Attached files
| file | filename |
|---|---|
| 8-K - 8-K - JANUS CAPITAL GROUP INC | a09-31957_18k.htm |
| EX-99.1 - EX-99.1 - JANUS CAPITAL GROUP INC | a09-31957_1ex99d1.htm |
Exhibit 99.2
|
|
Tim Armour Interim Chief Executive Officer Robert Garvy INTECH Chairman and Chief Executive Officer Third Quarter 2009 Earnings Presentation October 22, 2009 Greg Frost Chief Financial Officer C-1009-069 1-15-10 |
|
|
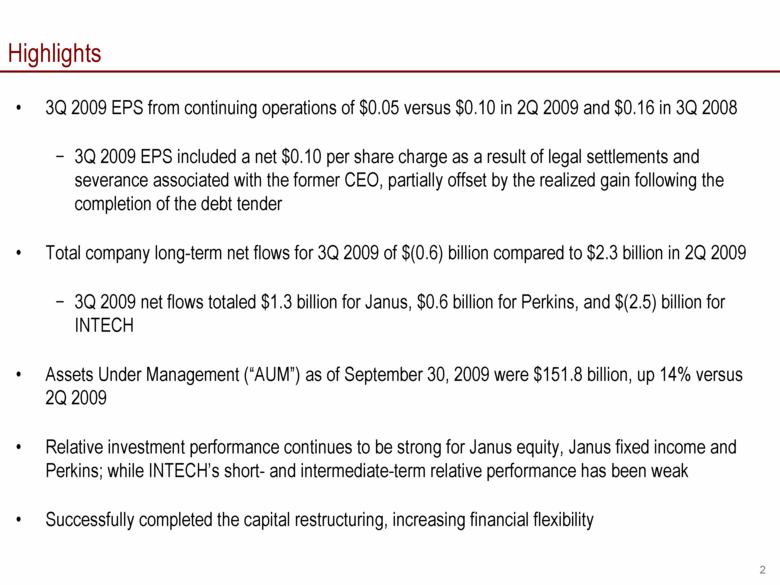
Highlights 3Q 2009 EPS from continuing operations of $0.05 versus $0.10 in 2Q 2009 and $0.16 in 3Q 2008 3Q 2009 EPS included a net $0.10 per share charge as a result of legal settlements and severance associated with the former CEO, partially offset by the realized gain following the completion of the debt tender Total company long-term net flows for 3Q 2009 of $(0.6) billion compared to $2.3 billion in 2Q 2009 3Q 2009 net flows totaled $1.3 billion for Janus, $0.6 billion for Perkins, and $(2.5) billion for INTECH Assets Under Management (“AUM”) as of September 30, 2009 were $151.8 billion, up 14% versus 2Q 2009 Relative investment performance continues to be strong for Janus equity, Janus fixed income and Perkins; while INTECH’s short- and intermediate-term relative performance has been weak Successfully completed the capital restructuring, increasing financial flexibility |
|
|
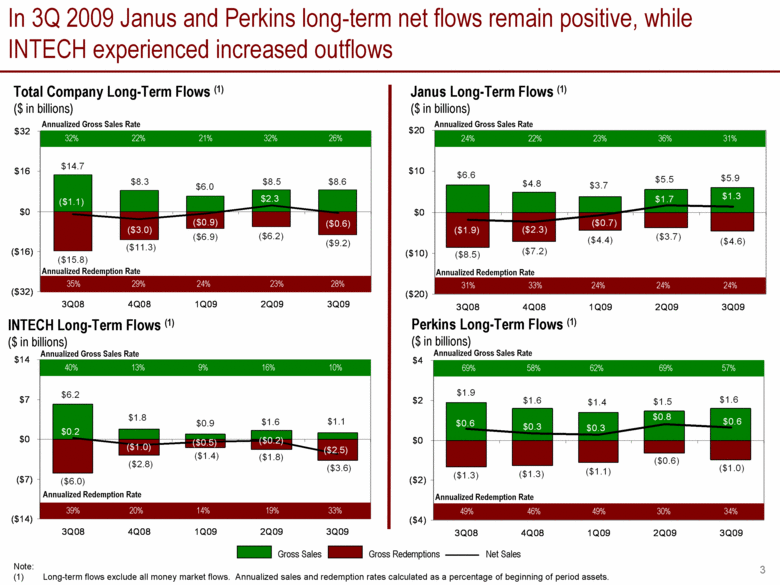
In 3Q 2009 Janus and Perkins long-term net flows remain positive, while INTECH experienced increased outflows Total Company Long-Term Flows (1) ($ in billions) INTECH Long-Term Flows (1) ($ in billions) Janus Long-Term Flows (1) ($ in billions) Gross Redemptions Gross Sales Net Sales Note: (1) Long-term flows exclude all money market flows. Annualized sales and redemption rates calculated as a percentage of beginning of period assets. 32% 22% 21% 32% 26% 35% 29% 24% 23% 28% Annualized Redemption Rate Annualized Gross Sales Rate Perkins Long-Term Flows (1) ($ in billions) 24% 22% 23% 36% 31% 31% 33% 24% 24% 24% Annualized Redemption Rate Annualized Gross Sales Rate 40% 13% 9% 16% 10% 39% 20% 14% 19% 33% Annualized Redemption Rate Annualized Gross Sales Rate 69% 58% 62% 69% 57% 49% 46% 49% 30% 34% Annualized Redemption Rate Annualized Gross Sales Rate $1.5 $1.6 $1.4 $1.6 $1.9 ($1.0) ($0.6) ($1.1) ($1.3) ($1.3) $0.6 $0.8 $0.3 $0.3 $0.6 ($4) ($2) $0 $2 $4 3Q08 4Q08 1Q09 2Q09 3Q09 $8.5 $6.0 $8.3 $14.7 $8.6 ($15.8) ($11.3) ($6.9) ($6.2) ($9.2) ($1.1) ($3.0) ($0.9) $2.3 ($0.6) ($32) ($16) $0 $16 $32 3Q08 4Q08 1Q09 2Q09 3Q09 $14 $7 $0 ($7) ($14) |
|
|
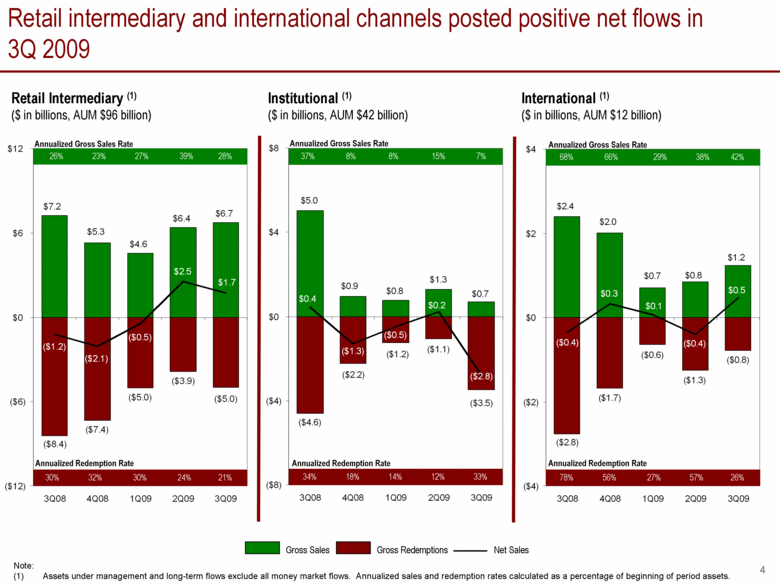
Retail intermediary and international channels posted positive net flows in 3Q 2009 Note: Assets under management and long-term flows exclude all money market flows. Annualized sales and redemption rates calculated as a percentage of beginning of period assets. Gross Redemptions Gross Sales Net Sales 26% 23% 27% 39% 28% Annualized Gross Sales Rate 30% 32% 30% 24% 21% Retail Intermediary (1) ($ in billions, AUM $96 billion) Institutional (1) ($ in billions, AUM $42 billion) International (1) ($ in billions, AUM $12 billion) 68% 66% 29% 38% 42% Annualized Redemption Rate Annualized Gross Sales Rate 78% 56% 27% 57% 26% 37% 8% 8% 15% 7% Annualized Redemption Rate Annualized Gross Sales Rate 34% 18% 14% 12% 33% Annualized Redemption Rate $1.2 $0.8 $0.7 $2.0 $2.4 ($0.8) ($1.3) ($0.6) ($1.7) ($2.8) $0.5 ($0.4) $0.1 $0.3 ($0.4) ($4) ($2) $0 $2 $4 3Q08 4Q08 1Q09 2Q09 3Q09 $6.7 $6.4 $4.6 $5.3 $7.2 ($5.0) ($3.9) ($5.0) ($7.4) ($8.4) $1.7 $2.5 ($0.5) ($2.1) ($1.2) ($12) ($6) $0 $6 $12 3Q08 4Q08 1Q09 2Q09 3Q09 $8 $4 $0 ($4) ($8) $5.0 $1.3 $0.9 $0.8 $0.7 $0.4 $0.2 ($0.5) ($1.3) ($1.1) ($1.2) ($2.2) ($2.8) ($3.5) ($4.6) 3Q08 4Q08 1Q09 2Q09 3Q09 |
|
|
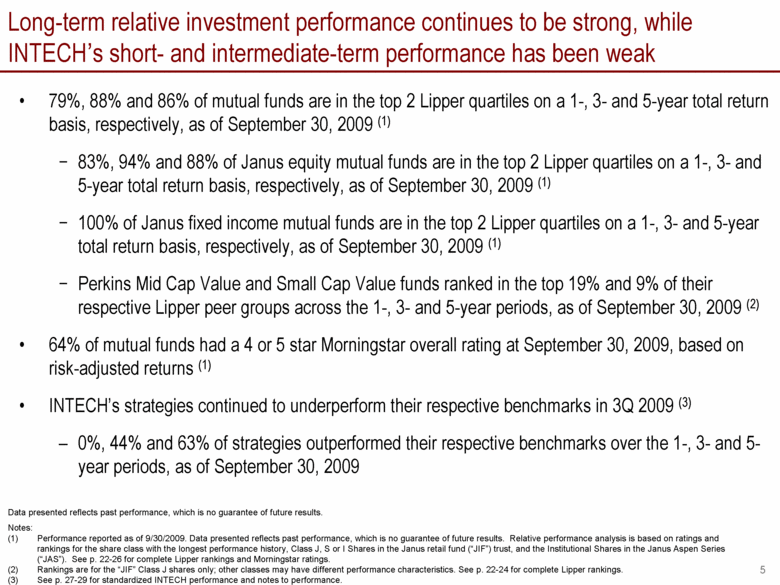
Long-term relative investment performance continues to be strong, while INTECH’s short- and intermediate-term performance has been weak 79%, 88% and 86% of mutual funds are in the top 2 Lipper quartiles on a 1-, 3- and 5-year total return basis, respectively, as of September 30, 2009 (1) 83%, 94% and 88% of Janus equity mutual funds are in the top 2 Lipper quartiles on a 1-, 3- and 5-year total return basis, respectively, as of September 30, 2009 (1) 100% of Janus fixed income mutual funds are in the top 2 Lipper quartiles on a 1-, 3- and 5-year total return basis, respectively, as of September 30, 2009 (1) Perkins Mid Cap Value and Small Cap Value funds ranked in the top 19% and 9% of their respective Lipper peer groups across the 1-, 3- and 5-year periods, as of September 30, 2009 (2) 64% of mutual funds had a 4 or 5 star Morningstar overall rating at September 30, 2009, based on risk-adjusted returns (1) INTECH’s strategies continued to underperform their respective benchmarks in 3Q 2009 (3) 0%, 44% and 63% of strategies outperformed their respective benchmarks over the 1-, 3- and 5-year periods, as of September 30, 2009 Data presented reflects past performance, which is no guarantee of future results. Notes: Performance reported as of 9/30/2009. Data presented reflects past performance, which is no guarantee of future results. Relative performance analysis is based on ratings and rankings for the share class with the longest performance history, Class J, S or I Shares in the Janus retail fund (“JIF”) trust, and the Institutional Shares in the Janus Aspen Series (“JAS”). See p. 22-26 for complete Lipper rankings and Morningstar ratings. Rankings are for the “JIF” Class J shares only; other classes may have different performance characteristics. See p. 22-24 for complete Lipper rankings. See p. 27-29 for standardized INTECH performance and notes to performance. |
|
|
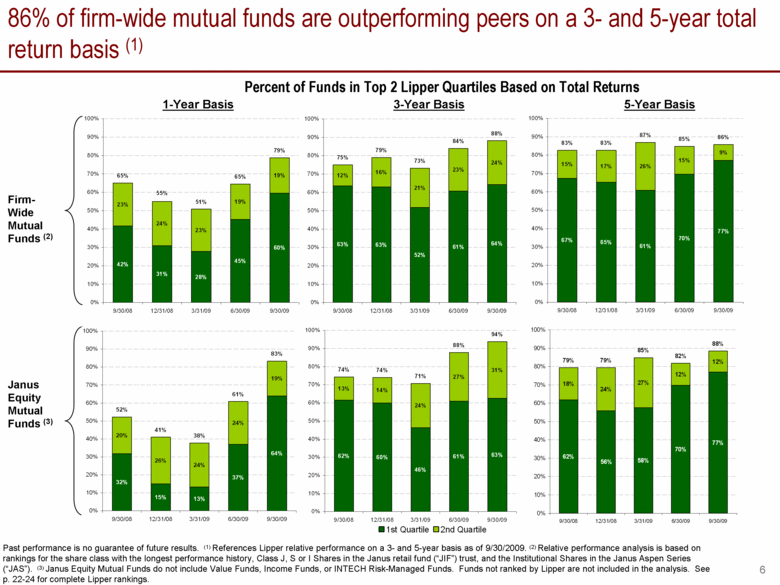
86% of firm-wide mutual funds are outperforming peers on a 3- and 5-year total return basis (1) Past performance is no guarantee of future results. (1) References Lipper relative performance on a 3- and 5-year basis as of 9/30/2009. (2) Relative performance analysis is based on rankings for the share class with the longest performance history, Class J, S or I Shares in the Janus retail fund (“JIF”) trust, and the Institutional Shares in the Janus Aspen Series (“JAS”). (3) Janus Equity Mutual Funds do not include Value Funds, Income Funds, or INTECH Risk-Managed Funds. Funds not ranked by Lipper are not included in the analysis. See p. 22-24 for complete Lipper rankings. 1-Year Basis 3-Year Basis Percent of Funds in Top 2 Lipper Quartiles Based on Total Returns Firm-Wide Mutual Funds (2) Janus Equity Mutual Funds (3) 5-Year Basis 63% 63% 52% 61% 64% 12% 16% 21% 23% 24% 79% 84% 75% 73% 88% 0% 10% 20% 30% 40% 50% 60% 70% 80% 90% 100% 9/30/08 12/31/08 3/31/09 6/30/09 9/30/09 1st Quartile 2nd Quartile 32% 15% 13% 37% 64% 20% 26% 24% 24% 19% 41% 61% 52% 38% 83% 0% 10% 20% 30% 40% 50% 60% 70% 80% 90% 100% 9/30/08 12/31/08 3/31/09 6/30/09 9/30/09 58% 70% 77% 18% 24% 27% 12% 12% 62% 56% 79% 82% 88% 85% 79% 0% 10% 20% 30% 40% 50% 60% 70% 80% 90% 100% 9/30/08 12/31/08 3/31/09 6/30/09 9/30/09 42% 31% 28% 45% 60% 23% 24% 23% 19% 19% 65% 55% 65% 51% 79% 0% 10% 20% 30% 40% 50% 60% 70% 80% 90% 100% 9/30/08 12/31/08 3/31/09 6/30/09 9/30/09 62% 60% 46% 61% 63% 13% 14% 24% 27% 31% 74% 88% 94% 71% 74% 0% 10% 20% 30% 40% 50% 60% 70% 80% 90% 100% 9/30/08 12/31/08 3/31/09 6/30/09 9/30/09 |
|
|
INTECH Robert Garvy INTECH Chairman and Chief Executive Officer |
|
|
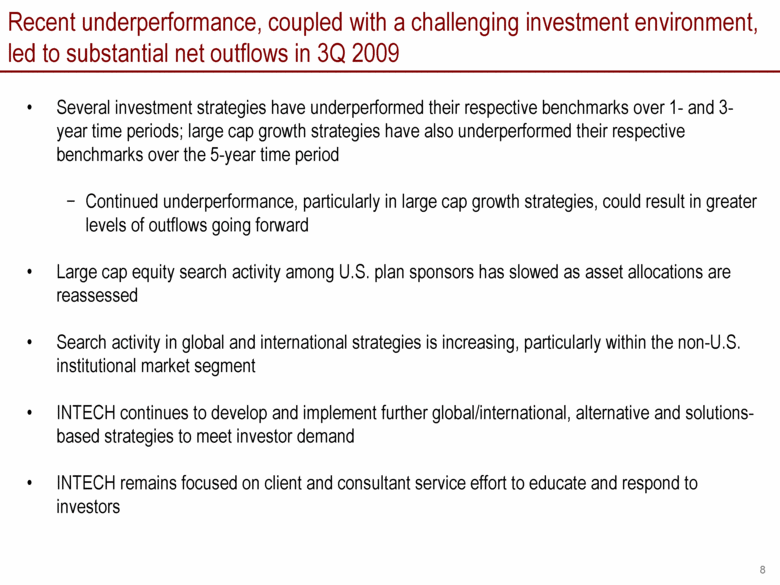
Recent underperformance, coupled with a challenging investment environment, led to substantial net outflows in 3Q 2009 Several investment strategies have underperformed their respective benchmarks over 1- and 3-year time periods; large cap growth strategies have also underperformed their respective benchmarks over the 5-year time period Continued underperformance, particularly in large cap growth strategies, could result in greater levels of outflows going forward Large cap equity search activity among U.S. plan sponsors has slowed as asset allocations are reassessed Search activity in global and international strategies is increasing, particularly within the non-U.S. institutional market segment INTECH continues to develop and implement further global/international, alternative and solutions-based strategies to meet investor demand INTECH remains focused on client and consultant service effort to educate and respond to investors |
|
|
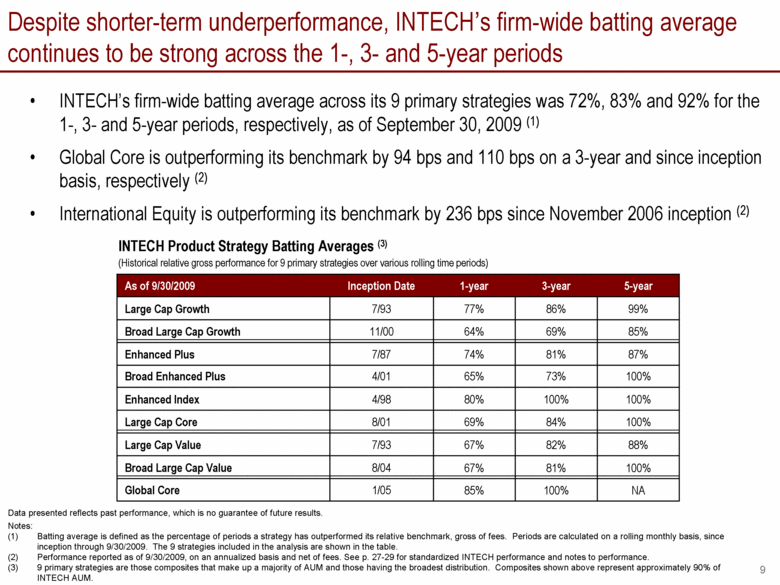
INTECH’s firm-wide batting average across its 9 primary strategies was 72%, 83% and 92% for the 1-, 3- and 5-year periods, respectively, as of September 30, 2009 (1) Global Core is outperforming its benchmark by 94 bps and 110 bps on a 3-year and since inception basis, respectively (2) International Equity is outperforming its benchmark by 236 bps since November 2006 inception (2) Despite shorter-term underperformance, INTECH’s firm-wide batting average continues to be strong across the 1-, 3- and 5-year periods INTECH Product Strategy Batting Averages (3) (Historical relative gross performance for 9 primary strategies over various rolling time periods) 85% 69% 64% 11/00 Broad Large Cap Growth NA 100% 85% 1/05 Global Core 100% 81% 67% 8/04 Broad Large Cap Value 88% 82% 67% 7/93 Large Cap Value 69% 80% 65% 74% 77% 1-year 8/01 4/98 4/01 7/87 7/93 Inception Date 100% 84% Large Cap Core 100% 100% Enhanced Index 100% 73% Broad Enhanced Plus 87% 81% Enhanced Plus 99% 86% Large Cap Growth 5-year 3-year As of 9/30/2009 Data presented reflects past performance, which is no guarantee of future results. Notes: Batting average is defined as the percentage of periods a strategy has outperformed its relative benchmark, gross of fees. Periods are calculated on a rolling monthly basis, since inception through 9/30/2009. The 9 strategies included in the analysis are shown in the table. Performance reported as of 9/30/2009, on an annualized basis and net of fees. See p. 27-29 for standardized INTECH performance and notes to performance. 9 primary strategies are those composites that make up a majority of AUM and those having the broadest distribution. Composites shown above represent approximately 90% of INTECH AUM. |
|
|
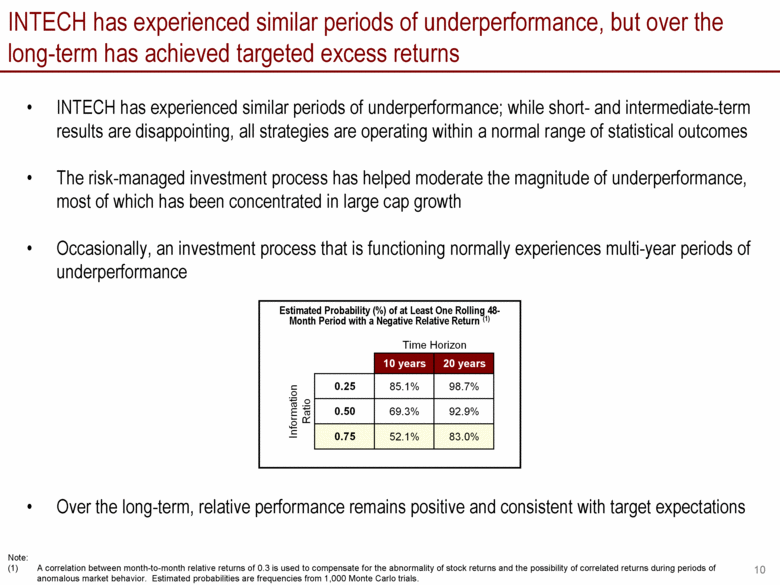
INTECH has experienced similar periods of underperformance; while short- and intermediate-term results are disappointing, all strategies are operating within a normal range of statistical outcomes The risk-managed investment process has helped moderate the magnitude of underperformance, most of which has been concentrated in large cap growth Occasionally, an investment process that is functioning normally experiences multi-year periods of underperformance Over the long-term, relative performance remains positive and consistent with target expectations INTECH has experienced similar periods of underperformance, but over the long-term has achieved targeted excess returns Estimated Probability (%) of at Least One Rolling 48-Month Period with a Negative Relative Return (1) Note: A correlation between month-to-month relative returns of 0.3 is used to compensate for the abnormality of stock returns and the possibility of correlated returns during periods of anomalous market behavior. Estimated probabilities are frequencies from 1,000 Monte Carlo trials. 10 years 20 years 0.25 85.1% 98.7% 0.50 69.3% 92.9% 0.75 52.1% 83.0% Time Horizon Information Ratio |
|
|
We believe INTECH remains well positioned for long-term growth Philosophy – INTECH’s philosophy is based on a proven mathematical theorem not supposition, hypothesis or conjecture Process – INTECH’s risk-managed investment process has been consistently applied for over 22 years People – INTECH’s organization has historically had low turnover compared to the industry Performance – INTECH’s long-term relative performance remains positive, and historically has been consistent with target expectations; short- and intermediate-term performance has been disappointing INTECH continues to focus on the needs of institutional investors and opportunities for growth Further develop and implement investment solution capabilities Leverage opportunities for global/international strategies Research and develop incremental improvements to investment process engineering Diversify stochastic portfolio theory into additional asset classes |
|
|
Financials Greg Frost Chief Financial Officer |
|
|
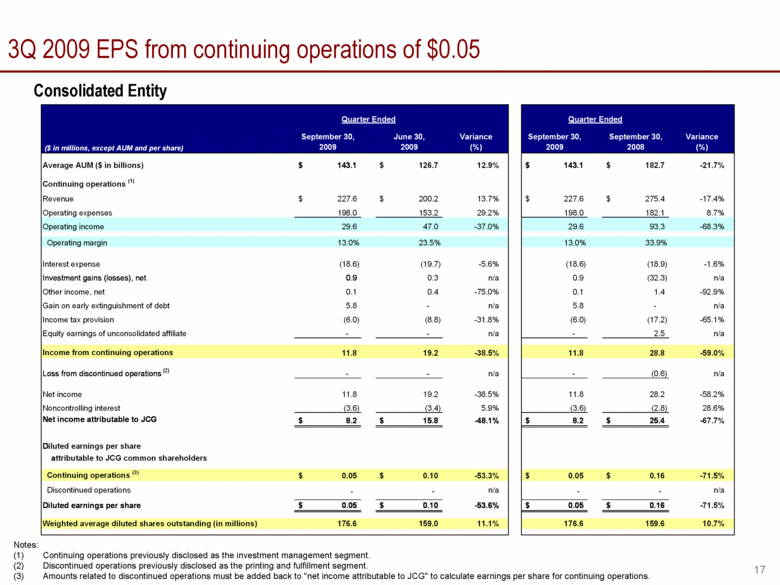
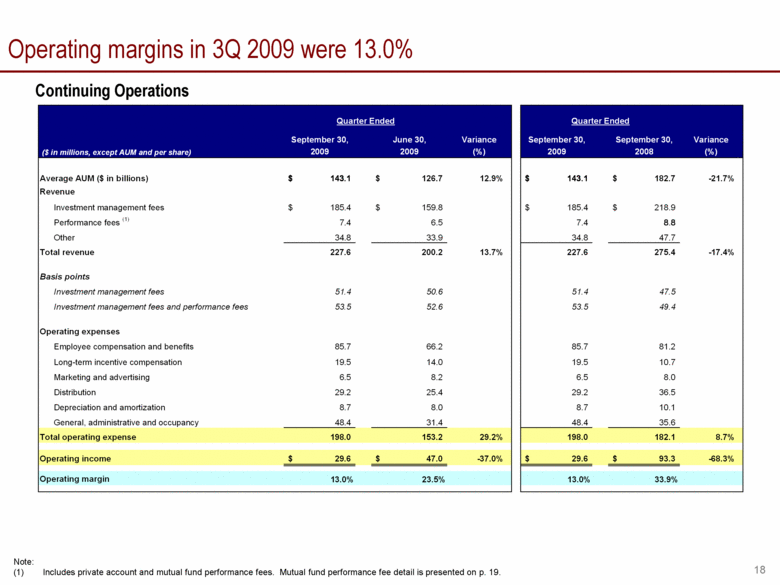
3Q 2009 Financial overview 3Q 2009 EPS from continuing operations of $0.05 versus $0.10 in 2Q 2009 and $0.16 in 3Q 2008 Average AUM of $143.1 billion and revenue of $227.6 million were up 13% and 14%, respectively, from 2Q 2009, and were down 22% and 17%, respectively, from 3Q 2008 Operating expenses of $198.0 million were up 29% from 2Q 2009, primarily due to $20.5 million of legal settlements, $12.1 million of CEO severance and higher variable expenses 3Q 2009 included $2.7 million related to JIF/JAD merger, compared to $3.0 million in 2Q 2009 Operating margin in 3Q 2009 was 13.0% versus 23.5% in 2Q 2009 and 33.9% in 3Q 2008 Increased financial flexibility following the successful completion of capital restructuring Decreased total long-term debt by $316 million, with a focus on near-term maturities Realized $5.8 million non-operating gain following the completion of the debt tender Management is focused on prudently managing expenses, while investing in the business |
|
|
Janus Today Delivering strong long-term relative investment performance across Janus, INTECH and Perkins Gaining share in the equity and fixed income markets through positive long-term net flow generation at Janus and Perkins Confident INTECH’s mathematical investment process is well positioned for long-term growth, despite current underperformance CEO search is identifying strong candidates and remains on track Experienced leadership team is committed to growing the business, while focusing on controlling costs Further establish global franchise Dedicated to becoming a top tier firm in the advisory channel Leverage Janus, INTECH and Perkins strong long-term relative investment performance to further penetrate the institutional channel |
|
|
Appendix |
|
|
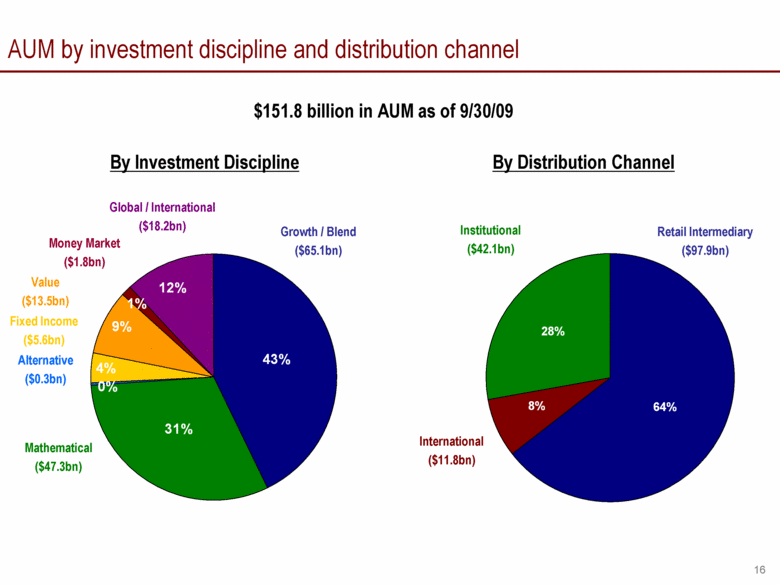
AUM by investment discipline and distribution channel Value ($13.5bn) Retail Intermediary ($97.9bn) $151.8 billion in AUM as of 9/30/09 By Investment Discipline By Distribution Channel Growth / Blend ($65.1bn) Money Market ($1.8bn) Global / International ($18.2bn) Fixed Income ($5.6bn) Mathematical ($47.3bn) Institutional ($42.1bn) International ($11.8bn) Alternative ($0.3bn) 28% 64% 8% |
|
|
3Q 2009 EPS from continuing operations of $0.05 Consolidated Entity Notes: Continuing operations previously disclosed as the investment management segment. Discontinued operations previously disclosed as the printing and fulfillment segment. Amounts related to discontinued operations must be added back to "net income attributable to JCG" to calculate earnings per share for continuing operations. September 30, June 30, Variance September 30, September 30, Variance ($ in millions, except AUM and per share) 2009 2009 (%) 2009 2008 (%) Average AUM ($ in billions) 143.1 $ 126.7 $ 12.9% 143.1 $ 182.7 $ -21.7% Continuing operations (1) Revenue 227.6 $ 200.2 $ 13.7% 227.6 $ 275.4 $ -17.4% Operating expenses 198.0 153.2 29.2% 198.0 182.1 8.7% Operating income 29.6 47.0 -37.0% 29.6 93.3 -68.3% Operating margin 13.0% 23.5% 13.0% 33.9% Interest expense (18.6) (19.7) -5.6% (18.6) (18.9) -1.6% Investment gains (losses), net 0.9 0.3 n/a 0.9 (32.3) n/a Other income, net 0.1 0.4 -75.0% 0.1 1.4 -92.9% Gain on early extinguishment of debt 5.8 - n/a 5.8 - n/a Income tax provision (6.0) (8.8) -31.8% (6.0) (17.2) -65.1% Equity earnings of unconsolidated affiliate - - n/a - 2.5 n/a Income from continuing operations 11.8 19.2 -38.5% 11.8 28.8 -59.0% Loss from discontinued operations (2) - - n/a - (0.6) n/a Net income 11.8 19.2 -38.5% 11.8 28.2 -58.2% Noncontrolling interest (3.6) (3.4) 5.9% (3.6) (2.8) 28.6% Net income attributable to JCG 8.2 $ 15.8 $ -48.1% 8.2 $ 25.4 $ -67.7% Diluted earnings per share attributable to JCG common shareholders Continuing operations (3) 0.05 $ 0.10 $ -53.3% 0.05 $ 0.16 $ -71.5% Discontinued operations - - n/a - - n/a Diluted earnings per share 0.05 $ 0.10 $ -53.6% 0.05 $ 0.16 $ -71.5% Weighted average diluted shares outstanding (in millions) 176.6 159.0 11.1% 176.6 159.6 10.7% Quarter Ended Quarter Ended |
|
|
Operating margins in 3Q 2009 were 13.0% Continuing Operations Note: Includes private account and mutual fund performance fees. Mutual fund performance fee detail is presented on p. 19. September 30, June 30, Variance September 30, September 30, Variance ($ in millions, except AUM and per share) 2009 2009 (%) 2009 2008 (%) Average AUM ($ in billions) 143.1 $ 126.7 $ 12.9% 143.1 $ 182.7 $ -21.7% Revenue Investment management fees 185.4 $ 159.8 $ 185.4 $ 218.9 $ Performance fees (1) 7.4 6.5 7.4 8.8 Other 34.8 33.9 34.8 47.7 Total revenue 227.6 200.2 13.7% 227.6 275.4 -17.4% Basis points Investment management fees 51.4 50.6 51.4 47.5 Investment management fees and performance fees 53.5 52.6 53.5 49.4 Operating expenses Employee compensation and benefits 85.7 66.2 85.7 81.2 Long-term incentive compensation 19.5 14.0 19.5 10.7 Marketing and advertising 6.5 8.2 6.5 8.0 Distribution 29.2 25.4 29.2 36.5 Depreciation and amortization 8.7 8.0 8.7 10.1 General, administrative and occupancy 48.4 31.4 48.4 35.6 Total operating expense 198.0 153.2 29.2% 198.0 182.1 8.7% Operating income 29.6 $ 47.0 $ -37.0% 29.6 $ 93.3 $ -68.3% Operating margin 13.0% 23.5% 13.0% 33.9% Quarter Ended Quarter Ended |
|
|
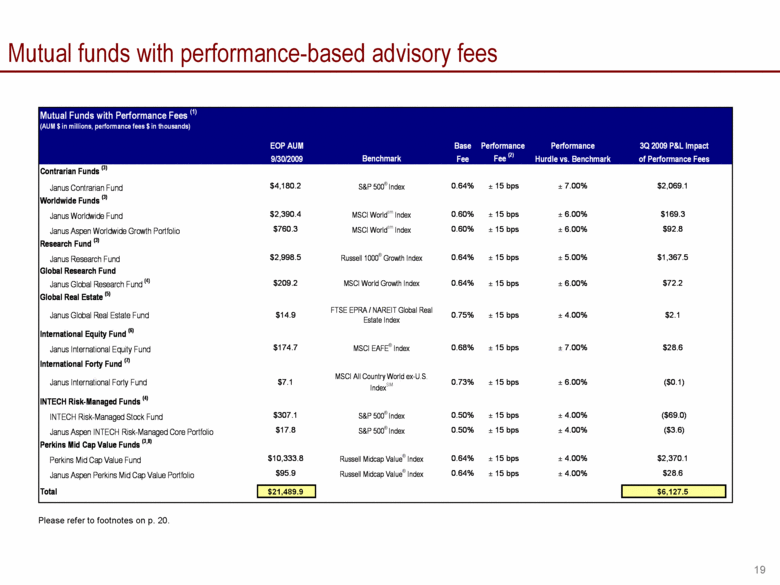
Mutual funds with performance-based advisory fees Please refer to footnotes on p. 20. Mutual Funds with Performance Fees (1) (AUM $ in millions, performance fees $ in thousands) EOP AUM Base Performance Performance 3Q 2009 P&L Impact 9/30/2009 Benchmark Fee Fee (2) Hurdle vs. Benchmark of Performance Fees Contrarian Funds (3) Janus Contrarian Fund $4,180.2 S&P 500® Index 0.64% ± 15 bps ± 7.00% $2,069.1 Worldwide Funds (3) Janus Worldwide Fund $2,390.4 MSCI World sm Index 0.60% ± 15 bps ± 6.00% $169.3 Janus Aspen Worldwide Growth Portfolio $760.3 MSCI World sm Index 0.60% ± 15 bps ± 6.00% $92.8 Research Fund (3) Janus Research Fund $2,998.5 Russell 1000® Growth Index 0.64% ± 15 bps ± 5.00% $1,367.5 Global Research Fund Janus Global Research Fund (4) $209.2 MSCI World Growth Index 0.64% ± 15 bps ± 6.00% $72.2 Global Real Estate (5) Janus Global Real Estate Fund $14.9 FTSE EPRA / NAREIT Global Real Estate Index 0.75% ± 15 bps ± 4.00% $2.1 International Equity Fund (6) Janus International Equity Fund $174.7 MSCI EAFE® Index 0.68% ± 15 bps ± 7.00% $28.6 International Forty Fund (7) Janus International Forty Fund $7.1 MSCI All Country World ex-U.S. Index SM 0.73% ± 15 bps ± 6.00% ($0.1) INTECH Risk-Managed Funds (4) INTECH Risk-Managed Stock Fund $307.1 S&P 500® Index 0.50% ± 15 bps ± 4.00% ($69.0) Janus Aspen INTECH Risk-Managed Core Portfolio $17.8 S&P 500® Index 0.50% ± 15 bps ± 4.00% ($3.6) Perkins Mid Cap Value Funds (3,8) Perkins Mid Cap Value Fund $10,333.8 Russell Midcap Value® Index 0.64% ± 15 bps ± 4.00% $2,370.1 Janus Aspen Perkins Mid Cap Value Portfolio $95.9 Russell Midcap Value® Index 0.64% ± 15 bps ± 4.00% $28.6 Total $21,489.9 $6,127.5 |
|
|
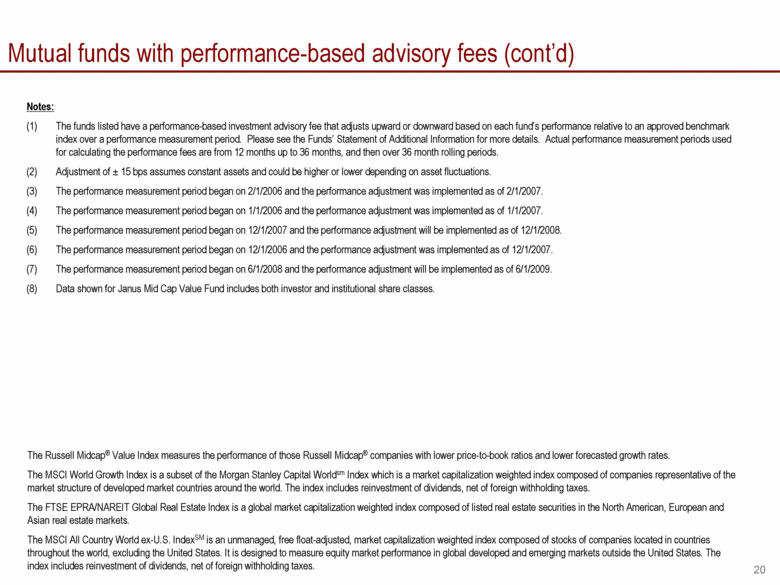
Mutual funds with performance-based advisory fees (cont’d) Notes: (1) The funds listed have a performance-based investment advisory fee that adjusts upward or downward based on each fund’s performance relative to an approved benchmark index over a performance measurement period. Please see the Funds’ Statement of Additional Information for more details. Actual performance measurement periods used for calculating the performance fees are from 12 months up to 36 months, and then over 36 month rolling periods. (2) Adjustment of ± 15 bps assumes constant assets and could be higher or lower depending on asset fluctuations. (3) The performance measurement period began on 2/1/2006 and the performance adjustment was implemented as of 2/1/2007. (4) The performance measurement period began on 1/1/2006 and the performance adjustment was implemented as of 1/1/2007. (5) The performance measurement period began on 12/1/2007 and the performance adjustment will be implemented as of 12/1/2008. (6) The performance measurement period began on 12/1/2006 and the performance adjustment was implemented as of 12/1/2007. (7) The performance measurement period began on 6/1/2008 and the performance adjustment will be implemented as of 6/1/2009. (8) Data shown for Janus Mid Cap Value Fund includes both investor and institutional share classes. The Russell Midcap® Value Index measures the performance of those Russell Midcap® companies with lower price-to-book ratios and lower forecasted growth rates. The MSCI World Growth Index is a subset of the Morgan Stanley Capital Worldsm Index which is a market capitalization weighted index composed of companies representative of the market structure of developed market countries around the world. The index includes reinvestment of dividends, net of foreign withholding taxes. The FTSE EPRA/NAREIT Global Real Estate Index is a global market capitalization weighted index composed of listed real estate securities in the North American, European and Asian real estate markets. The MSCI All Country World ex-U.S. IndexSM is an unmanaged, free float-adjusted, market capitalization weighted index composed of stocks of companies located in countries throughout the world, excluding the United States. It is designed to measure equity market performance in global developed and emerging markets outside the United States. The index includes reinvestment of dividends, net of foreign withholding taxes. |
|
|
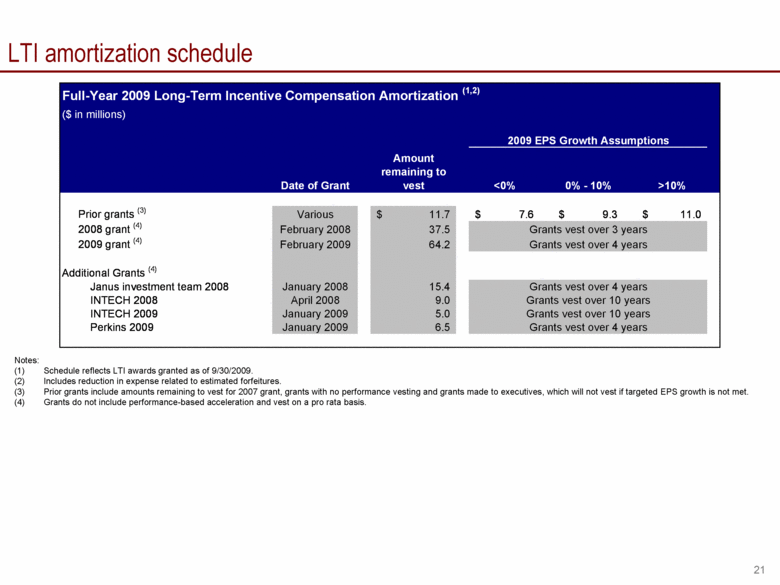
LTI amortization schedule Notes: (1) Schedule reflects LTI awards granted as of 9/30/2009. (2) Includes reduction in expense related to estimated forfeitures. (3) Prior grants include amounts remaining to vest for 2007 grant, grants with no performance vesting and grants made to executives, which will not vest if targeted EPS growth is not met. (4) Grants do not include performance-based acceleration and vest on a pro rata basis. Full-Year 2009 Long-Term Incentive Compensation Amortization (1,2) ($ in millions) Date of Grant Amount remaining to vest <0% 0% - 10% >10% Prior grants (3) Various 11.7 $ 7.6 $ 9.3 $ 11.0 $ 2008 grant (4) February 2008 37.5 2009 grant (4) February 2009 64.2 Additional Grants (4) Janus investment team 2008 January 2008 15.4 INTECH 2008 April 2008 9.0 INTECH 2009 January 2009 5.0 Perkins 2009 January 2009 6.5 2009 EPS Growth Assumptions Grants vest over 4 years Grants vest over 10 years Grants vest over 10 years Grants vest over 3 years Grants vest over 4 years Grants vest over 4 years |
|
|
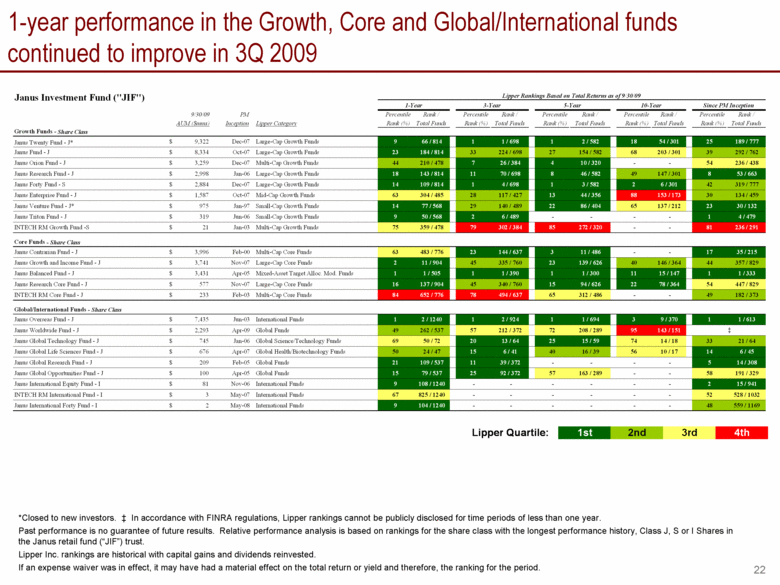
1-year performance in the Growth, Core and Global/International funds continued to improve in 3Q 2009 *Closed to new investors. ‡ In accordance with FINRA regulations, Lipper rankings cannot be publicly disclosed for time periods of less than one year. Past performance is no guarantee of future results. Relative performance analysis is based on rankings for the share class with the longest performance history, Class J, S or I Shares in the Janus retail fund (“JIF”) trust. Lipper Inc. rankings are historical with capital gains and dividends reinvested. If an expense waiver was in effect, it may have had a material effect on the total return or yield and therefore, the ranking for the period. Lipper Quartile: 1st 2nd 3rd 4th 9/30/09 PM Percentile Rank / Percentile Rank / Percentile Rank / Percentile Rank / Percentile Rank / AUM ($mms) Inception Lipper Category Rank (%) Total Funds Rank (%) Total Funds Rank (%) Total Funds Rank (%) Total Funds Rank (%) Total Funds Growth Funds - Share Class Janus Twenty Fund - J* 9,322 $ Dec-07 Large-Cap Growth Funds 9 66 / 814 1 1 / 698 1 2 / 582 18 54 / 301 25 189 / 777 Janus Fund - J 8,334 $ Oct-07 Large-Cap Growth Funds 23 184 / 814 33 224 / 698 27 154 / 582 68 203 / 301 39 292 / 762 Janus Orion Fund - J 3,259 $ Dec-07 Multi-Cap Growth Funds 44 210 / 478 7 26 / 384 4 10 / 320 - - 54 236 / 438 Janus Research Fund - J 2,998 $ Jan-06 Large-Cap Growth Funds 18 143 / 814 11 70 / 698 8 46 / 582 49 147 / 301 8 53 / 663 Janus Forty Fund - S 2,884 $ Dec-07 Large-Cap Growth Funds 14 109 / 814 1 4 / 698 1 3 / 582 2 6 / 301 42 319 / 777 Janus Enterprise Fund - J 1,587 $ Oct-07 Mid-Cap Growth Funds 63 304 / 485 28 117 / 427 13 44 / 356 88 153 / 173 30 134 / 459 Janus Venture Fund - J* 975 $ Jan-97 Small-Cap Growth Funds 14 77 / 568 29 140 / 489 22 86 / 404 65 137 / 212 23 30 / 132 Janus Triton Fund - J 319 $ Jun-06 Small-Cap Growth Funds 9 50 / 568 2 6 / 489 - - - - 1 4 / 479 INTECH RM Growth Fund -S 21 $ Jan-03 Multi-Cap Growth Funds 75 359 / 478 79 302 / 384 85 272 / 320 - - 81 236 / 291 Core Funds - Share Class Janus Contrarian Fund - J 3,996 $ Feb-00 Multi-Cap Core Funds 63 483 / 776 23 144 / 637 3 11 / 486 - - 17 35 / 215 Janus Growth and Income Fund - J 3,741 $ Nov-07 Large-Cap Core Funds 2 11 / 904 45 335 / 760 23 139 / 626 40 146 / 364 44 357 / 829 Janus Balanced Fund - J 3,431 $ Apr-05 Mixed-Asset Target Alloc. Mod. Funds 1 1 / 505 1 1 / 390 1 1 / 300 11 15 / 147 1 1 / 333 Janus Research Core Fund - J 577 $ Nov-07 Large-Cap Core Funds 16 137 / 904 45 340 / 760 15 94 / 626 22 78 / 364 54 447 / 829 INTECH RM Core Fund - J 233 $ Feb-03 Multi-Cap Core Funds 84 652 / 776 78 494 / 637 65 312 / 486 - - 49 182 / 373 Global/International Funds - Share Class Janus Overseas Fund - J 7,435 $ Jun-03 International Funds 1 2 / 1240 1 2 / 924 1 1 / 694 3 9 / 370 1 1 / 613 Janus Worldwide Fund - J 2,293 $ Apr-09 Global Funds 49 262 / 537 57 212 / 372 72 208 / 289 95 143 / 151 Janus Global Technology Fund - J 745 $ Jan-06 Global Science/Technology Funds 69 50 / 72 20 13 / 64 25 15 / 59 74 14 / 18 33 21 / 64 Janus Global Life Sciences Fund - J 676 $ Apr-07 Global Health/Biotechnology Funds 50 24 / 47 15 6 / 41 40 16 / 39 56 10 / 17 14 6 / 45 Janus Global Research Fund - J 209 $ Feb-05 Global Funds 21 109 / 537 11 39 / 372 - - - - 5 14 / 308 Janus Global Opportunities Fund - J 100 $ Apr-05 Global Funds 15 79 / 537 25 92 / 372 57 163 / 289 - - 58 191 / 329 Janus International Equity Fund - I 81 $ Nov-06 International Funds 9 108 / 1240 - - - - - - 2 15 / 941 INTECH RM International Fund - I 3 $ May-07 International Funds 67 825 / 1240 - - - - - - 52 528 / 1032 Janus International Forty Fund - I 2 $ May-08 International Funds 9 104 / 1240 - - - - - - 48 559 / 1169 ‡ Janus Investment Fund ("JIF") 1-Year 10-Year 3-Year 5-Year Lipper Rankings Based on Total Returns as of 9/30/09 Since PM Inception |
|
|
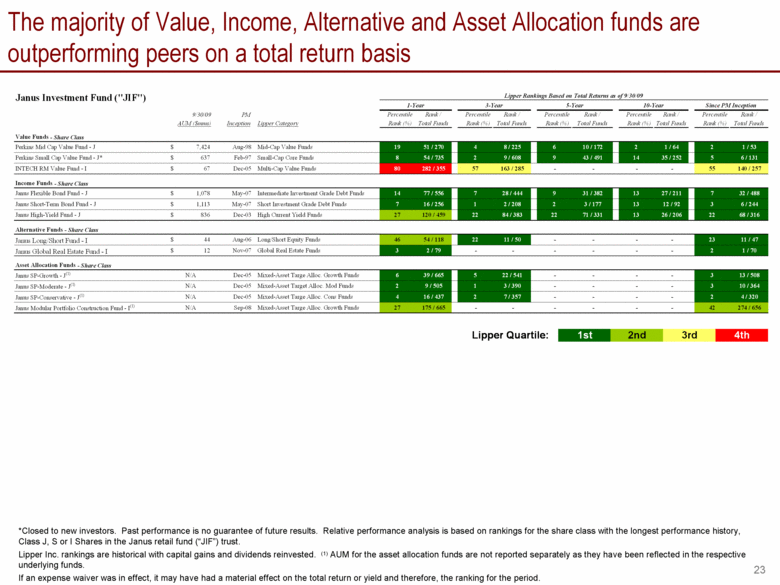
The majority of Value, Income, Alternative and Asset Allocation funds are outperforming peers on a total return basis *Closed to new investors. Past performance is no guarantee of future results. Relative performance analysis is based on rankings for the share class with the longest performance history, Class J, S or I Shares in the Janus retail fund (“JIF”) trust. Lipper Inc. rankings are historical with capital gains and dividends reinvested. (1) AUM for the asset allocation funds are not reported separately as they have been reflected in the respective underlying funds. If an expense waiver was in effect, it may have had a material effect on the total return or yield and therefore, the ranking for the period. Lipper Quartile: 1st 2nd 3rd 4th 9/30/09 PM Percentile Rank / Percentile Rank / Percentile Rank / Percentile Rank / Percentile Rank / AUM ($mms) Inception Lipper Category Rank (%) Total Funds Rank (%) Total Funds Rank (%) Total Funds Rank (%) Total Funds Rank (%) Total Funds Value Funds - Share Class Perkins Mid Cap Value Fund - J 7,424 $ Aug-98 Mid-Cap Value Funds 19 51 / 270 4 8 / 225 6 10 / 172 2 1 / 64 2 1 / 53 Perkins Small Cap Value Fund - J* 637 $ Feb-97 Small-Cap Core Funds 8 54 / 735 2 9 / 608 9 43 / 491 14 35 / 252 5 6 / 131 INTECH RM Value Fund - I 67 $ Dec-05 Multi-Cap Value Funds 80 282 / 355 57 163 / 285 - - - - 55 140 / 257 Income Funds - Share Class Janus Flexible Bond Fund - J 1,078 $ May-07 Intermediate Investment Grade Debt Funds 14 77 / 556 7 28 / 444 9 31 / 382 13 27 / 211 7 32 / 488 Janus Short-Term Bond Fund - J 1,113 $ May-07 Short Investment Grade Debt Funds 7 16 / 256 1 2 / 208 2 3 / 177 13 12 / 92 3 6 / 244 Janus High-Yield Fund - J 836 $ Dec-03 High Current Yield Funds 27 120 / 459 22 84 / 383 22 71 / 331 13 26 / 206 22 68 / 316 Alternative Funds - Share Class Janus Long/Short Fund - I 44 $ Aug-06 Long/Short Equity Funds 46 54 / 118 22 11 / 50 - - - - 23 11 / 47 Janus Global Real Estate Fund - I 12 $ Nov-07 Global Real Estate Funds 3 2 / 79 - - - - - - 2 1 / 70 Asset Allocation Funds - Share Class Janus SP-Growth - J (1) N/A Dec-05 Mixed-Asset Targe Alloc. Growth Funds 6 39 / 665 5 22 / 541 - - - - 3 13 / 508 Janus SP-Moderate - J (1) N/A Dec-05 Mixed-Asset Target Alloc. Mod Funds 2 9 / 505 1 3 / 390 - - - - 3 10 / 364 Janus SP-Conservative - J (1) N/A Dec-05 Mixed-Asset Targe Alloc. Cons Funds 4 16 / 437 2 7 / 357 - - - - 2 4 / 320 Janus Modular Portfolio Construction Fund - I (1) N/A Sep-08 Mixed-Asset Targe Alloc. Growth Funds 27 175 / 665 - - - - - - 42 274 / 656 Janus Investment Fund ("JIF") Lipper Rankings Based on Total Returns as of 9/30/09 1-Year 3-Year 5-Year 10-Year Since PM Inception |
|
|
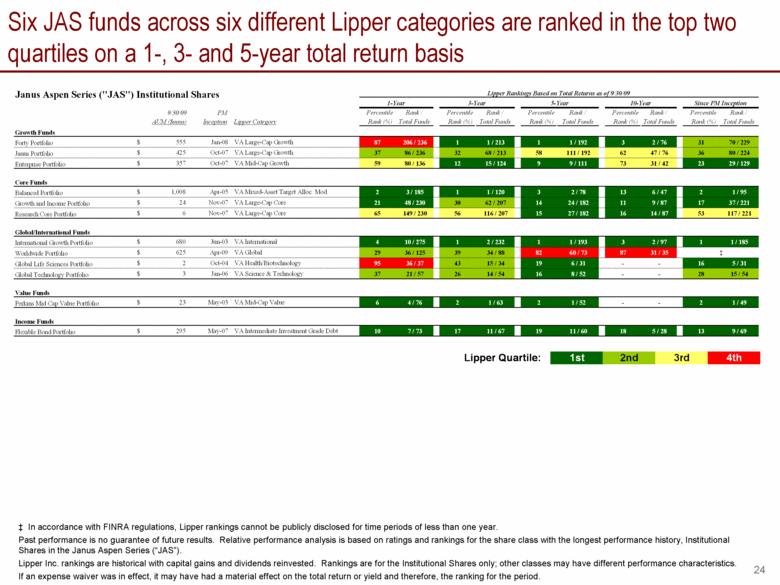
Six JAS funds across six different Lipper categories are ranked in the top two quartiles on a 1-, 3- and 5-year total return basis ‡ In accordance with FINRA regulations, Lipper rankings cannot be publicly disclosed for time periods of less than one year. Past performance is no guarantee of future results. Relative performance analysis is based on ratings and rankings for the share class with the longest performance history, Institutional Shares in the Janus Aspen Series (“JAS”). Lipper Inc. rankings are historical with capital gains and dividends reinvested. Rankings are for the Institutional Shares only; other classes may have different performance characteristics. If an expense waiver was in effect, it may have had a material effect on the total return or yield and therefore, the ranking for the period. Lipper Quartile: 1st 2nd 3rd 4th 9/30/09 PM Percentile Rank / Percentile Rank / Percentile Rank / Percentile Rank / Percentile Rank / AUM ($mms) Inception Lipper Category Rank (%) Total Funds Rank (%) Total Funds Rank (%) Total Funds Rank (%) Total Funds Rank (%) Total Funds Growth Funds Forty Portfolio 555 $ Jan-08 VA Large-Cap Growth 87 206 / 236 1 1 / 213 1 1 / 192 3 2 / 76 31 70 / 229 Janus Portfolio 425 $ Oct-07 VA Large-Cap Growth 37 86 / 236 32 68 / 213 58 111 / 192 62 47 / 76 36 80 / 224 Enterprise Portfolio 357 $ Oct-07 VA Mid-Cap Growth 59 80 / 136 12 15 / 124 9 9 / 111 73 31 / 42 23 29 / 129 Core Funds Balanced Portfolio 1,008 $ Apr-05 VA Mixed-Asset Target Alloc. Mod. 2 3 / 185 1 1 / 120 3 2 / 78 13 6 / 47 2 1 / 95 Growth and Income Portfolio 24 $ Nov-07 VA Large-Cap Core 21 48 / 230 30 62 / 207 14 24 / 182 11 9 / 87 17 37 / 221 Research Core Portfolio 6 $ Nov-07 VA Large-Cap Core 65 149 / 230 56 116 / 207 15 27 / 182 16 14 / 87 53 117 / 221 Global/International Funds International Growth Portfolio 680 $ Jun-03 VA International 4 10 / 275 1 2 / 232 1 1 / 193 3 2 / 97 1 1 / 185 Worldwide Portfolio 625 $ Apr-09 VA Global 29 36 / 125 39 34 / 88 82 60 / 73 87 31 / 35 Global Life Sciences Portfolio 2 $ Oct-04 VA Health/Biotechnology 95 36 / 37 43 15 / 34 19 6 / 31 - - 16 5 / 31 Global Technology Portfolio 3 $ Jan-06 VA Science & Technology 37 21 / 57 26 14 / 54 16 8 / 52 - - 28 15 / 54 Value Funds Perkins Mid Cap Value Portfolio 23 $ May-03 VA Mid-Cap Value 6 4 / 76 2 1 / 63 2 1 / 52 - - 2 1 / 49 Income Funds Flexible Bond Portfolio 295 $ May-07 VA Intermediate Investment Grade Debt 10 7 / 73 17 11 / 67 19 11 / 60 18 5 / 28 13 9 / 69 ‡ Janus Aspen Series ("JAS") Institutional Shares 1-Year 10-Year 3-Year 5-Year Lipper Rankings Based on Total Returns as of 9/30/09 Since PM Inception |
|
|
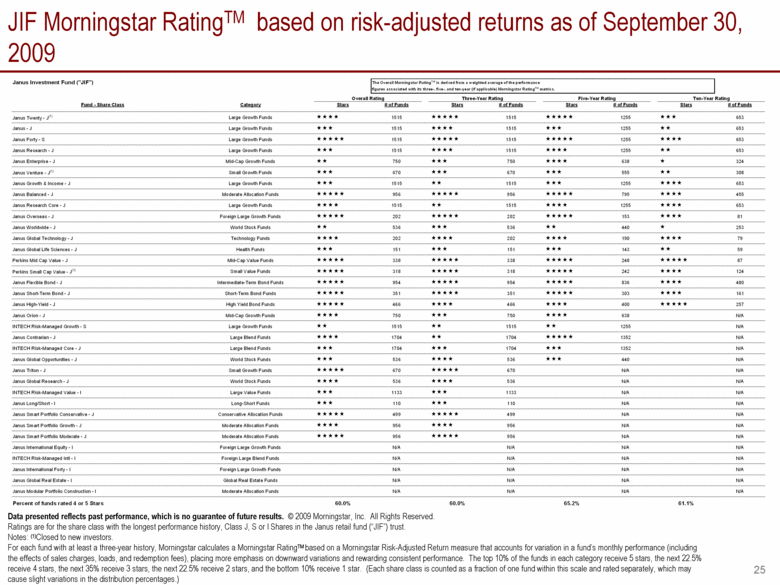
JIF Morningstar RatingTM based on risk-adjusted returns as of September 30, 2009 Data presented reflects past performance, which is no guarantee of future results. © 2009 Morningstar, Inc. All Rights Reserved. Ratings are for the share class with the longest performance history, Class J, S or I Shares in the Janus retail fund (“JIF”) trust. Notes: (1)Closed to new investors. For each fund with at least a three-year history, Morningstar calculates a Morningstar RatingTM based on a Morningstar Risk-Adjusted Return measure that accounts for variation in a fund’s monthly performance (including the effects of sales charges, loads, and redemption fees), placing more emphasis on downward variations and rewarding consistent performance. The top 10% of the funds in each category receive 5 stars, the next 22.5% receive 4 stars, the next 35% receive 3 stars, the next 22.5% receive 2 stars, and the bottom 10% receive 1 star. (Each share class is counted as a fraction of one fund within this scale and rated separately, which may cause slight variations in the distribution percentages.) Janus Investment Fund ("JIF") The Overall Morningstar RatingTM is derived from a weighted average of the performance figures associated with its three-, five-, and ten-year (if applicable) Morningstar RatingTM metrics. Fund - Share Class Category Stars # of Funds Stars # of Funds Stars # of Funds Stars # of Funds Janus Twenty - J(1) Large Growth Funds **** 1515 ***** 1515 ***** 1255 *** 653 Janus - J Large Growth Funds *** 1515 **** 1515 *** 1255 ** 653 Janus Forty - S Large Growth Funds ***** 1515 ***** 1515 ***** 1255 **** 653 Janus Research - J Large Growth Funds *** 1515 **** 1515 **** 1255 ** 653 Janus Enterprise - J Mid-Cap Growth Funds ** 750 *** 750 **** 638 * 324 Janus Venture - J(1) Small Growth Funds *** 670 *** 670 *** 555 ** 308 Janus Growth & Income - J Large Growth Funds *** 1515 ** 1515 *** 1255 **** 653 Janus Balanced - J Moderate Allocation Funds ***** 956 ***** 956 ***** 795 **** 455 Janus Research Core - J Large Growth Funds **** 1515 ** 1515 **** 1255 **** 653 Janus Overseas - J Foreign Large Growth Funds ***** 202 ***** 202 ***** 153 **** 81 Janus Worldwide - J World Stock Funds ** 536 *** 536 ** 440 * 253 Janus Global Technology - J Technology Funds **** 202 **** 202 **** 190 **** 79 Janus Global Life Sciences - J Health Funds *** 151 *** 151 *** 143 ** 59 Perkins Mid Cap Value - J Mid-Cap Value Funds ***** 338 ***** 338 ***** 248 ***** 87 Perkins Small Cap Value - J(1) Small Value Funds ***** 318 ***** 318 ***** 242 **** 124 Janus Flexible Bond - J Intermediate-Term Bond Funds ***** 954 ***** 954 ***** 836 **** 480 Janus Short-Term Bond - J Short-Term Bond Funds ***** 351 ***** 351 ***** 303 **** 161 Janus High-Yield - J High Yield Bond Funds ***** 466 **** 466 **** 400 ***** 257 Janus Orion - J Mid-Cap Growth Funds **** 750 *** 750 **** 638 N/A INTECH Risk-Managed Growth - S Large Growth Funds ** 1515 ** 1515 ** 1255 N/A Janus Contrarian - J Large Blend Funds **** 1704 ** 1704 ***** 1352 N/A INTECH Risk-Managed Core - J Large Blend Funds *** 1704 *** 1704 *** 1352 N/A Janus Global Opportunities - J World Stock Funds *** 536 **** 536 *** 440 N/A Janus Triton - J Small Growth Funds ***** 670 ***** 670 N/A N/A Janus Global Research - J World Stock Funds **** 536 **** 536 N/A N/A INTECH Risk-Managed Value - I Large Value Funds *** 1133 *** 1133 N/A N/A Janus Long/Short - I Long-Short Funds *** 110 *** 110 N/A N/A Janus Smart Portfolio Conservative - J Conservative Allocation Funds ***** 499 ***** 499 N/A N/A Janus Smart Portfolio Growth - J Moderate Allocation Funds **** 956 **** 956 N/A N/A Janus Smart Portfolio Moderate - J Moderate Allocation Funds ***** 956 ***** 956 N/A N/A Janus International Equity - I Foreign Large Growth Funds N/A N/A N/A N/A INTECH Risk-Managed Intl - I Foreign Large Blend Funds N/A N/A N/A N/A Janus International Forty - I Foreign Large Growth Funds N/A N/A N/A N/A Janus Global Real Estate - I Global Real Estate Funds N/A N/A N/A N/A Janus Modular Portfolio Construction - I Moderate Allocation Funds N/A N/A N/A N/A Percent of funds rated 4 or 5 Stars 60.0% 60.0% 65.2% 61.1% Ten-Year Rating Overall Rating Three-Year Rating Five-Year Rating |
|
|
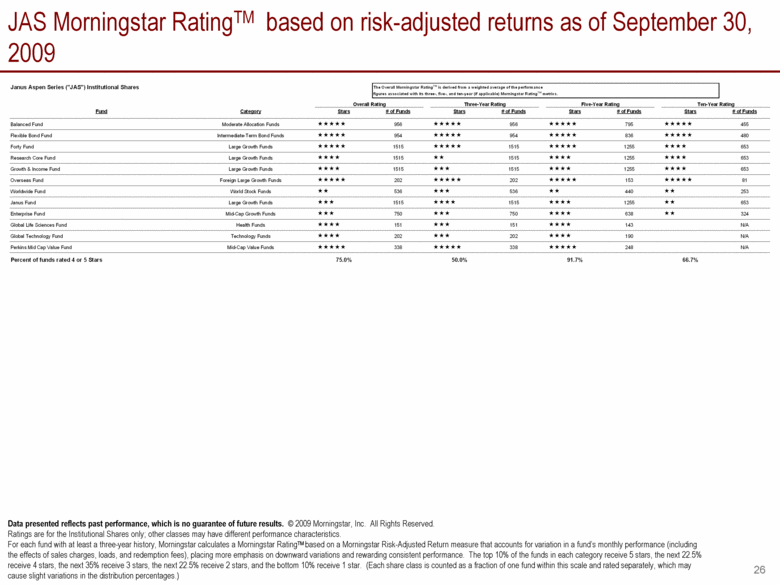
JAS Morningstar RatingTM based on risk-adjusted returns as of September 30, 2009 Data presented reflects past performance, which is no guarantee of future results. © 2009 Morningstar, Inc. All Rights Reserved. Ratings are for the Institutional Shares only; other classes may have different performance characteristics. For each fund with at least a three-year history, Morningstar calculates a Morningstar RatingTM based on a Morningstar Risk-Adjusted Return measure that accounts for variation in a fund’s monthly performance (including the effects of sales charges, loads, and redemption fees), placing more emphasis on downward variations and rewarding consistent performance. The top 10% of the funds in each category receive 5 stars, the next 22.5% receive 4 stars, the next 35% receive 3 stars, the next 22.5% receive 2 stars, and the bottom 10% receive 1 star. (Each share class is counted as a fraction of one fund within this scale and rated separately, which may cause slight variations in the distribution percentages.) Janus Aspen Series ("JAS") Institutional Shares The Overall Morningstar RatingTM is derived from a weighted average of the performance figures associated with its three-, five-, and ten-year (if applicable) Morningstar RatingTM metrics. Fund Category Stars # of Funds Stars # of Funds Stars # of Funds Stars # of Funds Balanced Fund Moderate Allocation Funds ***** 956 ***** 956 ***** 795 ***** 455 Flexible Bond Fund Intermediate-Term Bond Funds ***** 954 ***** 954 ***** 836 ***** 480 Forty Fund Large Growth Funds ***** 1515 ***** 1515 ***** 1255 **** 653 Research Core Fund Large Growth Funds **** 1515 ** 1515 **** 1255 **** 653 Growth & Income Fund Large Growth Funds **** 1515 *** 1515 **** 1255 **** 653 Overseas Fund Foreign Large Growth Funds ***** 202 ***** 202 ***** 153 ***** 81 Worldwide Fund World Stock Funds ** 536 *** 536 ** 440 ** 253 Janus Fund Large Growth Funds *** 1515 **** 1515 **** 1255 ** 653 Enterprise Fund Mid-Cap Growth Funds *** 750 *** 750 **** 638 ** 324 Global Life Sciences Fund Health Funds **** 151 *** 151 **** 143 N/A Global Technology Fund Technology Funds **** 202 *** 202 **** 190 N/A Perkins Mid Cap Value Fund Mid-Cap Value Funds ***** 338 ***** 338 ***** 248 N/A Percent of funds rated 4 or 5 Stars 75.0% 50.0% 91.7% 66.7% Ten-Year Rating Overall Rating Three-Year Rating Five-Year Rating |
|
|
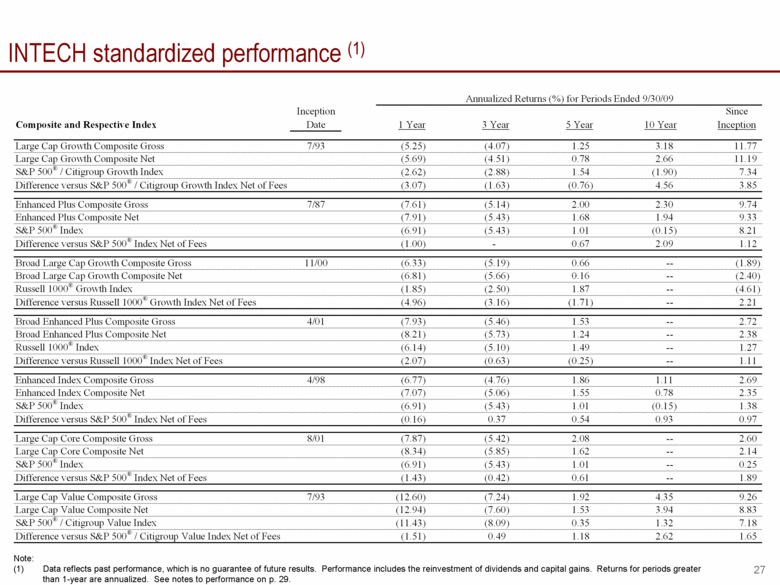
INTECH standardized performance (1) Note: Data reflects past performance, which is no guarantee of future results. Performance includes the reinvestment of dividends and capital gains. Returns for periods greater than 1-year are annualized. See notes to performance on p. 29. Inception Since Composite and Respective Index Date 1 Year 3 Year 5 Year 10 Year Inception Large Cap Growth Composite Gross 7/93 (5.25) (4.07) 1.25 3.18 11.77 Large Cap Growth Composite Net (5.69) (4.51) 0.78 2.66 11.19 S&P 500® / Citigroup Growth Index (2.62) (2.88) 1.54 (1.90) 7.34 Difference versus S&P 500® / Citigroup Growth Index Net of Fees (3.07) (1.63) (0.76) 4.56 3.85 Enhanced Plus Composite Gross 7/87 (7.61) (5.14) 2.00 2.30 9.74 Enhanced Plus Composite Net (7.91) (5.43) 1.68 1.94 9.33 S&P 500® Index (6.91) (5.43) 1.01 (0.15) 8.21 Difference versus S&P 500® Index Net of Fees (1.00) - 0.67 2.09 1.12 Broad Large Cap Growth Composite Gross 11/00 (6.33) (5.19) 0.66 -- (1.89) Broad Large Cap Growth Composite Net (6.81) (5.66) 0.16 -- (2.40) Russell 1000® Growth Index (1.85) (2.50) 1.87 -- (4.61) Difference versus Russell 1000® Growth Index Net of Fees (4.96) (3.16) (1.71) -- 2.21 Broad Enhanced Plus Composite Gross 4/01 (7.93) (5.46) 1.53 -- 2.72 Broad Enhanced Plus Composite Net (8.21) (5.73) 1.24 -- 2.38 Russell 1000® Index (6.14) (5.10) 1.49 -- 1.27 Difference versus Russell 1000® Index Net of Fees (2.07) (0.63) (0.25) -- 1.11 Enhanced Index Composite Gross 4/98 (6.77) (4.76) 1.86 1.11 2.69 Enhanced Index Composite Net (7.07) (5.06) 1.55 0.78 2.35 S&P 500® Index (6.91) (5.43) 1.01 (0.15) 1.38 Difference versus S&P 500® Index Net of Fees (0.16) 0.37 0.54 0.93 0.97 Large Cap Core Composite Gross 8/01 (7.87) (5.42) 2.08 -- 2.60 Large Cap Core Composite Net (8.34) (5.85) 1.62 -- 2.14 S&P 500® Index (6.91) (5.43) 1.01 -- 0.25 Difference versus S&P 500® Index Net of Fees (1.43) (0.42) 0.61 -- 1.89 Large Cap Value Composite Gross 7/93 (12.60) (7.24) 1.92 4.35 9.26 Large Cap Value Composite Net (12.94) (7.60) 1.53 3.94 8.83 S&P 500® / Citigroup Value Index (11.43) (8.09) 0.35 1.32 7.18 Difference versus S&P 500® / Citigroup Value Index Net of Fees (1.51) 0.49 1.18 2.62 1.65 Annualized Returns (%) for Periods Ended 9/30/09 |
|
|
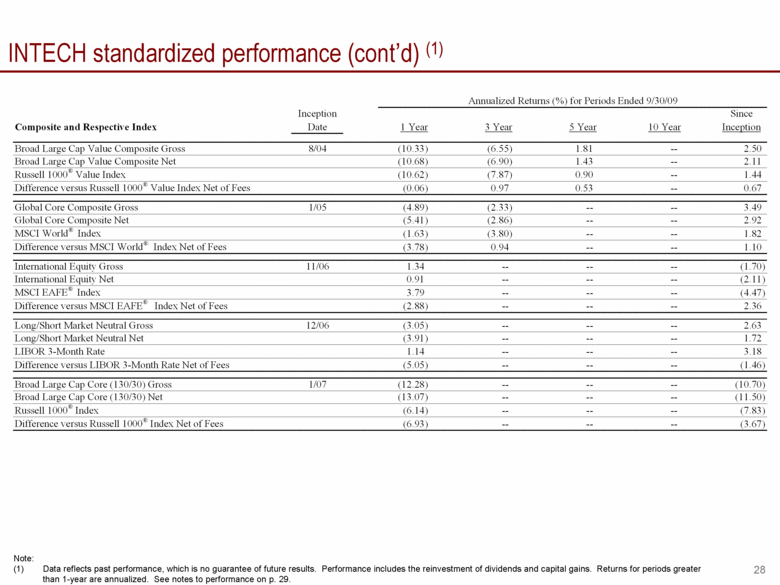
INTECH standardized performance (cont’d) (1) Note: Data reflects past performance, which is no guarantee of future results. Performance includes the reinvestment of dividends and capital gains. Returns for periods greater than 1-year are annualized. See notes to performance on p. 29. Inception Since Composite and Respective Index Date 1 Year 3 Year 5 Year 10 Year Inception Broad Large Cap Value Composite Gross 8/04 (10.33) (6.55) 1.81 -- 2.50 Broad Large Cap Value Composite Net (10.68) (6.90) 1.43 -- 2.11 Russell 1000® Value Index (10.62) (7.87) 0.90 -- 1.44 Difference versus Russell 1000® Value Index Net of Fees (0.06) 0.97 0.53 -- 0.67 Global Core Composite Gross 1/05 (4.89) (2.33) -- -- 3.49 Global Core Composite Net (5.41) (2.86) -- -- 2.92 MSCI World® Index (1.63) (3.80) -- -- 1.82 Difference versus MSCI World® Index Net of Fees (3.78) 0.94 -- -- 1.10 International Equity Gross 11/06 1.34 -- -- -- (1.70) International Equity Net 0.91 -- -- -- (2.11) MSCI EAFE® Index 3.79 -- -- -- (4.47) Difference versus MSCI EAFE® Index Net of Fees (2.88) -- -- -- 2.36 Long/Short Market Neutral Gross 12/06 (3.05) -- -- -- 2.63 Long/Short Market Neutral Net (3.91) -- -- -- 1.72 LIBOR 3-Month Rate 1.14 -- -- -- 3.18 Difference versus LIBOR 3-Month Rate Net of Fees (5.05) -- -- -- (1.46) Broad Large Cap Core (130/30) Gross 1/07 (12.28) -- -- -- (10.70) Broad Large Cap Core (130/30) Net (13.07) -- -- -- (11.50) Russell 1000® Index (6.14) -- -- -- (7.83) Difference versus Russell 1000® Index Net of Fees (6.93) -- -- -- (3.67) Annualized Returns (%) for Periods Ended 9/30/09 |
|
|
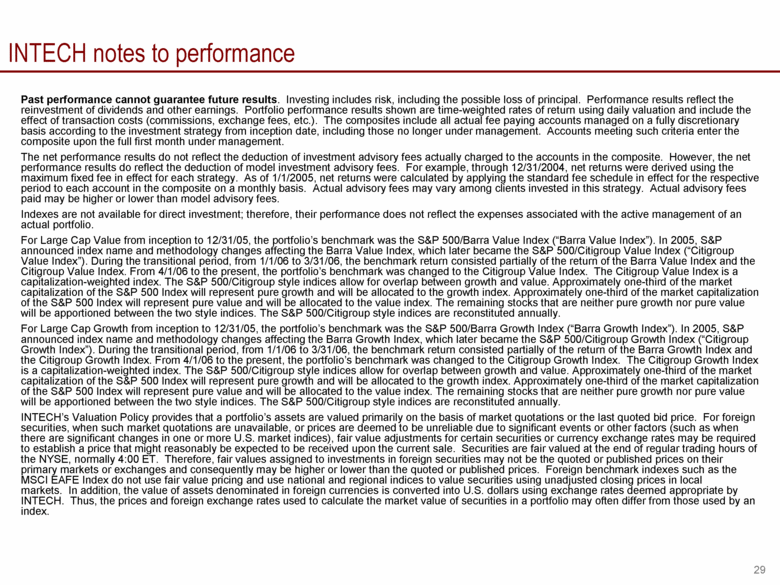
INTECH notes to performance Past performance cannot guarantee future results. Investing includes risk, including the possible loss of principal. Performance results reflect the reinvestment of dividends and other earnings. Portfolio performance results shown are time-weighted rates of return using daily valuation and include the effect of transaction costs (commissions, exchange fees, etc.). The composites include all actual fee paying accounts managed on a fully discretionary basis according to the investment strategy from inception date, including those no longer under management. Accounts meeting such criteria enter the composite upon the full first month under management. The net performance results do not reflect the deduction of investment advisory fees actually charged to the accounts in the composite. However, the net performance results do reflect the deduction of model investment advisory fees. For example, through 12/31/2004, net returns were derived using the maximum fixed fee in effect for each strategy. As of 1/1/2005, net returns were calculated by applying the standard fee schedule in effect for the respective period to each account in the composite on a monthly basis. Actual advisory fees may vary among clients invested in this strategy. Actual advisory fees paid may be higher or lower than model advisory fees. Indexes are not available for direct investment; therefore, their performance does not reflect the expenses associated with the active management of an actual portfolio. For Large Cap Value from inception to 12/31/05, the portfolio’s benchmark was the S&P 500/Barra Value Index (“Barra Value Index”). In 2005, S&P announced index name and methodology changes affecting the Barra Value Index, which later became the S&P 500/Citigroup Value Index (“Citigroup Value Index”). During the transitional period, from 1/1/06 to 3/31/06, the benchmark return consisted partially of the return of the Barra Value Index and the Citigroup Value Index. From 4/1/06 to the present, the portfolio’s benchmark was changed to the Citigroup Value Index. The Citigroup Value Index is a capitalization-weighted index. The S&P 500/Citigroup style indices allow for overlap between growth and value. Approximately one-third of the market capitalization of the S&P 500 Index will represent pure growth and will be allocated to the growth index. Approximately one-third of the market capitalization of the S&P 500 Index will represent pure value and will be allocated to the value index. The remaining stocks that are neither pure growth nor pure value will be apportioned between the two style indices. The S&P 500/Citigroup style indices are reconstituted annually. For Large Cap Growth from inception to 12/31/05, the portfolio’s benchmark was the S&P 500/Barra Growth Index (“Barra Growth Index”). In 2005, S&P announced index name and methodology changes affecting the Barra Growth Index, which later became the S&P 500/Citigroup Growth Index (“Citigroup Growth Index”). During the transitional period, from 1/1/06 to 3/31/06, the benchmark return consisted partially of the return of the Barra Growth Index and the Citigroup Growth Index. From 4/1/06 to the present, the portfolio’s benchmark was changed to the Citigroup Growth Index. The Citigroup Growth Index is a capitalization-weighted index. The S&P 500/Citigroup style indices allow for overlap between growth and value. Approximately one-third of the market capitalization of the S&P 500 Index will represent pure growth and will be allocated to the growth index. Approximately one-third of the market capitalization of the S&P 500 Index will represent pure value and will be allocated to the value index. The remaining stocks that are neither pure growth nor pure value will be apportioned between the two style indices. The S&P 500/Citigroup style indices are reconstituted annually. INTECH’s Valuation Policy provides that a portfolio’s assets are valued primarily on the basis of market quotations or the last quoted bid price. For foreign securities, when such market quotations are unavailable, or prices are deemed to be unreliable due to significant events or other factors (such as when there are significant changes in one or more U.S. market indices), fair value adjustments for certain securities or currency exchange rates may be required to establish a price that might reasonably be expected to be received upon the current sale. Securities are fair valued at the end of regular trading hours of the NYSE, normally 4:00 ET. Therefore, fair values assigned to investments in foreign securities may not be the quoted or published prices on their primary markets or exchanges and consequently may be higher or lower than the quoted or published prices. Foreign benchmark indexes such as the MSCI EAFE Index do not use fair value pricing and use national and regional indices to value securities using unadjusted closing prices in local markets. In addition, the value of assets denominated in foreign currencies is converted into U.S. dollars using exchange rates deemed appropriate by INTECH. Thus, the prices and foreign exchange rates used to calculate the market value of securities in a portfolio may often differ from those used by an index. |
|
|
Safe harbor statement This presentation includes statements concerning potential future events involving Janus Capital Group Inc. that could differ materially from the events that actually occur. The differences could be caused by a number of factors including those factors identified in Janus’ Annual Report on Form 10-K for the year ended December 31, 2008, on file with the Securities and Exchange Commission (Commission file no. 001-15253), including those that appear under headings such as “Risk Factors” and “Management’s Discussion and Analysis of Financial Condition and Results of Operations” and in the Prospectus Supplements, dated July 17, 2009, to the Registration Statement of Form S-3 (Registration No. 333-145310). Many of these factors are beyond the control of the company and its management. Any forward-looking statements contained in this presentation are as of the date on which such statements were made. The company assumes no duty to update them, even if experience, unexpected events, or future changes make it clear that any projected results expressed or implied therein will not be realized. |
|
|
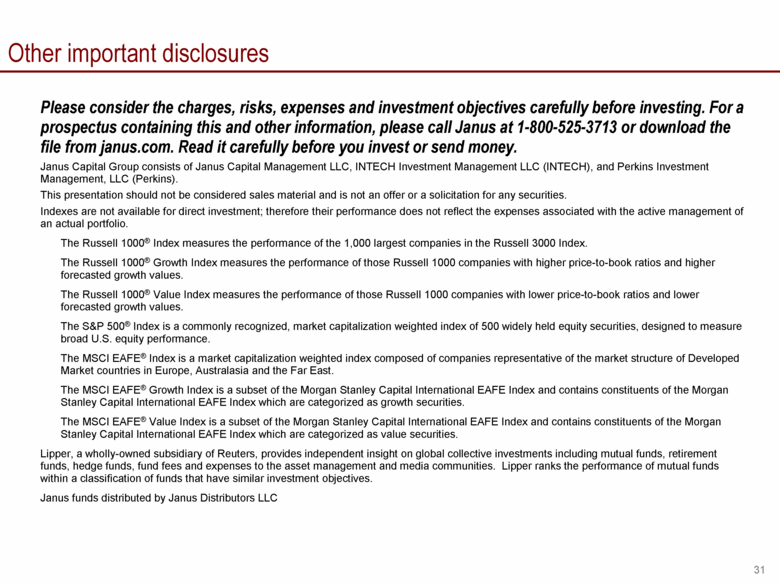
Please consider the charges, risks, expenses and investment objectives carefully before investing. For a prospectus containing this and other information, please call Janus at 1-800-525-3713 or download the file from janus.com. Read it carefully before you invest or send money. Janus Capital Group consists of Janus Capital Management LLC, INTECH Investment Management LLC (INTECH), and Perkins Investment Management, LLC (Perkins). This presentation should not be considered sales material and is not an offer or a solicitation for any securities. Indexes are not available for direct investment; therefore their performance does not reflect the expenses associated with the active management of an actual portfolio. The Russell 1000® Index measures the performance of the 1,000 largest companies in the Russell 3000 Index. The Russell 1000® Growth Index measures the performance of those Russell 1000 companies with higher price-to-book ratios and higher forecasted growth values. The Russell 1000® Value Index measures the performance of those Russell 1000 companies with lower price-to-book ratios and lower forecasted growth values. The S&P 500® Index is a commonly recognized, market capitalization weighted index of 500 widely held equity securities, designed to measure broad U.S. equity performance. The MSCI EAFE® Index is a market capitalization weighted index composed of companies representative of the market structure of Developed Market countries in Europe, Australasia and the Far East. The MSCI EAFE® Growth Index is a subset of the Morgan Stanley Capital International EAFE Index and contains constituents of the Morgan Stanley Capital International EAFE Index which are categorized as growth securities. The MSCI EAFE® Value Index is a subset of the Morgan Stanley Capital International EAFE Index and contains constituents of the Morgan Stanley Capital International EAFE Index which are categorized as value securities. Lipper, a wholly-owned subsidiary of Reuters, provides independent insight on global collective investments including mutual funds, retirement funds, hedge funds, fund fees and expenses to the asset management and media communities. Lipper ranks the performance of mutual funds within a classification of funds that have similar investment objectives. Janus funds distributed by Janus Distributors LLC Other important disclosures |

