Attached files
| file | filename |
|---|---|
| EX-99.3 - EXHIBIT 99.3 - QUANTENNA COMMUNICATIONS INC | exhibit993quantennaq4201.htm |
| 8-K - 8-K - QUANTENNA COMMUNICATIONS INC | qtna-21218x8k.htm |
| EX-99.1 - EXHIBIT 99.1 - QUANTENNA COMMUNICATIONS INC | exhibit991newsrelease-21218.htm |

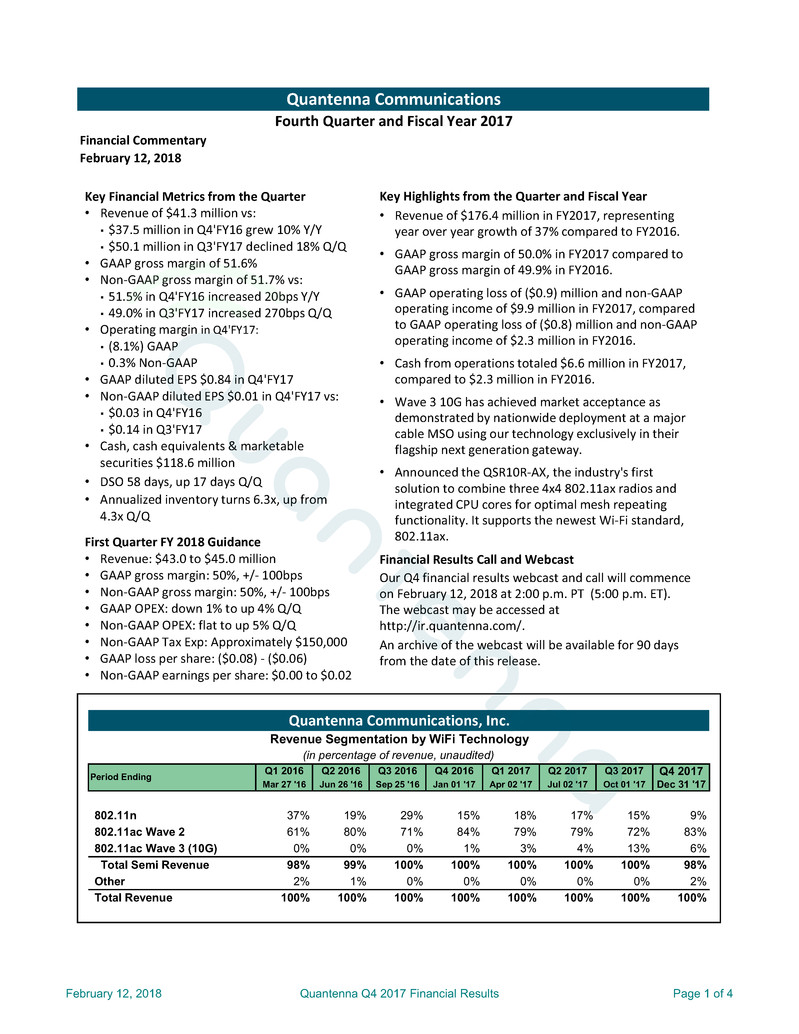
Financial Commentary
Q1 2016 Q2 2016 Q3 2016 Q4 2016 Q1 2017 Q2 2017 Q3 2017 Q4 2017
Mar 27 '16 Jun 26 '16 Sep 25 '16 Jan 01 '17 Apr 02 '17 Jul 02 '17 Oct 01 '17 Dec 31 '17
802.11n 37% 19% 29% 15% 18% 17% 15% 9%
802.11ac Wave 2 61% 80% 71% 84% 79% 79% 72% 83%
802.11ac Wave 3 (10G) 0% 0% 0% 1% 3% 4% 13% 6%
Total Semi Revenue 98% 99% 100% 100% 100% 100% 100% 98%
Other 2% 1% 0% 0% 0% 0% 0% 2%
Total Revenue 100% 100% 100% 100% 100% 100% 100% 100%
Fourth Quarter and Fiscal Year 2017
Quantenna Communications
Period Ending
February 12, 2018
Quantenna Communications, Inc.
Revenue Segmentation by WiFi Technology
(in percentage of revenue, unaudited)
Key Financial Metrics from the Quarter
• Revenue of $41.3 million vs:
▪ $37.5 million in Q4'FY16 grew 10% Y/Y
▪ $50.1 million in Q3'FY17 declined 18% Q/Q
• GAAP gross margin of 51.6%
• Non-GAAP gross margin of 51.7% vs:
▪ 51.5% in Q4'FY16 increased 20bps Y/Y
▪ 49.0% in Q3'FY17 increased 270bps Q/Q
• Operating margin in Q4'FY17:
▪ (8.1%) GAAP
▪ 0.3% Non-GAAP
• GAAP diluted EPS $0.84 in Q4'FY17
• Non-GAAP diluted EPS $0.01 in Q4'FY17 vs:
▪ $0.03 in Q4'FY16
▪ $0.14 in Q3'FY17
• Cash, cash equivalents & marketable
securities $118.6 million
• DSO 58 days, up 17 days Q/Q
• Annualized inventory turns 6.3x, up from
4.3x Q/Q
First Quarter FY 2018 Guidance
• Revenue: $43.0 to $45.0 million
• GAAP gross margin: 50%, +/- 100bps
• Non-GAAP gross margin: 50%, +/- 100bps
• GAAP OPEX: down 1% to up 4% Q/Q
• Non-GAAP OPEX: flat to up 5% Q/Q
• Non-GAAP Tax Exp: Approximately $150,000
• GAAP loss per share: ($0.08) - ($0.06)
• Non-GAAP earnings per share: $0.00 to $0.02
Key Highlights from the Quarter and Fiscal Year
• Revenue of $176.4 million in FY2017, representing
year over year growth of 37% compared to FY2016.
• GAAP gross margin of 50.0% in FY2017 compared to
GAAP gross margin of 49.9% in FY2016.
• GAAP operating loss of ($0.9) million and non-GAAP
operating income of $9.9 million in FY2017, compared
to GAAP operating loss of ($0.8) million and non-GAAP
operating income of $2.3 million in FY2016.
• Cash from operations totaled $6.6 million in FY2017,
compared to $2.3 million in FY2016.
• Wave 3 10G has achieved market acceptance as
demonstrated by nationwide deployment at a major
cable MSO using our technology exclusively in their
flagship next generation gateway.
• Announced the QSR10R-AX, the industry's first
solution to combine three 4x4 802.11ax radios and
integrated CPU cores for optimal mesh repeating
functionality. It supports the newest Wi-Fi standard,
802.11ax.
Financial Results Call and Webcast
Our Q4 financial results webcast and call will commence
on February 12, 2018 at 2:00 p.m. PT (5:00 p.m. ET).
The webcast may be accessed at
http://ir.quantenna.com/.
An archive of the webcast will be available for 90 days
from the date of this release.
February 12, 2018 Quantenna Q4 2017 Financial Results Page 1 of 4

Q1 2016 Q2 2016 Q3 2016 Q4 2016 Q1 2017 Q2 2017 Q3 2017 Q4 2017
Mar 27 '16 Jun 26 '16 Sep 25 '16 Jan 01 '17 Apr 02 '17 Jul 02 '17 Oct 01 '17 Dec 31 '17
Revenue 24,437$ 33,035$ 34,105$ 37,492$ 37,891$ 47,085$ 50,108$ 41,275$
COGS 12,534 16,671 17,247 18,188 19,307 23,314 25,591 19,996
Gross Margin 11,903 16,364 16,858 19,304 18,584 23,771 24,517 21,279
GM % of revenue 48.7% 49.5% 49.4% 51.5% 49.0% 50.5% 48.9% 51.6%
R&D 10,227 11,524 11,162 13,691 12,633 16,055 15,011 16,048
S&M 1,630 1,769 2,172 2,520 2,914 3,276 3,363 4,487
G&A 1,562 2,993 3,248 2,757 3,389 4,106 3,735 4,069
OPEX 13,419 16,286 16,582 18,968 18,936 23,437 22,109 24,604
OPEX % of revenue 54.9% 49.3% 48.6% 50.6% 50.0% 49.8% 44.1% 59.6%
Operating Income (loss) (1,516)$ 78$ 276$ 336$ (352)$ 334$ 2,408$ (3,325)$
OpInc % of revenue -6.2% 0.2% 0.8% 0.9% -0.9% 0.7% 4.8% -8.1%
Interest & Other Income (loss) (182) (291) (241) 10 3 45 120 237
Pretax Income (loss) (1,698) (213) 35 346 (349) 379 2,528 (3,088)
Taxes 17 21 14 314 535 210 (274) (35,413)
Tax Rate -1% -10% 40% 91% -153% 55% -11% 1147%
Net Income (loss) (1,715)$ (234)$ 21$ 32$ (884)$ 169$ 2,802$ 32,325$
Q1 2016 Q2 2016 Q3 2016 Q4 2016 Q1 2017 Q2 2017 Q3 2017 Q4 2017
Mar 27 '16 Jun 26 '16 Sep 25 '16 Jan 01 '17 Apr 02 '17 Jul 02 '17 Oct 01 '17 Dec 31 '17
Revenue 24,437$ 33,035$ 34,105$ 37,492$ 37,891$ 47,085$ 50,108$ 41,275$
COGS 12,531 16,668 17,238 18,170 19,264 23,272 25,553 19,954
Gross Margin 11,906 16,367 16,867 19,322 18,627 23,813 24,555 21,321
GM % of revenue 48.7% 49.5% 49.5% 51.5% 49.2% 50.6% 49.0% 51.7%
R&D 10,126 11,402 10,931 13,234 11,428 14,641 13,644 14,418
S&M 1,600 1,739 2,112 2,392 2,561 2,866 2,947 3,704
G&A 1,392 2,262 2,514 2,494 2,886 3,398 2,787 3,089
OPEX 13,118 15,403 15,557 18,120 16,875 20,905 19,378 21,211
OPEX % of revenue 53.7% 46.6% 45.6% 48.3% 44.5% 44.4% 38.7% 51.4%
Operating Income (loss) (1,212)$ 964$ 1,310$ 1,202$ 1,752$ 2,908$ 5,177$ 110$
OpInc % of revenue -5.0% 2.9% 3.8% 3.2% 4.6% 6.2% 10.3% 0.3%
Interest & Other Income (loss) (182) (291) (241) 10 3 45 120 237
Pretax Income (loss) (1,394) 673 1,069 1,212 1,755 2,953 5,297 347
Taxes 17 21 14 314 535 210 (274) (108)
Tax Rate -1% 3% 1% 26% 30% 7% -5% -31%
Net Income (loss) (1,411)$ 652$ 1,055$ 898$ 1,220$ 2,743$ 5,571$ 455$
Q1 2016 Q2 2016 Q3 2016 Q4 2016 Q1 2017 Q2 2017 Q3 2017 Q4 2017
Mar 27 '16 Jun 26 '16 Sep 25 '16 Jan 01 '17 Apr 02 '17 Jul 02 '17 Oct 01 '17 Dec 31 '17
Stock Based Compensation
COGS 3$ 3$ 9$ 18$ 43$ 42$ 38$ 42$
R&D 101 122 231 457 1,205 1,414 1,367 1,630
S&M 30 30 60 128 353 410 416 584
G&A 170 731 734 263 503 708 948 980
Total 304$ 886$ 1,034$ 866$ 2,104$ 2,574$ 2,769$ 3,236$
Non-Recurring Items
S&M 199$
Income Taxes (35,305)$
Period Ending
Quantenna Communications, Inc.
Period Ending
Period Ending
GAAP to Non-GAAP Reconciling Items
(in thousands, unaudited)
(in thousands, unaudited)
Consolidated Statements of Operations (Non-GAAP )
Consolidated Statements of Operations (GAAP)
(in thousands, unaudited)
February 12, 2018 Quantenna Q4 2017 Financial Results Page 2 of 4

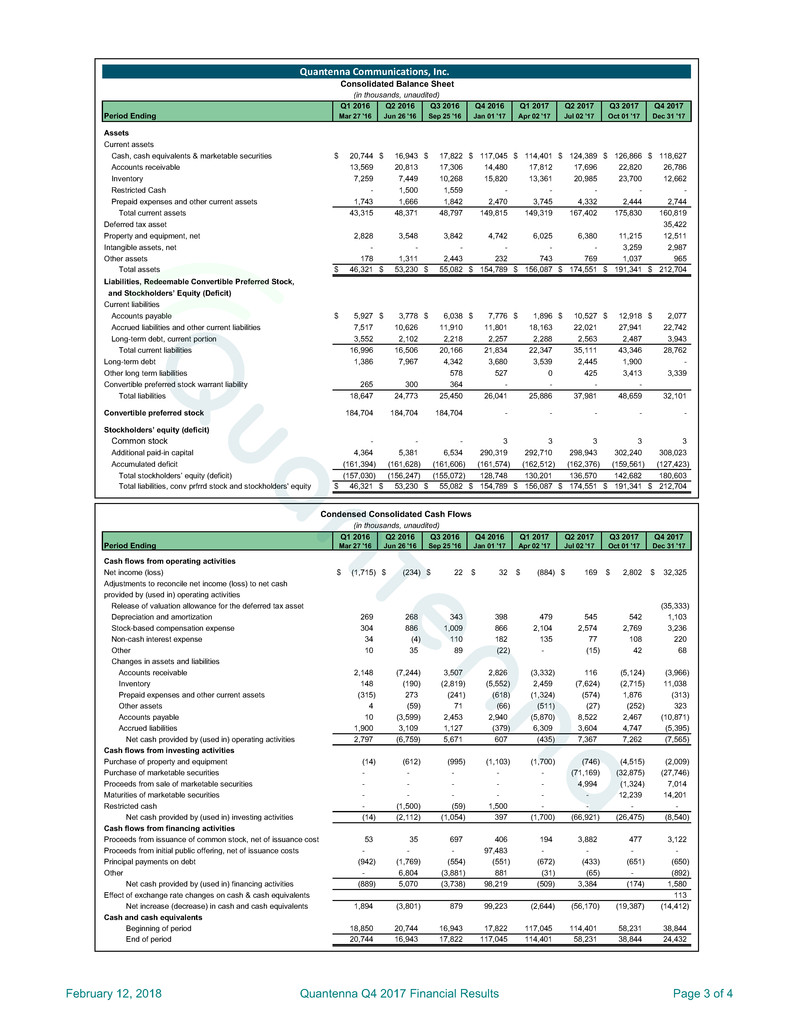
Q1 2016 Q2 2016 Q3 2016 Q4 2016 Q1 2017 Q2 2017 Q3 2017 Q4 2017
Period Ending Mar 27 '16 Jun 26 '16 Sep 25 '16 Jan 01 '17 Apr 02 '17 Jul 02 '17 Oct 01 '17 Dec 31 '17
Assets
Current assets
Cash, cash equivalents & marketable securities 20,744$ 16,943$ 17,822$ 117,045$ 114,401$ 124,389$ 126,866$ 118,627$
Accounts receivable 13,569 20,813 17,306 14,480 17,812 17,696 22,820 26,786
Inventory 7,259 7,449 10,268 15,820 13,361 20,985 23,700 12,662
Restricted Cash - 1,500 1,559 - - - - -
Prepaid expenses and other current assets 1,743 1,666 1,842 2,470 3,745 4,332 2,444 2,744
Total current assets 43,315 48,371 48,797 149,815 149,319 167,402 175,830 160,819
Deferred tax asset 35,422
Property and equipment, net 2,828 3,548 3,842 4,742 6,025 6,380 11,215 12,511
Intangible assets, net - - - - - - 3,259 2,987
Other assets 178 1,311 2,443 232 743 769 1,037 965
Total assets 46,321$ 53,230$ 55,082$ 154,789$ 156,087$ 174,551$ 191,341$ 212,704$
Liabilities, Redeemable Convertible Preferred Stock,
and Stockholders’ Equity (Deficit)
Current liabilities
Accounts payable 5,927$ 3,778$ 6,038$ 7,776$ 1,896$ 10,527$ 12,918$ 2,077$
Accrued liabilities and other current liabilities 7,517 10,626 11,910 11,801 18,163 22,021 27,941 22,742
Long-term debt, current portion 3,552 2,102 2,218 2,257 2,288 2,563 2,487 3,943
Total current liabilities 16,996 16,506 20,166 21,834 22,347 35,111 43,346 28,762
Long-term debt 1,386 7,967 4,342 3,680 3,539 2,445 1,900 -
Other long term liabilities 578 527 0 425 3,413 3,339
Convertible preferred stock warrant liability 265 300 364 - - - -
Total liabilities 18,647 24,773 25,450 26,041 25,886 37,981 48,659 32,101
Convertible preferred stock 184,704 184,704 184,704 - - - - -
Stockholders’ equity (deficit)
Common stock - - - 3 3 3 3 3
Additional paid-in capital 4,364 5,381 6,534 290,319 292,710 298,943 302,240 308,023
Accumulated deficit (161,394) (161,628) (161,606) (161,574) (162,512) (162,376) (159,561) (127,423)
Total stockholders’ equity (deficit) (157,030) (156,247) (155,072) 128,748 130,201 136,570 142,682 180,603
Total liabilities, conv prfrrd stock and stockholders' equity 46,321$ 53,230$ 55,082$ 154,789$ 156,087$ 174,551$ 191,341$ 212,704$
Q1 2016 Q2 2016 Q3 2016 Q4 2016 Q1 2017 Q2 2017 Q3 2017 Q4 2017
Period Ending Mar 27 '16 Jun 26 '16 Sep 25 '16 Jan 01 '17 Apr 02 '17 Jul 02 '17 Oct 01 '17 Dec 31 '17
Cash flows from operating activities
Net income (loss) (1,715)$ (234)$ 22$ 32$ (884)$ 169$ 2,802$ 32,325$
Adjustments to reconcile net income (loss) to net cash
provided by (used in) operating activities
Release of valuation allowance for the deferred tax asset (35,333)
Depreciation and amortization 269 268 343 398 479 545 542 1,103
Stock-based compensation expense 304 886 1,009 866 2,104 2,574 2,769 3,236
Non-cash interest expense 34 (4) 110 182 135 77 108 220
Other 10 35 89 (22) - (15) 42 68
Changes in assets and liabilities
Accounts receivable 2,148 (7,244) 3,507 2,826 (3,332) 116 (5,124) (3,966)
Inventory 148 (190) (2,819) (5,552) 2,459 (7,624) (2,715) 11,038
Prepaid expenses and other current assets (315) 273 (241) (618) (1,324) (574) 1,876 (313)
Other assets 4 (59) 71 (66) (511) (27) (252) 323
Accounts payable 10 (3,599) 2,453 2,940 (5,870) 8,522 2,467 (10,871)
Accrued liabilities 1,900 3,109 1,127 (379) 6,309 3,604 4,747 (5,395)
Net cash provided by (used in) operating activities 2,797 (6,759) 5,671 607 (435) 7,367 7,262 (7,565)
Cash flows from investing activities
Purchase of property and equipment (14) (612) (995) (1,103) (1,700) (746) (4,515) (2,009)
Purchase of marketable securities - - - - - (71,169) (32,875) (27,746)
Proceeds from sale of marketable securities - - - - - 4,994 (1,324) 7,014
Maturities of marketable securities - - - - - - 12,239 14,201
Restricted cash - (1,500) (59) 1,500 - - - -
Net cash provided by (used in) investing activities (14) (2,112) (1,054) 397 (1,700) (66,921) (26,475) (8,540)
Cash flows from financing activities
Proceeds from issuance of common stock, net of issuance cost 53 35 697 406 194 3,882 477 3,122
Proceeds from initial public offering, net of issuance costs - - - 97,483 - - - -
Principal payments on debt (942) (1,769) (554) (551) (672) (433) (651) (650)
Other - 6,804 (3,881) 881 (31) (65) - (892)
Net cash provided by (used in) financing activities (889) 5,070 (3,738) 98,219 (509) 3,384 (174) 1,580
Effect of exchange rate changes on cash & cash equivalents 113
Net increase (decrease) in cash and cash equivalents 1,894 (3,801) 879 99,223 (2,644) (56,170) (19,387) (14,412)
Cash and cash equivalents
Beginning of period 18,850 20,744 16,943 17,822 117,045 114,401 58,231 38,844
End of period 20,744 16,943 17,822 117,045 114,401 58,231 38,844 24,432
Quantenna Communications, Inc.
Consolidated Balance Sheet
(in thousands, unaudited)
Condensed Consolidated Cash Flows
(in thousands, unaudited)
February 12, 2018 Quantenna Q4 2017 Financial Results Page 3 of 4

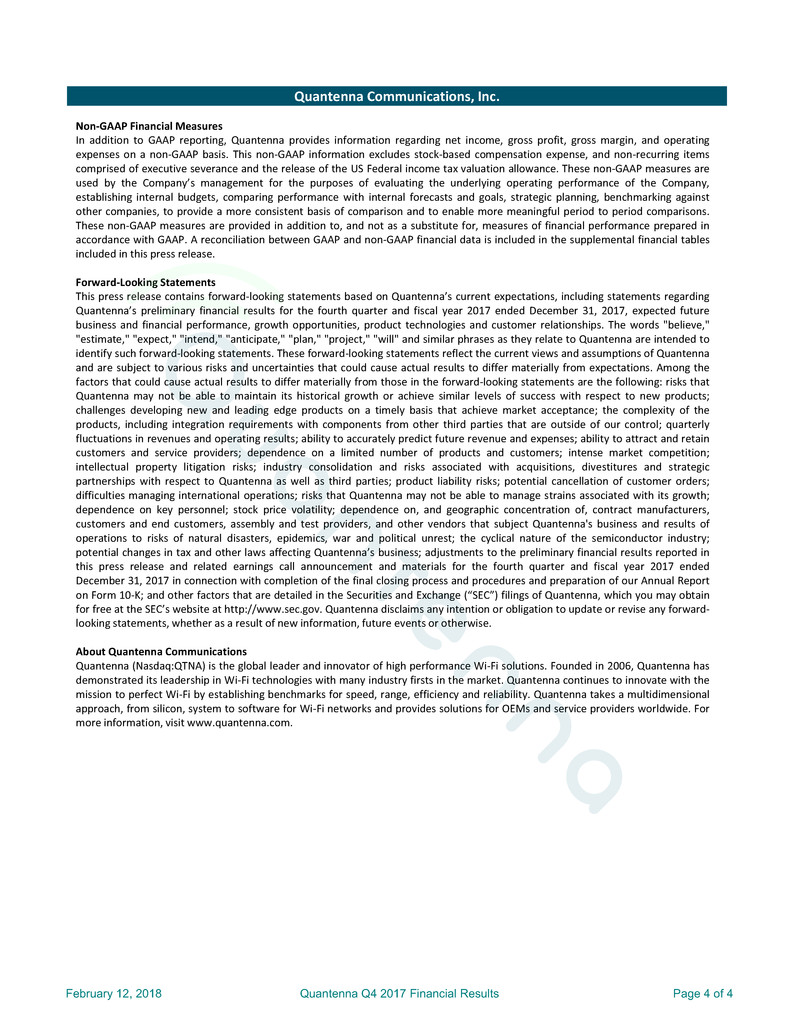
Quantenna Communications, Inc.
Non-GAAP Financial Measures
In addition to GAAP reporting, Quantenna provides information regarding net income, gross profit, gross margin, and operating
expenses on a non-GAAP basis. This non-GAAP information excludes stock-based compensation expense, and non-recurring items
comprised of executive severance and the release of the US Federal income tax valuation allowance. These non-GAAP measures are
used by the Company’s management for the purposes of evaluating the underlying operating performance of the Company,
establishing internal budgets, comparing performance with internal forecasts and goals, strategic planning, benchmarking against
other companies, to provide a more consistent basis of comparison and to enable more meaningful period to period comparisons.
These non-GAAP measures are provided in addition to, and not as a substitute for, measures of financial performance prepared in
accordance with GAAP. A reconciliation between GAAP and non-GAAP financial data is included in the supplemental financial tables
included in this press release.
Forward-Looking Statements
This press release contains forward-looking statements based on Quantenna’s current expectations, including statements regarding
Quantenna’s preliminary financial results for the fourth quarter and fiscal year 2017 ended December 31, 2017, expected future
business and financial performance, growth opportunities, product technologies and customer relationships. The words "believe,"
"estimate," "expect," "intend," "anticipate," "plan," "project," "will" and similar phrases as they relate to Quantenna are intended to
identify such forward-looking statements. These forward-looking statements reflect the current views and assumptions of Quantenna
and are subject to various risks and uncertainties that could cause actual results to differ materially from expectations. Among the
factors that could cause actual results to differ materially from those in the forward-looking statements are the following: risks that
Quantenna may not be able to maintain its historical growth or achieve similar levels of success with respect to new products;
challenges developing new and leading edge products on a timely basis that achieve market acceptance; the complexity of the
products, including integration requirements with components from other third parties that are outside of our control; quarterly
fluctuations in revenues and operating results; ability to accurately predict future revenue and expenses; ability to attract and retain
customers and service providers; dependence on a limited number of products and customers; intense market competition;
intellectual property litigation risks; industry consolidation and risks associated with acquisitions, divestitures and strategic
partnerships with respect to Quantenna as well as third parties; product liability risks; potential cancellation of customer orders;
difficulties managing international operations; risks that Quantenna may not be able to manage strains associated with its growth;
dependence on key personnel; stock price volatility; dependence on, and geographic concentration of, contract manufacturers,
customers and end customers, assembly and test providers, and other vendors that subject Quantenna's business and results of
operations to risks of natural disasters, epidemics, war and political unrest; the cyclical nature of the semiconductor industry;
potential changes in tax and other laws affecting Quantenna’s business; adjustments to the preliminary financial results reported in
this press release and related earnings call announcement and materials for the fourth quarter and fiscal year 2017 ended
December 31, 2017 in connection with completion of the final closing process and procedures and preparation of our Annual Report
on Form 10-K; and other factors that are detailed in the Securities and Exchange (“SEC”) filings of Quantenna, which you may obtain
for free at the SEC’s website at http://www.sec.gov. Quantenna disclaims any intention or obligation to update or revise any forward-
looking statements, whether as a result of new information, future events or otherwise.
About Quantenna Communications
Quantenna (Nasdaq:QTNA) is the global leader and innovator of high performance Wi-Fi solutions. Founded in 2006, Quantenna has
demonstrated its leadership in Wi-Fi technologies with many industry firsts in the market. Quantenna continues to innovate with the
mission to perfect Wi-Fi by establishing benchmarks for speed, range, efficiency and reliability. Quantenna takes a multidimensional
approach, from silicon, system to software for Wi-Fi networks and provides solutions for OEMs and service providers worldwide. For
more information, visit www.quantenna.com.
February 12, 2018 Quantenna Q4 2017 Financial Results Page 4 of 4
