Attached files
| file | filename |
|---|---|
| EX-99.1 - EX-99.1 - CPI Card Group Inc. | pmts-20210812xex99d1.htm |
| 8-K - 8-K - CPI Card Group Inc. | pmts-20210812x8k.htm |
Exhibit 99.2
| Investor Presentation Second Quarter and First Half 2021 August 12, 2021 |

| 2 Forward Looking Statements Certain statements and information in this presentation (as well as information included in other written or oral statements we make from time to time) may contain or constitute “forward-looking statements” within the meaning of the Private Securities Litigation Reform Act of 1995, Section 27A of the Securities Act of 1933, as amended, and Section 21E of the Securities Exchange Act of 1934, as amended. The words “believe,” “estimate,” “project,” “expect,” “anticipate,” “plan,” “intend,” “foresee,” “should,” “would,” “could,” “continue,” “committed,” “guides,” “provides guidance,” “provides outlook” or other similar expressions are intended to identify forward-looking statements, which are not historical in nature. These forward-looking statements, including statements about our strategic initiatives and market opportunities, are based on our current expectations and beliefs concerning future developments and their potential effect on us and other information currently available. Such forward-looking statements, because they relate to future events, are by their very nature subject to many important risks and uncertainties that could cause actual results or other events to differ materially from those contemplated. These risks and uncertainties include, but are not limited to: the potential effects of COVID-19 on our business, including our supply chain, customer demand, workforce, operations and ability to comply with certain covenants related to our indebtedness; a disruption or other failure in our supply chain or labor pool resulting in increased costs and inability to pass those costs on to our customers; our inability to recruit, retain and develop qualified personnel, including key personnel; our lack of eligibility to participate in government relief programs related to COVID-19 or inability to realize material benefits from such programs; our substantial indebtedness, including inability to make debt service payments or refinance such indebtedness; the restrictive terms of our indebtedness and covenants of future agreements governing indebtedness and the resulting restraints on our ability to pursue our business strategies; our limited ability to raise capital in the future; the effects of current or additional U.S. government tariffs as well as economic downturns or disruptions, including delays or interruptions in our ability to source raw materials and components used in our products; system security risks, data protection breaches and cyber-attacks; interruptions in our operations, including our information technology systems, or in the operations of the third parties that operate the data centers or computing infrastructure on which we rely; our transition to being an accelerated filer and complying with Section 404 of the Sarbanes-Oxley Act of 2002 and the costs associated with such compliance and implementation of procedures thereunder; failure to comply with regulations, customer contractual requirements and evolving industry standards regarding consumer privacy and data use and security; disruptions in production at one or more of our facilities; our failure to retain our existing customers or identify and attract new customers; our inability to adequately protect our trade secrets and intellectual property rights from misappropriation, infringement claims brought against us and risks related to open source software; defects in our software; problems in production quality, materials and process; a loss of market share or a decline in profitability resulting from competition; our inability to develop, introduce and commercialize new products; new and developing technologies that make our existing technology solutions and products obsolete or less relevant or our failure to introduce new products and services in a timely manner; costs and impacts to our financial results relating to the obligatory collection of sales tax and claims for uncollected sales tax in states that impose sales tax collection requirements on out-of-state businesses, as well as potential new U.S. tax legislation increasing the corporate income tax rate and challenges to our income tax positions; failure to meet the continued listing standards of the Toronto Stock Exchange or the Nasdaq Global Market; a decrease in the value of our common stock combined with our common stock not being traded on a United States national securities exchange, which may prevent investors or potential investors from investing or achieving a meaningful degree of liquidity; quarterly variation in our operating results; our inability to realize the full value of our long-lived assets; our failure to operate our business in accordance with the Payment Card Industry Security Standards Council security standards or other industry standards; a decline in U.S. and global market and economic conditions and resulting decreases in consumer and business spending; costs relating to product defects and any related product liability and/or warranty claims; our dependence on licensing arrangements; risks associated with international operations; non-compliance with, and changes in, laws in the United States and in foreign jurisdictions in which we operate and sell our products and services; the effect of legal and regulatory proceedings; our ability to comply with a wide variety of environmental, health and safety laws and regulations and the exposure to liability for any failure to comply; risks associated with the majority stockholders’ ownership of our stock; the influence of securities analysts over the trading market for and price of our common stock; our inability to sell, exit, reconfigure or consolidate businesses or facilities that no longer meet with our strategy; potential conflicts of interest that may arise due to our board of directors being comprised in part of directors who are principals of our majority stockholders; certain provisions of our organizational documents and other contractual provisions that may delay or prevent a change in control and make it difficult for stockholders other than our majority stockholders to change the composition of our board of directors; and other risks that are described in Part I, Item 1A– Risk Factors in our Annual Report on Form 10-K for the year ended December 31, 2020 and our other reports filed from time to time with the Securities and Exchange Commission (the “SEC”). We caution and advise readers not to place undue reliance on forward-looking statements, which speak only as of the date hereof. These statements are based on assumptions that may not be realized and involve risks and uncertainties that could cause actual results or other events to differ materially from the expectations and beliefs contained herein. We undertake no obligation to publicly update or revise any forward-looking statements after the date they are made, whether as a result of new information, future events or otherwise. Non-GAAP Financial Measures In addition to financial results reported in accordance with U.S. generally accepted accounting principles (“GAAP”), we have provided the following non-GAAP financial measures in this presentation, all reported on a continuing operations basis: Adjusted Net Income, Adjusted Diluted Earnings Per Share, EBITDA, Adjusted EBITDA, Adjusted EBITDA margin, LTM Adjusted EBITDA, Net Leverage Ratio, and Free Cash Flow. These non-GAAP financial measures are utilized by management in comparing our operating performance on a consistent basis between fiscal periods. We believe that these financial measures are appropriate to enhance an overall understanding of our underlying operating performance trends compared to historical and prospective periods and our peers. Management also believes that these measures are useful to investors in their analysis of our results of operations and provide improved comparability between fiscal periods. Non-GAAP financial measures should not be considered in isolation from, or as a substitute for, financial information calculated in accordance with GAAP. Our non-GAAP measures may be different from similarly titled measures of other companies. Additional information relating to certain financial measures, including our non-GAAP financial measures, is available in our most recent earnings release and on our website at http://investor.cpicardgroup.com. Cover Image: The Contactless Indicator mark, consisting of four graduating arcs, is a trademark owned by and used with permission of EMVCo, LLC. |
| 3 Agenda 1 2 3 Strategic Update Financial Review Summary 4 Vision and Strategic Priorities |

| 4 Strategic Update The Contactless Indicator mark, consisting of four graduating arcs, is a trademark owned by and used with permission of EMVCo, LLC. |

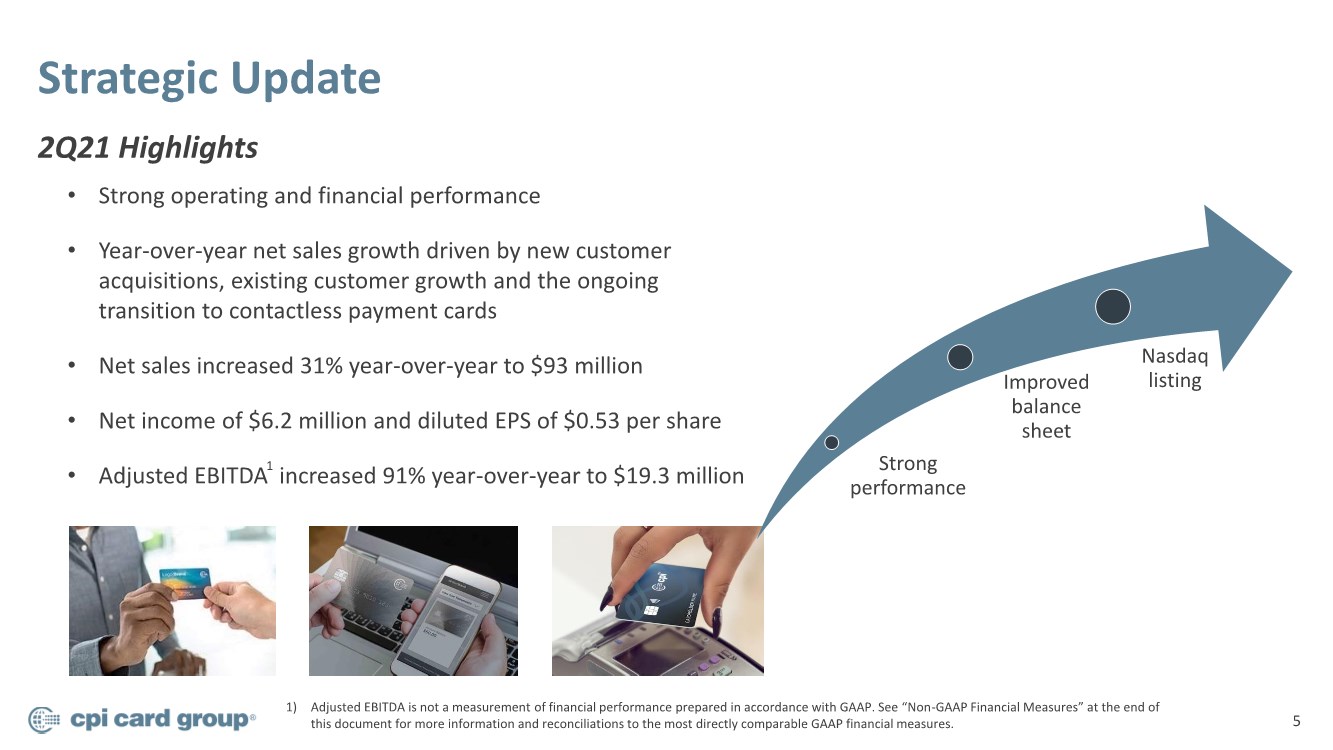
| 5 Strategic Update 2Q21 Highlights Strong performance Improved balance sheet Nasdaq listing • Strong operating and financial performance • Year-over-year net sales growth driven by new customer acquisitions, existing customer growth and the ongoing transition to contactless payment cards • Net sales increased 31% year-over-year to $93 million • Net income of $6.2 million and diluted EPS of $0.53 per share • Adjusted EBITDA increased 91% year-over-year to $19.3 million 1) Adjusted EBITDA is not a measurement of financial performance prepared in accordance with GAAP. See “Non-GAAP Financial Measures” at the end of this document for more information and reconciliations to the most directly comparable GAAP financial measures. 1 |
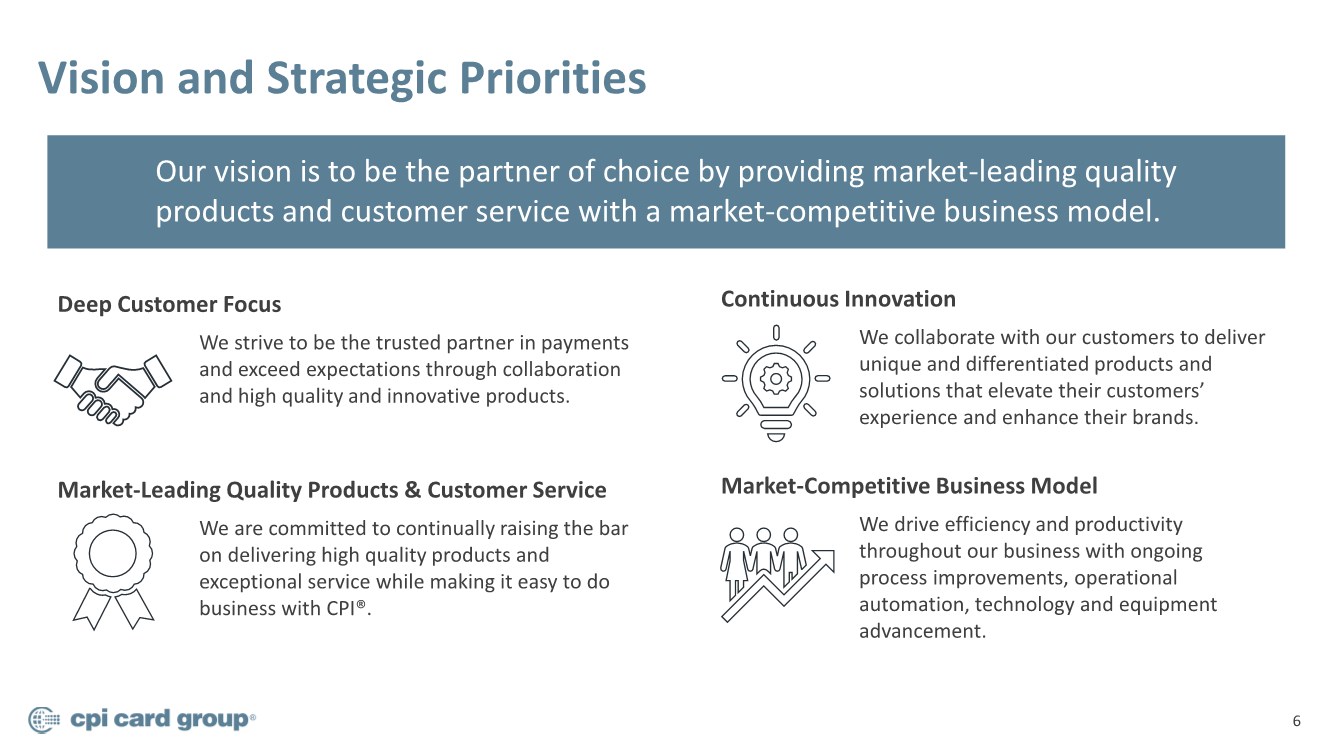
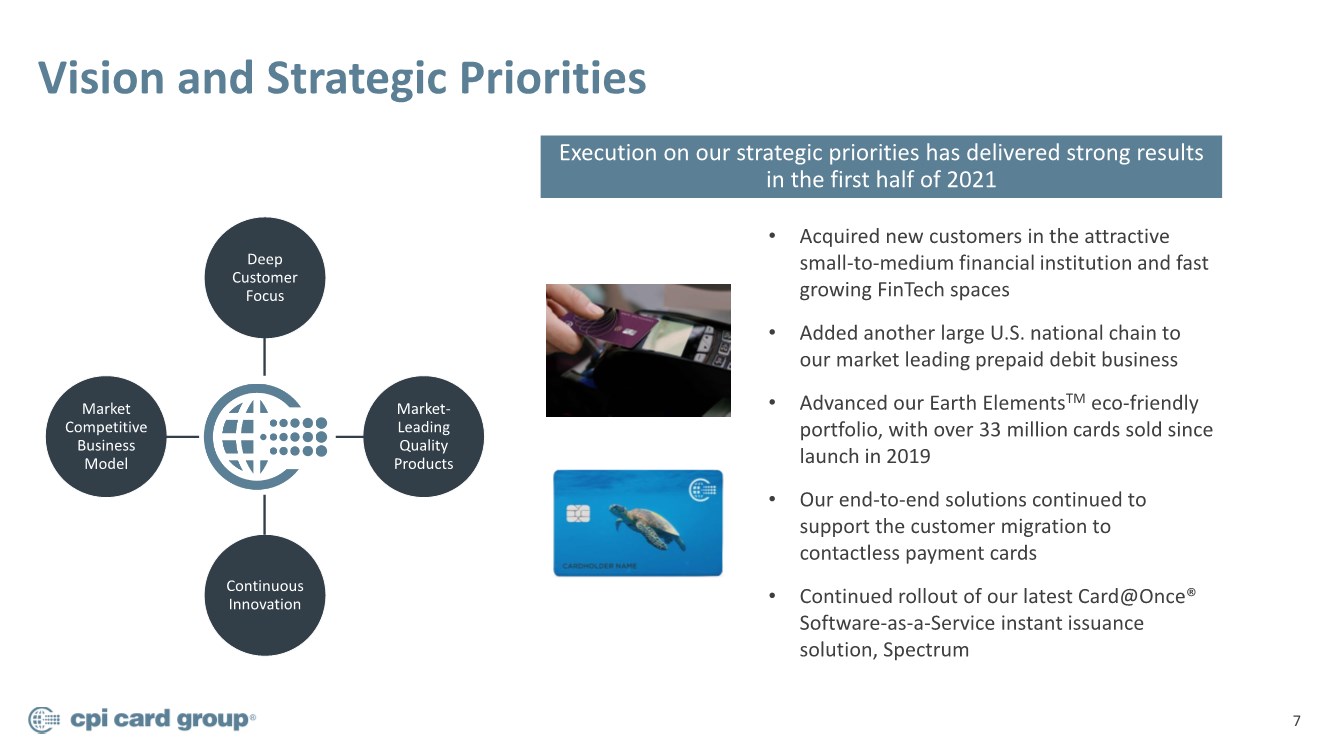
| 6 Vision and Strategic Priorities Our vision is to be the partner of choice by providing market-leading quality products and customer service with a market-competitive business model. Deep Customer Focus We strive to be the trusted partner in payments and exceed expectations through collaboration and high quality and innovative products. Market-Leading Quality Products & Customer Service We are committed to continually raising the bar on delivering high quality products and exceptional service while making it easy to do business with CPI®. Continuous Innovation We collaborate with our customers to deliver unique and differentiated products and solutions that elevate their customers’ experience and enhance their brands. Market-Competitive Business Model We drive efficiency and productivity throughout our business with ongoing process improvements, operational automation, technology and equipment advancement. |
| 7 Deep Customer Focus Market- Leading Quality Products Continuous Innovation Market Competitive Business Model Vision and Strategic Priorities • Acquired new customers in the attractive small-to-medium financial institution and fast growing FinTech spaces • Added another large U.S. national chain to our market leading prepaid debit business • Advanced our Earth ElementsTM eco-friendly portfolio, with over 33 million cards sold since launch in 2019 • Our end-to-end solutions continued to support the customer migration to contactless payment cards • Continued rollout of our latest Card@Once® Software-as-a-Service instant issuance solution, Spectrum Execution on our strategic priorities has delivered strong results in the first half of 2021 |
| 8 Financial Review The Contactless Indicator mark, consisting of four graduating arcs, is a trademark owned by and used with permission of EMVCo, LLC. |

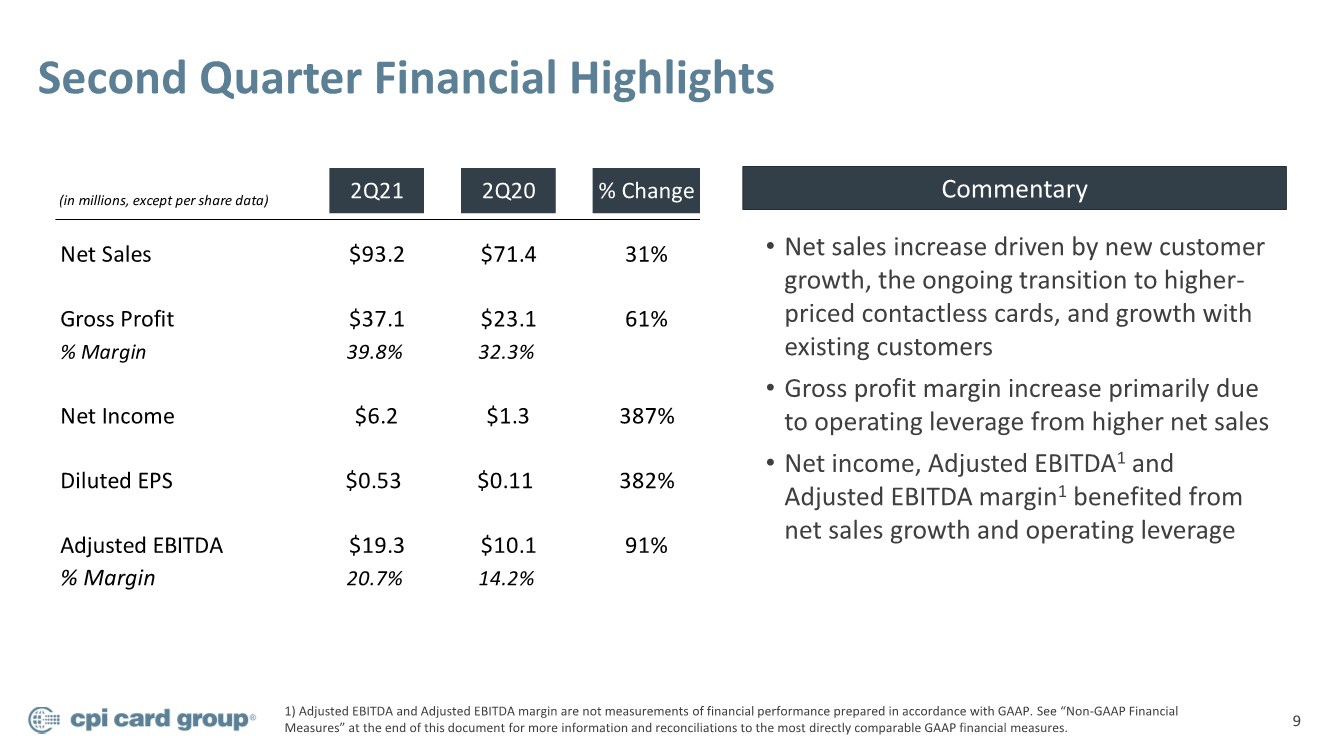
| 9 (in millions, except per share data) 2Q21 2Q20 % Change Net Sales $93.2 $71.4 31% Gross Profit $37.1 $23.1 61% % Margin 39.8% 32.3% Net Income $6.2 $1.3 387% Diluted EPS $0.53 $0.11 382% Adjusted EBITDA $19.3 $10.1 91% % Margin 20.7% 14.2% Second Quarter Financial Highlights 1) Adjusted EBITDA and Adjusted EBITDA margin are not measurements of financial performance prepared in accordance with GAAP. See “Non-GAAP Financial Measures” at the end of this document for more information and reconciliations to the most directly comparable GAAP financial measures. • Net sales increase driven by new customer growth, the ongoing transition to higher- priced contactless cards, and growth with existing customers • Gross profit margin increase primarily due to operating leverage from higher net sales • Net income, Adjusted EBITDA1 and Adjusted EBITDA margin1 benefited from net sales growth and operating leverage Commentary |
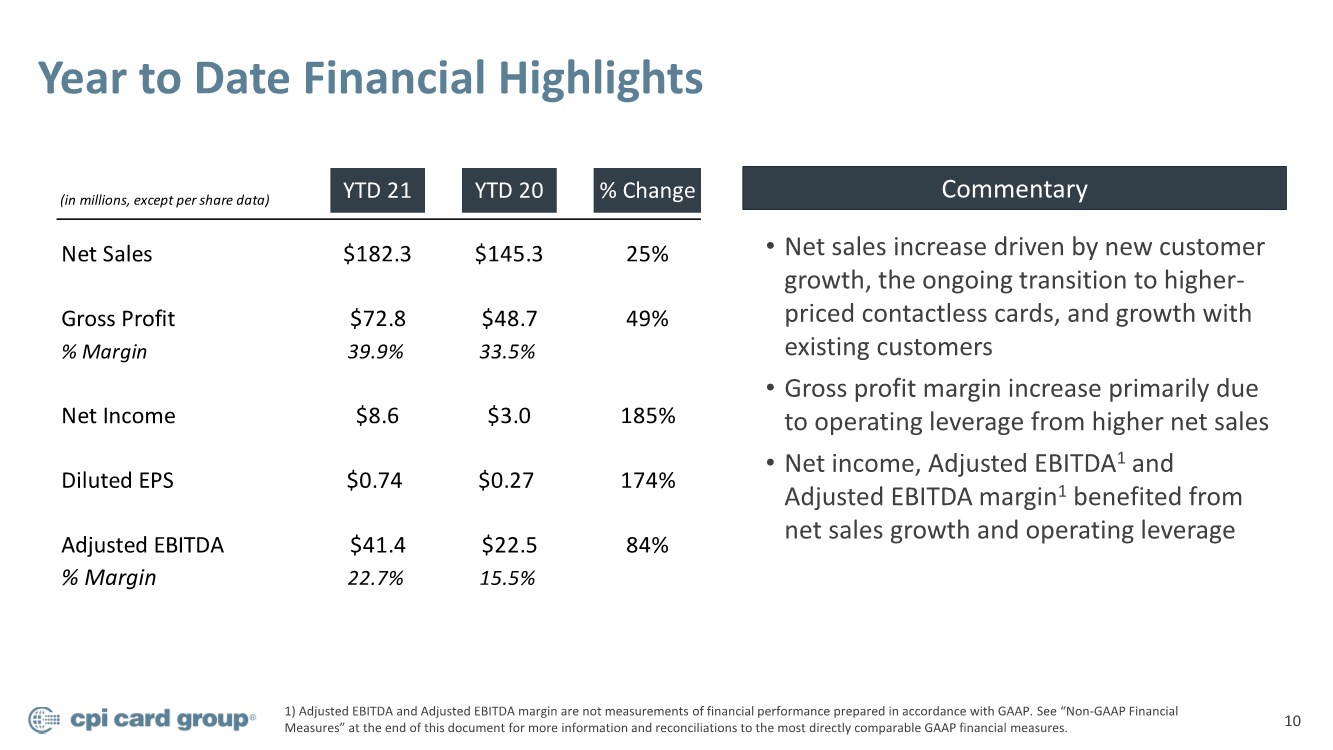
| 10 (in millions, except per share data) YTD 21 YTD 20 % Change Net Sales $182.3 $145.3 25% Gross Profit $72.8 $48.7 49% % Margin 39.9% 33.5% Net Income $8.6 $3.0 185% Diluted EPS $0.74 $0.27 174% Adjusted EBITDA $41.4 $22.5 84% % Margin 22.7% 15.5% Year to Date Financial Highlights 1) Adjusted EBITDA and Adjusted EBITDA margin are not measurements of financial performance prepared in accordance with GAAP. See “Non-GAAP Financial Measures” at the end of this document for more information and reconciliations to the most directly comparable GAAP financial measures. • Net sales increase driven by new customer growth, the ongoing transition to higher- priced contactless cards, and growth with existing customers • Gross profit margin increase primarily due to operating leverage from higher net sales • Net income, Adjusted EBITDA1 and Adjusted EBITDA margin1 benefited from net sales growth and operating leverage Commentary |
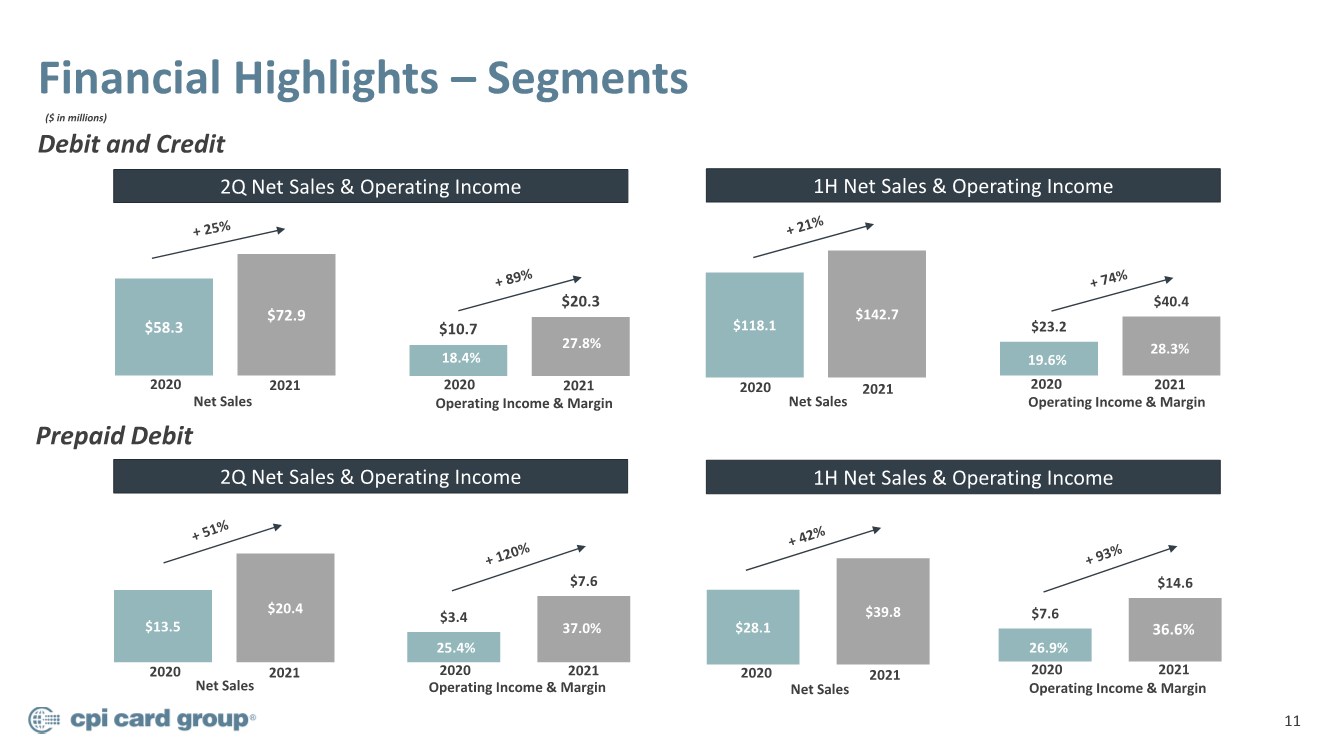
| 11 $13.5 $20.4 Financial Highlights – Segments Debit and Credit 2Q Net Sales & Operating Income 1H Net Sales & Operating Income 2Q Net Sales & Operating Income 1H Net Sales & Operating Income Prepaid Debit ($ in millions) $58.3 $72.9 $10.7 $20.3 18.4% 27.8% Net Sales Operating Income & Margin $118.1 $142.7 $23.2 $40.4 19.6% 28.3% $3.4 $7.6 25.4% 37.0% $28.1 $39.8 $7.6 $14.6 26.9% 36.6% Net Sales Operating Income & Margin Net Sales Net Sales Operating Income & Margin Operating Income & Margin 2020 2021 2020 2021 2020 2021 2020 2021 2020 2021 2020 2021 2020 2021 2020 2021 |
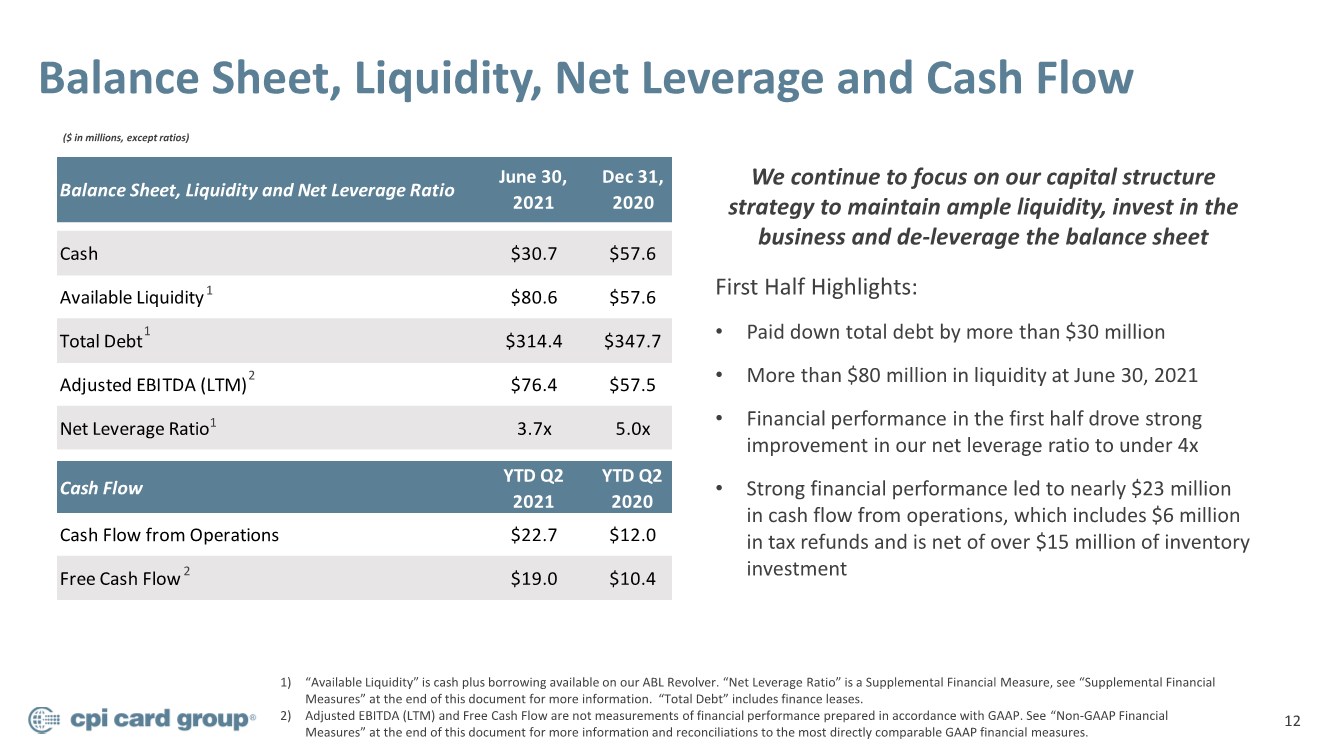
| 12 Balance Sheet, Liquidity, Net Leverage and Cash Flow Balance Sheet, Liquidity and Net Leverage Ratio June 30, 2021 Dec 31, 2020 Cash $30.7 $57.6 Available Liquidity $80.6 $57.6 Total Debt $314.4 $347.7 Adjusted EBITDA (LTM) $76.4 $57.5 Net Leverage Ratio 3.7x 5.0x Cash Flow YTD Q2 2021 YTD Q2 2020 Cash Flow from Operations $22.7 $12.0 Free Cash Flow $19.0 $10.4 1) “Available Liquidity” is cash plus borrowing available on our ABL Revolver. “Net Leverage Ratio” is a Supplemental Financial Measure, see “Supplemental Financial Measures” at the end of this document for more information. “Total Debt” includes finance leases. 2) Adjusted EBITDA (LTM) and Free Cash Flow are not measurements of financial performance prepared in accordance with GAAP. See “Non-GAAP Financial Measures” at the end of this document for more information and reconciliations to the most directly comparable GAAP financial measures. 2 1 1 2 ($ in millions, except ratios) 1 We continue to focus on our capital structure strategy to maintain ample liquidity, invest in the business and de-leverage the balance sheet First Half Highlights: • Paid down total debt by more than $30 million • More than $80 million in liquidity at June 30, 2021 • Financial performance in the first half drove strong improvement in our net leverage ratio to under 4x • Strong financial performance led to nearly $23 million in cash flow from operations, which includes $6 million in tax refunds and is net of over $15 million of inventory investment |
| 13 We remain committed to being the partner of choice by providing market-leading quality products and customer service through a market- competitive business model. Summary • Solid execution throughout the business • Strong net sales growth and margin expansion • Well positioned to deliver on our strategies |
| 14 Contact www.cpicardgroup.com (877) 369-9016 InvestorRelations@cpicardgroup.com |

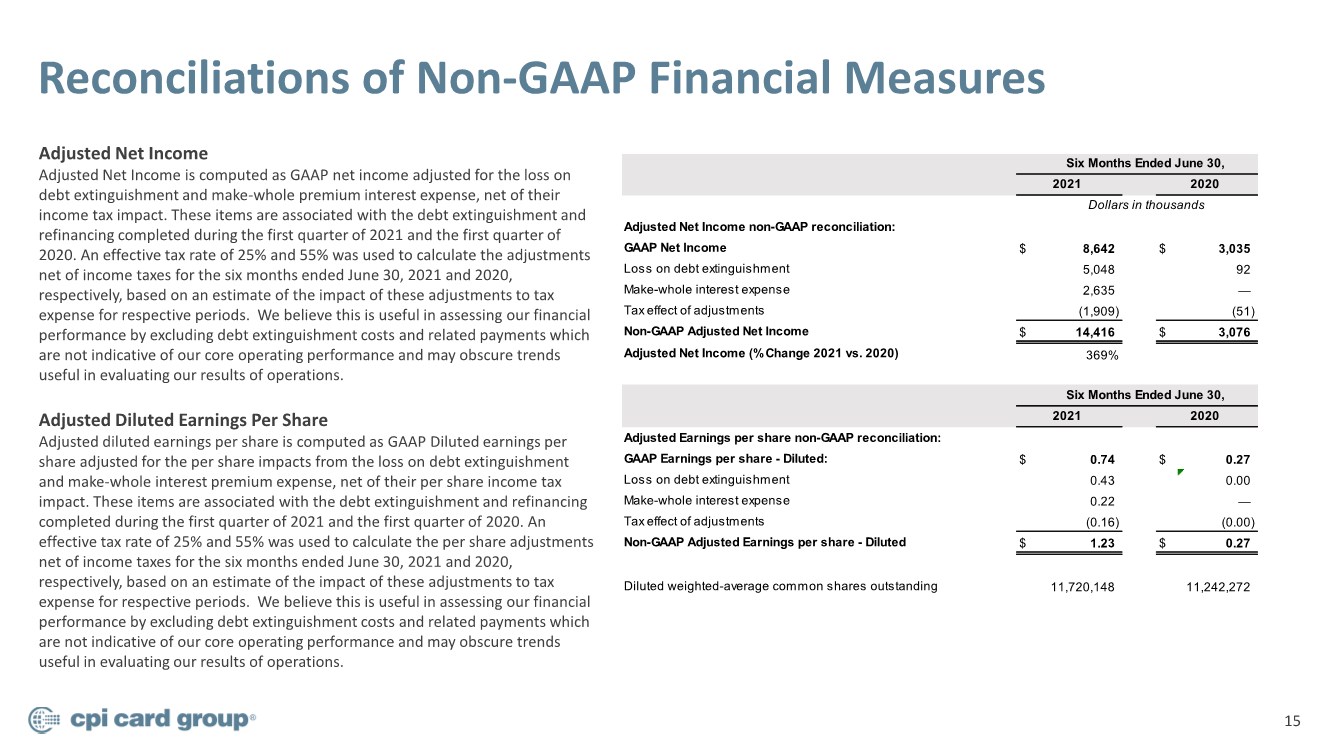
| 15 Adjusted Net Income non-GAAP reconciliation: GAAP Net Income $ 8,642 $ 3,035 Loss on debt extinguishment 5,048 92 Make-whole interest expense 2,635 — Tax effect of adjustments (1,909) (51) Non-GAAP Adjusted Net Income $ 14,416 $ 3,076 Adjusted Net Income (% Change 2021 vs. 2020) 369% Adjusted Earnings per share non-GAAP reconciliation: GAAP Earnings per share - Diluted: $ 0.74 $ 0.27 Loss on debt extinguishment 0.43 0.00 Make-whole interest expense 0.22 — Tax effect of adjustments (0.16) (0.00) Non-GAAP Adjusted Earnings per share - Diluted $ 1.23 $ 0.27 Diluted weighted-average common shares outstanding 11,720,148 11,242,272 Six Months Ended June 30, 2021 2020 Dollars in thousands Six Months Ended June 30, 2021 2020 Reconciliations of Non-GAAP Financial Measures Adjusted Net Income Adjusted Net Income is computed as GAAP net income adjusted for the loss on debt extinguishment and make-whole premium interest expense, net of their income tax impact. These items are associated with the debt extinguishment and refinancing completed during the first quarter of 2021 and the first quarter of 2020. An effective tax rate of 25% and 55% was used to calculate the adjustments net of income taxes for the six months ended June 30, 2021 and 2020, respectively, based on an estimate of the impact of these adjustments to tax expense for respective periods. We believe this is useful in assessing our financial performance by excluding debt extinguishment costs and related payments which are not indicative of our core operating performance and may obscure trends useful in evaluating our results of operations. Adjusted Diluted Earnings Per Share Adjusted diluted earnings per share is computed as GAAP Diluted earnings per share adjusted for the per share impacts from the loss on debt extinguishment and make-whole interest premium expense, net of their per share income tax impact. These items are associated with the debt extinguishment and refinancing completed during the first quarter of 2021 and the first quarter of 2020. An effective tax rate of 25% and 55% was used to calculate the per share adjustments net of income taxes for the six months ended June 30, 2021 and 2020, respectively, based on an estimate of the impact of these adjustments to tax expense for respective periods. We believe this is useful in assessing our financial performance by excluding debt extinguishment costs and related payments which are not indicative of our core operating performance and may obscure trends useful in evaluating our results of operations. |
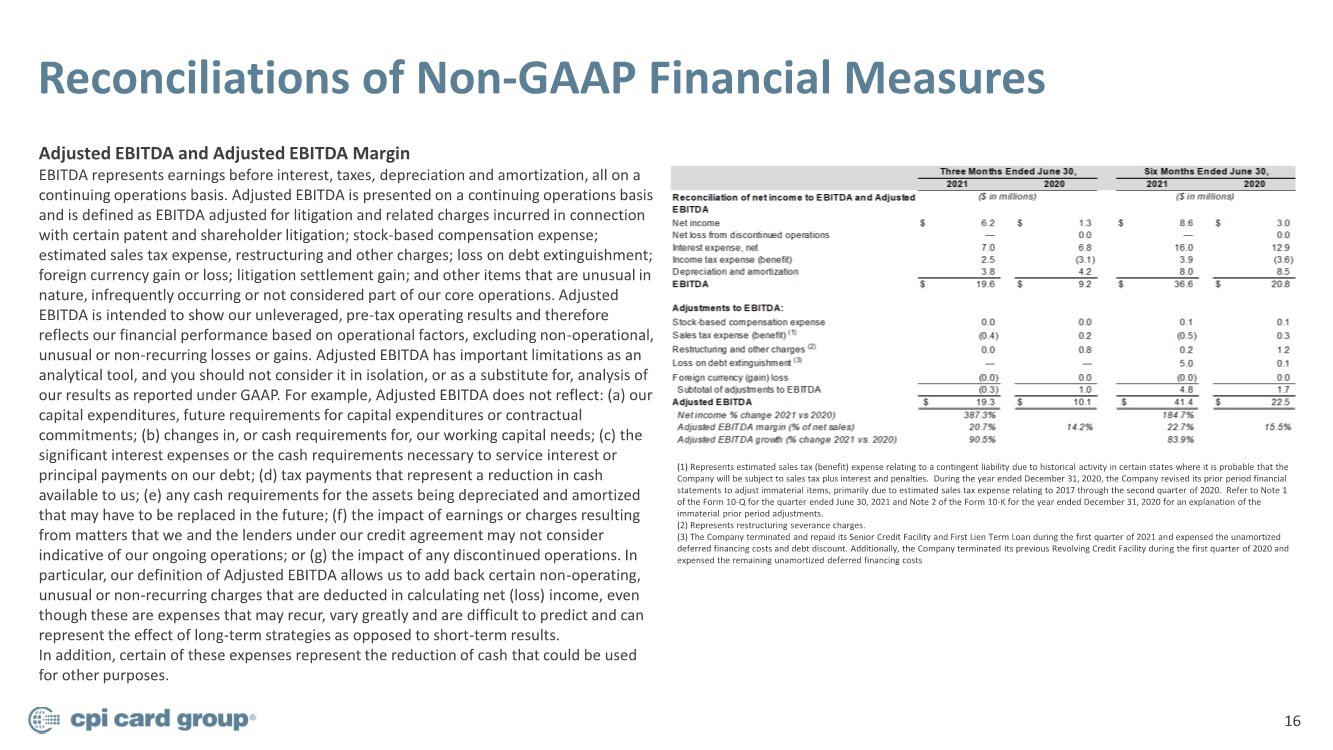
| 16 Reconciliations of Non-GAAP Financial Measures Adjusted EBITDA and Adjusted EBITDA Margin EBITDA represents earnings before interest, taxes, depreciation and amortization, all on a continuing operations basis. Adjusted EBITDA is presented on a continuing operations basis and is defined as EBITDA adjusted for litigation and related charges incurred in connection with certain patent and shareholder litigation; stock-based compensation expense; estimated sales tax expense, restructuring and other charges; loss on debt extinguishment; foreign currency gain or loss; litigation settlement gain; and other items that are unusual in nature, infrequently occurring or not considered part of our core operations. Adjusted EBITDA is intended to show our unleveraged, pre-tax operating results and therefore reflects our financial performance based on operational factors, excluding non-operational, unusual or non-recurring losses or gains. Adjusted EBITDA has important limitations as an analytical tool, and you should not consider it in isolation, or as a substitute for, analysis of our results as reported under GAAP. For example, Adjusted EBITDA does not reflect: (a) our capital expenditures, future requirements for capital expenditures or contractual commitments; (b) changes in, or cash requirements for, our working capital needs; (c) the significant interest expenses or the cash requirements necessary to service interest or principal payments on our debt; (d) tax payments that represent a reduction in cash available to us; (e) any cash requirements for the assets being depreciated and amortized that may have to be replaced in the future; (f) the impact of earnings or charges resulting from matters that we and the lenders under our credit agreement may not consider indicative of our ongoing operations; or (g) the impact of any discontinued operations. In particular, our definition of Adjusted EBITDA allows us to add back certain non-operating, unusual or non-recurring charges that are deducted in calculating net (loss) income, even though these are expenses that may recur, vary greatly and are difficult to predict and can represent the effect of long-term strategies as opposed to short-term results. In addition, certain of these expenses represent the reduction of cash that could be used for other purposes. (1) Represents estimated sales tax (benefit) expense relating to a contingent liability due to historical activity in certain states where it is probable that the Company will be subject to sales tax plus interest and penalties. During the year ended December 31, 2020, the Company revised its prior period financial statements to adjust immaterial items, primarily due to estimated sales tax expense relating to 2017 through the second quarter of 2020. Refer to Note 1 of the Form 10-Q for the quarter ended June 30, 2021 and Note 2 of the Form 10-K for the year ended December 31, 2020 for an explanation of the immaterial prior period adjustments. (2) Represents restructuring severance charges. (3) The Company terminated and repaid its Senior Credit Facility and First Lien Term Loan during the first quarter of 2021 and expensed the unamortized deferred financing costs and debt discount. Additionally, the Company terminated its previous Revolving Credit Facility during the first quarter of 2020 and expensed the remaining unamortized deferred financing costs |
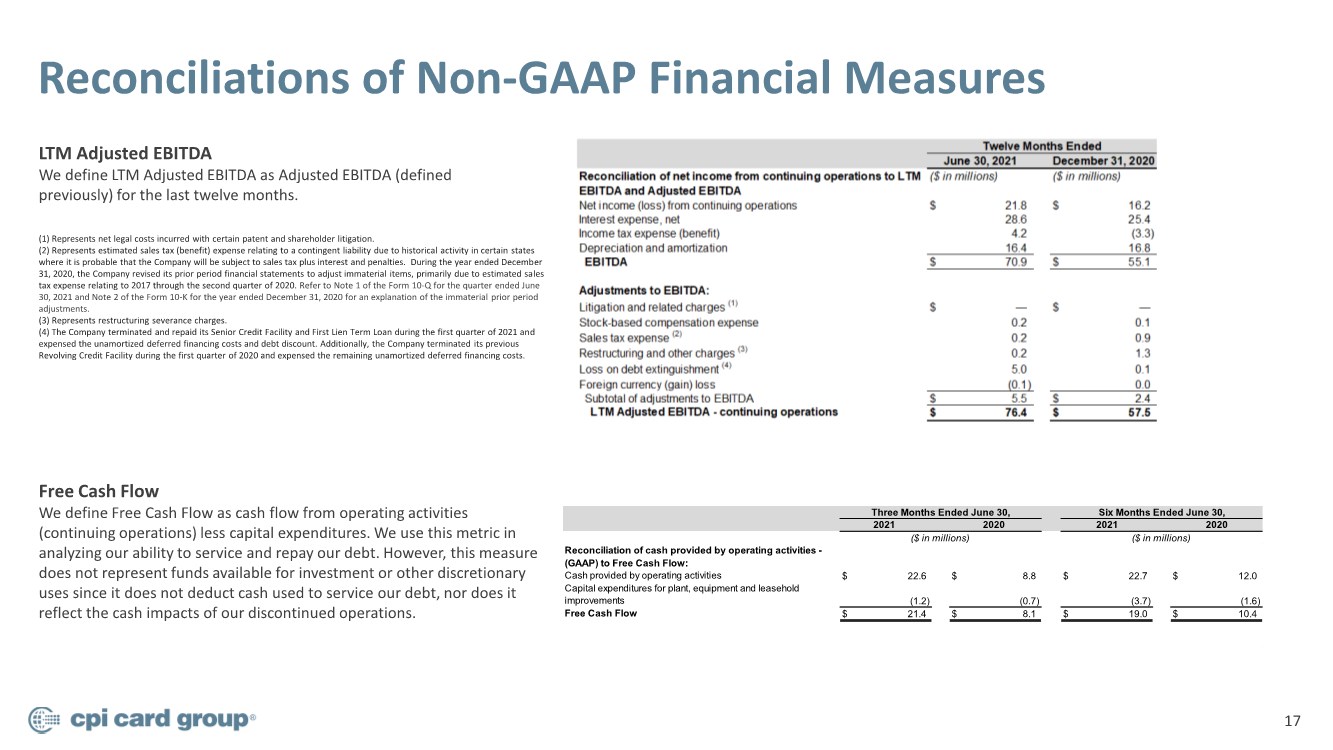
| 17 Reconciliations of Non-GAAP Financial Measures LTM Adjusted EBITDA We define LTM Adjusted EBITDA as Adjusted EBITDA (defined previously) for the last twelve months. (1) Represents net legal costs incurred with certain patent and shareholder litigation. (2) Represents estimated sales tax (benefit) expense relating to a contingent liability due to historical activity in certain states where it is probable that the Company will be subject to sales tax plus interest and penalties. During the year ended December 31, 2020, the Company revised its prior period financial statements to adjust immaterial items, primarily due to estimated sales tax expense relating to 2017 through the second quarter of 2020. Refer to Note 1 of the Form 10-Q for the quarter ended June 30, 2021 and Note 2 of the Form 10-K for the year ended December 31, 2020 for an explanation of the immaterial prior period adjustments. (3) Represents restructuring severance charges. (4) The Company terminated and repaid its Senior Credit Facility and First Lien Term Loan during the first quarter of 2021 and expensed the unamortized deferred financing costs and debt discount. Additionally, the Company terminated its previous Revolving Credit Facility during the first quarter of 2020 and expensed the remaining unamortized deferred financing costs. Free Cash Flow We define Free Cash Flow as cash flow from operating activities (continuing operations) less capital expenditures. We use this metric in analyzing our ability to service and repay our debt. However, this measure does not represent funds available for investment or other discretionary uses since it does not deduct cash used to service our debt, nor does it reflect the cash impacts of our discontinued operations. Reconciliation of cash provided by operating activities - (GAAP) to Free Cash Flow: Cash provided by operating activities $ 22.6 $ 8.8 $ 22.7 $ 12.0 Capital expenditures for plant, equipment and leasehold improvements (1.2) (0.7) (3.7) (1.6) Free Cash Flow $ 21.4 $ 8.1 $ 19.0 $ 10.4 Three Months Ended June 30, 2021 2020 ($ in millions) Six Months Ended June 30, 2021 2020 ($ in millions) |
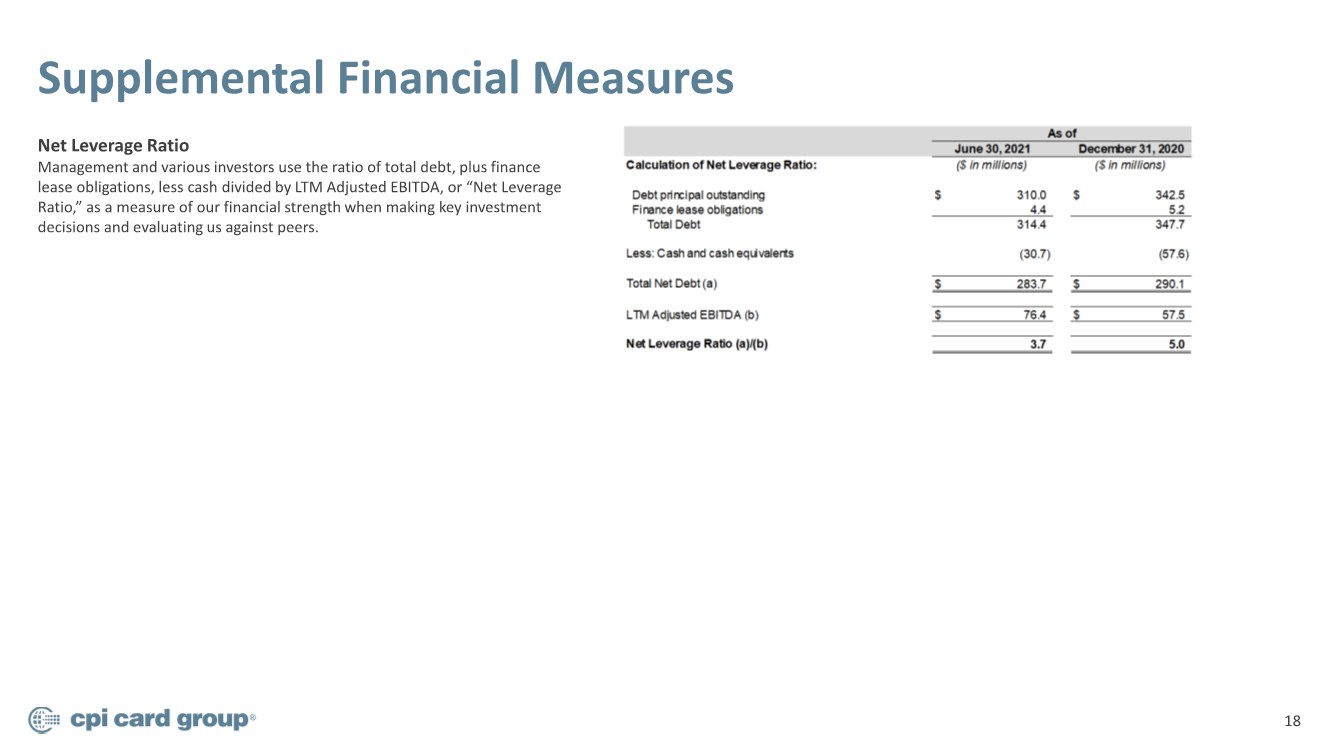
| 18 Supplemental Financial Measures Net Leverage Ratio Management and various investors use the ratio of total debt, plus finance lease obligations, less cash divided by LTM Adjusted EBITDA, or “Net Leverage Ratio,” as a measure of our financial strength when making key investment decisions and evaluating us against peers. |