Attached files
| file | filename |
|---|---|
| EX-99.1 - EX-99.1 - Prestige Consumer Healthcare Inc. | exhibit991fy22-q1earningsr.htm |
| 8-K - 8-K - Prestige Consumer Healthcare Inc. | pbh-20210805.htm |
First Quarter FY 2022 Results August 5th, 2021 Exhibit 99.2
F I R S T Q U A R T E R F Y 2 2 R E S U L T S This presentation contains certain “forward-looking” statements within the meaning of the Private Securities Litigation Reform Act of 1995, such as statements regarding the Company’s expected financial performance, including revenues, adjusted EPS, free cash flow, and organic revenue growth, and the related impact of the TheraTears acquistion; the Company’s ability to perform well in the currently evolving environment and execute on its brand-building strategy; the expected market share and consumption trends for the Company’s brands, and the recovery of COVID-impacted categories; the Company’s ability to easily integrate and create value from its acquisition of TheraTears; and the Company’s ability to execute on its disciplined capital allocation strategy. Words such as “trend,” “continue,” “will,” “expect,” “project,” “may,” “should,” “could,” “would,” and similar expressions identify forward-looking statements. Such forward-looking statements represent the Company’s expectations and beliefs and involve a number of known and unknown risks, uncertainties and other factors that may cause actual results to differ materially from those expressed or implied by such forward-looking statements. These factors include, among others, the impact of the COVID-19 pandemic, including on economic and business conditions, government actions, consumer trends, retail management initiatives, and disruptions to the distribution and supply chain; competitive pressures; the impact of the Company’s advertising and marketing and new product development initiatives; customer inventory management initiatives; fluctuating foreign exchange rates; difficulty integrating TheraTears and other risks set forth in Part I, Item 1A. Risk Factors in the Company’s Annual Report on Form 10-K for the year ended March 31, 2021. You are cautioned not to place undue reliance on these forward-looking statements, which speak only as of the date this presentation. Except to the extent required by applicable law, the Company undertakes no obligation to update any forward-looking statement contained in this presentation, whether as a result of new information, future events, or otherwise. All adjusted GAAP numbers presented are footnoted and reconciled to their closest GAAP measurement in the attached reconciliation schedule or in our August 5, 2021 earnings release in the “About Non-GAAP Financial Measures” section. Safe Harbor Disclosure 2
F I R S T Q U A R T E R F Y 2 2 R E S U L T S Agenda for Today’s Discussion I. Performance Update II. Financial Overview III. FY 22 Outlook 3
F I R S T Q U A R T E R F Y 2 2 R E S U L T S I. Performance Update
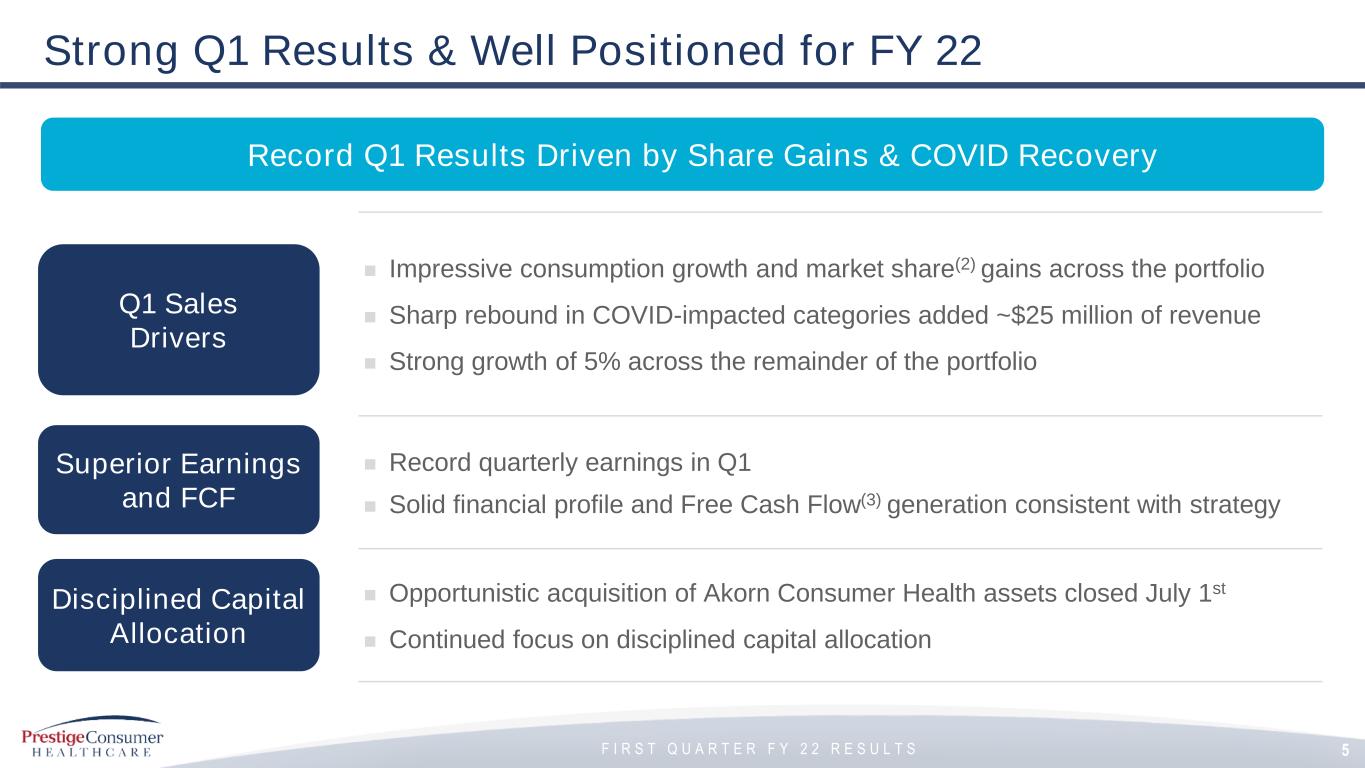
F I R S T Q U A R T E R F Y 2 2 R E S U L T S Strong Q1 Results & Well Positioned for FY 22 ◼ Impressive consumption growth and market share(2) gains across the portfolio ◼ Sharp rebound in COVID-impacted categories added ~$25 million of revenue ◼ Strong growth of 5% across the remainder of the portfolio ◼ Record quarterly earnings in Q1 ◼ Solid financial profile and Free Cash Flow(3) generation consistent with strategy ◼ Opportunistic acquisition of Akorn Consumer Health assets closed July 1st ◼ Continued focus on disciplined capital allocation Q1 Sales Drivers Disciplined Capital Allocation Superior Earnings and FCF 5 Record Q1 Results Driven by Share Gains & COVID Recovery
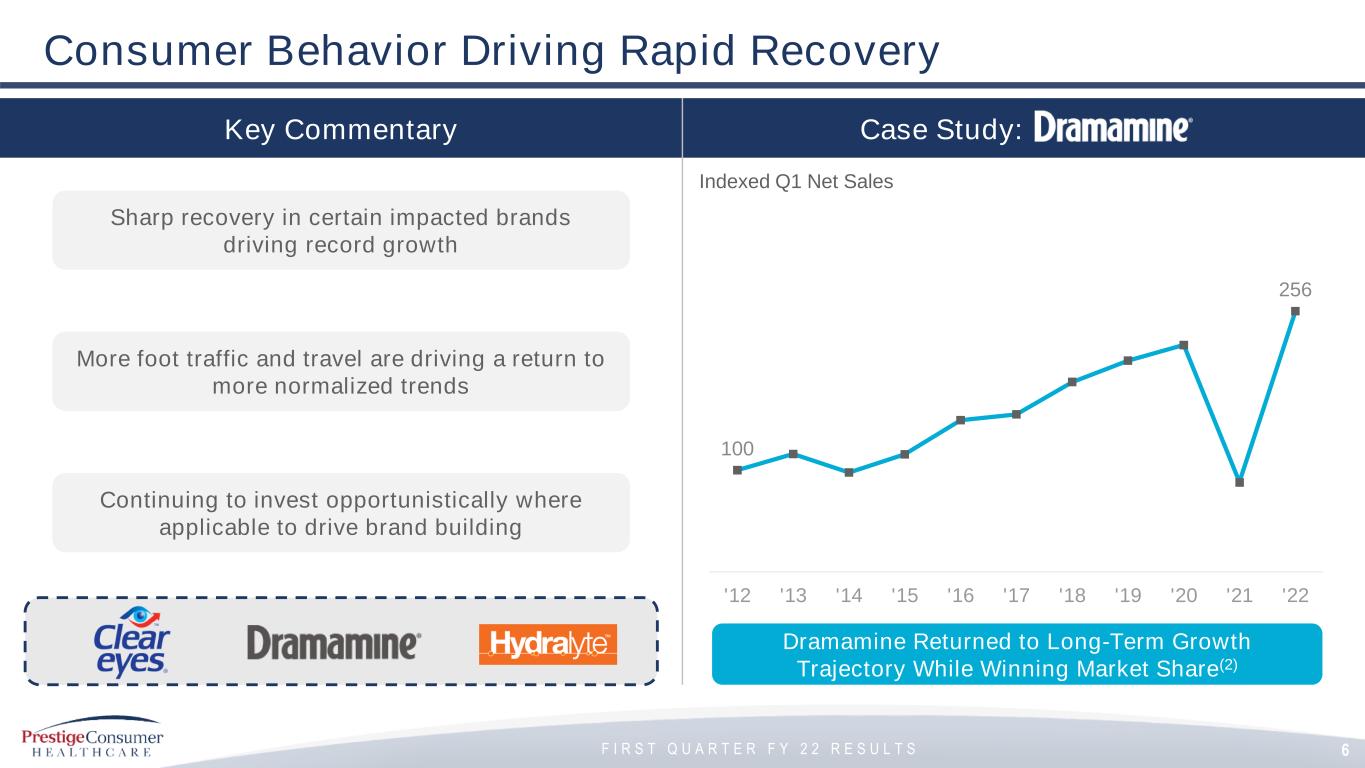
F I R S T Q U A R T E R F Y 2 2 R E S U L T S Consumer Behavior Driving Rapid Recovery 6 100 256 '12 '13 '14 '15 '16 '17 '18 '19 '20 '21 '22 Dramamine Returned to Long-Term Growth Trajectory While Winning Market Share(2) Case Study: DramamineKey Commentary Sharp recovery in certain impacted brands driving record growth More foot traffic and travel are driving a return to more normalized trends Continuing to invest opportunistically where applicable to drive brand building Indexed Q1 Net Sales
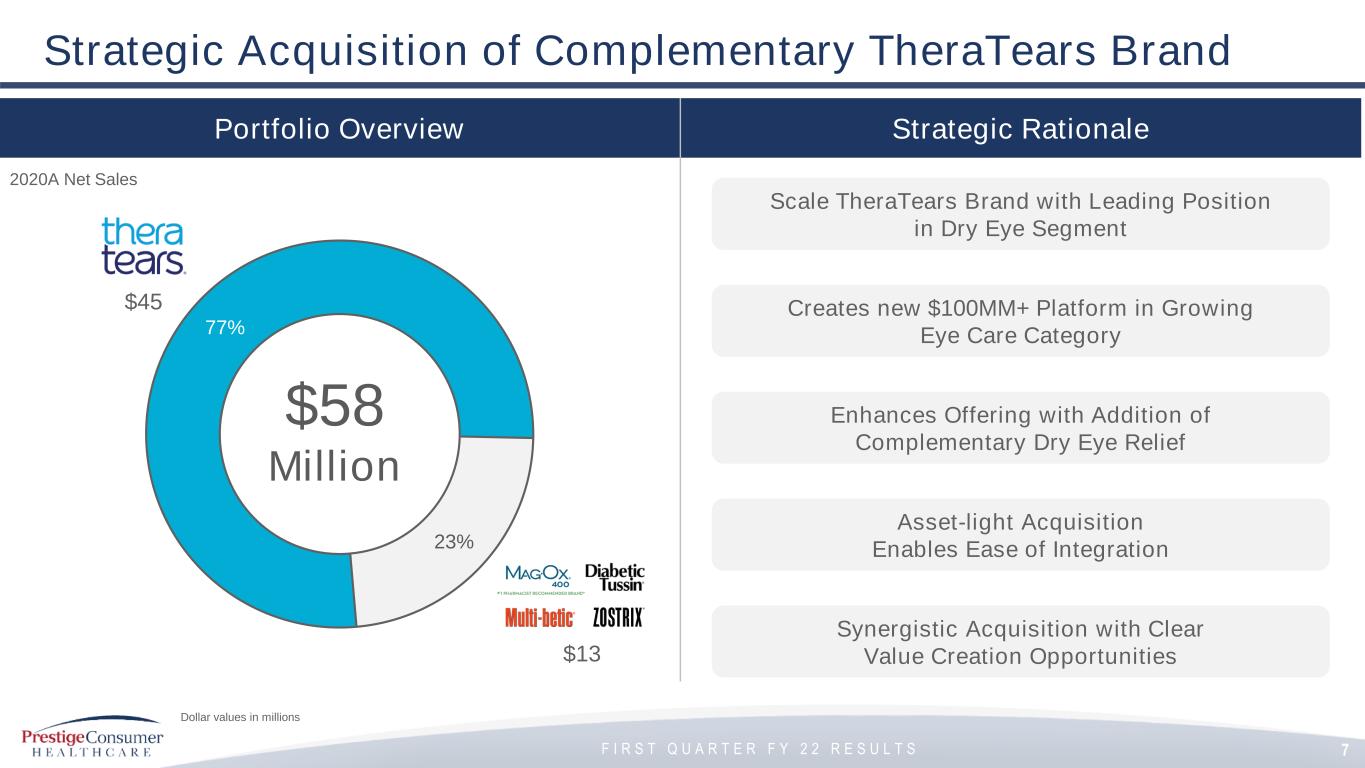
F I R S T Q U A R T E R F Y 2 2 R E S U L T S Portfolio Overview Strategic Acquisition of Complementary TheraTears Brand Strategic Rationale 7 77% 23% 2020A Net Sales $13 $58 Million $45 Scale TheraTears Brand with Leading Position in Dry Eye Segment Creates new $100MM+ Platform in Growing Eye Care Category Enhances Offering with Addition of Complementary Dry Eye Relief Synergistic Acquisition with Clear Value Creation Opportunities Dollar values in millions Asset-light Acquisition Enables Ease of Integration
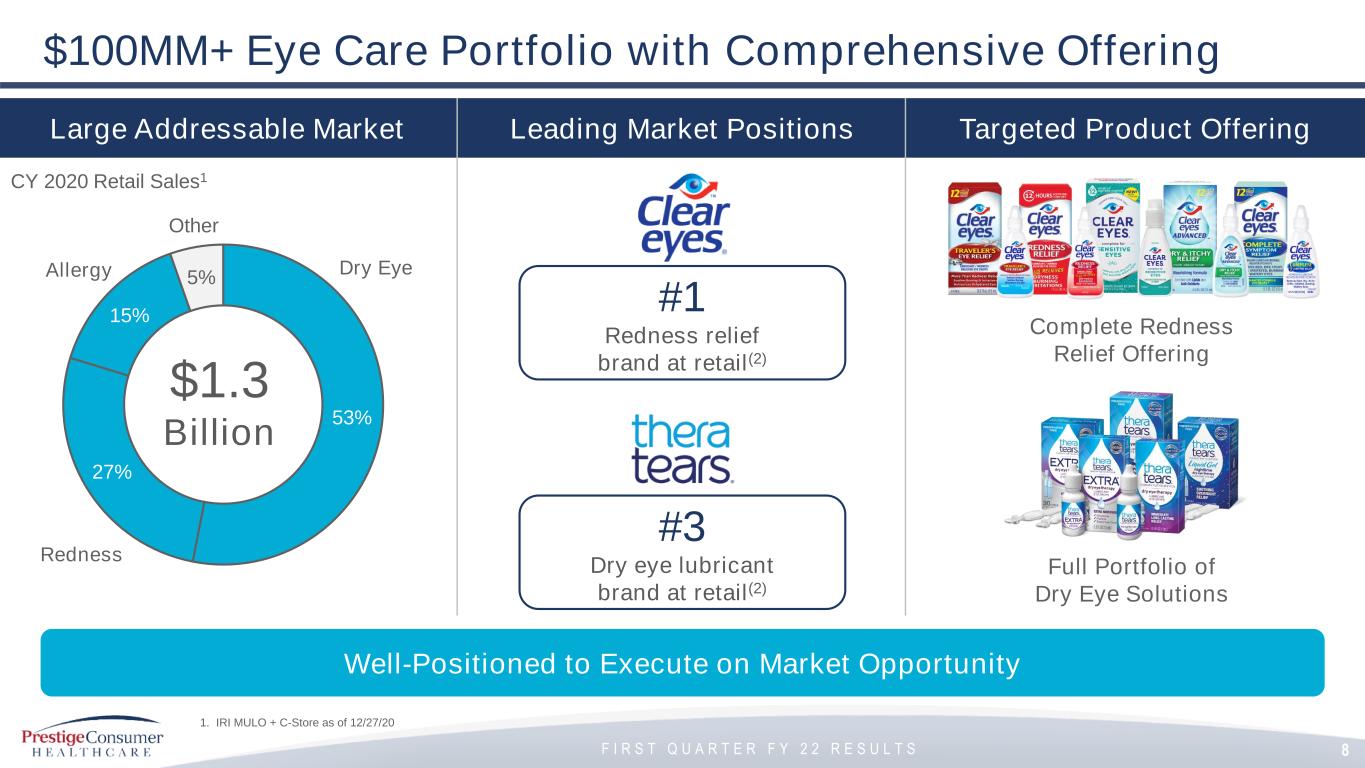
F I R S T Q U A R T E R F Y 2 2 R E S U L T S Large Addressable Market $100MM+ Eye Care Portfolio with Comprehensive Offering Leading Market Positions Targeted Product Offering Well-Positioned to Execute on Market Opportunity 8 53% 27% 15% 5% $1.3 Billion CY 2020 Retail Sales1 Dry Eye Redness Other #3 Dry eye lubricant brand at retail(2) #1 Redness relief brand at retail(2) Complete Redness Relief Offering Full Portfolio of Dry Eye Solutions Allergy 1. IRI MULO + C-Store as of 12/27/20
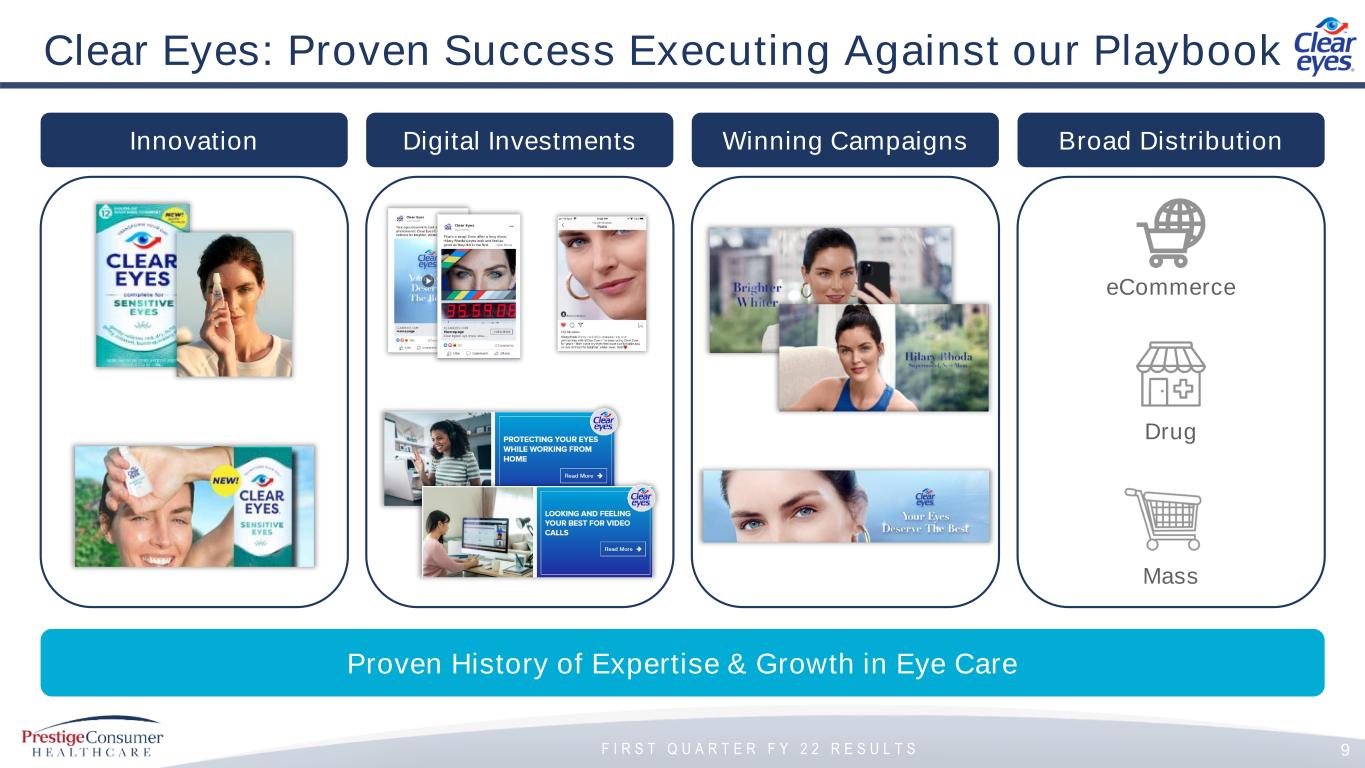
F I R S T Q U A R T E R F Y 2 2 R E S U L T S 9 Clear Eyes: Proven Success Executing Against our Playbook Innovation Digital Investments Broad Distribution Proven History of Expertise & Growth in Eye Care Winning Campaigns eCommerce Drug Mass

F I R S T Q U A R T E R F Y 2 2 R E S U L T S II. Financial Overview
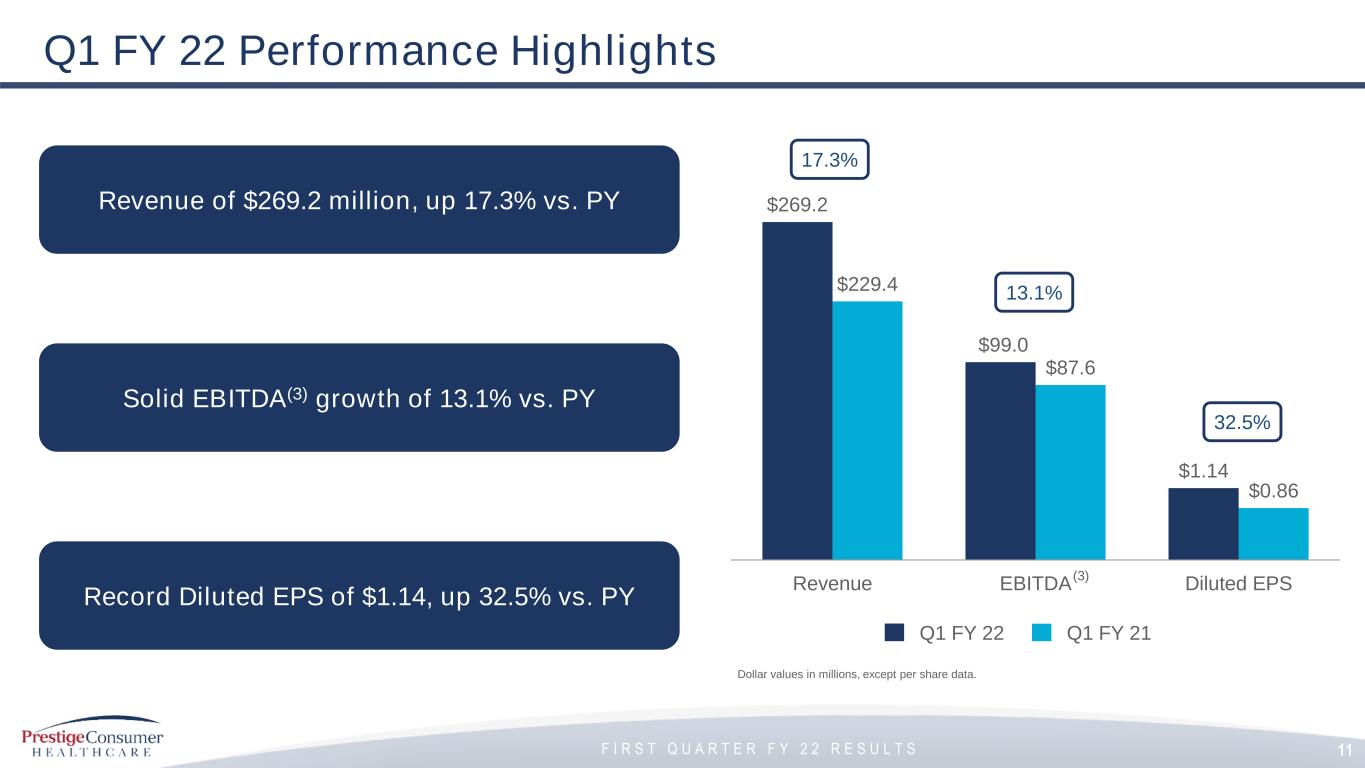
F I R S T Q U A R T E R F Y 2 2 R E S U L T S Q1 FY 22 Performance Highlights Q1 FY 22 Q1 FY 21 Dollar values in millions, except per share data. $269.2 $99.0 $1.14 $229.4 $87.6 $0.86 Revenue EBITDA Diluted EPS 17.3% 13.1% 32.5% Revenue of $269.2 million, up 17.3% vs. PY Record Diluted EPS of $1.14, up 32.5% vs. PY Solid EBITDA(3) growth of 13.1% vs. PY 11 (3)
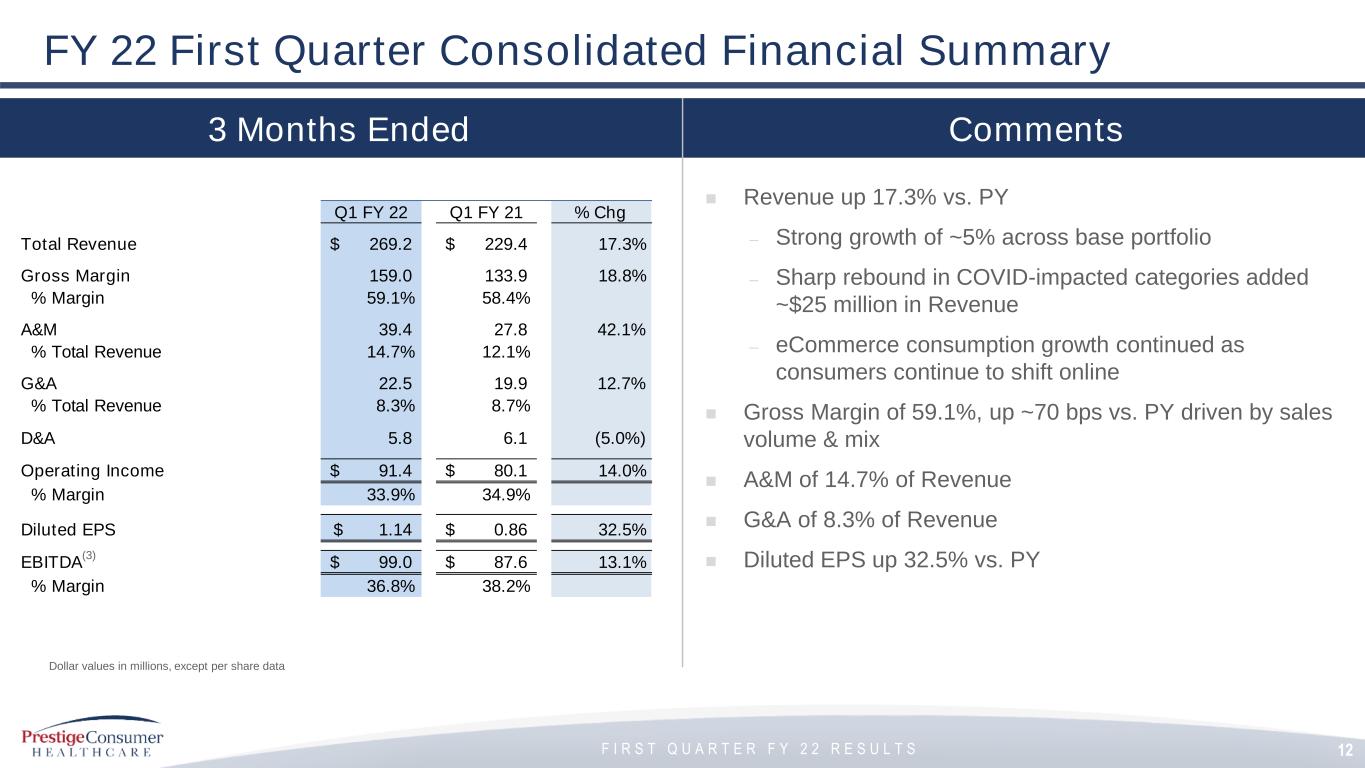
F I R S T Q U A R T E R F Y 2 2 R E S U L T S Q1 FY 22 Q1 FY 21 % Chg Total Revenue 269.2$ 229.4$ 17.3% Gross Margin 159.0 133.9 18.8% % Margin 59.1% 58.4% A&M 39.4 27.8 42.1% % Total Revenue 14.7% 12.1% G&A 22.5 19.9 12.7% % Total Revenue 8.3% 8.7% D&A 5.8 6.1 (5.0%) Operating Income 91.4$ 80.1$ 14.0% % Margin 33.9% 34.9% Diluted EPS 1.14$ 0.86$ 32.5% EBITDA 99.0$ 87.6$ 13.1% % Margin 36.8% 38.2% 3 Months Ended Comments ◼ Revenue up 17.3% vs. PY – Strong growth of ~5% across base portfolio – Sharp rebound in COVID-impacted categories added ~$25 million in Revenue – eCommerce consumption growth continued as consumers continue to shift online ◼ Gross Margin of 59.1%, up ~70 bps vs. PY driven by sales volume & mix ◼ A&M of 14.7% of Revenue ◼ G&A of 8.3% of Revenue ◼ Diluted EPS up 32.5% vs. PY FY 22 First Quarter Consolidated Financial Summary Dollar values in millions, except per share data 12 (3)
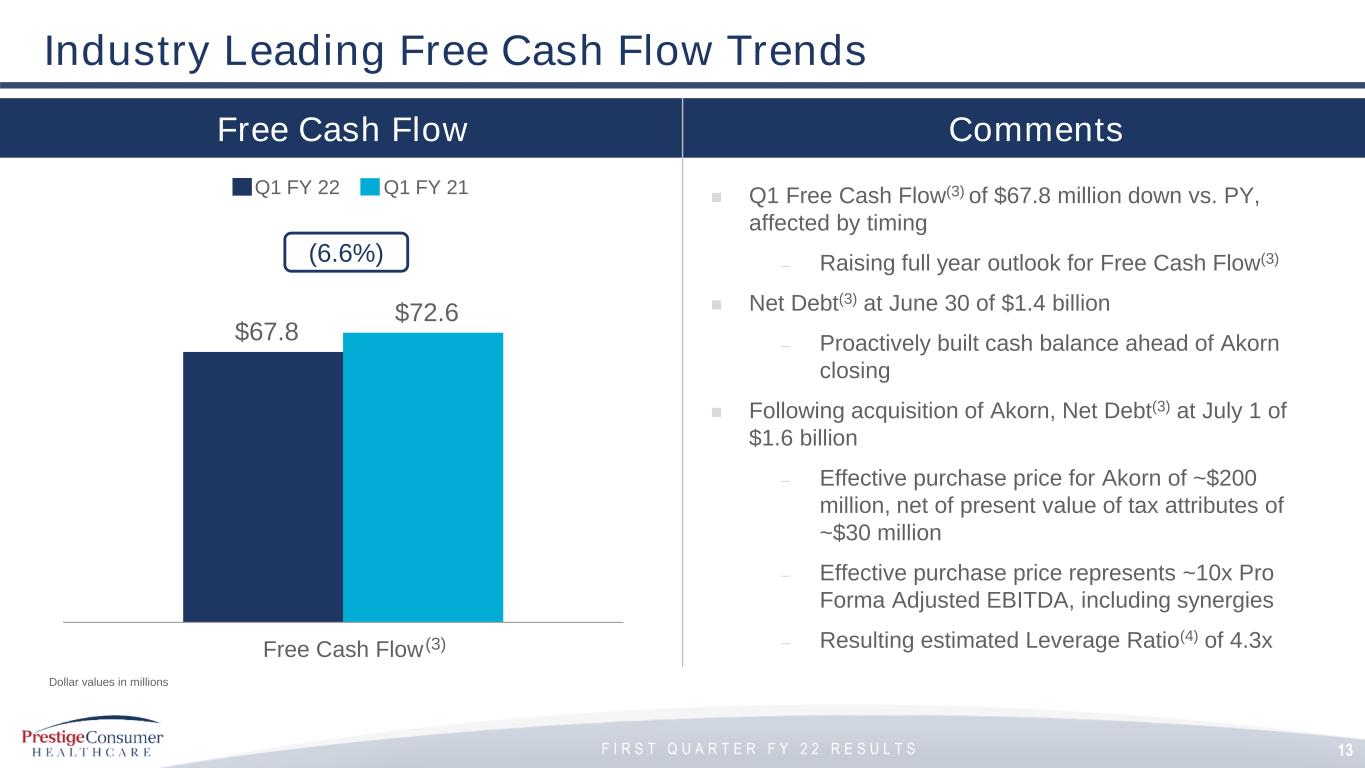
F I R S T Q U A R T E R F Y 2 2 R E S U L T S $67.8 $72.6 Free Cash Flow Free Cash Flow Comments ◼ Q1 Free Cash Flow(3) of $67.8 million down vs. PY, affected by timing – Raising full year outlook for Free Cash Flow(3) ◼ Net Debt(3) at June 30 of $1.4 billion – Proactively built cash balance ahead of Akorn closing ◼ Following acquisition of Akorn, Net Debt(3) at July 1 of $1.6 billion – Effective purchase price for Akorn of ~$200 million, net of present value of tax attributes of ~$30 million – Effective purchase price represents ~10x Pro Forma Adjusted EBITDA, including synergies – Resulting estimated Leverage Ratio(4) of 4.3x Industry Leading Free Cash Flow Trends Q1 FY 22 Q1 FY 21 (6.6%) (3) Dollar values in millions 13
F I R S T Q U A R T E R F Y 2 2 R E S U L T S III. FY 22 Outlook
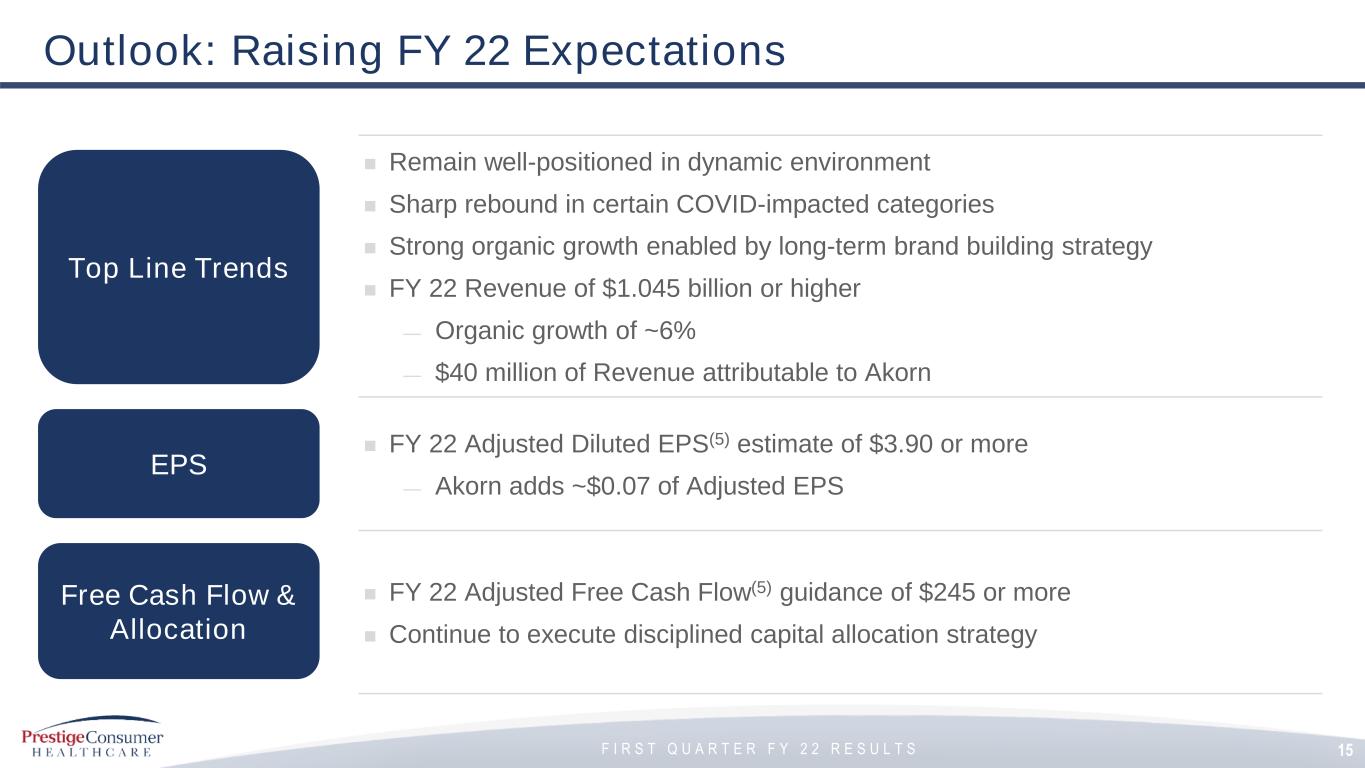
F I R S T Q U A R T E R F Y 2 2 R E S U L T S Outlook: Raising FY 22 Expectations ◼ Remain well-positioned in dynamic environment ◼ Sharp rebound in certain COVID-impacted categories ◼ Strong organic growth enabled by long-term brand building strategy ◼ FY 22 Revenue of $1.045 billion or higher — Organic growth of ~6% — $40 million of Revenue attributable to Akorn ◼ FY 22 Adjusted Diluted EPS(5) estimate of $3.90 or more — Akorn adds ~$0.07 of Adjusted EPS ◼ FY 22 Adjusted Free Cash Flow(5) guidance of $245 or more ◼ Continue to execute disciplined capital allocation strategy Top Line Trends Free Cash Flow & Allocation EPS 15

F I R S T Q U A R T E R F Y 2 2 R E S U L T S Q&A
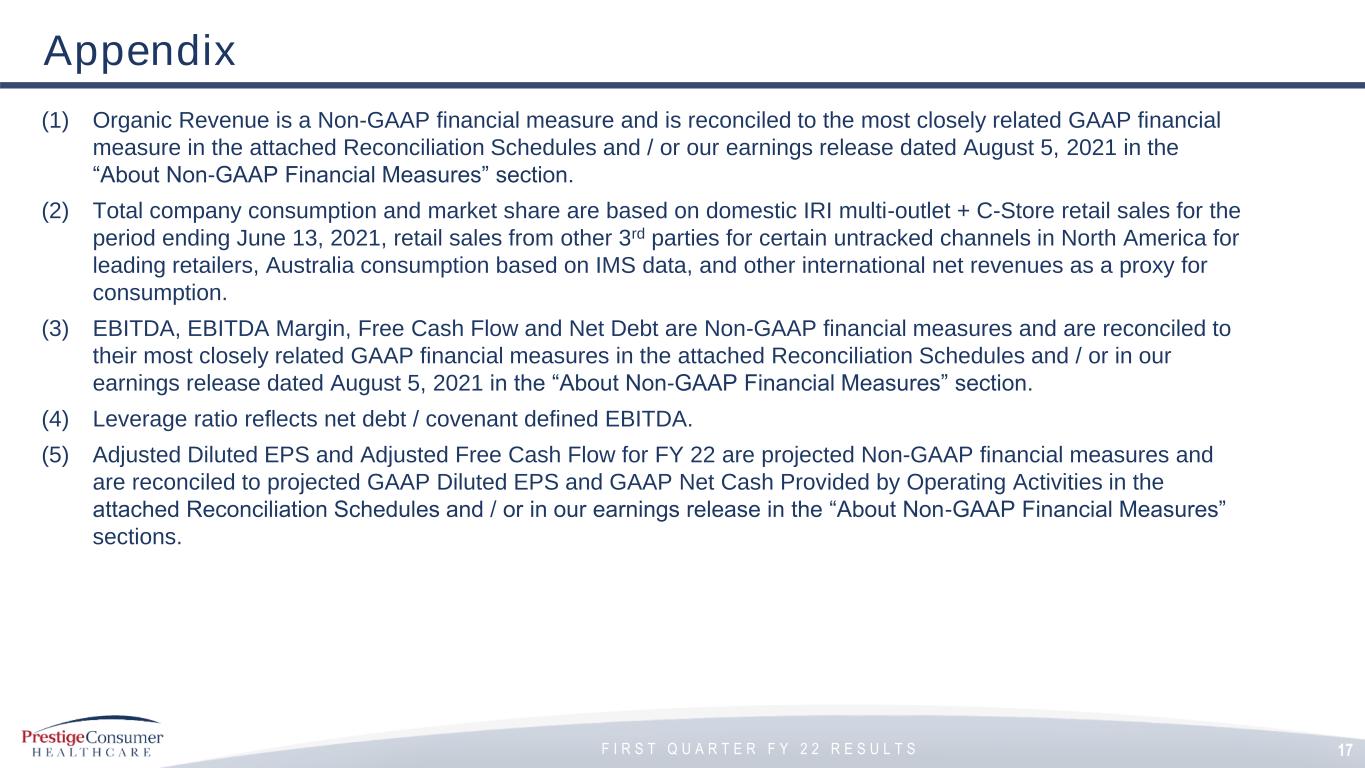
F I R S T Q U A R T E R F Y 2 2 R E S U L T S Appendix (1) Organic Revenue is a Non-GAAP financial measure and is reconciled to the most closely related GAAP financial measure in the attached Reconciliation Schedules and / or our earnings release dated August 5, 2021 in the “About Non-GAAP Financial Measures” section. (2) Total company consumption and market share are based on domestic IRI multi-outlet + C-Store retail sales for the period ending June 13, 2021, retail sales from other 3rd parties for certain untracked channels in North America for leading retailers, Australia consumption based on IMS data, and other international net revenues as a proxy for consumption. (3) EBITDA, EBITDA Margin, Free Cash Flow and Net Debt are Non-GAAP financial measures and are reconciled to their most closely related GAAP financial measures in the attached Reconciliation Schedules and / or in our earnings release dated August 5, 2021 in the “About Non-GAAP Financial Measures” section. (4) Leverage ratio reflects net debt / covenant defined EBITDA. (5) Adjusted Diluted EPS and Adjusted Free Cash Flow for FY 22 are projected Non-GAAP financial measures and are reconciled to projected GAAP Diluted EPS and GAAP Net Cash Provided by Operating Activities in the attached Reconciliation Schedules and / or in our earnings release in the “About Non-GAAP Financial Measures” sections. 17
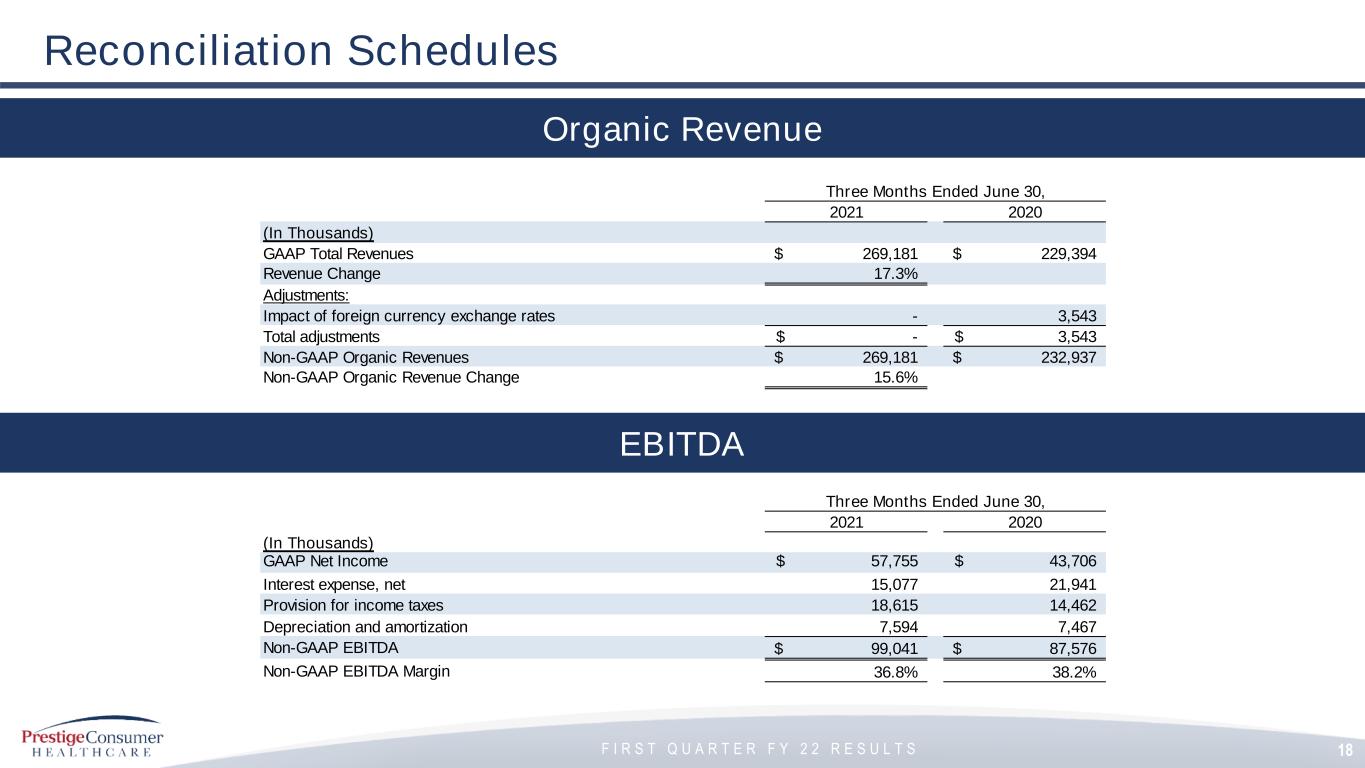
F I R S T Q U A R T E R F Y 2 2 R E S U L T S 18 Reconciliation Schedules Organic Revenue Three Months Ended June 30, Year Ended March 31, 2021 2020 (In Thousands) GAAP Total Revenues 269,181$ 229,394$ Revenue Change 17.3% Adjustments: Impact of foreign currency exchange rates - 3,543 Total adjustments -$ 3,543$ Non-GAAP Organic Revenues 269,181$ 232,937$ Non-GAAP Organic Revenue Change 15.6% EBITDA Three Months Ended June 30, Year Ended March 31, 2021 2020 (In Thousands) GAAP Net Income 57,755$ 43,706$ Interest expense, net 15,077 21,941 Provision for income taxes 18,615 14,462 Depreciation and amortization 7,594 7,467 Non-GAAP EBITDA 99,041$ 87,576$ Non-GAAP EBITDA Margin 36.8% 38.2%
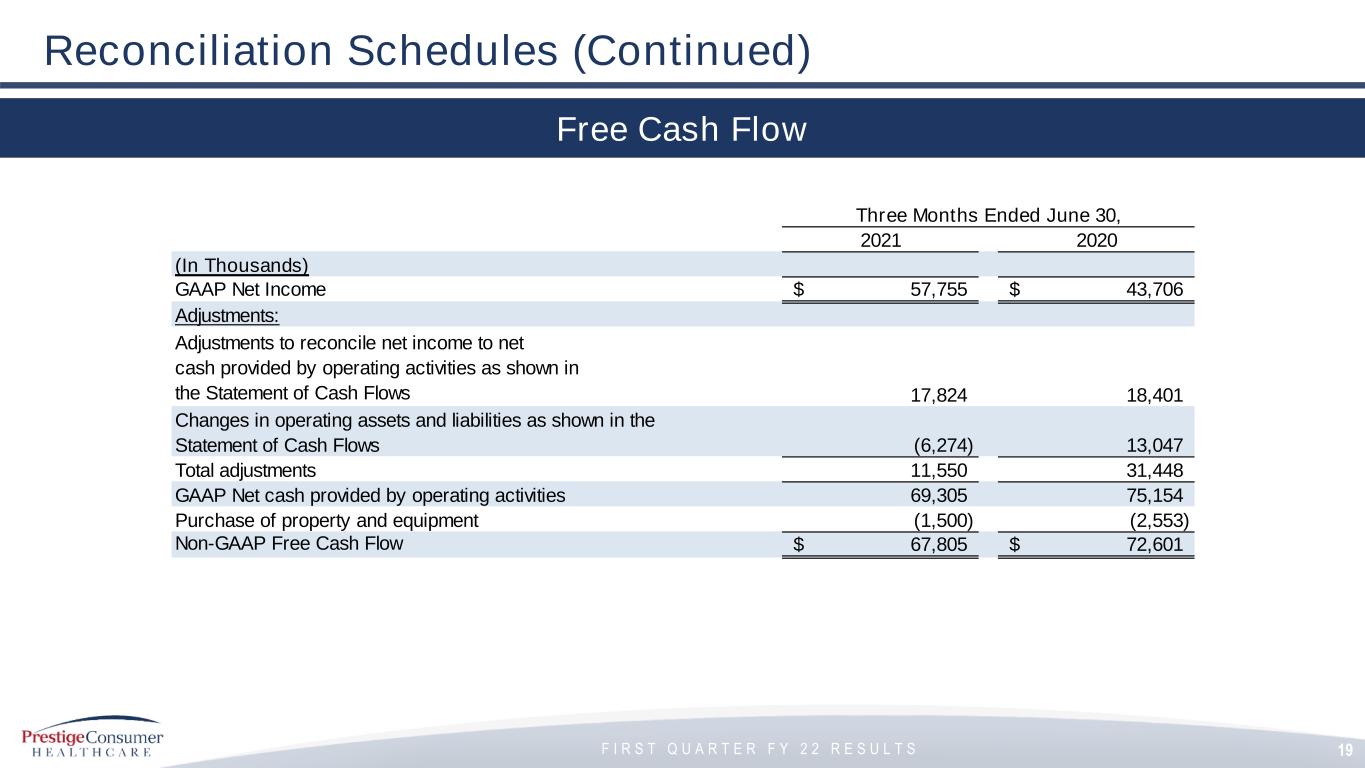
F I R S T Q U A R T E R F Y 2 2 R E S U L T S Three Months Ended June 30, Year Ended March 31, 2021 2020 (In Thousands) GAAP Net Income 57,755$ 43,706$ Adjustments: Adjustments to reconcile net income to net cash provided by operating activities as shown in the Statement of Cash Flows 17,824 18,401 Changes in operating assets and liabilities as shown in the Statement of Cash Flows (6,274) 13,047 Total adjustments 11,550 31,448 GAAP Net cash provided by operating activities 69,305 75,154 Purchase of property and equipment (1,500) (2,553) Non-GAAP Free Cash Flow 67,805$ 72,601$ 19 Reconciliation Schedules (Continued) Free Cash Flow
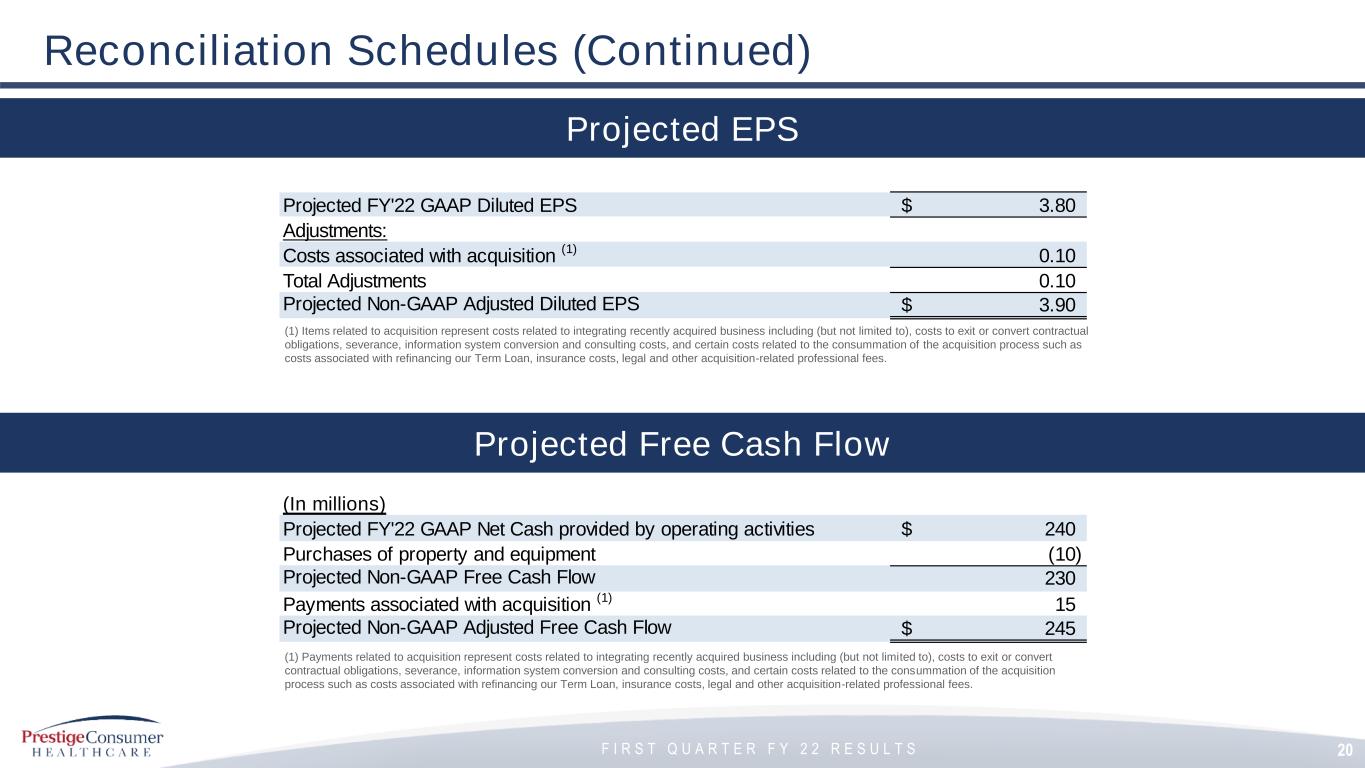
F I R S T Q U A R T E R F Y 2 2 R E S U L T S 20 Reconciliation Schedules (Continued) Projected EPS Projected Free Cash Flow (In millions) Projected FY'22 GAAP Net Cash provided by operating activities 240$ Purchases of property and equipment (10) Projected Non-GAAP Free Cash Flow 230 Payments associated with acquisition (1) 15 Projected Non-GAAP Adjusted Free Cash Flow 245$ (1) Payments related to acquisition represent costs related to integrating recently acquired business including (but not limited to), costs to exit or convert contractual obligations, severance, information system conversion and consulting costs, and certain costs related to the consummation of the acquisition process such as costs associated with refinancing our Term Loan, insurance costs, legal and other acquisition-related professional fees. (1) Items related to acquisition represent costs related to integrating recently acquired business including (but not limited to), costs to exit or convert contractual obligations, severance, information system conversion and consulting costs, and certain costs related to the consummation of the acquisition process such as costs associated with refinancing our Term Loan, insurance costs, legal and other acquisition-related professional fees. Projected FY'22 GAAP Diluted EPS 3.80$ Adjustments: Costs associated with acquisition (1) 0.10 Total Adjustments 0.10 Projected Non-GAAP Adjusted Diluted EPS 3.90$
