Attached files
| file | filename |
|---|---|
| EX-32.2 - EXHIBIT 32.2 - Prestige Consumer Healthcare Inc. | exhibit322certificationofc.htm |
| EX-32.1 - EXHIBIT 32.1 - Prestige Consumer Healthcare Inc. | exhibit321certificationofe.htm |
| EX-31.2 - EXHIBIT 31.2 - Prestige Consumer Healthcare Inc. | exhibit312certification_sa.htm |
| EX-31.1 - EXHIBIT 31.1 - Prestige Consumer Healthcare Inc. | exhibit311certification_lo.htm |
| EX-23.1 - EXHIBIT 23.1 - Prestige Consumer Healthcare Inc. | exhibit231pbhconsentfy18.htm |
| EX-21.1 - EXHIBIT 21.1 - Prestige Consumer Healthcare Inc. | exhibit211directindirectsu.htm |
UNITED STATES
SECURITIES AND EXCHANGE COMMISSION
Washington, D.C. 20549
FORM 10-K
(Mark One)
x | ANNUAL REPORT PURSUANT TO SECTION 13 OR 15(d) OF THE SECURITIES EXCHANGE ACT OF 1934 FOR THE FISCAL YEAR ENDED MARCH 31, 2018 | |
OR
o | TRANSITION REPORT PURSUANT TO SECTION 13 OR 15(d) OF THE SECURITIES EXCHANGE ACT OF 1934 FOR THE TRANSITION PERIOD FROM ______ TO ______ | |
Commission File Number: 001-32433
PRESTIGE BRANDS HOLDINGS, INC.
(Exact name of Registrant as specified in its charter)
Delaware (State or other jurisdiction of incorporation or organization) |  | 20-1297589 (I.R.S. Employer Identification No.) |
660 White Plains Road Tarrytown, New York 10591 (Address of principal executive offices) (Zip Code) | ||
Securities registered pursuant to Section 12(b) of the Act: | (914) 524-6800 (Registrant's telephone number, including area code) | |
Title of each class: | Name of each exchange on which registered: | |
Common Stock, par value $0.01 per share | New York Stock Exchange | |
Securities registered pursuant to Section 12(g) of the Act: None
Indicate by check mark if the Registrant is a well-known seasoned issuer, as defined in Rule 405 of the Securities Act. Yes x No o
Indicate by check mark if the Registrant is not required to file reports pursuant to Section 13 or Section 15(d) of the Act. Yes o No x
Indicate by check mark whether the Registrant (1) has filed all reports required to be filed by Section 13 or 15(d) of the Securities Exchange Act of 1934 during the preceding 12 months (or for such shorter period that the Registrant was required to file such reports), and (2) has been subject to such filing requirements for the past 90 days. Yes x No o
Indicate by check mark whether the registrant has submitted electronically and posted on its corporate Web site, if any, every Interactive Data File required to be submitted and posted pursuant to Rule 405 of Regulation S-T (§ 232.405 of this chapter) during the preceding 12 months (or for such shorter period that the registrant was required to submit and post such files). Yes x No o
Indicate by check mark if disclosure of delinquent filers pursuant to Item 405 of Regulation S-K (§ 229.405 of this chapter) is not contained herein, and will not be contained, to the best of Registrant’s knowledge, in definitive proxy or information statements incorporated by reference in Part III of this Form 10-K or any amendment to this Form 10-K. x
Indicate by check mark whether the Registrant is a large accelerated filer, an accelerated filer, a non-accelerated filer, smaller reporting company, or an emerging growth company. See the definitions of “large accelerated filer,” “accelerated filer,” “smaller reporting company,” and “emerging growth company” in Rule 12b-2 of the Exchange Act.
Large accelerated filer | x | Accelerated filer | o | |||
Non-accelerated filer | o | (Do not check if a smaller reporting company) | Smaller reporting company | o | ||
Emerging growth company | o | |||||
If an emerging growth company, indicate by check mark if the registrant has elected not to use the extended transition period for complying with any new or revised financial accounting standards provided pursuant to Section 13(a) of the Exchange Act. o
Indicate by check mark whether the Registrant is a shell company (as defined in Rule 12b-2 of the Act). Yes o No x
The aggregate market value of voting and non-voting common equity held by non-affiliates computed by reference to the price at which the common equity was last sold as of the last business day of the Registrant’s most recently completed second fiscal quarter ended September 30, 2017 was $2,651.0 million.
As of May 4, 2018, the Registrant had 53,073,534 shares of common stock outstanding.
DOCUMENTS INCORPORATED BY REFERENCE
Portions of the Registrant’s Definitive Proxy Statement for the 2018 Annual Meeting of Stockholders (the “2018 Proxy Statement”) are incorporated by reference into Part III of this Annual Report on Form 10-K to the extent described herein.
TABLE OF CONTENTS
Page | ||
Part I | ||
Item 1. | Business | |
Item 1A. | Risk Factors | |
Item 1B. | Unresolved Staff Comments | |
Item 2. | Properties | |
Item 3. | Legal Proceedings | |
Item 4. | Mine Safety Disclosures | |
Part II | ||
Item 5. | Market for Registrant's Common Equity, Related Stockholder Matters and Issuer Purchases of Equity Securities | |
Item 6. | Selected Financial Data | |
Item 7. | Management's Discussion and Analysis of Financial Condition and Results of Operations | |
Item 7A. | Quantitative and Qualitative Disclosures About Market Risk | |
Item 8. | Financial Statements and Supplementary Data | |
Item 9. | Changes in and Disagreements with Accountants on Accounting and Financial Disclosure | |
Item 9A. | Controls and Procedures | |
Item 9B. | Other Information | |
Part III | ||
Item 10. | Directors, Executive Officers and Corporate Governance | |
Item 11. | Executive Compensation | |
Item 12. | Security Ownership of Certain Beneficial Owners and Management and Related Stockholder Matters | |
Item 13. | Certain Relationships and Related Transactions, and Director Independence | |
Item 14. | Principal Accounting Fees and Services | |
Part IV | ||
Item 15. | Exhibits, Financial Statement Schedules | |
Item 16. | Form 10-K Summary | |
TRADEMARKS AND TRADENAMES | ||
Trademarks and tradenames used in this Annual Report on Form 10-K are the property of Prestige Brands Holdings, Inc. or its subsidiaries, as the case may be. We have italicized our trademarks or tradenames when they appear in this Annual Report on Form 10-K. | ||
Part I.
CAUTIONARY STATEMENT REGARDING FORWARD-LOOKING STATEMENTS
This Annual Report on Form 10-K contains “forward-looking statements” within the meaning of the Private Securities Litigation Reform Act of 1995 (the “PSLRA”), including, without limitation, information within Management’s Discussion and Analysis of Financial Condition and Results of Operations. The following cautionary statements are being made pursuant to the provisions of the PSLRA and with the intention of obtaining the benefits of the “safe harbor” provisions of the PSLRA.
Forward-looking statements speak only as of the date of this Annual Report on Form 10-K. Except as required under federal securities laws and the rules and regulations of the SEC, we do not intend to update any forward-looking statements to reflect events or circumstances arising after the date of this Annual Report on Form 10-K, whether as a result of new information, future events or otherwise. As a result of the risks and uncertainties described below, readers are cautioned not to place undue reliance on forward-looking statements included in this Annual Report on Form 10-K or that may be made elsewhere from time to time by, or on behalf of, us. All forward-looking statements attributable to us are expressly qualified by these cautionary statements.
These forward-looking statements generally can be identified by the use of words or phrases such as "believe," "anticipate," "expect," "estimate," "plan," "project," "intend," "strategy," "goal," "objective," "future," "seek," "may," "might," "should," "would," "will," "will be," or other similar words and phrases. Forward-looking statements are based on current expectations and assumptions that are subject to a number of risks and uncertainties that could cause actual results to differ materially from those anticipated, including, without limitation:
• | The high level of competition in our industry and markets; |
• | Our inability to increase organic growth via new product introductions, line extensions, increased spending on advertising and promotional support, and other new sales and marketing strategies; |
• | Our dependence on a limited number of customers for a large portion of our sales; |
• | Our inability to successfully identify, negotiate, complete and integrate suitable acquisition candidates and to obtain necessary financing; |
• | Our inability to invest successfully in research and development to develop new products; |
• | Changes in inventory management practices by retailers; |
• | Our inability to grow our international sales; |
• | General economic conditions affecting sales of our products and their respective markets; |
• | Economic factors, such as increases in interest rates and currency exchange rate fluctuations; |
• | Business, regulatory and other conditions affecting retailers; |
• | Changing consumer trends, additional store brand or branded competition or other pricing pressures which may cause us to lower our prices; |
• | Our dependence on third-party manufacturers to produce many of the products we sell; |
• | Our dependence on a third party logistics provider to distribute our products to customers; |
• | Price increases for raw materials, labor, energy and transportation costs, and for other input costs; |
• | Disruptions in our distribution center or manufacturing facility; |
• | Acquisitions, dispositions or other strategic transactions diverting managerial resources, the incurrence of additional liabilities or problems associated with integration of those businesses and facilities; |
• | Actions of government agencies in connection with our products, advertising or regulatory matters governing our industry; |
• | Product liability claims, product recalls and related negative publicity; |
• | Our inability to protect our intellectual property rights; |
• | Our dependence on third parties for intellectual property relating to some of the products we sell; |
• | Our inability to protect our internal information technology systems; |
• | Our dependence on third party information technology service providers and their ability to protect against security threats and disruptions; |
• | Our assets being comprised virtually entirely of goodwill and intangibles and possible changes in their value based on adverse operating results; |
• | Our dependence on key personnel; |
• | Shortages of supply of sourced goods or interruptions in the distribution or manufacturing of our products; |
• | The costs associated with any claims in litigation or arbitration and any adverse judgments rendered in such litigation or arbitration; |
• | Our level of indebtedness and possible inability to service our debt; |
• | Our inability to obtain additional financing; |
• | The restrictions imposed by our financing agreements on our operations; and |
• | Changes in federal and state tax laws, including the recently enacted Tax Cuts and Jobs Act. |
1
For more information, see “Risk Factors” contained in Part I, Item 1A of this Annual Report on Form 10-K.
ITEM 1. BUSINESS
Overview
Unless otherwise indicated by the context, all references in this Annual Report on Form 10-K to “we,” “us,” “our,” the “Company” or “Prestige” refer to Prestige Brands Holdings, Inc. and our subsidiaries. Similarly, reference to a year (e.g., “2018”) refers to our fiscal year ended March 31 of that year.
We are engaged in the development, manufacturing, marketing, sales and distribution of well-recognized, brand name, over-the-counter (“OTC”) healthcare and household cleaning products to mass merchandisers and drug, food, dollar, convenience, and club stores in North America (the United States and Canada) and in Australia and certain other international markets. We use the strength of our brands, our established retail distribution network, a low-cost operating model and our experienced management team to our competitive advantage. Our ultimate success is dependent on several factors, including our ability to:
• | Develop and execute effective sales, advertising and marketing programs; |
• | Integrate acquired brands; |
• | Establish and maintain third party manufacturing and distribution to fulfill customer demands; |
• | Develop innovative new products; |
• | Respond to the technological advances and product introductions of our competitors; and |
• | Continue to grow our presence in the United States and international markets. |
We conduct our operations in three reportable segments: North American OTC Healthcare, International OTC Healthcare, and Household Cleaning. Our business, business model, competitive strengths and growth strategy face various risks that are described in "Risk Factors" in Part I, Item 1A of this Annual Report on Form 10-K.
2
Major Brands
Our major brands, set forth in the table below, have strong levels of consumer awareness and retail distribution across all major channels. These brands accounted for approximately 83.0%, 79.4%, and 75.1% of our revenues for 2018, 2017, and 2016, respectively, during the period the respective brands were owned by us.
Major Brands | Market Position | Market Segment(2) | ||
North American and International OTC Healthcare: | ||||
BC®/Goody's® (1) | #1 | Analgesic Powders | ||
Beano® (1) | #1 | Gas Prevention | ||
Boudreaux's Butt Paste (1) | #4 | Baby Ointments | ||
Chloraseptic® (1) | #1 | Sore Throat Liquids/Lozenges | ||
Clear Eyes® (1) | #1 | Eye Allergy/Redness Relief | ||
Compound W® (1) | #1 | Wart Removal | ||
Debrox® (1) | #1 | Ear Wax Removal | ||
DenTek® (1) | #2 | PEG Oral Care | ||
Dramamine® (1) | #1 | Motion Sickness Relief | ||
Efferdent® (1) | #2 | Denture Cleanser Tablets | ||
Fess® (4) | #1 | Nasal Saline Spray | ||
Fleet (1) | #1 | Adult Enemas/Suppositories | ||
Gaviscon® (3) | #1 | Upset Stomach Remedies | ||
Hydralyte® (4) | #1 | Oral Rehydration | ||
Luden's® (1) | #3 | Cough Drops | ||
Monistat® (1) | #1 | Vaginal Anti-Fungal | ||
Nix® (1) | #1 | Lice/Parasite Treatments | ||
Pedia-Lax (1) | #1 | Pediatric Laxatives | ||
Summer's Eve (1) | #1 | Feminine Hygiene | ||
Household Cleaning: | ||||
Comet® (1) | #1 | Abrasive Tub and Tile Cleaners | ||
(1) | We have prepared the information included in this Annual Report on Form 10-K with regard to the market position for our brands based in part on data generated by Information Resources, Inc., an independent market research firm (“IRI”), for the 52-week period ended March 25, 2018. IRI reports total U.S. Multi-Outlet retail sales data in the food, drug, mass merchandise markets (including Walmart), dollar stores (Dollar General, Family Dollar, Fred's), selected warehouse clubs (BJ's and Sam's) and DeCA military commissaries and convenience stores, representing approximately 90% of Prestige Brands' categories for retail sales. |
(2) | “Market segment” is defined by us and is either a standard IRI category or a segment within a standard IRI category and is based on our product offerings and the categories in which we compete. |
(3) | Gaviscon is distributed by us in Canada only, and the market information was generated by Nielsen, an independent third party market research firm for the 52 week period ending March 3, 2018. Figures represent national, all channel retail sales data in the food, drug, mass merchandise (including Walmart), general merchandise (including Dollarama), and warehouse club stores (including Costco). Data reported for warehouse club and general merchandise is calculated based on home scan panel data, and not direct point of sale data. |
(4) | The brands from our Care Pharmaceuticals Pty. Ltd. subsidiary ("Care Pharma") includes the Fess line of cold/allergy and saline nasal health products, which is the leading saline spray for both adults and children in Australia, and Hydralyte, which is the leading OTC brand in oral rehydration in Australia. Market information was generated by IRI Aztec, an independent market research firm, for the 52 week period ending March 18, 2018. |
3
Our products are sold through multiple channels, including mass merchandisers and drug, food, dollar, convenience, and club stores, which reduces our exposure to any single distribution channel.
We have grown our product portfolio both organically and through acquisitions. We develop our existing brands by investing in new product lines, brand extensions and strong advertising support. Acquisitions of OTC brands have also been an important part of our growth strategy. We have acquired strong and well-recognized brands from consumer products, pharmaceutical and private equity companies. While certain of these brands have long histories of brand development and investment, we believe that, at the time we acquired them, most were considered “non-core” by their previous owners. As a result, these acquired brands did not benefit from adequate management focus and marketing support during the period prior to their acquisition, which created opportunities for us to reinvigorate these brands and improve their performance post-acquisition. After adding a core brand to our portfolio, we seek to increase its sales, market share and distribution in both existing and new channels through our established retail distribution network. We pursue this growth through increased spending on advertising and promotional support, new sales and marketing strategies, improved packaging and formulations and innovative development of brand extensions.
Competitive Strengths
Diversified Portfolio of Well-Recognized and Established Consumer Brands
We own and market a diverse portfolio of well-recognized consumer brands, some of which were established over 100 years ago. Our diverse portfolio of products provides us with multiple sources of growth and minimizes our reliance on any one product or category. We provide significant marketing support to our portfolio that is designed to enhance our sales growth and our long-term profitability across our major and other significant brands, sometimes referred to as core brands (which are discussed on page 7 to this Annual Report on Form 10-K).
Strong Competitor in Attractive Categories
We compete in product categories that address recurring consumer needs. We believe we are well positioned in these categories due to the long history and consumer awareness of our brands, our strong market positions, and our low-cost operating model. The markets in which we sell our products, however, are highly competitive and include numerous national and global manufacturers, distributors, marketers and retailers. As a result, any one or more of our brands could suffer a decline in market position or sales.
Proven Ability to Develop and Introduce New Products
We focus our marketing and product development efforts on the identification of under-served consumer needs, the design of products that directly address those needs, and the ability to extend our highly recognizable brand names to other products. As an example of this philosophy, in 2018 we launched a number of new products, including DenTek Comfort Picks Wallet Card, Summer's Eve Simply Coconut Water Wash, Dramamine N Long Lasting Nausea Relief and Monistat Cooling Cream. In 2017, we launched Nix Ultra Kit, Compound W Complete Wart Kit, Luden's Green Apple, Chloraseptic Spray - improved flavors, Efferdent Reformulation, Gaviscon Max Relief Berry and Gaviscon Max Relief Peppermint. Although line extensions and new product introductions are important to the overall growth of a brand, our efforts may reduce sales of existing products within that brand.
Efficient Operating Model
To gain operating efficiencies, we oversee the production planning and quality control aspects of the manufacturing, warehousing and distribution of our products, while we primarily outsource the operating elements of these functions to well-established third-party providers. This approach allows us to benefit from their core competencies and maintain a highly variable cost structure with low overhead, limited working capital requirements, and minimal investment in capital expenditures, as evidenced by the following:
Gross Margin % | G&A % To Total Revenues | CapEx % To Total Revenues | |
2018 | 55.4 | 8.2 | 1.2 |
2017 | 56.7 | 10.1 | 0.3 |
2016 | 57.9 | 9.0 | 0.4 |
In 2018, our gross margin percentage decreased 130 basis points versus 2017, primarily as a result of higher distribution costs and the acquisition of C.B. Fleet Company, Inc. ("Fleet"), which has lower gross margins. In 2017, our gross margin percentage decreased 120 basis points versus 2016, primarily as a result of lower gross margins associated with the acquired DenTek and Fleet brands and purchase accounting charges related to the Fleet acquisition. General and administrative costs, as a percentage of total revenues, decreased 190 basis points in 2018 versus 2017, primarily as a result of higher acquisition and integration charges in
4
2017 related to our acquisition of Fleet. General and administrative costs, as a percentage of total revenues, increased 110 basis points in 2017 versus 2016, primarily as a result of higher acquisition and integration charges. In 2018, our capital expenditures as a percentage of revenues increased 90 basis points versus 2017, primarily due to capital expenditures related our manufacturing facility in Lynchburg, Virginia, which was acquired in conjunction with our acquisition of Fleet. In 2017, our capital expenditures as a percentage of revenues decreased 10 basis points versus 2016.
Management Team with Proven Ability to Acquire, Integrate and Grow Brands
Our business has grown through acquisition and expansion of the many brands we have purchased as a result of the efforts of our experienced management team. Our management team has significant experience in consumer product marketing, sales, legal and regulatory compliance, product development and customer service. We rely on experienced personnel to bear the substantial responsibility of brand management and to effectuate our growth strategy and these managers nurture the brands to allow the brands to grow and evolve.
Growth Strategy
In order to continue to enhance our brands and drive growth, we focus our growth strategy on the following core competencies:
• | Effective Marketing and Advertising; |
• | Sales Excellence; |
• | Extraordinary Customer Service; |
• | Innovation and Product Development; and |
• | Strategic Acquisitions/Capital Uses |
We execute this strategy through the following efforts:
• | Investments in Advertising and Promotion |
We invest in advertising and promotion to drive the growth of our major brands and other significant brands, sometimes referred to as core brands, which are discussed on page 7 of this Annual Report on Form 10-K. Our marketing strategy is focused primarily on consumer-oriented programs that include targeted coupon programs, media, and in-store and digital advertising. While the absolute level of marketing expenditures differs by brand and category, we have often increased the amount of investment in our brands after acquiring them. Advertising and promotional spend on our top five selling brands was approximately 16.4% of the revenues associated with these brands in 2018.
• | Growing our Categories and Market Share with Innovative New Products |
One of our strategies is to broaden the categories in which we participate and increase our share within those categories through ongoing product innovation. In 2018, we launched a number of new products, including DenTek Comfort Picks Wallet Card, Summer's Eve Simply Coconut Water Wash, Dramamine N Long Lasting Nausea Relief and Monistat Cooling Cream. In 2017, we launched Nix Ultra Kit, Compound W Complete Wart Kit, Luden's Green Apple, Chloraseptic Spray - improved flavors, Efferdent Reformulation, Gaviscon Max Relief Berry and Gaviscon Max Relief Peppermint. While there is always a risk that sales of existing products may be reduced by new product introductions, our goal is to grow the overall sales of our brands.
• | Increasing Distribution Across Multiple Channels |
Our broad distribution base attempts to ensure that our products are well positioned across all available channels and that we are able to participate in changing consumer retail trends. In an effort to ensure continued sales growth, we focus on expanding our reliance on direct sales while reducing our reliance on brokers.
• | Growing Our International Business |
International sales beyond the borders of North America represented 8.8%, 8.4% and 7.4% of revenues in 2018, 2017, and 2016, respectively, and are primarily from the acquisition of Fleet in 2017, DenTek Holdings, Inc. ("DenTek") in
5
2016, and the acquisition of Hydralyte in 2015. We have designed and developed both products and packaging for specific international markets and expect that our international revenues will continue to grow.
A number of our other brands have previously been sold internationally, and we seek to expand the number of brands sold through our existing international distribution network and continue to identify additional distribution partners for further expansion into other international markets.
• | Pursuing Strategic Acquisitions |
Acquisitions are an important part of our overall strategy for growing revenue. We have a history of growth through acquisition, the most recent example being the acquisition of Fleet in January 2017 (see "Our History and Accomplishments" below). While we believe that there will continue to be a pipeline of acquisition candidates for us to investigate, strategic fit and relative cost are of the utmost importance in our decision to pursue such opportunities. We believe our business model allows us to integrate acquisitions in an efficient manner, while also providing opportunities to realize significant cost savings.
Market Position
During 2018, approximately 78.0% of our revenues were from brands with a number one or number two market position, compared with approximately 75.5% and 72.1% during 2017 and 2016, respectively. In 2018, these brands included BC/Goody's, Beano, Chloraseptic, Clear Eyes, Comet, Compound W, DenTek, Dramamine, Debrox, Efferdent, Fess, Fleet, Gaviscon, Hydralyte, Monistat, Nix, Pedia-Lax, and Summer's Eve.
Our History and Accomplishments
Since our formation as a Delaware corporation in 1996, we have added brands to our portfolio principally by acquiring strong and well-recognized brands from larger consumer products and pharmaceutical companies. We engaged in strategic mergers and acquisitions over the last three years as follows:
2017 Acquisition
Acquisition of Fleet
On January 26, 2017, the Company completed the acquisition of Fleet pursuant to the merger agreement, dated as of December 22, 2016, for $823.7 million. The purchase price was funded by available cash on hand, additional borrowings under our asset-based revolving credit facility (the "2012 ABL Revolver"), and a new $740.0 million senior secured incremental term loan under our existing term loan facility (the "2012 Term Loan"). As a result of the merger, we acquired women's health, gastrointestinal and dermatological care OTC brands, including Summer’s Eve, Fleet, and Boudreaux's Butt Paste, as well as a “mix and fill” manufacturing facility in Lynchburg, Virginia. The financial results from the Fleet acquisition are included in the Company's North American and International OTC Healthcare segments.
2017 Divestitures
On July 7, 2016, we completed the sale of the Pediacare®, New Skin® and Fiber Choice® brands for $40.0 million plus the cost of inventory. During the year ended March 31, 2017, we recorded a pre-tax loss on sale of $56.2 million.
Concurrent with the completion of the sale of these brands, we entered into an option agreement with the buyer to purchase Dermoplast® at a specified earnings multiple as defined in the option agreement. The buyer paid a $1.25 million deposit for this option in September 2016 and later notified us of its election to exercise the option. In December 2016, we completed the sale of the Dermoplast® brand, and in a separate transaction, the e.p.t® brand, for an aggregate amount of $59.6 million. As a result, we recorded a pre-tax net gain on these divestitures of $3.9 million.
2017 Sale of License Rights
Historically, we received royalty income from the licensing of the names of certain of our brands in geographic areas or markets in which we do not directly compete. We have had royalty agreements for our Comet brand for several years, which included options on behalf of the licensee to purchase license rights in certain geographic areas and markets in perpetuity. In December 2014, we amended these agreements, and we sold rights to use of the Comet brand in certain Eastern European countries to a third-party licensee in exchange for $10.0 million as a partial early buyout of the license. The amended agreement provided that we
6
would continue to receive royalty payments of $1.0 million per quarter for the remaining geographic areas and also granted the licensee an option to acquire the license rights in the remaining geographic areas any time after June 30, 2016. In July 2016, the licensee elected to exercise its option. In August 2016, we received $11.0 million for the purchase of the remaining license rights and, as a result, we recorded a pre-tax gain of $1.2 million and reduced our indefinite-lived tradenames by $9.0 million. Furthermore, the licensee was no longer required to make additional royalty payments to us, and as a result, our royalty income was reduced accordingly.
2016 Acquisition
Acquisition of DenTek
On February 5, 2016, we completed the acquisition of DenTek, a privately-held marketer and distributor of specialty oral care products. The closing was finalized pursuant to the terms of the merger agreement, announced November 23, 2015, under which we agreed to acquire DenTek from its stockholders for a purchase price of $226.9 million. The acquisition expanded our portfolio of brands, strengthened our existing oral care platform and increased our geographic reach in parts of Europe. We financed the transaction with a combination of available cash on hand, available cash from our 2012 ABL Revolver, and financing of an additional unsecured bridge loan. The DenTek brands are included in our North American and International OTC Healthcare segments.
Products
We conduct our operations through three reportable segments:
• | North American OTC Healthcare; |
• | International OTC Healthcare; and |
• | Household Cleaning. |
North American and International OTC Healthcare Segments
Our portfolio of OTC Healthcare products includes the following major brands: DenTek specialty oral care products, Monistat women’s health products, Nix lice treatment, Chloraseptic sore throat treatments, Clear Eyes eye care products, Compound W wart treatments, Efferdent denture care products, Luden's throat drops, Dramamine motion sickness treatment, BC and Goody's pain relievers, Beano gas prevention, Debrox earwax remover, Pedia-Lax pediatric laxatives, Fleet laxatives, Summer's Eve women's health products, Boudreaux's Butt Paste, Hydralyte for rehydration and electrolyte replacement, Fess nasal saline spray and Gaviscon antacid in Canada.
Other significant brands include Little Remedies pediatric healthcare products, Orabrush oral hygiene products, and The Doctor's oral hygiene products.
In 2018, the North American OTC Healthcare segments accounted for 83.5% of our net revenues, compared to 81.7% and 81.6% in 2017 and 2016, respectively. In 2018, the International OTC Healthcare segment accounted for 8.8% of our net revenues, compared to 8.3% and 7.2% in 2017 and 2016, respectively.
The following describes our major brands in the North American and International OTC Healthcare segments:
BC/Goody's
BC and Goody's compete in the $3.7 billion U.S. Adult Analgesic category. They are the top two U.S. OTC pain reliever brands in a powder form. Developed in North Carolina over 80 years ago, their unique form delivers fast pain relief. The combined brands are the number one Adult Analgesic product in convenience stores according to IRI. BC is available in Original, Cherry, Arthritis and new Sinus Pain. Goody's includes Extra Strength, Back & Body, PM, Cool Orange, Mixed Fruit Blast and the single dose liquid pain reliever, Headache Relief Shot.
Beano
Beano commands the number one position in the U.S. Gas Prevention category and the number two overall position in the larger $183.6 million U.S. Anti-Gas category. The product is formulated with a unique digestive enzyme that works naturally with the body to prevent gas symptoms before they start.
Boudreaux's Butt Paste
7
Boudreaux's Butt Paste is the number four brand in the $189.2 million Baby Ointments category. Boudreaux's products include various diaper rash ointments.
Chloraseptic
Chloraseptic was originally developed by a dentist in 1957 to relieve sore throats and mouth pain. Chloraseptic’s liquid sore throat spray is the number one selling product in the U.S. Sore Throat Liquids/Lozenges market and was ranked the number one U.S. pharmacist recommended sore throat liquid/spray by Pharmacy Times and U.S. News & World Report.
Clear Eyes
Clear Eyes has been marketed as an effective eye care product that helps eliminate redness and helps moisturize the eye. Clear Eyes is among the leading brands in the U.S. OTC Personal Eye Care category.
Compound W
Compound W has a long heritage, with its wart removal products having been introduced more than 50 years ago. Compound W products are specially designed to provide relief from common and plantar warts and are sold in multiple forms of treatment depending on the consumer’s need, including Fast-Acting Liquid, Fast-Acting Gel, One Step Pads and Freeze Off, a cryogenic-based wart removal system that works in as little as one application. Compound W is the number one U.S. pharmacist recommended wart remover according to Pharmacy Times. Additionally, Compound W is the number one wart removal brand in the United States.
Debrox
Debrox is the number one brand of U.S. OTC ear wax removal aids. The product line consists of two items: an ear wax removal kit containing liquid drops and an ear washer bulb, and a second item containing just the liquid drops as a refill. With Debrox, consumers have a safe, gentle method for removing ear wax build up while in the privacy of their homes. Debrox is the number one recommended brand with pharmacists in the United States according to Pharmacy Times.
DenTek
DenTek is the number two brand in the PEG Oral Care market and includes floss picks, interdental brushes, dental guards, dental repair and wax, floss threaders, dental picks, and tongue cleaners.
Dramamine
Dramamine is the number one brand and the number one pharmacist recommended brand, according to Pharmacy Times, in the $108.4 million U.S. Motion Sickness Relief category. The product line includes Dramamine Non-Drowsy Naturals, Dramamine for Kids, a Less Drowsy formula and a Chewable form, in addition to the top selling Dramamine original product.
Efferdent
Efferdent Denture Cleanser holds the number two position in the $144.9 million U.S. Denture Cleanser Tablets category. The January 2011 introduction of Efferdent PM extended the brand into the growing overnight cleanser market. In 2014, we introduced Fresh Guard by Efferdent. This product is designed specifically for the cleaning of mouth guards, retainers, removable braces and mouth guard appliances.
Fess
In the Australia market, Fess is currently the leading brand in the Nasal Saline Spray market.
Fleet
Fleet is the number one brand in the U.S. Laxative-Enema/Suppositories category. First sold in 1869, Fleet products include enemas, wipes, suppositories and oral laxatives.
Gaviscon
Gaviscon is currently the number one brand in the $170.2 million Canadian Upset Stomach Remedies category. Gaviscon's success is partly attributed to a differentiated method of action versus traditional antacid products, as it creates a foam barrier to keep stomach acid from backing up into the esophagus.
Hydralyte
Hydralyte is the leading OTC brand in the Oral Rehydration market in Australia.
Luden's
Luden's throat drops heritage spans more than 130 years in the $736.8 million U.S. Cough Drops category. In 2014, Luden’s expanded its product portfolio with the introduction of Sugar Free Black Cherry, Watermelon and Blue Raspberry throat drops.
8
In 2017, Luden's introduced Strawberry Banana and Green Apple flavors. In 2018, Luden's introduced Honey Berry and Red Hot Cinnamon flavors.
Monistat
Monistat, the number one doctor recommended U.S. OTC brand for yeast infection treatment, is currently the second largest selling brand in the Company. The active ingredient, miconazole, is as effective at curing yeast infections as the leading prescription pill. Monistat comes in 3 different doses: 1-day, 3-day and 7-day; in 3 different forms: cream, ovule and suppository; and with or without symptom relief accessories: external cream and wipes. Monistat is the number one brand in the U.S. Vaginal Treatments/Anti-Fungal category. The Monistat® Complete Care™ line of products was introduced in 2014 and includes an Instant Itch Relief Cream, Vaginal Health Test, Chafing Relief Powder Gel®, Stay Fresh Feminine Freshness Gel and, launched in 2018, Cooling Cloths and an Instant Itch Relief Spray.
Nix
Nix is the number one brand in the U.S. Lice/Parasite Treatments category. Nix kills lice and their eggs while also protecting against lice re-infestation for up to 14 days. It is safe for use on children as young as 2 months old and is the number one recommended brand for lice treatments according to Pharmacy Times.
Pedia-Lax
Pedia-Lax is the number one brand in the $29.8 million Pediatric Laxatives category.
Summer's Eve
Summer's Eve is currently the largest selling brand in the Company and is the number one brand in the Feminine Hygiene category. Summer's Eve offers a variety of feminine hygiene products including washes, cloths, sprays and powders.
Household Cleaning Segment
Our portfolio of Household Cleaning brands includes the Chore Boy, Comet and Spic and Span brands. During 2018, the Household Cleaning segment accounted for 7.7% of our revenues, compared with 10.0% and 11.2% in 2017 and 2016, respectively.
Comet
Comet was originally introduced in 1956 and is one of the most widely recognized household cleaning brands. Comet is the number one brand in the U.S. Abrasive Tub and Tile Cleaners segment of the household cleaning category that includes non-scratch, abrasive powders, creams, and liquids. Comet products include several varieties of cleaning powders, spray and cream, both abrasive and non-abrasive.
For additional information concerning our business segments, please refer to Part II, Item 7, “Management’s Discussion and Analysis of Financial Condition and Results of Operations” and Note 19 to the Consolidated Financial Statements included elsewhere in this Annual Report on Form 10-K.
Marketing and Sales
Our marketing strategy is based on the acquisition and the rejuvenation of established consumer brands that possess what we believe to be significant brand value and unrealized potential. Our marketing objective is to increase sales and market share by developing innovative new products and line extensions and executing creative and cost-effective advertising and promotional programs. After we acquire a brand, we implement a brand building strategy that uses the brand’s existing consumer awareness to maximize sales of current products and provides a vehicle to drive growth through product innovation. This brand building process involves the evaluation of the existing brand name, the development and introduction of innovative new products, and the execution of support programs. Recognizing that financial resources are limited, we allocate our resources to focus on our core brands with the most impactful, consumer-relevant initiatives that we believe have the greatest opportunities for growth and financial success. Brand priorities vary from year-to-year and generally revolve around new product introductions.
Customers
Our senior management team and dedicated sales force strive to maintain long-standing relationships with our top 50 domestic customers. We also contract with third-party sales management enterprises that interface directly with our remaining customers and report directly to members of our sales management team.
9
We enjoy broad distribution across each of the major retail channels, including mass merchandisers, drug, food, dollar, convenience and club stores. The following table sets forth the percentage of gross sales across our six major distribution channels during each of the past three years ended March 31:
Percentage of Gross Sales(1) | |||||
Channel of Distribution | 2018 | 2017 | 2016 | ||
Mass | 37.2 | 30.9 | 30.2 | ||
Drug | 24.6 | 22.8 | 22.3 | ||
Food | 15.8 | 16.5 | 18.0 | ||
Dollar | 9.0 | 9.8 | 10.7 | ||
Convenience | 3.2 | 7.0 | 6.6 | ||
Club | 1.6 | 3.0 | 2.7 | ||
Other | 8.6 | 10.0 | 9.5 | ||
(1) | Includes estimates for some of our wholesale customers that service more than one distribution channel. |
Due to the diversity of our product lines, we believe that each of these channels is important to our business, and we continue to seek opportunities for growth in each channel.
During 2018, 2017, and 2016, Walmart accounted for approximately 23.8%, 21.1%, and 20.2%, respectively, of our gross revenues. We expect that for future periods, our top ten customers, including Walmart, will, in the aggregate, continue to account for a large portion of our sales.
Our strong customer relationships and product recognition allow us to attempt to capitalize on a number of important strategic opportunities, including (i) minimization of slotting fees, (ii) maximization of new product introductions, (iii) maximization of shelf space prominence, and (iv) minimization of cash collection days. We believe that our emphasis on strong customer relationships, speed and flexibility and leading sales technology capabilities, combined with consistent marketing support programs and ongoing product innovation, will continue to maximize our competitiveness in the increasingly complex retail environment.
The following table sets forth a list of our primary distribution channels and our principal customers for each channel:
Distribution Channel | Customers | Distribution Channel | Customers | |||
Mass | Meijer | Drug | CVS | |||
Target | Rite Aid | |||||
Walmart | Walgreens | |||||
Food | Ahold/Delhaize | Dollar | Dollar General | |||
Kroger | Dollar Tree | |||||
Publix | Family Dollar | |||||
Albertson's/Safeway | ||||||
Supervalu | Club | BJ’s Wholesale Club | ||||
Wakefern | Costco | |||||
HEB | Sam’s Club | |||||
Wegman's | ||||||
Convenience | McLane | Other | Amazon | |||
HT Hackney | ||||||
Core Mark | ||||||
10
Outsourcing and Manufacturing
In order to maximize our competitiveness and efficiently allocate our resources, third-party manufacturers fulfill most of our manufacturing needs. We have found that contract manufacturing often maximizes our flexibility and responsiveness to industry and consumer trends while minimizing the need for capital expenditures. We select contract manufacturers based on their core competencies and our perception of the best overall value, including factors such as (i) depth of services, (ii) professionalism and integrity of the management team, (iii) manufacturing agility and capacity, (iv) regulatory compliance, and (v) competitive pricing. We also conduct thorough reviews of each potential manufacturer’s facilities, quality standards, capacity and financial stability. We generally purchase only finished products from our manufacturers.
Our primary contract manufacturers provide comprehensive services from product development through the manufacturing of finished goods. They are responsible for such matters as (i) production planning, (ii) product research and development, (iii) procurement, (iv) production, (v) quality testing, and (vi) almost all capital expenditures. In most instances, we provide our contract manufacturers with guidance in the areas of (i) product development, (ii) performance criteria, (iii) regulatory guidance, (iv) sourcing of packaging materials, and (v) monthly master production schedules. This management approach results in minimal capital expenditures and maximizes our cash flow, which allows us to reinvest to support our marketing initiatives, fund brand acquisitions or repay outstanding indebtedness.
At March 31, 2018, we had relationships with 116 third-party manufacturers. Of those, we had long-term contracts with 46 manufacturers that produced items that accounted for approximately 73.6% of our gross sales for 2018, compared to 47 manufacturers with long-term contracts that accounted for approximately 78.4% of our gross sales in 2017. The fact that we do not have long-term contracts with certain manufacturers means that they could cease manufacturing our products at any time and for any reason or initiate arbitrary and costly price increases, which could have a material adverse effect on our business and results of operations. Although we are in the process of negotiating long-term contracts with certain key manufacturers, we may not be able to reach a timely agreement, which could have a material adverse effect on our business and results of operations.
At March 31, 2018, suppliers for our key brands included GSK, Fareva, Denison Pharmaceuticals, Inc., Aspen Pharmacare, Olds Products Company, Tower Laboratories Ltd., and Contract Pharmaceuticals Corp. We enter into manufacturing agreements for a majority of our products by sales volume, each of which vary based on the capabilities of the third-party manufacturer and the products being supplied. These agreements explicitly outline the manufacturer’s obligations and product specifications with respect to the brand or brands being produced. The purchase price of products is subject to change pursuant to the terms of these agreements due to fluctuations in raw material, packaging and labor costs. Other products are manufactured on a purchase order basis, which is generally based on batch sizes and results in no long-term obligations or commitments.
In conjunction with the 2017 acquisition of Fleet, we acquired a "mix and fill" manufacturing facility in Lynchburg, Virginia, which manufactures products comprising approximately two-thirds of Fleet's sales.
We believe that most of the raw materials and packaging used to produce our products at our manufacturing facility in Virginia are readily available through multiple sources.
Warehousing and Distribution
We receive orders from retailers and/or brokers primarily by electronic data interchange, which automatically enters each order into our information systems and then routes the order to our distribution center. The distribution center will, in turn, send a confirmation that the order was received, fill the order and ship the order to the customer, while sending a shipment confirmation to us. Upon receipt of the shipment confirmation, we send an invoice to the customer.
We manage product distribution in the continental United States primarily through one facility located in St. Louis, which is owned and operated by a third-party provider. Our U.S. warehouse provider provides warehouse services including storage, handling and shipping, as well as transportation services, with respect to our full line of products, including (i) complete management services, (ii) carrier claims administration, (iii) proof of delivery, (iv) procurement, (v) report generation, and (vi) freight payment services.
11
Competition
The business of selling brand name consumer products in the OTC Healthcare and Household Cleaning categories is highly competitive. These markets include numerous national and global manufacturers, distributors, marketers and retailers that actively compete for consumers’ business both in the United States and abroad. In addition, like most companies that market products in these categories, we are experiencing increased competition from “private label” products introduced by major retail chains. While we believe that our branded products provide superior quality and benefits, we are unable to predict the extent to which consumers will purchase “private label” products as an alternative to branded products.
Our principal competitors vary by industry category. Competitors in the OTC Healthcare category include: Johnson & Johnson, The Procter & Gamble Company, Reckitt Benckiser, Kraft Foods, GSK, Sunstar America, Inc., Pfizer, Novartis Consumer Healthcare, Combe, and Boehringer Ingelheim,
Competitors in the Household Cleaning category include: Henkel AG & Co., Colgate-Palmolive Company, The Clorox Company, The Procter & Gamble Company, and 3M Company.
We compete on the basis of numerous factors, including brand recognition, product quality, performance, value to customers, price, and product availability at the retail level. Advertising, promotion, merchandising and packaging, the timing of new product introductions, and line extensions also have a significant impact on customers’ buying decisions and, as a result, on our sales. The structure and quality of our sales force, as well as sell-through of our products, affect in-store position, wall display space and inventory levels in retail outlets. Our markets are also highly sensitive to the introduction of new products, which may rapidly capture a significant share of the market.
Many of the competitors noted above are larger and have substantially greater research and development and financial resources than we do, and may therefore have the ability to spend more aggressively and consistently on research and development, advertising and marketing, and to respond more effectively to changing business and economic conditions. See “Competitive Strengths” above for additional information regarding our competitive strengths and Part I, Item 1A “Risk Factors” below for additional information regarding competition in our industry.
Regulation
Product Regulation
The formulation, manufacturing, packaging, labeling, distribution, importation, sale and storage of our products are subject to extensive regulation by various U.S. federal agencies, including the U.S. Food and Drug Administration ("FDA"), the Federal Trade Commission ("FTC"), the Consumer Product Safety Commission (“CPSC”), and the Environmental Protection Agency (“EPA”), and various agencies of the states, localities and foreign countries in which our products are manufactured, distributed and sold. Our Regulatory Team is guided by a senior member of management and staffed by individuals with appropriate legal and regulatory experience. Our Regulatory and Operations teams work closely with our third-party manufacturers and our own manufacturing operation on quality-related matters, while we monitor our third party manufacturers' compliance with FDA and foreign regulations and perform periodic audits to ensure compliance. This continual evaluation process is designed to ensure that our manufacturing processes and products are of the highest quality and in compliance with known regulatory requirements. If the FDA or a foreign governmental authority chooses to audit a particular third-party manufacturing facility, we require the third-party manufacturer to notify us immediately and update us on the progress of the audit as it proceeds. If we or our manufacturers fail to comply with applicable regulations, we could become subject to significant claims or penalties or be required to discontinue the sale of the non-compliant product. In addition, the adoption of new regulations or changes in the interpretations of existing regulations may result in significant additional compliance costs or discontinuation of product sales.
Most of our U.S. OTC drug products are regulated pursuant to the FDA’s monograph system. The monographs set out the active ingredients and labeling indications that are permitted for certain broad categories of U.S. OTC drug products. When the FDA has finalized a particular monograph, it has concluded that a properly labeled product formulation is generally recognized as safe and effective and not misbranded. A tentative final monograph indicates that the FDA has not made a final determination about products in a category to establish safety and efficacy for a product and its uses. However, unless there is a serious safety or efficacy issue, the FDA typically will exercise enforcement discretion and permit companies to sell products conforming to a tentative final monograph until the final monograph is published. Products that comply with either final or tentative final monograph standards do not require pre-market approval from the FDA.
Certain of our U.S. OTC drug products are New Drug Application (“NDA”) or Abbreviated New Drug Application (“ANDA”) products and are manufactured and labeled in accordance with a FDA-approved submission. These products are subject to reporting requirements as set forth in FDA regulations.
12
Certain of our U.S. OTC Healthcare products are medical devices regulated by the FDA through a system that usually involves pre-market clearance. During the review process, the FDA makes an affirmative determination as to the sufficiency of the label directions, cautions and warnings for the medical devices in question.
Certain of our products are considered cosmetics regulated by the FDA through the Federal Food, Drug, and Cosmetic Act (FDC Act) and the Fair Packaging and Labeling Act. FDA does not require pre-market clearance but seeks to insure the products are not adulterated or misbranded.
In accordance with the FDC Act and FDA regulations, we and our third-party manufacturers of U.S. products must also comply with the FDA’s current Good Manufacturing Practices (“GMPs”). The FDA inspects our facilities and those of our third-party manufacturers periodically to determine that both we and our third-party manufacturers are complying with GMPs.
A number of our products are regulated by the CPSC under the Federal Hazardous Substances Act (the “FHSA”), the Poison Prevention Packaging Act of 1970 (the “PPPA”) and the Consumer Products Safety Improvement Act of 2008 (the “CPSIA”). Certain of our household products are considered to be hazardous substances under the FHSA and therefore require specific cautionary warnings to be included in their labeling for such products to be legally marketed. In addition, a small number of our products are subject to regulation under the PPPA and can only be legally marketed if they are dispensed in child-resistant packaging or labeled for use in households where there are no children. The CPSIA requires us to make available to our customers certificates stating that we are in compliance with any applicable regulation administered by the CPSC.
Nix spray and certain Household Cleaning products are considered pesticides under the Federal Insecticide, Fungicide, and Rodenticide Act (“FIFRA”). Generally speaking, any substance intended for preventing, destroying, repelling, or mitigating any pest is considered to be a pesticide under FIFRA. We also market and distribute certain household products under our Comet and Spic and Span brands that make antibacterial and/or disinfectant claims governed by FIFRA. Due to the antibacterial and/or disinfectant claims on certain of the Comet and Spic and Span products and the lice killing claims on Nix spray, such products are considered to be pesticides under FIFRA and are required to be registered with the EPA and contain certain disclosures on the product labels. In addition, the contract manufacturers from which we source these products must be registered with the EPA. Our EPA registered products are also subject to state regulations and the rules and regulations of the various jurisdictions where these products are sold.
Our international business is also subject to product regulations by local regulatory authorities in the various regions where these businesses operate, including regulations regarding manufacturing, labeling, distribution, sale and storage.
Other Regulations
We are also subject to a variety of other regulations in various foreign markets, including regulations pertaining to import/export and antitrust issues. To the extent we decide to commence or expand operations in additional countries, we may be required to obtain an approval, license or certification from the country’s ministry of health or comparable agency. We must also comply with product labeling and packaging regulations that may vary from country to country. Government regulations in both our domestic and international markets can delay or prevent the introduction, or require the reformulation or withdrawal, of some of our products. Our failure to comply with these regulations can also result in a product being removed from sale in a particular market, either temporarily or permanently. In addition, we are subject to FTC and state regulations, as well as foreign regulations, relating to our product claims and advertising. If we fail to comply with these regulations, we could be subject to enforcement actions and the imposition of penalties.
Intellectual Property
We own a number of trademark registrations and applications in the United States, Canada and other foreign countries. The following are some of the most important registered trademarks we own in the United States and/or Canada: BC, Beano, Boudreaux's Butt Paste, Chloraseptic, Chore Boy, Cinch, Clear Eyes, Comet, Compound W, Debrox, DenTek, Dramamine, Ecotrin, Efferdent, Effergrip, Fleet, Freeze Off, Gaviscon, Gly-Oxide, Goody's, Little Remedies, Luden's, Monistat, NasalCrom, Nix, Spic and Span, Summer's Eve, Tagamet, The Doctor’s Brushpicks, The Doctor’s NightGuard, and Wartner.
Our trademarks and tradenames are how we convey that the products we sell are “brand name” products. Our ownership of these trademarks and tradenames is very important to our business, as it allows us to compete based on the value and goodwill associated with these marks. We may also license others to use these marks. Additionally, we own or license patents on innovative and proprietary technology. The patents evidence the unique nature of our products, provide us with exclusivity, and afford us protection from the encroachment of others. None of the patents that we own or license, however, is material to us on a consolidated basis. Enforcing our rights, or the rights of any of our licensors, represented by these trademarks, tradenames and patents is critical to
13
our business and may require significant expense. If we are not able to effectively enforce our rights, others may be able to dilute our trademarks, tradenames and patents and diminish the value associated with our brands and technologies.
We do not own all of the intellectual property rights applicable to our products. In those cases where our third-party manufacturers own patents that protect our products, we are dependent on them as a source of supply for our products. In addition, we rely on our suppliers for their enforcement of their intellectual property rights against infringing products.
We have granted a paid-up license to an international consumer packaged goods company for the right to use the Comet, Spic and Span and Chlorinol trademarks in the commercial/institutional/industrial business throughout the world (excluding Russia and specified Eastern European countries). We also transferred to the licensee the Comet and Chlorinol trademarks in Russia and specified Eastern European countries. We retain the the right to use the Comet, Spic and Span and Chlorinol trademarks in the retail/household business throughout the world (excluding Russia and specified Eastern European countries).
Seasonality
The first quarter of our fiscal year typically has the lowest level of revenue due to the seasonal nature of certain of our brands relative to the summer and winter months. In addition, the first quarter generally is the least profitable quarter due to the increased advertising and promotional spending to support those brands with a summer selling season, such as Clear Eyes products, Compound W, and Wartner. The level of advertising and promotional campaigns in the third quarter influences sales of our cough/cold products, such as Chloraseptic, Little Remedies, and Luden's, during the fourth quarter cough and cold winter months. Additionally, the fourth quarter typically has the lowest level of advertising and promotional spending as a percent of revenue.
Employees
We employed approximately 530 full time and no part time individuals at March 31, 2018. Of our approximately 530 employees, approximately 390 are non-production employees. None of our employees is a party to a collective bargaining agreement. Management believes that our relations with our employees are good.
Backlog Orders
We define backlog as orders with requested delivery dates prior to March 31st that were not shipped as of March 31st. We had no significant backlog orders at March 31, 2018 or 2017.
Available Information
Our Internet address is www.prestigebrands.com. We make available free of charge on or through our Internet website our Annual Reports on Form 10-K, Quarterly Reports on Form 10-Q, Current Reports on Form 8-K, and amendments to those reports, as well as the Proxy Statement for our annual stockholders’ meetings, as soon as reasonably practicable after we electronically file such material with, or furnish it to, the Securities and Exchange Commission (the “SEC”). Information on our Internet website does not constitute a part of this Annual Report on Form 10-K and is not incorporated herein by reference, including any general statement incorporating by reference this Annual Report on Form 10-K into any filing under the Securities Act of 1933, as amended (the “Securities Act”), or under the Securities Exchange Act of 1934, as amended (the “Exchange Act”).
You may read and copy any materials that we file with the SEC at the SEC’s Public Reference Room at 100 F Street, NE, Washington, DC 20549. You may obtain information on the operation of the Public Reference Room by calling the SEC at 1-800-SEC-0330. The SEC also maintains an Internet site (http://www.sec.gov) that contains reports, proxy and information statements and other information regarding issuers that file electronically with the SEC.
We have adopted a Code of Conduct Policy, Code of Ethics for Senior Financial Employees, Policy and Procedures for Complaints Regarding Accounting, Internal Controls and Auditing Matters, Corporate Governance Guidelines, Audit Committee Pre-Approval Policy, and Charters for our Audit, Compensation and Nominating and Corporate Governance Committees, as well as a Related Persons Transaction Policy and Stock Ownership Guidelines. We will provide to any person without charge, upon request, a copy of the foregoing materials. Any requests for the foregoing documents from us should be made in writing to:
Prestige Brands Holdings, Inc.
660 White Plains Road
Tarrytown, New York 10591
Attention: Secretary
We intend to disclose future amendments to the provisions of the foregoing documents, policies and guidelines and waivers therefrom, if any, on our Internet website and/or through the filing of a Current Report on Form 8-K with the SEC, to the extent required under the Exchange Act.
14
ITEM 1A. RISK FACTORS
The high level of competition in our industry, much of which comes from competitors with greater resources, could adversely affect our business, financial condition and results of operations.
The business of selling brand name consumer products in the OTC Healthcare and Household Cleaning categories is highly competitive. These markets include numerous manufacturers, distributors, marketers and retailers that actively compete for consumers’ business both in the United States and abroad. Many of these competitors are larger and have substantially greater resources than we do, and may therefore have the ability to spend more aggressively on research and development, advertising and marketing, and to respond more effectively to changing business and economic conditions. If this were to occur, it could have a material adverse effect on our financial condition and results of operations.
Certain of our product lines that account for a large percentage of our sales have a smaller market share relative to our competitors. In some cases we may have a number one market position but still have a relatively small share of the overall market. Alternatively, we may hold a number two market position but have a substantially smaller share of the market versus the number one competitor. See “Part I, Item 1. Business - Major Brands” of this Annual Report on Form 10-K for information regarding market share.
We compete for customers’ attention based on a number of factors, including brand recognition, product quality, performance, value to customers, price and product availability at the retail level. Advertising, promotion, merchandising and packaging and the timing of new product introductions and line extensions also have a significant impact on consumer buying decisions and, as a result, on our sales. Our markets are highly sensitive to the introduction of new products, which may rapidly capture a significant share of the market. New product innovations by our competitors or our failure to develop new products or the failure of a new product launch by the Company, could have a material adverse effect on our business, financial condition and results of operations. If our advertising, marketing and promotional programs are not effective, our sales may decline. In addition, the introduction or expansion of store brand products that compete with our products has impacted and could in the future impact our sales and results of operations.
The structure and quality of our sales force, as well as sell-through of our products, affect in-store position, wall display space and inventory levels in retail stores. If we are unable to maintain our current distribution network, product offerings in retail stores, inventory levels and in-store positioning of our products, our sales and operating results could be adversely affected.
In addition, competitors may attempt to gain market share by offering products at prices at or below those typically offered by us. Competitive pricing may require us to reduce prices, which may result in lost revenue or a reduction of our profit margins. Future price adjustments by our competitors or our inability to react with price adjustments of our own could result in a loss of market share, which could have a material adverse effect on our financial condition and results of operations.
We depend on a limited number of customers with whom we have no long-term agreements for a large portion of our gross sales, and the loss of one or more of these customers could reduce our gross sales and have a material adverse effect on our financial condition and results of operations.
During 2018, one customer, Walmart, which accounted for approximately 23.8% of our gross sales, was our only customer that accounted for more than 10% of our gross revenues. We expect that for future periods, our top ten customers, including Walmart, will, in the aggregate, continue to account for a large and potentially increasing portion of our sales. The loss of one or more of these top customers, or any significant decrease in sales to these customers based on changes in their strategies including a reduction in the number of brands they carry, the amount of shelf space they dedicate to store brand products, inventory management, or a significant decrease in our retail display space in any of these customers’ stores, could reduce our sales and have a material adverse effect on our financial condition and results of operations.
In addition, our business is based primarily upon individual sales orders. We typically do not enter into long-term contracts with our customers. Accordingly, our customers could cease buying products or reduce the number of items they buy from us at any time and for any reason. The fact that we do not have long-term contracts with our customers means that we have no recourse in the event a customer no longer wants to purchase products from us or reduces the number of items purchased. If a significant number of our smaller customers, or any of our significant customers, elect not to purchase products from us, our financial condition and results of operations could be adversely affected.
We primarily depend on third-party manufacturers to produce the products we sell. If we are unable to maintain these manufacturing relationships or fail to enter into additional relationships, as necessary, we may be unable to meet customer demand and our business, sales and profitability could suffer as a result.
15
Many of our products are produced by a limited number of third-party manufacturers. Our ability to retain our current manufacturing relationships and engage in and successfully transition to new relationships is critical to our ability to deliver quality products to our customers in a timely manner. Without adequate supplies of quality merchandise, our sales would decrease materially and our business would suffer. In the event that our primary third-party manufacturers are unable or unwilling to ship products to us in a timely manner, we would have to rely on secondary manufacturing relationships or, to the extent unavailable, identify and qualify new manufacturing relationships. Because of the unique manufacturing requirements of certain products, the Company may be unable to qualify new suppliers in a timely way or at the quantities, quality and price levels needed. From time to time, certain of the Company's manufacturers have had difficulty meeting demand, which can cause shortages of our products. In such instances, we may not be able to identify or qualify secondary manufacturers for such products in a timely manner, and such manufacturers may not allocate sufficient capacity to allow us to meet our commitments to customers. In addition, identifying alternative manufacturers without adequate lead times may involve additional manufacturing expense, delay in production or product disadvantage in the marketplace. For example, we are moving our BC®/Goody's® product lines to a new third party manufacturer. Any delays or issues with the transition may have an adverse impact on sales of the products. In general, the consequences of not securing adequate, high quality and timely supplies of merchandise would negatively impact inventory levels, which could damage our reputation and result in lost customers and sales, and could have a material adverse effect on our business, financial condition and results of operations.
The manufacturers we use have increased the cost of many of the products we purchase, which could adversely affect our margins in the event we are unable to pass along these increased costs to our customers or identify and qualify new manufacturers. Increased costs could also have a material adverse effect on our financial condition and results of operations.
At March 31, 2018, we had relationships with 116 third-party manufacturers. Of those, we had long-term contracts with 46 manufacturers that produced items that accounted for approximately 73.6% of our gross sales for 2018, compared to 47 manufacturers with long-term contracts that produced approximately 78.4% of gross sales in 2017. The fact that we do not have long-term contracts with certain manufacturers means that they could cease manufacturing our products at any time and for any reason or initiate arbitrary and costly price increases, which could have a material adverse effect on our business and results of operations. Although we are in the process of negotiating long-term contracts with certain key manufacturers, we may not be able to reach a timely agreement, which could have a material adverse effect on our business and results of operations.
Our inability to successfully identify, negotiate, complete and integrate suitable acquisition candidates and to obtain necessary financing could have an adverse impact on our growth and our business, financial condition and results of operations.
Achievement of our strategic objectives requires the acquisition, or potentially the disposition, of certain brands or product lines, and these acquisitions and dispositions may not be successful.
The majority of our growth has been driven by acquiring other brands and companies. At any given time, we may be engaged in discussions with respect to possible acquisitions that are intended to enhance our product portfolio, enable us to realize cost savings, and further diversify our category, customer and channel focus. Our ability to successfully grow through acquisitions depends on our ability to identify, negotiate, complete and integrate suitable acquisition candidates and to obtain any necessary financing. However, we may not be able to identify and successfully negotiate suitable strategic acquisitions at attractive valuations, obtain financing for future acquisitions on satisfactory terms, or otherwise complete future acquisitions. These acquisition efforts could also divert the attention of our management and key personnel from our business operations. All acquisitions entail various risks such that after completing an acquisition, we may also experience:
• | Difficulties in integrating any acquired companies, suppliers, personnel and products into our existing business; |
• | Difficulties in realizing the benefits of the acquired company or products, including expected returns, margins, synergies and profitability; |
• | Higher costs of integration than we anticipated; |
• | Exposure to unexpected liabilities of the acquired business; |
• | Difficulties in retaining key employees of the acquired business who are necessary to operate the business; |
• | Difficulties in maintaining uniform standards, controls, procedures and policies throughout our acquired companies; or |
• | Adverse customer or stockholder reaction to the acquisition. |
16
As a result, any acquisitions we pursue or complete could adversely impact our business, financial condition and results from operations. In addition, any acquisition could adversely affect our operating results as a result of higher interest costs from any acquisition-related debt and higher amortization expenses related to the acquired intangible assets.
In the event that we decide to divest of a brand or product line, we may encounter difficulty finding, or be unable to find, a buyer on acceptable terms in a timely manner.
Additionally, the pursuit of acquisitions and divestitures could also divert management's attention from our business operations and result in a delay in our efforts to achieve our strategic objectives.
Price increases for raw materials, labor, energy, transportation costs and other manufacturer, logistics provider or distributor demands could have an adverse impact on our margins.
The costs to manufacture and distribute our products are subject to fluctuation based on a variety of factors. Increases in commodity raw material (including resins), packaging component prices, and labor, energy and fuel costs and other input costs could have a significant impact on our financial condition and results of operations if our third party manufacturers, logistics providers or distributors pass along those costs to us. In addition, while we have historically outsourced the manufacturing of our products to third parties, as a result of our acquisition of Fleet, we now operate a manufacturing facility and we will directly incur any increases in manufacturing costs for these products. If we are unable to increase the price for our products to our customers or continue to achieve cost savings in a rising cost environment, any such cost increases would reduce our gross margins and could have a material adverse effect on our financial condition and results of operations. If we increase the price of our products in order to maintain our current gross margins for our products, such increase may adversely affect demand for, and sales of, our products, which could have a material adverse effect on our business, financial condition and results of operations.
Disruption in our St. Louis distribution center or our Virginia manufacturing facility may prevent us from meeting customer demand, and our sales and profitability may suffer as a result.
Our product distribution in the United States is managed by a third party through one primary distribution center near St. Louis, Missouri, and with the acquisition of Fleet, we now operate one manufacturing facility located in Lynchburg, Virginia, which manufactures products comprising approximately two-thirds of Fleet's sales. A serious disruption, caused by performance or contractual issues with the third party distribution manager or by earthquake, flood, or fire, could damage our inventory and/or materially impair our ability to distribute our products to customers in a timely manner or at a reasonable cost. For example, we previously identified the integration of Fleet as one factor that could create significant disruption. We also reported in 2017, that the third party distribution manager experienced a high rate of employee turnover and a tightened freight carrier market that caused us to experience significantly increased warehouse and shipping costs. Any disruption as a result of business integration or third party performance at our distribution center could result in increased costs, expense and/or shipping times, and could cause us to incur customer fees and penalties. In addition, any serious disruption to our Fleet manufacturing facility could materially impair our ability to manufacture many of the Fleet products, which would also limit our ability to provide products to customers in a timely manner or at a reasonable cost. We could also incur significantly higher costs and experience longer lead times should we be required to reopen or replace our primary distribution center, the third party distribution manager or the manufacturing facility. As a result, any serious disruption could have a material adverse effect on our business, financial condition and results of operations.
Our risks associated with doing business internationally increase as we expand our international footprint.
During 2018, 2017, and 2016, approximately 8.8%, 8.4% and 7.4%, respectively, of our total revenues were attributable to our international business. As of July 1, 2013, we acquired Care Pharmaceuticals, which markets and sells healthcare products in Australia. On April 30, 2014, we acquired the Hydralyte brand in Australia and New Zealand. On February 5, 2016, we acquired DenTek, which increases our geographic reach in parts of Europe. In addition, on January 26, 2017, we acquired Fleet, which has operations in Singapore. We generally rely on brokers and distributors for the sale of our products in foreign countries. In addition, some of our third party manufacturers are located outside the United States. Risks of doing business internationally include:
• | Political instability or declining economic conditions in the countries or regions where we operate that adversely affect sales of our products; |
• | Currency controls that restrict or prohibit the payment of funds or the repatriation of earnings to the United States; |
• | Fluctuating foreign exchange rates that result in unfavorable increases in the price of our products or cause increases in the cost of certain products purchased from our foreign third-party manufacturers; |
17
• | Compliance with laws and regulations concerning ethical business practices; |
• | Trade restrictions and exchange controls; |
• | Difficulties in staffing and managing international operations; |
• | Difficulty in protecting our intellectual property rights in these markets; and |
• | Increased costs of compliance with general business and tax regulations in these countries or regions. |
If new products and product line extensions do not gain widespread customer acceptance or are otherwise discontinued, the Company's financial performance could be impacted.
The Company's future performance and growth depends on its ability to successfully develop and introduce new products and product line extensions. We cannot be certain that we will achieve our innovation goals. The successful development and introduction of new products involves substantial research, development, marketing and promotional expenditures, which the Company may be unable to recover if the new products do not gain widespread market acceptance. New product development and marketing efforts, including efforts to enter markets or product categories in which the Company has limited or no prior experience, have inherent risks. These risks include product development or launch delays, competitor actions, regulatory approval hurdles and the failure of new products and line extensions to achieve anticipated levels of market acceptance.
Regulatory matters governing our industry could have a significant negative effect on our sales and operating costs.
In both the United States and in our foreign markets, our operations are affected by extensive laws, governmental regulations, administrative determinations, court decisions and similar constraints. Such laws, regulations and other constraints exist at the federal, state and local levels in the United States and at analogous levels of government in foreign jurisdictions.
The formulation, manufacturing, packaging, labeling, distribution, importation, marketing, sale and storage of our products are subject to extensive regulation by various U.S. federal agencies, including the FDA, FTC and CPSC, the EPA, and by various agencies of the states, localities and foreign countries in which our products are manufactured, distributed, stored and sold. The FDC Act and FDA regulations require that the manufacturing processes of our facilities and third-party manufacturers of U.S. products must also comply with the FDA’s GMPs. The FDA inspects our facilities and those of our third-party manufacturers periodically to determine if we and our third-party manufacturers are complying with GMPs. The health regulatory bodies of other countries have their own regulations and standards, which may or may not be consistent with the U.S. FDA GMPs. A history of general compliance in the past is not a guarantee that future GMPs will not mandate other compliance steps and associated expense.
If we or our third-party manufacturers or distributors fail to comply with applicable regulations, we could become subject to enforcement actions, significant penalties or claims, which could materially adversely affect our business, financial condition and results of operations. In addition, we could be required to:
• | Suspend manufacturing operations; |
• | Modify product formulations or processes; |
• | Suspend the sale or require a recall of products with non-complying specifications; or |
• | Change product labeling, packaging, marketing, or advertising, recall non-compliant products, or take other corrective action. |
The adoption of new regulations or changes in the interpretation of existing regulations may result in significant compliance costs or the cessation of product sales and may adversely affect the marketing of our products, which could have a material adverse effect on our financial condition and results of operations. For example, although our Virginia manufacturing facility had passed audits by Brazilian regulators in the past, it was audited in 2017 and deemed noncompliant with Brazilian standards as to the manufacture of one of the products. As a result, the regulators required a recall of a specific product on the Brazilian market. We do not believe this event will have a material adverse impact on our business or results but future audits may impact other products or markets in the future. As with any such matter, we complete a risk analysis to mitigate the potential for impact beyond the affected market.
18
In addition, our failure to comply with FDA, FTC, EPA or any other federal and state regulations, or with similar regulations in foreign markets, that cover our product registration, product claims and advertising, including direct claims and advertising by us, may result in enforcement actions and imposition of penalties, litigation by private parties, or otherwise materially adversely affect the distribution and sale of our products, which could have a material adverse effect on our business, financial condition and results of operations.
Product liability claims and product recalls and related negative publicity could adversely affect our sales and operating results.
We are dependent on consumers’ perception of the safety and quality of our products. Negative consumer perception may arise from product liability claims and product recalls, regardless of whether such claims or recalls involve us or our products. The mere publication of information asserting concerns about the safety of our products or the ingredients used in our products could have a material adverse effect on our business and results of operations. For example, some of our products contain the active ingredient acetaminophen, which is a pain reliever and fever reducer. We believe our products are safe and effective when used in accordance with label directions. However, adverse publicity about acetaminophen or other ingredients used in our products may discourage consumers from buying our products containing those ingredients, which would have an adverse impact on our sales.
From time to time we are subjected to various product liability claims. Claims could be based on allegations that, among other things, our products contain contaminants, include inadequate instructions or warnings regarding their use or include inadequate warnings concerning side effects and interactions with other substances. Whether or not successful, product liability claims could result in negative publicity that could adversely affect the reputation of our brands and our business, sales and operating results. Additionally, we may be required to pay for losses or injuries purportedly caused by our products. In addition, we could be required for a variety of reasons to initiate product recalls, which we have done on several occasions. Any product recalls could have a material adverse effect on our business, financial condition and results of operations.
In addition, although we maintain, and require our suppliers and third-party manufacturers to maintain, product liability insurance coverage, potential product liability claims may exceed the amount of insurance coverage or may be excluded under the terms of the policy, which could have a material adverse effect on our financial condition. In addition, in the future we may not be able to obtain adequate insurance coverage or we may be required to pay higher premiums and accept higher deductibles in order to secure adequate insurance coverage.
If we are unable to protect our intellectual property rights, our ability to compete effectively in the market for our products could be negatively impacted.
The market for our products depends to a significant extent upon the goodwill associated with our trademarks, tradenames and patents. Our trademarks and tradenames convey that the products we sell are “brand name” products. We believe consumers ascribe value to our brands, some of which are over 100 years old. We own or license the material trademarks, tradenames and patents used in connection with the packaging, marketing and sale of our products. These rights prevent our competitors or new entrants to the market from using our valuable brand names and technologies. Therefore, trademark, tradename and patent protection is critical to our business. Although most of our material intellectual property is registered in the United States and in applicable foreign countries, we may not be successful in asserting protection. If we were to lose the exclusive right to use one or more of our intellectual property rights, the loss of such exclusive right could have a material adverse effect on our financial condition and results of operations.
In addition, other parties may infringe on our intellectual property rights and may thereby dilute the value of our brands in the marketplace. Brand dilution could cause confusion in the marketplace and adversely affect the value that consumers associate with our brands, which could negatively impact our business and sales. In addition, third parties may assert claims against our intellectual property rights, and we may not be able to successfully resolve those claims, which would cause us to lose the right to use the intellectual property subject to those claims. Such loss could have a material adverse effect on our financial condition and results of operations. Furthermore, from time to time, we may be involved in litigation in which we are enforcing or defending our intellectual property rights, which could require us to incur substantial fees and expenses and have a material adverse effect on our financial condition and results of operations.
We license certain of our trademarks to third party licensees, who are bound by their respective license agreements to protect our trademarks from infringement and adhere to defined quality requirements. If a licensee of our trademarks fails to adhere to the contractually defined quality requirements, our business and financial results could be negatively impacted if one of our brands suffers a substantial impairment to its reputation due to real or perceived quality issues. Further, if a licensee fails to protect one of our licensed trademarks from infringement, we might be required to take action, which could require us to incur substantial fees and expenses.
19
We depend on third parties for intellectual property relating to some of the products we sell, and our inability to maintain or enter into future license agreements may result in our failure to meet customer demand, which would adversely affect our operating results.
We have licenses or manufacturing agreements with third parties that own intellectual property (e.g., formulae, copyrights, trademarks, trade dress, patents and other technology) used in the manufacture and sale of certain of our products. In the event that any such license or manufacturing agreement expires or is otherwise terminated, we will lose the right to use the intellectual property covered by such license or agreement and will have to develop or obtain rights to use other intellectual property. Similarly, our rights could be reduced if the applicable licensor or third-party manufacturer fails to maintain or protect the licensed intellectual property because, in such event, our competitors could obtain the right to use the intellectual property without restriction. If this were to occur, we might not be able to develop or obtain replacement intellectual property in a timely or cost effective manner. Additionally, any modified products may not be well-received by customers. The consequences of losing the right to use or having reduced rights to such intellectual property could negatively impact our sales due to our failure to meet consumer demand for the affected products or require us to incur costs for the development of new or different intellectual property, either of which could have a material adverse effect on our business, financial condition and results of operations. In addition, development of replacement products may be time-consuming and ultimately may not be feasible.
Virtually all of our assets consist of goodwill and intangible assets and are subject to impairment risk.
As our financial statements indicate, virtually all of our assets consist of goodwill and intangible assets, principally the trademarks, tradenames and patents that we have acquired. On an annual basis, and otherwise when there is evidence that events or changes in circumstances indicate that the carrying value of intangible assets might not be recoverable, we assess the potential impairment of our goodwill and other intangible assets. Upon any such evaluation, we may be required to record a significant charge in our financial statements, which would negatively impact our financial condition and results of operations. We recorded non-cash impairment charges in 2018, 2010 and 2009 for certain assets. If any of our brands sustain significant or prolonged declines in revenues or profitability or performance not in line with our expectations, the carrying value may no longer be recoverable, in which case a non-cash impairment charge may be recorded in future periods. For example, if the Company’s brand performance is weaker than projections used in valuation calculations, the value of such brands may become impaired. In the event that such analysis would result in the fair value being lower than the carrying value, we would be required to record an impairment charge. Although we experienced revenue declines in certain brands in the past, we continue to believe that the fair value of our brands exceed their carrying values as adjusted. However, sustained or significant future declines in revenue, profitability, lost distribution, other adverse changes in expected operating results, and/or unfavorable changes in economic factors used to estimate fair value of certain brands could indicate that the fair value no longer exceeds the carrying value, in which case a non-cash impairment charge may be recorded in future periods. Should the value of those assets or other assets become further impaired or our financial condition is materially adversely affected in any way, we would not have tangible assets that could be sold to repay our liabilities. As a result, our creditors and investors may not be able to recoup the amount of the indebtedness that they have extended to us or the amount they have invested in us.
We depend on our key personnel, and the loss of the services provided by any of our executive officers or other key employees could harm our business and results of operations.
Our success depends to a significant degree upon the continued contributions of our senior management. These employees may voluntarily terminate their employment with us at any time. We may not be able to successfully retain existing personnel or identify, hire and integrate new personnel. While we believe we have developed depth and experience among our key personnel, our business may be adversely affected if one or more of these key individuals were to leave. We do not maintain any key-man or similar insurance policies covering any of our senior management or key personnel.
Our indebtedness could adversely affect our financial condition, and the significant amount of cash we need to service our debt would not be available to reinvest in our business.
At March 31, 2018, our total indebtedness, including current maturities, was approximately $2.0 billion.
Our indebtedness could:
• | Increase our vulnerability to general adverse economic and industry conditions; |
• | Limit our ability to engage in strategic acquisitions; |
20
• | Require us to dedicate a substantial portion of our cash flow from operations toward repayment of our indebtedness, thereby reducing the availability of our cash flow to fund working capital, capital expenditures, acquisitions and investments and other general corporate purposes; |
• | Limit our flexibility in planning for, or reacting to, changes in our business and the markets in which we operate; |
• | Place us at a competitive disadvantage compared to our competitors that have less debt; and |
• | Limit, among other things, our ability to borrow additional funds on favorable terms or at all. |
The terms of the indentures governing our 6.375% senior notes due March 1, 2024 (the "2016 Senior Notes") and our 5.375% senior unsecured notes due December 15, 2021 (the "2013 Senior Notes"), and the credit agreement governing the 2012 Term Loan and 2012 ABL Revolver, allow us to issue and incur additional debt only upon satisfaction of the conditions set forth in those respective agreements. If new debt is added to current debt levels, the related risks described above could increase.
At March 31, 2018, we had $96.6 million of borrowing capacity available under the 2012 ABL Revolver to support our operating activities.
Our operating flexibility is limited in significant respects by the restrictive covenants in our senior credit facility and the indentures governing our senior notes.
Our senior credit facility and the indentures governing our senior notes impose restrictions that could impede our ability to enter into certain corporate transactions, as well as increase our vulnerability to adverse economic and industry conditions, by limiting our flexibility in planning for, and reacting to, changes in our business and industry. These restrictions limit our ability to, among other things:
• | Borrow money or issue guarantees; |
• | Pay dividends, repurchase stock from, or make other restricted payments to, stockholders; |
• | Make investments or acquisitions; |
• | Use assets as security in other transactions; |
• | Sell assets or merge with or into other companies; |
• | Enter into transactions with affiliates; |
• | Sell stock in our subsidiaries; and |
• | Direct our subsidiaries to pay dividends or make other payments to us. |
Our ability to engage in these types of transactions is generally limited by the terms of the senior credit facility and the indentures governing the senior notes, even if we believe that a specific transaction would positively contribute to our future growth, operating results or profitability.
In addition, our senior credit facility requires us to maintain certain leverage, interest coverage and fixed charge ratios. Although we believe we can continue to meet and/or maintain the financial covenants contained in our credit agreement, our ability to do so may be affected by events outside our control. Covenants in our senior credit facility also require us to use 100% of the proceeds we receive from debt issuances to repay outstanding borrowings under our senior credit facility. Any failure by us to comply with the terms and conditions of the credit agreement and the indentures governing the senior notes could result in an event of default, which may allow our creditors to accelerate our debt and therefore have a material adverse effect on our financial condition.
21
The senior credit facility and the indentures governing the senior notes contain cross-default provisions that could result in the acceleration of all of our indebtedness.
The senior credit facility and the indentures governing the senior notes contain provisions that allow the respective creditors to declare all outstanding borrowings under one agreement to be immediately due and payable as a result of a default under another agreement. Consequently, failure to make a payment required by the indentures governing the senior notes, among other things, may lead to an event of default under the senior credit facility. Similarly, an event of default or failure to make a required payment at maturity under the senior credit facility, among other things, may lead to an event of default under the indentures governing the senior notes. If the debt under the senior credit facility and indentures governing the senior notes were to both be accelerated, the aggregate amount immediately due and payable as of March 31, 2018 would have been approximately $2.0 billion. We presently do not have sufficient liquidity to repay these borrowings in the event they were to be accelerated, and we may not have sufficient liquidity in the future to do so. Additionally, we may not be able to borrow money from other lenders to enable us to refinance our indebtedness. At March 31, 2018, the book value of our current assets was $303.5 million. Although the book value of our total assets was $3,760.6 million, approximately $3,401.0 million was in the form of intangible assets, including goodwill of $620.1 million, a significant portion of which may not be available to satisfy our creditors in the event our debt is accelerated.
Any failure to comply with the restrictions of the senior credit facility, the indentures governing the senior notes or any other subsequent financing agreements may result in an event of default. Such default may allow the creditors to accelerate the related debt, as well as any other debt to which the cross-acceleration or cross-default provisions apply. In addition, the lenders may be able to terminate any commitments they had made to supply us with additional funding. As a result, any default by us under our credit agreement, indentures governing the senior notes or any other financing agreement could have a material adverse effect on our financial condition.
Litigation may adversely affect our business, financial condition and results of operations.
Our business is subject to the risk of, and from time to time in the ordinary course of business we are involved in, litigation by employees, customers, consumers, suppliers, competitors, regulators, stockholders or others through private actions, class actions, administrative proceedings, regulatory actions or other litigation. The outcome of litigation, particularly class action lawsuits and regulatory actions, is difficult to assess or quantify. Plaintiffs in these types of lawsuits may seek recovery of very large or indeterminate amounts, and the magnitude of the potential loss relating to such lawsuits may remain unknown for substantial periods of time. The cost to defend current and future litigation may be significant. There may also be adverse publicity associated with litigation that could decrease customer acceptance of our products, regardless of whether the allegations are valid or whether we are ultimately found liable. For example, although our marketing is evidence-based, consumers and competitors may challenge, and have challenged, certain of our marketing claims by alleging, among other things, false and misleading advertising with respect to advertising for certain of our products. Such challenges could result in our having to pay monetary damages or limit our ability to maintain current marketing claims. Conversely, we have, and may be required in the future to initiate litigation against others to protect the value of our intellectual property and the related goodwill or enforce an agreement or contract that has been breached. These matters may be time consuming and expensive, but may be necessary to protect our assets and realize the benefits of the agreements and contracts that we have negotiated. As a result, litigation may adversely affect our business, financial condition and results of operations.
The trading price of our common stock may be volatile.
The trading price of our common stock could be subject to significant fluctuations in response to several factors, some of which are beyond our control, including (i) general stock market volatility, (ii) variations in our quarterly operating results, (iii) our leveraged financial position, (iv) potential sales of additional shares of our common stock, (v) perceptions associated with the identification of material weaknesses in internal control over financial reporting, (vi) general trends in the consumer products industry, (vii) changes by securities analysts in their estimates or investment ratings, (viii) the relative illiquidity of our common stock, (ix) voluntary withdrawal or recall of products, (x) news regarding litigation in which we are or become involved, (xi) potential changes in demand for common stock related to the Company's inclusion in the S&P MidCap 400 index, and (xii) general marketplace conditions brought on by economic recession.
We have no current intention of paying dividends to holders of our common stock.
We presently intend to retain our earnings, if any, for use in our operations, to facilitate strategic acquisitions, to repurchase our common stock, or to repay our outstanding indebtedness and have no current intention of paying dividends to holders of our common stock. In addition, our debt instruments limit our ability to declare and pay cash dividends on our common stock. As a result, a shareholder's only opportunity to achieve a return on their investment in our common stock will be if the market price of our common stock appreciates and they sell their shares at a profit.
22
Our annual and quarterly results of operations may fluctuate significantly and could fall below the expectations of securities analysts and investors due to a number of factors, many of which are beyond our control, resulting in a decline in the price of our securities.
Our annual and quarterly results of operations may fluctuate significantly because of numerous factors, including:
• | The timing of when we make acquisitions or introduce new products; |
• | Our inability to increase the sales of our existing products and expand their distribution; |
• | The timing of the introduction or return to the market of competitive products and the introduction of store brand products; |
• | Inventory management resulting from consolidation among our customers; |
• | Adverse regulatory or market events in the United States or in our international markets; |
• | Changes in consumer preferences, spending habits and competitive conditions, including the effects of competitors’ operational, promotional or expansion activities; |
• | Seasonality of our products; |
• | Fluctuations in commodity prices, product costs, utilities and energy costs, prevailing wage rates, insurance costs and other costs; |
• | The discontinuation and return of our products from retailers; |
• | Our ability to recruit, train and retain qualified employees, and the costs associated with those activities; |
• | Changes in advertising and promotional activities and expansion to new markets; |
• | Negative publicity relating to us and the products we sell; |
• | Litigation matters; |
• | Unanticipated increases in infrastructure costs; |
• | Impairment of goodwill or long-lived assets; |
• | Changes in interest rates; and |
• | Changes in accounting, tax, regulatory or other rules applicable to our business. |
Our quarterly operating results and revenues may fluctuate as a result of any of these or other factors. Accordingly, results for any one quarter are not necessarily indicative of results to be expected for any other quarter or for any year, and revenues for any particular future period may decrease. In the future, operating results may fall below the expectations of securities analysts and investors. In that event, the market price of our outstanding securities could be adversely impacted.
Provisions in our amended and restated certificate of incorporation and Delaware law may discourage potential acquirers of our company, which could adversely affect the value of our securities.
Our amended and restated certificate of incorporation provides that our Board of Directors is authorized to issue from time to time, without further stockholder approval, up to five million shares of preferred stock in one or more series of preferred stock issuances. Our Board of Directors may establish the number of shares to be included in each series of preferred stock and determine, as applicable, the voting and other powers, designations, preferences, rights, qualifications, limitations and restrictions for such series of preferred stock. The shares of preferred stock could have preferences over our common stock with respect to dividends and liquidation rights. We may issue additional preferred stock in ways which may delay, defer or prevent a change in control of the Company without further action by our stockholders. The shares of preferred stock may be issued with voting rights that may
23
adversely affect the voting power of the holders of our common stock by increasing the number of outstanding shares having voting rights, and by the creation of class or series voting rights.
Our amended and restated certificate of incorporation, as amended, contains additional provisions that may have the effect of making it more difficult for a third party to acquire or attempt to acquire control of our company. In addition, we are subject to certain provisions of Delaware law that limit, in some cases, our ability to engage in certain business combinations with significant stockholders.
These provisions, either alone, or in combination with each other, give our current directors and executive officers the ability to significantly influence the outcome of a proposed acquisition of the Company. These provisions would apply even if an acquisition or other significant corporate transaction was considered beneficial by some of our stockholders. If a change in control or change in management is delayed or prevented by these provisions, the market price of our outstanding securities could be adversely impacted.
We rely significantly on information technology. Any inadequacy, interruption, theft or loss of data, malicious attack, integration failure, failure to maintain the security, confidentiality or privacy of sensitive data residing on our systems or other security failure of that technology could harm our ability to effectively operate our business and damage the reputation of our brands.
The Company relies extensively on information technology systems, some of which are managed by third-party service providers, to conduct its business. We rely on our information technology systems (some of which are outsourced to third parties) to manage the data, communications and business processes for all of our functions, including our marketing, sales, manufacturing, logistics, customer service, accounting and administrative functions. These systems include, but are not limited to, programs and processes relating to internal communications and communications with other parties, ordering and managing materials from suppliers, converting materials to finished products, shipping product to customers, billing customers and receiving and applying payment, processing transactions, summarizing and reporting results of operations, complying with regulatory, legal or tax requirements, collecting and storing customer, consumer, employee, investor, and other stakeholder information and personal data, and other processes necessary to manage the Company's business.
Increased information technology security threats and more sophisticated computer crime, including advanced persistent threats, pose a potential risk to the security of the information technology systems, networks, and services of the Company, its customers and other business partners, as well as the confidentiality, availability, and integrity of the data of the Company, its customers and other business partners. As a result, the Company's information technology systems, networks or service providers could be damaged or cease to function properly or the Company could suffer a loss or disclosure of business, personal or stakeholder information, due to any number of causes, including catastrophic events, power outages and security breaches. The Company has conducted regular security audits by an outside firm to address any potential service interruptions or vulnerabilities. However, if these plans do not provide effective protection, the Company may suffer interruptions in its ability to manage or conduct its operations, which may adversely affect its business. The Company may need to expend additional resources in the future to continue to protect against, or to address problems caused by, any business interruptions or data security breaches.
Any breach of our data security could result in an unauthorized release or transfer of customer, consumer, user or employee information, or the loss of valuable business data or cause a disruption in our business. These events could give rise to unwanted media attention, damage our reputation, damage our customer, consumer or user relationships and result in lost sales, fines or lawsuits or adversely impact the Company's results of operations and financial condition. We may also be required to expend significant capital and other resources to protect against or respond to or alleviate problems caused by a security breach. If we are unable to prevent material failures, our operations may be impacted, and we may suffer other negative consequences such as reputational damage, litigation, remediation costs and/or penalties under various data privacy laws and regulations.
Our information technology systems may be susceptible to disruptions.
We utilize information technology systems to improve the effectiveness of our operations and support our business, including systems to support financial reporting and an enterprise resource planning system. During post-production and future enterprise resource planning phases, we could be subject to transaction errors, processing inefficiencies and other business disruptions that could lead to the loss of revenue or inaccuracies in our financial information. The occurrence of these or other challenges could disrupt our information technology systems and adversely affect our operations.
Changes in our provision for income taxes or adverse outcomes resulting from examination of our income tax returns could adversely affect our results.
24
Our provision for income taxes is subject to volatility and could be adversely affected by several factors, some of which are outside of our control, including:
• | Changes in the income allocation methods for state taxes, and the determination of which states or countries have jurisdiction to tax our Company; |
• | An increase in non-deductible expenses for tax purposes, including certain stock-based compensation, executive compensation and impairment of goodwill; |
• | Transfer pricing adjustments; |
• | Tax assessments resulting from tax audits or any related tax interest or penalties that could significantly affect our income tax provision for the period in which the settlement takes place; |
• | A change in our decision to indefinitely reinvest foreign earnings; |
• | Tax liabilities from acquired businesses; |
• | Changes in accounting principles; and |
• | Changes in tax laws or related interpretations, accounting standards, regulations, and interpretations in multiple tax jurisdictions in which we operate. |
Significant judgment is required to determine the recognition and measurement of the attributes prescribed in Financial Accounting Standards Board ("FASB") Accounting Standards Codification ("ASC") 740. As a multinational corporation, we conduct our business in many countries and are subject to taxation in many jurisdictions. The taxation of our business is subject to the application of multiple and sometimes conflicting tax laws and regulations as well as multinational tax conventions. Our effective tax rate is dependent upon the availability of tax credits and carryforwards. The application of tax laws and regulations is subject to legal and factual interpretation, judgment and uncertainty. Tax laws themselves are subject to change as a result of changes in fiscal policy, changes in legislation, and the evolution of regulations and court rulings. Consequently, taxing authorities may impose tax assessments or judgments against us that could materially impact our tax liability and/or our effective income tax rate.
In addition, we may be subject to examination of our income tax returns by the Internal Revenue Service and other tax authorities. If tax authorities challenge the relative mix of our U.S. and international income, or successfully assert the jurisdiction to tax our earnings, our future effective income tax rates could be adversely affected.
The impacts of the Tax Cuts and Jobs Act ("Tax Act") could be materially different from our current estimates.
The Tax Act was signed into law in December 2017, which represents significant U.S. federal tax reform legislation that includes a permanent reduction to the U.S. federal corporate income tax rate. We expect the new law to significantly reduce our tax rate in future periods. In 2018, our tax provision reflects the benefit of the Federal tax rate reduction due to the one-time revaluation of our deferred tax liabilities and a charge related to the forced foreign repatriation tax. The changes included in the Tax Act are broad and complex. The final transitional impacts of the Tax Act may differ from the above estimate, possibly materially, due to, among other things, changes in interpretations of the Tax Act, any legislative action to address questions that arise because of the Tax Act, any changes in accounting standards for income taxes or related interpretations in response to the Tax Act, or any updates or changes to estimates we have utilized to calculate the transitional impacts. The Commission has issued guidance that allows for a measurement period of up to one year after the enactment date of the Tax Act to finalize the recording of the related tax impacts. We currently anticipate finalizing and recording any resulting adjustments by the end of the measurement period.
ITEM 1B. UNRESOLVED STAFF COMMENTS
None.
25
ITEM 2. PROPERTIES
Our corporate headquarters is located in Tarrytown, New York, a suburb of New York City. Primary functions performed at the Tarrytown facility include marketing, sales, operations, quality control, regulatory affairs, finance, information technology and legal. We believe our Tarrytown facility is adequate for these functions, and the lease expires on December 31, 2027.
We lease office space in Roger, Arkansas, primarily to perform sales functions, which expires on December 1, 2020. We also lease office space for a sales office in Northbrook, Illinois, which expires on January 31, 2022.
We lease office space located in Australia. Primary functions performed at that location include marketing, sales, operations, quality control, regulatory affairs, and finance. The lease for our Australia facility expires on April 30, 2022.
We lease an office in Germany where inventory and account management and invoicing are performed. This lease expires on January 31, 2019.
We lease an office in the UK that performs marketing, operations and finance functions for our UK business. The lease expires on July 29, 2021.
We also lease an office in Singapore, which expires on October 31, 2019, and a sales office in China, which lease expires on July 31, 2018. We plan to renew this lease through August 31, 2019.
In addition, we have a lease for office space in New Jersey which expires on February 11, 2021. This facility is currently being subleased, and the sublease expires on February 10, 2021.
As a result of the acquisition of Fleet, we own an office and manufacturing facility in Lynchburg, Virginia.
All of our facilities serve the North American OTC Healthcare, International OTC Healthcare, and Household Cleaning segments.
ITEM 3. LEGAL PROCEEDINGS
We are involved from time to time in routine legal matters and other claims incidental to our business. We review outstanding claims and proceedings internally and with external counsel as necessary to assess probability and amount of potential loss. These assessments are re-evaluated at each reporting period and as new information becomes available to determine whether a reserve should be established or if any existing reserve should be adjusted. The actual cost of resolving a claim or proceeding ultimately may be substantially different than the amount of the recorded reserve. In addition, because it is not permissible under GAAP to establish a litigation reserve until the loss is both probable and estimable, in some cases there may be insufficient time to establish a reserve prior to the actual incurrence of the loss (upon verdict and judgment at trial, for example, or in the case of a quickly negotiated settlement). We believe the resolution of routine matters and other incidental claims, taking our reserves into account, will not have a material adverse effect on our business, financial condition or results of operations.
ITEM 4. MINE SAFETY DISCLOSURES
None.
26
Part II
ITEM 5. MARKET FOR REGISTRANT'S COMMON EQUITY, RELATED STOCKHOLDER MATTERS AND ISSUER PURCHASES OF EQUITY SECURITIES
Market Information
Our common stock is listed on The New York Stock Exchange (“NYSE”) under the symbol “PBH.” The high and low sales prices of our common stock as reported by the NYSE for the two most recently completed fiscal years on a quarterly basis and the current year through May 4, 2018 are as follows:
High | Low | |||||||
Year Ending March 31, 2019 | ||||||||
April 1, 2018 - May 4, 2018 | $ | 34.38 | $ | 27.87 | ||||
Year Ending March 31, 2018 | ||||||||
Quarter Ended: | ||||||||
June 30, 2017 | $ | 59.63 | $ | 48.96 | ||||
September 30, 2017 | 53.90 | 48.23 | ||||||
December 31, 2017 | 51.80 | 40.11 | ||||||
March 31, 2018 | 46.44 | 32.46 | ||||||
Year Ending March 31, 2017 | ||||||||
Quarter Ended: | ||||||||
June 30, 2016 | $ | 58.09 | $ | 51.68 | ||||
September 30, 2016 | 57.34 | 46.21 | ||||||
December 31, 2016 | 52.89 | 44.64 | ||||||
March 31, 2017 | 58.08 | 51.02 | ||||||
Holders
As of May 4, 2018, there were 36 holders of record of our common stock. The number of record holders does not include beneficial owners whose shares are held in the names of banks, brokers, nominees or other fiduciaries.
Dividend Policy
Common Stock
We have not in the past paid, and do not expect for the foreseeable future to pay, cash dividends on our common stock. Instead, we anticipate that all of our earnings in the foreseeable future will be used in our operations, to facilitate strategic acquisitions, to repurchase our common stock, or to pay down our outstanding indebtedness. Any future determination to pay dividends will be at the discretion of our Board of Directors and will depend, among other factors, on our results of operations, financial condition, capital requirements and contractual restrictions limiting our ability to declare and pay cash dividends, including restrictions under our 2012 Term Loan and the indentures governing our senior notes, and any other considerations our Board of Directors deems relevant.
Part III, Item 12 "Security Ownership of Certain Beneficial Owners and Management and Related Stockholder Matters" of this Annual Report on Form 10-K is incorporated herein by reference.
27
PERFORMANCE GRAPH
The following graph (“Performance Graph”) compares our cumulative total stockholder return since March 31, 2013, with the cumulative total stockholder return for the Standard & Poor's MidCap 400 Index, the Russell 2000 Index and our peer group index. The Company is included in each of the Standard & Poor's MidCap 400 Index and the Russell 2000 Index. The Performance Graph assumes that the value of the investment in the Company’s common stock and each index was $100.00 on March 31, 2013. The Performance Graph was also prepared based on the assumption that all dividends paid, if any, were reinvested. The Peer Group Index is a self-constructed peer group consisting of companies in the consumer products industry with comparable revenues and market capitalization, from which the Company has been excluded.
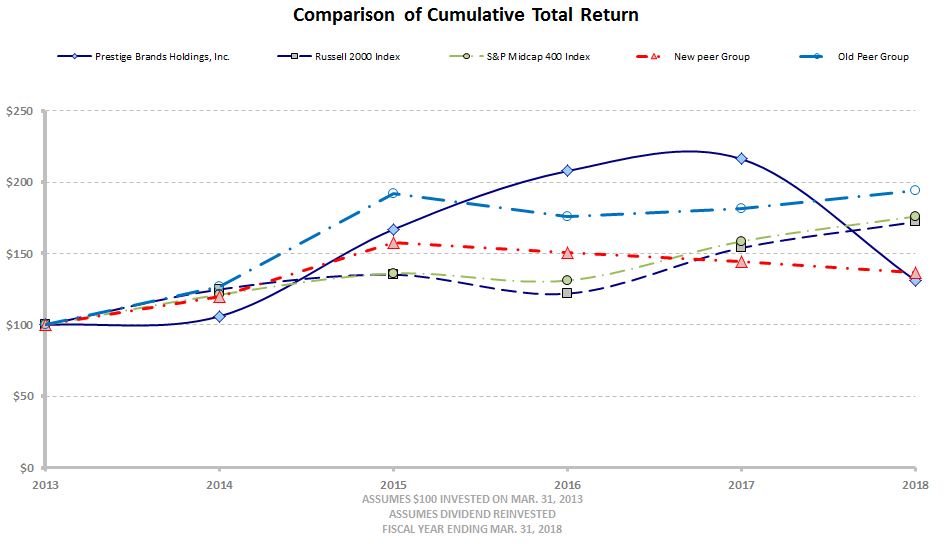
March 31, | |||||||||||||||||||||||
Company/Market/Peer Group | 2013 | 2014 | 2015 | 2016 | 2017 | 2018 | |||||||||||||||||
Prestige Brands Holdings, Inc. | $ | 100.00 | $ | 106.07 | $ | 166.95 | $ | 207.82 | $ | 216.27 | $ | 131.26 | |||||||||||
Russell 2000 Index | 100.00 | 124.90 | 135.15 | 121.96 | 153.94 | 172.09 | |||||||||||||||||
S&P MidCap 400 Index | 100.00 | 121.24 | 136.03 | 131.14 | 158.57 | 175.97 | |||||||||||||||||
New Peer Group Index (1) | 100.00 | 119.98 | 157.68 | 150.83 | 144.68 | 136.53 | |||||||||||||||||
Old Peer Group Index (2) | 100.00 | 126.65 | 192.01 | 175.94 | 181.78 | 194.19 | |||||||||||||||||
(1) | The New Peer Group Index is a self-constructed peer group consisting of companies in the consumer products industry with comparable revenues and market capitalization, from which the Company has been excluded. The new peer group index is comprised of: (i) B&G Food Holdings Corp., (ii) Hain Celestial Group, Inc., (iii) Church & Dwight Co., Inc., (iv) Helen of Troy, Ltd., (v) Vista Outdoor, (vi) Impax Laboratories, Inc., (vii) Revlon, Inc., (viii) Lancaster Colony Corp, (ix) Edgewell Personal Care Company, (x) Energizer Holdings, Inc. and (xi) Calavo Growers, Inc. |
(2) | The Old Peer Group Index is a self-constructed peer group consisting of companies in the consumer products industry with comparable revenues and market capitalization, from which the Company has been excluded. The old peer group index is comprised of: (i) B&G Food Holdings Corp., (ii) Hain Celestial Group, Inc., (iii) Church & Dwight Co., Inc., (iv) Helen of Troy, Ltd., (v) Monster Beverage Corp., (vi) Impax Laboratories, Inc., (vii) Snyders-Lance Inc., (viii) Revlon, Inc., (ix) Lancaster Colony Corp, (x) Akorn, Inc., (xi) Edgewell Personal Care Company, (xii) Energizer Holdings, Inc. and (xiii) Calavo Growers, Inc. |
28
The Performance Graph shall not be deemed incorporated by reference by any general statement incorporating by reference this Annual Report on Form 10-K into any filing under the Securities Act or the Exchange Act, except to the extent that we specifically incorporate this information by reference, and shall not otherwise be deemed filed under such Acts.
29
ITEM 6. SELECTED FINANCIAL DATA
The following table furnishes selected consolidated financial data for the five years ended March 31, 2018. This selected consolidated financial data should be read together with "Management's Discussion and Analysis of Financial Condition and Results of Operations" and our Consolidated Financial Statements and related notes thereto included elsewhere in this Annual Report on Form 10-K.
(In thousands, except per share data) | Year Ended March 31, | ||||||||||||||||||
2018 | 2017 | 2016 | 2015 | 2014 | |||||||||||||||
Income Statement Data | |||||||||||||||||||
Total revenues | $ | 1,041,179 | $ | 882,060 | $ | 806,247 | $ | 714,623 | $ | 597,381 | |||||||||
Cost of Sales | |||||||||||||||||||
Cost of sales excluding depreciation | 459,676 | 381,333 | 339,036 | 308,400 | 261,830 | ||||||||||||||
Cost of sales depreciation | 4,998 | 441 | — | — | — | ||||||||||||||
Cost of sales (1) | 464,674 | 381,774 | 339,036 | 308,400 | 261,830 | ||||||||||||||
Gross profit | 576,505 | 500,286 | 467,211 | 406,223 | 335,551 | ||||||||||||||
Advertising and promotion (2) | 147,286 | 128,359 | 110,802 | 99,651 | 84,968 | ||||||||||||||
General and administrative (3) | 85,001 | 89,143 | 72,418 | 81,273 | 48,481 | ||||||||||||||
Depreciation and amortization | 28,428 | 25,351 | 23,676 | 17,740 | 13,486 | ||||||||||||||
Loss on divestitures | — | 51,820 | — | — | — | ||||||||||||||
Tradename impairment | 99,924 | — | — | — | — | ||||||||||||||
Interest expense, net (4) | 105,879 | 93,343 | 85,160 | 81,234 | 68,582 | ||||||||||||||
Gain on sale of asset | — | — | — | (1,133 | ) | — | |||||||||||||
Loss on extinguishment of debt | 2,901 | 1,420 | 17,970 | — | 18,286 | ||||||||||||||
Income before income taxes | 107,086 | 110,850 | 157,185 | 127,458 | 101,748 | ||||||||||||||
(Benefit) provision for income taxes | (232,484 | ) | 41,455 | 57,278 | 49,198 | 29,133 | |||||||||||||
Net Income | $ | 339,570 | $ | 69,395 | $ | 99,907 | $ | 78,260 | $ | 72,615 | |||||||||
Earnings Per Share: | |||||||||||||||||||
Basic | $ | 6.40 | $ | 1.31 | $ | 1.89 | $ | 1.50 | $ | 1.41 | |||||||||
Diluted | $ | 6.34 | $ | 1.30 | $ | 1.88 | $ | 1.49 | $ | 1.39 | |||||||||
Weighted average shares outstanding: | |||||||||||||||||||
Basic | 53,099 | 52,976 | 52,754 | 52,170 | 51,641 | ||||||||||||||
Diluted | 53,526 | 53,362 | 53,143 | 52,670 | 52,349 | ||||||||||||||
Other comprehensive income (loss) | 7,037 | (2,827 | ) | (113 | ) | (24,151 | ) | 843 | |||||||||||
Comprehensive income | $ | 346,607 | $ | 66,568 | $ | 99,794 | $ | 54,109 | $ | 73,458 | |||||||||
30
Year Ended March 31, | |||||||||||||||||||
Other Financial Data | 2018 | 2017 | 2016 | 2015 | 2014 | ||||||||||||||
Capital expenditures | $ | 12,532 | $ | 2,977 | $ | 3,568 | $ | 6,101 | $ | 2,764 | |||||||||
Cash provided by (used in): | |||||||||||||||||||
Operating activities (5) | 210,110 | 148,672 | 176,310 | 157,585 | 113,232 | ||||||||||||||
Investing activities | (11,562 | ) | (694,595 | ) | (222,971 | ) | (805,258 | ) | (57,976 | ) | |||||||||
Financing activities (5) | (208,955 | ) | 560,957 | 52,076 | 641,935 | (42,803 | ) | ||||||||||||
March 31, | |||||||||||||||||||
Balance Sheet Data | 2018 | 2017 | 2016 | 2015 | 2014 | ||||||||||||||
Cash and cash equivalents | $ | 32,548 | $ | 41,855 | $ | 27,230 | $ | 21,318 | $ | 28,331 | |||||||||
Total assets | 3,760,612 | 3,911,348 | 2,948,791 | 2,641,967 | 1,773,773 | ||||||||||||||
Total long-term debt, including current maturities | 2,013,000 | 2,222,000 | 1,652,500 | 1,593,600 | 937,500 | ||||||||||||||
Stockholders’ equity | 1,178,610 | 822,549 | 744,336 | 627,624 | 563,360 | ||||||||||||||
(1) | For 2018, 2017, 2016, 2015 and 2014, cost of sales included $3.7 million, $3.0 million, $1.4 million, $2.2 million and $0.6 million, respectively, of charges related to inventory step-up and other costs associated with acquisitions. |
(2) | For 2018 and 2017, advertising and promotion expense included a credit of $0.2 million and a charge of $2.2 million, respectively, related to the integration of the Fleet acquisition. |
(3) | For 2018, 2017, 2016, 2015, and 2014, general and administrative expense included $2.7 million, $16.0 million, $2.4 million, $13.9 million, and $1.1 million, respectively, of costs related to acquisitions. For 2018, general and administrative expense also includes a tax adjustment associated with acquisitions of $0.7 million. For 2016, an additional $1.4 million of costs associated with a Chief Executive Officer transition was included in general and administrative expense. |
(4) | For 2018, interest expense, net included $0.4 million of accelerated amortization of debt costs associated with funds received from the repatriation of foreign earnings used to pay down debt and $0.3 million of additional interest expense as a result of the Term Loan refinancing. For 2017, interest expense, net included $8.3 million of bank commitment fees related to the recently acquired Fleet business. |
(5) | In accordance with Accounting Standards Update ("ASU") 2016-09, Compensation - Stock Compensation (Topic 718), we have reclassified cash flows related to excess tax benefits from share-based awards from a financing activity to an operating activity. The reclassification was not material. |
31
ITEM 7. MANAGEMENT'S DISCUSSION AND ANALYSIS OF FINANCIAL CONDITION AND RESULTS OF OPERATIONS
The following discussion of our financial condition and results of operations should be read together with the “Selected Financial Data” and the Consolidated Financial Statements and related notes included elsewhere in this Annual Report on Form 10-K. This discussion and analysis may contain forward-looking statements that involve certain risks, assumptions and uncertainties that could cause actual results to differ materially from those implied or described by the forward-looking statements. Future results could differ materially from the discussion that follows for many reasons, including the factors described in Part I, Item 1A. “Risk Factors” in this Annual Report on Form 10-K, as well as those described in future reports filed with the SEC.
General
We are engaged in the development, manufacturing, marketing, sales and distribution of well-recognized, brand name OTC healthcare and household cleaning products to mass merchandisers and drug, food, dollar, convenience, and club stores in North America (the United States and Canada) and in Australia and certain other international markets. We use the strength of our brands, our established retail distribution network, a low-cost operating model and our experienced management team to create our competitive advantage.
We have grown our product portfolio both organically and through acquisitions. We develop our existing brands by investing in new product lines, brand extensions and strong advertising support. Acquisitions of OTC brands have also been an important part of our growth strategy. We have acquired strong and well-recognized brands from consumer products, pharmaceutical and private equity companies. While certain of these brands have long histories of brand development and investment, we believe that, at the time we acquired them, most were considered “non-core” by their previous owners. As a result, these acquired brands did not benefit from adequate management focus and marketing support during the period prior to their acquisition, which created opportunities for us to reinvigorate these brands and improve their performance post-acquisition. After adding a core brand to our portfolio, we seek to increase its sales, market share and distribution in both existing and new channels through our established retail distribution network. We pursue this growth through increased spending on advertising and promotional support, new sales and marketing strategies, improved packaging and formulations and innovative development of brand extensions.
Tax Reform
On December 22, 2017, the U.S. government enacted comprehensive tax legislation commonly referred to as the Tax Cuts and Jobs Act ("Tax Act"). The Tax Act represents significant U.S. federal tax reform legislation that includes a permanent reduction to the U.S. federal corporate income tax rate. The permanent reduction to the federal corporate income tax rate resulted in a one-time gain of $267.0 million related to the value of our deferred tax liabilities and a gain of $3.2 million related to the lower blended tax rate on our current year earnings, resulting in a net gain of $270.2 million. Additionally, the tax reform legislation subjects certain of our cumulative foreign earnings and profits to U.S. income taxes through a deemed repatriation, which resulted in a charge of $1.9 million during 2018.
The changes included in the Tax Act are broad and complex. The final transition impacts of the Tax Act may differ from the above estimate, possibly materially, due to, among other things, changes in interpretations of the Tax Act, any legislative action to address questions that arise because of the Tax Act, any changes in accounting standards for income taxes or related interpretations in response to the Tax Act, or any updates or changes to estimates the Company has utilized to calculate the transition impacts, including impacts from changes to current year earnings estimates and foreign exchange rates of foreign subsidiaries. The U.S. Securities and Exchange Commission has issued rules that would allow for a measurement period of up to one year after the enactment date of the Tax Act to finalize the recording of the related tax impacts.
Acquisitions
Acquisition of Fleet
On January 26, 2017, the Company completed the acquisition of Fleet pursuant to the Agreement and Plan of Merger, dated as of December 22, 2016, for $823.7 million plus cash on hand at closing and subject to certain adjustments related to net working capital. The purchase price was funded by available cash on hand, additional borrowings under the 2012 ABL Revolver, and a new $740.0 million senior secured incremental term loan under the 2012 Term Loan. As a result of the merger, we acquired women's health, gastrointestinal and dermatological care OTC brands, including Summer’s Eve, Fleet, and Boudreaux's Butt Paste, as well as a “mix and fill” manufacturing facility in Lynchburg, Virginia. The financial results from the Fleet acquisition are included in the Company's North American and International OTC Healthcare segments.
Acquisition of DenTek
On February 5, 2016, the Company completed the acquisition of DenTek, a privately-held marketer and distributor of specialty oral care products. The closing was finalized pursuant to the terms of the merger agreement, announced November 23, 2015, under which the Company agreed to acquire DenTek from its stockholders for a purchase price of $226.9 million. The acquisition
32
expanded the Company's portfolio of brands, strengthened its existing oral care platform and increased its geographic reach in parts of Europe. The Company financed the transaction with a combination of available cash on hand, available cash from its 2012 ABL Revolver, and financing of an additional unsecured bridge loan. The DenTek brands are included in our North American and International OTC Healthcare segments.
Acquisition of Insight Pharmaceuticals
On September 3, 2014, the Company completed the acquisition of Insight Pharmaceuticals Corporation ("Insight"), a marketer and distributor of feminine care and other OTC healthcare products, for $745.9 million in cash after receiving a return of approximately $7.2 million from escrow related to an arbitrator's ruling. The closing followed the FTC approval of the acquisition and was finalized pursuant to the terms of the purchase agreement announced on April 25, 2014. Pursuant to the Insight purchase agreement, the Company acquired 27 OTC brands sold in North America (including related tradenames, contracts and inventory), which extended the Company's portfolio of OTC brands to include a leading feminine care platform in the United States and Canada anchored by Monistat, the leading North American brand in OTC yeast infection treatment. The acquisition also added brands to the Company's cough & cold, pain relief, ear care and dermatological platforms. In connection with the FTC's approval of the Insight acquisition, we sold one of the competing brands that we acquired from Insight on the same day as the Insight closing. Insight is primarily included in our North American OTC Healthcare segment.
Acquisition of the Hydralyte brand
On April 30, 2014, we completed the acquisition of the Hydralyte brand in Australia and New Zealand from The Hydration Pharmaceuticals Trust of Victoria, Australia, which was funded through a combination of cash on hand and our existing senior secured credit facility.
Hydralyte is the leading OTC brand in oral rehydration in Australia and is marketed and sold through our Care Pharma subsidiary. Hydralyte is available in pharmacies in multiple forms and is indicated for oral rehydration following diarrhea, vomiting, fever, heat and other ailments. Hydralyte is included in our International OTC Healthcare segment.
Divestitures and Sale of License Rights
On July 7, 2016, we completed the sale of the Pediacare®, New Skin® and Fiber Choice® brands for $40.0 million plus the cost of inventory. During the year ended March 31, 2017, we recorded a pre-tax loss on sale of $56.2 million. The proceeds were used to repay debt and related income taxes due on the dispositions.
Concurrent with the completion of the sale of these brands, we entered into a transitional services agreement with the buyer, whereby we agreed to provide the buyer with various services, including marketing, operations, finance and other services, from the date of the acquisition through January 7, 2017. We also entered into an option agreement with the buyer to purchase Dermoplast® at a specified earnings multiple as defined in the option agreement. The buyer paid a $1.25 million deposit for this option in September 2016 and later notified us of its election to exercise the option. In December 2016, we completed the sale of the Dermoplast® brand, and in a separate transaction, the e.p.t® brand, for an aggregate amount of $59.6 million. As a result, we recorded a pre-tax net gain on these divestitures of $3.9 million.
Historically, we received royalty income from the licensing of the names of certain of our brands in geographic areas or markets in which we do not directly compete. We have had royalty agreements for our Comet brand for several years, which included options on behalf of the licensee to purchase license rights in certain geographic areas and markets in perpetuity. In December 2014, we amended these agreements and we sold rights to use of the Comet brand in certain Eastern European countries to a third-party licensee in exchange for $10.0 million as a partial early buyout of the license. The amended agreement provided that we would continue to receive royalty payments of $1.0 million per quarter for the remaining geographic areas and also granted the licensee an option to acquire the license rights in the remaining geographic areas any time after June 30, 2016. In July 2016, the licensee elected to exercise its option. In August 2016, we received $11.0 million for the purchase of the remaining license rights and, as a result, we recorded a pre-tax gain of $1.2 million and reduced our indefinite-lived tradenames by $9.0 million. Furthermore, the licensee is no longer required to make additional royalty payments to us, and as a result, our royalty income was reduced accordingly.
Critical Accounting Policies and Estimates
Our significant accounting policies are described in the notes to the Consolidated Financial Statements included elsewhere in this Annual Report on Form 10-K. While all significant accounting policies are important to our Consolidated Financial Statements, certain of these policies may be viewed as being critical. Such policies are those that are both most important to the portrayal of our financial condition and results of operations and require our most difficult, subjective and complex estimates and assumptions that affect the reported amounts of assets, liabilities, revenues, expenses or the related disclosure of contingent assets and liabilities. These estimates are based on our historical experience and on various other assumptions that we believe to be reasonable
33
under the circumstances. Actual results may differ materially from these estimates. The most critical accounting policies are as follows:
Revenue Recognition
We recognize revenue when the following revenue recognition criteria are met: (i) persuasive evidence of an arrangement exists; (ii) the selling price is fixed or determinable; (iii) the product has been shipped and the customer takes ownership and assumes the risk of loss; and (iv) collection of the resulting receivable is reasonably assured. We have determined that these criteria are met and the transfer of risk of loss generally occurs when product is received by the customer, and, accordingly, we recognize revenue at that time. Provisions are made for estimated discounts related to customer payment terms and estimated product returns at the time of sale based on our historical experience.
As is customary in the consumer products industry, we participate in the promotional programs of our customers to enhance the sale of our products. The cost of these promotional programs varies based on the actual number of units sold during a finite period of time. These promotional programs consist of direct-to-consumer incentives, such as coupons and temporary price reductions, as well as incentives to our customers, such as allowances for new distribution, including slotting fees, and cooperative advertising. Estimates of the costs of these promotional programs are based on (i) historical sales experience, (ii) the current promotional offering, (iii) forecasted data, (iv) current market conditions, and (v) communication with customer purchasing/marketing personnel. We recognize the cost of such sales incentives by recording an estimate of such cost as a reduction of revenue, at the later of (a) the date the related revenue is recognized, or (b) the date when a particular sales incentive is offered. At the completion of the promotional program, these estimated amounts are adjusted to actual amounts.
We also periodically run coupon programs in newspaper inserts, on our product websites, or as on-package coupons. We utilize a national clearing house to process coupons redeemed by customers. At the time a coupon is distributed, a provision is made based upon historical redemption rates for that particular product, information provided as a result of the clearing house’s experience with coupons of similar dollar value, the length of time the coupon is valid, and the seasonality of the coupon drop, among other factors. The amount recorded against revenues and accrued for these events during 2018, 2017 and 2016 was $8.0 million, $7.3 million and $5.6 million, respectively. Cash settlement of coupon redemptions during 2018, 2017 and 2016 was $6.2 million, $4.6 million and $3.5 million, respectively.
Allowances for Product Returns
Due to the nature of the consumer products industry, we are required to estimate future product returns. Accordingly, we record an estimate of product returns concurrent with recording sales. Such estimates are made after analyzing (i) historical return rates, (ii) current economic trends, (iii) changes in customer demand, (iv) product acceptance, (v) seasonality of our product offerings, and (vi) the impact of changes in product formulation, packaging and advertising.
Lower of Cost or Net Realizable Value for Obsolete and Damaged Inventory
We value our inventory at the lower of cost or net realizable value. Accordingly, we reduce our inventories for the diminution of value resulting from product obsolescence, damage or other issues affecting marketability, equal to the difference between the cost of the inventory and its estimated net realizable value. Factors utilized in the determination of estimated net realizable value include (i) current sales data and historical return rates, (ii) estimates of future demand, (iii) competitive pricing pressures, (iv) new product introductions, (v) product expiration dates, and (vi) component and packaging obsolescence.
Many of our products are subject to expiration dating. As a general rule, our customers will not accept goods with expiration dating of less than 12 months from the date of delivery. To monitor this risk, management utilizes a detailed compilation of inventory with expiration dating between zero and 15 months and reserves for 100% of the cost of any item with expiration dating of 12 months or less. Inventory obsolescence costs charged to operations for 2018, 2017, and 2016 were $1.0 million, $4.6 million and $2.6 million, respectively, or 0.1%, 0.5% and 0.3%, respectively, of net sales.
Pension Expense
Certain employees of C.B. Fleet Company, Inc. ("Fleet") are covered by defined benefit pension plans. The Company’s policy is to contribute at least the minimum amount required under The Employee Retirement Income Security Act of 1974 ("ERISA"). The Company may elect to make additional contributions. Benefits are based on years of service and levels of compensation. On December 16, 2014, the decision was made to freeze the benefits under the Company's U.S. qualified defined benefit pension plan with an effective date of March 1, 2015.
The funded status of our pension plans is dependent upon many factors, including returns on invested assets and the level of certain market interest rates. We review pension assumptions regularly and we may from time to time make voluntary contributions to our pension plans that exceed the amounts required by statute. During fiscal 2018, we made total pension contributions to our
34
pension plans of $0.4 million. Changes in interest rates and the market value of the securities held by the plans could materially change, positively or negatively, the funded status of the plans and affect the level of pension expense and required contributions.
Our discount rate assumption for our defined benefit plans changed to 3.93% to 4.07% at March 31, 2018 from 3.92% to 4.21% at March 31, 2017. While we do not currently anticipate a change in our fiscal 2019 assumptions, as a sensitivity measure, a 0.25% decline or increase in our qualified discount rate would increase or decrease our qualified pension expense by less than $0.1 million. Similarly, a 0.25% decrease or increase in the expected return on our pension plan assets would increase or decrease our qualified pension expense by approximately $0.1 million. We expect to make a contribution of $1.0 million to our qualified defined benefit pension plan during fiscal 2019.
Valuation of Intangible Assets and Goodwill
Goodwill and intangible assets amounted to $3,401.0 million and $3,518.9 million at March 31, 2018 and 2017, respectively. At March 31, 2018 and 2017, goodwill and intangible assets were apportioned among similar product groups within our three operating segments as follows:
March 31, 2018 | |||||||||||||||
(In thousands) | North American OTC Healthcare | International OTC Healthcare | Household Cleaning | Consolidated | |||||||||||
Goodwill | $ | 580,934 | $ | 32,919 | $ | 6,245 | $ | 620,098 | |||||||
Intangible assets, net | |||||||||||||||
Indefinite-lived: | |||||||||||||||
Analgesics | 308,204 | — | — | 308,204 | |||||||||||
Cough & Cold | 138,946 | 19,291 | — | 158,237 | |||||||||||
Women's Health | 987,300 | 1,691 | — | 988,991 | |||||||||||
Gastrointestinal | 378,739 | 61,025 | — | 439,764 | |||||||||||
Eye & Ear Care | 172,319 | — | — | 172,319 | |||||||||||
Dermatologicals | 148,990 | 1,999 | — | 150,989 | |||||||||||
Oral Care | 241,238 | — | — | 241,238 | |||||||||||
Other OTC | — | — | — | — | |||||||||||
Household Cleaning | — | — | 30,561 | 30,561 | |||||||||||
Total indefinite-lived intangible assets, net | 2,375,736 | 84,006 | 30,561 | 2,490,303 | |||||||||||
Finite-lived: | |||||||||||||||
Analgesics | 36,849 | 1,850 | — | 38,699 | |||||||||||
Cough & Cold | 23,402 | 567 | — | 23,969 | |||||||||||
Women's Health | 46,403 | 1,669 | — | 48,072 | |||||||||||
Gastrointestinal | 42,506 | 1,013 | — | 43,519 | |||||||||||
Eye & Ear Care | 25,102 | — | — | 25,102 | |||||||||||
Dermatologicals | 44,000 | — | — | 44,000 | |||||||||||
Oral Care | 34,248 | 969 | — | 35,217 | |||||||||||
Other OTC | 12,846 | — | — | 12,846 | |||||||||||
Household Cleaning | — | — | 19,189 | 19,189 | |||||||||||
Total finite-lived intangible assets, net | 265,356 | 6,068 | 19,189 | 290,613 | |||||||||||
Total intangible assets, net | 2,641,092 | 90,074 | 49,750 | 2,780,916 | |||||||||||
Total goodwill and intangible assets, net | $ | 3,222,026 | $ | 122,993 | $ | 55,995 | $ | 3,401,014 | |||||||
35
March 31, 2017 | |||||||||||||||
(In thousands) | North American OTC Healthcare | International OTC Healthcare | Household Cleaning | Consolidated | |||||||||||
Goodwill | $ | 576,453 | $ | 32,554 | $ | 6,245 | $ | 615,252 | |||||||
Intangible assets, net | |||||||||||||||
Indefinite-lived: | |||||||||||||||
Analgesics | 308,204 | — | — | 308,204 | |||||||||||
Cough & Cold | 138,946 | 19,188 | — | 158,134 | |||||||||||
Women's Health | 987,300 | 1,682 | — | 988,982 | |||||||||||
Gastrointestinal | 407,339 | 60,700 | — | 468,039 | |||||||||||
Eye & Ear Care | 172,319 | — | — | 172,319 | |||||||||||
Dermatologicals | 148,990 | 1,988 | — | 150,978 | |||||||||||
Oral Care | 241,238 | — | — | 241,238 | |||||||||||
Other OTC | — | — | — | — | |||||||||||
Household Cleaning | — | — | 101,261 | 101,261 | |||||||||||
Total indefinite-lived intangible assets, net | 2,404,336 | 83,558 | 101,261 | 2,589,155 | |||||||||||
Finite-lived: | |||||||||||||||
Analgesics | 39,375 | 2,047 | — | 41,422 | |||||||||||
Cough & Cold | 26,320 | 605 | — | 26,925 | |||||||||||
Women's Health | 49,617 | 1,820 | — | 51,437 | |||||||||||
Gastrointestinal | 44,756 | 1,088 | — | 45,844 | |||||||||||
Eye & Ear Care | 26,808 | — | — | 26,808 | |||||||||||
Dermatologicals | 49,258 | — | — | 49,258 | |||||||||||
Oral Care | 37,146 | 908 | — | 38,054 | |||||||||||
Other OTC | 13,776 | — | — | 13,776 | |||||||||||
Household Cleaning | — | — | 20,934 | 20,934 | |||||||||||
Total finite-lived intangible assets, net | 287,056 | 6,468 | 20,934 | 314,458 | |||||||||||
Total intangible assets, net | 2,691,392 | 90,026 | 122,195 | 2,903,613 | |||||||||||
Total goodwill and intangible assets, net | $ | 3,267,845 | $ | 122,580 | $ | 128,440 | $ | 3,518,865 | |||||||
Goodwill increased by $4.8 million in 2018 primarily due to a measurement period adjustment recorded during the current year associated with our Fleet acquisition.
The decrease in the indefinite-lived intangible assets of $98.9 million for 2018 was primarily due to impairment charges related to our Beano and Comet brands of $28.6 million and $70.7 million, respectively, as discussed under "Impairment Analysis", below.
The decrease in the finite-lived intangible assets of $23.8 million for 2018 was primarily due to the amortization expense of $23.3 million and the write-off of the Massengill brand of $0.6 million, as discussed under "Impairment Analysis", below.
At March 31, 2018, our highest valued brands were Monistat, Summer's Eve, BC/Goody's, Fleet and DenTek, comprising 61.1% of the intangible assets value within the OTC Healthcare segments. The Comet, Chore Boy, and Spic and Span brands comprised all of the intangible assets value within the Household Cleaning segment.
Goodwill and intangible assets comprise substantially all of our assets. Goodwill represents the excess of the purchase price over the fair value of assets acquired and liabilities assumed in a business combination. Intangible assets generally represent our tradenames, brand names and patents. When we acquire a brand, we are required to make judgments regarding the value assigned to the associated intangible assets, as well as their respective useful lives. Management considers many factors both prior to and
36
after the acquisition of an intangible asset in determining the value, as well as the useful life, assigned to each intangible asset that we acquire or continue to own and promote.
The most significant factors are:
• | Brand History |
A brand that has been in existence for a long period of time (e.g., 25, 50 or 100 years) generally warrants a higher valuation and longer life (sometimes indefinite) than a brand that has been in existence for a very short period of time. A brand that has been in existence for an extended period of time generally has been the subject of considerable investment by its previous owner(s) to support product innovation and advertising and promotion.
• | Market Position |
Consumer products that rank number one or two in their respective market generally have greater name recognition and are known as quality product offerings, which warrant a higher valuation and longer life than products that lag in the marketplace.
• | Recent and Projected Sales Growth |
Recent sales results present a snapshot as to how the brand has performed in the most recent time periods and represent another factor in the determination of brand value. In addition, projected sales growth provides information about the strength and potential longevity of the brand. A brand that has both strong current and projected sales generally warrants a higher valuation and a longer life than a brand that has weak or declining sales. Similarly, consideration is given to the potential investment, in the form of advertising and promotion, required to reinvigorate a brand that has fallen from favor.
• | History of and Potential for Product Extensions |
Consideration is given to the product innovation that has occurred during the brand’s history and the potential for continued product innovation that will determine the brand’s future. Brands that can be continually enhanced by new product offerings generally warrant a higher valuation and longer life than a brand that has always “followed the leader”.
After consideration of the factors described above, as well as current economic conditions and changing consumer behavior, management prepares a determination of an intangible asset’s value and useful life based on its analysis. Under accounting guidelines, goodwill is not amortized, but must be tested for impairment annually, or more frequently if an event occurs or circumstances change that would more likely than not reduce the fair value of the reporting unit below the carrying amount. In a similar manner, indefinite-lived assets are not amortized. They are also subject to an annual impairment test, or more frequently if events or changes in circumstances indicate that the asset may be impaired. Additionally, at each reporting period an evaluation must be made to determine whether events and circumstances continue to support an indefinite useful life. Intangible assets with finite lives are amortized over their respective estimated useful lives and must also be tested for impairment whenever events or changes in circumstances indicate that the carrying value of the asset may not be recoverable and exceeds its fair value.
On an annual basis, during the fourth fiscal quarter, or more frequently if conditions indicate that the carrying value of the asset may not be recovered, management performs a review of both the values and, if applicable, useful lives assigned intangible assets and tests for impairment.
We report goodwill and indefinite-lived intangible assets in three reportable segments: North American OTC Healthcare, International OTC Healthcare and Household Cleaning. We identify our reporting units in accordance with the FASB ASC Subtopic 280. The carrying value and fair value for intangible assets and goodwill for a reporting unit are calculated based on key assumptions and valuation methodologies previously discussed. As a result, any material changes to these assumptions could require us to record additional impairment in the future.
In the past, we have experienced declines in revenues and profitability of certain brands in the North American OTC Healthcare and Household Cleaning segments. Sustained or significant future declines in revenue, profitability, other adverse changes in expected operating results, and/or unfavorable changes in other economic factors used to estimate fair values of certain brands could indicate that fair value no longer exceeds carrying value, in which case a non-cash impairment charge may be recorded in future periods.
37
Goodwill
As of February 28, 2018, our annual impairment review date, and March 31, 2018, we had 15 reporting units with goodwill. As part of our annual test for impairment of goodwill, management estimates the discounted cash flows of each reporting unit to estimate their respective fair values. In performing this analysis, management considers current information and future events, such as competition, technological advances and reductions in advertising support for our trademarks and tradenames, that could cause subsequent evaluations to utilize different assumptions. In the event that the carrying amount of the reporting unit exceeds the fair value, management would then be required to allocate the estimated fair value of the assets and liabilities of the reporting unit as if the unit was acquired in a business combination, thereby revaluing the carrying amount of goodwill.
Indefinite-Lived Intangible Assets
At each reporting period, management analyzes current events and circumstances to determine whether the indefinite life classification for a trademark or tradename continues to be valid. If circumstances warrant a change to a finite life, the carrying value of the intangible asset would then be amortized prospectively over the estimated remaining useful life.
Management tests the indefinite-lived intangible assets for impairment by comparing the carrying value of the intangible asset to its estimated fair value. Since quoted market prices are seldom available for trademarks and tradenames such as ours, we utilize present value techniques to estimate fair value. Accordingly, management’s projections are utilized to assimilate all of the facts, circumstances and expectations related to the trademark or tradename and estimate the cash flows over its useful life. In a manner similar to goodwill, future events, such as competition, technological advances and reductions in advertising support for our trademarks and tradenames, could cause subsequent evaluations to utilize different assumptions. Once that analysis is completed, a discount rate is applied to the cash flows to estimate fair value. In connection with this analysis, management:
• | Reviews period-to-period sales and profitability by brand; |
• | Analyzes industry trends and projects brand growth rates; |
• | Prepares annual sales forecasts; |
• | Evaluates advertising effectiveness; |
• | Analyzes gross margins; |
• | Reviews contractual benefits or limitations; |
• | Monitors competitors’ advertising spend and product innovation; |
• | Prepares projections to measure brand viability over the estimated useful life of the intangible asset; and |
• | Considers the regulatory environment, as well as industry litigation. |
Finite-Lived Intangible Assets
When events or changes in circumstances indicate the carrying value of the assets may not be recoverable, management performs a review similar to indefinite-lived intangible assets to ascertain the impact of events and circumstances on the estimated useful lives and carrying values of our trademarks and tradenames.
If the analysis warrants a change in the estimated useful life of the intangible asset, management will reduce the estimated useful life and amortize the carrying value prospectively over the shorter remaining useful life. Management’s projections are utilized to assimilate all of the facts, circumstances and expectations related to the trademark or tradename and estimate the cash flows over its useful life. Future events, such as competition, technological advances and reductions in advertising support for our trademarks and tradenames, could cause subsequent evaluations to utilize different assumptions. In the event that the long-term projections indicate that the carrying value is in excess of the undiscounted cash flows expected to result from the use of the intangible assets, management is required to record an impairment charge. Once that analysis is completed, a discount rate is applied to the cash flows to estimate fair value. The impairment charge is measured as the excess of the carrying amount of the intangible asset over fair value, as calculated using the excess earnings method.
38
Impairment Analysis
Goodwill and indefinite-lived intangibles are tested for impairment annually and whenever events and circumstances indicate that impairment may have occurred. During the fourth quarter of each fiscal year, we perform our annual impairment analysis. We utilized the discounted cash flow method to estimate the fair value of our reporting units as part of the goodwill impairment test and the excess earnings method to estimate the fair value of our individual indefinite-lived intangible assets. The discount rate utilized in the analyses, as well as future cash flows, may be influenced by such factors as changes in interest rates and rates of inflation. Additionally, should the related fair values of goodwill and intangible assets be adversely affected as a result of declining sales or margins caused by competition, changing consumer preferences, technological advances or reductions in advertising and promotional expenses, we may be required to record impairment charges in the future. In addition, we considered our market capitalization at February 28, 2018, which was the date of our annual review, as compared to the aggregate fair values of our reporting units, to assess the reasonableness of our estimates pursuant to the discounted cash flow methodology.
As a result of our analysis at February 28, 2018, all reporting units tested had a fair value that exceeded their carrying value by at least 19%. We performed a sensitivity analysis on our weighted average cost of capital and we determined that a 50 basis point increase in the weighted average cost of capital would not have resulted in any of our reporting unit's implied fair value being less than their carrying value. Additionally, a 50 basis point decrease in the terminal growth rate used for each reporting unit would also not have resulted in any of our reporting units' implied fair value being less than their carrying value.
As a result of our analysis at February 28, 2018, two of our indefinite-lived intangible assets, Beano and Comet, did not exceed the carrying values and as such, impairment charges of $28.6 million and $70.7 million, respectively, were recorded in 2018 relating to these two tradenames. In addition, we recorded an impairment charge on our Massengill finite-lived intangible tradename of $0.6 million bringing its carrying value to zero. The impairment charges were the result of our reassessment of the long-term sales projections for these brands during our annual planning cycle. In addition, we performed a sensitivity analysis of our weighted average cost of capital, and we determined that a 50 basis point increase in the weighted average cost of capital would have resulted in an additional impairment of Beano and Comet totaling $4.2 million. Additionally, a 50 basis point decrease in the terminal growth rate used for each of the Beano and Comet tradenames would have resulted in an additional impairment of $2.3 million.
Beano and Massengill are part of our North American OTC Healthcare segment and Comet is part of our Household Cleaning segment.
Stock-Based Compensation
The Compensation and Equity topic of the FASB ASC 718 requires us to measure the cost of services to be rendered based on the grant-date fair value of the equity award. Compensation expense is to be recognized over the period during which an employee is required to provide service in exchange for the award, generally referred to as the requisite service period. Information utilized in the determination of fair value includes the following:
• | Type of instrument (i.e., restricted shares, stock options, warrants or performance shares); |
• | Strike price of the instrument; |
• | Market price of our common stock on the date of grant; |
• | Discount rates; |
• | Duration of the instrument; and |
• | Volatility of our common stock in the public market. |
Additionally, management must estimate the expected attrition rate of the recipients to enable it to estimate the amount of non-cash compensation expense to be recorded in our financial statements. While management prepares various analyses to estimate the respective variables, a change in assumptions or market conditions, as well as changes in the anticipated attrition rates, could have a significant impact on the future amounts recorded as non-cash compensation expense.
Recently Adopted Accounting Pronouncements
In March 2018, the FASB issued ASU 2018-05, Income Taxes (Topic 740). The amendments in this update reflect the income tax accounting implications of the Tax Act. See "Tax Reform" above for a discussion of the Tax Act that was signed into law on December 22, 2017, and the impact it has had and may have on our business and financial results.
In February 2018, the FASB issued ASU 2018-02, Income Statement - Reporting Comprehensive Income (Topic 220): Reclassification of Certain Tax Effects from Accumulated Other Comprehensive Income. The amendments in this update allow a reclassification from accumulated other comprehensive income to retained earnings for stranded tax effects resulting from the Tax Act. See "Tax Reform" above for a discussion of the Tax Act that was signed into law on December 22, 2017, and the impact it has had and may have on our business and financial results. The amendments in this update are effective for all entities for
39
fiscal years beginning after December 15, 2018, and interim periods within those fiscal years. We have early adopted ASU 2018-02 and the adoption did not have a material impact on our consolidated financial statements.
In March 2016, the FASB issued ASU 2016-09, Compensation - Stock Compensation (Topic 718): Improvements to Employee Share-Based Payment Accounting. The amendments in this update involve several aspects of accounting for share-based payment transactions, including income tax consequences, classification of awards and classification on the statement of cash flows. For public business entities, the amendments in this update were effective for annual periods beginning after December 15, 2016, and interim periods within those annual periods. We adopted ASU 2016-09 effective April 1, 2017, and the adoption did not have a material impact on our consolidated financial statements.
In July 2015, the FASB issued ASU 2015-11, Simplifying the Measurement of Inventory. The amendments in this update more closely align the measurement of inventory in GAAP with the measurement of inventory in International Financial Reporting Standards, under which an entity should measure inventory at the lower of cost or net realizable value. Net realizable value is the estimated selling price in the ordinary course of business, less reasonably predictable costs of completion, disposal, and transportation. For public business entities, the amendments were effective for fiscal years beginning after December 15, 2016, including interim periods within those fiscal years. Our adoption of ASU 2015-11, effective April 1, 2017, did not have a material impact on our consolidated financial statements.
Recently Issued Accounting Pronouncements
In March 2017, the FASB issued ASU 2017-07, Compensation - Retirement Benefits (Topic 715): Improving the Presentation of Net Periodic Pension Cost and Net Periodic Postretirement Benefit Cost, which changes the presentation of net periodic benefit cost related to employer sponsored defined benefit plans and other postretirement benefits. Service cost should be included in the same income statement line item as other compensation costs arising from services rendered during the period, while other components of net periodic benefit pension cost should be presented separately outside of operating income. Additionally, only service costs may be capitalized in assets. Entities should apply the guidance on the presentation of the components of net periodic benefit cost in the income statement retrospectively. The guidance limiting the capitalization of net periodic benefit cost in assets to the service cost component should be applied prospectively. The standard is effective for annual reporting periods beginning after December 15, 2017. The adoption of this standard will require us to move certain pension costs out of operating income.
In January 2017, the FASB issued ASU 2017-04, Intangibles - Goodwill and Other (Topic 350). The amendments in this update simplify the test for goodwill impairment by eliminating Step 2 from the impairment test, which required the entity to perform procedures to determine the fair value at the impairment testing date of its assets and liabilities following the procedure that would be required in determining fair value of assets acquired and liabilities assumed in a business combination. The amendments in this update are effective for public companies for annual or any interim goodwill impairment tests in fiscal years beginning after December 15, 2019. We are evaluating the impact of adopting this guidance on our consolidated financial statements and whether to early adopt this ASU.
In January 2017, the FASB issued ASU 2017-01, Business Combinations (Topic 805); Clarifying the Definition of a Business. The amendments in this update clarify the definition of a business to help companies evaluate whether transactions should be accounted for as acquisitions or disposals of assets or businesses. The amendments in this update are effective for public companies for annual periods beginning after December 15, 2017, including interim periods within those periods. We will adopt this standard as of the beginning of our fiscal 2019, and we do not expect a material impact to our consolidated financial statements.
In August 2016, the FASB issued ASU 2016-15, Classification of Certain Cash Receipts and Cash Payments. The amendments in this update provide clarification and guidance on eight cash flow classification issues. For public business entities, the amendments in this update are effective for fiscal years beginning after December 15, 2017, and interim periods within those fiscal years. We will adopt this standard as of the beginning of our fiscal 2019, and we do not expect a material impact to our consolidated financial statements.
In February 2016, the FASB issued ASU 2016-02, Leases. The amendments in this update include a new FASB ASC Topic 842, which supersedes Topic 840. The core principle of Topic 842 is that a lessee should recognize the assets and liabilities that arise from leases. For public business entities, the amendments in this update are effective for fiscal years beginning after December 15, 2018, including interim periods within those fiscal years. Early application is permitted for all entities as of the beginning of interim or annual reporting periods. We are evaluating the impact of adopting this guidance on our consolidated financial statements.
In May 2014, the FASB issued ASU 2014-09, Revenue from Contracts with Customers - Topic 606, including new FASB ASC 606, which supersedes the revenue recognition requirements in FASB ASC 605. Along with amendments issued in 2015 and 2016, the new guidance will eliminate industry-specific revenue recognition guidance under current GAAP and replace it with a principle-based approach for determining revenue. The core principle of the new guidance is that an entity should recognize
40
revenue for the transfer of goods and services equal to an amount it expects to be entitled to receive for those goods and services. The new standard will also require additional disclosures regarding the nature, amount, timing and uncertainty of revenue and cash flows arising from customer contracts. The new guidance permits two methods of adoption: retrospectively to each prior reporting period presented (full retrospective method), or retrospectively by recognizing the cumulative effect of initially applying the guidance to all contracts existing at the date of initial application (the modified retrospective method). The ASU, as amended, is effective for annual reporting periods beginning after December 15, 2017.
Our implementation approach included performing a detailed study of the various types of agreements that we have with our customers and assessed conformance of our current accounting practices with the new standard. We will adopt the guidance effective on April 1, 2018 using the modified retrospective method. We are finalizing the accounting policies under the new guidance and determined it may impact the timing of revenue recognition for product sales and the timing of revenue reductions associated with certain customer promotional programs we participate in.
Results of Operations
2018 compared to 2017
Total Segment Revenues
The following table represents total revenue by segment, including product groups, for each of the fiscal years ended March 31, 2018 and 2017.
Increase (Decrease) | |||||||||||||
(In thousands) | 2018 | % | 2017 | % | Amount | % | |||||||
North American OTC Healthcare | |||||||||||||
Analgesics | $ | 118,610 | 11.5 | $ | 120,253 | 13.6 | $ | (1,643 | ) | (1.4 | ) | ||
Cough & Cold | 93,537 | 9.0 | 90,795 | 10.3 | 2,742 | 3.0 | |||||||
Women's Health | 247,244 | 23.7 | 147,071 | 16.7 | 100,173 | 68.1 | |||||||
Gastrointestinal | 117,627 | 11.3 | 76,500 | 8.7 | 41,127 | 53.8 | |||||||
Eye & Ear Care | 92,308 | 8.9 | 97,618 | 11.0 | (5,310 | ) | (5.4 | ) | |||||
Dermatologicals | 94,775 | 9.1 | 85,194 | 9.6 | 9,581 | 11.2 | |||||||
Oral Care | 99,072 | 9.5 | 97,586 | 11.1 | 1,486 | 1.5 | |||||||
Other OTC | 5,701 | 0.5 | 5,807 | 0.7 | (106 | ) | (1.8 | ) | |||||
Total North American OTC Healthcare | 868,874 | 83.5 | 720,824 | 81.7 | 148,050 | 20.5 | |||||||
International OTC Healthcare | |||||||||||||
Analgesics | 807 | 0.1 | 1,922 | 0.2 | (1,115 | ) | (58.0 | ) | |||||
Cough & Cold | 18,310 | 1.8 | 17,990 | 2.0 | 320 | 1.8 | |||||||
Women's Health | 12,140 | 1.2 | 3,811 | 0.4 | 8,329 | 218.6 | |||||||
Gastrointestinal | 34,609 | 3.3 | 24,812 | 2.8 | 9,797 | 39.5 | |||||||
Eye & Ear Care | 11,744 | 1.1 | 12,075 | 1.4 | (331 | ) | (2.7 | ) | |||||
Dermatologicals | 2,113 | 0.2 | 2,159 | 0.3 | (46 | ) | (2.1 | ) | |||||
Oral Care | 11,930 | 1.1 | 10,513 | 1.2 | 1,417 | 13.5 | |||||||
Other OTC | 5 | 0.0 | 22 | 0.0 | (17 | ) | (77.3 | ) | |||||
Total International OTC Healthcare | 91,658 | 8.8 | 73,304 | 8.3 | 18,354 | 25.0 | |||||||
Total OTC Healthcare | 960,532 | 92.3 | 794,128 | 90.0 | 166,404 | 21.0 | |||||||
Household Cleaning | 80,647 | 7.7 | 87,932 | 10.0 | (7,285 | ) | (8.3 | ) | |||||
Total Consolidated | $ | 1,041,179 | 100.0 | $ | 882,060 | 100.0 | $ | 159,119 | 18.0 | ||||
Total segment revenues for 2018 were $1,041.2 million, an increase of $159.1 million, or 18.0%, versus 2017. The $159.1 million increase was primarily related to an increase in the North American OTC Healthcare segment, which accounted for $148.1 million, and the International OTC Healthcare segment, which accounted for $18.4 million, largely due to the acquisition of Fleet. The increase attributable to Fleet revenues was partially offset by a decrease of $23.0 million resulting from the divestiture of certain non-core brands. Excluding the impact of the acquisition and divestitures, total segment revenues increased by $6.7 million.
North American OTC Healthcare Segment
41
Revenues for the North American OTC Healthcare segment increased $148.1 million, or 20.5%, during 2018 versus 2017. The $148.1 million increase was primarily attributable to the acquisition of Fleet. Excluding the revenue increase contributed by Fleet, and the reduction of $21.9 million in revenues resulting from the divestiture of certain non-core brands, revenues increased by $6.3 million.
International OTC Healthcare Segment
Revenues for the International OTC Healthcare segment increased $18.4 million, or 25.0%, during 2018 versus 2017. The $18.4 million increase was primarily attributable to the acquisition of Fleet. Excluding the revenue increase contributed by Fleet, and the reduction of $0.3 million in revenues resulting from the divestiture of certain non-core brands, revenues increased by $7.0 million.
Household Cleaning Segment
Revenues for the Household Cleaning segment decreased by $7.3 million, or 8.3%, during 2018 versus 2017. This decrease was primarily attributable to decreased sales related to the Comet brand.
Gross Profit
The following table represents our gross profit and gross profit as a percentage of total segment revenues, by segment for each of the fiscal years ended March 31, 2018 and 2017.
(In thousands) | Increase (Decrease) | ||||||||||||
Gross Profit | 2018 | % | 2017 | % | Amount | % | |||||||
North American OTC Healthcare | $ | 511,576 | 58.9 | $ | 438,074 | 60.8 | $ | 73,502 | 16.8 | ||||
International OTC Healthcare | 51,414 | 56.1 | 42,515 | 58.0 | 8,899 | 20.9 | |||||||
Household Cleaning | 13,515 | 16.8 | 19,697 | 22.4 | (6,182 | ) | (31.4 | ) | |||||
$ | 576,505 | 55.4 | $ | 500,286 | 56.7 | $ | 76,219 | 15.2 | |||||
Gross profit for 2018 increased $76.2 million, or 15.2%, versus 2017. As a percentage of total revenues, gross profit decreased to 55.4% in 2018 from 56.7% in 2017. The decrease in gross profit as a percentage of revenues was primarily the result of higher distribution costs and the acquisition of Fleet, which has lower gross margins.
North American OTC Healthcare Segment
Gross profit for the North American OTC Healthcare segment increased $73.5 million, or 16.8%, during 2018 versus 2017. The increase to gross profit was primarily attributable to increased revenue from the acquisition of Fleet. As a percentage of North American OTC Healthcare revenues, gross profit decreased to 58.9% during 2018 from 60.8% during 2017, primarily due to higher distribution costs and the acquisition of Fleet, which has lower gross margins.
International OTC Healthcare Segment
Gross profit for the International OTC Healthcare segment increased $8.9 million, or 20.9%, during 2018 versus 2017. The increase to gross profit was primarily attributable to increased revenue from the acquisition of Fleet. As a percentage of International OTC Healthcare revenues, gross profit decreased to 56.1% during 2018 from 58.0% during 2017, primarily due to the acquisition of Fleet, which has lower gross margins.
Household Cleaning Segment
Gross profit for the Household Cleaning segment decreased $6.2 million, or 31.4%, during 2018 versus 2017. As a percentage of Household Cleaning revenues, gross profit decreased to 16.8% during 2018 from 22.4% during 2017. The decrease in gross profit as a percentage of revenues was primarily attributable to the reduced royalties as a result of the sale of royalty rights related to the Comet brand in certain geographic regions and higher distribution costs.
42
Contribution Margin
Contribution margin is our segment measure of profitability. It is defined as gross profit less advertising and promotional expenses.
The following table represents our contribution margin and contribution margin as a percentage of total segment revenues, by segment for each of the fiscal years ended March 31, 2018 and 2017.
(In thousands) | Increase (Decrease) | ||||||||||||
Contribution Margin | 2018 | % | 2017 | % | Amount | % | |||||||
North American OTC Healthcare | $ | 382,518 | 44.0 | $ | 325,609 | 45.2 | $ | 56,909 | 17.5 | ||||
International OTC Healthcare | 35,147 | 38.3 | 29,081 | 39.7 | 6,066 | 20.9 | |||||||
Household Cleaning | 11,554 | 14.3 | 17,237 | 19.6 | (5,683 | ) | (33.0 | ) | |||||
$ | 429,219 | 41.2 | $ | 371,927 | 42.2 | $ | 57,292 | 15.4 | |||||
North American OTC Healthcare Segment
Contribution margin for the North American OTC Healthcare segment increased $56.9 million, or 17.5%, during 2018 versus 2017. The contribution margin increase was primarily the result of higher sales volume and gross profit, partially offset by higher advertising and promotion expenses, all attributable to the Fleet acquisition. As a percentage of North American OTC Healthcare revenues, contribution margin for the North American OTC Healthcare segment decreased to 44.0% during 2018 from 45.2% during 2017. The contribution margin decrease as a percentage of revenues was primarily due to the gross profit decrease as a percentage of revenues in the North American OTC Healthcare segment discussed above.
International OTC Healthcare Segment
Contribution margin for the International OTC Healthcare segment increased $6.1 million, or 20.9%, during 2018 versus 2017. The contribution margin increase was primarily the result of higher sales volume and gross profit, partially offset by higher advertising and promotion expenses, all attributable to the Fleet acquisition. As a percentage of International OTC Healthcare revenues, contribution margin for the International OTC Healthcare segment decreased to 38.3% during 2018 from 39.7% during 2017. The contribution margin decrease as a percentage of revenues was primarily due to the gross profit decrease as a percentage of revenues in the International OTC Healthcare segment discussed above.
Household Cleaning Segment
Contribution margin for the Household Cleaning segment decreased $5.7 million, or 33.0%, during 2018 versus 2017. As a percentage of Household Cleaning revenues, contribution margin for the Household Cleaning segment decreased to 14.3% during 2018 from 19.6% during 2017. The contribution margin decrease as a percentage of revenues was primarily attributable to the gross profit decrease as a percentage of revenues in the Household Cleaning segment discussed above.
General and Administrative
General and administrative expenses were $85.0 million for 2018 versus $89.1 million for 2017. The decrease in general and administrative expenses was primarily due to higher acquisition and integration charges in 2017 related to our acquisition of Fleet, partially offset by an increase in 2018 in compensation costs associated with the acquisition of Fleet.
Depreciation and Amortization
Depreciation and amortization expense was $28.4 million for 2018 versus $25.4 million for 2017. The increase was primarily due to higher amortization expense during 2018 as a result of the Fleet acquisition.
(Gain) Loss on Divestitures
We recorded a pre-tax net loss on divestitures of $51.8 million during the year ended March 31, 2017, which relates to several separate transactions. In July 2016, the Company completed the sale of Pediacare®, New Skin® and Fiber Choice®, which were non-core OTC brands and were reported under the North American OTC Healthcare segment in the Cough & Cold, Dermatologicals and Gastrointestinal product groups, respectively, and recorded a pre-tax loss of $56.2 million. Also included in the pre-tax net loss is a pre-tax gain of $1.2 million on the sale of a royalty license for our Comet brand in certain geographic areas as further discussed in "Divestitures and Sale of License Rights" above. Furthermore, also included in the pre-tax net loss above is a pre-tax net gain on divestitures of $3.2 million, which relates primarily to sales of e.p.t® and Dermoplast®. Both e.p.t® and Dermoplast® were non-core OTC brands reported under the North American OTC Healthcare segment. e.p.t® was included in the Women's Health product group, while Dermoplast® was included in the Dermatologicals product group.
Tradename Impairment
43
As a result of our impairment analysis at February 28, 2018, two of our indefinite-lived intangible assets, Beano and Comet, did not exceed the carrying values and as such, impairment charges of $28.6 million and $70.7 million, respectively, were recorded in 2018 relating to these two tradenames. In addition, we recorded an impairment charge on our Massengill finite-lived intangible tradename of $0.6 million bringing its carrying value to zero. The impairment charges were the result of our reassessment of the long-term sales projections for these brands during our annual planning cycle. Beano and Massengill are part of our North American OTC Healthcare segment and Comet is part of our Household Cleaning segment.
Interest Expense, net of Interest Income
Net interest expense was $105.9 million during 2018 versus $93.3 million during 2017. The increase in net interest expense was primarily attributable to higher borrowings due to the Fleet acquisition, partially offset by lower interest rates. The average indebtedness outstanding increased from $1.7 billion during 2017 to $2.1 billion during 2018. The average cost of borrowing decreased to 5.0% for 2018 from 5.6% for 2017.
Loss on Extinguishment of Debt
During 2018, we recorded a $2.9 million loss on extinguishment of debt, which consisted of deferred financing fees we wrote off primarily related to the prepayment of our 2012 Term Loan. During 2017, we recorded a $1.4 million loss on extinguishment of debt, which consisted of deferred financing fees we wrote off primarily related to the 2017 refinancings.
Income Taxes
On December 22, 2017, the U.S. government enacted the Tax Act, which represents significant U.S. federal tax reform legislation that includes a permanent reduction to the U.S. federal corporate income tax rate. The permanent reduction to the federal corporate income tax rate resulted in a one-time gain of $267.0 million related to the value of our deferred tax liabilities and a gain of $3.2 million related to the lower blended tax rate on our current year earnings, resulting in a net gain of $270.2 million. Additionally, the tax reform legislation subjects certain of our cumulative foreign earnings and profits to U.S. income taxes through a deemed repatriation, which resulted in a charge of $1.9 million during 2018.
The provision/benefit for income taxes during 2018 was a benefit of $232.5 million versus a provision of $41.5 million in 2017. The effective tax rate on income before income taxes was (217.1)% during 2018 versus 37.4% during 2017. The change in the provision/benefit for 2018 versus 2017 was primarily due to the Tax Act discussed above.
44
Results of Operations
2017 compared to 2016
Total Segment Revenues
The following table represents total revenue by segment, including product groups, for each of the fiscal years ended March 31, 2017 and 2016.
Increase (Decrease) | |||||||||||||
(In thousands) | 2017 | % | 2016 | % | Amount | % | |||||||
North American OTC Healthcare | |||||||||||||
Analgesics | $ | 120,253 | 13.6 | $ | 117,337 | 14.6 | $ | 2,916 | 2.5 | ||||
Cough & Cold | 90,795 | 10.3 | 100,148 | 12.4 | (9,353 | ) | (9.3 | ) | |||||
Women's Health | 147,071 | 16.7 | 132,184 | 16.4 | 14,887 | 11.3 | |||||||
Gastrointestinal | 76,500 | 8.7 | 74,568 | 9.2 | 1,932 | 2.6 | |||||||
Eye & Ear Care | 97,618 | 11.0 | 95,515 | 11.8 | 2,103 | 2.2 | |||||||
Dermatologicals | 85,194 | 9.6 | 82,941 | 10.3 | 2,253 | 2.7 | |||||||
Oral Care | 97,586 | 11.1 | 49,099 | 6.1 | 48,487 | (nm) | |||||||
Other OTC | 5,807 | 0.7 | 6,079 | 0.8 | (272 | ) | (4.5 | ) | |||||
Total North American OTC Healthcare | 720,824 | 81.7 | 657,871 | 81.6 | 62,953 | 9.6 | |||||||
International OTC Healthcare | |||||||||||||
Analgesics | 1,922 | 0.2 | 2,128 | 0.3 | (206 | ) | (9.7 | ) | |||||
Cough & Cold | 17,990 | 2.0 | 16,422 | 2.0 | 1,568 | 9.5 | |||||||
Women's Health | 3,811 | 0.4 | 2,982 | 0.4 | 829 | 27.8 | |||||||
Gastrointestinal | 24,812 | 2.8 | 20,019 | 2.4 | 4,793 | 23.9 | |||||||
Eye & Ear Care | 12,075 | 1.4 | 11,983 | 1.5 | 92 | 0.8 | |||||||
Dermatologicals | 2,159 | 0.3 | 2,133 | 0.3 | 26 | 1.2 | |||||||
Oral Care | 10,513 | 1.2 | 2,026 | 0.3 | 8,487 | (nm) | |||||||
Other OTC | 22 | 0.0 | 20 | 0.0 | 2 | 10.0 | |||||||
Total International OTC Healthcare | 73,304 | 8.3 | 57,713 | 7.2 | 15,591 | 27.0 | |||||||
Total OTC Healthcare | 794,128 | 90.0 | 715,584 | 88.8 | 78,544 | 11.0 | |||||||
Household Cleaning | 87,932 | 10.0 | 90,663 | 11.2 | (2,731 | ) | (3.0 | ) | |||||
Total Consolidated | $ | 882,060 | 100.0 | $ | 806,247 | 100.0 | $ | 75,813 | 9.4 | ||||
(nm) size of % not meaningful
Total segment revenues for 2017 were $882.1 million, an increase of $75.8 million, or 9.4%, versus 2016. This increase was primarily related to an increase in the North American OTC Healthcare segment, which accounted for $63.0 million, and the International OTC Healthcare segment, which accounted for $15.6 million, largely due to the acquisitions of DenTek and Fleet. The DenTek brands, acquired in February 2016, accounted for approximately $56.9 million of revenues in the North American OTC Healthcare and International OTC Healthcare segments not included in the comparable period in the prior year. The Fleet brands, acquired in January 2017, accounted for approximately $38.7 million of revenues in the North American OTC Healthcare and International OTC Healthcare segments not included in the comparable period in the prior year. The increases attributable to DenTek and Fleet revenues were partially offset by a net decrease of approximately $17.0 million within the North American OTC Healthcare and International OTC Healthcare segments, primarily due to the impact of divested brands.
North American OTC Healthcare Segment
Revenues for the North American OTC Healthcare segment increased $63.0 million, or 9.6%, during 2017 versus 2016. The $63.0 million increase was primarily attributable to the acquisitions of DenTek and Fleet, which accounted for approximately $48.7 million and $35.8 million, respectively, of revenues. Excluding the revenue increases contributed by DenTek and Fleet, revenues would have decreased by approximately $21.6 million, primarily due to the impact of divested brands.
International OTC Healthcare Segment
45
Revenues for the International OTC Healthcare segment increased $15.6 million, or 27.0%, during 2017 versus 2016. The $15.6 million increase was primarily attributable to the acquisitions of DenTek and Fleet, which accounted for approximately $8.2 million and $2.8 million, respectively, of revenues. Excluding the revenue increases contributed by DenTek and Fleet, revenues would have increased by approximately $4.6 million, primarily due to increases in the Gastrointestinal and Cough & Cold product groups.
Household Cleaning Segment
Revenues for the Household Cleaning segment decreased $2.7 million, or 3.0%, during 2017 versus 2016. The decrease was primarily attributable to decreased royalties as a result of the sale of royalty rights related to the Comet brand in certain geographic regions, which was completed in July 2016.
Gross Profit
The following table represents our gross profit and gross profit as a percentage of total segment revenues, by segment for each of the fiscal years ended March 31, 2017 and 2016.
(In thousands) | Increase (Decrease) | ||||||||||||
Gross Profit | 2017 | % | 2016 | % | Amount | % | |||||||
North American OTC Healthcare | $ | 438,074 | 60.8 | $ | 407,853 | 62.0 | $ | 30,221 | 7.4 | ||||
International OTC Healthcare | 42,515 | 58.0 | 36,037 | 62.4 | 6,478 | 18.0 | |||||||
Household Cleaning | 19,697 | 22.4 | 23,321 | 25.7 | (3,624 | ) | (15.5 | ) | |||||
$ | 500,286 | 56.7 | $ | 467,211 | 57.9 | $ | 33,075 | 7.1 | |||||
Gross profit for 2017 increased $33.1 million, or 7.1%, versus 2016. As a percentage of total revenues, gross profit decreased to 56.7% in 2017 from 57.9% in 2016. The decrease in gross profit as a percentage of revenues was primarily the result of lower gross margins associated with the acquired DenTek and Fleet brands and purchase accounting charges related to the Fleet integration.
North American OTC Healthcare Segment
Gross profit for the North American OTC Healthcare segment increased $30.2 million, or 7.4%, during 2017 versus 2016. This increase was due to higher overall sales volume, primarily from the acquisitions of DenTek and Fleet. As a percentage of North American OTC Healthcare revenues, gross profit decreased to 60.8% during 2017 from 62.0% during 2016, primarily due to lower gross margins associated with the acquired DenTek and Fleet brands and purchase accounting charges related to the Fleet integration.
International OTC Healthcare Segment
Gross profit for the International OTC Healthcare segment increased $6.5 million, or 18.0%, during 2017 versus 2016. The increase was due to higher overall sales volume, primarily from the acquisitions of DenTek and Fleet. As a percentage of International OTC Healthcare revenues, gross profit decreased to 58.0% during 2017 from 62.4% during 2016, primarily due to lower gross margins associated with the acquired DenTek and Fleet brands.
Household Cleaning Segment
Gross profit for the Household Cleaning segment decreased $3.6 million, or 15.5%, during 2017 versus 2016. As a percentage of Household Cleaning revenues, gross profit decreased to 22.4% during 2017 from 25.7% during 2016. The decrease in gross profit as a percentage of revenues was primarily attributable to the reduced royalties as a result of the sale of royalty rights related to the Comet brand in certain geographic regions.
Contribution Margin
Contribution margin is our segment measure of profitability. It is defined as gross profit less advertising and promotional expenses.
The following table represents our contribution margin and contribution margin as a percentage of total segment revenues, by segment for each of the fiscal years ended March 31, 2017 and 2016.
(In thousands) | Increase (Decrease) | ||||||||||||
Contribution Margin | 2017 | % | 2016 | % | Amount | % | |||||||
North American OTC Healthcare | $ | 325,609 | 45.2 | $ | 310,460 | 47.2 | $ | 15,149 | 4.9 | ||||
International OTC Healthcare | 29,081 | 39.7 | 24,923 | 43.2 | 4,158 | 16.7 | |||||||
Household Cleaning | 17,237 | 19.6 | 21,026 | 23.2 | (3,789 | ) | (18.0 | ) | |||||
$ | 371,927 | 42.2 | $ | 356,409 | 44.2 | $ | 15,518 | 4.4 | |||||
46
North American OTC Healthcare Segment
Contribution margin for the North American OTC Healthcare segment increased $15.1 million, or 4.9%, during 2017 versus 2016. The contribution margin increase was primarily the result of higher sales volumes and gross profit attributable to the DenTek and Fleet acquisitions, partially offset by charges related to the Fleet acquisition. As a percentage of North American OTC Healthcare revenues, contribution margin for the North American OTC Healthcare segment decreased to 45.2% during 2017 from 47.2% during 2016. The contribution margin decrease as a percentage of revenues was primarily due to the gross profit decrease as a percentage of revenues in the North American OTC Healthcare segment discussed above.
International OTC Healthcare Segment
Contribution margin for the International OTC Healthcare segment increased $4.2 million, or 16.7%, during 2017 versus 2016. The contribution margin increase was primarily the result of higher sales volumes and gross profit attributable to the DenTek and Fleet acquisitions. As a percentage of International OTC Healthcare revenues, contribution margin for the International OTC Healthcare segment decreased to 39.7% during 2017 from 43.2% during 2016. The contribution margin decrease as a percentage of revenues was primarily due to the gross profit decrease as a percentage of revenues in the International OTC Healthcare segment discussed above.
Household Cleaning Segment
Contribution margin for the Household Cleaning segment decreased $3.8 million, or 18.0%, during 2017 versus 2016. As a percentage of Household Cleaning revenues, contribution margin from the Household Cleaning segment decreased to 19.6% during 2017 from 23.2% during 2016. This decrease was primarily attributable to the gross profit decrease as a percentage of revenues in the Household Cleaning segment discussed above.
General and Administrative
General and administrative expenses were $89.1 million for 2017 versus $72.4 million for 2016. The increase in general and administrative expenses was primarily due to an increase in compensation costs as well as integration costs associated with the acquisitions of DenTek and Fleet, and the costs associated with the sales of Pediacare®, Fiber Choice®, New Skin®, Dermoplast® and e.p.t®.
Depreciation and Amortization
Depreciation and amortization expense was $25.4 million for 2017 versus $23.7 million for 2016. The increase was primarily due to higher intangible asset amortization and depreciation expense during 2017 related to the intangible assets and fixed assets acquired as a result of the DenTek and Fleet acquisitions, partially offset by a reduction in amortization related to divested brands.
Loss on Divestitures
We recorded a pre-tax net loss on divestitures of $51.8 million during the year ended March 31, 2017, which relates to several separate transactions. In July 2016, the Company completed the sale of Pediacare®, New Skin® and Fiber Choice®, which were non-core OTC brands and were reported under the North American OTC Healthcare segment in the Cough & Cold, Dermatologicals and Gastrointestinal product groups, respectively, and recorded a pre-tax loss of $56.2 million. Also included in the pre-tax net loss is a pre-tax gain of $1.2 million on the sale of a royalty license for our Comet brand in certain geographic areas as further discussed in "Divestitures and Sale of License Rights" above. Furthermore, also included in the pre-tax net loss above is a pre-tax net gain on divestitures of $3.2 million, which relates primarily to sales of e.p.t® and Dermoplast®. Both e.p.t® and Dermoplast® were non-core OTC brands reported under the North American OTC Healthcare segment. e.p.t® was included in the Women's Health product group, while Dermoplast® was included in the Dermatologicals product group.
Interest Expense, net of Interest Income
Net interest expense was $93.3 million during 2017 versus $85.2 million during 2016. The increase in net interest expense was primarily attributable costs associated with the acquisition of Fleet, partially offset by the lower interest rate on our 2016 Senior Notes compared to our 8.125% senior unsecured notes due February 1, 2020 (the "2012 Senior Notes"). The 2016 Senior Notes were issued in February 2016 in connection with the acquisition of DenTek and the redemption of the 2012 Senior Notes. The average indebtedness outstanding increased from $1.5 billion during 2016 to $1.7 billion during 2017. The average cost of borrowing increased to 5.6% for 2017 from 5.3% for 2016.
Loss on Extinguishment of Debt
During 2017, we recorded a $1.4 million loss on extinguishment of debt, which consisted of deferred financing fees we wrote off primarily related to the 2017 refinancings. During 2016, we recorded an $18.0 million loss on extinguishment of debt, which consisted of deferred financing fees we wrote off primarily related to the 2016 refinancings.
47
Income Taxes
The provision for income taxes during 2017 was $41.5 million versus $57.3 million in 2016. The effective tax rate on income before income taxes was 37.4% during 2017 versus 36.4% during 2016. The increase in the effective tax rate for 2017 versus 2016 was primarily due to the impact of certain non-deductible items in 2017 related to the Fleet acquisition, as well as the sale of rights for our Comet brand and the elimination of the lower tax basis in e.p.t® and Dermoplast® upon their sale.
Liquidity and Capital Resources
Liquidity
Our primary source of cash comes from our cash flow from operations. In the past, we have supplemented this source of cash with various debt facilities, primarily in connection with acquisitions. We have financed our operations, and expect to continue to finance our operations over the next twelve months, with a combination of funds generated from operations and borrowings. Our principal uses of cash are for operating expenses, debt service, share repurchase, and acquisitions. Based on our current levels of operations and anticipated growth, excluding acquisitions, we believe that our cash generated from operations and our existing credit facilities will be adequate to finance our working capital and capital expenditures through the next twelve months, although no assurance can be given in this regard.
Year Ended March 31, | $ Change | |||||||||||||||||
(In thousands) | 2018 | 2017 | 2016 | 2018 vs. 2017 | 2017 vs. 2016 | |||||||||||||
Net cash provided by (used in): | ||||||||||||||||||
Operating activities | $ | 210,110 | $ | 148,672 | $ | 176,310 | $ | 61,438 | $ | (27,638 | ) | |||||||
Investing activities | (11,562 | ) | (694,595 | ) | (222,971 | ) | 683,033 | (471,624 | ) | |||||||||
Financing activities | (208,955 | ) | 560,957 | 52,076 | (769,912 | ) | 508,881 | |||||||||||
Effects of exchange rate changes on cash and cash equivalents | 1,100 | (409 | ) | 497 | 1,509 | (906 | ) | |||||||||||
Net change in cash and cash equivalents | $ | (9,307 | ) | $ | 14,625 | $ | 5,912 | $ | (23,932 | ) | $ | 8,713 | ||||||
2018 compared to 2017
Operating Activities
Net cash provided by operating activities was $210.1 million for 2018 compared to $148.7 million for 2017. The $61.4 million increase in net cash provided by operating activities was primarily due to an increase in net income after non-cash items, partly offset by increased working capital.
Investing Activities
Net cash used in investing activities was $11.6 million for 2018 compared to $694.6 million for 2017. This change was primarily due to the acquisition of Fleet in 2017, partly offset by proceeds from divestitures in 2017. Capital expenditures were $12.5 million in 2018 compared to $3.0 million in 2017.
Financing Activities
Net cash used in financing activities was $209.0 million for 2018 compared to net cash provided by financing activities of $561.0 million for 2017. This change was primarily due to proceeds from the refinancing of our 2012 Term Loan in 2017.
2017 compared to 2016
Operating Activities
Net cash provided by operating activities was $148.7 million for 2017 compared to $176.3 million for 2016. The $27.6 million decrease in net cash provided by operating activities was primarily due to a decrease in net income of $30.5 million, partially offset by a decrease in working capital of $8.4 million. The decrease in net income was primarily due to acquisition-related costs and a loss on divestitures associated with the sale of Pediacare®, New Skin® and Fiber Choice®.
Investing Activities
Net cash used in investing activities was $694.6 million for 2017 compared to $223.0 million for 2016. This change was primarily due to the acquisition of Fleet in 2017 for $803.8 million, partially offset by the acquisition of DenTek in 2016 for $227.0 million and proceeds from divestitures of $110.7 million received in 2017.
Financing Activities
48
Net cash provided by financing activities was $561.0 million for 2017 compared to $52.1 million for 2016. This change was primarily due to proceeds in 2017 from the Term B-4 Loans under the 2012 Term Loan of $1,427.0 million, partially offset by term loan repayments of $862.5 million.
Capital Resources
2012 Term Loan and 2012 ABL Revolver:
On January 31, 2012, Prestige Brands, Inc. ("the Borrower") entered into a senior secured credit facility, which consists of (i) a $660.0 million 2012 Term Loan with a 7-year maturity and (ii) a $50.0 million asset-based 2012 ABL Revolver with a 5-year maturity. In subsequent years, we have utilized portions of our accordion feature to increase the amount of our borrowing capacity under the 2012 ABL Revolver by $85.0 million to $135.0 million and reduced our borrowing rate on the 2012 ABL Revolver by 0.25% (discussed below). The 2012 Term Loan was issued with an original issue discount of 1.5% of the principal amount thereof, resulting in net proceeds to the Borrower of $650.1 million. The 2012 Term Loan is unconditionally guaranteed by Prestige Brands Holdings, Inc. and certain of its domestic 100% owned subsidiaries, other than the Borrower. Each of these guarantees is joint and several. There are no significant restrictions on the ability of any of the guarantors to obtain funds from their subsidiaries or to make payments to the Borrower or the Company.
On February 21, 2013, we entered into Amendment No. 1 ("Term Loan Amendment No. 1") to the 2012 Term Loan. Term Loan Amendment No. 1 provided for the refinancing of all of the Borrower's existing Term B Loans with new Term B-1 Loans (the "Term B-1 Loans"). The interest rate on the Term B-1 Loans under Term Loan Amendment No. 1 was based, at our option, on a LIBOR rate plus a margin of 2.75% per annum, with a LIBOR floor of 1.00%, or an alternate base rate, with a floor of 2.00%, plus a margin. In addition, Term Loan Amendment No. 1 provided the Borrower with certain additional capacity to prepay subordinated debt, the 2012 Senior Notes and certain other unsecured indebtedness permitted to be incurred under the credit agreement governing the 2012 Term Loan and 2012 ABL Revolver.
On September 3, 2014, we entered into Amendment No. 2 ("Term Loan Amendment No. 2") to the 2012 Term Loan. Term Loan Amendment No. 2 provided for (i) the creation of a new class of Term B-2 Loans under the 2012 Term Loan (the "Term B-2 Loans") in an aggregate principal amount of $720.0 million, (ii) increased flexibility under the credit agreement governing the 2012 Term Loan and 2012 ABL Revolver, including additional investment, restricted payment and debt incurrence flexibility and financial maintenance covenant relief, and (iii) an interest rate on (x) the Term B-1 Loans that was based, at our option, on a LIBOR rate plus a margin of 3.125% per annum, with a LIBOR floor of 1.00%, or an alternate base rate, with a floor of 2.00%, plus a margin, and (y) the Term B-2 Loans that was based, at our option, on a LIBOR rate plus a margin of 3.50% per annum, with a LIBOR floor of 1.00%, or an alternate base rate, with a floor of 2.00%, plus a margin (with a margin step-down to 3.25% per annum, based upon achievement of a specified secured net leverage ratio).
Also on September 3, 2014, we entered into Amendment No. 3 ("ABL Amendment No. 3") to the 2012 ABL Revolver. ABL Amendment No. 3 provided for (i) a $40.0 million increase in revolving commitments under the 2012 ABL Revolver and (ii) increased flexibility under the credit agreement governing the 2012 Term Loan and 2012 ABL Revolver, including additional investment, restricted payment and debt incurrence flexibility. Borrowings under the 2012 ABL Revolver, as amended, bear interest at a rate per annum equal to an applicable margin, plus, at our option, either (i) a base rate determined by reference to the highest of (a) the Federal Funds rate plus 0.50%, (b) the prime rate of Citibank, N.A., and (c) the LIBOR rate determined by reference to the cost of funds for U.S. dollar deposits for an interest period of one month, adjusted for certain additional costs, plus 1.00% or (ii) a LIBOR rate determined by reference to the costs of funds for U.S. dollar deposits for the interest period relevant to such borrowing, adjusted for certain additional costs. The applicable margin for borrowings under the 2012 ABL Revolver may be increased to 2.00% or 2.25% for LIBOR borrowings and 1.00% or 1.25% for base-rate borrowings, depending on average excess availability under the 2012 ABL Revolver during the prior fiscal quarter. In addition to paying interest on outstanding principal under the 2012 ABL Revolver, we are required to pay a commitment fee to the lenders under the 2012 ABL Revolver in respect of the unutilized commitments thereunder. The initial commitment fee rate is 0.50% per annum. The commitment fee rate will be reduced to 0.375% per annum at any time when the average daily unused commitments for the prior quarter is less than a percentage of total commitments by an amount set forth in the credit agreement covering the 2012 ABL Revolver.
On May 8, 2015, we entered into Amendment No. 3 ("Term Loan Amendment No. 3") to the 2012 Term Loan. Term Loan Amendment No. 3 provided for (i) the creation of a new class of Term B-3 Loans under the 2012 Term Loan (the "Term B-3 Loans") in an aggregate principal amount of $852.5 million, which combined the outstanding balances of the Term B-1 Loans of $207.5 million and the Term B-2 Loans of $645.0 million, and (ii) increased flexibility under the credit agreement governing the 2012 Term Loan and 2012 ABL Revolver, including additional investment, restricted payment, and debt incurrence flexibility and financial maintenance covenant relief. The maturity date of the Term B-3 Loans remained the same as the Term B-2 Loans' original maturity date of September 3, 2021.
49
On June 9, 2015, we entered into Amendment No. 4 (“ABL Amendment No. 4”) to the 2012 ABL Revolver. ABL Amendment No. 4 provided for (i) a $35.0 million increase in the accordion feature under the 2012 ABL Revolver and (ii) increased flexibility under the credit agreement governing the 2012 Term Loan and the 2012 ABL Revolver, including additional investment, restricted payment, and debt incurrence flexibility and financial maintenance covenant relief and (iii) extended the maturity date of the 2012 ABL Revolver to June 9, 2020, which is five years from the effective date of ABL Amendment No. 4.
In connection with the DenTek acquisition on February 5, 2016, we entered into Amendment No. 5 (“ABL Amendment No. 5”) to the 2012 ABL Revolver. ABL Amendment No. 5 temporarily suspended certain financial and related reporting covenants in the 2012 ABL Revolver until the earliest of (i) the date that was 60 calendar days following February 4, 2016, (ii) the date upon which certain of DenTek’s assets were included in the Company’s borrowing base under the 2012 ABL Revolver and (iii) the date upon which the Company received net proceeds from an offering of debt securities.
In connection with the Fleet acquisition, on January 26, 2017, we entered into Amendment No. 4 ("Term Loan Amendment No. 4") to the 2012 Term Loan. Term Loan Amendment No. 4 provided for (i) the refinancing of all of our outstanding term loans and the creation of a new class of Term B-4 Loans under the 2012 Term Loan (the "Term B-4 Loans") in an aggregate principal amount of $1,427.0 million and (ii) increased flexibility under the credit agreement governing the 2012 Term Loan and the 2012 ABL Revolver, including additional investment, restricted payment, and debt incurrence flexibility and financial maintenance covenant relief. In addition, Citibank, N.A. was succeeded by Barclays Bank PLC as administrative agent under the 2012 Term Loan.
Also on January 26, 2017, we entered into Amendment No. 6 ("ABL Amendment No. 6") to the 2012 ABL Revolver. ABL Amendment No. 6 provides for (i) a $40.0 million increase in revolving commitments under the 2012 ABL Revolver, (ii) an extension of the maturity date of revolving commitments to January 26, 2022, and (iii) increased flexibility under the credit agreement governing the 2012 Term Loan and the 2012 ABL Revolver, including additional investment, restricted payment and debt incurrence flexibility consistent with Term Loan Amendment No. 4. We may voluntarily repay outstanding loans under the 2012 ABL Revolver at any time without a premium or penalty.
On March 21, 2018, we entered into Amendment No. 5 (“Term Loan Amendment No. 5”) to the 2012 Term Loan. Term Loan Amendment No. 5 ("Term B-5 Loans") provided for the repricing of the Term B-4 Loans under the Credit Agreement to an interest rate that is based, at our option, on a LIBOR rate plus a margin of 2.00% per annum, with a LIBOR floor of 0.00%, or an alternative base rate plus a margin of 1.00% per annum with a floor of 1.00%.
For the year ended March 31, 2018, the average interest rate on the 2012 Term Loan was 4.5%. For the year ended March 31, 2018, the average interest rate on the amounts borrowed under the 2012 ABL Revolver was 2.7%.
2013 Senior Notes:
On December 17, 2013, the Borrower issued $400.0 million of senior unsecured notes, with an interest rate of 5.375% and a maturity date of December 15, 2021 (the "2013 Senior Notes"). The Borrower may redeem some or all of the 2013 Senior Notes at redemption prices set forth in the indenture governing the 2013 Senior Notes. The 2013 Senior Notes are guaranteed by Prestige Brands Holdings, Inc. and certain of its 100% domestic owned subsidiaries, other than the Borrower. Each of these guarantees is joint and several. There are no significant restrictions on the ability of any of the guarantors to obtain funds from their subsidiaries or to make payments to the Borrower or the Company.
2016 Senior Notes:
On February 19, 2016, the Borrower completed the sale of $350.0 million aggregate principal amount of 6.375% senior notes due March 1, 2024 (the “Initial Notes”), pursuant to a purchase agreement, dated February 16, 2016, among the Borrower, the guarantors party thereto (the “Guarantors”) and the initial purchasers party thereto. The 2016 Senior Notes are guaranteed by Prestige Brands Holdings, Inc. and certain of its domestic 100% owned subsidiaries, other than the Borrower. Each of these guarantees is joint and several. There are no significant restrictions on the ability of any of the Guarantors to obtain funds from their subsidiaries or to make payments to the Borrower or the Company.
The 2016 Senior Notes were issued pursuant to an indenture, dated February 19, 2016 (the “Indenture”). The Indenture provides, among other things, that interest will be payable on the 2016 Senior Notes on March 1 and September 1 of each year, beginning on September 1, 2016, until their maturity date of March 1, 2024. The 2016 Senior Notes are senior unsecured obligations of the Borrower.
50
On March 21, 2018, we completed the sale of $250.0 million aggregate principal amount of 6.375% senior notes due 2024 (the “Additional Notes”), at an issue price of 101.0%, pursuant to a purchase agreement, dated March 16, 2018, among the Borrower, the guarantors party thereto and the initial purchasers party thereto. The Additional Notes are senior unsecured obligations of the Borrower and are guaranteed by each of Prestige Brands Holdings, Inc.'s domestic subsidiaries that guarantee the obligations under the 2012 Term Loan. We used the proceeds from the issuance of the Additional Notes to repay a portion of our outstanding obligations under the 2012 Term Loan and to pay related fees and expenses. The Additional Notes will be treated as a single series with the $350.0 million aggregate principle amount of Initial Notes (the Initial Notes and, together with the Additional Notes, the “2016 Senior Notes”).
Redemptions and Restrictions:
On or after December 15, 2016, we have had the option to redeem some or all of the 2013 Senior Notes at redemption prices set forth in the indenture governing the 2013 Senior Notes. In addition, at any time prior to December 15, 2016, we had the option to redeem up to 35% of the aggregate principal amount of the 2013 Senior Notes at a redemption price equal to 105.375% of the principal amount thereof, plus accrued and unpaid interest, if any, to the redemption date, with the net cash proceeds of certain equity offerings, provided that certain conditions were met. Subject to certain limitations, in the event of a change of control (as defined in the indenture governing the 2013 Senior Notes), the Borrower will be required to make an offer to purchase the 2013 Senior Notes at a price equal to 101% of the aggregate principal amount of the 2013 Senior Notes repurchased, plus accrued and unpaid interest, if any, to the date of repurchase.
We have the option to redeem all or a portion of the 2016 Senior Notes at any time on or after March 1, 2019 at the redemption prices set forth in the Indenture, plus accrued and unpaid interest, if any. We may also redeem all or any portion of the 2016 Senior Notes at any time prior to March 1, 2019, at a price equal to 100% of the aggregate principal amount of notes redeemed, plus a "make-whole premium" calculated as set forth in the Indenture and accrued and unpaid interest, if any. In addition, before March 1, 2019, the Borrower may redeem up to 40% of the aggregate principal amount of the 2016 Senior Notes with the net proceeds of certain equity offerings, at the redemption price set forth in the Indenture, provided that certain conditions are met. Subject to certain limitations, in the event of a change of control (as defined in the Indenture), the Borrower will be required to make an offer to purchase the 2016 Senior Notes at a price equal to 101% of the aggregate principal amount of the notes repurchased, plus accrued and unpaid interest, if any, to the date of repurchase.
The indentures governing the 2013 Senior Notes and the 2016 Senior Notes contain provisions that restrict us from undertaking specified corporate actions, such as asset dispositions, acquisitions, dividend payments, repurchases of common shares outstanding, changes of control, incurrences of indebtedness, issuance of equity, creation of liens, making of loans and transactions with affiliates. Additionally, the credit agreement governing the 2012 Term Loan and the 2012 ABL Revolver and the indentures governing the 2013 Senior Notes and the 2016 Senior Notes contain cross-default provisions, whereby a default pursuant to the terms and conditions of certain indebtedness will cause a default on the remaining indebtedness under the credit agreement governing the 2012 Term Loan and the 2012 ABL Revolver and the indentures governing the 2013 Senior Notes and the 2016 Senior Notes. At March 31, 2018, we were in compliance with the covenants under our long-term indebtedness.
As of March 31, 2018, we had an aggregate of $2.0 billion of outstanding indebtedness, which consisted of the following:
• | $400.0 million of 5.375% 2013 Senior Notes due 2021; |
• | $600.0 million of 6.375% 2016 Senior Notes due 2024; |
• | $938.0 million of borrowings under the Term B-5 Loans; and |
• | $75.0 million of borrowings under the 2012 ABL Revolver. |
As of March 31, 2018, we had $96.6 million of borrowing capacity under the 2012 ABL Revolver.
As we deem appropriate, we may from time to time utilize derivative financial instruments to mitigate the impact of changing interest rates associated with our long-term debt obligations or other derivative financial instruments. While we have utilized derivative financial instruments in the past, we did not have any significant derivative financial instruments outstanding at either March 31, 2018 or March 31, 2017. We have not entered into derivative financial instruments for trading purposes; all of our derivatives were over-the-counter instruments with liquid markets.
Our debt facilities contain various financial covenants, including provisions that require us to maintain certain leverage, interest coverage and fixed charge ratios. The credit agreement governing the 2012 Term Loan and the 2012 ABL Revolver and the indentures governing the 2013 and 2016 Senior Notes contain provisions that accelerate our indebtedness on certain changes in control and restrict us from undertaking specified corporate actions, including asset dispositions, acquisitions, payment of dividends and other specified payments, repurchasing our equity securities in the public markets, incurrence of indebtedness, creation of liens, making loans and investments and transaction with affiliates. Specifically, we must:
51
• | Have a leverage ratio of less than 7.25 to 1.0 for the quarter ended March 31, 2018 (defined as, with certain adjustments, the ratio of our consolidated total net debt as of the last day of the fiscal quarter to our trailing twelve month consolidated net income before interest, taxes, depreciation, amortization, non-cash charges and certain other items (“EBITDA”)). Our leverage ratio requirement decreases over time by 0.25 to 1.0 per quarter until December 31, 2018 to 6.50 to 1 thereafter; |
• | Have an interest coverage ratio of greater than 2.25 to 1.0 for the quarter ended March 31, 2018 (defined as, with certain adjustments, the ratio of our consolidated EBITDA to our trailing twelve month consolidated cash interest expense); and |
• | Have a fixed charge ratio of greater than 1.0 to 1.0 for the quarter ended March 31, 2018 (defined as, with certain adjustments, the ratio of our consolidated EBITDA minus capital expenditures to our trailing twelve month consolidated interest paid, taxes paid and other specified payments). Our fixed charge requirement remains level throughout the term of the agreement. |
At March 31, 2018, we were in compliance with the applicable financial and restrictive covenants under the 2012 Term Loan and the 2012 ABL Revolver and the indentures governing the 2013 Senior Notes and the 2016 Senior Notes. Additionally, management anticipates that in the normal course of operations, we will be in compliance with the financial and restrictive covenants during 2019. During the years ended March 31, 2018 and 2017, we made voluntary principal payments against outstanding indebtedness of $444.0 million and $175.5 million, respectively, under the 2012 Term Loan. Under the Term Loan Amendment No. 5, we are required to make quarterly payments each equal to 0.25% of the aggregate amount of $975.0 million. Since we have previously made a significant optional payment that exceeded a significant portion of our required quarterly payments, we will not be required to make another payment until the fiscal year ending March 31, 2022.
Commitments
As of March 31, 2018, we had ongoing commitments under various contractual and commercial obligations as follows:
Payments Due by Period | |||||||||||||||||||
(In millions) | Less than | 1 to 3 | 4 to 5 | After 5 | |||||||||||||||
Contractual Obligations | Total | 1 Year | Years | Years | Years | ||||||||||||||
Long-term debt | $ | 2,013.0 | $ | — | $ | — | $ | 486.8 | $ | 1,526.2 | |||||||||
Interest on long-term debt(1) | 654.4 | 111.4 | 222.9 | 217.0 | 103.1 | ||||||||||||||
Purchase obligations: | |||||||||||||||||||
Inventory costs(2) | 335.3 | 305.3 | 19.1 | 10.9 | — | ||||||||||||||
Other costs(3) | 27.9 | 27.2 | 0.7 | — | — | ||||||||||||||
Operating leases (4) | 21.0 | 3.3 | 5.3 | 3.9 | 8.5 | ||||||||||||||
Total contractual cash obligations (5) | $ | 3,051.6 | $ | 447.2 | $ | 248.0 | $ | 718.6 | $ | 1,637.8 | |||||||||
(1) | Represents the estimated interest obligations on the outstanding balances at March 31, 2018 of the 2013 Senior Notes, 2016 Senior Notes, Term B-5 Loans, and 2012 ABL Revolver, assuming scheduled principal payments (based on the terms of the loan agreements) are made and assuming a weighted average interest rate of 5.0%. Estimated interest obligations would be different under different assumptions regarding interest rates or timing of principal payments. |
(2) | Purchase obligations for inventory costs are legally binding commitments for projected inventory requirements to be utilized during the normal course of our operations. |
(3) | Purchase obligations for other costs are legally binding commitments for marketing, advertising and capital expenditures. Activity costs for molds and equipment to be paid, based solely on a per unit basis without any deadlines for final payment, have been excluded from the table because we are unable to determine the time period over which such activity costs will be paid. |
(4) | We have excluded minimum sublease rentals of $1.0 million due in the future under non-cancellable subleases. Refer to Note 17 for further details. |
52
(5) | We have excluded obligations related to uncertain tax positions because we cannot reasonably estimate when they will occur. |
Off-Balance Sheet Arrangements
We do not have any off-balance sheet arrangements or financing activities with special-purpose entities.
Inflation
Inflationary factors such as increases in the costs of raw materials, packaging materials, purchased product and overhead may adversely affect our operating results and financial condition. Although we do not believe that inflation has had a material impact on our financial condition or results of operations for the three most recent fiscal years, a high rate of inflation in the future could have a material adverse effect on our financial condition or results of operations. More volatility in crude oil prices may have an adverse impact on transportation costs, as well as certain petroleum based raw materials and packaging material. Although we make efforts to minimize the impact of inflationary factors, including raising prices to our customers, a high rate of pricing volatility associated with crude oil supplies or other raw materials used in our products may have an adverse effect on our operating results.
53
ITEM 7A. QUANTITATIVE AND QUALITATIVE DISCLOSURES ABOUT MARKET RISK
Interest Rate Risk
We are exposed to changes in interest rates because our 2012 Term Loan and 2012 ABL Revolver are variable rate debt. Interest rate changes generally do not significantly affect the market value of the 2012 Term Loan and the 2012 ABL Revolver but do affect the amount of our interest payments and, therefore, our future earnings and cash flows, assuming other factors are held constant. At March 31, 2018, we had variable rate debt of approximately $1,013.0 million.
Holding other variables constant, including levels of indebtedness, a one percentage point increase in interest rates on our variable rate debt would have an adverse impact on pre-tax earnings and cash flows for the year ended March 31, 2018 of approximately $13.8 million.
Foreign Currency Exchange Rate Risk
During the years ended March 31, 2018 and 2017, approximately 10.4% and 12.0%, respectively, of our revenues were denominated in currencies other than the U.S. Dollar. As such, we are exposed to transactions that are sensitive to foreign currency exchange rates, including insignificant foreign currency forward exchange agreements. These transactions are primarily with respect to the Canadian and Australian Dollar.
We performed a sensitivity analysis with respect to exchange rates for the year ended March 31, 2018 and 2017. Holding all other variables constant, and assuming a hypothetical 10.0% adverse change in foreign currency exchange rates, this analysis resulted in a less than 10.0% impact on pre-tax income of approximately $7.3 million and $4.1 million for the years ended March 31, 2018 and 2017, respectively.
54
ITEM 8. FINANCIAL STATEMENTS AND SUPPLEMENTARY DATA
The supplementary data required by this Item are described in Part IV, Item 15 of this Annual Report on Form 10-K and are presented beginning on page 99.
INDEX TO CONSOLIDATED FINANCIAL STATEMENTS
Prestige Brands Holdings, Inc.
Audited Financial Statements
March 31, 2018
Report of Independent Registered Public Accounting Firm, PricewaterhouseCoopers LLP | |
Consolidated Statements of Income and Comprehensive Income for each of the three years in the period ended March 31, 2018 | |
Consolidated Balance Sheets at March 31, 2018 and 2017 | |
Consolidated Statements of Changes in Stockholders’ Equity for each of the three years in the period ended March 31, 2018 | |
Consolidated Statements of Cash Flows for each of the three years in the period ended March 31, 2018 | |
Notes to Consolidated Financial Statements | |
Schedule II—Valuation and Qualifying Accounts for the years ended March 31, 2018, 2017 and 2016 | |
Management's Report on Internal Control over Financial Reporting
Management of the Company is responsible for establishing and maintaining adequate internal control over financial reporting (as defined in Rule 13a-15(f) of the Exchange Act). Internal control over financial reporting is a process designed by, or under the supervision of the Chief Executive Officer and Chief Financial Officer and effected by the Board of Directors, management and other personnel, to provide reasonable assurance regarding the reliability of financial reporting and the preparation of financial statements for external purposes in accordance with generally accepted accounting principles.
Because of its inherent limitations, internal control over financial reporting may not prevent or detect misstatements. Therefore, even those systems determined to be effective can provide only reasonable, not absolute, assurance that the control objectives will be met. Also, projections of any evaluation of effectiveness to future periods are subject to the risk that controls may become inadequate because of changes in conditions, or that the degree of compliance with the policies and procedures may deteriorate over time.
Management, with the participation of the Chief Executive Officer and Chief Financial Officer, has evaluated the effectiveness of the Company's internal control over financial reporting as of March 31, 2018. In making its evaluation, management has used the criteria established by the Committee of Sponsoring Organizations of the Treadway Commission (COSO) in Internal Control - Integrated Framework (2013 Framework).
Based on management's assessment utilizing the 2013 Framework, management concluded that the Company's internal control over financial reporting was effective as of March 31, 2018.
PricewaterhouseCoopers LLP, an independent registered public accounting firm, has issued a report on the effectiveness of our internal control over financial reporting as of March 31, 2018, which appears below.
Prestige Brands Holdings, Inc.
May 10, 2018
55
Report of Independent Registered Public Accounting Firm
To the Board of Directors and Stockholders
Prestige Brands Holdings, Inc.
Opinions on the Financial Statements and Internal Control over Financial Reporting
We have audited the accompanying consolidated balance sheets of Prestige Brands Holdings, Inc. and its subsidiaries as of March 31, 2018 and 2017, and the related consolidated statements of income and comprehensive income, of changes in stockholders’ equity, and of cash flows for each of the three years in the period ended March 31, 2018, including the related notes and financial statement schedule listed in the accompanying index (collectively referred to as the "consolidated financial statements"). We also have audited the Company's internal control over financial reporting as of March 31, 2018, based on criteria established in Internal Control - Integrated Framework (2013) issued by the Committee of Sponsoring Organizations of the Treadway Commission (COSO).
In our opinion, the consolidated financial statements referred to above present fairly, in all material respects, the financial position of the Company as of March 31, 2018 and 2017, and the results of their operations and their cash flows for each of the three years in the period ended March 31, 2018 in conformity with accounting principles generally accepted in the United States of America. Also in our opinion, the Company maintained, in all material respects, effective internal control over financial reporting as of March 31, 2018, based on criteria established in Internal Control - Integrated Framework (2013) issued by the COSO.
Basis for Opinions
The Company's management is responsible for these consolidated financial statements, for maintaining effective internal control over financial reporting, and for its assessment of the effectiveness of internal control over financial reporting, included in the accompanying Management's Report on Internal Control over Financial Reporting. Our responsibility is to express opinions on the Company’s consolidated financial statements and on the Company's internal control over financial reporting based on our audits. We are a public accounting firm registered with the Public Company Accounting Oversight Board (United States) ("PCAOB") and are required to be independent with respect to the Company in accordance with the U.S. federal securities laws and the applicable rules and regulations of the Securities and Exchange Commission and the PCAOB.
We conducted our audits in accordance with the standards of the PCAOB. Those standards require that we plan and perform the audits to obtain reasonable assurance about whether the consolidated financial statements are free of material misstatement, whether due to error or fraud, and whether effective internal control over financial reporting was maintained in all material respects.
Our audits of the consolidated financial statements included performing procedures to assess the risks of material misstatement of the consolidated financial statements, whether due to error or fraud, and performing procedures that respond to those risks. Such procedures included examining, on a test basis, evidence regarding the amounts and disclosures in the consolidated financial statements. Our audits also included evaluating the accounting principles used and significant estimates made by management, as well as evaluating the overall presentation of the consolidated financial statements. Our audit of internal control over financial reporting included obtaining an understanding of internal control over financial reporting, assessing the risk that a material weakness exists, and testing and evaluating the design and operating effectiveness of internal control based on the assessed risk. Our audits also included performing such other procedures as we considered necessary in the circumstances. We believe that our audits provide a reasonable basis for our opinions.
Definition and Limitations of Internal Control over Financial Reporting
A company’s internal control over financial reporting is a process designed to provide reasonable assurance regarding the reliability of financial reporting and the preparation of financial statements for external purposes in accordance with generally accepted accounting principles. A company’s internal control over financial reporting includes those policies and procedures that (i) pertain to the maintenance of records that, in reasonable detail, accurately and fairly reflect the transactions and dispositions of the assets of the company; (ii) provide reasonable assurance that transactions are recorded as necessary to permit preparation of financial statements in accordance with generally accepted accounting principles, and that receipts and expenditures of the company are being made only in accordance with authorizations of management and directors of the company; and (iii) provide reasonable assurance regarding prevention or timely detection of unauthorized acquisition, use, or disposition of the company’s assets that could have a material effect on the financial statements.
56
Because of its inherent limitations, internal control over financial reporting may not prevent or detect misstatements. Also, projections of any evaluation of effectiveness to future periods are subject to the risk that controls may become inadequate because of changes in conditions, or that the degree of compliance with the policies or procedures may deteriorate.
/s/ PricewaterhouseCoopers LLP
Stamford, Connecticut
May 10, 2018
We have served as the Company’s auditor since at least 1999. We have not determined the specific year we began serving as auditor of the Company.
57
Prestige Brands Holdings, Inc.
Consolidated Statements of Income and Comprehensive Income
Year Ended March 31, | |||||||||||
(In thousands, except per share data) | 2018 | 2017 | 2016 | ||||||||
Revenues | |||||||||||
Net sales | $ | 1,040,792 | $ | 881,113 | $ | 803,088 | |||||
Other revenues | 387 | 947 | 3,159 | ||||||||
Total revenues | 1,041,179 | 882,060 | 806,247 | ||||||||
Cost of Sales | |||||||||||
Cost of sales excluding depreciation | 459,676 | 381,333 | 339,036 | ||||||||
Cost of sales depreciation | 4,998 | 441 | — | ||||||||
Cost of sales | 464,674 | 381,774 | 339,036 | ||||||||
Gross profit | 576,505 | 500,286 | 467,211 | ||||||||
Operating Expenses | |||||||||||
Advertising and promotion | 147,286 | 128,359 | 110,802 | ||||||||
General and administrative | 85,001 | 89,143 | 72,418 | ||||||||
Depreciation and amortization | 28,428 | 25,351 | 23,676 | ||||||||
Loss on divestitures | — | 51,820 | — | ||||||||
Tradename impairment | 99,924 | — | — | ||||||||
Total operating expenses | 360,639 | 294,673 | 206,896 | ||||||||
Operating income | 215,866 | 205,613 | 260,315 | ||||||||
Other (income) expense | |||||||||||
Interest income | (388 | ) | (203 | ) | (162 | ) | |||||
Interest expense | 106,267 | 93,546 | 85,322 | ||||||||
Loss on extinguishment of debt | 2,901 | 1,420 | 17,970 | ||||||||
Total other expense | 108,780 | 94,763 | 103,130 | ||||||||
Income before income taxes | 107,086 | 110,850 | 157,185 | ||||||||
(Benefit) provision for income taxes | (232,484 | ) | 41,455 | 57,278 | |||||||
Net income | $ | 339,570 | $ | 69,395 | $ | 99,907 | |||||
Earnings per share: | |||||||||||
Basic | $ | 6.40 | $ | 1.31 | $ | 1.89 | |||||
Diluted | $ | 6.34 | $ | 1.30 | $ | 1.88 | |||||
Weighted average shares outstanding: | |||||||||||
Basic | 53,099 | 52,976 | 52,754 | ||||||||
Diluted | 53,526 | 53,362 | 53,143 | ||||||||
Comprehensive income (loss), net of tax: | |||||||||||
Currency translation adjustments | 5,702 | (2,575 | ) | (113 | ) | ||||||
Unrecognized net gain (loss) on pension plans | 1,335 | (252 | ) | — | |||||||
Total other comprehensive income (loss) | 7,037 | (2,827 | ) | (113 | ) | ||||||
Comprehensive income | $ | 346,607 | $ | 66,568 | $ | 99,794 | |||||
See accompanying notes.
58
Prestige Brands Holdings, Inc.
Consolidated Balance Sheets
(In thousands) | March 31, | ||||||
Assets | 2018 | 2017 | |||||
Current assets | |||||||
Cash and cash equivalents | $ | 32,548 | $ | 41,855 | |||
Accounts receivable, net of allowance of $12,734 and $13,010, respectively | 140,881 | 136,742 | |||||
Inventories | 118,547 | 115,609 | |||||
Deferred income tax assets | 26 | — | |||||
Prepaid expenses and other current assets | 11,475 | 40,228 | |||||
Total current assets | 303,477 | 334,434 | |||||
Property, plant and equipment, net | 52,552 | 50,595 | |||||
Goodwill | 620,098 | 615,252 | |||||
Intangible assets, net | 2,780,916 | 2,903,613 | |||||
Other long-term assets | 3,569 | 7,454 | |||||
Total Assets | $ | 3,760,612 | $ | 3,911,348 | |||
Liabilities and Stockholders’ Equity | |||||||
Current liabilities | |||||||
Accounts payable | $ | 61,390 | $ | 70,218 | |||
Accrued interest payable | 9,708 | 8,130 | |||||
Other accrued liabilities | 52,101 | 83,661 | |||||
Total current liabilities | 123,199 | 162,009 | |||||
Long-term debt | |||||||
Principal amount | 2,013,000 | 2,222,000 | |||||
Less unamortized debt costs | (20,048 | ) | (28,268 | ) | |||
Long-term debt, net | 1,992,952 | 2,193,732 | |||||
Deferred income tax liabilities | 442,518 | 715,086 | |||||
Other long-term liabilities | 23,333 | 17,972 | |||||
Total Liabilities | 2,582,002 | 3,088,799 | |||||
Commitments and Contingencies – Note 17 | |||||||
Stockholders’ Equity | |||||||
Preferred stock – $0.01 par value | |||||||
Authorized – 5,000 shares | |||||||
Issued and outstanding – None | — | — | |||||
Common stock – $0.01 par value | |||||||
Authorized – 250,000 shares | |||||||
Issued – 53,396 shares at March 31, 2018 and 53,287 shares at March 31, 2017 | 534 | 533 | |||||
Additional paid-in capital | 468,783 | 458,255 | |||||
Treasury stock, at cost – 353 shares at March 31, 2018 and 332 shares at March 31, 2017 | (7,669 | ) | (6,594 | ) | |||
Accumulated other comprehensive loss, net of tax | (19,315 | ) | (26,352 | ) | |||
Retained earnings | 736,277 | 396,707 | |||||
Total Stockholders’ Equity | 1,178,610 | 822,549 | |||||
Total Liabilities and Stockholders’ Equity | $ | 3,760,612 | $ | 3,911,348 | |||
See accompanying notes.
59
Prestige Brands Holdings, Inc.
Consolidated Statements of Changes in Stockholders’ Equity
Common Stock | Additional Paid-in Capital | Treasury Stock | Accumulated Other Comprehensive (Loss) Income | Retained Earnings (Accumulated Deficit) | Totals | ||||||||||||||||||||||||
(In thousands) | Shares | Par Value | Shares | Amount | |||||||||||||||||||||||||
Balances at March 31, 2015 | 52,562 | $ | 525 | $ | 426,584 | 266 | $ | (3,478 | ) | $ | (23,412 | ) | $ | 227,405 | $ | 627,624 | |||||||||||||
Stock-based compensation | — | — | 9,954 | — | — | — | — | 9,954 | |||||||||||||||||||||
Exercise of stock options | 348 | 3 | 6,685 | — | — | — | — | 6,688 | |||||||||||||||||||||
Issuance of shares related to restricted stock | 156 | 2 | (1 | ) | — | — | — | — | 1 | ||||||||||||||||||||
Treasury share repurchases | — | — | — | 40 | (1,685 | ) | — | — | (1,685 | ) | |||||||||||||||||||
Excess tax benefits from share-based awards | — | — | 1,960 | — | — | — | — | 1,960 | |||||||||||||||||||||
Comprehensive (loss) income | — | — | — | — | — | (113 | ) | 99,907 | 99,794 | ||||||||||||||||||||
Balances at March 31, 2016 | 53,066 | $ | 530 | $ | 445,182 | 306 | $ | (5,163 | ) | $ | (23,525 | ) | $ | 327,312 | $ | 744,336 | |||||||||||||
Stock-based compensation | — | — | 8,148 | — | — | — | — | 8,148 | |||||||||||||||||||||
Exercise of stock options | 127 | 2 | 4,026 | — | — | — | — | 4,028 | |||||||||||||||||||||
Issuance of shares related to restricted stock | 94 | 1 | (1 | ) | — | — | — | — | — | ||||||||||||||||||||
Treasury share repurchases | — | — | — | 26 | (1,431 | ) | — | — | (1,431 | ) | |||||||||||||||||||
Excess tax benefits from share-based awards | — | — | 900 | — | — | — | — | 900 | |||||||||||||||||||||
Comprehensive (loss) income | — | — | — | — | — | (2,827 | ) | 69,395 | 66,568 | ||||||||||||||||||||
Balances at March 31, 2017 | 53,287 | $ | 533 | $ | 458,255 | 332 | $ | (6,594 | ) | $ | (26,352 | ) | $ | 396,707 | $ | 822,549 | |||||||||||||
Stock-based compensation | — | — | 8,909 | — | — | — | — | 8,909 | |||||||||||||||||||||
Exercise of stock options | 56 | — | 1,620 | — | — | — | — | 1,620 | |||||||||||||||||||||
Issuance of shares related to restricted stock | 53 | 1 | (1 | ) | — | — | — | — | — | ||||||||||||||||||||
Treasury share repurchases | — | — | — | 21 | (1,075 | ) | — | — | (1,075 | ) | |||||||||||||||||||
Comprehensive income | — | — | — | — | — | 7,037 | 339,570 | 346,607 | |||||||||||||||||||||
Balances at March 31, 2018 | 53,396 | $ | 534 | $ | 468,783 | 353 | $ | (7,669 | ) | $ | (19,315 | ) | $ | 736,277 | $ | 1,178,610 | |||||||||||||
See accompanying notes.
60
Prestige Brands Holdings, Inc.
Consolidated Statements of Cash Flows
Year Ended March 31, | |||||||||||
(In thousands) | 2018 | 2017 | 2016 | ||||||||
Operating Activities | |||||||||||
Net income | $ | 339,570 | $ | 69,395 | $ | 99,907 | |||||
Adjustments to reconcile net income to net cash provided by operating activities: | |||||||||||
Depreciation and amortization | 33,426 | 25,792 | 23,676 | ||||||||
Loss on divestitures | — | 51,820 | — | ||||||||
Loss (gain) on sale or disposal of property and equipment | 1,568 | 573 | (35 | ) | |||||||
Deferred income taxes | (269,086 | ) | (5,778 | ) | 46,152 | ||||||
Long term income taxes payable | — | 581 | (332 | ) | |||||||
Amortization of debt origination costs | 6,742 | 8,633 | 8,994 | ||||||||
Excess tax benefits from share-based awards | — | 900 | 1,960 | ||||||||
Stock-based compensation costs | 8,909 | 8,148 | 9,954 | ||||||||
Loss on extinguishment of debt | 2,901 | 1,420 | 17,970 | ||||||||
Premium payment on 2012 Senior Notes | — | — | (10,158 | ) | |||||||
Impairment loss | 99,924 | — | — | ||||||||
Lease termination costs | 214 | 524 | — | ||||||||
Other non-cash items | 1,704 | — | — | ||||||||
Changes in operating assets and liabilities, net of effects from acquisitions: | |||||||||||
Accounts receivable | (5,043 | ) | (18,938 | ) | 1,824 | ||||||
Inventories | (2,482 | ) | (10,262 | ) | (3,005 | ) | |||||
Prepaid expenses and other assets | 33,721 | (1,996 | ) | (7,921 | ) | ||||||
Accounts payable | (10,028 | ) | 21,447 | (11,348 | ) | ||||||
Accrued liabilities | (31,495 | ) | 2,413 | (1,328 | ) | ||||||
Pension and deferred compensation contribution | (435 | ) | (6,000 | ) | — | ||||||
Net cash provided by operating activities | 210,110 | 148,672 | 176,310 | ||||||||
Investing Activities | |||||||||||
Purchases of property, plant and equipment | (12,532 | ) | (2,977 | ) | (3,568 | ) | |||||
Proceeds from divestitures | — | 110,717 | — | ||||||||
Proceeds from the sale of property, plant and equipment | — | 85 | 344 | ||||||||
Proceeds from working capital arbitration settlement | — | 1,419 | 7,237 | ||||||||
Acquisition of DenTek, less cash acquired | — | — | (226,984 | ) | |||||||
Acquisition of C.B. Fleet, less cash acquired | — | (803,839 | ) | — | |||||||
Acquisition of Fleet escrow receipt | 970 | — | — | ||||||||
Net cash used in investing activities | (11,562 | ) | (694,595 | ) | (222,971 | ) | |||||
Financing Activities | |||||||||||
Proceeds from issuance of 2016 Senior Notes | 250,000 | — | 350,000 | ||||||||
Repayment of 2012 Senior Notes | — | — | (250,000 | ) | |||||||
Borrowings under Bridge term loans | — | — | 80,000 | ||||||||
Repayments under Bridge term loans | — | — | (80,000 | ) | |||||||
Proceeds from issuance of Term Loan | — | 1,427,000 | — | ||||||||
Term Loan repayments | (444,000 | ) | (862,500 | ) | (60,000 | ) | |||||
Borrowings under revolving credit agreement | 30,000 | 110,000 | 115,000 | ||||||||
Repayments under revolving credit agreement | (45,000 | ) | (105,000 | ) | (96,100 | ) | |||||
Payments of debt origination costs | (500 | ) | (11,140 | ) | (11,828 | ) | |||||
Proceeds from exercise of stock options | 1,620 | 4,028 | 6,689 | ||||||||
Proceeds from restricted stock exercises | — | — | 544 | ||||||||
Fair value of shares surrendered as payment of tax withholding | (1,075 | ) | (1,431 | ) | (2,229 | ) | |||||
Net cash (used in) provided by financing activities | (208,955 | ) | 560,957 | 52,076 | |||||||
Effects of exchange rate changes on cash and cash equivalents | 1,100 | (409 | ) | 497 | |||||||
(Decrease) increase in cash and cash equivalents | (9,307 | ) | 14,625 | 5,912 | |||||||
Cash and cash equivalents - beginning of year | 41,855 | 27,230 | 21,318 | ||||||||
Cash and cash equivalents - end of year | $ | 32,548 | $ | 41,855 | $ | 27,230 | |||||
Interest paid | $ | 98,572 | $ | 85,209 | $ | 79,132 | |||||
Income taxes paid | $ | 24,440 | $ | 47,999 | $ | 15,352 | |||||
See accompanying notes.
61
Prestige Brands Holdings, Inc.
Notes to Consolidated Financial Statements
1. Business and Basis of Presentation
Nature of Business
Prestige Brands Holdings, Inc. (referred to herein as the “Company” or “we”, which reference shall, unless the context requires otherwise, be deemed to refer to Prestige Brands Holdings, Inc. and all of its direct and indirect 100% owned subsidiaries on a consolidated basis) is engaged in the development, manufacturing, marketing, sales and distribution of over-the-counter (“OTC”) healthcare and household cleaning products to mass merchandisers and drug, food, dollar, convenience, and club stores in North America (the United States and Canada) and in Australia and certain other international markets. Prestige Brands Holdings, Inc. is a holding company with no operations and is also the parent guarantor of the senior credit facility and the senior notes described in Note 10 to these Consolidated Financial Statements.
Basis of Presentation
Our Consolidated Financial Statements are prepared in accordance with accounting principles generally accepted in the United States of America ("GAAP"). All significant intercompany transactions and balances have been eliminated in consolidation. Our fiscal year ends on March 31st of each year. References in these Consolidated Financial Statements or notes to a year (e.g., “2018”) mean our fiscal year ended on March 31st of that year.
Use of Estimates
The preparation of financial statements in conformity with GAAP requires management to make estimates and assumptions that affect the reported amounts of assets and liabilities and disclosure of contingent assets and liabilities at the date of the financial statements, as well as the reported amounts of revenues and expenses during the reporting period. Although these estimates are based on our knowledge of current events and actions that we may undertake in the future, actual results could differ from those estimates. As discussed below, our most significant estimates include those made in connection with the valuation of intangible assets, stock-based compensation, fair value of debt, sales returns and allowances, trade promotional allowances and inventory obsolescence, and the recognition of income taxes using an estimated annual effective tax rate.
Reclassification
In accordance with Accounting Standards Update (“ASU”) 2016-09, Compensation - Stock Compensation (Topic 718), we have reclassified cash flows on our Condensed Consolidated Statements of Cash Flows related to excess tax benefits from a financing activity to an operating activity for all periods presented. The impact of the reclassification on our Financial Statements was not material.
Cash and Cash Equivalents
We consider all short-term deposits and investments with original maturities of three months or less to be cash equivalents. At March 31, 2018, approximately 23% of our cash is held by a bank in Sydney, Australia. Substantially all of our remaining cash is held by a large regional bank with headquarters in California. We do not believe that, as a result of this concentration, we are subject to any unusual financial risk beyond the normal risk associated with commercial banking relationships. The Federal Deposit Insurance Corporation (“FDIC”) and Securities Investor Protection Corporation (“SIPC”) insures our domestic balances, up to $250,000 and $500,000, with a $250,000 limit for cash, respectively. Substantially all of the Company's cash balances at March 31, 2018 are uninsured. We had non-cash financing activities in 2018 of $0.6 million relating to the March 2018 debt refinancing (see Note 10 for further details).
Accounts Receivable
We extend non-interest-bearing trade credit to our customers in the ordinary course of business. We maintain an allowance for doubtful accounts receivable based upon historical collection experience and expected collectability of the accounts receivable. In an effort to reduce credit risk, we (i) have established credit limits for all of our customer relationships, (ii) perform ongoing credit evaluations of customers’ financial condition, (iii) monitor the payment history and aging of customers’ receivables, and (iv) monitor open orders against an individual customer’s outstanding receivable balance.
Inventories
Inventories are stated at the lower of cost or net realizable value, where cost is determined by using the first-in, first-out method. We reduce inventories for the diminution of value resulting from product obsolescence, damage or other issues affecting marketability, equal to the difference between the cost of the inventory and its estimated net realizable value. Factors utilized in the determination of estimated net realizable value include (i) current sales data and historical return rates, (ii) estimates of future demand, (iii)
62
competitive pricing pressures, (iv) new product introductions, (v) product expiration dates, and (vi) component and packaging obsolescence.
Property, Plant and Equipment
Property, plant and equipment are stated at cost and are depreciated using the straight-line method based on the following estimated useful lives:
Years | |
Building | 15 - 40 |
Machinery | 3 - 15 |
Computer equipment and software | 3 - 5 |
Furniture and fixtures | 7 - 10 |
Leasehold improvements | * |
*Leasehold improvements are amortized over the lesser of the lease term or the estimated useful life of the related asset.
Expenditures for maintenance and repairs are charged to expense as incurred. When an asset is sold or otherwise disposed of, we remove the cost and associated accumulated depreciation from the respective accounts and recognize the resulting gain or loss in the Consolidated Statements of Income and Comprehensive Income.
Property, plant and equipment are reviewed for impairment whenever events or changes in circumstances indicate that the carrying amount of such assets may not be recoverable. An impairment loss is recognized if the carrying amount of the asset exceeds its fair value.
Goodwill
The excess of the purchase price over the fair market value of assets acquired and liabilities assumed in business combinations is classified as goodwill. Goodwill is not amortized, although the carrying value is tested for impairment at least annually in the fourth fiscal quarter of each year, or more frequently if events or changes in circumstances indicate that the asset may be impaired. Goodwill is tested for impairment at the product group level, which is one level below the operating segment level.
Intangible Assets
Intangible assets, which are comprised primarily of tradenames, are stated at cost less accumulated amortization. For intangible assets with finite lives, amortization is computed using the straight-line method over estimated useful lives, typically ranging from 10 to 30 years.
Indefinite-lived intangible assets are tested for impairment at least annually in the fourth fiscal quarter of each year, or more frequently if events or changes in circumstances indicate that the asset may be impaired. Intangible assets with finite lives are reviewed for impairment whenever events or changes in circumstances indicate that their carrying amount may exceed their fair values and may not be recoverable. An impairment loss is recognized if the carrying amount of the asset exceeds its fair value.
Debt Origination Costs
We have incurred debt origination costs in connection with the issuance of long-term debt. These costs are amortized over the term of the related debt, using the effective interest method for our bonds and our term loan facility and the straight-line method for our revolving credit facility. Costs associated with our revolving credit facility are reported as a long-term asset and costs related to our senior notes and the term loan facility are recorded as a reduction of debt.
Revenue Recognition
Revenues are recognized when the following criteria are met: (i) persuasive evidence of an arrangement exists; (ii) the selling price is fixed or determinable; (iii) the product has been shipped and the customer takes ownership and assumes the risk of loss, and (iv) collection of the resulting receivable is reasonably assured. We have determined that these criteria are met and the transfer of the risk of loss generally occurs when product is received by the customer and, accordingly, we recognize revenue at that time. Provisions are made for estimated discounts related to customer payment terms and estimated product returns at the time of sale based on our historical experience.
As is customary in the consumer products industry, we participate in the promotional programs of our customers to enhance the sale of our products. The cost of these promotional programs varies based on the actual number of units sold during a finite period of time. These promotional programs consist of direct-to-consumer incentives, such as coupons and temporary price reductions, as well as incentives to our customers, such as allowances for new distribution, including slotting fees, and cooperative advertising. Estimates of the costs of these promotional programs are based on (i) historical sales experience, (ii) the current
63
promotional offering, (iii) forecasted data, (iv) current market conditions, and (v) communication with customer purchasing/marketing personnel. We recognize the cost of such sales incentives by recording an estimate of such cost as a reduction of revenue, at the later of (a) the date the related revenue is recognized, or (b) the date when a particular sales incentive is offered. At the completion of the promotional program, the estimated amounts are adjusted to actual results.
Due to the nature of the consumer products industry, we are required to estimate future product returns. Accordingly, we record an estimate of product returns concurrent with recording sales, which is made after analyzing (i) historical return rates, (ii) current economic trends, (iii) changes in customer demand, (iv) product acceptance, (v) seasonality of our product offerings, and (vi) the impact of changes in product formulation, packaging and advertising.
Cost of Sales
Cost of sales includes costs related to the manufacture of our products, including raw materials, direct labor and indirect plant costs (including but not limited to depreciation), warehousing costs, inbound and outbound shipping costs, and handling and storage costs. Warehousing, shipping and handling and storage costs were $64.7 million for 2018, $46.2 million for 2017 and $39.2 million for 2016.
Advertising and Promotion Costs
Advertising and promotion costs are expensed as incurred. Allowances for distribution costs associated with products, including slotting fees, are recognized as a reduction of sales. Under these slotting fee distribution arrangements, the retailers allow our products to be placed on the stores’ shelves in exchange for such fees.
Stock-based Compensation
We recognize stock-based compensation expense by measuring the cost of services to be rendered based on the grant-date fair value of the equity award. Compensation expense is recognized over the period a grantee is required to provide service in exchange for the award, generally referred to as the requisite service period.
Pension Expense
Certain employees of C.B. Fleet Company, Inc. ("Fleet") are covered by defined benefit pension plans. The Company’s policy is to contribute at least the minimum amount required under The Employee Retirement Income Security Act of 1974 ("ERISA"). The Company may elect to make additional contributions. Benefits are based on years of service and levels of compensation. On December 16, 2014, the decision was made to freeze the benefits under the Company's U.S. qualified defined benefit pension plan with an effective date of March 1, 2015.
The funded status of our pension plans is dependent upon many factors, including returns on invested assets and the level of certain market interest rates. We review pension assumptions regularly and we may from time to time make voluntary contributions to our pension plans that exceed the amounts required by statute. Changes in interest rates and the market value of the securities held by the plans could materially change, positively or negatively, the funded status of the plans and affect the level of pension expense and required contributions in fiscal 2019 and beyond.
Income Taxes
On December 22, 2017, the U.S. government enacted comprehensive tax legislation commonly referred to as the Tax Cuts and Jobs Act ("Tax Act"). The Tax Act represents significant U.S. federal tax reform legislation that includes a permanent reduction to the U.S. federal corporate income tax rate. The permanent reduction to the federal corporate income tax rate resulted in a one-time gain of $267.0 million related to the value of our deferred tax liabilities and a gain of $3.2 million related to the lower blended tax rate on our current year earnings, resulting in a net gain of $270.2 million. Additionally, the tax reform legislation subjects certain of our cumulative foreign earnings and profits to U.S. income taxes through a deemed repatriation, which resulted in a charge of $1.9 million during 2018.
Deferred tax assets and liabilities are determined based on the differences between the financial reporting and tax bases of assets and liabilities using the enacted tax rates and laws that will be in effect when the differences are expected to reverse. A valuation allowance is established when necessary to reduce deferred tax assets to the amounts expected to be realized.
The Income Taxes topic of the Financial Accounting Standards Board (“FASB”) Accounting Standards Codification (“ASC”) 740 prescribes a recognition threshold and measurement attributes for the financial statement recognition and measurement of a tax position taken or expected to be taken in a tax return. The guidance only allows the recognition of those tax benefits that have a greater than 50% likelihood of being sustained upon examination by the various taxing authorities. As a result, we have applied such guidance in determining our tax uncertainties.
We are subject to taxation in the United States and various state and foreign jurisdictions.
64
We classify penalties and interest related to unrecognized tax benefits as income tax expense in the Consolidated Statements of Income and Comprehensive Income.
Earnings Per Share
Basic earnings per share is computed based on income available to common stockholders and the weighted-average number of shares of common stock outstanding during the period. Diluted earnings per share is computed based on income available to common stockholders and the weighted-average number of shares of common stock outstanding plus the effect of potentially dilutive common shares outstanding during the period using the treasury stock method, which includes stock options and restricted stock units ("RSUs"). Potential common shares, composed of the incremental common shares issuable upon the exercise of outstanding stock options and unvested RSUs, are included in the diluted earnings per share calculation to the extent that they are dilutive. In loss periods, the assumed exercise of in-the-money stock options and RSUs has an antidilutive effect, and therefore these instruments are excluded from the computation of diluted earnings per share. The following table sets forth the computation of basic and diluted earnings per share:
Year Ended March 31, | |||||||||||
(In thousands, except per share data) | 2018 | 2017 | 2016 | ||||||||
Numerator | |||||||||||
Net income | $ | 339,570 | $ | 69,395 | $ | 99,907 | |||||
Denominator | |||||||||||
Denominator for basic earnings per share - weighted average shares outstanding | 53,099 | 52,976 | 52,754 | ||||||||
Dilutive effect of unvested restricted stock units and options issued to employees and directors | 427 | 386 | 389 | ||||||||
Denominator for diluted earnings per share | 53,526 | 53,362 | 53,143 | ||||||||
Earnings per Common Share: | |||||||||||
Basic net earnings per share | $ | 6.40 | $ | 1.31 | $ | 1.89 | |||||
Diluted net earnings per share | $ | 6.34 | $ | 1.30 | $ | 1.88 | |||||
For 2018, 2017, and 2016 there were 0.4 million, 0.2 million, and less than 0.1 million shares, respectively, attributable to outstanding stock-based awards that were excluded from the calculation of diluted earnings per share because their inclusion would have been anti-dilutive.
Recently Adopted Accounting Pronouncements
In March 2018, the FASB issued ASU 2018-05, Income Taxes (Topic 740). The amendments in this update reflect the income tax accounting implications of the Tax Act. See "Income Taxes" above for a discussion of the Tax Act that was signed into law on December 22, 2017, and the impact it has had and may have on our business and financial results.
In February 2018, the FASB issued ASU 2018-02, Income Statement - Reporting Comprehensive Income (Topic 220): Reclassification of Certain Tax Effects from Accumulated Other Comprehensive Income. The amendments in this update allow a reclassification from accumulated other comprehensive income to retained earnings for stranded tax effects resulting from the Tax Act. See "Income Taxes" above for a discussion of the Tax Act that was signed into law on December 22, 2017, and the impact it has had and may have on our business and financial results. The amendments in this update are effective for all entities for fiscal years beginning after December 15, 2018, and interim periods within those fiscal years. We have early adopted ASU 2018-02 and the adoption did not have a material impact on our consolidated financial statements.
In March 2016, the FASB issued ASU 2016-09, Compensation - Stock Compensation (Topic 718): Improvements to Employee Share-Based Payment Accounting. The amendments in this update involve several aspects of accounting for share-based payment transactions, including income tax consequences, classification of awards and classification on the statement of cash flows. For public business entities, the amendments in this update were effective for annual periods beginning after December 15, 2016, and interim periods within those annual periods. We adopted ASU 2016-09 effective April 1, 2017, and the adoption did not have a material impact on our consolidated financial statements.
65
In July 2015, the FASB issued ASU 2015-11, Simplifying the Measurement of Inventory. The amendments in this update more closely align the measurement of inventory in GAAP with the measurement of inventory in International Financial Reporting Standards, under which an entity should measure inventory at the lower of cost or net realizable value. Net realizable value is the estimated selling price in the ordinary course of business, less reasonably predictable costs of completion, disposal, and transportation. For public business entities, the amendments were effective for fiscal years beginning after December 15, 2016, including interim periods within those fiscal years. Our adoption of ASU 2015-11, effective April 1, 2017, did not have a material impact on our consolidated financial statements.
Recently Issued Accounting Pronouncements
In March 2017, the FASB issued ASU 2017-07, Compensation - Retirement Benefits (Topic 715): Improving the Presentation of Net Periodic Pension Cost and Net Periodic Postretirement Benefit Cost, which changes the presentation of net periodic benefit cost related to employer sponsored defined benefit plans and other postretirement benefits. Service cost should be included in the same income statement line item as other compensation costs arising from services rendered during the period, while other components of net periodic benefit pension cost should be presented separately outside of operating income. Additionally, only service costs may be capitalized in assets. Entities should apply the guidance on the presentation of the components of net periodic benefit cost in the income statement retrospectively. The guidance limiting the capitalization of net periodic benefit cost in assets to the service cost component should be applied prospectively. The standard is effective for annual reporting periods beginning after December 15, 2017. The adoption of this standard will require us to move certain pension costs out of operating income.
In January 2017, the FASB issued ASU 2017-04, Intangibles - Goodwill and Other (Topic 350). The amendments in this update simplify the test for goodwill impairment by eliminating Step 2 from the impairment test, which required the entity to perform procedures to determine the fair value at the impairment testing date of its assets and liabilities following the procedure that would be required in determining fair value of assets acquired and liabilities assumed in a business combination. The amendments in this update are effective for public companies for annual or any interim goodwill impairment tests in fiscal years beginning after December 15, 2019. We are evaluating the impact of adopting this guidance on our consolidated financial statements and whether to early adopt this ASU.
In January 2017, the FASB issued ASU 2017-01, Business Combinations (Topic 805); Clarifying the Definition of a Business. The amendments in this update clarify the definition of a business to help companies evaluate whether transactions should be accounted for as acquisitions or disposals of assets or businesses. The amendments in this update are effective for public companies for annual periods beginning after December 15, 2017, including interim periods within those periods. We will adopt this standard as of the beginning of our fiscal 2019, and we do not expect a material impact to our consolidated financial statements.
In August 2016, the FASB issued ASU 2016-15, Classification of Certain Cash Receipts and Cash Payments. The amendments in this update provide clarification and guidance on eight cash flow classification issues. For public business entities, the amendments in this update are effective for fiscal years beginning after December 15, 2017, and interim periods within those fiscal years. We will adopt this standard as of the beginning of our fiscal 2019, and we do not expect a material impact to our consolidated financial statements.
In February 2016, the FASB issued ASU 2016-02, Leases. The amendments in this update include a new FASB ASC Topic 842, which supersedes Topic 840. The core principle of Topic 842 is that a lessee should recognize the assets and liabilities that arise from leases. For public business entities, the amendments in this update are effective for fiscal years beginning after December 15, 2018, including interim periods within those fiscal years. Early application is permitted for all entities as of the beginning of interim or annual reporting periods. We are evaluating the impact of adopting this guidance on our consolidated financial statements.
In May 2014, the FASB issued ASU 2014-09, Revenue from Contracts with Customers - Topic 606, including new FASB ASC 606, which supersedes the revenue recognition requirements in FASB ASC 605. Along with amendments issued in 2015 and 2016, the new guidance will eliminate industry-specific revenue recognition guidance under current GAAP and replace it with a principle-based approach for determining revenue. The core principle of the new guidance is that an entity should recognize revenue for the transfer of goods and services equal to an amount it expects to be entitled to receive for those goods and services. The new standard will also require additional disclosures regarding the nature, amount, timing and uncertainty of revenue and cash flows arising from customer contracts. The new guidance permits two methods of adoption: retrospectively to each prior reporting period presented (full retrospective method), or retrospectively by recognizing the cumulative effect of initially applying the guidance to all contracts existing at the date of initial application (the modified retrospective method). The ASU, as amended, is effective for annual reporting periods beginning after December 15, 2017.
Our implementation approach included performing a detailed study of the various types of agreements that we have with our customers and assessed conformance of our current accounting practices with the new standard. We will adopt the guidance effective on April 1, 2018 using the modified retrospective method. We are finalizing the accounting policies under the new
66
guidance and determined it may impact the timing of revenue recognition for product sales and the timing of revenue reductions associated with certain customer promotional programs we participate in.
2. Acquisitions
The following acquisitions were accounted for in accordance with Business Combinations topic of the FASB ASC 805, which requires that the total cost of an acquisition be allocated to the tangible and intangible assets acquired and liabilities assumed based upon their respective fair values at the date of acquisition.
Acquisition of Fleet
On January 26, 2017, the Company completed the acquisition of Fleet pursuant to the Agreement and Plan of Merger, dated as of December 22, 2016, for $823.7 million plus cash on hand at closing and subject to certain adjustments related to net working capital. The purchase price was funded by available cash on hand, additional borrowings under our asset-based revolving credit facility, and a new $740.0 million senior secured incremental term loan under the 2012 Term Loan. As a result of the merger, we acquired women's health, gastrointestinal and dermatological care OTC brands, including Summer’s Eve, Fleet, and Boudreaux's Butt Paste, as well as a “mix and fill” manufacturing facility in Lynchburg, Virginia. The financial results from the Fleet acquisition are included in the Company's North American and International OTC Healthcare segments.
We prepared an analysis of the fair values of the assets acquired and liabilities assumed as of the date of acquisition. The following table summarizes our allocation of the assets acquired and liabilities assumed as of the January 26, 2017 acquisition date:
(In thousands) | January 26, 2017 | ||
Cash | $ | 19,884 | |
Accounts receivable | 25,293 | ||
Inventories | 20,812 | ||
Prepaid expenses and other current assets | 17,024 | ||
Property, plant and equipment, net | 38,661 | ||
Goodwill | 273,058 | ||
Intangible assets, net | 747,600 | ||
Other long-term assets | 1,137 | ||
Total assets acquired | 1,143,469 | ||
Accounts payable | 10,412 | ||
Accrued expenses | 22,895 | ||
Deferred income taxes - long term | 261,555 | ||
Other long term liabilities | 24,884 | ||
Total liabilities assumed | 319,746 | ||
Total purchase price | $ | 823,723 | |
Based on this analysis, we allocated $648.7 million to non-amortizable intangible assets and $98.9 million to amortizable intangible assets. We recorded goodwill of $273.1 million based on the amount by which the purchase price exceeded the fair value of the net assets acquired. The goodwill is a result of acquiring and retaining workforces and expected synergies from integrating Fleet's operations into the Company's. Goodwill is not deductible for income tax purposes.
67
The following table provides our unaudited pro forma revenues, net income and net income per basic and diluted common share had the results of Fleet's operations been included in our operations commencing on April 1, 2015, based on available information related to Fleet's operations. This pro forma information is not necessarily indicative either of the combined results of operations that actually would have been realized by us had the Fleet acquisition been consummated at the beginning of the period for which the pro forma information is presented, or of future results.
Year Ended March 31, | ||||||
2017 | 2016 | |||||
(In thousands, except per share data) | (Unaudited) | |||||
Revenues | $ | 1,049,473 | $ | 1,004,698 | ||
Net income | $ | 73,750 | $ | 92,712 | ||
Earnings per share: | ||||||
Basic EPS | $ | 1.39 | $ | 1.76 | ||
Diluted EPS | $ | 1.38 | $ | 1.74 | ||
Acquisition of DenTek
On February 5, 2016, the Company completed the acquisition of DenTek Holdings, Inc. ("DenTek"), a privately-held marketer and distributor of specialty oral care products. The closing was finalized pursuant to the terms of the merger agreement, announced November 23, 2015, under which the Company agreed to acquire DenTek from its stockholders for a purchase price of $226.9 million. The acquisition expanded the Company's portfolio of brands, strengthened its existing oral care platform and increased its geographic reach in parts of Europe. The Company financed the transaction with a combination of available cash on hand, available cash from its asset based loan revolver, and financing of an additional unsecured bridge loan. The DenTek brands are included in the Company's North American and International OTC Healthcare segments.
3. Divestitures and Sale of License Rights
Divestitures
On July 7, 2016, we completed the sale of the Pediacare®, New Skin® and Fiber Choice® brands for $40.0 million plus the cost of inventory. During the year ended March 31, 2017, we recorded a pre-tax loss on sale of $56.2 million. The proceeds were used to repay debt and related income taxes due on the dispositions.
Concurrent with the completion of the sale of these brands, we entered into an option agreement with the buyer to purchase Dermoplast® at a specified earnings multiple as defined in the option agreement. The buyer paid a $1.25 million deposit for this option in September 2016 and later notified us of its election to exercise the option. In December 2016, we completed the sale of the Dermoplast® brand, and in a separate transaction, the e.p.t® brand, for an aggregate amount of $59.6 million. As a result, we recorded a pre-tax net gain on these divestitures of $3.9 million.
Sale of license rights
Historically, we received royalty income from the licensing of the names of certain of our brands in geographic areas or markets in which we do not directly compete. We have had royalty agreements for our Comet brand for several years, which included options on behalf of the licensee to purchase license rights in certain geographic areas and markets in perpetuity. In December 2014, we amended these agreements, and we sold rights to use of the Comet brand in certain Eastern European countries to a third-party licensee in exchange for $10.0 million as a partial early buyout of the license. The amended agreement provided that we would continue to receive royalty payments of $1.0 million per quarter for the remaining geographic areas and also granted the licensee an option to acquire the license rights in the remaining geographic areas any time after June 30, 2016. In July 2016, the licensee elected to exercise its option. In August 2016, we received $11.0 million for the purchase of the remaining license rights and, as a result, we recorded a pre-tax gain of $1.2 million and reduced our indefinite-lived tradenames by $9.0 million. Furthermore, the licensee was no longer required to make additional royalty payments to us, and as a result, our royalty income was reduced accordingly.
68
4. Accounts Receivable
Accounts receivable consist of the following:
March 31, | |||||||
(In thousands) | 2018 | 2017 | |||||
Components of Accounts Receivable | |||||||
Trade accounts receivable | $ | 152,832 | $ | 148,339 | |||
Other receivables | 783 | 1,413 | |||||
153,615 | 149,752 | ||||||
Less allowances for discounts, returns and uncollectible accounts | (12,734 | ) | (13,010 | ) | |||
Accounts receivable, net | $ | 140,881 | $ | 136,742 | |||
5. Inventories
Inventories consist of the following:
March 31, | |||||||
(In thousands) | 2018 | 2017 | |||||
Components of Inventories | |||||||
Packaging and raw materials | $ | 13,112 | $ | 9,984 | |||
Work in process | 157 | 369 | |||||
Finished goods | 105,278 | 105,256 | |||||
Inventories | $ | 118,547 | $ | 115,609 | |||
Inventories are carried and depicted above at the lower of cost or net realizable value, which includes a reduction in inventory values of $4.2 million and $6.6 million at March 31, 2018 and 2017, respectively, related to obsolete and slow-moving inventory.
6. Property, Plant and Equipment
Property, plant and equipment, net consist of the following:
March 31, | |||||||
(In thousands) | 2018 | 2017 | |||||
Components of Property, Plant and Equipment | |||||||
Land | $ | 550 | $ | 550 | |||
Building | 13,746 | 13,156 | |||||
Machinery | 38,599 | 31,456 | |||||
Computer equipment | 18,116 | 15,440 | |||||
Furniture and fixtures | 2,924 | 2,720 | |||||
Leasehold improvements | 8,804 | 7,497 | |||||
82,739 | 70,819 | ||||||
Accumulated depreciation | (30,187 | ) | (20,224 | ) | |||
Property, plant and equipment, net | $ | 52,552 | $ | 50,595 | |||
We recorded depreciation expense of $10.1 million, $6.0 million, and $5.2 million for 2018, 2017, and 2016, respectively.
69
7. Goodwill
The following table summarizes the changes in the carrying value of goodwill by operating segment for each of 2016, 2017, and 2018:
(In thousands) | North American OTC Healthcare | International OTC Healthcare | Household Cleaning | Consolidated | |||||||||||
Balance – March 31, 2016 | $ | 330,615 | $ | 22,776 | $ | 6,800 | $ | 360,191 | |||||||
2017 additions | 258,438 | 10,139 | — | 268,577 | |||||||||||
2017 reductions | (12,600 | ) | — | (555 | ) | (13,155 | ) | ||||||||
Effects of foreign currency exchange rates | — | (361 | ) | — | (361 | ) | |||||||||
Balance – March 31, 2017 | 576,453 | 32,554 | 6,245 | 615,252 | |||||||||||
2018 adjustments (a) | 4,481 | — | — | 4,481 | |||||||||||
Effects of foreign currency exchange rates | — | 365 | — | 365 | |||||||||||
Balance – March 31, 2018 | $ | 580,934 | $ | 32,919 | $ | 6,245 | $ | 620,098 | |||||||
(a) Amount relates to a measurement period adjustment recorded during 2018, associated with our Fleet acquisition.
As further discussed in Note 8, in December 2014, we completed a transaction to sell rights to use of the Comet brand in certain Eastern European countries to a third-party licensee. As a result, we recorded a gain on the sale of $1.3 million and reduced the carrying value of our intangible assets and goodwill. In August 2016, we sold the remaining rights to the use of the Comet brand in certain geographic areas and reduced goodwill by $0.6 million as a result.
As discussed in Note 2, on February 5, 2016, we completed the acquisition of DenTek. In connection with this acquisition, we recorded goodwill of $73.7 million based on the amount by which the purchase price exceeded the fair value of net assets acquired. In December 2016, we received $1.4 million as a result of an arbitration associated with the DenTek acquisition. As a result, we reduced goodwill by $2.8 million, including other post-closing adjustments of $1.4 million.
As discussed in Note 2, on January 26, 2017, we completed the acquisition of Fleet. In connection with this acquisition, we recorded goodwill of $273.1 million based on the amount by which the purchase price exceeded the fair value of the net assets acquired.
On July 7, 2016, we completed the sale of Pediacare®, New Skin® and Fiber Choice® (see Note 3 above for further details) for $40.0 million plus the cost of inventory and reduced goodwill by $2.9 million as a result. In addition, as discussed in Note 3, in connection with this sale, the buyer exercised its option to purchase the Dermoplast® brand. The sale of Dermoplast® was completed on December 30, 2016 and, as a result, we reduced goodwill by $5.5 million.
On December 28, 2016, we completed the sale of the e.p.t® brand and, as a result, we reduced goodwill by $1.4 million.
Under accounting guidelines, goodwill is not amortized, but must be tested for impairment annually, or more frequently if an event occurs or circumstances change that would more likely than not reduce the fair value of the reporting unit below the carrying amount. At February 28, 2018 and February 29, 2017, in conjunction with the annual test for goodwill impairment, there were no indicators of impairment under the analysis. Accordingly, no impairment charge was recorded in 2018 or 2017.
We identify our reporting units in accordance with the FASB ASC Subtopic 280. The carrying value and fair value for intangible assets and goodwill for a reporting unit are calculated based on key assumptions and valuation methodologies previously discussed. The discounted cash flow methodology is a widely-accepted valuation technique utilized by market participants in the transaction evaluation process and has been applied consistently. We also considered our market capitalization at February 28, 2018 and February 29, 2017, as compared to the aggregate fair values of our reporting units, to assess the reasonableness of our estimates pursuant to the discounted cash flow methodology. The estimates and assumptions made in assessing the fair value of our reporting units and the valuation of the underlying assets and liabilities are inherently subject to significant uncertainties. Consequently, changing rates of interest and inflation, declining sales or margins, increases in competition, changing consumer preferences, technical advances, or reductions in advertising and promotion may require an impairment charge to be recorded in the future.
70
As a result of our analysis at February 28, 2018, all reporting units tested had a fair value that exceeded their carrying value by at least 19%.
8. Intangible Assets
A reconciliation of the activity affecting intangible assets, net for each of 2018 and 2017 is as follows:
Year Ended March 31, 2018 | |||||||||||
(In thousands) | Indefinite Lived Tradenames | Finite Lived Tradenames and Customer Relationships | Totals | ||||||||
Gross Amount | |||||||||||
Balance – March 31, 2017 | $ | 2,589,155 | $ | 441,801 | $ | 3,030,956 | |||||
Tradename impairment | (99,300 | ) | (624 | ) | (99,924 | ) | |||||
Effects of foreign currency exchange rates | 448 | 137 | 585 | ||||||||
Balance – March 31, 2018 | $ | 2,490,303 | $ | 441,314 | $ | 2,931,617 | |||||
Accumulated Amortization | |||||||||||
Balance – March 31, 2017 | $ | — | $ | 127,343 | $ | 127,343 | |||||
Additions | — | 23,349 | 23,349 | ||||||||
Effects of foreign currency exchange rates | — | 9 | 9 | ||||||||
Balance – March 31, 2018 | $ | — | $ | 150,701 | $ | 150,701 | |||||
Intangible assets, net – March 31, 2018 | $ | 2,490,303 | $ | 290,613 | $ | 2,780,916 | |||||
Intangible Assets, net by Reportable Segment: | |||||||||||
North American OTC Healthcare | $ | 2,375,736 | $ | 265,356 | $ | 2,641,092 | |||||
International OTC Healthcare | 84,006 | 6,068 | 90,074 | ||||||||
Household Cleaning | 30,561 | 19,189 | 49,750 | ||||||||
Intangible assets, net – March 31, 2018 | $ | 2,490,303 | $ | 290,613 | $ | 2,780,916 | |||||
71
Year Ended March 31, 2017 | |||||||||||
(In thousands) | Indefinite Lived Tradenames | Finite Lived Tradenames and Customer Relationships | Totals | ||||||||
Gross Amount | |||||||||||
Balance – March 31, 2016 | $ | 2,020,046 | $ | 417,880 | $ | 2,437,926 | |||||
Additions | 648,700 | 98,900 | 747,600 | ||||||||
Reclassifications | (2,064 | ) | 2,064 | — | |||||||
Reductions | (77,248 | ) | (76,903 | ) | (154,151 | ) | |||||
Effects of foreign currency exchange rates | (279 | ) | (140 | ) | (419 | ) | |||||
Balance – March 31, 2017 | $ | 2,589,155 | $ | 441,801 | $ | 3,030,956 | |||||
Accumulated Amortization | |||||||||||
Balance – March 31, 2016 | $ | — | $ | 115,203 | $ | 115,203 | |||||
Additions | — | 19,753 | 19,753 | ||||||||
Reductions | — | (7,610 | ) | (7,610 | ) | ||||||
Effects of foreign currency exchange rates | — | (3 | ) | (3 | ) | ||||||
Balance – March 31, 2017 | $ | — | $ | 127,343 | $ | 127,343 | |||||
Intangible assets, net – March 31, 2017 | $ | 2,589,155 | $ | 314,458 | $ | 2,903,613 | |||||
Intangible Assets, net by Reportable Segment: | |||||||||||
North American OTC Healthcare | $ | 2,404,336 | $ | 287,056 | $ | 2,691,392 | |||||
International OTC Healthcare | 83,558 | 6,468 | 90,026 | ||||||||
Household Cleaning | 101,261 | 20,934 | 122,195 | ||||||||
Intangible assets, net – March 31, 2017 | $ | 2,589,155 | $ | 314,458 | $ | 2,903,613 | |||||
As discussed in Note 2, on February 5, 2016, we completed the acquisition of DenTek. In connection with this acquisition, we allocated $206.7 million to intangible assets based on our analysis.
As discussed in Note 2, on January 26, 2017, we completed the acquisition of Fleet. In connection with this acquisition, we allocated $747.6 million to intangible assets based on our analysis.
On July 7, 2016, we completed the sale of the Pediacare®, New Skin® and Fiber Choice® (see Note 3 above for further details) brands for $40.0 million plus the cost of inventory and received $40.1 million, and reduced our indefinite and finite-lived tradenames by $37.2 million and $54.0 million, respectively. During the year ended March 31, 2017, we recorded a pre-tax loss of $56.2 million on the sale of these brands. In addition, as discussed in Note 3, in connection with this sale, the buyer exercised its option to purchase the Dermoplast® brand. The sale of Dermoplast® was completed on December 30, 2016, and we received $48.4 million. As a result, we reduced intangible assets by $31.0 million.
Historically, we received royalty income from the licensing of the names of certain of our brands in geographic areas or markets in which we do not directly compete. We have had royalty agreements for our Comet brand for several years, which included options on behalf of the licensee to purchase license rights in certain geographic areas and markets in perpetuity. In December 2014, we amended these agreements and we sold rights to use of the Comet brand in certain Eastern European countries to a third-party licensee in exchange for $10.0 million as a partial early buyout of the license. The amended agreement provided that we would continue to receive royalty payments of $1.0 million per quarter for the remaining geographic areas and also granted the licensee an option to acquire the license rights in the remaining geographic areas any time after June 30, 2016. In July 2016, the licensee elected to exercise its option. In August 2016, we received $11.0 million for the purchase of the remaining license rights and, as a result, we recorded a pre-tax gain of $1.2 million and reduced our indefinite-lived tradenames by $9.0 million. Furthermore, the licensee is no longer required to make additional royalty payments to us, and as a result, our royalty income was reduced accordingly.
In December 2016, we also completed the sale of the e.p.t brand and, as a result, we reduced intangible assets by $14.8 million.
72
Under accounting guidelines, indefinite-lived assets are not amortized, but must be tested for impairment annually, or more frequently if an event occurs or circumstances change that would more likely than not reduce the fair value of the asset below the carrying amount. Additionally, at each reporting period, an evaluation must be made to determine whether events and circumstances continue to support an indefinite useful life. Intangible assets with finite lives are amortized over their respective estimated useful lives and are also tested for impairment whenever events or changes in circumstances indicate that the carrying value of the asset may not be recoverable and exceeds its fair value.
During the fourth quarter of each fiscal year, we perform our annual impairment analysis. We utilized the excess earnings method to estimate the fair value of our individual indefinite-lived intangible assets. The discount rate utilized in the analyses, as well as future cash flows, may be influenced by such factors as changes in interest rates and rates of inflation. Additionally, should the related fair values of intangible assets be adversely affected as a result of declining sales or margins caused by competition, changing consumer preferences, technological advances or reductions in advertising and promotional expenses, we may be required to record impairment charges in the future.
As a result of our analysis at February 28, 2018, two of our indefinite-lived intangible assets, Beano and Comet, did not exceed the carrying values and as such, impairment charges of $28.6 million and $70.7 million, respectively, were recorded in 2018 relating to these two tradenames, bringing Beano’s indefinite-lived tradename carrying value to $49.8 million and Comet’s indefinite-lived tradename carrying value to $30.6 million.
In addition, we recorded an impairment charge on our Massengill finite-lived intangible tradename of $0.6 million bringing its carrying value to zero. The impairment charges were the result of our reassessment of the long-term sales projections for these brands during our annual planning cycle. In addition, we performed a sensitivity analysis of our weighted average cost of capital and we determined that a 50 basis point increase in the weighted average cost of capital would have resulted in an additional impairment of Beano and Comet totaling $4.2 million. Additionally, a 50 basis point decrease in the terminal growth rate used for each of the Beano and Comet tradenames would have resulted in an additional impairment of $2.3 million.
Beano and Massengill are part of our North American OTC Healthcare segment and Comet is part of our Household Cleaning segment.
The weighted average remaining life for finite-lived intangible assets at March 31, 2018 was approximately 12.5 years, and the amortization expense for the year ended March 31, 2018 was $23.3 million. At March 31, 2018, finite-lived intangible assets are expected to be amortized over their estimated useful life, which ranges from a period of 10 to 30 years, and the estimated amortization expense for each of the five succeeding years and periods thereafter is as follows (in thousands):
(In thousands) | |||
Year Ending March 31, | Amount | ||
2019 | 23,234 | ||
2020 | 23,234 | ||
2021 | 22,812 | ||
2022 | 22,389 | ||
2023 | 22,389 | ||
Thereafter | 176,555 | ||
$ | 290,613 | ||
73
9. Other Accrued Liabilities
Other accrued liabilities consist of the following:
March 31, | |||||||
(In thousands) | 2018 | 2017 | |||||
Accrued marketing costs | $ | 21,473 | $ | 29,384 | |||
Accrued compensation costs | 10,591 | 15,535 | |||||
Accrued broker commissions | 1,487 | 1,782 | |||||
Income taxes payable | 1,901 | 3,840 | |||||
Accrued professional fees | 2,244 | 2,412 | |||||
Accrued production costs | 7,392 | 4,580 | |||||
Income tax related payable | — | 19,000 | |||||
Other accrued liabilities | 7,013 | 7,128 | |||||
$ | 52,101 | $ | 83,661 | ||||
10. Long-Term Debt
2012 Term Loan and 2012 ABL Revolver:
On January 31, 2012, the Borrower entered into a senior secured credit facility, which consists of (i) a $660.0 million term loan facility (the “2012 Term Loan”) with a 7-year maturity and (ii) a $50.0 million asset-based revolving credit facility (the “2012 ABL Revolver”) with a 5-year maturity. In subsequent years, we have utilized portions of our accordion feature to increase the amount of our borrowing capacity under the 2012 ABL Revolver by $85.0 million to $135.0 million and reduced our borrowing rate on the 2012 ABL Revolver by 0.25% (discussed below). The 2012 Term Loan was issued with an original issue discount of 1.5% of the principal amount thereof, resulting in net proceeds to the Borrower of $650.1 million. The 2012 Term Loan is unconditionally guaranteed by Prestige Brands Holdings, Inc. and certain of its domestic 100% owned subsidiaries, other than the Borrower. Each of these guarantees is joint and several. There are no significant restrictions on the ability of any of the guarantors to obtain funds from their subsidiaries or to make payments to the Borrower or the Company.
On February 21, 2013, we entered into Amendment No. 1 ("Term Loan Amendment No. 1") to the 2012 Term Loan. Term Loan Amendment No. 1 provided for the refinancing of all of the Borrower's existing Term B Loans with new Term B-1 Loans (the "Term B-1 Loans"). The interest rate on the Term B-1 Loans under Term Loan Amendment No. 1 was based, at our option, on a LIBOR rate plus a margin of 2.75% per annum, with a LIBOR floor of 1.00%, or an alternate base rate, with a floor of 2.00%, plus a margin. In addition, Term Loan Amendment No. 1 provided the Borrower with certain additional capacity to prepay subordinated debt, the 2012 Senior Notes and certain other unsecured indebtedness permitted to be incurred under the credit agreement governing the 2012 Term Loan and 2012 ABL Revolver.
On September 3, 2014, we entered into Amendment No. 2 ("Term Loan Amendment No. 2") to the 2012 Term Loan. Term Loan Amendment No. 2 provided for (i) the creation of a new class of Term B-2 Loans under the 2012 Term Loan (the "Term B-2 Loans") in an aggregate principal amount of $720.0 million, (ii) increased flexibility under the credit agreement governing the 2012 Term Loan and 2012 ABL Revolver, including additional investment, restricted payment and debt incurrence flexibility and financial maintenance covenant relief, and (iii) an interest rate on (x) the Term B-1 Loans that was based, at our option, on a LIBOR rate plus a margin of 3.125% per annum, with a LIBOR floor of 1.00%, or an alternate base rate, with a floor of 2.00%, plus a margin, and (y) the Term B-2 Loans that was based, at our option, on a LIBOR rate plus a margin of 3.50% per annum, with a LIBOR floor of 1.00%, or an alternate base rate, with a floor of 2.00%, plus a margin (with a margin step-down to 3.25% per annum, based upon achievement of a specified secured net leverage ratio).
Also on September 3, 2014, we entered into Amendment No. 3 ("ABL Amendment No. 3") to the 2012 ABL Revolver. ABL Amendment No. 3 provided for (i) a $40.0 million increase in revolving commitments under the 2012 ABL Revolver and (ii) increased flexibility under the credit agreement governing the 2012 Term Loan and 2012 ABL Revolver, including additional investment, restricted payment and debt incurrence flexibility. Borrowings under the 2012 ABL Revolver, as amended, bear interest at a rate per annum equal to an applicable margin, plus, at our option, either (i) a base rate determined by reference to the highest of (a) the Federal Funds rate plus 0.50%, (b) the prime rate of Citibank, N.A., and (c) the LIBOR rate determined by reference to the cost of funds for U.S. dollar deposits for an interest period of one month, adjusted for certain additional costs, plus 1.00% or (ii) a LIBOR rate determined by reference to the costs of funds for U.S. dollar deposits for the interest period relevant to such borrowing, adjusted for certain additional costs. The applicable margin for borrowings under the 2012 ABL Revolver may be increased to 2.00% or 2.25% for LIBOR borrowings and 1.00% or 1.25% for base-rate borrowings, depending on average
74
excess availability under the 2012 ABL Revolver during the prior fiscal quarter. In addition to paying interest on outstanding principal under the 2012 ABL Revolver, we are required to pay a commitment fee to the lenders under the 2012 ABL Revolver in respect of the unutilized commitments thereunder. The initial commitment fee rate is 0.50% per annum. The commitment fee rate will be reduced to 0.375% per annum at any time when the average daily unused commitments for the prior quarter is less than a percentage of total commitments by an amount set forth in the credit agreement covering the 2012 ABL Revolver. We may voluntarily repay outstanding loans under the 2012 ABL Revolver at any time without a premium or penalty.
On May 8, 2015, we entered into Amendment No. 3 ("Term Loan Amendment No. 3") to the 2012 Term Loan. Term Loan Amendment No. 3 provided for (i) the creation of a new class of Term B-3 Loans under the 2012 Term Loan (the "Term B-3 Loans") in an aggregate principal amount of $852.5 million, which combined the outstanding balances of the Term B-1 Loans of $207.5 million and the Term B-2 Loans of $645.0 million, and (ii) increased flexibility under the credit agreement governing the 2012 Term Loan and 2012 ABL Revolver, including additional investment, restricted payment, and debt incurrence flexibility and financial maintenance covenant relief. The maturity date of the Term B-3 Loans remained the same as the Term B-2 Loans' original maturity date of September 3, 2021.
On June 9, 2015, we entered into Amendment No. 4 (“ABL Amendment No. 4”) to the 2012 ABL Revolver. ABL Amendment No. 4 provided for (i) a $35.0 million increase in the accordion feature under the 2012 ABL Revolver and (ii) increased flexibility under the credit agreement governing the 2012 Term Loan and the 2012 ABL Revolver, including additional investment, restricted payment, and debt incurrence flexibility and financial maintenance covenant relief and (iii) extended the maturity date of the 2012 ABL Revolver to June 9, 2020, which is five years from the effective date of ABL Amendment No. 4.
In connection with the DenTek acquisition on February 5, 2016, we entered into Amendment No. 5 (“ABL Amendment No. 5”) to the 2012 ABL Revolver. ABL Amendment No. 5 temporarily suspended certain financial and related reporting covenants in the 2012 ABL Revolver until the earliest of (i) the date that was 60 calendar days following February 4, 2016, (ii) the date upon which certain of DenTek’s assets were included in the Company’s borrowing base under the 2012 ABL Revolver and (iii) the date upon which the Company received net proceeds from an offering of debt securities.
In connection with the Fleet acquisition, on January 26, 2017, we entered into Amendment No. 4 ("Term Loan Amendment No. 4") to the 2012 Term Loan. Term Loan Amendment No. 4 provided for (i) the refinancing of all of our outstanding term loans and the creation of a new class of Term B-4 Loans under the 2012 Term Loan (the "Term B-4 Loans") in an aggregate principal amount of $1,427.0 million and (ii) increased flexibility under the credit agreement governing the 2012 Term Loan and the 2012 ABL Revolver, including additional investment, restricted payment, and debt incurrence flexibility and financial maintenance covenant relief. In addition, Citibank, N.A. was succeeded by Barclays Bank PLC as administrative agent under the 2012 Term Loan.
Also on January 26, 2017, we entered into Amendment No. 6 ("ABL Amendment No. 6") to the 2012 ABL Revolver. ABL Amendment No. 6 provides for (i) a $40.0 million increase in revolving commitments under the 2012 ABL Revolver, (ii) an extension of the maturity date of revolving commitments to January 26, 2022, and (iii) increased flexibility under the credit agreement governing the 2012 Term Loan and the 2012 ABL Revolver, including additional investment, restricted payment and debt incurrence flexibility consistent with Term Loan Amendment No. 4. We may voluntarily repay outstanding loans under the 2012 ABL Revolver at any time without a premium or penalty.
On March 21, 2018, we entered into Amendment No. 5 (“Term Loan Amendment No. 5”) to the 2012 Term Loan. Term Loan Amendment No. 5 ("Term B-5 Loans") provided for the repricing of the Term B-4 Loans under the Credit Agreement to an interest rate that is based, at our option, on a LIBOR rate plus a margin of 2.00% per annum, with a LIBOR floor of 0.00%, or an alternative base rate plus a margin of 1.00% per annum with a floor of 1.00%.
For the year ended March 31, 2018, the average interest rate on the 2012 Term Loan was 4.5%. For the year ended March 31, 2018, the average interest rate on the amounts borrowed under the 2012 ABL Revolver was 2.7%.
2013 Senior Notes:
On December 17, 2013, the Borrower issued $400.0 million of senior unsecured notes, with an interest rate of 5.375% and a maturity date of December 15, 2021 (the "2013 Senior Notes"). The Borrower may redeem some or all of the 2013 Senior Notes at redemption prices set forth in the indenture governing the 2013 Senior Notes. The 2013 Senior Notes are guaranteed by Prestige Brands Holdings, Inc. and certain of its 100% domestic owned subsidiaries, other than the Borrower. Each of these guarantees is joint and several. There are no significant restrictions on the ability of any of the guarantors to obtain funds from their subsidiaries or to make payments to the Borrower or the Company.
2016 Senior Notes:
75
On February 19, 2016, the Borrower completed the sale of $350.0 million aggregate principal amount of 6.375% senior notes due March 1, 2024 (the “Initial Notes”), pursuant to a purchase agreement, dated February 16, 2016, among the Borrower, the guarantors party thereto (the “Guarantors”) and the initial purchasers party thereto. The 2016 Senior Notes are guaranteed by Prestige Brands Holdings, Inc. and certain of its domestic 100% owned subsidiaries, other than the Borrower. Each of these guarantees is joint and several. There are no significant restrictions on the ability of any of the Guarantors to obtain funds from their subsidiaries or to make payments to the Borrower or the Company.
The 2016 Senior Notes were issued pursuant to an indenture, dated February 19, 2016 (the “Indenture”). The Indenture provides, among other things, that interest will be payable on the 2016 Senior Notes on March 1 and September 1 of each year, beginning on September 1, 2016, until their maturity date of March 1, 2024. The 2016 Senior Notes are senior unsecured obligations of the Borrower.
On March 21, 2018, we completed the sale of $250.0 million aggregate principal amount of 6.375% senior notes due 2024 (the “Additional Notes”), at an issue price of 101.0%, pursuant to a purchase agreement, dated March 16, 2018, among Prestige Brands, the guarantors party thereto and the initial purchasers party thereto. The Additional Notes are senior unsecured obligations of Prestige Brands and are guaranteed by each of Prestige Brands’ domestic subsidiaries that guarantee its obligations under the 2012 Term Loan. We used the proceeds from the issuance of the Additional Notes to repay a portion of our outstanding obligations under the 2012 Term Loan and to pay related fees and expenses. The Additional Notes will be treated as a single series with the $350.0 million aggregate principle amount of Initial Notes (the Initial Notes and, together with the Additional Notes, the “2016 Senior Notes”).
Redemptions and Restrictions:
On or after December 15, 2016, we have had the option to redeem some or all of the 2013 Senior Notes at redemption prices set forth in the indenture governing the 2013 Senior Notes. In addition, at any time prior to December 15, 2016, we had the option to redeem up to 35% of the aggregate principal amount of the 2013 Senior Notes at a redemption price equal to 105.375% of the principal amount thereof, plus accrued and unpaid interest, if any, to the redemption date, with the net cash proceeds of certain equity offerings, provided that certain conditions were met. Subject to certain limitations, in the event of a change of control (as defined in the indenture governing the 2013 Senior Notes), the Borrower will be required to make an offer to purchase the 2013 Senior Notes at a price equal to 101% of the aggregate principal amount of the 2013 Senior Notes repurchased, plus accrued and unpaid interest, if any, to the date of repurchase.
We have the option to redeem all or a portion of the 2016 Senior Notes at any time on or after March 1, 2019 at the redemption prices set forth in the Indenture, plus accrued and unpaid interest, if any. We may also redeem all or any portion of the 2016 Senior Notes at any time prior to March 1, 2019, at a price equal to 100% of the aggregate principal amount of notes redeemed, plus a "make-whole premium" calculated as set forth in the Indenture and accrued and unpaid interest, if any. In addition, before March 1, 2019, we may redeem up to 40% of the aggregate principal amount of the 2016 Senior Notes with the net proceeds of certain equity offerings, at the redemption price set forth in the Indenture, provided that certain conditions are met. Subject to certain limitations, in the event of a change of control (as defined in the Indenture), we will be required to make an offer to purchase the 2016 Senior Notes at a price equal to 101% of the aggregate principal amount of the notes repurchased, plus accrued and unpaid interest, if any, to the date of repurchase.
The indentures governing the 2013 Senior Notes and the 2016 Senior Notes contain provisions that restrict us from undertaking specified corporate actions, such as asset dispositions, acquisitions, dividend payments, repurchases of common shares outstanding, changes of control, incurrences of indebtedness, issuance of equity, creation of liens, making of loans and transactions with affiliates. Additionally, the credit agreement governing the 2012 Term Loan and the 2012 ABL Revolver and the indentures governing the 2013 Senior Notes and the 2016 Senior Notes contain cross-default provisions, whereby a default pursuant to the terms and conditions of certain indebtedness will cause a default on the remaining indebtedness under the credit agreement governing the 2012 Term Loan and the 2012 ABL Revolver and the indentures governing the 2013 Senior Notes and the 2016 Senior Notes. At March 31, 2018, we were in compliance with the covenants under our long-term indebtedness.
At March 31, 2018, we had an aggregate of $1.1 million of unamortized debt costs related to the 2012 ABL Revolver included in other long-term assets, and $20.0 million of unamortized debt costs included in long-term debt costs, the total of which is comprised of $3.7 million related to the 2013 Senior Notes, $5.0 million related to the 2016 Senior Notes, and $11.3 million related to the 2012 Term Loan.
At March 31, 2017 we had an aggregate of $1.3 million of unamortized debt costs related to the 2012 ABL Revolver included in other long-term assets, and $28.3 million of unamortized debt costs included in long-term debt costs, the total of which is comprised of $4.6 million related to the 2013 Senior Notes, $4.9 million related to the 2016 Senior Notes, and $18.8 million related to the 2012 Term Loan.
76
At March 31, 2018, we had $75.0 million outstanding on the 2012 ABL Revolver and a borrowing capacity of $96.6 million.
Long-term debt consists of the following, as of the dates indicated:
(In thousands, except percentages) | March 31, 2018 | March 31, 2017 | ||||||
2016 Senior Notes bearing interest at 6.375%, with interest payable on March 1 and September 1 of each year. The 2016 Senior Notes mature on March 1, 2024. | $ | 600,000 | $ | 350,000 | ||||
2013 Senior Notes bearing interest at 5.375%, with interest payable on June 15 and December 15 of each year. The 2013 Senior Notes mature on December 15, 2021. | 400,000 | 400,000 | ||||||
2012 Term B-5 Loans bearing interest at the Borrower's option at either LIBOR plus a margin of 2.00%, with a LIBOR floor of 0.00%, or an alternate base rate plus a margin of 1.00% with a floor of 1.00% due on January 26, 2024. | 938,000 | 1,382,000 | ||||||
2012 ABL Revolver bearing interest at the Borrower's option at either a base rate plus applicable margin or LIBOR plus applicable margin. Any unpaid balance is due on January 26, 2022. | 75,000 | 90,000 | ||||||
Total long-term debt (including current portion) | 2,013,000 | 2,222,000 | ||||||
Current portion of long-term debt | — | — | ||||||
Long-term debt | 2,013,000 | 2,222,000 | ||||||
Less: unamortized debt costs | (20,048 | ) | (28,268 | ) | ||||
Long-term debt, net | $ | 1,992,952 | $ | 2,193,732 | ||||
As of March 31, 2018, aggregate future principal payments required in accordance with the terms of the 2012 Term Loan, 2012 ABL Revolver and the indentures governing the 2016 Senior Notes and the 2013 Senior Notes are as follows:
(In thousands) | ||||
Year Ending March 31, | Amount | |||
2019 | $ | — | ||
2020 | — | |||
2021 | — | |||
2022 | 477,000 | |||
2023 | 9,750 | |||
Thereafter | 1,526,250 | |||
$ | 2,013,000 | |||
11. Fair Value Measurements
For certain of our financial instruments, including cash, accounts receivable, accounts payable and other current liabilities, the carrying amounts approximate their respective fair values due to the relatively short maturity of these amounts.
The Fair Value Measurements and Disclosures topic of the FASB ASC 820 requires fair value to be determined based on the exchange price that would be received for an asset or paid to transfer a liability in the principal or most advantageous market assuming an orderly transaction between market participants. The Fair Value Measurements and Disclosures topic established market (observable inputs) as the preferred source of fair value, to be followed by the Company's assumptions of fair value based on hypothetical transactions (unobservable inputs) in the absence of observable market inputs. Based upon the above, the following fair value hierarchy was created:
Level 1 - Quoted market prices for identical instruments in active markets;
Level 2 - Quoted prices for similar instruments in active markets, as well as quoted prices for identical or similar instruments in markets that are not considered active; and
Level 3 - Unobservable inputs developed by the Company using estimates and assumptions reflective of those that would be utilized by a market participant.
77
The market values have been determined based on market values for similar instruments adjusted for certain factors. As such, the 2016 Senior Notes, the 2013 Senior Notes, the Term B-5 Loans, and the 2012 ABL Revolver are measured in Level 2 of the above hierarchy (see summary below detailing the carrying amounts and estimated fair values of these borrowings at March 31, 2018 and 2017).
March 31, 2018 | March 31, 2017 | |||||||||||||||
(In thousands) | Carrying Value | Fair Value | Carrying Value | Fair Value | ||||||||||||
2016 Senior Notes | $ | 600,000 | $ | 610,500 | $ | 350,000 | $ | 367,500 | ||||||||
2013 Senior Notes | 400,000 | 402,000 | 400,000 | 409,000 | ||||||||||||
2012 Term B-5 Loans | 938,000 | 939,173 | 1,382,000 | 1,395,820 | ||||||||||||
2012 ABL Revolver | 75,000 | 75,000 | 90,000 | 90,000 | ||||||||||||
At March 31, 2018 and 2017, we did not have any assets or liabilities measured in Level 1 or 3. During 2018, 2017 and 2016, there were no transfers of assets or liabilities between Levels 1, 2 and 3.
In accordance with ASU 2015-07, Fair Value Measurement (Topic 820): Disclosures for Investments in Certain Entities That Calculate Net Asset Value per Share (or Its Equivalent), investments that are measured at fair value using net asset value ("NAV") per share as a practical expedient have not been classified in the fair value hierarchy.
12. Stockholders' Equity
The Company is authorized to issue 250.0 million shares of common stock, $0.01 par value per share, and 5.0 million shares of preferred stock, $0.01 par value per share. The Board of Directors may direct the issuance of the undesignated preferred stock in one or more series and determine preferences, privileges and restrictions thereof.
Each share of common stock has the right to one vote on all matters submitted to a vote of stockholders. The holders of common stock are also entitled to receive dividends whenever funds are legally available and when declared by the Board of Directors, subject to prior rights of holders of all classes of stock outstanding having priority rights as to dividends. No dividends have been declared or paid on the Company's common stock through March 31, 2018.
Pursuant to the provisions of various employee restricted stock awards, we repurchased 20,549 shares and 25,768 shares of restricted common stock from our employees during the years ended March 31, 2018 and 2017, respectively. The repurchases during the years ended March 31, 2018 and 2017 were at an average price of $52.33 and $55.51, respectively. All of the repurchased shares have been recorded as treasury stock.
13. Share-Based Compensation
In connection with our initial public offering, the Board of Directors adopted the 2005 Long-Term Equity Incentive Plan (the “Plan”), which provides for grants of up to a maximum of 5.0 million shares of restricted stock, stock options, restricted stock units ("RSUs") and other equity-based awards. In June 2014, the Board of Directors approved, and in July 2014, the stockholders ratified, an increase of an additional 1.8 million shares of our common stock for issuance under the Plan, an increase of the maximum number of shares subject to stock options that may be awarded to any one participant under the Plan during any fiscal 12-month period from 1.0 million to 2.5 million shares, and an extension of the term of the Plan by ten years, to February 2025. Directors, officers and other employees of the Company and its subsidiaries, as well as others performing services for the Company, are eligible for grants under the Plan.
During 2018, pre-tax share-based compensation costs charged against income and the related income tax benefit recognized were $8.9 million and $1.8 million, respectively.
During 2017, pre-tax share-based compensation costs charged against income and the related income tax benefit recognized were $8.1 million and $2.6 million, respectively.
During 2016, pre-tax share-based compensation costs charged against income and the related income tax benefit recognized were $10.0 million and $3.5 million, respectively.
78
At March 31, 2018, there were $8.2 million of unrecognized compensation costs related to nonvested share-based compensation arrangements under the Plan, based on management’s estimate of the shares that will ultimately vest. We expect to recognize such costs over a weighted-average period of 0.8 years. The total fair value of options and restricted shares vested during 2018, 2017, and 2016 was $6.8 million, $6.0 million and $7.0 million, respectively. Cash received from the exercise of stock options was $1.6 million during 2018, and we realized $1.1 million in tax benefits for the tax deductions resulting from RSU issuances and option exercises in 2018. Cash received from the exercise of stock options was $4.0 million during 2017, and we realized $2.0 million in tax benefits for the tax deductions resulting from RSU issuances and option exercises in 2017. Cash received from the exercise of stock options was $6.7 million during 2016, and we realized $3.6 million in tax benefits for the tax deductions from RSU issuances and option exercises in 2016. At March 31, 2018, there were 2.2 million shares available for issuance under the Plan.
On May 8, 2017, the Compensation and Talent Management Committee of our Board of Directors granted 35,593 performance units, 54,773 RSUs and stock options to acquire 182,823 shares of our common stock to certain executive officers and employees under the Plan.
Pursuant to the Plan, each of the independent members of the Board of Directors received a grant of 2,564 RSUs on August 1, 2017. The RSUs are fully vested upon receipt of the award and will be settled by delivery to the director of one share of common stock of the Company for each vested RSU promptly following the earliest of the director's (i) death, (ii) disability or (iii) the six-month anniversary of the date on which the director's Board membership ceases for reasons other than death or disability.
Restricted Stock Units
Restricted stock units granted to employees under the Plan generally vest in three years, primarily upon the attainment of certain time vesting thresholds, and, in the case of performance share units, may also be contingent on the attainment of certain performance goals of the Company, including revenue and earnings before income taxes, depreciation and amortization targets. The RSUs provide for accelerated vesting if there is a change of control, as defined in the Plan. The RSUs granted to employees generally vest either ratably over three years or in their entirety on the three-year anniversary of the date of the grant. Upon vesting, the units will be settled in shares of our common stock. Termination of employment prior to vesting will result in forfeiture of the RSUs, unless otherwise accelerated by the Compensation and Talent Management Committee or, in the case of RSUs granted in May 2017, subject to pro-rata vesting in the event of death, disability or retirement. The RSUs granted to directors vest immediately upon grant, and will be settled by delivery to the director of one share of common stock of the Company for each vested RSU promptly following the earliest of the director's (i) death, (ii) disability or (iii) six-month anniversary of the date on which the director's Board membership ceases for reasons other than death or disability.
The fair value of the RSUs is determined using the closing price of our common stock on the date of the grant.
79
A summary of the Company’s RSUs granted under the Plan is presented below:
RSUs | Shares (in thousands) | Weighted-Average Grant-Date Fair Value | |||||
Vested and nonvested at March 31, 2015 | 362.3 | $ | 22.74 | ||||
Granted | 266.1 | 42.41 | |||||
Vested and issued | (155.6 | ) | 18.31 | ||||
Forfeited | (5.0 | ) | 39.61 | ||||
Vested and nonvested at March 31, 2016 | 467.8 | 35.22 | |||||
Vested at March 31, 2016 | 69.8 | 14.76 | |||||
Granted | 68.4 | 55.44 | |||||
Vested and issued | (94.7 | ) | 28.51 | ||||
Forfeited | (91.4 | ) | 41.71 | ||||
Vested and nonvested at March 31, 2017 | 350.1 | 39.29 | |||||
Vested at March 31, 2017 | 63.4 | 20.12 | |||||
Granted | 105.8 | 55.61 | |||||
Vested and issued | (53.3 | ) | 34.30 | ||||
Forfeited | (9.1 | ) | 48.76 | ||||
Vested and nonvested at March 31, 2018 | 393.5 | 44.13 | |||||
Vested at March 31, 2018 | 90.5 | 29.88 | |||||
Options
The Plan provides that the exercise price of options granted shall be no less than the fair market value of the Company's common stock on the date the options are granted. Options granted have a term of no greater than ten years from the date of grant and vest in accordance with a schedule determined at the time the option is granted, generally three to five years. The option awards provide for accelerated vesting in the event of a change in control, as defined in the Plan. Except in the case of death, disability or retirement, termination of employment prior to vesting will result in forfeiture of the unvested stock options. Vested stock options will remain exercisable by the employee after termination of employment, subject to the terms in the Plan.
The fair value of each option award is estimated on the date of grant using the Black-Scholes Option Pricing Model that uses the assumptions noted in the table below. Expected volatilities are based on the historical volatility of our common stock and other factors, including the historical volatilities of comparable companies. We use appropriate historical data, as well as current data, to estimate option exercise and employee termination behaviors. Employees that are expected to exhibit similar exercise or termination behaviors are grouped together for the purposes of valuation. The expected terms of the options granted are derived from our historical experience, management’s estimates, and consideration of information derived from the public filings of companies similar to us, and represent the period of time that options granted are expected to be outstanding. The risk-free rate represents the yield on U.S. Treasury bonds with a maturity equal to the expected term of the granted options.
The weighted-average grant-date fair values of the options granted during 2018, 2017, and 2016 were $21.20, $21.75, and $17.24, respectively.
Year Ended March 31, | ||||||||
2018 | 2017 | 2016 | ||||||
Expected volatility | 35.2 | % | 37.8 | % | 40.2 | % | ||
Expected dividends | — | — | — | |||||
Expected term in years | 6.0 | 6.0 | 6.0 | |||||
Risk-free rate | 2.2 | % | 1.7 | % | 1.7 | % | ||
80
A summary of option activity under the Plan is as follows:
Options | Shares (in thousands) | Weighted-Average Exercise Price | Weighted- Average Remaining Contractual Term | Aggregate Intrinsic Value (in thousands) | |||||||||
Outstanding at March 31, 2015 | 871.2 | $ | 23.40 | ||||||||||
Granted | 208.2 | 42.13 | |||||||||||
Exercised | (348.0 | ) | 19.22 | ||||||||||
Forfeited or expired | (3.7 | ) | 35.72 | ||||||||||
Outstanding at March 31, 2016 | 727.7 | 30.70 | |||||||||||
Granted | 264.3 | 55.86 | |||||||||||
Exercised | (126.8 | ) | 31.75 | ||||||||||
Forfeited or expired | (92.9 | ) | 42.66 | ||||||||||
Outstanding at March 31, 2017 | 772.3 | 37.70 | |||||||||||
Granted | 182.8 | 56.11 | |||||||||||
Exercised | (55.7 | ) | 29.08 | ||||||||||
Forfeited or expired | (26.2 | ) | 48.19 | ||||||||||
Outstanding at March 31, 2018 | 873.2 | 41.79 | 7.0 | $ | 2,985 | ||||||||
Exercisable at March 31, 2018 | 495.0 | 32.41 | 5.8 | $ | 2,985 | ||||||||
The aggregate intrinsic value of options exercised during 2018, 2017 and 2016 was $1.2 million, $3.2 million and $8.6 million, respectively.
14. Accumulated Other Comprehensive Loss
The table below presents accumulated other comprehensive loss (“AOCI”), which affects equity and results from recognized transactions and other economic events, other than transactions with owners in their capacity as owners.
AOCI consisted of the following at March 31, 2018 and 2017:
March 31, | March 31, | ||||||
(In thousands) | 2018 | 2017 | |||||
Components of Accumulated Other Comprehensive Loss | |||||||
Cumulative translation adjustment | $ | (20,398 | ) | $ | (26,100 | ) | |
Unrecognized net gain (loss) on pension plans | 1,083 | (252 | ) | ||||
Accumulated other comprehensive loss, net of tax | $ | (19,315 | ) | $ | (26,352 | ) | |
As of March 31, 2018 and 2017, no amounts were reclassified from accumulated other comprehensive income into earnings.
15. Income Taxes
On December 22, 2017, the U.S. government enacted comprehensive tax legislation commonly referred to as the Tax Cuts and Jobs Act ("Tax Act"). The Tax Act represents significant U.S. federal tax reform legislation that includes a permanent reduction to the U.S. federal corporate income tax rate. The permanent reduction to the federal corporate income tax rate resulted in a one-time gain of $267.0 million related to the value of our deferred tax liabilities and a gain of $3.2 million related to the lower blended tax rate on our current year earnings, resulting in a net gain of $270.2 million. Additionally, the tax reform legislation subjects certain of our cumulative foreign earnings and profits to U.S. income taxes through a deemed repatriation, which resulted in a charge of $1.9 million during 2018.
81
The changes included in the Tax Act are broad and complex. The final transition impacts of the Tax Act may differ from the above estimate, possibly materially, due to, among other things, changes in interpretations of the Tax Act, any legislative action to address questions that arise because of the Tax Act, any changes in accounting standards for income taxes or related interpretations in response to the Tax Act, or any updates or changes to estimates the Company has utilized to calculate the transition impacts, including impacts from changes to current year earnings estimates and foreign exchange rates of foreign subsidiaries. The U.S. Securities and Exchange Commission has issued rules that would allow for a measurement period of up to one year after the enactment date of the Tax Act to finalize the recording of the related tax impacts. We currently anticipate finalizing and recording any resulting adjustments by the end of the measurement period.
Income before income taxes consists of the following:
Year Ended March 31, | |||||||||||
(In thousands) | 2018 | 2017 | 2016 | ||||||||
United States | $ | 84,435 | $ | 93,582 | $ | 142,253 | |||||
Foreign | 22,651 | 17,268 | 14,932 | ||||||||
$ | 107,086 | $ | 110,850 | $ | 157,185 | ||||||
The provision for income taxes consists of the following:
Year Ended March 31, | |||||||||||
(In thousands) | 2018 | 2017 | 2016 | ||||||||
Current | |||||||||||
Federal | $ | 31,327 | $ | 40,183 | $ | 6,080 | |||||
State | 2,686 | 2,808 | 1,171 | ||||||||
Foreign | 5,588 | 4,242 | 3,905 | ||||||||
Deferred | |||||||||||
Federal | (270,796 | ) | (5,421 | ) | 44,787 | ||||||
State | (1,240 | ) | (163 | ) | 1,678 | ||||||
Foreign | (49 | ) | (194 | ) | (343 | ) | |||||
Total (benefit) provision for income taxes | $ | (232,484 | ) | $ | 41,455 | $ | 57,278 | ||||
82
The principal components of our deferred tax balances are as follows:
March 31, | |||||||
(In thousands) | 2018 | 2017 | |||||
Deferred Tax Assets | |||||||
Allowance for doubtful accounts and sales returns | $ | 2,806 | $ | 5,280 | |||
Inventory capitalization | 1,176 | 1,881 | |||||
Inventory reserves | 540 | 1,880 | |||||
Net operating loss carryforwards | 609 | 609 | |||||
State income taxes | 10,154 | 17,727 | |||||
Accrued liabilities | 2,210 | 2,174 | |||||
Accrued compensation | 4,992 | 9,574 | |||||
Stock compensation | 5,038 | 5,790 | |||||
Other | 4,975 | 7,925 | |||||
Total deferred tax assets | $ | 32,500 | $ | 52,840 | |||
Deferred Tax Liabilities | |||||||
Property, plant and equipment | $ | (6,032 | ) | $ | (9,157 | ) | |
Intangible assets | (467,388 | ) | (754,322 | ) | |||
Total deferred tax liabilities | $ | (473,420 | ) | $ | (763,479 | ) | |
Net deferred tax liability before valuation allowance | $ | (440,920 | ) | $ | (710,639 | ) | |
Valuation allowance | (609 | ) | (3,437 | ) | |||
Net deferred tax liability | $ | (441,529 | ) | $ | (714,076 | ) | |
The net deferred tax liability shown above is net of $1.0 million of long-term deferred tax assets as of March 31, 2018 and $1.0 million of long-term deferred tax assets as of March 31, 2017.
At March 31, 2018 and 2017, we have a valuation allowance of $0.6 million and $3.4 million, respectively, related to certain deferred tax assets acquired from Fleet that we have concluded are not more likely than not to be realized. The decrease in the valuation allowance related to the reclassification of $2.8 million into our uncertain tax liability.
A reconciliation of the effective tax rate compared to the statutory U.S. Federal tax rate is as follows:
Year Ended March 31, | ||||||||||||||||||||
2018 | 2017 | 2016 | ||||||||||||||||||
(In thousands) | % | % | % | |||||||||||||||||
Income tax provision at statutory rate | $ | 37,480 | 35.0 | $ | 38,798 | 35.0 | $ | 55,015 | 35.0 | |||||||||||
Foreign tax benefit | (2,084 | ) | (1.9 | ) | (2,322 | ) | (2.1 | ) | (2,894 | ) | (1.8 | ) | ||||||||
State income taxes, net of federal income tax benefit | 1,414 | 1.3 | 1,820 | 1.7 | 3,284 | 2.0 | ||||||||||||||
Impact of tax legislation | (268,244 | ) | (250.5 | ) | — | — | — | — | ||||||||||||
Goodwill adjustment for sale of asset | — | — | 3,208 | 2.9 | — | — | ||||||||||||||
Nondeductible transaction costs | — | — | 686 | 0.6 | 1,071 | 0.7 | ||||||||||||||
Nondeductible compensation | — | — | 342 | 0.3 | 758 | 0.5 | ||||||||||||||
Other | (1,050 | ) | (1.0 | ) | (1,077 | ) | (1.0 | ) | 44 | — | ||||||||||
Total (benefit) provision for income taxes | $ | (232,484 | ) | (217.1 | ) | $ | 41,455 | 37.4 | $ | 57,278 | 36.4 | |||||||||
Uncertain tax liability activity is as follows:
83
2018 | 2017 | 2016 | |||||||||
(In thousands) | |||||||||||
Balance – beginning of year | $ | 3,651 | $ | 4,084 | $ | 3,420 | |||||
Additions based on tax positions related to the current year | 7,286 | 583 | 664 | ||||||||
Reductions based on lapse of statute of limitations | (110 | ) | (1,016 | ) | — | ||||||
Balance – end of year | $ | 10,827 | $ | 3,651 | $ | 4,084 | |||||
We recognize interest and penalties related to uncertain tax positions as a component of income tax expense. We did not incur any material interest or penalties related to income taxes in 2016, 2017 or 2018. The amount of unrecognized tax benefits at March 31, 2018, 2017, and 2016 was $10.8 million, $3.7 million, and $4.1 million, respectively, which would reduce the effective tax rate by 10.1%, 3.3%, and 2.6%, respectively, if recognized. We do not anticipate any events or circumstances that would cause a significant change to these uncertainties during the ensuing year. We are subject to taxation in the United States and various state and foreign jurisdictions, and we are generally open to examination from the year ended March 31, 2015 forward.
Pursuant to The Tax Act, we recognized a tax liability on any unrepatriated foreign earnings generated through December 31, 2017. Any future foreign earnings may be eligible for the dividends received deduction. As a result, the Company no longer maintains an assertion that any of its foreign earnings are indefinitely reinvested. Consequently, the Company has recorded the U.S. and local country tax effects of repatriating any unremitted foreign earnings.
16. Employee Retirement Plans
We have a defined contribution plan in which all U.S. full-time employees (excluding those employees of the recently acquired Fleet business discussed below) are eligible to participate. The participants may contribute from 1% to 70% of their compensation, as defined in the plan. We match 100% of the first 3%, plus 50% of the next 3% of each participant's base compensation with full vesting immediately. We may also make additional contributions to the plan as determined by the Board of Directors. The total expense for the defined contribution plan was less than $0.1 million for 2018.
In conjunction with the acquisition of Fleet (see Note 2), we assumed a number of additional employee retirement plans including a defined contribution plan and two defined benefit plans. All U.S. full-time employees of Fleet are eligible to participate in Fleet's defined contribution plan. The participants may contribute from 2% to 50% of their compensation, as defined in the plan. We match 100% of the first 6% of each participant's base compensation with full vesting upon entering the plan. The Company's contribution is reduced by the amount of forfeitures that occur during the year. We may also make additional contributions to the plan as determined by the Board of Directors. The total expense for the defined contribution plan was $0.8 million for 2018.
Certain employees of Fleet are covered by defined benefit pension plans. The Company’s policy is to contribute at least the minimum amount required under ERISA. The Company may elect to make additional contributions. Benefits are based on years of service and levels of compensation. On December 16, 2014, the decision was made to freeze the benefits under the Company's U.S. qualified defined benefit pension plan with an effective date of March 1, 2015.
Benefit Obligations and Plan Assets
The following table summarizes the changes in the U.S. pension plan obligations and plan assets from the date of acquisition to the end of our fiscal year, and includes a statement of the plans' funded status as of March 31, 2018 and 2017:
84
Period Ended | |||||||
(In thousands) | March 31, 2018 | March 31, 2017 | |||||
Change in benefit obligation: | |||||||
Projected benefit obligation at beginning of period | $ | 61,714 | $ | 61,187 | |||
Interest cost | 2,529 | 456 | |||||
Actuarial loss | 800 | 791 | |||||
Benefits paid | (3,161 | ) | (720 | ) | |||
Projected benefit obligations at end of year | $ | 61,882 | $ | 61,714 | |||
Change in plan assets: | |||||||
Fair value of plan assets at beginning of period | $ | 47,772 | $ | 41,560 | |||
Actual return on plan assets | 5,505 | 854 | |||||
Employer contribution | 392 | 6,078 | |||||
Benefits paid | (3,161 | ) | (720 | ) | |||
Fair value of plan assets at end of year | $ | 50,508 | $ | 47,772 | |||
Funded status at end of year | $ | (11,374 | ) | $ | (13,942 | ) | |
Amounts recognized in the balance sheet at the end of the period consist of the following:
Period Ended | |||||||
(In thousands) | March 31, 2018 | March 31, 2017 | |||||
Current liability | $ | 461 | 463 | ||||
Long-term liability | 10,913 | 13,479 | |||||
Total | $ | 11,374 | $ | 13,942 | |||
The primary components of Net Periodic Benefits consist of the following:
Period Ended | |||||||
(In thousands) | March 31, 2018 | March 31, 2017 | |||||
Interest cost | $ | 2,529 | $ | 456 | |||
Expected return on assets | (2,901 | ) | (462 | ) | |||
Net periodic benefit cost (income) | $ | (372 | ) | $ | (6 | ) | |
The accumulated benefit obligation, which represents benefits earned to the measurement date, was $61.9 million at March 31, 2018, and $61.7 million at March 31, 2017 and we had a net periodic benefit (income) of less than $1.0 million for 2018 and 2017.
The pension benefit amounts stated above include one pension plan that is an unfunded plan. The projected benefit obligation and accumulated benefit obligation for this unfunded plan were $5.9 million as of March 31, 2018 and $6.0 million as of March 31, 2017.
The following table includes amounts that are expected to be contributed to the plans by the Company. It reflects benefit payments that are made from the plans' assets as well as those made directly from the Company's assets and includes the participants' share of the cost, which is funded by participant contributions. The amounts in the table are actuarially determined and reflect the Company's best estimate given its current knowledge; actual amounts could be materially different.
85
(In thousands) | Pension Benefits | ||
Employer contributions: | |||
2019 (expectation) to participant benefits | $ | 1,461 | |
Expected benefit payments year ending March 31, | |||
2019 | $ | 3,314 | |
2020 | 3,386 | ||
2021 | 3,463 | ||
2022 | 3,588 | ||
2023 | 3,674 | ||
2024-2028 | 19,157 | ||
During 2018, we made no contribution to the qualified plan. During 2017, we funded $6.0 million to the plan, which was invested as described in the plan assets below.
The Company's primary investment objective for its qualified pension plan assets is to provide a source of retirement income for the plans' participants and beneficiaries. The asset allocation for the Company's funded retirement plan as of March 31, 2018 and 2017, and the target allocation by asset category are as follows:
Percentage of Plan Assets | |||||||
Asset Category | Target Allocation | March 31, 2018 | March 31, 2017 | ||||
Domestic large cap equities | 21 | % | 21 | % | 41 | % | |
Domestic small/mid cap equities | 6 | 6 | 7 | ||||
International equities | 18 | 18 | 16 | ||||
Balanced/asset allocation | — | — | 2 | ||||
Fixed income and cash | 55 | 55 | 34 | ||||
Total | 100 | % | 100 | % | 100 | % | |
The plan assets are invested in a diversified portfolio consisting primarily of domestic fixed income and publicly traded equity securities held within group trust funds at March 31, 2018 and pooled separate mutual funds at March 31, 2017. These assets are fair valued using NAV.
The following tables show the unrecognized actuarial loss (gain) included in accumulated other comprehensive income at March 31, 2018 and 2017, as well as the prior service cost credit and actuarial loss expected to be reclassified from accumulated other comprehensive income (loss) to retirement expense during 2019:
(In thousands) | |||
Balances in accumulated other comprehensive loss as of March 31, 2017: | |||
Unrecognized actuarial loss | $ | 399 | |
Unrecognized prior service credit | — | ||
Balances in accumulated other comprehensive (income) as of March 31, 2018: | |||
Unrecognized actuarial (gain) | $ | (1,407 | ) |
Unrecognized prior service credit | — | ||
Amounts expected to be reclassified from accumulated other comprehensive income (loss) during 2019: | |||
Unrecognized actuarial (loss) | $ | — | |
Unrecognized prior service credit | — | ||
86
Assumptions used in determining the actuarial present value of the benefit obligation as of March 31, 2018 and 2017 were as follows:
Period Ended | |||
March 31, 2018 | March 31, 2017 | ||
Key assumptions: | |||
Discount rate | 3.93% to 4.07% | 3.92% to 4.21% | |
Expected return on plan assets, net of administrative fees | 6.25% | 6.25% | |
Rate of compensation increase | — | — | |
The determination of the expected long-term rate of return was derived from an optimized portfolio using an asset allocation software program. The risk and return assumptions, along with the correlations between the asset classes, were entered into the program. Based on these assumptions and historical experience, the portfolio is expected to achieve a long-term rate of return of 6.25%. The investment managers engaged to manage the portfolio are expected to outperform their expected benchmarks on a relative basis over a full market cycle.
17. Commitments and Contingencies
We are involved from time to time in routine legal matters and other claims incidental to our business. We review outstanding claims and proceedings internally and with external counsel as necessary to assess probability and amount of potential loss. These assessments are re-evaluated at each reporting period and as new information becomes available to determine whether a reserve should be established or if any existing reserve should be adjusted. The actual cost of resolving a claim or proceeding ultimately may be substantially different than the amount of the recorded reserve. In addition, because it is not permissible under GAAP to establish a litigation reserve until the loss is both probable and estimable, in some cases there may be insufficient time to establish a reserve prior to the actual incurrence of the loss (upon verdict and judgment at trial, for example, or in the case of a quickly negotiated settlement). We believe the resolution of routine legal matters and other claims incidental to our business, taking our reserves into account, will not have a material adverse effect on our business, financial condition, or results of operations.
Lease Commitments
We have operating leases for office facilities and equipment, including New York and other locations, which expire at various dates through fiscal 2028. These amounts have been included in the table below.
The following summarizes future minimum lease payments for our operating leases (a):
(In thousands) | Facilities | Equipment | Total | ||||||||
Year Ending March 31, | |||||||||||
2019 | $ | 2,928 | $ | 333 | $ | 3,261 | |||||
2020 | 2,685 | 138 | 2,823 | ||||||||
2021 | 2,505 | 31 | 2,536 | ||||||||
2022 | 2,163 | 24 | 2,187 | ||||||||
2023 | 1,683 | 10 | 1,693 | ||||||||
Thereafter | 8,487 | — | 8,487 | ||||||||
$ | 20,451 | $ | 536 | $ | 20,987 | ||||||
(a) Minimum lease payments have not been reduced by minimum sublease rentals of $1.0 million due in the future under non- cancellable subleases.
The following schedule shows the composition of total minimum lease payments that have been reduced by minimum sublease rentals:
Year ending March 31, | |||||||
(In thousands) | 2018 | 2017 | |||||
Minimum lease payments | $ | 20,987 | $ | 10,982 | |||
Less: Sublease rentals | (1,018 | ) | (690 | ) | |||
$ | 19,969 | $ | 10,292 | ||||
87
Rent expense was $1.9 million, $2.0 million, and $1.8 million for 2018, 2017, and 2016, respectively.
Purchase Commitments
We have supply agreements for the manufacture of some of our products. The following table shows the minimum amounts that we are committed to pay under these agreements:
(In thousands) | |||
Year Ending March 31, | Amount | ||
2019 | $ | 9,473 | |
2020 | 9,839 | ||
2021 | 9,280 | ||
2022 | 9,280 | ||
2023 | 1,578 | ||
Thereafter | — | ||
$ | 39,450 | ||
18. Concentrations of Risk
Our revenues are concentrated in the areas of OTC Healthcare and Household Cleaning products. We sell our products to mass merchandisers and drug, food, dollar, convenience, and club stores. During 2018, 2017, and 2016, approximately 41.2%, 40.0%, and 41.9%, respectively, of our gross revenues were derived from our five top selling brands. One customer, Walmart, accounted for more than 10% of our gross revenues for each of the periods presented. During 2018, 2017, and 2016, Walmart accounted for approximately 23.8%, 21.1%, and 20.2%, respectively, of our gross revenues. At March 31, 2018, approximately 26.1% of our accounts receivable were owed by Walmart.
We manage product distribution in the continental United States through a third-party distribution center in St. Louis, Missouri. A serious disruption, such as an earthquake, tornado, flood or fire, to the main distribution center could damage our inventories and could materially impair our ability to distribute our products to customers in a timely manner or at a reasonable cost. We could incur significantly higher costs and experience longer lead times associated with the distribution of our products to our customers during the time that it takes us to reopen or replace our distribution center. As a result, any such disruption could have a material adverse effect on our business, sales and profitability.
At March 31, 2018, we had relationships with 116 third-party manufacturers. Of those, we had long-term contracts with 46 manufacturers that produced items that accounted for approximately 73.6% of our gross sales for 2018, compared to 47 manufacturers with long-term contracts that accounted for approximately 78.4% of gross sales in 2017. The fact that we do not have long-term contracts with certain manufacturers means that they could cease manufacturing our products at any time and for any reason or initiate arbitrary and costly price increases, which could have a material adverse effect on our business and results from operations. Although we are in the process of negotiating long-term contracts with certain key manufacturers, we may not be able to reach a timely agreement, which could have a material adverse effect on our business and results of operations.
19. Business Segments
Segment information has been prepared in accordance with the Segment Reporting topic of FASB ASC 280. Our current reportable segments consist of (i) North American OTC Healthcare, (ii) International OTC Healthcare and (iii) Household Cleaning. We evaluate the performance of our operating segments and allocate resources to these segments based primarily on contribution margin, which we define as gross profit less advertising and promotional expenses.
The tables below summarize information about our operating and reportable segments.
88
Year Ended March 31, 2018 | |||||||||||||||
(In thousands) | North American OTC Healthcare | International OTC Healthcare | Household Cleaning | Consolidated | |||||||||||
Total segment revenues* | $ | 868,874 | $ | 91,658 | $ | 80,647 | $ | 1,041,179 | |||||||
Cost of sales | 357,298 | 40,244 | 67,132 | 464,674 | |||||||||||
Gross profit | 511,576 | 51,414 | 13,515 | 576,505 | |||||||||||
Advertising and promotion | 129,058 | 16,267 | 1,961 | 147,286 | |||||||||||
Contribution margin | $ | 382,518 | $ | 35,147 | $ | 11,554 | 429,219 | ||||||||
Other operating expenses** | 213,353 | ||||||||||||||
Operating income | 215,866 | ||||||||||||||
Other expense | 108,780 | ||||||||||||||
Income before income taxes | 107,086 | ||||||||||||||
Benefit for income taxes | (232,484 | ) | |||||||||||||
Net income | $ | 339,570 | |||||||||||||
*Intersegment revenues of $7.7 million were eliminated from the North American OTC Healthcare segment.
**Other operating expenses for the year ended March 31, 2018 includes a tradename impairment charge of $99.9 million.
Year Ended March 31, 2017 | |||||||||||||||
(In thousands) | North American OTC Healthcare | International OTC Healthcare | Household Cleaning | Consolidated | |||||||||||
Total segment revenues* | $ | 720,824 | $ | 73,304 | $ | 87,932 | $ | 882,060 | |||||||
Cost of sales | 282,750 | 30,789 | 68,235 | 381,774 | |||||||||||
Gross profit | 438,074 | 42,515 | 19,697 | 500,286 | |||||||||||
Advertising and promotion | 112,465 | 13,434 | 2,460 | 128,359 | |||||||||||
Contribution margin | $ | 325,609 | $ | 29,081 | $ | 17,237 | 371,927 | ||||||||
Other operating expenses** | 166,314 | ||||||||||||||
Operating income | 205,613 | ||||||||||||||
Other expense | 94,763 | ||||||||||||||
Income before income taxes | 110,850 | ||||||||||||||
Provision for income taxes | 41,455 | ||||||||||||||
Net income | $ | 69,395 | |||||||||||||
* Intersegment revenues of $4.2 million were eliminated from the North American OTC Healthcare segment.
**Other operating expenses for the year ended March 31, 2017 includes a pre-tax net loss of $51.8 million related to divestitures. These divestitures include Pediacare®, New Skin®, Fiber Choice®, e.p.t®, Dermoplast®, and license rights in certain geographic areas pertaining to Comet. The assets and corresponding contribution margin associated with the pre-tax net loss on divestitures related to Pediacare®, New Skin®, Fiber Choice®, e.p.t® and Dermoplast® are included within the North American OTC Healthcare segment, while the pre-tax gain on sale of license rights related to Comet are included in the Household Cleaning segment.
89
Year Ended March 31, 2016 | |||||||||||||||
(In thousands) | North American OTC Healthcare | International OTC Healthcare | Household Cleaning | Consolidated | |||||||||||
Total segment revenues* | $ | 657,871 | $ | 57,713 | $ | 90,663 | $ | 806,247 | |||||||
Cost of sales | 250,018 | 21,676 | 67,342 | 339,036 | |||||||||||
Gross profit | 407,853 | 36,037 | 23,321 | 467,211 | |||||||||||
Advertising and promotion | 97,393 | 11,114 | 2,295 | 110,802 | |||||||||||
Contribution margin | $ | 310,460 | $ | 24,923 | $ | 21,026 | 356,409 | ||||||||
Other operating expenses | 96,094 | ||||||||||||||
Operating income | 260,315 | ||||||||||||||
Other expense | 103,130 | ||||||||||||||
Income before income taxes | 157,185 | ||||||||||||||
Provision for income taxes | 57,278 | ||||||||||||||
Net income | $ | 99,907 | |||||||||||||
*Intersegment revenues of $2.7 million were eliminated from the North America OTC Healthcare segment.
The tables below summarize information about our segment revenues from similar product groups.
Year Ended March 31, 2018 | |||||||||||||||
(In thousands) | North American OTC Healthcare | International OTC Healthcare | Household Cleaning | Consolidated | |||||||||||
Analgesics | $ | 118,610 | $ | 807 | $ | — | $ | 119,417 | |||||||
Cough & Cold | 93,537 | 18,310 | — | 111,847 | |||||||||||
Women's Health | 247,244 | 12,140 | — | 259,384 | |||||||||||
Gastrointestinal | 117,627 | 34,609 | — | 152,236 | |||||||||||
Eye & Ear Care | 92,308 | 11,744 | — | 104,052 | |||||||||||
Dermatologicals | 94,775 | 2,113 | — | 96,888 | |||||||||||
Oral Care | 99,072 | 11,930 | — | 111,002 | |||||||||||
Other OTC | 5,701 | 5 | — | 5,706 | |||||||||||
Household Cleaning | — | — | 80,647 | 80,647 | |||||||||||
Total segment revenues | $ | 868,874 | $ | 91,658 | $ | 80,647 | $ | 1,041,179 | |||||||
Year Ended March 31, 2017 | |||||||||||||||
(In thousands) | North American OTC Healthcare | International OTC Healthcare | Household Cleaning | Consolidated | |||||||||||
Analgesics | $ | 120,253 | $ | 1,922 | $ | — | $ | 122,175 | |||||||
Cough & Cold | 90,795 | 17,990 | — | 108,785 | |||||||||||
Women's Health | 147,071 | 3,811 | — | 150,882 | |||||||||||
Gastrointestinal | 76,500 | 24,812 | — | 101,312 | |||||||||||
Eye & Ear Care | 97,618 | 12,075 | — | 109,693 | |||||||||||
Dermatologicals | 85,194 | 2,159 | — | 87,353 | |||||||||||
Oral Care | 97,586 | 10,513 | — | 108,099 | |||||||||||
Other OTC | 5,807 | 22 | — | 5,829 | |||||||||||
Household Cleaning | — | — | 87,932 | 87,932 | |||||||||||
Total segment revenues | $ | 720,824 | $ | 73,304 | $ | 87,932 | $ | 882,060 | |||||||
90
Year Ended March 31, 2016 | |||||||||||||||
(In thousands) | North American OTC Healthcare | International OTC Healthcare | Household Cleaning | Consolidated | |||||||||||
Analgesics | $ | 117,337 | $ | 2,128 | $ | — | $ | 119,465 | |||||||
Cough & Cold | 100,148 | 16,422 | — | 116,570 | |||||||||||
Women's Health | 132,184 | 2,982 | — | 135,166 | |||||||||||
Gastrointestinal | 74,568 | 20,019 | — | 94,587 | |||||||||||
Eye & Ear Care | 95,515 | 11,983 | — | 107,498 | |||||||||||
Dermatologicals | 82,941 | 2,133 | — | 85,074 | |||||||||||
Oral Care | 49,099 | 2,026 | — | 51,125 | |||||||||||
Other OTC | 6,079 | 20 | — | 6,099 | |||||||||||
Household Cleaning | — | — | 90,663 | 90,663 | |||||||||||
Total segment revenues | $ | 657,871 | $ | 57,713 | $ | 90,663 | $ | 806,247 | |||||||
Our total segment revenues by geographic area are as follows:
Year Ended March 31, | |||||||||||
2018 | 2017 | 2016 | |||||||||
United States | $ | 903,511 | $ | 769,732 | $ | 704,360 | |||||
Rest of world | 137,668 | 112,328 | 101,887 | ||||||||
Total | $ | 1,041,179 | $ | 882,060 | $ | 806,247 | |||||
Our consolidated goodwill and intangible assets have been allocated to the reportable segments as follows:
March 31, 2018 (In thousands) | North American OTC Healthcare | International OTC Healthcare | Household Cleaning | Consolidated | |||||||||||
Goodwill | $ | 580,934 | $ | 32,919 | $ | 6,245 | $ | 620,098 | |||||||
Intangible assets | |||||||||||||||
Indefinite-lived | 2,375,736 | 84,006 | 30,561 | 2,490,303 | |||||||||||
Finite-lived | 265,356 | 6,068 | 19,189 | 290,613 | |||||||||||
Intangible assets, net | 2,641,092 | 90,074 | 49,750 | 2,780,916 | |||||||||||
Total | $ | 3,222,026 | $ | 122,993 | $ | 55,995 | $ | 3,401,014 | |||||||
91
March 31, 2017 (In thousands) | North American OTC Healthcare | International OTC Healthcare | Household Cleaning | Consolidated | |||||||||||
Goodwill | $ | 576,453 | $ | 32,554 | $ | 6,245 | $ | 615,252 | |||||||
Intangible assets | |||||||||||||||
Indefinite-lived | 2,404,336 | 83,558 | 101,261 | 2,589,155 | |||||||||||
Finite-lived | 287,056 | 6,468 | 20,934 | 314,458 | |||||||||||
Intangible assets, net | 2,691,392 | 90,026 | 122,195 | 2,903,613 | |||||||||||
Total | $ | 3,267,845 | $ | 122,580 | $ | 128,440 | $ | 3,518,865 | |||||||
Our goodwill and intangible assets by geographic area are as follows:
Year Ended March 31, | |||||||
2018 | 2017 | ||||||
United States | $ | 3,278,021 | $ | 3,396,285 | |||
Rest of world | 122,993 | 122,580 | |||||
Total | $ | 3,401,014 | $ | 3,518,865 | |||
92
20. Unaudited Quarterly Financial Information
Unaudited quarterly financial information for 2018 and 2017 is as follows:
Year Ended March 31, 2018
Quarterly Period Ended | ||||||||||||||||
(In thousands, except for per share data) | June 30, 2017 | September 30, 2017 | December 31, 2017 | March 31, 2018 | ||||||||||||
Total revenues | $ | 256,573 | $ | 258,026 | $ | 270,615 | $ | 255,965 | ||||||||
Cost of sales | 113,097 | 113,928 | 122,941 | 114,708 | ||||||||||||
Gross profit | 143,476 | 144,098 | 147,674 | 141,257 | ||||||||||||
Operating expenses | ||||||||||||||||
Advertising and promotion | 36,944 | 39,188 | 35,835 | 35,319 | ||||||||||||
General and administrative | 20,336 | 21,567 | 21,207 | 21,891 | ||||||||||||
Depreciation and amortization | 7,167 | 7,186 | 7,129 | 6,946 | ||||||||||||
Tradename impairment | — | — | — | 99,924 | ||||||||||||
Total operating expenses | 64,447 | 67,941 | 64,171 | 164,080 | ||||||||||||
Operating income | 79,029 | 76,157 | 83,503 | (22,823 | ) | |||||||||||
Net interest expense | 26,341 | 26,836 | 25,864 | 26,838 | ||||||||||||
Loss on extinguishment of debt | — | — | — | 2,901 | ||||||||||||
Income (loss) before income taxes | 52,688 | 49,321 | 57,639 | (52,562 | ) | |||||||||||
Provision (benefit) for income taxes | 18,929 | 18,616 | (257,154 | ) | (12,875 | ) | ||||||||||
Net income (loss) | $ | 33,759 | $ | 30,705 | $ | 314,793 | $ | (39,687 | ) | |||||||
Earnings (loss) per share: | ||||||||||||||||
Basic | $ | 0.64 | $ | 0.58 | $ | 5.93 | $ | (0.75 | ) | |||||||
Diluted | $ | 0.63 | $ | 0.57 | $ | 5.88 | $ | (0.75 | ) | |||||||
Weighted average shares outstanding: | ||||||||||||||||
Basic | 53,038 | 53,098 | 53,129 | 53,131 | ||||||||||||
Diluted | 53,509 | 53,539 | 53,543 | 53,131 | ||||||||||||
Comprehensive income (loss), net of tax: | ||||||||||||||||
Currency translation adjustments | 1,119 | 2,716 | 4,492 | (2,625 | ) | |||||||||||
Unrecognized net gain on pension plans | 1 | — | — | 1,334 | ||||||||||||
Total other comprehensive income (loss) | 1,120 | 2,716 | 4,492 | (1,291 | ) | |||||||||||
Comprehensive income (loss) | $ | 34,879 | $ | 33,421 | $ | 319,285 | $ | (40,978 | ) | |||||||
93
Year Ended March 31, 2017
Quarterly Period Ended | ||||||||||||||||
(In thousands, except for per share data) | June 30, 2016 | September 30, 2016 | December 31, 2016 | March 31, 2017 | ||||||||||||
Total revenues | $ | 209,575 | $ | 215,052 | $ | 216,763 | $ | 240,670 | ||||||||
Cost of sales | 87,984 | 91,087 | 92,216 | 110,487 | ||||||||||||
Gross profit | 121,591 | 123,965 | 124,547 | 130,183 | ||||||||||||
Operating expenses | ||||||||||||||||
Advertising and promotion | 27,635 | 28,592 | 30,682 | 41,450 | ||||||||||||
General and administrative | 19,457 | 18,795 | 22,131 | 28,760 | ||||||||||||
Depreciation and amortization | 6,832 | 6,016 | 5,852 | 6,651 | ||||||||||||
Loss (gain) on divestitures | 55,453 | (496 | ) | (3,405 | ) | 268 | ||||||||||
Total operating expenses | 109,377 | 52,907 | 55,260 | 77,129 | ||||||||||||
Operating income | 12,214 | 71,058 | 69,287 | 53,054 | ||||||||||||
Net interest expense | 21,127 | 20,830 | 18,554 | 32,832 | ||||||||||||
Loss on extinguishment of debt | — | — | — | 1,420 | ||||||||||||
(Loss) income before income taxes | (8,913 | ) | 50,228 | 50,733 | 18,802 | |||||||||||
(Benefit) provision for income taxes | (3,382 | ) | 18,033 | 19,092 | 7,712 | |||||||||||
Net (loss) income | $ | (5,531 | ) | $ | 32,195 | $ | 31,641 | $ | 11,090 | |||||||
(Loss) earnings per share: | ||||||||||||||||
Basic | $ | (0.10 | ) | $ | 0.61 | $ | 0.60 | $ | 0.21 | |||||||
Diluted | $ | (0.10 | ) | $ | 0.60 | $ | 0.59 | $ | 0.21 | |||||||
Weighted average shares outstanding: | ||||||||||||||||
Basic | 52,881 | 52,993 | 52,999 | 53,009 | ||||||||||||
Diluted | 52,881 | 53,345 | 53,359 | 53,419 | ||||||||||||
Comprehensive (loss) income, net of tax: | ||||||||||||||||
Currency translation adjustments | (5,824 | ) | 2,703 | (8,736 | ) | 9,282 | ||||||||||
Unrecognized net loss on pension plans | — | — | — | (252 | ) | |||||||||||
Total other comprehensive (loss) income | (5,824 | ) | 2,703 | (8,736 | ) | 9,030 | ||||||||||
Comprehensive (loss) income | $ | (11,355 | ) | $ | 34,898 | $ | 22,905 | $ | 20,120 | |||||||
94
21. Subsequent Events
Share Repurchase Program
The Company’s Board of Directors authorized the repurchase of up to $50.0 million of the Company’s issued and outstanding common stock. Under the authorization, the Company may purchase common stock through May, 2019 utilizing one or more open market transactions, transactions structured through investment banking institutions, in privately-negotiated transactions or otherwise, by direct purchases of common stock or a combination of the foregoing in compliance with the applicable rules and regulations of the Securities and Exchange Commission.
The timing of the purchases and the amount of stock repurchased is subject to the Company's discretion and will depend on market and business conditions, applicable legal and credit requirements and other corporate considerations including the Company’s historical strategy of pursuing accretive acquisitions and deleveraging.
Share Based Compensation
On May 7, 2018, the Compensation and Talent Management Committee of our Board of Directors granted 103,406 performance units, 100,399 RSUs and stock options to acquire 294,484 shares of our common stock to certain executive officers and employees under the Plan. Performance units are earned based on achievement of the performance objectives set by the Compensation and Talent Management Committee and, if earned, vest in their entirety on the three-year anniversary of the date of grant. RSUs vest either 33.3% per year over three years or in their entirety on the three-year anniversary of the date of grant. Upon vesting, both performance units and RSUs will be settled in shares of our common stock. The stock options will vest 33.3% per year over three years and are exercisable for up to ten years from the date of grant. These stock options were granted at an exercise price of $29.46 per share, which is equal to the closing price for our common stock on the date of the grant. Except in cases of death, disability or retirement, termination of employment prior to vesting will result in forfeiture of the unvested performance units, RSUs and the stock options. Vested stock options will remain exercisable by the employee after termination, subject to the terms of the Plan.
95
SCHEDULE II
VALUATION AND QUALIFYING ACCOUNTS
(In thousands) | Balance at Beginning of Year | Amounts Charged to Expense | Deductions | Other | Balance at End of Year | ||||||||||||||
Year Ended March 31, 2018 | |||||||||||||||||||
Reserves for sales returns and allowance | $ | 9,429 | $ | 62,953 | $ | (63,569 | ) | $ | — | $ | 8,813 | ||||||||
Reserves for trade promotions | 15,193 | 78,669 | (82,427 | ) | — | 11,435 | |||||||||||||
Reserves for consumer coupon redemptions | 4,614 | 7,283 | (9,252 | ) | — | 2,645 | |||||||||||||
Allowance for doubtful accounts | 1,352 | 187 | (336 | ) | — | 1,203 | |||||||||||||
Deferred tax valuation allowance | 3,437 | — | — | (2,828 | ) | (a) | 609 | ||||||||||||
Year Ended March 31, 2017 | |||||||||||||||||||
Reserves for sales returns and allowance | 8,823 | 41,173 | (41,417 | ) | 850 | (b) | 9,429 | ||||||||||||
Reserves for trade promotions | 12,641 | 69,475 | (69,713 | ) | 2,790 | (b) | 15,193 | ||||||||||||
Reserves for consumer coupon redemptions | 4,323 | 7,616 | (7,745 | ) | 420 | (b) | 4,614 | ||||||||||||
Allowance for doubtful accounts | 815 | 177 | 360 | — | 1,352 | ||||||||||||||
Deferred tax valuation allowance | — | — | — | 3,437 | (b) | 3,437 | |||||||||||||
Year Ended March 31, 2016 | |||||||||||||||||||
Reserves for sales returns and allowance | 6,716 | 41,217 | (40,085 | ) | 975 | (c) | 8,823 | ||||||||||||
Reserves for trade promotions | 9,932 | 62,331 | (62,409 | ) | 2,787 | (c) | 12,641 | ||||||||||||
Reserves for consumer coupon redemptions | 1,672 | 6,235 | (5,637 | ) | 2,053 | (c) | 4,323 | ||||||||||||
Allowance for doubtful accounts | 1,277 | (276 | ) | (186 | ) | — | 815 | ||||||||||||
(a) Reclassified into a FIN 48 liability.
(b) Reflects the applicable amounts acquired from the purchase of Fleet on January 26, 2017.
(c) Reflects the applicable amounts acquired from the purchase of DenTek on February 5, 2016.
96
ITEM 9. CHANGES IN AND DISAGREEMENTS WITH ACCOUNTANTS ON ACCOUNTING AND FINANCIAL DISCLOSURE
None.
ITEM 9A. CONTROLS AND PROCEDURES
Disclosure Controls and Procedures
The Company’s management, with the participation of its Chief Executive Officer and Chief Financial Officer, evaluated the effectiveness of the Company’s disclosure controls and procedures, as defined in Rule 13a–15(e) of the Exchange Act, as of March 31, 2018. Based upon that evaluation, the Chief Executive Officer and Chief Financial Officer concluded that, as of March 31, 2018, the Company’s disclosure controls and procedures were effective to ensure that information required to be disclosed by the Company in the reports the Company files or submits under the Exchange Act is recorded, processed, summarized and reported, within the time periods specified in the SEC’s rules and forms and that such information is accumulated and communicated to the Company’s management, including the Company’s Chief Executive Officer and Chief Financial Officer, as appropriate to allow timely decisions regarding required disclosure.
Management’s Annual Report on Internal Control over Financial Reporting
The report of management on our internal control over financial reporting as of March 31, 2018 and the attestation report of our independent registered public accounting firm on our internal control over financial reporting are set forth in Part II, Item 8. “Financial Statements and Supplementary Data" beginning on page 56 of this Annual Report on Form 10-K.
Changes in Internal Control over Financial Reporting
There was no change in our internal control over financial reporting that occurred during the quarter ended March 31, 2018 that has materially affected, or is reasonably likely to materially affect, our internal control over financial reporting.
ITEM 9B. OTHER INFORMATION
None.
97
Part III
ITEM 10. DIRECTORS, EXECUTIVE OFFICERS AND CORPORATE GOVERNANCE
Information required to be disclosed by this Item will be contained in the Company’s 2018 Proxy Statement under the headings “Election of Directors,” “Executive Compensation and Other Matters,” “Section 16(a) Beneficial Ownership Reporting Compliance” and “Governance of the Company”, which information is incorporated herein by reference.
ITEM 11. EXECUTIVE COMPENSATION
Information required to be disclosed by this Item, including Items 402 (b) and 407 (e)(4) and (e)(5) of Regulation S-K, will be contained in the Company’s 2018 Proxy Statement under the headings “Executive Compensation and Other Matters”, “Governance of the Company”, "Compensation Discussion and Analysis", "Compensation Committee Report", and "Compensation Committee Interlocks and Insider Participation", which information is incorporated herein by reference.
ITEM 12. SECURITY OWNERSHIP OF CERTAIN BENEFICIAL OWNERS AND MANAGEMENT AND RELATED STOCKHOLDER MATTERS
Information required to be disclosed by this Item will be contained in the Company’s 2018 Proxy Statement under the headings “Security Ownership of Certain Beneficial Owners and Management” and “Securities Authorized for Issuance Under Equity Compensation Plans”, which information is incorporated herein by reference.
ITEM 13. CERTAIN RELATIONSHIPS AND RELATED TRANSACTIONS, AND DIRECTOR INDEPENDENCE
Information required to be disclosed by this Item will be contained in the Company’s 2018 Proxy Statement under the headings “Certain Relationships and Related Transactions”, “Election of Directors” and “Governance of the Company”, which information is incorporated herein by reference.
ITEM 14. PRINCIPAL ACCOUNTING FEES AND SERVICES
Information required to be disclosed by this Item will be contained in the Company’s 2018 Proxy Statement under the heading “Ratification of Appointment of the Independent Registered Public Accounting Firm”, which information is incorporated herein by reference.
98
Part IV
ITEM 15. EXHIBITS AND FINANCIAL STATEMENT SCHEDULES
(a)(1) | Financial Statements |
The financial statements and financial statement schedules listed below are set forth under Part II, Item 8 (pages 56 through 109 and page 122) of this Annual Report on Form 10-K, which are incorporated herein to this Item as if copied verbatim.
Prestige Brands Holdings, Inc. |
Report of Independent Registered Public Accounting Firm, PricewaterhouseCoopers LLP |
Consolidated Statements of Income and Comprehensive Income for each of the three years in the period ended March 31, 2018 |
Consolidated Balance Sheets at March 31, 2018 and 2017 |
Consolidated Statements of Changes in Stockholders’ Equity for each of the three years in the period ended March 31, 2018 |
Consolidated Statements of Cash Flows for each of the three years in the period ended March 31, 2018 |
Notes to Consolidated Financial Statements |
Schedule II—Valuation and Qualifying Accounts for the years ended March 31, 2018, 2017 and 2016 |
(a)(2) | Financial Statement Schedules |
Schedule II - Valuation and Qualifying Accounts listed in (a)(1) above is incorporated herein by reference as if copied verbatim. Schedules other than those listed in the preceding sentence have been omitted as they are either not required, not applicable, or the information has otherwise been shown in the consolidated financial statements or notes thereto.
(b) | Exhibits |
See Exhibit Index immediately following the financial statements and financial statement schedules of this Annual Report on Form 10-K.
99
ITEM 16. FORM 10-K SUMMARY
None.
SIGNATURES
Pursuant to the requirements of Section 13 or 15(d) of the Securities Exchange Act of 1934, the registrant has duly caused this report to be signed on its behalf by the undersigned, thereunto duly authorized.
PRESTIGE BRANDS HOLDINGS, INC. | |||
By: | /s/ Christine Sacco | ||
Name: | Christine Sacco | ||
Title: | Chief Financial Officer | ||
Date: | May 10, 2018 | ||
Pursuant to the requirements of the Securities Exchange Act of 1934, this report has been signed below by the following persons on behalf of the registrant and in the capacities and on the dates indicated.
Signature | Title | Date | ||
/s/ RONALD M. LOMBARDI | Director, President and Chief Executive Officer | May 10, 2018 | ||
Ronald M. Lombardi | (Principal Executive Officer) | |||
/s/ CHRISTINE SACCO | Chief Financial Officer | May 10, 2018 | ||
Christine Sacco | (Principal Financial Officer and | |||
Principal Accounting Officer) | ||||
/s/ JOHN E. BYOM | Director | May 10, 2018 | ||
John E. Byom | ||||
/s/ GARY E. COSTLEY | Director | May 10, 2018 | ||
Gary E. Costley | ||||
/s/ SHEILA A. HOPKINS | Director | May 10, 2018 | ||
Sheila A. Hopkins | ||||
/s/ CARL J. JOHNSON | Director | May 10, 2018 | ||
Carl J. Johnson | ||||
/s/ JAMES M. JENNESS | Director | May 10, 2018 | ||
James M. Jenness | ||||
/s/ NATALE S. RICCIARDI | Director | May 10, 2018 | ||
Natale S. Ricciardi | ||||
100
EXHIBIT INDEX
Exhibit No. | Description | |
2.1 | Stock Purchase Agreement, dated April 25, 2014, by and among Medtech Products Inc., Insight Pharmaceuticals Corporation, SPC Partners IV, L.P. and the other seller parties thereto (filed as Exhibit 2.5 to the Company's Annual Report on Form 10-K filed with the SEC on May 19, 2014).+ | |
2.2 | Agreement and Plan of Merger, dated as of December 22, 2016, by and among Medtech Products Inc., AETAGE LLC, C.B. Fleet TopCo, LLC and Gryphon Partners 3.5, L.P. (filed as Exhibit 2.1 to the Company's Quarterly Report on Form 10-Q filed with the SEC on February 2, 2017).+ | |
3.1 | Amended and Restated Certificate of Incorporation of Prestige Brands Holdings, Inc. (filed as Exhibit 3.1 to the Company's Form S-1/A filed with the SEC on February 8, 2005).+ | |
3.2 | Amended and Restated Bylaws of Prestige Brands Holdings, Inc., as amended (filed as Exhibit 3.2 to the Company's Quarterly Report on Form 10-Q filed with the SEC on November 6, 2009).+ | |
3.3 | Certificate of Designations of Series A Preferred Stock of Prestige Brands Holdings, Inc., as filed with the Secretary of State of the State of Delaware on February 27, 2012 (filed as Exhibit 3.1 to the Company's Current Report on Form 8-K filed with the SEC on February 28, 2012).+ | |
4.1 | Form of stock certificate for common stock (filed as Exhibit 4.1 to the Company's Form S-1/A filed with the SEC on January 26, 2005).+ | |
4.2 | Indenture, dated as of December 17, 2013, among Prestige Brands, Inc., as issuer, the Company and certain subsidiaries, as guarantors, and U.S. Bank National Association, as Trustee with respect to 5.375% Senior Notes due 2021 (filed as Exhibit 4.1 to the Company’s Quarterly Report on Form 10-Q filed with the SEC on February 7, 2014).+ | |
4.3 | Second Supplemental Indenture, dated December 17, 2013 by and among Prestige Brands, Inc. the guarantors party thereto from time to time and U.S. Bank National Association, as trustee (filed as Exhibit 4.1 to the Company’s Current Report on Form 8-K filed with the SEC on December 17, 2013).+ | |
4.4 | Form of 5.375% Senior Note due 2021 (filed as Exhibit 4.1 to the Company’s Quarterly Report on Form 10-Q filed with the SEC on February 7, 2014). + | |
4.5 | Indenture, dated as of February 19, 2016, among Prestige Brands, Inc., as issuer, the Company and certain subsidiaries, as guarantors, and U.S. Bank National Association, as Trustee with respect to 6.375% Senior Notes due 2024 (filed as Exhibit 4.1 to the Company's Current Report on Form 8-K filed with the SEC on February 19, 2016). + | |
4.6 | First Supplemental Indenture, dated as of April 4, 2016, among DenTek Holdings, Inc. and DenTek Oral Care, Inc., as guaranteeing subsidiaries, Prestige Brands, Inc. and U.S. Bank National Association, as Trustee with respect to the 6.375% Senior Notes due 2024 (filed as Exhibit 4.6 to the Company’s Annual Report on Form 10-K filed with the SEC on May 17, 2016). + | |
4.7 | Third Supplemental Indenture, dated as of March 21, 2018, by and among Prestige Brands, Inc., as issuer, the Company and certain subsidiaries, as guarantors, and U.S. Bank National Association, as Trustee with respect to 6.375% Senior Notes due 2024 (filed as Exhibit 4.1 to the Company's Current Report on Form 8-K filed with the SEC on March 21, 2018). + | |
4.8 | Form of 6.375% Senior Notes due 2024 (filed as Exhibit 4.1 to the Company's Current Report on Form 8-K filed with the SEC on February 19, 2016). + | |
10.1 | $660,000,000 Term Loan Credit Agreement, dated as of January 31, 2012, among Prestige Brands Inc., the Company, and certain subsidiaries of the Company as guarantors, Citibank, N.A., Citigroup Global Markets Inc., Morgan Stanley Senior Funding, Inc. and RBC Capital Markets (filed as Exhibit 10.3 to the Company's Annual Report on Form 10-K filed with the SEC on May 18, 2012). + | |
10.2 | Amendment No. 1, dated as of February 21, 2013, to the Term Loan Credit Agreement, dated as of January 31, 2012, among the Company, Prestige Brands, Inc., the other Guarantors from time to time party thereto, the lenders from time to time party thereto and Citibank, N.A. as administrative agent (filed as Exhibit 10.1 to the Company's Current Report on Form 8-K filed with the SEC on February 25, 2013). + | |
10.3 | Amendment No. 2, dated as of September 3, 2014, to the Term Loan Credit Agreement, dated as of January 31, 2012, among the Company, Prestige Brands, Inc., the other Guarantors from time to time party thereto, the lenders from time to time party thereto and Citibank, N.A. as administrative agent (filed as Exhibit 10.1 to the Company's Quarterly Report on Form 10-Q filed with the SEC on February 5, 2015).+ | |
10.4 | Amendment No. 3, dated as of May 8, 2015, to the Term Loan Credit Agreement, dated as of January 31, 2012, among the Company, Prestige Brands, Inc., the other Guarantors from time to time party thereto, the lenders from time to time party thereto and Citibank, N.A. as administrative agent (filed as Exhibit 10.6 to the Company's Annual Report on Form 10-K filed with the SEC on May 14, 2015).+ | |
10.5 | Amendment No. 4, dated as of January 26, 2017, to the Term Loan Credit Agreement, dated as of January 31, 2012, among the Company, Prestige Brands, Inc., the other guarantors from time to time party thereto, the lenders from time to time party thereto and Barclays Bank PLC (as successor in interest to Citibank, N.A.), as administrative agent (filed as Exhibit 10.1 to the Company’s Current Report on Form 8-K filed with the SEC on January 31, 2017). + | |
10.6 | Amendment No. 5, dated as of March 21, 2018, to the Term Loan Credit Agreement, dated as of January 31, 2012, among the Company, Prestige Brands, Inc., the other guarantors from time to time party thereto, the lenders from time to time party thereto and Barclays Bank PLC (as successor in interest to Citibank, N.A.), as administrative agent (filed as Exhibit 10.1 to the Company’s Current Report on Form 8-K filed with the SEC on March 21, 2018).+ | |
10.7 | Term Loan Security Agreement, dated as of January 31, 2012, among Prestige Brands Inc., the Company and certain subsidiaries of the Company as guarantors, Citibank N.A. and U.S. Bank National Association, as Trustee (filed as Exhibit 10.4 to the Company's Annual Report on Form 10-K filed with the SEC on May 18, 2012).+ | |
10.8 | $50,000,000 ABL Credit Agreement, dated as of January 31, 2012, Among Prestige Brands, Inc., the Company, certain subsidiaries of the Company as guarantors, Citibank, N.A., Citigroup Global Markets Inc., Morgan Stanley Senior Funding, Inc. and RBC Capital Markets filed (filed as Exhibit 10.5 to the Company's Annual Report on Form 10-K filed with the SEC on May 18, 2012.).+ | |
10.9 | Incremental Amendment, dated as of September 12, 2012, to the ABL Credit Agreement dated as of January 31, 2012 (filed as Exhibit 10.2 to the Company's Quarterly Report on Form 10-Q filed with the SEC on November 7, 2012).+ | |
10.10 | Amendment, dated as of June 11, 2013, to the ABL Credit Agreement dated as of January 31, 2012 (filed as Exhibit 10.2 to the Company’s Quarterly Report on Form 10-Q filed with the SEC on August 1, 2013).+ | |
10.11 | Amendment No. 3, dated as of September 3, 2014, to the ABL Credit Agreement (as amended by that certain Incremental Amendment, dated as of September 12, 2012, and that certain Incremental Amendment, dated as of June 11, 2013), dated as of January 31, 2012, among the Company, Prestige Brands, Inc., the other Guarantors from time to time party thereto, the lenders from time to time party thereto and Citibank, N.A. as administrative agent, L/C issuer and swing line lender (filed as Exhibit 10.2 to the Company’s Current Report on Form 8-K filed with the SEC on September 3, 2014). + | |
10.12 | Amendment No. 4, dated as of June 9, 2015, to the ABL Credit Agreement (as amended by that certain Incremental Amendment, dated as of September 12, 2012, and that certain Incremental Amendment, dated as of June 11, 2013, and that certain Incremental Amendment dated as of September 3, 2014), dated as of January 31, 2012, among the Company, Prestige Brands, Inc., the other Guarantors from time to time party thereto, the lenders from time to time party thereto and Citibank, N.A. as administrative agent, L/C issuer and swing line lender (filed as Exhibit 10.1 to the Company's Quarterly Report on Form 10-Q filed with the SEC on August 6, 2015).+ | |
10.13 | Amendment No. 5, dated as of February 4, 2016, to the ABL Credit Agreement, originally dated as of January 31, 2012, among the Company, Prestige Brands, Inc., the other Guarantors from time to time party thereto, the lenders from time to time party thereto and Citibank, N.A. as administrative agent, L/C issuer and swing line lender (filed as Exhibit 10.2 to the Company's Current Report on Form 8-K filed with the SEC on February 9, 2016). + | |
10.14 | Amendment No. 6, dated as of January 26, 2017, to the ABL Credit Agreement, originally dated as of January 31, 2012, among the Company, Prestige Brands, Inc., the other guarantors from time to time party thereto, the lenders from time to time party thereto and Citibank, N.A., as administrative agent, L/C issue and swing line lender (filed as Exhibit 10.2 to the Company’s Current Report on Form 8-K filed with the SEC on January 31, 2017). + | |
10.15 | Agreement of Lease between RA 660 White Plains Road LLC and Prestige Brands, Inc. (filed as Exhibit 10.2 to the Company's Quarterly Report on Form 10-Q filed with the SEC on August 9, 2012). + | |
10.16 | Amendment to Agreement of Lease between RA 660 White Plains Road LLC and Prestige Brands, Inc. (filed as Exhibit 10.1 to the Company's Quarterly Report on Form 10-Q filed with the SEC on August 7, 2014). + | |
10.17 | Letter Agreement, dated August 26, 2014, to Amendment to Agreement of Lease between RA 660 White Plains Road LLC and Prestige Brands, Inc. (filed as Exhibit 10.2 to the Company’s Quarterly Report on Form 10-Q filed with the SEC on November 6, 2014).+ | |
10.18 | Second Amendment to Lease between GHP 660 LLC and Prestige Brands, Inc. (filed as Exhibit 10.1 to the Company's Quarterly Report on Form 10-Q filed with the SEC on November 2, 2017). + | |
10.19 | Prestige Brands Holdings, Inc. 2005 Long-Term Equity Incentive Plan (filed as Exhibit 10.38 to the Company’s Form S-1/A filed with the SEC on January 26, 2005).+# | |
10.20 | Form of Restricted Stock Grant Agreement (filed as Exhibit 10.1 to the Company's Quarterly Report on Form 10-Q filed with the SEC on August 9, 2005). +# | |
10.21 | Form of Nonqualified Stock Option Agreement (filed as Exhibit 10.20 to the Company's Annual Report on Form 10-K filed with the SEC on May 19, 2014). +# | |
10.22 | Form of Award Agreement for Restricted Stock Units (filed as Exhibit 10.21 to the Company's Annual Report on Form 10-K filed with the SEC on May 19, 2014). +# | |
10.23 | Form of Nonqualified Stock Option Agreement for grants beginning Fiscal 2018 (filed as Exhibit 10.30 to the Company's Annual Report on Form 10-K filed with the SEC on May 17, 2017). +# | |
10.24 | Form of Award Agreement for Restricted Stock Units for grants beginning Fiscal 2018 (filed as Exhibit 10.31 to the Company's Annual Report on Form 10-K filed with the SEC on May 17, 2017). +# | |
10.25 | Form of Award Agreement for Performance Units for grants beginning Fiscal 2018 (filed as Exhibit 10.32 to the Company's Annual Report on Form 10-K filed with the SEC on May 17, 2017). +# | |
10.26 | Form of Director Indemnification Agreement (filed as Exhibit 10.21 to the Company’s Annual Report on Form 10-K filed with the SEC on May 17, 2013). +@ | |
10.27 | Form of Officer Indemnification Agreement (filed as Exhibit 10.22 to the Company’s Annual Report on Form 10-K filed with the SEC on May 17, 2013). +@ | |
10.28 | Supply Agreement, dated May 15, 2008, by and between Fitzpatrick Bros., Inc. and The Spic and Span Company (filed as Exhibit 10.1 to the Company's Quarterly Report on Form 10-Q filed with the SEC on August 11, 2008).+† | |
10.29 | First Amendment to Supply Agreement, dated as of March 1, 2011, between Fitzpatrick Bros., Inc. and The Spic and Span Company (filed as Exhibit 10.29 to the Company's Annual Report on Form 10-K filed with the SEC on May 13, 2011).+† | |
10.30 | Transitional Manufacturing and Supply Agreement, dated January 31, 2012 between Medtech Products Inc. (“Medtech”) and GlaxoSmithKline Consumer Healthcare L.P. (“GSK”) (filed as Exhibit 10.28 to the Company's Annual Report on Form 10-K filed with the SEC on May 18, 2012).+† | |
10.31 | Amendment No. 1 to Transitional Manufacturing and Supply Agreement, dated as of June 25, 2013 between GSK and Medtech (filed as Exhibit 10.34 to the Company’s Annual Report on Form 10-K filed with the SEC on May 17, 2016). + | |
10.32 | Amendment No. 2 to Transitional Manufacturing and Supply Agreement, dated as of November 6, 2015, between GSK and Medtech (filed as Exhibit 10.35 to the Company’s Annual Report on Form 10-K filed with the SEC on May 17, 2016). + | |
10.33 | Supply Agreement, dated as of July 1, 2012, among Medtech Products Inc. and Pharmacare Limited T/A Aspen Pharmacare (filed as Exhibit 10.26 to the Company’s Annual Report on Form 10-K filed with the SEC on May 17, 2013).+ | |
10.34 | Supply Agreement, dated as of November 16, 2012, among Medtech Products Inc. and BestSweet Inc. (filed as Exhibit 10.27 to the Company’s Annual Report on Form 10-K filed with the SEC on May 17, 2013).+ | |
10.35 | Prestige Brands Holdings, Inc. Executive Severance Plan, dated as of October 30, 2017 (filed as Exhibit 10.1 to the Company’s Current Report on Form 8-K filed on November 2, 2017). +# | |
21.1 | ||
23.1 | ||
31.1 | ||
31.2 | ||
32.1 | ||
32.2 | ||
* | Filed herewith. |
† | Certain confidential portions have been omitted pursuant to a confidential treatment request separately filed with the SEC. |
+ | Incorporated herein by reference. |
@ | Represents a management contract. |
# | Represents a compensatory plan. |