Attached files
| file | filename |
|---|---|
| 8-K - 8-K - Dine Brands Global, Inc. | d181248d8k.htm |
Exhibit 99.1

News Release
Investor Contact
Ken Diptee
Executive Director, Investor Relations
Dine Brands Global, Inc.
818-637-3632
Ken.Diptee@dinebrands.com
Media Contact
Susan Nelson
Vice President, Global Communications
and Public Affairs
Dine Brands Global, Inc.
Susan.Nelson@dinebrands.com
Dine Brands Global, Inc. Reports Second Quarter 2021 Results
Significant Improvement in Domestic System-Wide Comparable Same-Restaurant Sales
99% of Domestic Restaurants Open
Ten New Restaurants Opened by Franchisees
Cash Position Remains Strong
GLENDALE, Calif., August 5, 2021 – Dine Brands Global, Inc. (NYSE: DIN), the parent company of Applebee’s Neighborhood Grill + Bar® and IHOP® restaurants, today announced financial results for the second quarter of 2021.
“Our strong second-quarter results reflect the perseverance of the Dine Brands system as comp sales for both brands improved significantly. I’m thankful to our teams who have worked so hard to serve our guests and enhance the restaurant experience,” said John Peyton, chief executive officer of Dine Brands Global, Inc.
Mr. Peyton added, “Both Applebee’s and IHOP continue to make meaningful progress in a challenging environment. Relative to 2019, Applebee’s posted its best quarterly comp sales performance in over a decade. IHOP’s second-quarter comp sales improved markedly relative to 2019. Our solid fundamentals generated significant adjusted free cash flow and enabled us to maintain a healthy cash position. Our business is built to win thanks to our two iconic brands. Our franchisees are emerging from the pandemic with stable fundamentals. I’m confident we will continue to build on this momentum as we further accelerate innovation, while also focusing on our guests’ needs and accelerating growth.”
Vance Chang, chief financial officer, added, “We are very pleased with the progress we have made in the second quarter. Looking ahead, our optimism is somewhat tempered by continued volatility, which include labor shortages and variants of COVID-19. We remain steadfast in executing our strategy to improve profitability and accelerate sustainable growth.”
Page 1 of 16
Domestic System-Wide Comparable Same-Restaurant Sales Relative to the Second Quarter of 2020
Domestic Same-Restaurant Sales (Fiscal Month)
| April | May | June | Q2 2021 | |||||||||||||
| Applebee’s |
237.4 | % | 116.3 | % | 49.2 | % | 102.2 | % | ||||||||
| IHOP |
297.4 | % | 134.6 | % | 63.4 | % | 120.1 | % | ||||||||
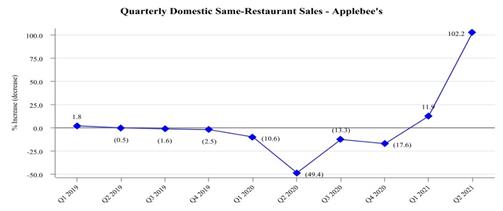
| • | Applebee’s year-over-year comparable same-restaurant sales increased 102.2% for the second quarter of 2021. This compares to an increase of 11.9% for the first quarter of 2021. |
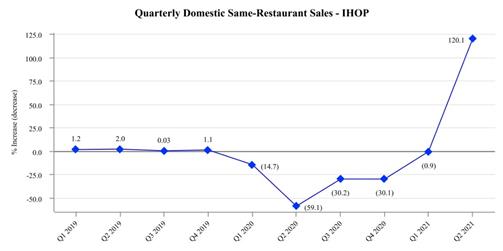
| • | IHOP’s comparable same-restaurant sales increased 120.1% for the second quarter of 2021. This compares to a decrease of 0.9% for the first quarter of 2021. |
| • | Comparable same-restaurant sales for the second quarter of 2021 for both Applebee’s and IHOP improved sequentially from the first quarter of 2021. Both brands outperformed their respective categories in the second quarter of 2021, according to Black Box IntelligenceTM. |
Domestic System-Wide Comparable Same-Restaurant Sales Relative to the Second Quarter of 2019
Domestic Same-Restaurant Sales (Fiscal Month)
| April | May | June | Q2 2021 | |||||||||||||
| Applebee’s |
11.7 | % | 8.1 | % | 11.4 | % | 10.5 | % | ||||||||
| IHOP |
(4.7 | %) | (4.8 | %) | (1.4 | %) | (3.4 | %) | ||||||||
| • | Applebee’s year-over-year comparable same-restaurant sales increased 10.5% for the second quarter of 2021 compared to a decrease of 6.2% for the first quarter of 2021. This reflects an improvement of 16.7 percentage points. |
| • | IHOP’s comparable same-restaurant sales decreased 3.4% for the second quarter of 2021 compared to a decrease of 21.2% for the first quarter of 2021. This reflects an improvement of 17.8 percentage points. |
Page 2 of 16
Historical Domestic System-Wide Comparable Same-Restaurant Sales Relative to the Prior Year
Domestic Average Weekly Sales Comparison to the Second Quarter of 2019
Average Weekly Domestic Unit Sales (in thousands)
| Q2 2021 | Q2 2019 | % of Pre-Pandemic Sales Recovered | ||||
| Applebee’s |
$53.8 | $48.4 | 111.2% | |||
| IHOP |
$36.4 | $36.8 | 98.9% | |||
Off-Premise Sales Growth Comparison Relative to the Second Quarter of 2020
| • | Applebee’s off-premise comparable same-restaurant sales for the second quarter of 2021 increased by 8.0%. This compares to an increase of 122.7% for the first quarter of 2021. |
| • | Applebee’s off-premise sales accounted for 30.3% of sales mix for the second quarter of 2021. |
| • | Applebee’s Carside To Go sales accounted for 17.3% of sales mix for the second quarter of 2021 and delivery sales accounted for 13.0% of sales mix. |
| • | IHOP’s off-premise comparable same-restaurant sales for the second quarter of 2021 increased by 6.3%. This compares to an increase of 123.7% for the first quarter of 2021. |
| • | IHOP’s off-premise sales accounted for 26.1% of sales mix for the second quarter of 2021. |
Page 3 of 16
| • | IHOP’s delivery sales accounted for 13.9% of sales mix and take-out sales accounted for 12.2% of sales mix for the second quarter of 2021. |
Second Quarter of 2021 Summary
| • | GAAP earnings per diluted share of $1.69 for the second quarter of 2021 compared to a net loss per diluted share of $8.33 for the second quarter of 2020. This variance was primarily due to non-cash impairment charges incurred in the second quarter of 2020 totaling $106.5 million related to the write-downs of Applebee’s goodwill and other intangible assets as a result of the impact of COVID-19 on the Company’s operations and higher gross profit. There were no similar impairments in the second quarter of 2021. |
| • | Adjusted earnings per diluted share of $1.94 for the second quarter of 2021 compared to an adjusted net loss per diluted share of $0.87 for the second quarter of 2020. The increase was primarily due to higher gross profit. (See “Non-GAAP Financial Measures” and reconciliation of GAAP earnings per diluted share to adjusted earnings per diluted share.) |
| • | General and administrative expenses for the second quarter of 2021 were $39.3 million compared to $30.9 million for the second quarter of 2020. The variance was mainly due to higher incentive compensation accrual. |
| • | Consolidated adjusted EBITDA for the second quarter of 2021 was $71.7 million compared to $12.1 million for the second quarter of 2020. (See “Non-GAAP Financial Measures” and reconciliation of GAAP net income to consolidated adjusted EBITDA.) |
| • | Development activity by Applebee’s and IHOP franchisees resulted in the opening of 10 new restaurants. |
First Six Months of 2021 Summary
| • | GAAP earnings per diluted share of $3.19 for the first six months of 2021 compared to a net loss per diluted share of $6.96 for the first six months of 2020. This variance was primarily due to non-cash impairment charges incurred in the first six months of 2020 totaling $106.5 million related to the write-downs of Applebee’s goodwill and other intangible assets as a result of the impact of COVID-19 on the Company’s operations and higher gross profit. There were no similar impairments in the first six months of 2021. |
| • | Adjusted earnings per diluted share of $3.67 for the first six months of 2021 compared to adjusted earnings per diluted share of $0.61 for the first six months of 2020. The increase was primarily due to higher gross profit. (See “Non-GAAP Financial Measures” and reconciliation of GAAP earnings per diluted share to adjusted earnings per diluted share.) |
| • | General and administrative expenses for the first six months of 2021 were $79.2 million compared to $68.5 million for the first six months of 2020. The variance was mainly due to higher incentive compensation accrual. |
| • | Consolidated adjusted EBITDA for the first six months of 2021 was $129.9 million. This compares to $73.8 million for the first six months of 2020. (See “Non-GAAP Financial Measures” and reconciliation of GAAP net income to consolidated adjusted EBITDA.) |
| • | Cash flows from operating activities for the first six months of 2021 were $106.0 million. This compares to cash used in operating activities of $10.5 million for the first six months of 2020. The increase was mainly due to an improvement in gross profit, partially offset by an increase in general and administrative expenses. |
Page 4 of 16
| • | The Company generated adjusted free cash flow of $107.3 million for the first six months of 2021. This compares to negative adjusted free cash flow of $12.4 million for the first six months of 2020. The increase is primarily due to the improvement in cash flows from operating activities discussed above. (See “Non-GAAP Financial Measures” and reconciliation of the Company’s cash provided by operating activities to adjusted free cash flow.) |
| • | Development activity by Applebee’s and IHOP franchisees resulted in the opening of 20 new restaurants. |
Cash Position
As of June 30, 2021, the Company had $348.0 million of total cash and cash equivalents, of which $259.5 million was unrestricted cash. The Company believes that its asset-light business model and cash position will continue to provide strong liquidity as the recovery from the pandemic continues.
As of June 30, 2021, there were no outstanding borrowings under the revolving credit facility. As of June 30, 2021, $3.3 million was pledged against the revolving credit facility for outstanding letters of credit.
As of June 30, 2021, the Company’s leverage ratio was 4.94x compared to 7.02x as of March 31, 2021. As a result, quarterly principal payments on the Company’s fixed rate senior secured notes will no longer be required after a $3.25 million principal payment is made in September 2021.
As of June 30, 2021, the Company’s debt service coverage ratio was approximately 4.6x compared to 3.45x as of March 31, 2021.
The Company voluntarily reduced its interest reserve on its fixed rate senior secured notes in the second quarter of 2021 back to the required $16.4 million due to the strong improvement in the Company’s business over the last 12 months.
GAAP Effective Tax Rate
The Company’s effective tax rate for the second quarter of 2021 was a 24.0% tax expense compared to an 8.2% tax benefit for the second quarter of 2020. The Company’s effective tax rate for the second quarter of 2021 was significantly different than the rate for the same quarter of last year primarily due to the non-deductible impairment of goodwill in the second quarter of 2020, which reduced the overall tax benefit generated by the pre-tax book loss.
Financial Performance Guidance for 2021
The Company believes that its consolidated financial results for 2021 could continue to be materially impacted by COVID-19. Considering the ongoing uncertainty of the pandemic and the possible emergence of new variants, the Company currently cannot provide a complete business outlook for fiscal 2021. The Company’s guidance assumes there are no significant disruptions to its business due to COVID-19 during the second half of fiscal 2021. The projections are as of this date. The Company assumes no obligation to update or supplement this information.
| • | The Company expects higher incentive compensation for 2021, which is a variable component of general and administrative expenses that will fluctuate based on business performance. As such, the Company revises expectations for general and administrative expenses for 2021 to range between approximately $168 million and $178 million, including non-cash stock-based compensation expense and depreciation of approximately $30 million. This compares to previous expectations for general and administrative expenses for 2021 to range between approximately $160 million and $170 million. |
Page 5 of 16
| • | The Company reiterates capital expenditures are expected to be approximately $19 million, inclusive of approximately $7 million related to the company restaurants segment. |
Domestic System Reopening Update
As of June 30, 2021, out of 3,244 domestic restaurants, 3,222, or 99%, were open for either dine-in service or off-premise service comprised of take-out and delivery, and 22 were temporarily closed. This compares to as of March 31, 2021, when out of 3,256 domestic restaurants, 3,224, or 99%, were open for either dine-in service or off-premise service comprised of take-out and delivery, and 32 were temporarily closed.
Second Quarter of 2021 Earnings Conference Call Details
Dine Brands will host a conference call to discuss its results on August 5, 2021 at 9:00 a.m. Pacific time. To participate on the call, please dial (833) 528-0602 and enter the conference identification number 6786828. International callers, please dial (830) 221-9708 and enter the conference identification number
6786828.
A live webcast of the call will be available on www.dinebrands.com and may be accessed by visiting Events and Presentations under the site’s Investors section. Participants should allow approximately ten minutes prior to the call’s start time to visit the site and download any streaming media software needed to listen to the webcast. A telephonic replay of the call may be accessed from 12:00 p.m. Pacific time on August 5, 2021 through 12:00 p.m. Pacific time on August 12, 2021 by dialing (855) 859-2056 and entering the conference identification number 6786828. International callers, please dial (404) 537-3406 and enter the conference identification number 6786828. An online archive of the webcast will also be available on Events and Presentations under the Investors section of the Company’s website.
About Dine Brands Global, Inc.
Based in Glendale, California, Dine Brands Global, Inc. (NYSE: DIN), through its subsidiaries, franchises restaurants under both the Applebee’s Neighborhood Grill + Bar and IHOP brands. With approximately 3,500 restaurants combined in 16 countries and approximately 350 franchisees, Dine Brands is one of the largest full-service restaurant companies in the world. For more information on Dine Brands, visit the Company’s website located at www.dinebrands.com.
Forward-Looking Statements
Statements contained in this press release may constitute forward-looking statements within the meaning of Section 27A of the Securities Act of 1933, as amended, and Section 21E of the Securities Exchange Act of 1934, as amended. You can identify these forward-looking statements by words such as “may,” “will,” “would,” “should,” “could,” “expect,” “anticipate,” “believe,” “estimate,” “intend,” “plan,” “goal” and other similar expressions. These statements involve known and unknown risks, uncertainties and other factors, which may cause actual results to be materially different from those expressed or implied in such statements. These factors include, but are not limited to: uncertainty regarding the duration and severity of the ongoing COVID-19 pandemic and its ultimate impact on the Company; the effectiveness of related containment measures; general economic conditions; our level of indebtedness; compliance with the terms of our securitized debt; our ability to refinance our current indebtedness or obtain additional financing; our dependence on information technology; potential cyber incidents; the implementation of restaurant development plans; our dependence on our franchisees; the concentration of our Applebee’s franchised restaurants in a limited number of franchisees; the financial health of our franchisees; our franchisees’ and other licensees’ compliance with our quality standards and trademark usage; general risks associated with the restaurant industry; potential harm to our brands’ reputation; possible future impairment charges; the effects of tax reform; trading volatility and fluctuations in the price of our stock; our ability to achieve the financial guidance we provide to investors; successful implementation of our business strategy; the availability of suitable locations for new restaurants; shortages or interruptions in
Page 6 of 16
the supply or delivery of products from third parties or availability of utilities; the management and forecasting of appropriate inventory levels; development and implementation of innovative marketing and use of social media; changing health or dietary preference of consumers; risks associated with doing business in international markets; the results of litigation and other legal proceedings; third-party claims with respect to intellectual property assets; our ability to attract and retain management and other key employees; compliance with federal, state and local governmental regulations; risks associated with our self-insurance; natural disasters, pandemics, epidemics, or other serious incidents; our success with development initiatives outside of our core business; the adequacy of our internal controls over financial reporting and future changes in accounting standards; and other factors discussed from time to time in the Corporation’s Annual and Quarterly Reports on Forms 10-K and 10-Q and in the Corporation’s other filings with the Securities and Exchange Commission. The forward-looking statements contained in this press release are made as of the date hereof and the Corporation does not intend to, nor does it assume any obligation to, update or supplement any forward-looking statements after the date hereof to reflect actual results or future events or circumstances.
Non-GAAP Financial Measures
This press release includes references to the Company’s non-GAAP financial measure “adjusted net income available to common stockholders”, “adjusted earnings per diluted share (Adjusted EPS)”, “Adjusted EBITDA” and “Adjusted free cash flow.” Adjusted EPS is computed for a given period by deducting from net income or loss available to common stockholders for such period the effect of any closure and impairment charges, any gain or loss related to debt extinguishment, any intangible asset amortization, any non-cash interest expense, any gain or loss related to the disposition of assets, and other items deemed not reflective of current operations. This is presented on an aggregate basis and a per share (diluted) basis. Adjusted EBITDA is computed for a given period by deducting from net income or loss for such period the effect of any closure and impairment charges, any interest charges, any income tax provision or benefit, any non-cash stock-based compensation, any depreciation and amortization, any gain or loss related to the disposition of assets and other items deemed not reflective of current operations. “Adjusted free cash flow” for a given period is defined as cash provided by operating activities, plus receipts from notes and equipment contracts receivable, less capital expenditures. Management may use certain of these non-GAAP financial measures along with the corresponding U.S. GAAP measures to evaluate the performance of the business and to make certain business decisions. Management uses adjusted free cash flow in its periodic assessments of, among other things, the amount of cash dividends per share of common stock and repurchases of common stock and we believe it is important for investors to have the same measure used by management for that purpose. Adjusted free cash flow does not represent residual cash flow available for discretionary purposes. Additionally, adjusted EPS is one of the metrics used in determining payouts under the Company’s annual cash incentive plan. Management believes that these non-GAAP financial measures provide additional meaningful information that should be considered when assessing the business and the Company’s performance compared to prior periods and the marketplace. Adjusted EPS and adjusted free cash flow are supplemental non-GAAP financial measures and should not be considered in isolation or as a substitute for measures of performance prepared in accordance with U.S. GAAP.
Page 7 of 16
Dine Brands Global, Inc. and Subsidiaries
Consolidated Statements of Comprehensive Income (Loss)
(In thousands, except per share amounts)
(Unaudited)
| Three Months Ended | Six Months Ended | |||||||||||||||
| June 30, | June 30, | |||||||||||||||
| 2021 | 2020 | 2021 | 2020 | |||||||||||||
| Revenues: |
||||||||||||||||
| Franchise revenues: |
||||||||||||||||
| Royalties, franchise fees and other |
$ | 94,630 | $ | 38,781 | $ | 174,721 | $ | 122,095 | ||||||||
| Advertising revenues |
72,324 | 29,095 | 133,209 | 90,818 | ||||||||||||
|
|
|
|
|
|
|
|
|
|
|
|
| |||||
| Total franchise revenues |
166,954 | 67,876 | 307,930 | 212,913 | ||||||||||||
| Company restaurant sales |
38,194 | 16,774 | 74,143 | 48,074 | ||||||||||||
| Rental revenues |
27,382 | 23,707 | 53,524 | 52,716 | ||||||||||||
| Financing revenues |
1,089 | 1,355 | 2,221 | 2,893 | ||||||||||||
|
|
|
|
|
|
|
|
|
|
|
|
| |||||
| Total revenues |
233,619 | 109,712 | 437,818 | 316,596 | ||||||||||||
|
|
|
|
|
|
|
|
|
|
|
|
| |||||
| Cost of revenues: |
||||||||||||||||
| Franchise expenses: |
||||||||||||||||
| Advertising expenses |
72,324 | 29,095 | 133,209 | 90,818 | ||||||||||||
| Bad debt (credit) expense |
(291 | ) | 5,053 | (2,284 | ) | 5,571 | ||||||||||
| Other franchise expenses |
7,224 | 2,932 | 13,275 | 10,141 | ||||||||||||
|
|
|
|
|
|
|
|
|
|
|
|
| |||||
| Total franchise expenses |
79,257 | 37,080 | 144,200 | 106,530 | ||||||||||||
| Company restaurant expenses |
34,759 | 21,139 | 67,643 | 51,471 | ||||||||||||
| Rental expenses: |
||||||||||||||||
| Interest expense from finance leases |
893 | 1,137 | 1,855 | 2,347 | ||||||||||||
| Other rental expenses |
19,718 | 20,106 | 39,714 | 41,429 | ||||||||||||
|
|
|
|
|
|
|
|
|
|
|
|
| |||||
| Total rental expenses |
20,611 | 21,243 | 41,569 | 43,776 | ||||||||||||
| Financing expenses |
115 | 128 | 243 | 270 | ||||||||||||
|
|
|
|
|
|
|
|
|
|
|
|
| |||||
| Total cost of revenues |
134,742 | 79,590 | 253,655 | 202,047 | ||||||||||||
|
|
|
|
|
|
|
|
|
|
|
|
| |||||
| Gross profit |
98,877 | 30,122 | 184,163 | 114,549 | ||||||||||||
| General and administrative expenses |
39,276 | 30,870 | 79,187 | 68,478 | ||||||||||||
| Interest expense, net |
15,739 | 17,127 | 32,235 | 32,299 | ||||||||||||
| Impairment and closure charges |
2,571 | 124,365 | 4,581 | 124,353 | ||||||||||||
| Amortization of intangible assets |
2,663 | 2,755 | 5,351 | 5,581 | ||||||||||||
| (Gain) loss on disposition of assets |
(30 | ) | 1,776 | 137 | 1,543 | |||||||||||
|
|
|
|
|
|
|
|
|
|
|
|
| |||||
| Income before income taxes | 38,658 | (146,771 | ) | 62,672 | (117,705 | ) | ||||||||||
| Income tax (provision) benefit | (9,296 | ) | 11,992 | (7,707 | ) | 5,254 | ||||||||||
|
|
|
|
|
|
|
|
|
|
|
|
| |||||
| Net income (loss) |
$ | 29,362 | $ | (134,779 | ) | $ | 54,965 | $ | (112,451 | ) | ||||||
|
|
|
|
|
|
|
|
|
|
|
|
| |||||
| Net income (loss) available to common stockholders: |
||||||||||||||||
| Net income (loss) |
$ | 29,362 | $ | (134,779 | ) | $ | 54,965 | $ | (112,451 | ) | ||||||
| Less: Net income allocated to unvested participating restricted stock |
(657 | ) | — | (1,431 | ) | (420 | ) | |||||||||
|
|
|
|
|
|
|
|
|
|
|
|
| |||||
| Net income (loss) available to common stockholders |
$ | 28,705 | $ | (134,779 | ) | $ | 53,534 | $ | (112,871 | ) | ||||||
|
|
|
|
|
|
|
|
|
|
|
|
| |||||
| Net income (loss) available to common stockholders per share: |
||||||||||||||||
| Basic |
$ | 1.70 | $ | (8.33 | ) | $ | 3.21 | $ | (6.96 | ) | ||||||
|
|
|
|
|
|
|
|
|
|
|
|
| |||||
| Diluted |
$ | 1.69 | $ | (8.33 | ) | $ | 3.19 | $ | (6.96 | ) | ||||||
|
|
|
|
|
|
|
|
|
|
|
|
| |||||
| Weighted average shares outstanding: |
||||||||||||||||
| Basic |
16,886 | 16,177 | 16,673 | 16,215 | ||||||||||||
|
|
|
|
|
|
|
|
|
|
|
|
| |||||
| Diluted |
16,977 | 16,177 | 16,802 | 16,215 | ||||||||||||
|
|
|
|
|
|
|
|
|
|
|
|
| |||||
| Dividends declared per common share | $ | — | $ | — | $ | — | $ | 0.76 | ||||||||
|
|
|
|
|
|
|
|
|
|
|
|
| |||||
| Dividends paid per common share | $ | — | $ | 0.76 | $ | — | $ | 1.45 | ||||||||
|
|
|
|
|
|
|
|
|
|
|
|
| |||||
Page 8 of 16
Dine Brands Global, Inc. and Subsidiaries
Consolidated Balance Sheets
(In thousands, except share and per share amounts)
| June 30, 2021 | December 31, 2020 | |||||||
| (Unaudited) | ||||||||
| Assets |
||||||||
| Current assets: |
||||||||
| Cash and cash equivalents |
$ | 259,461 | $ | 383,369 | ||||
| Receivables, net of allowance of $10,095 (2021) and $15,057 (2020) |
99,308 | 121,897 | ||||||
| Restricted cash |
72,137 | 39,884 | ||||||
| Prepaid gift card costs |
21,716 | 29,080 | ||||||
| Prepaid income taxes |
397 | 6,178 | ||||||
| Other current assets |
8,134 | 6,098 | ||||||
|
|
|
|
|
|
| |||
| Total current assets |
461,153 | 586,506 | ||||||
| Other intangible assets, net |
544,587 | 549,671 | ||||||
| Operating lease right-of-use assets |
331,826 | 346,086 | ||||||
| Goodwill |
251,628 | 251,628 | ||||||
| Property and equipment, net |
178,571 | 187,977 | ||||||
| Long-term receivables, net of allowance of $5,503 (2021) and $7,999 (2020) |
47,839 | 54,512 | ||||||
| Deferred rent receivable |
53,017 | 56,449 | ||||||
| Non-current restricted cash |
16,400 | 32,800 | ||||||
| Other non-current assets, net |
10,902 | 9,316 | ||||||
|
|
|
|
|
|
| |||
| Total assets |
$ | 1,895,923 | $ | 2,074,945 | ||||
|
|
|
|
|
|
| |||
| Liabilities and Stockholders’ Deficit |
||||||||
| Current liabilities: |
||||||||
| Current maturities of long-term debt |
$ | 3,250 | $ | 13,000 | ||||
| Accounts payable |
40,126 | 37,424 | ||||||
| Gift card liability |
120,842 | 144,159 | ||||||
| Current maturities of operating lease obligations |
70,491 | 69,672 | ||||||
| Current maturities of finance lease and financing obligations |
10,954 | 11,293 | ||||||
| Accrued employee compensation and benefits |
22,785 | 21,237 | ||||||
| Accrued advertising |
52,707 | 21,641 | ||||||
| Deferred franchise revenue, short-term |
7,447 | 7,682 | ||||||
| Other accrued expenses |
16,253 | 22,460 | ||||||
|
|
|
|
|
|
| |||
| Total current liabilities |
344,855 | 348,568 | ||||||
| Long-term debt, net, less current maturities |
1,278,504 | 1,491,996 | ||||||
| Operating lease obligations, less current maturities |
325,278 | 345,163 | ||||||
| Finance lease obligations, less current maturities |
64,095 | 69,012 | ||||||
| Financing obligations, less current maturities |
32,393 | 32,797 | ||||||
| Deferred income taxes, net |
67,780 | 78,293 | ||||||
| Deferred franchise revenue, long-term |
47,794 | 52,237 | ||||||
| Other non-current liabilities |
17,975 | 11,530 | ||||||
|
|
|
|
|
|
| |||
| Total liabilities |
2,178,674 | 2,429,596 | ||||||
|
|
|
|
|
|
| |||
| Commitments and contingencies |
||||||||
| Stockholders’ deficit: |
||||||||
| Preferred stock, $1 par value, 10,000,000 shares authorized, no shares issued or outstanding |
— | — | ||||||
| Common stock, $0.01 par value; shares: 40,000,000 authorized; June 30, 2021 - 25,011,253 issued, 17,177,950 outstanding; December 31, 2020 - 24,882,122 issued, 16,452,174 outstanding |
250 | 249 | ||||||
| Additional paid-in-capital |
250,509 | 257,625 | ||||||
| Accumulated deficit |
(588 | ) | (55,553 | ) | ||||
| Accumulated other comprehensive loss |
(57 | ) | (55 | ) | ||||
| Treasury stock, at cost; shares: June 30, 2021 - 7,833,303; December 31, 2020 - 8,429,948 |
(532,865 | ) | (556,917 | ) | ||||
|
|
|
|
|
|
| |||
| Total stockholders’ deficit |
(282,751 | ) | (354,651 | ) | ||||
|
|
|
|
|
|
| |||
| Total liabilities and stockholders’ deficit |
$ | 1,895,923 | $ | 2,074,945 | ||||
|
|
|
|
|
|
| |||
Page 9 of 16
Dine Brands Global, Inc. and Subsidiaries
Consolidated Statements of Cash Flows
(In thousands)
(Unaudited)
| Six Months Ended | ||||||||
| June 30, | ||||||||
| 2021 | 2020 | |||||||
| Cash flows from operating activities: |
||||||||
| Net income (loss) |
$ | 54,965 | $ | (112,451 | ) | |||
| Adjustments to reconcile net income (loss) to cash flows provided by (used in) operating activities: |
||||||||
| Non-cash impairment and closure charges |
4,514 | 124,343 | ||||||
| Depreciation and amortization |
19,976 | 21,345 | ||||||
| Non-cash stock-based compensation expense |
5,612 | 6,670 | ||||||
| Non-cash interest expense |
1,427 | 1,318 | ||||||
| Deferred income taxes |
(10,007 | ) | (10,793 | ) | ||||
| Deferred revenue |
(4,678 | ) | (4,840 | ) | ||||
| Loss on disposition of assets |
137 | 1,543 | ||||||
| Other |
(3,608 | ) | (252 | ) | ||||
| Changes in operating assets and liabilities: |
||||||||
| Accounts receivable, net |
4,928 | (31,039 | ) | |||||
| Current income tax receivables and payables |
5,315 | (5,456 | ) | |||||
| Gift card receivables and payables |
(3,837 | ) | 2,293 | |||||
| Other current assets |
(2,036 | ) | (2,503 | ) | ||||
| Accounts payable |
6,195 | (903 | ) | |||||
| Accrued employee compensation and benefits |
1,466 | (13,336 | ) | |||||
| Accrued advertising expenses |
31,066 | 13,012 | ||||||
| Other current liabilities |
(5,419 | ) | 532 | |||||
|
|
|
|
|
|
| |||
| Cash flows provided by (used in) operating activities |
106,016 | (10,517 | ) | |||||
|
|
|
|
|
|
| |||
| Cash flows from investing activities: |
||||||||
| Principal receipts from notes, equipment contracts and other long-term receivables |
9,703 | 10,772 | ||||||
| Net additions to property and equipment |
(4,064 | ) | (7,380 | ) | ||||
| Proceeds from sale of property and equipment |
946 | 456 | ||||||
| Additions to long-term receivables |
— | (1,475 | ) | |||||
| Other |
(237 | ) | (276 | ) | ||||
|
|
|
|
|
|
| |||
| Cash flows provided by investing activities |
6,348 | 2,097 | ||||||
|
|
|
|
|
|
| |||
| Cash flows from financing activities: |
||||||||
| Repayment of long-term debt |
(6,500 | ) | — | |||||
| Borrowing from revolving credit facility |
— | 220,000 | ||||||
| Repayment of revolving credit facility |
(220,000 | ) | — | |||||
| Dividends paid on common stock |
— | (23,934 | ) | |||||
| Repurchase of common stock |
— | (29,853 | ) | |||||
| Principal payments on finance lease obligations |
(5,244 | ) | (5,993 | ) | ||||
| Proceeds from stock options exercised |
22,511 | 20,523 | ||||||
| Tax payments for restricted stock upon vesting |
(1,403 | ) | (2,129 | ) | ||||
| Tax payments for share settlement of restricted stock units |
(9,783 | ) | (178 | ) | ||||
|
|
|
|
|
|
| |||
| Cash flows (used in) provided by financing activities |
(220,419 | ) | 178,436 | |||||
|
|
|
|
|
|
| |||
| Net change in cash, cash equivalents and restricted cash |
(108,055 | ) | 170,016 | |||||
| Cash, cash equivalents and restricted cash at beginning of period |
456,053 | 172,475 | ||||||
|
|
|
|
|
|
| |||
| Cash, cash equivalents and restricted cash at end of period |
$ | 347,998 | $ | 342,491 | ||||
|
|
|
|
|
|
| |||
Page 10 of 16
Dine Brands Global, Inc. and Subsidiaries
Non-GAAP Financial Measures
(In thousands, except per share amounts)
(Unaudited)
Reconciliation of net income (loss) available to common stockholders to net income (loss) available to common stockholders, as adjusted for the following items: Impairment and closure charges; amortization of intangible assets; non-cash interest expense; gain or loss on disposition of assets; and the combined tax effect of the preceding adjustments, as well as related per share data:
| Three Months Ended
June 30, |
Six Months Ended
June 30, | |||||||||||||||
| 2021 | 2020 | 2021 | 2020 | |||||||||||||
| Net income (loss) available to common stockholders, as reported |
$ | 28,705 | $ | (134,779 | ) | $ | 53,534 | $ | (112,871 | ) | ||||||
| Impairment and closure charges |
2,571 | 124,365 | 4,581 | 124,353 | ||||||||||||
| Amortization of intangible assets |
2,663 | 2,755 | 5,351 | 5,581 | ||||||||||||
| Non-cash interest expense |
715 | 663 | 1,427 | 1,318 | ||||||||||||
| (Gain) loss on disposition of assets |
(30 | ) | 1,776 | 137 | 1,543 | |||||||||||
| Net income tax provision for above adjustments |
(1,598 | ) | (9,331 | ) | (3,104 | ) | (10,140 | ) | ||||||||
| Net income allocated to unvested participating restricted stock |
(97 | ) | 514 | (219 | ) | 88 | ||||||||||
|
|
|
|
|
|
|
|
|
|
|
|
| |||||
| Net income (loss) available to common stockholders, as adjusted |
$ | 32,929 | $ | (14,037) | $ | 61,707 | $ | 9,872 | ||||||||
|
|
|
|
|
|
|
|
|
|
|
|
| |||||
| Diluted net income (loss) available to common stockholders per share: |
||||||||||||||||
| Net income (loss) available to common stockholders per share, as reported |
$ | 1.69 | $ | (8.33 | ) | $ | 3.19 | $ | (6.96 | ) | ||||||
| Impairment and closure charges |
0.11 | 7.19 | 0.20 | 7.14 | ||||||||||||
| Amortization of intangible assets |
0.11 | 0.13 | 0.23 | 0.26 | ||||||||||||
| Non-cash interest expense |
0.03 | 0.03 | 0.06 | 0.06 | ||||||||||||
| (Gain) loss on disposition of assets |
(0.00 | ) | 0.08 | 0.01 | 0.07 | |||||||||||
| Net income allocated to unvested participating restricted stock |
(0.01 | ) | 0.03 | (0.01) | 0.01 | |||||||||||
| Rounding |
0.01 | — | (0.01) | 0.03 | ||||||||||||
|
|
|
|
|
|
|
|
|
|
|
|
| |||||
| Diluted net income (loss) available to common stockholders per share, as adjusted |
$ | 1.94 | $ | (0.87 | ) | $ | 3.67 | $ | 0.61 | |||||||
|
|
|
|
|
|
|
|
|
|
|
|
| |||||
| Numerator for basic EPS - net income (loss) available to common stockholders, as adjusted |
$ | 32,929 | $ | (14,037 | ) | $ | 61,707 | $ | 9,872 | |||||||
| Effect of unvested participating restricted stock using the two-class method |
3 | 1 | 12 | — | ||||||||||||
|
|
|
|
|
|
|
|
|
|
|
|
| |||||
| Numerator for diluted EPS - net income (loss) available to common stockholders, as adjusted |
$ | 32,932 | $ | (14,036 | ) | $ | 61,719 | $ | 9,872 | |||||||
|
|
|
|
|
|
|
|
|
|
|
|
| |||||
| Denominator for basic EPS - weighted-average shares |
16,886 | 16,177 | 16,673 | 16,215 | ||||||||||||
| Dilutive effect of stock options |
91 | — | 129 | 101 | ||||||||||||
|
|
|
|
|
|
|
|
|
|
|
|
| |||||
| Denominator for diluted EPS - weighted-average shares |
16,977 | 16,177 | 16,802 | 16,316 | ||||||||||||
|
|
|
|
|
|
|
|
|
|
|
|
| |||||
Page 11 of 16
Dine Brands Global, Inc. and Subsidiaries
Non-GAAP Financial Measures
(Unaudited)
Reconciliation of the Company’s cash provided by operating activities to “adjusted free cash flow” (cash provided by operating activities, plus receipts from notes and equipment contracts receivable, less additions to property and equipment). Management uses this liquidity measure in its periodic assessments of, among other things, the amount of cash dividends per share of common stock and repurchases of common stock. We believe it is important for investors to have the same measure used by management for that purpose. Adjusted free cash flow does not represent residual cash flow available for discretionary purposes.
| Six Months Ended
June 30, | ||||||||
| 2021 | 2020 | |||||||
| (In millions) | ||||||||
| Cash flows provided by (used in) operating activities |
$ | 106.0 | $ | (10.5 | ) | |||
| Receipts from notes and equipment contracts receivable |
5.4 | 5.5 | ||||||
| Net additions to property and equipment |
(4.1 | ) | (7.4 | ) | ||||
|
|
|
|
|
|
| |||
| Adjusted free cash flow |
107.3 | (12.4 | ) | |||||
| Dividends paid on common stock |
— | (23.9 | ) | |||||
| Repurchase of common stock |
— | (29.9 | ) | |||||
|
|
|
|
|
|
| |||
| $ | 107.3 | $ | (66.2 | ) | ||||
|
|
|
|
|
|
| |||
Page 12 of 16
Dine Brands Global, Inc. and Subsidiaries
Non-GAAP Financial Measures
(in thousands)
(Unaudited)
Reconciliation of the Company’s net income (loss) to “adjusted EBITDA.” The Company defines adjusted EBITDA as net income or loss, adjusted for the effect of impairment and closure charges, interest charges, income tax provision or benefit, depreciation and amortization, non-cash stock-based compensation, gain or loss on disposition of assets, other non-income based taxes and other items deemed not reflective of current operations. Management may use certain non-GAAP measures along with the corresponding U.S. GAAP measures to evaluate the performance of the Company and to make certain business decisions.
| Three Months Ended | Six Months Ended | |||||||||||||||
| June 30, | June 30, | |||||||||||||||
| 2021 | 2020 | 2021 | 2020 | |||||||||||||
| Net income (loss), as reported |
$ | 29,362 | $ | (134,779 | ) | $ | 54,965 | $ | (112,451 | ) | ||||||
| Impairment and closure charges |
2,571 | 124,365 | 4,581 | 124,353 | ||||||||||||
| Interest charges on finance leases |
1,383 | 1,646 | 2,847 | 3,369 | ||||||||||||
| All other interest charges |
16,446 | 17,657 | 33,691 | 33,899 | ||||||||||||
| Income tax provision (benefit) |
9,296 | (11,992 | ) | 7,707 | (5,254 | ) | ||||||||||
| Depreciation and amortization |
9,972 | 10,695 | 19,959 | 21,345 | ||||||||||||
| Non-cash stock-based compensation |
2,517 | 2,632 | 5,614 | 6,670 | ||||||||||||
| (Gain) loss on disposition of assets |
(30 | ) | 1,776 | 137 | 1,543 | |||||||||||
| Other |
221 | 86 | 353 | 304 | ||||||||||||
|
|
|
|
|
|
|
|
|
|
|
|
| |||||
| Adjusted EBITDA |
$ | 71,738 | $ | 12,086 | $ | 129,854 | $ | 73,778 | ||||||||
|
|
|
|
|
|
|
|
|
|
|
|
| |||||
Page 13 of 16
Dine Brands Global, Inc. and Subsidiaries
Restaurant Data
(Unaudited)
The following table sets forth, for the three and six months ended June 30, 2021 and 2020, the number of “Effective Restaurants” in the Applebee’s and IHOP systems and information regarding the percentage change in sales at those restaurants compared to the same periods in the prior year and, as such, the percentage change in sales at Effective Restaurants is based on non-GAAP sales data. Sales at restaurants that are owned by franchisees and area licensees are not attributable to the Company. However, we believe that presentation of this information is useful in analyzing our revenues because franchisees and area licensees pay us royalties and advertising fees that are generally based on a percentage of their sales, and, where applicable, rental payments under leases that partially may be based on a percentage of their sales. Management also uses this information to make decisions about future plans for the development of additional restaurants as well as evaluation of current operations.
| Three Months Ended | Six Months Ended | |||||||||||||||
| June 30, | June 30, | |||||||||||||||
| 2021 | 2020 | 2021 | 2020 | |||||||||||||
| Applebee’s |
||||||||||||||||
| Effective Restaurants(a) |
||||||||||||||||
| Franchise |
1,623 | 1,527 | 1,625 | 1,612 | ||||||||||||
| Company |
69 | 67 | 69 | 68 | ||||||||||||
|
|
|
|
|
|
|
|
|
|
|
|
| |||||
| Total |
1,692 | 1,594 | 1,694 | 1,680 | ||||||||||||
|
|
|
|
|
|
|
|
|
|
|
|
| |||||
| System-wide(b) |
||||||||||||||||
| Domestic sales percentage change(c) |
125.3 | % | (53.5 | )% | 43.3 | % | (32.5 | )% | ||||||||
| Domestic same-restaurant sales percentage change(d) |
102.2 | % | (49.4 | )% | 46.4 | % | (29.1 | )% | ||||||||
| Franchise(b) |
||||||||||||||||
| Domestic sales percentage change(c) |
125.2 | % | (53.6 | )% | 43.0 | % | (32.5 | )% | ||||||||
| Domestic same-restaurant sales percentage change(d) |
102.1 | % | (49.4 | )% | 46.1 | % | (29.0 | )% | ||||||||
| Average weekly domestic unit sales (in thousands) |
$ | 53.8 | $ | 25.0 | $ | 50.3 | $ | 35.2 | ||||||||
| IHOP |
||||||||||||||||
| Effective Restaurants(a) |
||||||||||||||||
| Franchise |
1,568 | 1,375 | 1,566 | 1,510 | ||||||||||||
| Area license |
155 | 144 | 156 | 153 | ||||||||||||
|
|
|
|
|
|
|
|
|
|
|
|
| |||||
| Total |
1,723 | 1,519 | 1,722 | 1,663 | ||||||||||||
|
|
|
|
|
|
|
|
|
|
|
|
| |||||
| System-wide(b) |
||||||||||||||||
| Sales percentage change(c) |
163.6 | % | (64.3 | )% | 39.2 | % | (39.1 | )% | ||||||||
| Domestic same-restaurant sales percentage change, including area license restaurants(d) |
120.1 | % | (59.1 | )% | 40.7 | % | (35.6 | )% | ||||||||
| Franchise(b) |
||||||||||||||||
| Sales percentage change(c) |
163.1 | % | (64.4 | )% | 38.5 | % | (39.2 | )% | ||||||||
| Domestic same-restaurant sales percentage change(d) |
118.2 | % | (58.9 | )% | 39.4 | % | (35.4 | )% | ||||||||
| Average weekly unit sales (in thousands) |
$ | 36.4 | $ | 15.8 | $ | 32.9 | $ | 24.6 | ||||||||
| Area License (b) |
||||||||||||||||
| Sales percentage change(c) |
168.8 | % | (63.3 | )% | 46.7 | % | (38.1 | )% | ||||||||
Page 14 of 16
Dine Brands Global, Inc. and Subsidiaries
Restaurant Data
(Unaudited)
| (a) | “Effective Restaurants” are the weighted average number of restaurants open in a given fiscal period, adjusted to account for restaurants open for only a portion of the period. Information is presented for all Effective Restaurants in the Applebee’s and IHOP systems, which includes restaurants owned by franchisees and area licensees as well as those owned by the Company. Effective Restaurants do not include units operated as ghost kitchens (small kitchens with no store-front presence, used to fill off-premise orders). |
| (b) | “System-wide” sales are retail sales at domestic Applebee’s restaurants operated by franchisees and IHOP restaurants operated by franchisees and area licensees, as reported to the Company, in addition to retail sales at company-operated restaurants. System-wide sales do not include retail sales of ghost kitchens. Sales at restaurants that are owned by franchisees and area licensees are not attributable to the Company. An increase or decrease in franchisees’ reported sales will result in a corresponding increase or decrease in our royalty revenue. Unaudited reported sales for Applebee’s domestic franchise restaurants, Applebee’s company-operated restaurants, IHOP franchise restaurants and IHOP area license restaurants for the three and six months ended June 30, 2021 and 2020 were as follows: |
| Three Months Ended | Six Months Ended | |||||||||||||||
| June 30, | June 30, | |||||||||||||||
| 2021 | 2020 | 2021 | 2020 | |||||||||||||
| (In millions) | ||||||||||||||||
| Reported sales |
||||||||||||||||
| Applebee’s domestic franchise restaurant sales |
$ | 1,062.8 | $ | 472.0 | $ | 1,987.5 | $ | 1,390.2 | ||||||||
| Applebee’s company-operated restaurants |
38.2 | 16.8 | 74.1 | 48.1 | ||||||||||||
| IHOP franchise restaurant sales |
742.0 | 282.1 | 1,338.8 | 966.9 | ||||||||||||
| IHOP area license restaurant sales |
70.9 | 26.4 | 132.6 | 90.4 | ||||||||||||
|
|
|
|
|
|
|
|
|
|
|
|
| |||||
| Total |
$ | 1,913.9 | $ | 797.3 | $ | 3,533.0 | $ | 2,495.6 | ||||||||
|
|
|
|
|
|
|
|
|
|
|
|
| |||||
| (c) | “Sales percentage change” reflects, for each category of restaurants, the percentage change in sales in any given fiscal period compared to the prior fiscal period for all restaurants in that category. |
| (d) | “Domestic same-restaurant sales percentage change” reflects the percentage change in sales, in any given fiscal period, compared to the same weeks in the prior year for domestic restaurants that have been operated during both fiscal periods that are being compared and have been open for at least 18 months. Because of new unit openings and restaurant closures, the domestic restaurants open during both fiscal periods being compared may be different from period to period. |
Page 15 of 16
Dine Brands Global, Inc. and Subsidiaries
Restaurant Data
(Unaudited)
| Three Months Ended | Six Months Ended | |||||||||||||||
| June 30, | June 30, | |||||||||||||||
| Applebee’s Restaurant Development Activity | 2021 | 2020 | 2021 | 2020 | ||||||||||||
| Summary - beginning of period: |
||||||||||||||||
| Franchise |
1,636 | 1,706 | 1,640 | 1,718 | ||||||||||||
| Company |
69 | 69 | 69 | 69 | ||||||||||||
|
|
|
|
|
|
|
|
|
|
|
|
| |||||
| Total Applebee’s restaurants, beginning of period |
1,705 | 1,775 | 1,709 | 1,787 | ||||||||||||
|
|
|
|
|
|
|
|
|
|
|
|
| |||||
| Franchise restaurants opened: |
||||||||||||||||
| Domestic |
— | — | 2 | — | ||||||||||||
| International |
1 | — | 1 | — | ||||||||||||
|
|
|
|
|
|
|
|
|
|
|
|
| |||||
| Total franchise restaurants opened |
1 | — | 3 | — | ||||||||||||
|
|
|
|
|
|
|
|
|
|
|
|
| |||||
| Franchise restaurants permanently closed: |
||||||||||||||||
| Domestic |
(6 | ) | (24 | ) | (10 | ) | (32 | ) | ||||||||
| International |
(4 | ) | (2 | ) | (6 | ) | (6 | ) | ||||||||
|
|
|
|
|
|
|
|
|
|
|
|
| |||||
| Total franchise restaurants permanently closed |
(10 | ) | (26 | ) | (16 | ) | (38 | ) | ||||||||
|
|
|
|
|
|
|
|
|
|
|
|
| |||||
| Net franchise restaurant reduction |
(9 | ) | (26 | ) | (13 | ) | (38 | ) | ||||||||
|
|
|
|
|
|
|
|
|
|
|
|
| |||||
| Summary - end of period: |
||||||||||||||||
| Franchise |
1,627 | 1,680 | 1,627 | 1,680 | ||||||||||||
| Company |
69 | 69 | 69 | 69 | ||||||||||||
|
|
|
|
|
|
|
|
|
|
|
|
| |||||
| Total Applebee’s restaurants, end of period |
1,696 | 1,749 | 1,696 | 1,749 | ||||||||||||
|
|
|
|
|
|
|
|
|
|
|
|
| |||||
| Domestic |
1,590 | 1,633 | 1,590 | 1,633 | ||||||||||||
| International |
106 | 116 | 106 | 116 | ||||||||||||
| IHOP Restaurant Development Activity |
||||||||||||||||
| Summary - beginning of period: |
||||||||||||||||
| Franchise |
1,593 | 1,680 | 1,611 | 1,680 | ||||||||||||
| Area license |
156 | 160 | 158 | 161 | ||||||||||||
| Company |
4 | — | 3 | — | ||||||||||||
|
|
|
|
|
|
|
|
|
|
|
|
| |||||
| Total IHOP restaurants, beginning of period |
1,753 | 1,840 | 1,772 | 1,841 | ||||||||||||
|
|
|
|
|
|
|
|
|
|
|
|
| |||||
| Franchise/area license restaurants opened: |
||||||||||||||||
| Domestic franchise |
7 | 1 | 15 | 7 | ||||||||||||
| Domestic area license |
1 | — | 1 | 1 | ||||||||||||
| International franchise |
1 | — | 1 | 2 | ||||||||||||
|
|
|
|
|
|
|
|
|
|
|
|
| |||||
| Total franchise/area license restaurants opened |
9 | 1 | 17 | 10 | ||||||||||||
|
|
|
|
|
|
|
|
|
|
|
|
| |||||
| Franchise/area license restaurants permanently closed: |
||||||||||||||||
| Domestic franchise |
(14 | ) | (13 | ) | (30 | ) | (19 | ) | ||||||||
| Domestic area license |
— | (1 | ) | (2 | ) | (3 | ) | |||||||||
| International franchise |
— | (2 | ) | (9 | ) | (4 | ) | |||||||||
| International area license |
(1 | ) | (2 | ) | (1 | ) | (2 | ) | ||||||||
|
|
|
|
|
|
|
|
|
|
|
|
| |||||
| Total franchise/area license restaurants permanently closed |
(15 | ) | (18 | ) | (42 | ) | (28 | ) | ||||||||
|
|
|
|
|
|
|
|
|
|
|
|
| |||||
| Net franchise/area license restaurant reduction |
(6 | ) | (17 | ) | (25 | ) | (18 | ) | ||||||||
| Refranchised from Company restaurants |
1 | — | 1 | — | ||||||||||||
| Franchise restaurants reacquired by the Company |
— | — | (1 | ) | — | |||||||||||
|
|
|
|
|
|
|
|
|
|
|
|
| |||||
| Net franchise/area license restaurant decrease |
(5 | ) | (17 | ) | (25 | ) | (18 | ) | ||||||||
|
|
|
|
|
|
|
|
|
|
|
|
| |||||
| Summary - end of period |
||||||||||||||||
| Franchise |
1,588 | 1,666 | 1,588 | 1,666 | ||||||||||||
| Area license |
156 | 157 | 156 | 157 | ||||||||||||
| Company |
3 | — | 3 | — | ||||||||||||
|
|
|
|
|
|
|
|
|
|
|
|
| |||||
| Total IHOP restaurants, end of period |
1,747 | 1,823 | 1,747 | 1,823 | ||||||||||||
|
|
|
|
|
|
|
|
|
|
|
|
| |||||
| Domestic |
1,654 | 1,696 | 1,654 | 1,696 | ||||||||||||
| International |
93 | 127 | 93 | 127 | ||||||||||||
The restaurant counts and activity presented above do not include three domestic Applebee’s ghost kitchens (small kitchens with no store-front presence, used to fill off-premise orders) and two international IHOP ghost kitchens.
Page 16 of 16