Attached files
| file | filename |
|---|---|
| 8-K - 8-K - First Internet Bancorp | inbk-20210803.htm |

Investor Presentation Second Quarter 2021 Exhibit 99.1
Forward-Looking Statements & Non-GAAP Financial Measures This presentation may contain forward-looking statements with respect to the financial condition, results of operations, trends in lending policies, plans, objectives, future performance or business of the Company. Forward-looking statements are generally identifiable by the use of words such as “anticipate,” “believe,” “continue,” “could,” “designed,” “estimate,” “expect,” “intend,” “may,” “optimistic,” “pending,” “plan,” “position,” “preliminary,” “remain,” “should,” “will,” “would” or other similar expressions. Such statements are not a guarantee of future performance or results, are based on information available at the time the statements are made and are subject to certain risks and uncertainties including: the effects of the COVID-19 global pandemic and other adverse public health developments on the economy, our business and operations and the business and operations of our vendors and customers: general economic conditions, whether national or regional, and conditions in the lending markets in which we participate that may have an adverse effect on the demand for our loans and other products; our credit quality and related levels of nonperforming assets and loan losses, and the value and salability of the real estate that we own or that is the collateral for our loans; failures or breaches of or interruptions in the communications and information systems on which we rely to conduct our business; failure of our plans to grow our commercial real estate, commercial and industrial, public finance and SBA loan portfolios; competition with national, regional and community financial institutions; the loss of any key members of senior management; fluctuations in interest rates; general economic conditions; risks relating to the regulation of financial institutions; and other factors identified in reports we file with the U.S. Securities and Exchange Commission. All statements in this presentation, including forward-looking statements, speak only as of the date they are made, and the Company undertakes no obligation to update any statement in light of new information or future events. This presentation contains financial information determined by methods other than in accordance with U.S. generally accepted accounting principles (“GAAP”). Non-GAAP financial measures, specifically adjusted revenue, adjusted net income, adjusted diluted earnings per share, average tangible common equity, adjusted return on average assets, return on average tangible common equity, adjusted return on average tangible common equity, tangible common equity, tangible assets, tangible book value per common share, tangible common equity to tangible assets, net interest income – FTE, net interest margin – FTE, allowance for loan losses to loans, excluding PPP loans, adjusted noninterest income, adjusted noninterest expense, adjusted noninterest expense to average assets, adjusted income before income taxes, adjusted income tax provision (benefit), and adjusted effective income tax rate are used by the Company’s management to measure the strength of its capital and analyze profitability, including its ability to generate earnings on tangible capital invested by its shareholders. Although management believes these non-GAAP measures are useful to investors by providing a greater understanding of its business, they should not be considered a substitute for financial measures determined in accordance with GAAP, nor are they necessarily comparable to non-GAAP performance measures that may be presented by other companies. Reconciliations of these non-GAAP financial measures to the most directly comparable GAAP financial measures are included in the table at the end of this presentation under the caption “Reconciliation of Non-GAAP Financial Measures.” 2
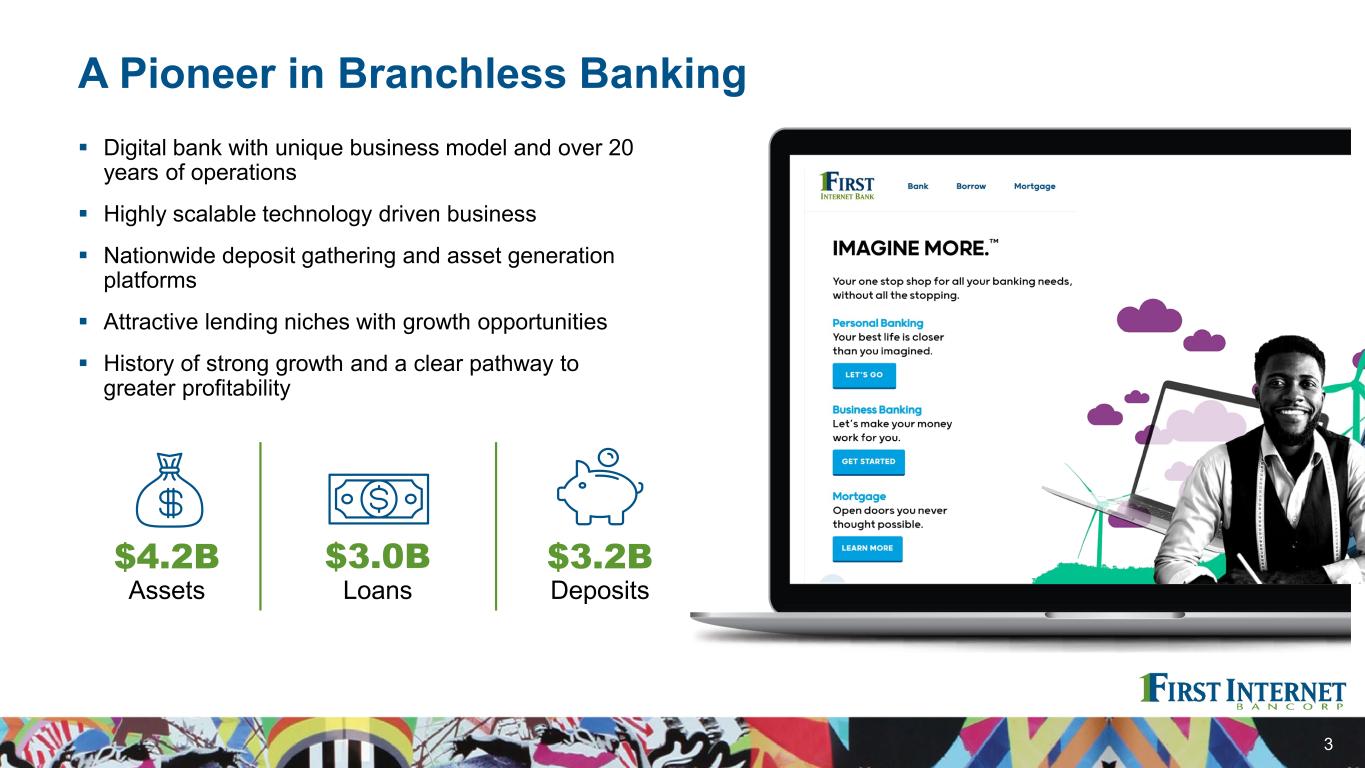
A Pioneer in Branchless Banking Digital bank with unique business model and over 20 years of operations Highly scalable technology driven business Nationwide deposit gathering and asset generation platforms Attractive lending niches with growth opportunities History of strong growth and a clear pathway to greater profitability 3 $4.2B Assets $3.0B Loans $3.2B Deposits
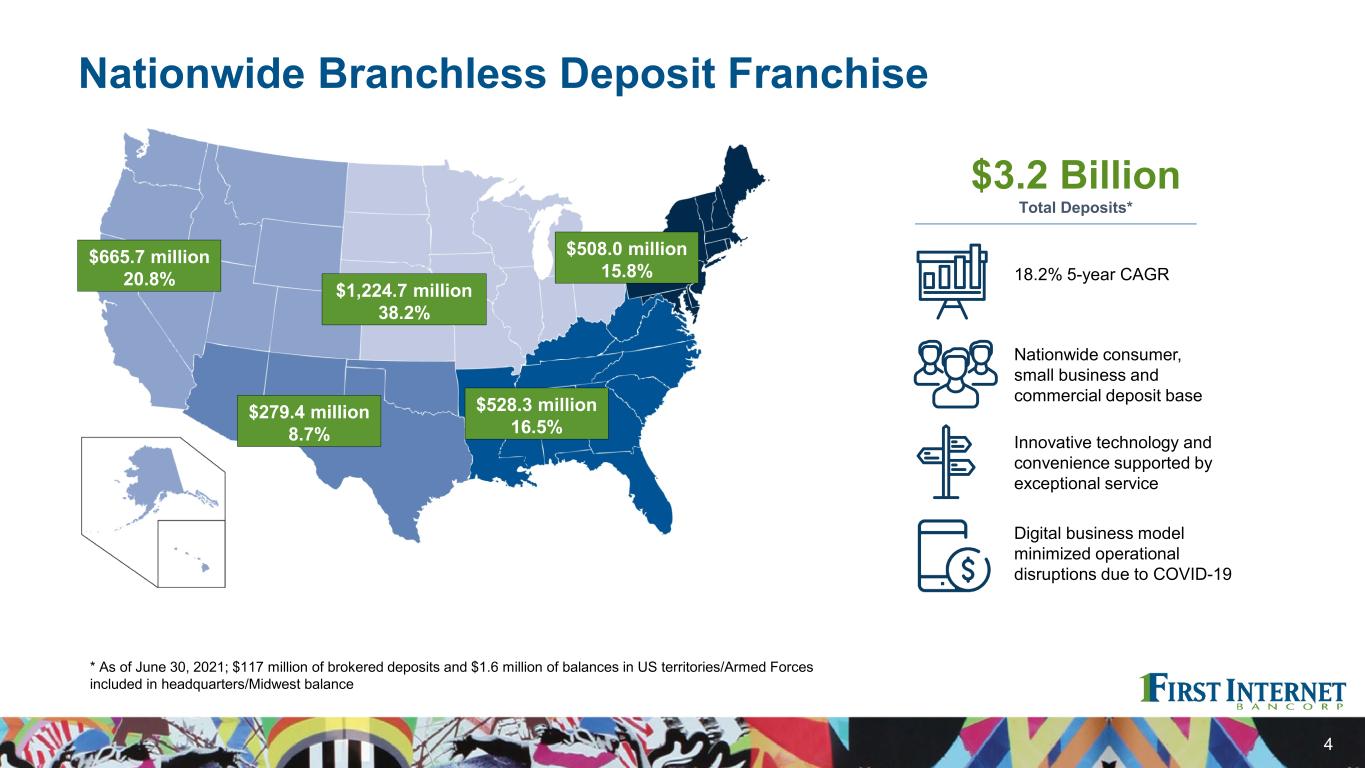
Nationwide Branchless Deposit Franchise 4 $665.7 million 20.8% $279.4 million 8.7% $1,224.7 million 38.2% $528.3 million 16.5% $508.0 million 15.8% * As of June 30, 2021; $117 million of brokered deposits and $1.6 million of balances in US territories/Armed Forces included in headquarters/Midwest balance $3.2 Billion Total Deposits* 18.2% 5-year CAGR Nationwide consumer, small business and commercial deposit base Innovative technology and convenience supported by exceptional service Digital business model minimized operational disruptions due to COVID-19
Multiple Opportunities to Grow Deposits 5 Capitalize on the enduring trend toward branchless banking – consumers and small businesses are increasingly moving their banking business online, especially following the experience of COVID-19 Generate an increased level of lower-cost deposits as expansion of small-business, municipal and commercial relationships continue Selectively target consumer deposits in tech-centric markets – building off success with Gen-Xers Draw on over 20 years of branchless banking experience to attract more customers with best practices such as dedicated online relationship bankers delivering a superior client experience

National and Regional Asset Generation Platform Consumer — National Commercial — Regional Commercial — National Diversified Asset Generation Platform Digital direct-to-consumer mortgages Specialty lending – horse trailers and RVs Single tenant lease financing Public finance Small business lending C&I – Central Indiana C&I – Arizona Investor CRE – Central Indiana Construction – Central Indiana

Entrepreneurial Culture Key to Success First Internet Bank has been recognized for its innovation and is consistently ranked among the best banks to work for, enhancing its ability to attract and retain top talent American Banker’s “Best Banks to Work For” Eight years in a row “Top Workplaces in Central Indiana” – The Indianapolis Star Eight years in a row including being #3 in 2021, #8 in 2020, #1 in 2019, #4 in 2018 and #2 on the list in 2017 “Best Places to Work in Indiana” Five time finalist “Best Small Business Checking Account” – Newsweek ranking of “America’s Best Banks 2021” “Best Online Banks 2021” – Bankrate and GoBanking Rates annual “Best Banking” awards Top Rated Online Business Bank in 2017 – Advisory HQ TechPoint 2016 Mira Award “Tech-enabled Company of the Year” Magnify Money ranked #1 amongst 2016 Best Banking Apps (Banker’s “Online Direct Banks”)
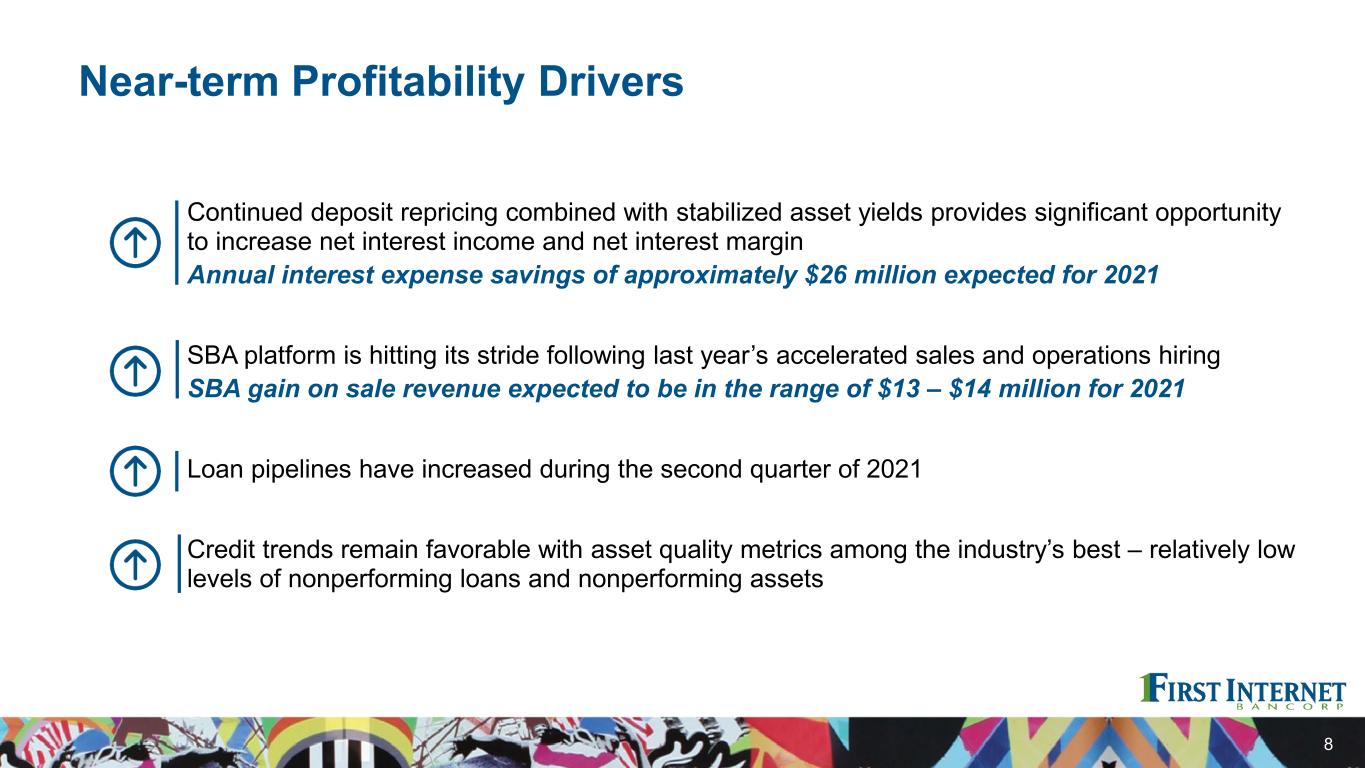
Near-term Profitability Drivers Continued deposit repricing combined with stabilized asset yields provides significant opportunity to increase net interest income and net interest margin Annual interest expense savings of approximately $26 million expected for 2021 SBA platform is hitting its stride following last year’s accelerated sales and operations hiring SBA gain on sale revenue expected to be in the range of $13 – $14 million for 2021 Loan pipelines have increased during the second quarter of 2021 Credit trends remain favorable with asset quality metrics among the industry’s best – relatively low levels of nonperforming loans and nonperforming assets 8

Second Quarter 2021 Highlights 9 1 See Reconciliation of Non-GAAP Financial Measures in the Appendix Loans and Deposits Total portfolio loan balances declined 3.3% from 1Q21 C&I and investor CRE increased while healthcare finance, single tenant lease financing and public finance experienced net payoffs Non-time deposit balances increased 3.7% from 1Q21 while CDs were down 7.4% Profitability and Capital ROAA of 1.25% and ROATCE of 15.09%1 Adjusted ROAA of 1.06%1 and adjusted ROATCE of 12.79%1 Tangible common equity / tangible assets increased 31 bps from 1Q21 to 8.43%1 Regulatory capital ratios increased from 1Q21 and remain strong Key Operating Trends Cost of interest-bearing deposits declined 13 bps from 1Q21 to 0.99% FTE net interest margin increased 7 bps from 1Q21 to 2.25%1 SBA loan sales contributed $3.0 million of fee revenue Asset quality improved with NPAs to total assets of 0.25% Earnings Diluted EPS of $1.31; adjusted diluted EPS of $1.11, up 178% from 2Q201 Net income of $13.1 million; adjusted net income of $11.1 million, up 182% from 2Q201 Total revenue of $30.6 million; adjusted revenue of $28.0 million, up 45% from 2Q201
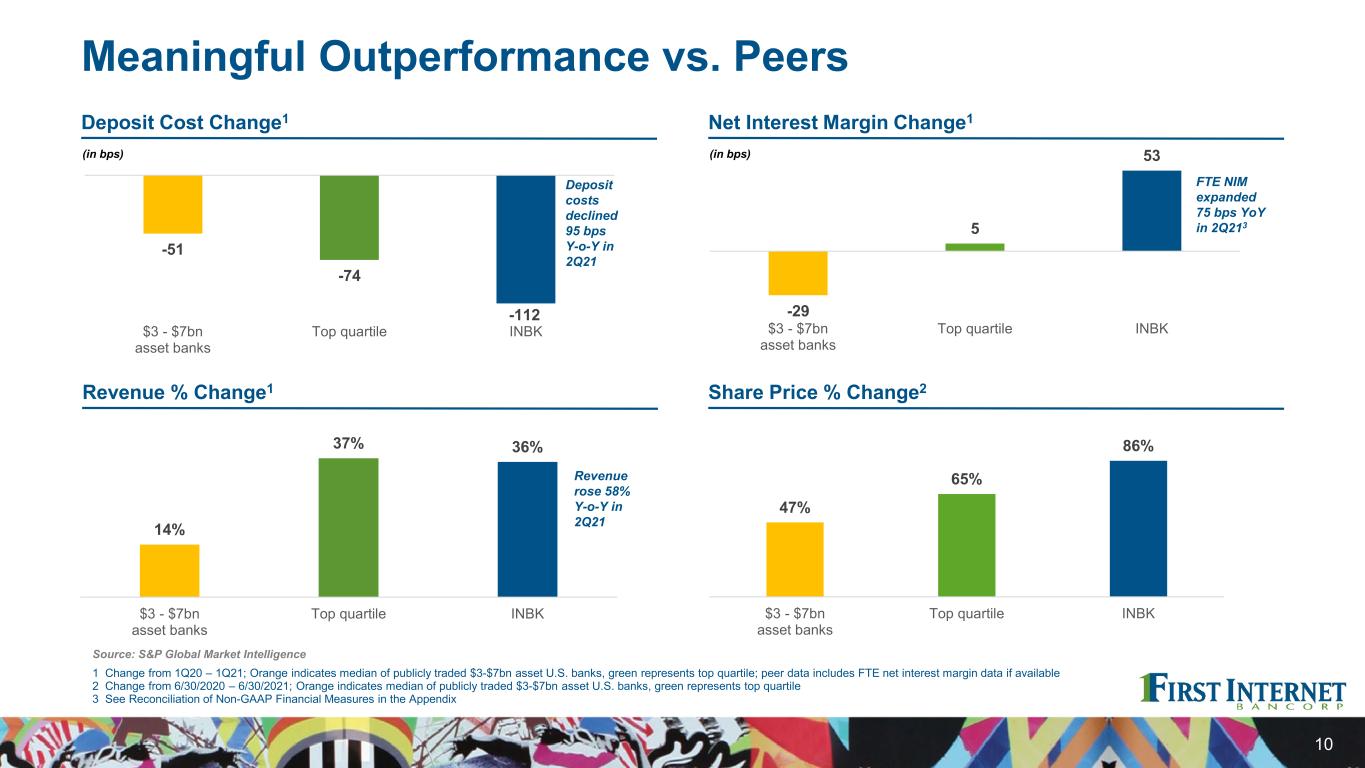
Meaningful Outperformance vs. Peers 10 1 Change from 1Q20 – 1Q21; Orange indicates median of publicly traded $3-$7bn asset U.S. banks, green represents top quartile; peer data includes FTE net interest margin data if available 2 Change from 6/30/2020 – 6/30/2021; Orange indicates median of publicly traded $3-$7bn asset U.S. banks, green represents top quartile 3 See Reconciliation of Non-GAAP Financial Measures in the Appendix Net Interest Margin Change1 (in bps) Share Price % Change2 Deposit Cost Change1 (in bps) Revenue % Change1 14% 37% 36% $3 - $7bn asset banks Top quartile INBK -51 -74 -112 $3 - $7bn asset banks Top quartile INBK 47% 65% 86% $3 - $7bn asset banks Top quartile INBK -29 5 53 $3 - $7bn asset banks Top quartile INBK Deposit costs declined 95 bps Y-o-Y in 2Q21 FTE NIM expanded 75 bps YoY in 2Q213 Revenue rose 58% Y-o-Y in 2Q21 Source: S&P Global Market Intelligence
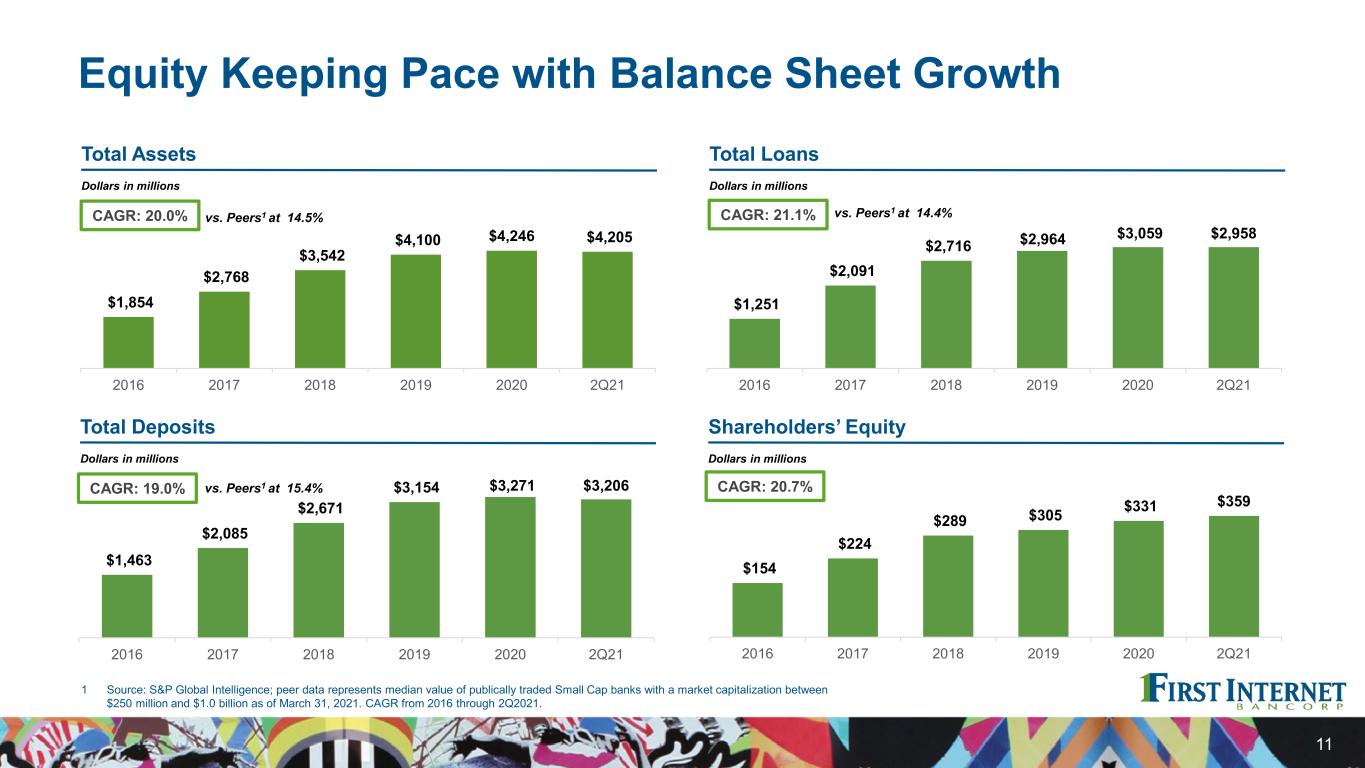
Equity Keeping Pace with Balance Sheet Growth 11 Dollars in millions Total Loans Dollars in millions Total Assets CAGR: 20.0% vs. Peers1 at 14.5% $1,854 $2,768 $3,542 $4,100 $4,246 $4,205 2016 2017 2018 2019 2020 2Q21 Dollars in millions Shareholders’ Equity Dollars in millions Total Deposits CAGR: 21.1% vs. Peers1 at 14.4% CAGR: 19.0% vs. Peers1 at 15.4% CAGR: 20.7% 1 Source: S&P Global Intelligence; peer data represents median value of publically traded Small Cap banks with a market capitalization between $250 million and $1.0 billion as of March 31, 2021. CAGR from 2016 through 2Q2021. $1,251 $2,091 $2,716 $2,964 $3,059 $2,958 2016 2017 2018 2019 2020 2Q21 $1,463 $2,085 $2,671 $3,154 $3,271 $3,206 2016 2017 2018 2019 2020 2Q21 $154 $224 $289 $305 $331 $359 2016 2017 2018 2019 2020 2Q21
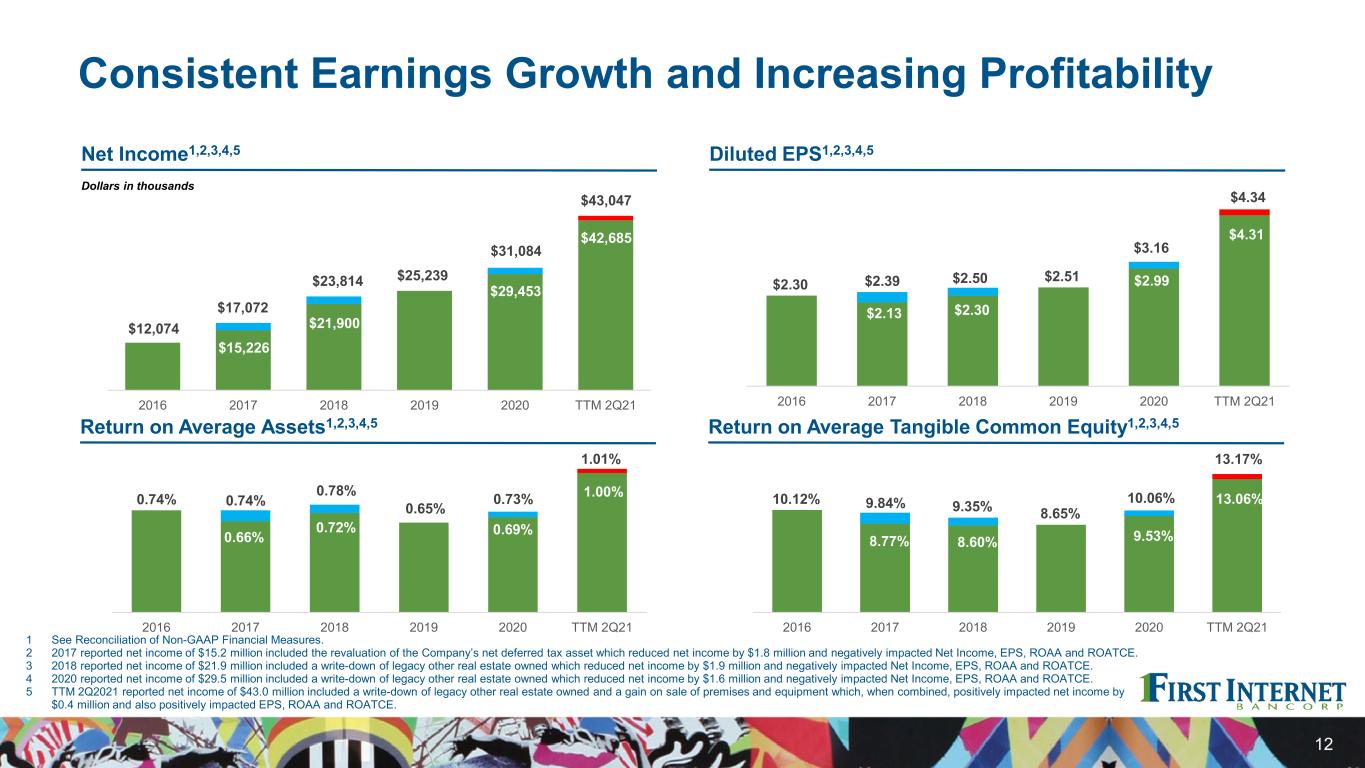
Consistent Earnings Growth and Increasing Profitability 12 1 See Reconciliation of Non-GAAP Financial Measures. 2 2017 reported net income of $15.2 million included the revaluation of the Company’s net deferred tax asset which reduced net income by $1.8 million and negatively impacted Net Income, EPS, ROAA and ROATCE. 3 2018 reported net income of $21.9 million included a write-down of legacy other real estate owned which reduced net income by $1.9 million and negatively impacted Net Income, EPS, ROAA and ROATCE. 4 2020 reported net income of $29.5 million included a write-down of legacy other real estate owned which reduced net income by $1.6 million and negatively impacted Net Income, EPS, ROAA and ROATCE. 5 TTM 2Q2021 reported net income of $43.0 million included a write-down of legacy other real estate owned and a gain on sale of premises and equipment which, when combined, positively impacted net income by $0.4 million and also positively impacted EPS, ROAA and ROATCE. Diluted EPS1,2,3,4,5 Dollars in thousands Net Income1,2,3,4,5 Return on Average Tangible Common Equity1,2,3,4,5Return on Average Assets1,2,3,4,5 $15,226 $21,900 $29,453 $43,047 $12,074 $17,072 $23,814 $25,239 $31,084 $42,685 2016 2017 2018 2019 2020 TTM 2Q21 $2.13 $2.30 $2.99 $4.34 $2.30 $2.39 $2.50 $2.51 $3.16 $4.31 2016 2017 2018 2019 2020 TTM 2Q21 0.66% 0.72% 0.69% 0.74% 0.74% 0.78% 0.65% 0.73% 1.00% 2016 2017 2018 2019 2020 TTM 2Q21 1.01% 8.77% 8.60% 9.53% 10.12% 9.84% 9.35% 8.65% 10.06% 13.17% 2016 2017 2018 2019 2020 TTM 2Q21 13.06%
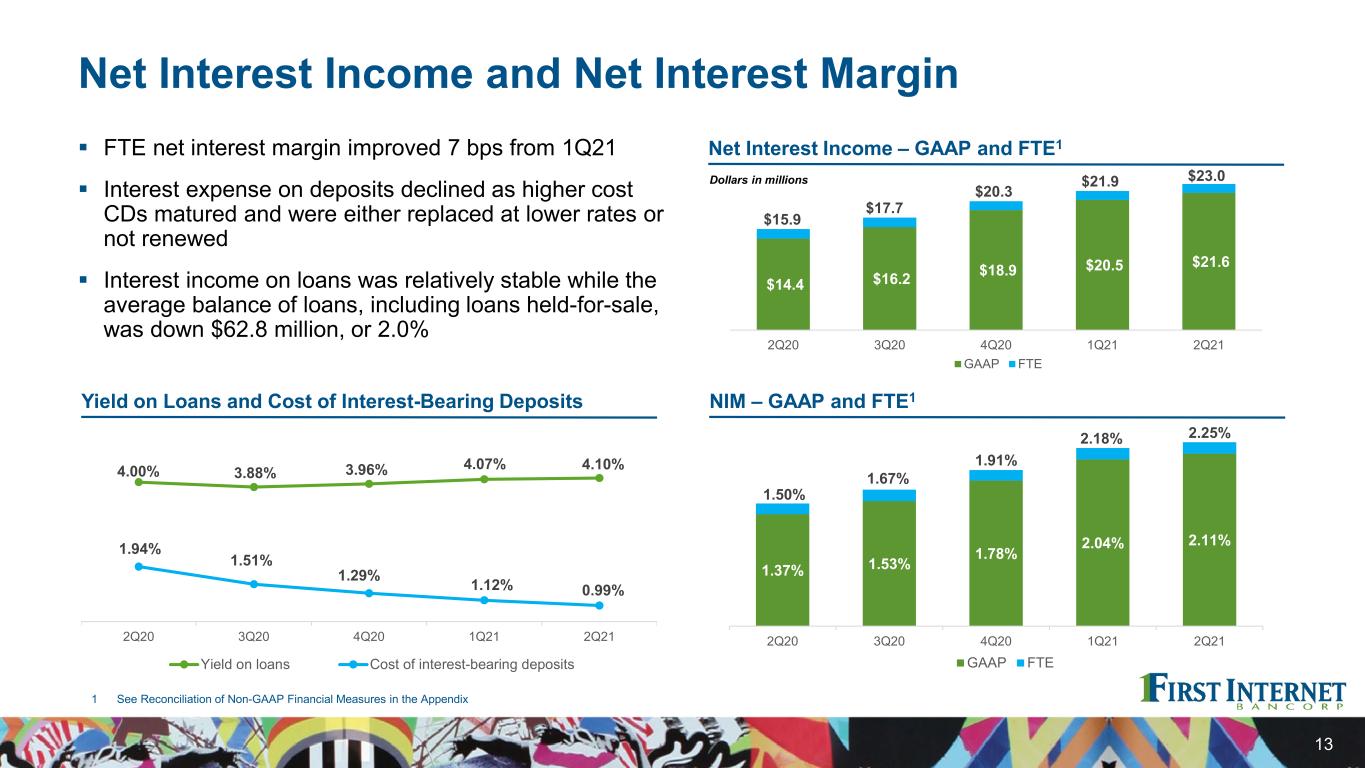
Net Interest Income and Net Interest Margin FTE net interest margin improved 7 bps from 1Q21 Interest expense on deposits declined as higher cost CDs matured and were either replaced at lower rates or not renewed Interest income on loans was relatively stable while the average balance of loans, including loans held-for-sale, was down $62.8 million, or 2.0% 13 1 See Reconciliation of Non-GAAP Financial Measures in the Appendix Yield on Loans and Cost of Interest-Bearing Deposits NIM – GAAP and FTE1 4.00% 3.88% 3.96% 4.07% 4.10% 1.94% 1.51% 1.29% 1.12% 0.99% 2Q20 3Q20 4Q20 1Q21 2Q21 Yield on loans Cost of interest-bearing deposits $14.4 $16.2 $18.9 $20.5 $21.6 $15.9 $17.7 $20.3 $21.9 $23.0 2Q20 3Q20 4Q20 1Q21 2Q21 GAAP FTE 1.37% 1.53% 1.78% 2.04% 2.11% 1.50% 1.67% 1.91% 2.18% 2.25% 2Q20 3Q20 4Q20 1Q21 2Q21 GAAP FTE Net Interest Income – GAAP and FTE1 Dollars in millions
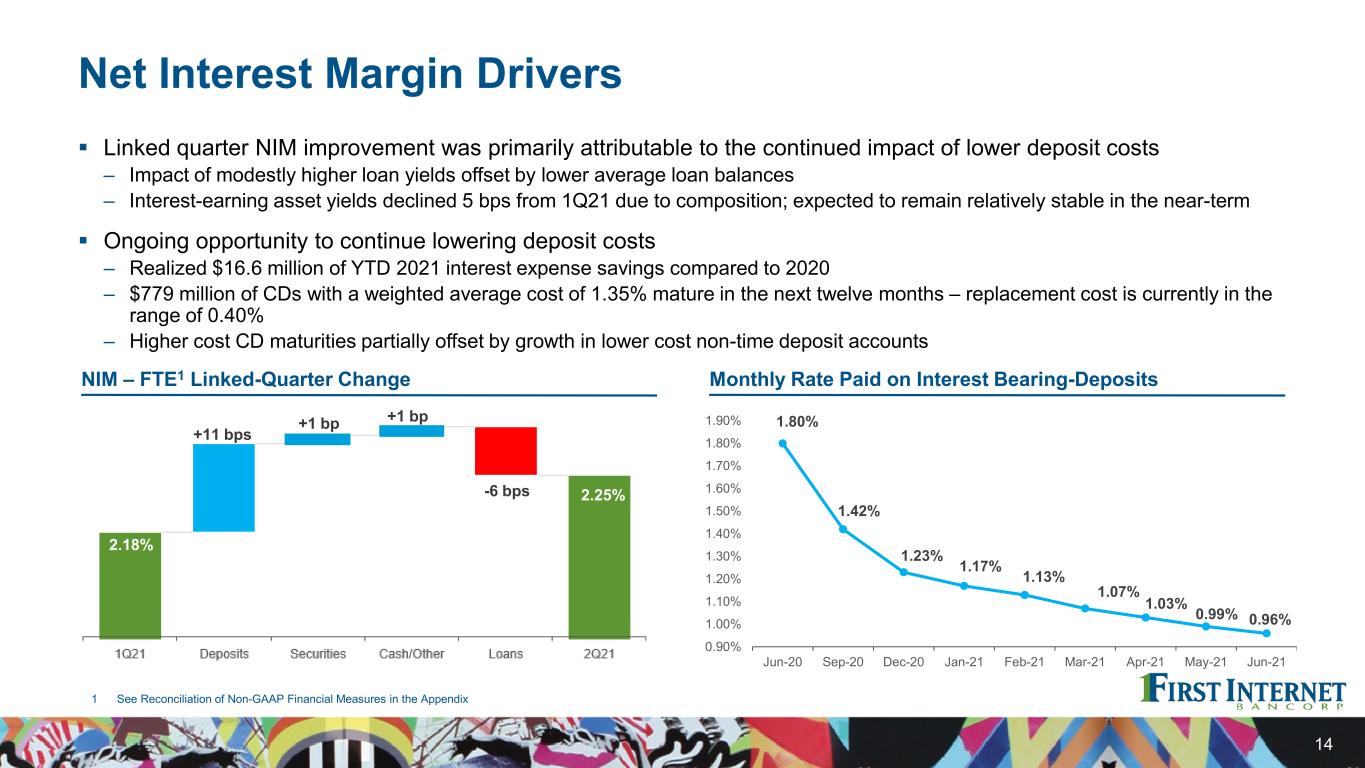
Net Interest Margin Drivers Linked quarter NIM improvement was primarily attributable to the continued impact of lower deposit costs – Impact of modestly higher loan yields offset by lower average loan balances – Interest-earning asset yields declined 5 bps from 1Q21 due to composition; expected to remain relatively stable in the near-term Ongoing opportunity to continue lowering deposit costs – Realized $16.6 million of YTD 2021 interest expense savings compared to 2020 – $779 million of CDs with a weighted average cost of 1.35% mature in the next twelve months – replacement cost is currently in the range of 0.40% – Higher cost CD maturities partially offset by growth in lower cost non-time deposit accounts 14 1 See Reconciliation of Non-GAAP Financial Measures in the Appendix NIM – FTE1 Linked-Quarter Change Monthly Rate Paid on Interest Bearing-Deposits 1.80% 1.42% 1.23% 1.17% 1.13% 1.07% 1.03% 0.99% 0.96% 0.90% 1.00% 1.10% 1.20% 1.30% 1.40% 1.50% 1.60% 1.70% 1.80% 1.90% Jun-20 Sep-20 Dec-20 Jan-21 Feb-21 Mar-21 Apr-21 May-21 Jun-21 2.18% 2.25% +11 bps -6 bps +1 bp +1 bp
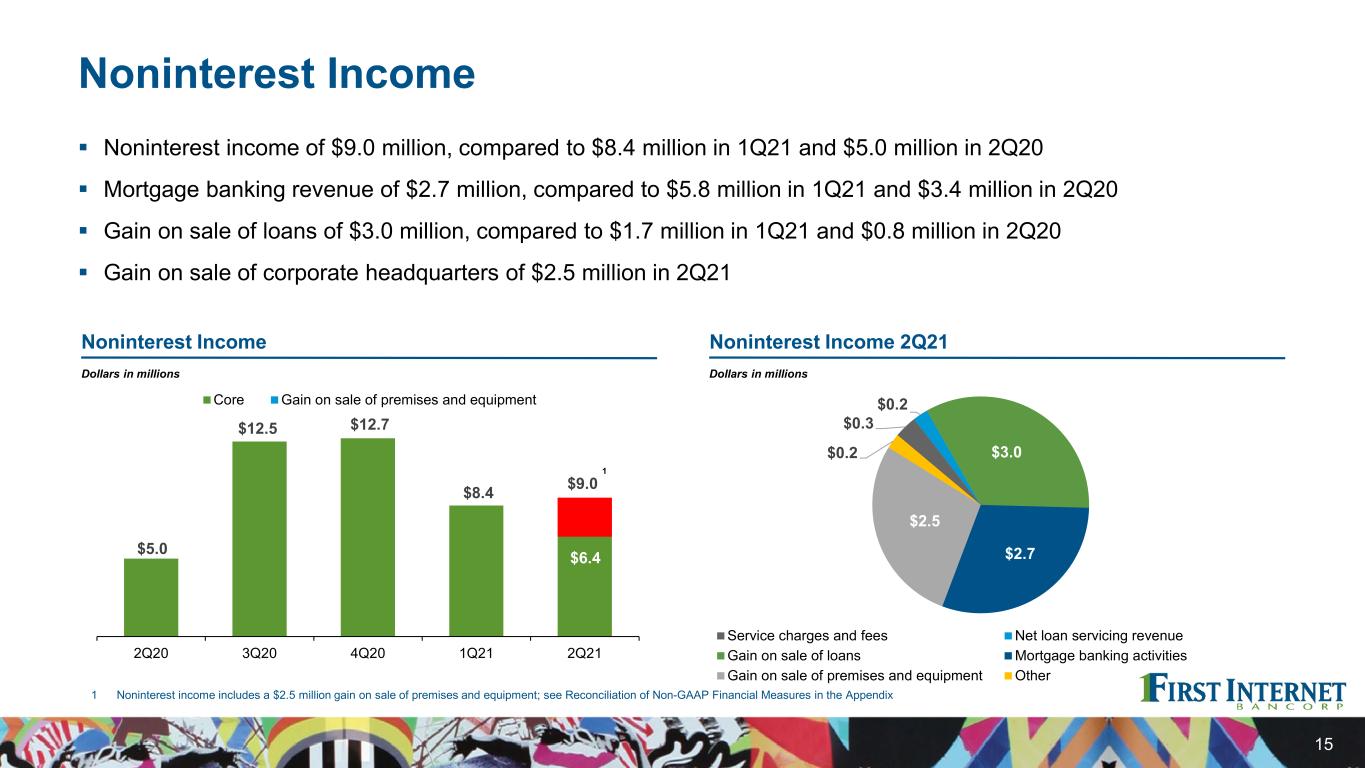
Noninterest Income Noninterest income of $9.0 million, compared to $8.4 million in 1Q21 and $5.0 million in 2Q20 Mortgage banking revenue of $2.7 million, compared to $5.8 million in 1Q21 and $3.4 million in 2Q20 Gain on sale of loans of $3.0 million, compared to $1.7 million in 1Q21 and $0.8 million in 2Q20 Gain on sale of corporate headquarters of $2.5 million in 2Q21 15 $0.3 $0.2 $3.0 $2.7 $2.5 $0.2 Service charges and fees Net loan servicing revenue Gain on sale of loans Mortgage banking activities Gain on sale of premises and equipment Other Dollars in millions Noninterest Income 2Q21 Dollars in millions Noninterest Income 1 Noninterest income includes a $2.5 million gain on sale of premises and equipment; see Reconciliation of Non-GAAP Financial Measures in the Appendix $5.0 $12.5 $12.7 $8.4 $6.4 $9.0 2Q20 3Q20 4Q20 1Q21 2Q21 Core Gain on sale of premises and equipment 1

Noninterest Expense Noninterest expense of $15.1 million, compared to $15.3 million in 1Q21 and $13.2 million in 2Q20 – Decrease in salaries and employee benefits from 1Q21 due mainly to lower medical claims expense – Decrease in deposit insurance premium due to year-over-year decline in total assets – Higher marketing expense due to increase in mortgage lead costs and sponsorships Noninterest expense / average assets remains well below the industry average 16 $13.2 $14.3 $14.5 $15.3 $15.1 $16.4 2Q20 3Q20 4Q20 1Q21 2Q21 Core OREO write-down 1.22% 1.33% 1.34% 1.49% 1.44%1.52% 2Q20 3Q20 4Q20 1Q21 2Q21 Core OREO write-down 1 1 Noninterest expense includes the $2.1 million write-down of other real estate owned; see Reconciliation of Non-GAAP Financial Measures in the Appendix Dollars in millions Noninterest Expense Noninterest Expense / Average Assets 1
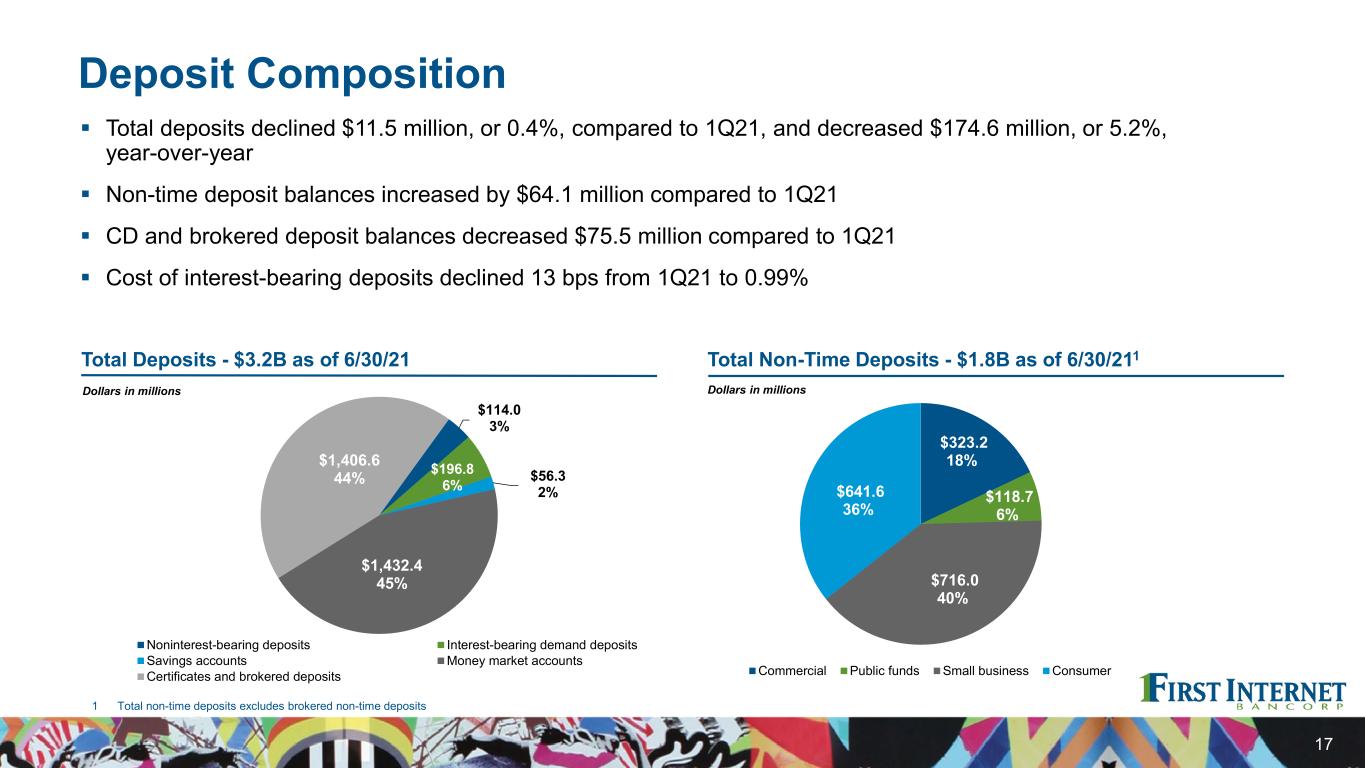
Deposit Composition Total deposits declined $11.5 million, or 0.4%, compared to 1Q21, and decreased $174.6 million, or 5.2%, year-over-year Non-time deposit balances increased by $64.1 million compared to 1Q21 CD and brokered deposit balances decreased $75.5 million compared to 1Q21 Cost of interest-bearing deposits declined 13 bps from 1Q21 to 0.99% 17 Total Non-Time Deposits - $1.8B as of 6/30/211 $114.0 3% $196.8 6% $56.3 2% $1,432.4 45% $1,406.6 44% Noninterest-bearing deposits Interest-bearing demand deposits Savings accounts Money market accounts Certificates and brokered deposits $323.2 18% $118.7 6% $716.0 40% $641.6 36% Commercial Public funds Small business Consumer 1 Total non-time deposits excludes brokered non-time deposits Dollars in millions Total Deposits - $3.2B as of 6/30/21 Dollars in millions
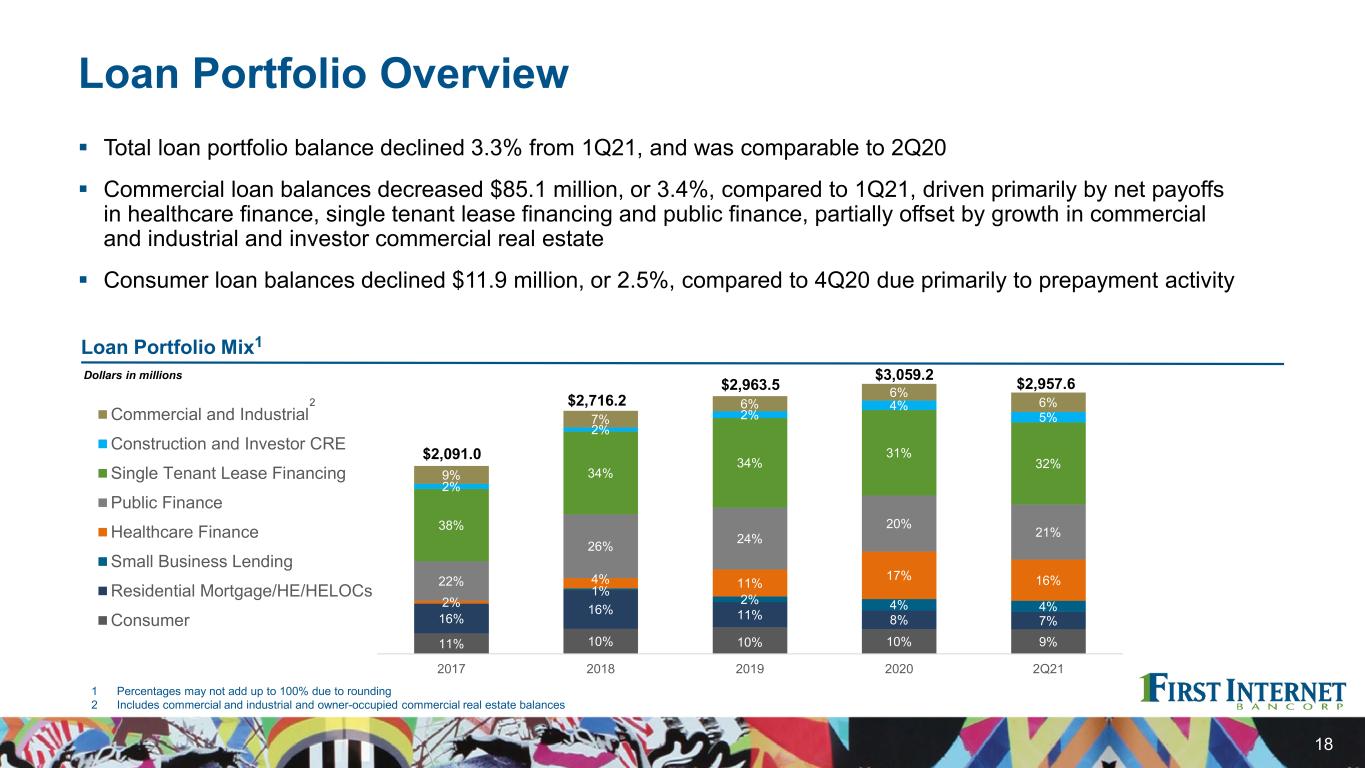
Loan Portfolio Overview Total loan portfolio balance declined 3.3% from 1Q21, and was comparable to 2Q20 Commercial loan balances decreased $85.1 million, or 3.4%, compared to 1Q21, driven primarily by net payoffs in healthcare finance, single tenant lease financing and public finance, partially offset by growth in commercial and industrial and investor commercial real estate Consumer loan balances declined $11.9 million, or 2.5%, compared to 4Q20 due primarily to prepayment activity 18 Loan Portfolio Mix1 1 Percentages may not add up to 100% due to rounding 2 Includes commercial and industrial and owner-occupied commercial real estate balances 11% 10% 10% 10% 9% 16% 16% 11% 8% 7% 1% 2% 4% 4%2% 4% 11% 17% 16%22% 26% 24% 20% 21%38% 34% 34% 31% 32% 2% 2% 2% 4% 5% 9% 7% 6% 6% 6% $2,091.0 $2,716.2 $2,963.5 $3,059.2 $2,957.6 2017 2018 2019 2020 2Q21 Commercial and Industrial Construction and Investor CRE Single Tenant Lease Financing Public Finance Healthcare Finance Small Business Lending Residential Mortgage/HE/HELOCs Consumer Dollars in millions 2
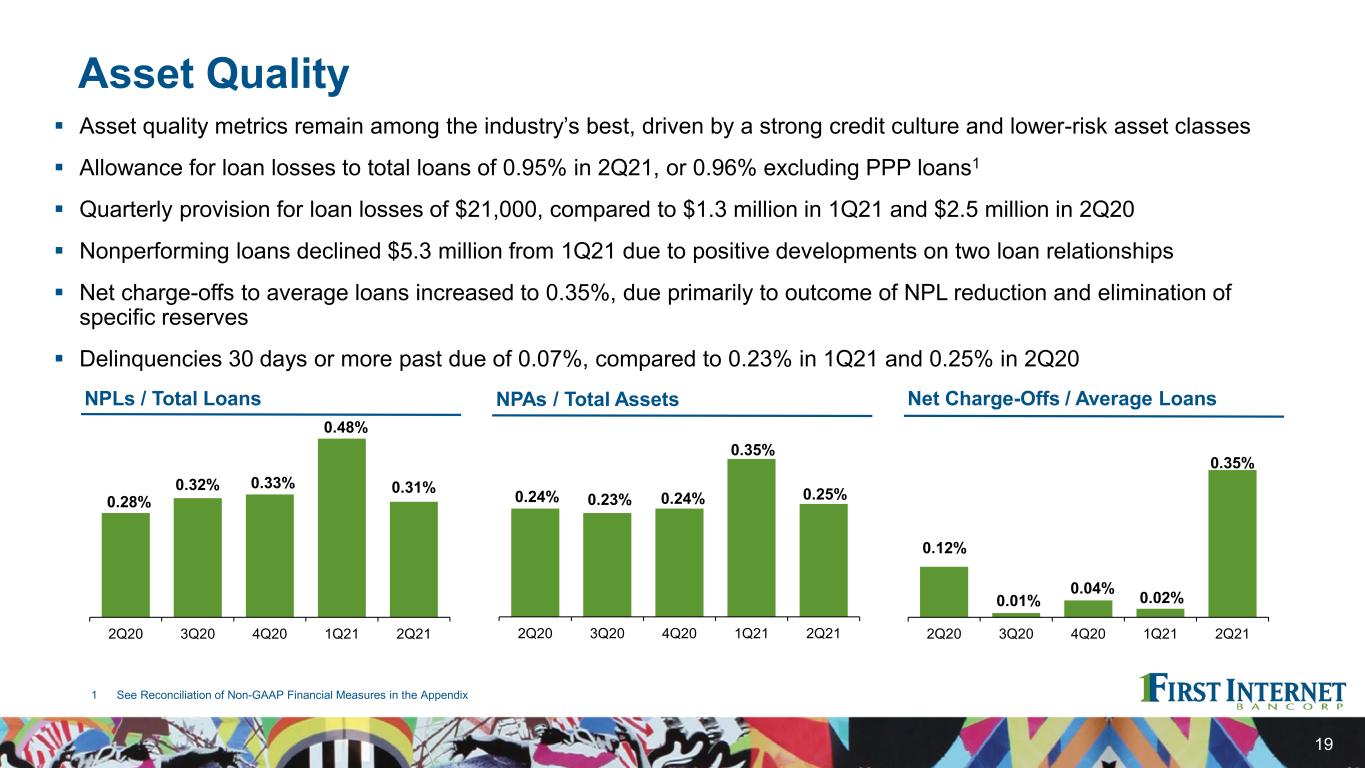
Asset Quality Asset quality metrics remain among the industry’s best, driven by a strong credit culture and lower-risk asset classes Allowance for loan losses to total loans of 0.95% in 2Q21, or 0.96% excluding PPP loans1 Quarterly provision for loan losses of $21,000, compared to $1.3 million in 1Q21 and $2.5 million in 2Q20 Nonperforming loans declined $5.3 million from 1Q21 due to positive developments on two loan relationships Net charge-offs to average loans increased to 0.35%, due primarily to outcome of NPL reduction and elimination of specific reserves Delinquencies 30 days or more past due of 0.07%, compared to 0.23% in 1Q21 and 0.25% in 2Q20 19 0.28% 0.32% 0.33% 0.48% 0.31% 2Q20 3Q20 4Q20 1Q21 2Q21 0.12% 0.01% 0.04% 0.02% 0.35% 2Q20 3Q20 4Q20 1Q21 2Q21 0.24% 0.23% 0.24% 0.35% 0.25% 2Q20 3Q20 4Q20 1Q21 2Q21 1 See Reconciliation of Non-GAAP Financial Measures in the Appendix NPLs / Total Loans NPAs / Total Assets Net Charge-Offs / Average Loans
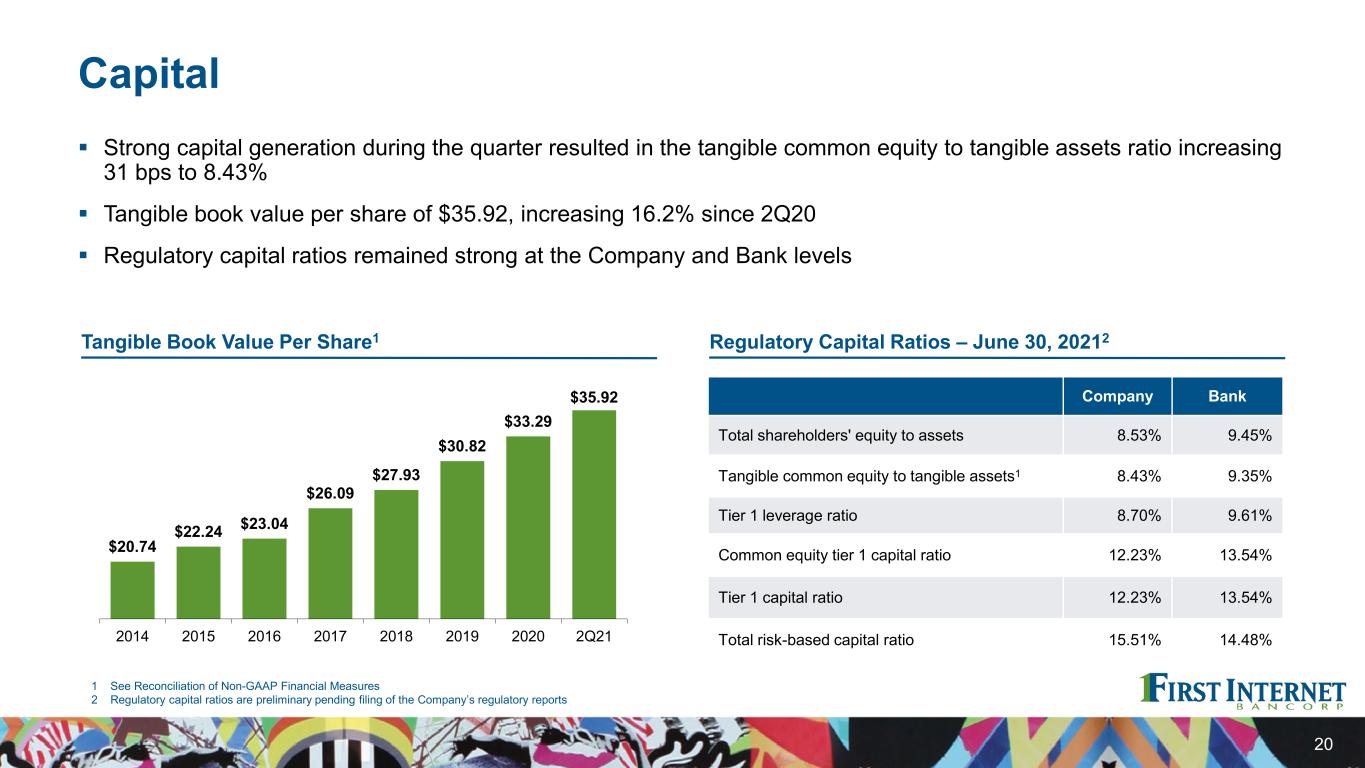
Capital Strong capital generation during the quarter resulted in the tangible common equity to tangible assets ratio increasing 31 bps to 8.43% Tangible book value per share of $35.92, increasing 16.2% since 2Q20 Regulatory capital ratios remained strong at the Company and Bank levels 20 1 See Reconciliation of Non-GAAP Financial Measures 2 Regulatory capital ratios are preliminary pending filing of the Company’s regulatory reports Company Bank Total shareholders' equity to assets 8.53% 9.45% Tangible common equity to tangible assets1 8.43% 9.35% Tier 1 leverage ratio 8.70% 9.61% Common equity tier 1 capital ratio 12.23% 13.54% Tier 1 capital ratio 12.23% 13.54% Total risk-based capital ratio 15.51% 14.48% $20.74 $22.24 $23.04 $26.09 $27.93 $30.82 $33.29 $35.92 2014 2015 2016 2017 2018 2019 2020 2Q21 Tangible Book Value Per Share1 Regulatory Capital Ratios – June 30, 20212
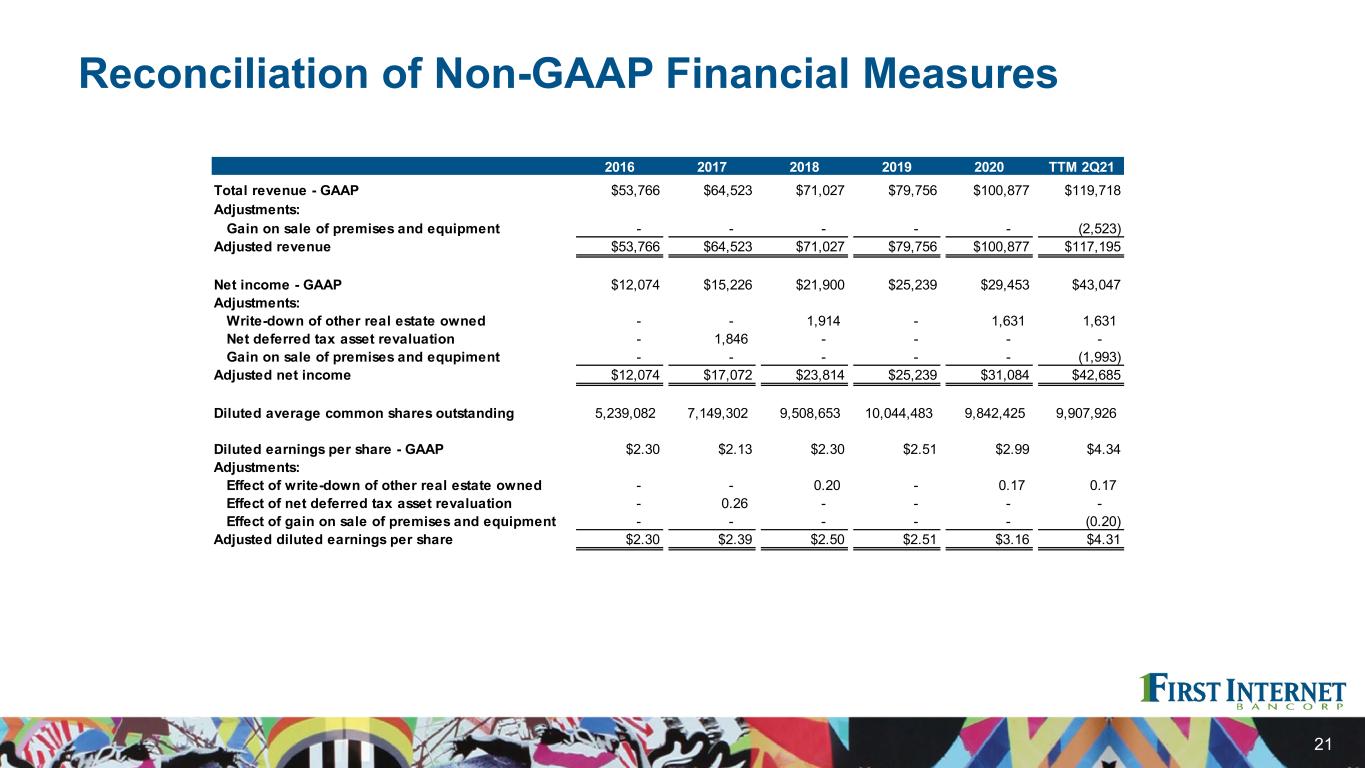
Reconciliation of Non-GAAP Financial Measures 21 2016 2017 2018 2019 2020 TTM 2Q21 Total revenue - GAAP $53,766 $64,523 $71,027 $79,756 $100,877 $119,718 Adjustments: Gain on sale of premises and equipment - - - - - (2,523) Adjusted revenue $53,766 $64,523 $71,027 $79,756 $100,877 $117,195 Net income - GAAP $12,074 $15,226 $21,900 $25,239 $29,453 $43,047 Adjustments: Write-down of other real estate owned - - 1,914 - 1,631 1,631 Net deferred tax asset revaluation - 1,846 - - - - Gain on sale of premises and equpiment - - - - - (1,993) Adjusted net income $12,074 $17,072 $23,814 $25,239 $31,084 $42,685 Diluted average common shares outstanding 5,239,082 7,149,302 9,508,653 10,044,483 9,842,425 9,907,926 Diluted earnings per share - GAAP $2.30 $2.13 $2.30 $2.51 $2.99 $4.34 Adjustments: Effect of write-down of other real estate owned - - 0.20 - 0.17 0.17 Effect of net deferred tax asset revaluation - 0.26 - - - - Effect of gain on sale of premises and equipment - - - - - (0.20) Adjusted diluted earnings per share $2.30 $2.39 $2.50 $2.51 $3.16 $4.31
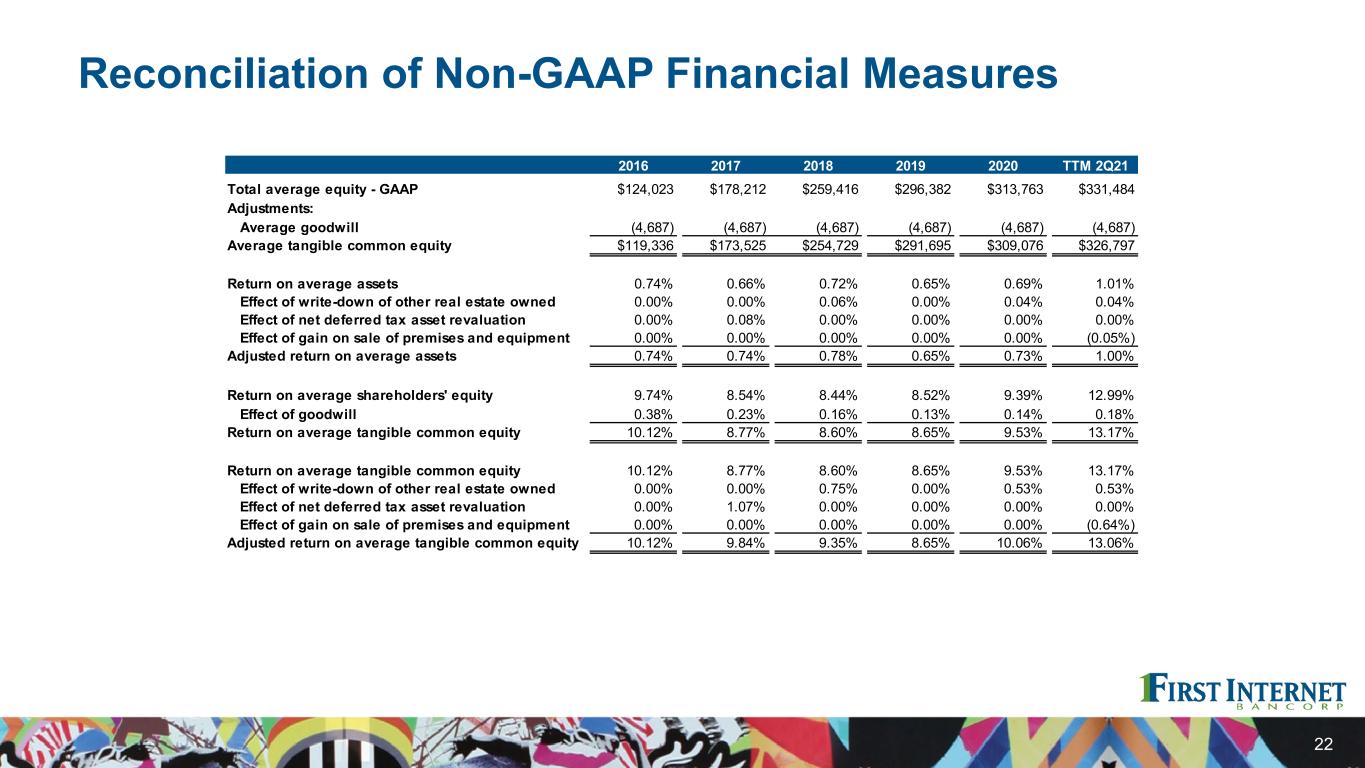
Reconciliation of Non-GAAP Financial Measures 22 2016 2017 2018 2019 2020 TTM 2Q21 Total average equity - GAAP $124,023 $178,212 $259,416 $296,382 $313,763 $331,484 Adjustments: Average goodwill (4,687) (4,687) (4,687) (4,687) (4,687) (4,687) Average tangible common equity $119,336 $173,525 $254,729 $291,695 $309,076 $326,797 Return on average assets 0.74% 0.66% 0.72% 0.65% 0.69% 1.01% Effect of write-down of other real estate owned 0.00% 0.00% 0.06% 0.00% 0.04% 0.04% Effect of net deferred tax asset revaluation 0.00% 0.08% 0.00% 0.00% 0.00% 0.00% Effect of gain on sale of premises and equipment 0.00% 0.00% 0.00% 0.00% 0.00% (0.05%) Adjusted return on average assets 0.74% 0.74% 0.78% 0.65% 0.73% 1.00% Return on average shareholders' equity 9.74% 8.54% 8.44% 8.52% 9.39% 12.99% Effect of goodwill 0.38% 0.23% 0.16% 0.13% 0.14% 0.18% Return on average tangible common equity 10.12% 8.77% 8.60% 8.65% 9.53% 13.17% Return on average tangible common equity 10.12% 8.77% 8.60% 8.65% 9.53% 13.17% Effect of write-down of other real estate owned 0.00% 0.00% 0.75% 0.00% 0.53% 0.53% Effect of net deferred tax asset revaluation 0.00% 1.07% 0.00% 0.00% 0.00% 0.00% Effect of gain on sale of premises and equipment 0.00% 0.00% 0.00% 0.00% 0.00% (0.64%) Adjusted return on average tangible common equity 10.12% 9.84% 9.35% 8.65% 10.06% 13.06%

Reconciliation of Non-GAAP Financial Measures 23 Dollars in thousands 2016 2017 2018 2019 2020 2Q21 Total equity - GAAP $153,942 $224,127 $288,735 $304,913 $330,944 $344,566 Adjustments: Goodwill (4,687) (4,687) (4,687) (4,687) (4,687) (4,687) Tangible common equity $149,255 $219,440 $284,048 $300,226 $326,257 $339,879 Common shares outstanding 6,478,050 8,411,077 10,170,778 9,741,800 9,800,569 9,823,831 Book value per common share $23.76 $26.65 $28.39 $31.30 $33.77 $35.07 Effect of goodwill (0.72) (0.56) (0.46) (0.48) (0.48) (0.47) Tangible book value per common share $23.04 $26.09 $27.93 $30.82 $33.29 $34.60
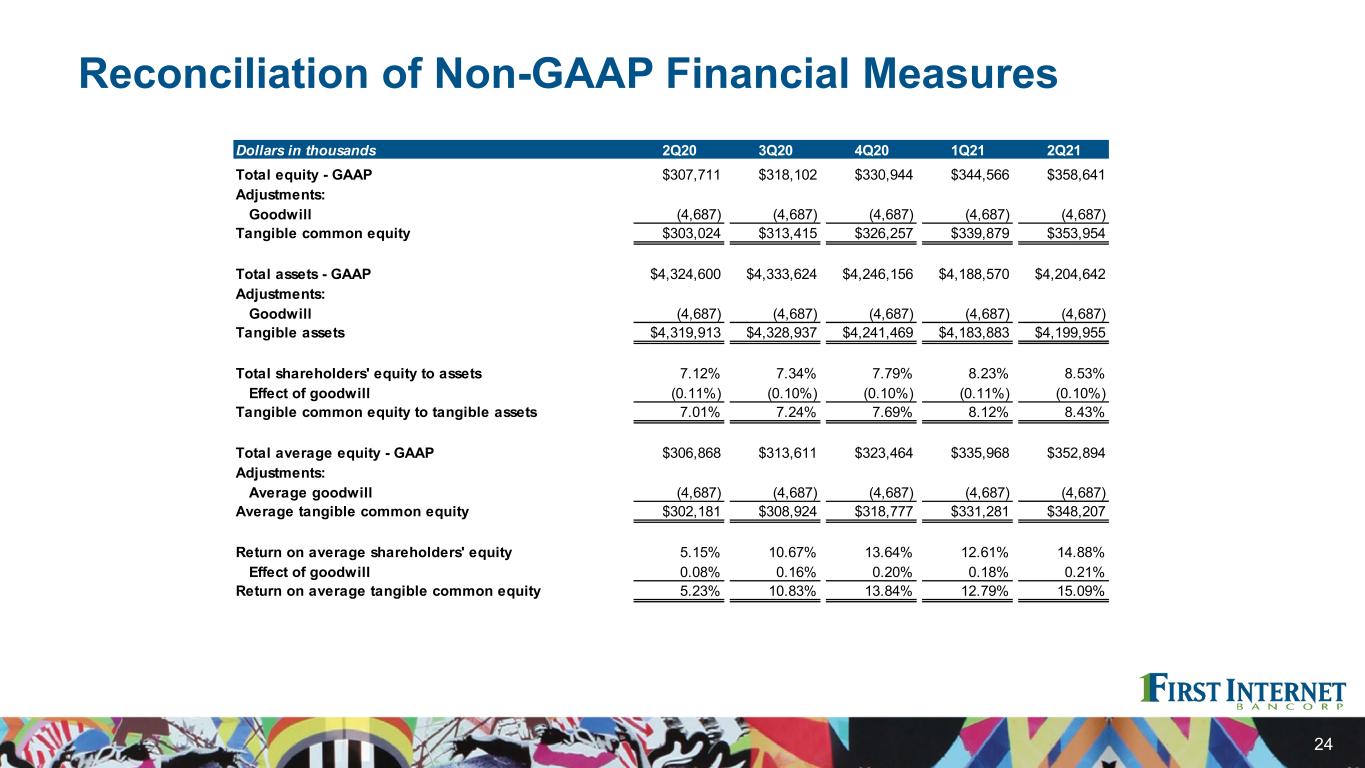
Reconciliation of Non-GAAP Financial Measures 24 Dollars in thousands 2Q20 3Q20 4Q20 1Q21 2Q21 Total equity - GAAP $307,711 $318,102 $330,944 $344,566 $358,641 Adjustments: Goodwill (4,687) (4,687) (4,687) (4,687) (4,687) Tangible common equity $303,024 $313,415 $326,257 $339,879 $353,954 Total assets - GAAP $4,324,600 $4,333,624 $4,246,156 $4,188,570 $4,204,642 Adjustments: Goodwill (4,687) (4,687) (4,687) (4,687) (4,687) Tangible assets $4,319,913 $4,328,937 $4,241,469 $4,183,883 $4,199,955 Total shareholders' equity to assets 7.12% 7.34% 7.79% 8.23% 8.53% Effect of goodwill (0.11%) (0.10%) (0.10%) (0.11%) (0.10%) Tangible common equity to tangible assets 7.01% 7.24% 7.69% 8.12% 8.43% Total average equity - GAAP $306,868 $313,611 $323,464 $335,968 $352,894 Adjustments: Average goodwill (4,687) (4,687) (4,687) (4,687) (4,687) Average tangible common equity $302,181 $308,924 $318,777 $331,281 $348,207 Return on average shareholders' equity 5.15% 10.67% 13.64% 12.61% 14.88% Effect of goodwill 0.08% 0.16% 0.20% 0.18% 0.21% Return on average tangible common equity 5.23% 10.83% 13.84% 12.79% 15.09%
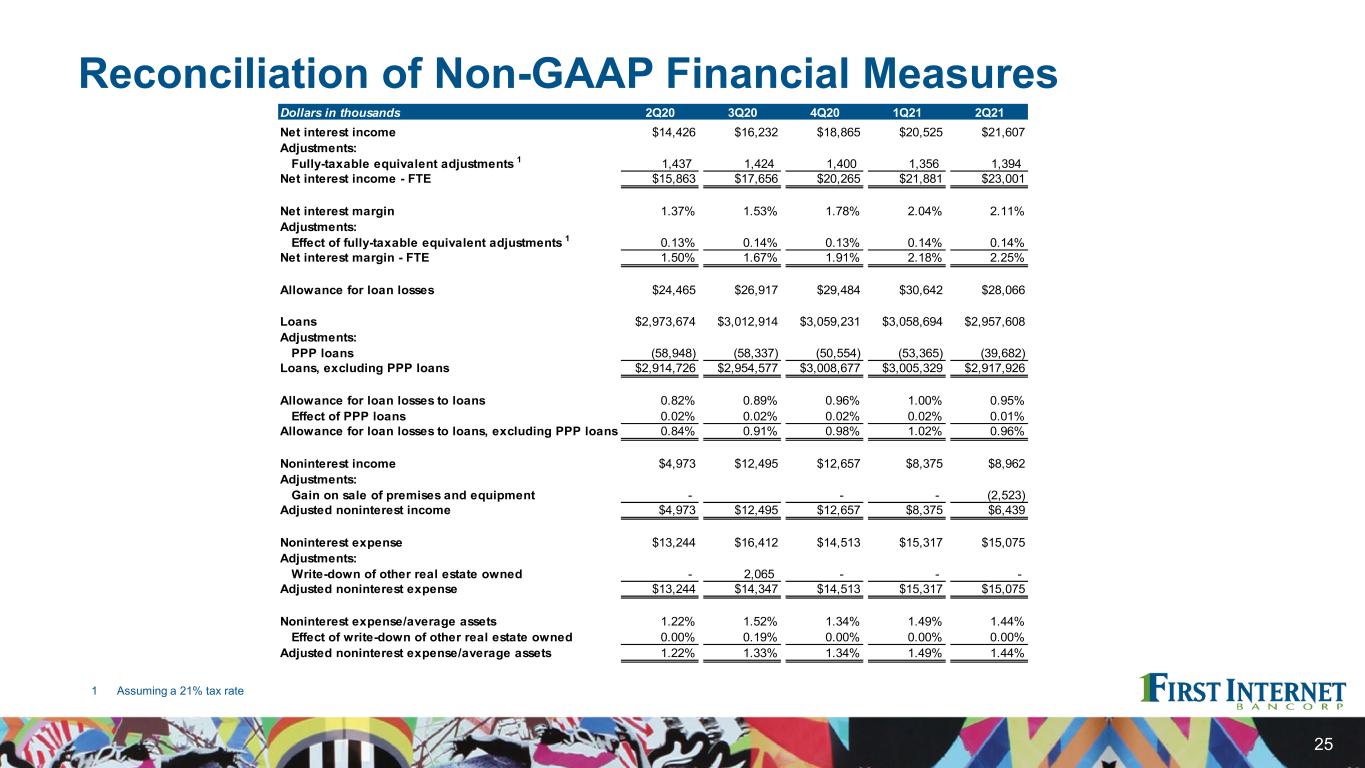
Reconciliation of Non-GAAP Financial Measures 25 1 Assuming a 21% tax rate Dollars in thousands 2Q20 3Q20 4Q20 1Q21 2Q21 Net interest income $14,426 $16,232 $18,865 $20,525 $21,607 Adjustments: Fully-taxable equivalent adjustments 1 1,437 1,424 1,400 1,356 1,394 Net interest income - FTE $15,863 $17,656 $20,265 $21,881 $23,001 Net interest margin 1.37% 1.53% 1.78% 2.04% 2.11% Adjustments: Effect of fully-taxable equivalent adjustments 1 0.13% 0.14% 0.13% 0.14% 0.14% Net interest margin - FTE 1.50% 1.67% 1.91% 2.18% 2.25% Allowance for loan losses $24,465 $26,917 $29,484 $30,642 $28,066 Loans $2,973,674 $3,012,914 $3,059,231 $3,058,694 $2,957,608 Adjustments: PPP loans (58,948) (58,337) (50,554) (53,365) (39,682) Loans, excluding PPP loans $2,914,726 $2,954,577 $3,008,677 $3,005,329 $2,917,926 Allowance for loan losses to loans 0.82% 0.89% 0.96% 1.00% 0.95% Effect of PPP loans 0.02% 0.02% 0.02% 0.02% 0.01% Allowance for loan losses to loans, excluding PPP loans 0.84% 0.91% 0.98% 1.02% 0.96% Noninterest income $4,973 $12,495 $12,657 $8,375 $8,962 Adjustments: Gain on sale of premises and equipment - - - (2,523) Adjusted noninterest income $4,973 $12,495 $12,657 $8,375 $6,439 Noninterest expense $13,244 $16,412 $14,513 $15,317 $15,075 Adjustments: Write-down of other real estate owned - 2,065 - - - Adjusted noninterest expense $13,244 $14,347 $14,513 $15,317 $15,075 Noninterest expense/average assets 1.22% 1.52% 1.34% 1.49% 1.44% Effect of write-down of other real estate owned 0.00% 0.19% 0.00% 0.00% 0.00% Adjusted noninterest expense/average assets 1.22% 1.33% 1.34% 1.49% 1.44%

Reconciliation of Non-GAAP Financial Measures 26 Dollars in thousands 2Q20 3Q20 4Q20 1Q21 2Q21 Total revenue - GAAP 19,399$ 28,727$ 31,522$ 28,900$ 30,569$ Adjustments: Gain on sale of premises and equipment - - - - (2,523) Adjusted revenue 19,399$ 28,727$ 31,522$ 28,900$ 28,046$ Income before income taxes - GAAP $3,664 $9,806 $14,145 $12,307 $15,473 Adjustments: Write-down of other real estate owned - 2,065 - - - Gain on sale of premises and equipment - - - - (2,523) Adjusted income before income taxes $3,664 $11,871 $14,145 $12,307 $12,950 Income tax provision (benefit) - GAAP (268)$ 1,395$ 3,055$ 1,857$ 2,377$ Adjustments: Write-down of other real estate owned - 434 - - - Gain on sale of premises and equipment - - - - (530) Adjusted income tax provision (benefit) (268)$ 1,829$ 3,055$ 1,857$ 1,847$ Net income - GAAP $3,932 $8,411 $11,090 $10,450 $13,096 Adjustments: Write-down of other real estate owned - 1,631 - - - Gain on sale of premises and equipment - - - - (1,993) Adjusted net income $3,932 $10,042 $11,090 $10,450 $11,103

Reconciliation of Non-GAAP Financial Measures 27 Dollars in thousands 2Q20 3Q20 4Q20 1Q21 2Q21 Diluted average common shares outstanding 9,768,227 9,773,224 9,914,022 9,963,036 9,881,422 Diluted earnings per share - GAAP 0.40$ 0.86$ 1.12$ 1.05$ 1.31$ Adjustments: Effect of write-down of other real estate owned - 0.17 - - - Effect of gain on sale of premises and equipment - - - - (0.20) Adjusted diluted earnings per share $0.40 $1.03 $1.12 $1.05 $1.11 Return on average assets 0.37% 0.78% 1.02% 1.02% 1.25% Effect of write-down of other real estate owned 0.00% 0.15% 0.00% 0.00% 0.00% Effect of gain on sale of premises and equipment 0.00% 0.00% 0.00% 0.00% (0.19%) Adjusted return on average assets 0.37% 0.93% 1.02% 1.02% 1.06% Return on average tangible common equity 5.23% 10.83% 13.84% 12.79% 15.09% Effect of write-down of other real estate owned 0.00% 2.10% 0.00% 0.00% 0.00% Effect of gain on sale of premises and equipment 0.00% 0.00% 0.00% 0.00% (2.30%) Adjusted return on average tangible common equity 5.23% 12.93% 13.84% 12.79% 12.79% Effective income tax rate (7.3%) 14.2% 21.6% 15.1% 15.4% Effect of write-down of other real estate owned 0.0% 1.2% 0.0% 0.0% 0.0% Effect of gain on sale of premises and equipment 0.0% 0.0% 0.0% 0.0% (1.1%) Adjusted effective income tax rate (7.3%) 15.4% 21.6% 15.1% 14.3%
