Attached files
| file | filename |
|---|---|
| EX-32.1 - EXHIBIT 32.1 - First Internet Bancorp | inbk-4q2019ex321.htm |
| EX-31.2 - EXHIBIT 31.2 - First Internet Bancorp | inbk-4q2019ex312.htm |
| EX-31.1 - EXHIBIT 31.1 - First Internet Bancorp | inbk-4q2019ex311.htm |
| EX-24.1 - EXHIBIT 24.1 - First Internet Bancorp | inbk-4q2019ex241.htm |
| EX-23.1 - EXHIBIT 23.1 - First Internet Bancorp | inbk-4q2019ex231.htm |
| EX-10.11 - EXHIBIT 10.11 - First Internet Bancorp | inbk-4q2019ex1011.htm |
| EX-10.10 - EXHIBIT 10.10 - First Internet Bancorp | inbk-4q2019ex1010.htm |
| EX-4.1 - EXHIBIT 4.1 - First Internet Bancorp | inbk-4q2019ex41.htm |
UNITED STATES
SECURITIES AND EXCHANGE COMMISSION
Washington, D.C. 20549
FORM 10-K
(Mark One) | |
þ | ANNUAL REPORT PURSUANT TO SECTION 13 OR 15(d) OF THE SECURITIES EXCHANGE ACT OF 1934 For the Fiscal Year Ended December 31, 2019. |
or | |
¨ | TRANSITION REPORT PURSUANT TO SECTION 13 OR 15(d) OF THE SECURITIES EXCHANGE ACT OF 1934 For the Transition Period From ________ to ________. |
Commission File Number 001-35750
First Internet Bancorp | ||
(Exact Name of Registrant as Specified in its Charter) | ||
Indiana | 20-3489991 | |
(State or other jurisdiction of | (I.R.S. Employer | |
incorporation or organization) | Identification No.) | |
11201 USA Parkway | ||
Fishers, Indiana | 46037 | |
(Address of principal executive offices) | (Zip Code) | |
(317) 532-7900 |
(Registrant’s telephone number, including area code) |
Securities registered pursuant to Section 12(b) of the Act:
Title of each class | Trading Symbols | Name of exchange on which registered | ||
Common stock, without par value | INBK | The Nasdaq Stock Market LLC | ||
6.0% Fixed to Floating Subordinated Notes due 2026 | INBKL | The Nasdaq Stock Market LLC | ||
6.0% Fixed to Floating Subordinated Notes due 2029 | INBKZ | The Nasdaq Stock Market LLC | ||
Securities registered pursuant to Section 12(g) of the Act: None
Indicate by check mark if the registrant is a well-known seasoned issuer, as defined in Rule 405 of the Securities Act. Yes ¨ No þ
Indicate by check mark if the registrant is not required to file reports pursuant to Section 13 or Section 15(d) of the Act. Yes ¨ No þ
Indicate by check mark whether the registrant (1) has filed all reports required to be filed by Section 13 or Section 15(d) of the Securities Exchange Act of 1934 during the preceding 12 months (or for such shorter period that the registrant was required to file such reports), and (2) has been subject to such filing requirements for the past 90 days. Yes þ No ¨
Indicate by check mark whether the registrant has submitted electronically every Interactive Data File required to be submitted pursuant to Rule 405 of Regulation S-T (§232.405 of this chapter) during the preceding 12 months (or such shorter period that the registrant was required to submit such files). Yes þ No ¨
Indicate by check mark whether the registrant is a large accelerated filer, an accelerated filer, a non-accelerated filer, a smaller reporting company or an emerging growth company. See the definitions of "large accelerated filer," "accelerated filer," "smaller reporting company," and "emerging growth company" in Rule 12b-2 of the Exchange Act.
Large accelerated filer ¨ | Accelerated filer þ |
Non-accelerated filer ¨ | Smaller reporting company þ |
Emerging growth company ¨ | |
If an emerging growth company, indicate by check mark if the registrant has elected not to use the extended transition period for complying with any new or revised financial accounting standards provided pursuant to Section 13(a) of the Exchange Act. ¨
Indicate by check mark whether the registrant is a shell company (as defined in Rule 12b-2 of the Act). Yes ¨ No þ
The aggregate market value of common stock held by non-affiliates of the registrant as of June 28, 2019, the last business day of the registrant’s most recently completed second fiscal quarter, was approximately $204.6 million, based on the closing sale price for the registrant’s common stock on that date. For purposes of determining this number, all officers and directors of the registrant are considered to be affiliates of the registrant. This number is provided only for the purpose of this report and does not represent an admission by either the registrant or any such person as to the status of such person.
As of March 6, 2020, the registrant had 9,754,964 shares of common stock issued and outstanding.
Documents Incorporated By Reference
Portions of our Proxy Statement for our 2020 Annual Meeting of Shareholders are incorporated by reference in Part III.
Cautionary Note Regarding Forward-Looking Statements
This annual report on Form 10-K contains “forward-looking statements” within the meaning of the federal securities laws. These statements are not historical facts, but rather statements based on the current expectations of First Internet Bancorp and its consolidated subsidiaries (the “Company,” “we,” “our,” or “us”) regarding its business strategies, intended results and future performance. Forward-looking statements are generally preceded by terms such as “anticipate,” “believe,” “can,” “continue,” “could,” “estimate,” “expect,” “intend,” “likely,” “may,” “pending,” “plan,” “position,” “preliminary,” “remain,” “should,” “will,” “would,” or other similar expressions. Such statements are subject to certain risks and uncertainties including: general economic conditions, whether national or regional, and conditions in the lending markets in which we participate that may have an adverse effect on the demand for our loans and other products, our credit quality and related levels of nonperforming assets and loan losses, and the value and salability of the real estate that we own or that is the collateral for our loans; failures or breaches of or interruptions in the communication and information systems on which we rely to conduct our business that could reduce our revenues, increase our costs or lead to disruptions in our business; our plans to grow our commercial real estate, commercial and industrial, public finance, U.S. Small Business Administration (“SBA”) and healthcare finance loan portfolios, which may carry greater risks of non-payment or other unfavorable consequences; our dependence on capital distributions from First Internet Bank of Indiana (the “Bank”); results of examinations of us by our regulators, including the possibility that our regulators may, among other things, require us to increase our allowance for loan losses or to write-down assets; changing bank regulatory conditions, policies or programs, whether arising as new legislation or regulatory initiatives, that could lead to restrictions on activities of banks generally, or the Bank in particular; more restrictive regulatory capital requirements; increased costs, including deposit insurance premiums; regulation or prohibition of certain income producing activities or changes in the secondary market for loans and other products; changes in market rates and prices that may adversely impact the value of securities, loans, deposits and other financial instruments and the interest rate sensitivity of our balance sheet; our liquidity requirements being adversely affected by changes in our assets and liabilities; the effect of legislative or regulatory developments, including changes in laws concerning taxes, banking, securities, insurance and other aspects of the financial services industry; competitive factors among financial services organizations, including product and pricing pressures and our ability to attract, develop and retain qualified banking professionals; execution of future acquisition, reorganization or disposition transactions, including without limitation, the related time and costs of implementing such transactions, integrating operations as part of these transactions and possible failures to achieve expected gains, revenue growth and/or expense savings and other anticipated benefits from such transactions; changes in applicable tax laws; the growth and profitability of noninterest or fee income being less than expected; the loss of any key members of senior management; the effect of changes in accounting policies and practices, as may be adopted by the Financial Accounting Standards Board (the “FASB”), the Securities and Exchange Commission (the “SEC”), the Public Company Accounting Oversight Board and other regulatory agencies; and the effect of fiscal and governmental policies of the United States federal government. Additional factors that may affect our results include those discussed in this report under the heading “Risk Factors” and in other reports filed with the SEC. We caution readers not to place undue reliance on any such forward-looking statements, which speak only as of the date made. The factors listed above could affect our financial performance and could cause our actual results for future periods to differ materially from any opinions or statements expressed with respect to future periods in any current statements.
Except as required by law, we do not undertake, and specifically disclaim any obligation, to publicly release the result of any revisions that may be made to any forward-looking statements to reflect events or circumstances after the date of such statements or to reflect the occurrence of anticipated or unanticipated events.
i
First Internet Bancorp
Table of Contents
PART I | PAGE | |
Item 1. | Business | |
Item 1A. | Risk Factors | |
Item 1B. | Unresolved Staff Comments | |
Item 2. | Properties | |
Item 3. | Legal Proceedings | |
Item 4. | Mine Safety Disclosures | |
PART II | ||
Item 5. | Market for the Registrant’s Common Equity, Related Stockholder Matters and Issuer Purchases of Equity Securities | |
Item 6. | Selected Financial Data | |
Item 7. | Management’s Discussion and Analysis of Financial Condition and Results of Operations | |
Item 7A. | Quantitative and Qualitative Disclosures About Market Risk | |
Item 8. | Financial Statements and Supplementary Data | |
Item 9. | Changes in and Disagreements with Accountants on Accounting and Financial Disclosure | |
Item 9A. | Controls and Procedures | |
Item 9B. | Other Information | |
PART III | ||
Item 10. | Directors, Executive Officers and Corporate Governance | |
Item 11. | Executive Compensation | |
Item 12. | Security Ownership of Certain Beneficial Owners and Management and Related Stockholder Matters | |
Item 13. | Certain Relationships and Related Transactions, and Director Independence | |
Item 14. | Principal Accountant Fees and Services | |
PART IV | ||
Item 15. | Exhibits and Financial Statement Schedules | |
Item 16. | Form 10-K Summary | |
SIGNATURES | ||
ii
PART I
Item 1. Business
General
First Internet Bancorp is a bank holding company that conducts its primary business activities through its wholly-owned subsidiary, First Internet Bank of Indiana, an Indiana chartered bank. First Internet Bank of Indiana was the first state-chartered, Federal Deposit Insurance Corporation (“FDIC”) insured Internet bank and commenced banking operations in 1999. First Internet Bancorp was incorporated under the laws of the State of Indiana on September 15, 2005. On March 21, 2006, we consummated a plan of exchange by which we acquired all of the outstanding shares of the Bank.
When we refer to “First Internet Bancorp,” the “Company,” “we,” “us” and “our” in the remainder of this annual report on Form 10-K, we mean First Internet Bancorp and its consolidated subsidiaries, unless the context indicates otherwise. References to “First Internet Bank” or the “Bank” refer to First Internet Bank of Indiana, an Indiana chartered bank and wholly-owned subsidiary of the Company.
We offer a wide range of commercial, small business, consumer and municipal banking products and services. We conduct our consumer and small business deposit operations primarily through online channels on a nationwide basis and have no traditional branch offices. Our residential mortgage products are offered nationwide primarily through an online direct-to-consumer platform and are supplemented with Central Indiana-based mortgage and construction lending. Our consumer lending products are primarily originated on a nationwide basis over the Internet as well as through relationships with dealerships and financing partners.
Our commercial banking products and services are delivered through a relationship banking model and include commercial real estate (“CRE”) banking, commercial and industrial (“C&I”) banking, public finance, healthcare finance, small business lending and commercial deposits and treasury management. Through our CRE team, we offer single tenant lease financing on a nationwide basis in addition to traditional investor CRE and construction loans primarily within Central Indiana and adjacent markets. To meet the needs of commercial borrowers and depositors located primarily in Central Indiana, Phoenix, Arizona and adjacent markets, our C&I banking team provides credit solutions such as lines of credit, term loans, owner-occupied CRE loans and corporate credit cards. Our public finance team provides a range of public and municipal lending and leasing products to government entities on a nationwide basis. Our healthcare finance team was established in conjunction with our strategic partnership with Lendeavor, Inc., a San Francisco-based technology-enabled lender to healthcare practices, and provides lending for healthcare practice finance or acquisition, acquisition or refinancing of owner-occupied CRE and equipment purchases. This portfolio segment is generally concentrated in the Western and Southwestern regions of the United States with plans to continue expanding nationwide. Our commercial deposits and treasury management team works with the other commercial teams to provide deposit products and treasury management services to our commercial and municipal lending customers as well as pursues commercial deposit opportunities in business segments where we have no credit relationships.
In 2018, we identified small business as an area for potential growth in loans, revenue and deposits. We believe that we can differentiate ourselves from larger financial institutions through providing a full suite of services to emerging small businesses and entrepreneurs. We have begun adding experienced personnel to build out our capabilities in small business lending and U.S. government guaranteed lending programs, including loans originated under the Small Business Administration (“SBA”) guidelines. To accelerate our efforts in this area, on November 1, 2019, we acquired a loan portfolio, a servicing portfolio and a team of experienced small business lending servicing professionals from First Colorado National Bank. As of December 31, 2019, the principal balance of loans acquired was approximately $32.6 million and was comprised primarily of SBA 7(a) loans while the principal balance of the servicing portfolio acquired was approximately $94.8 million and consisted of guaranteed SBA 7(a) loans sold in the secondary market. We expect to continue adding personnel to build out a nationwide small business platform.
As of December 31, 2019, we had total assets of $4.1 billion, total liabilities of $3.8 billion, and shareholders’ equity of $304.9 million.
Our principal executive offices are located at 11201 USA Parkway, Fishers, Indiana 46037, and our telephone number is (317) 532-7900.
Subsidiaries
The Bank has three wholly-owned subsidiaries: First Internet Public Finance Corp., which provides a range of public and municipal finance lending and leasing products to governmental entities throughout the United States and acquires securities
1
issued by state and local governments and other municipalities; JKH Realty Services, LLC, which manages other real estate owned properties as needed; and SPF15 Inc., which was established to acquire and hold real estate.
Performance
Balance Sheet Growth. Total assets have increased 222.9% from $1.3 billion at December 31, 2015 to $4.1 billion at December 31, 2019. This increase was driven primarily by strong organic growth. During the same time period, loans increased from $1.0 billion to $3.0 billion and deposits increased from $1.0 billion to $3.2 billion, increases of 210.7% and 229.9%, respectively. Our sustained growth profile has been the result of our flexible and highly scalable Internet banking platform that allows us to target a broad reach of customers across all 50 states. Additionally, key strategic commercial banking hires have enabled us to further expand our product offerings on both a local and national basis. At December 31, 2019, commercial loans comprised 77.2% of loans compared to 61.1% at December 31, 2015.
Earnings Growth. Net income has increased 182.7% from $8.9 million for the twelve months ended December 31, 2015 to $25.2 million for the twelve months ended December 31, 2019. Diluted earnings per share have increased 28.1% from $1.96 for the twelve months ended December 31, 2015 to $2.51 for the twelve months ended December 31, 2019.
Asset Quality. We have maintained a high-quality loan portfolio due to our emphasis on a strong credit culture, conservative underwriting standards, disciplined risk management processes, and a diverse national and local customer base. At December 31, 2019, our nonperforming assets to total assets was 0.22%, our nonperforming loans to total loans was 0.23% and our allowance for loan losses to total loans was 0.74%.
Strategic Focus
We operate on a national basis through our scalable Internet banking platform to gather deposits and offer residential mortgage and consumer lending products rather than relying on a conventional brick and mortar branch system. We also offer commercial banking services, including CRE and C&I, single tenant lease financing, public finance, healthcare finance and small business lending. Our overriding strategic focus is enhancing franchise and shareholder value while maintaining strong risk management policies and procedures. We believe the continued creation of franchise and shareholder value will be driven by profitable growth in commercial and consumer banking, effective underwriting, strong asset quality and efficient technology-driven operations.
National Focus on Deposit and Consumer Banking Growth. Our first product offerings were basic deposit accounts, certificates of deposit, electronic bill pay and credit cards. Within 90 days of opening, we had accounts with consumers in all 50 states. Over the years, we added consumer loans, lines of credit, home equity loans and single-family mortgages. Our footprint for deposit gathering and these consumer lending activities is the entire nation. With the use of our Internet-based technology platform, we do not face geographic boundaries that traditional banks must overcome for customer acquisition. Armed with smart phones, tablets and computers, our customers can access our online banking system, bill pay, and remote deposit capture 24 hours a day, seven days a week, on a real-time basis. In addition, we have dedicated banking specialists who can service customer needs via telephone, email or online chat. We intend to continue to expand our deposit base by leveraging technology and through targeted marketing efforts.
Commercial Banking Growth. We have diversified our operations by adding commercial banking, public finance, healthcare finance and small business lending to complement our consumer platform. We offer traditional CRE loans, single tenant lease financing, C&I loans, healthcare finance loans, small business lending loans, corporate credit cards, treasury management services and public and municipal finance loans and leases. Our commercial lending teams consist of seasoned commercial bankers, many of whom have had extensive careers with larger money center, super-regional or regional banks. These lenders leverage deep market knowledge and experience to serve commercial borrowers with a relationship-based approach. We intend to continue expanding our commercial banking platform by hiring additional seasoned loan officers and relationship managers with specialized market or product expertise.
Experience. Our management team and our Board of Directors are integral to our success. Our management team and Board of Directors are led by David B. Becker, the founder of First Internet Bank of Indiana. Mr. Becker is a seasoned business executive and entrepreneur with over three decades of management experience in the financial services and financial technology space, and has served as Chief Executive Officer since 2005. Mr. Becker has been the recipient of numerous business awards, including Ernst & Young Entrepreneur of the Year in 2001, and was inducted into the Central Indiana Business Hall of Fame in 2008. The senior management team consists of individuals with backgrounds in both regional and community banking and financial technology services. The senior management team is overseen by a dedicated Board of Directors with a wide range of experience from careers in financial services, legal and regulatory services, and industrial services.
2
Increased Efficiency Through Technology. We have built a scalable banking platform based upon technology as opposed to a traditional branch network. We intend to continue leveraging this infrastructure as well as investing in and utilizing new technologies to compete more effectively as we grow in the future. Through our online account access services, augmented by our team of dedicated banking specialists, we can satisfy the needs of our retail and commercial customers in an efficient manner. We believe that our business model and digital banking processes are capable of supporting continued growth and producing a greater level of operational efficiency, which should drive increasing profitability.
Expand Asset Generation and Revenue Channels. Our geographic and credit product diversity have produced balance sheet and earnings growth. We expect to continue exploring additional asset and revenue generation capabilities that complement our commercial and consumer banking platforms. These efforts may include adding personnel or teams with product, industry or geographic expertise or through strategic acquisitions.
Lending Activities
We earn interest income on loans as well as fee income from the origination of loans. Lending activities include loans to individuals, which primarily consist of residential real estate loans, home equity loans and lines of credit, and consumer loans, and loans to commercial customers, which include C&I loans, CRE loans, municipal loans and leases, lines of credit, letters of credit, single tenant lease financing, loans to healthcare providers and small business lending loans. Residential real estate loans are either retained in our loan portfolio or sold to secondary investors, with gains or losses from the sales being recognized within noninterest income. Refer to Note 4 to the Company's consolidated financial statements for further discussion of each loan portfolio segment as of December 31, 2019.
Deposit Activities and Other Sources of Funds
We obtain deposits through the ACH network (direct deposit as well as customer-directed transfers of funds from outside financial institutions), remote and mobile deposit capture, mailed checks, wire transfers and a deposit-taking ATM network. Additionally, we had approximately $538.4 million in brokered deposits at December 31, 2019, which includes deposits originated through broker/dealer relationships, as well as certain public fund deposits originated through a relationship with an asset manager that manages the short-term liquidity needs of municipalities and other governmental bodies.
The Bank does not own or operate any ATMs. Through network participation, the Bank’s customers are able to use nearly any ATM worldwide to withdraw cash. The Bank currently rebates up to $10.00 per customer per month for surcharges our customers incur when using an ATM owned by another institution. Management believes this program is more cost effective for the Bank, and more convenient for our customers, than it would be to build and maintain a proprietary nationwide ATM network.
By providing robust online capabilities, quality customer service and competitive pricing for the products and services offered, we have been able to develop relationships with our customers and build brand loyalty. As a result, we are not dependent upon costly account acquisition campaigns to attract new customers on a continual basis.
Competition
The markets in which we compete to make loans and attract deposits are highly competitive.
For retail banking activities, we compete with other banks that use the Internet as a primary service channel, including Ally Bank, Discover Bank, TIAA Bank, Synchrony Bank, Goldman Sachs Bank USA and Axos Bank. However, we also compete with other banks, savings banks, credit unions, investment banks, insurance companies, securities brokerages and other financial institutions, as nearly all have some form of Internet delivery for their services. For residential mortgage lending, competitors that use the Internet as a primary service channel include Quicken Loans and loanDepot. We also compete with money center and superregional banks in residential mortgage lending, including Bank of America, Chase and Wells Fargo.
For our traditional commercial lending activities, we compete with larger financial institutions operating in the Midwest and Central Indiana regions, including KeyBank, PNC Bank, Chase, BMO Harris Bank, Huntington National Bank and First Financial Bank. In the Southwest, competitors include Wells Fargo, Chase, Bank of America, U.S. Bank, Mid First Bank and BOK Financial. For our single tenant lease financing activities, we compete nationally with regional banks, local banks and credit unions, as well as life insurance companies and commercial mortgage-backed securities lenders. Examples of these competitors include Wells Fargo, First Savings Bank, CapStar Bank, TIAA Bank and StanCorp. For our public finance activities, we compete nationally with superregional and regional banks, such as Huntington National Bank, KeyBank, Capital One, Sterling National Bank, JP Morgan and Chase Co. and Bank of America. For our healthcare finance activities, we compete nationally with superregional and regional banks, such as TD Bank, PNC Bank, Wintrust Financial Corporation and Columbia Bank. These
3
competitors may have significantly greater financial resources and higher lending limits than we do and may also offer specialized products and services that we do not. For our small business lending activities, we compete on a national footprint with other participating SBA-approved lenders. Those lenders could be smaller or larger than us and could include non-bank entities. Examples of these competitors include Wells Fargo, Byline Bank, Live Oak Bank, Huntington, and Newtek, as well as a large number of regional or community banks. These competitors have resources and/or lending limits that differ greatly from one another.
In the United States, banking has continued to experience consolidation leading to the emergence of several large nationwide banking institutions. These competitors have significantly greater financial resources as well as offer a wider range of services than we do. We have attempted to offset some of the advantages of the larger competitors by leveraging technology to deliver product solutions and better compete in targeted segments. We have positioned ourselves as an alternative to these institutions for consumers who do not wish to subsidize the cost of large branch networks through high fees and unfavorable interest rates.
We anticipate that consolidation will continue in the financial services industry and perhaps accelerate as a result of intensified competition for the same customer segments as well as significantly increased regulatory burdens and rules that are expected to increase expenses and put pressure on earnings.
Regulation and Supervision
The Company and the Bank are extensively regulated under federal and state law. The Company is a registered bank holding company under the Bank Holding Company Act of 1956 (the “BHCA”) and, as such, is subject to regulation, supervision and examination by the Board of Governors of the Federal Reserve System (the “Federal Reserve”). The Company is required to file reports with the Federal Reserve on a quarterly basis.
The Bank is an Indiana-chartered bank formed pursuant to the Indiana Financial Institutions Act (the “IFIA”). As such, the Bank is regularly examined by and subject to regulations promulgated by the Indiana Department of Financial Institutions (the “DFI”) and the FDIC as its primary federal bank regulator. The Bank is not a member of the Federal Reserve System.
The regulatory environment affecting the Company has been and continues to be altered by the enactment of new statutes and the adoption of new regulations as well as by revisions to, and evolving interpretations of, existing regulations. State and federal banking agencies have significant discretion in the conduct of their supervisory and enforcement activities and their examination policies. Any change in such practices and policies could have a material impact on the Company’s results of operations and financial condition.
The following discussion is intended to be a summary of the material statutes, regulations and regulatory directives that are currently applicable to us. It does not purport to be comprehensive or complete and it is expressly subject to and modified by reference to the text of the applicable statutes, regulations and directives.
The Dodd-Frank Act
The Dodd-Frank Wall Street Reform and Consumer Protection Act (the “Dodd-Frank Act”) comprehensively reformed the regulation of financial institutions and the products and services they offer. Certain provisions of the Dodd-Frank Act noted in this section are also discussed in other sections.
The Dodd-Frank Act permanently raised deposit insurance levels to $250,000. Deposit insurance assessments are calculated based on an insured depository institution’s assets rather than its insured deposits, and the minimum reserve ratio of the FDIC’s Deposit Insurance Fund (the “DIF”) is 1.35%. The payment of interest on business demand deposit accounts is permitted by the Dodd-Frank Act. The Dodd-Frank Act authorized the Federal Reserve to regulate interchange fees for debit card transactions and established minimum mortgage underwriting standards for residential mortgages. Further, the Dodd-Frank Act bars certain banking organizations from engaging in proprietary trading and from sponsoring and investing in hedge funds and private equity funds, except as permitted under certain limited circumstances.
The Dodd-Frank Act also established the Consumer Financial Protection Bureau (the “CFPB”) as an independent agency within the Board of Governors of the Federal Reserve System. The CFPB has the exclusive authority to administer, enforce, and otherwise implement federal consumer financial laws, which includes the power to make rules, issue orders, and issue guidance governing the provision of consumer financial products and services. The CFPB has exclusive federal consumer law supervisory authority and primary enforcement authority over insured depository institutions with assets totaling over $10 billion. Authority for institutions with $10 billion or less rests with the prudential regulator, and in the case of the Bank lies with the FDIC.
4
Holding Company Regulation
We are subject to supervision and examination as a bank holding company by the Federal Reserve under the BHCA. In addition, the Federal Reserve has the authority to issue orders to bank holding companies to cease and desist from unsafe or unsound banking practices and from violations of conditions imposed by, or violations of agreements with, the Federal Reserve. The Federal Reserve is also empowered, among other things, to assess civil money penalties against companies or individuals who violate Federal Reserve orders or regulations, to order termination of nonbanking activities of bank holding companies and to order termination of ownership and control of a nonbanking subsidiary by a bank holding company. Federal Reserve approval is also required in connection with bank holding companies’ acquisitions of more than 5% of the voting shares of any class of a depository institution or its holding company and, among other things, in connection with the bank holding company’s engaging in new activities.
Under the BHCA, our activities are limited to businesses so closely related to banking, managing or controlling banks as to be a proper incident thereto. The BHCA also requires a bank holding company to obtain approval from the Federal Reserve before (1) acquiring or holding more than a 5% voting interest in any bank or bank holding company, (2) acquiring all or substantially all of the assets of another bank or bank holding company or (3) merging or consolidating with another bank holding company.
We have not filed an election with the Federal Reserve to be treated as a “financial holding company,” a type of holding company that can engage in certain insurance and securities-related activities that are not permitted for a bank holding company.
Source of Strength. Under the Dodd-Frank Act, we are required to serve as a source of financial and managerial strength for the Bank in the event of the financial distress of the Bank. This provision codifies the longstanding policy of the Federal Reserve. In addition, any capital loans by a bank holding company to any of its depository subsidiaries are subordinate to the payment of deposits and to certain other indebtedness. In the event of a bank holding company’s bankruptcy, any commitment by the bank holding company to a federal bank regulatory agency to maintain the capital of a depository subsidiary will be assumed by the bankruptcy trustee and entitled to a priority of payment.
Regulatory Capital. The Federal Reserve sets risk-based capital ratio and leverage ratio guidelines for bank holding companies. Under the guidelines and related policies, bank holding companies must maintain capital sufficient to meet both a risk-based asset ratio test and a leverage ratio test on a consolidated basis. The guidelines provide a systematic analytical framework that makes regulatory capital requirements sensitive to differences in risk profiles among banking organizations, takes off-balance sheet exposures expressly into account in evaluating capital adequacy and minimizes disincentives to holding assets considered by regulatory agencies to be liquid and low risk. The risk-based ratio is determined by allocating assets and specified off-balance sheet commitments into risk-weighted categories, with higher weighting assigned to categories perceived as representing greater risk. The risk-based ratio represents total capital divided by total risk-weighted assets. The leverage ratio is Tier 1 capital divided by total average assets adjusted as specified in the guidelines. The Bank, supervised by the FDIC and DFI, is subject to substantially similar capital requirements. Our applicable capital ratios as of December 31, 2019 and 2018 are summarized in Note 14 to the financial statements.
In 2013, the Federal Reserve published final rules (the “Basel III Capital Rules”) establishing a comprehensive capital framework for U.S. bank holding companies. The FDIC adopted substantially identical standards for institutions, like the Bank, subject to its jurisdiction in an interim final rule.
Among other things, the Basel III Capital Rules (i) introduced a new capital measure called “Common Equity Tier 1” (“CET1”), (ii) specified that Tier 1 Capital consists of CET1 and “Additional Tier 1 Capital” instruments meeting specified requirements, (iii) applied most deductions/adjustments to regulatory capital measures to CET1 and not to the other components of capital, thus potentially requiring higher levels of CET1 in order to meet minimum ratios, and (iv) expanded the scope of the deductions/adjustments from capital in comparison to prior regulations.
Under Basel III Capital Rules, the minimum capital ratios are: 4.5% CET1 to risk-weighted assets, 6.0% Tier 1 capital to risk-weighted assets, 8.0% Total Capital (Tier 1 Capital plus Tier 2 Capital) to risk-weighted assets and 4.0% Leverage Ratio. In addition, a capital conservation buffer of 2.5% above each level applicable to the CET1, Tier 1, and Total Capital ratios is required for banking institutions like the Company and the Bank to avoid restrictions on their ability to make capital distributions, including dividends, and pay certain discretionary bonus payments to executive officers. The capital conservation buffer was phased in with annual increases through January 1, 2019. The following are the Basel III regulatory capital levels, inclusive of the capital conservation buffer, that the Company and the Bank must satisfy to avoid limitations on capital distributions, including dividends, and discretionary bonus payments during the applicable phase-in period from January 1, 2015, until January 1, 2019:
5
Basel III Regulatory Capital Levels | ||||||||||||||
January 1, 2015 | January 1, 2016 | January 1, 2017 | January 1, 2018 | January 1, 2019 | ||||||||||
Common equity tier 1 capital to risk-weighted assets | 4.50 | % | 5.125 | % | 5.75 | % | 6.375 | % | 7.00 | % | ||||
Tier 1 capital to risk-weighted assets | 6.00 | % | 6.625 | % | 7.25 | % | 7.875 | % | 8.50 | % | ||||
Total capital to risk-weighted assets | 8.00 | % | 8.625 | % | 9.25 | % | 9.875 | % | 10.50 | % | ||||
The Basel III Capital Rules revised the prompt corrective action framework by (i) introducing a CET1 ratio requirement at each capital level, with a required CET1 ratio of 6.5% to remain well-capitalized, (ii) increasing the minimum Tier 1 Capital ratio requirement for each category, with the minimum Tier 1 Capital ratio for well-capitalized status being increased to 8% and (iii) transitioning to a Leverage Ratio of 4% in order to qualify as adequately capitalized and a Leverage Ratio of 5% to be well capitalized.
As of December 31, 2019, the Company and the Bank met all capital adequacy requirements under the Basel III Capital Rules.
Regulation of Banks
Business Activities. The Bank derives its lending and investment powers from the IFIA, the Federal Deposit Insurance Act (the “FDIA”) and related regulations.
Loans-to-One Borrower Limitations. Generally, the Bank’s total loans or extensions of credit to a single borrower, including the borrower’s related entities, outstanding at one time, and not fully secured, cannot exceed 15% of the Bank’s unimpaired capital and surplus. If the loans or extensions of credit are fully secured by readily marketable collateral, the Bank may lend up to an additional 10% of its unimpaired capital and surplus.
Community Reinvestment Act. Under the Community Reinvestment Act (the “CRA”), as implemented by FDIC regulations, the Bank has a continuing and affirmative obligation, consistent with safe and sound banking practices, to help meet the credit needs of its entire community, including low and moderate-income neighborhoods. The CRA does not establish specific lending requirements or programs for financial institutions nor does it limit an institution’s discretion to develop the types of products and services that it believes are best suited to its particular community, consistent with the CRA. The CRA requires the FDIC, in connection with its examinations of the Bank, to assess the Bank’s record of meeting the credit needs of its entire community and to take that record into account in evaluating certain applications for regulatory approvals that we may file with the FDIC.
Due to its Internet-driven model and nationwide consumer banking platform, the Bank has opted to operate under a CRA Strategic Plan, which was submitted to and approved by the FDIC and sets forth certain guidelines the Bank must meet. The current Strategic Plan expires December 31, 2020. The Bank received a “Satisfactory” CRA rating in its most recent CRA examination. Failure of an institution to receive at least a “Satisfactory” rating could inhibit such institution or its holding company from engaging in certain activities or pursuing acquisitions of other financial institutions.
Transactions with Affiliates. The authority of the Bank, like other FDIC-insured banks, to engage in transactions with its “affiliates” is limited by Sections 23A and 23B of the Federal Reserve Act and the Federal Reserve’s Regulation W. An “affiliate” for this purpose is defined generally as any company that owns or controls the Bank or is under common ownership or control with the Bank, but excludes a company controlled by a bank. In general, transactions between the Bank and its affiliates must be on terms that are consistent with safe and sound banking practices and at least as favorable to the Bank as comparable transactions between the Bank and non-affiliates. In addition, covered transactions with affiliates are restricted individually to 10% and in the aggregate to 20% of the Bank’s capital. Collateral ranging from 100% to 130% of the loan amount depending on the quality of the collateral must be provided for an affiliate to secure a loan or other extension of credit from the Bank. The Company is an “affiliate” of the Bank for purposes of Regulation W and Sections 23A and 23B of the Federal Reserve Act. We believe the Bank complied with these provisions during 2019.
6
Loans to Insiders. The Bank’s authority to extend credit to its directors, executive officers and principal shareholders, as well as to entities controlled by such persons (“Related Interests”), is governed by Sections 22(g) and 22(h) of the Federal Reserve Act and Regulation O of the Federal Reserve. Among other things, these provisions require that extensions of credit to insiders: (1) be made on terms that are substantially the same as, and follow credit underwriting procedures that are not less stringent than, those prevailing for comparable transactions with unaffiliated persons and that do not involve more than the normal risk of repayment or present other unfavorable features; and (2) not exceed certain limitations on the amount of credit extended to such persons, individually and in the aggregate, which limits are based, in part, on the amount of the Bank’s capital. In addition, extensions of credit in excess of certain limits must be approved in advance by the Bank’s Board of Directors. Further, provisions of the Dodd-Frank Act require that any sale or purchase of an asset by the Bank with an insider must be on market terms, and if the transaction represents more than 10% of the Bank’s capital stock and surplus, it must be approved in advance by a majority of the disinterested directors of the Bank. We believe the Bank is in compliance with these provisions.
Enforcement. The DFI and the FDIC share primary regulatory enforcement responsibility over the Bank and its institution-affiliated parties, including directors, officers and employees. This enforcement authority includes, among other things, the ability to appoint a conservator or receiver for the Bank, to assess civil money penalties, to issue cease and desist orders, to seek judicial enforcement of administrative orders and to remove directors and officers from office and bar them from further participation in banking. In general, these enforcement actions may be initiated in response to violations of laws, regulations and administrative orders, as well as in response to unsafe or unsound banking practices or conditions.
Standards for Safety and Soundness. Pursuant to the FDIA, the federal banking agencies have adopted a set of guidelines prescribing safety and soundness standards. These guidelines establish general standards relating to internal controls and information systems, internal audit systems, loan documentation, credit underwriting, interest rate risk exposure, asset growth, asset quality, earnings standards, compensation, fees and benefits. In general, the guidelines require appropriate systems and practices to identify and manage the risks and exposures specified in the guidelines. We believe we are in compliance with the safety and soundness guidelines.
Dividends. The ability of the Bank to pay dividends is limited by state and federal laws and regulations that require the Bank to obtain the prior approval of the DFI before paying a dividend that, together with other dividends it has paid during a calendar year, would exceed the sum of its net income for the year to date combined with its retained net income for the previous two years. The amount of dividends the Bank could pay may also be affected or limited by other factors, such as the requirements to maintain adequate capital.
Capital Distributions. The FDIC may disapprove of a notice or application to make a capital distribution if:
• | the Bank would be undercapitalized following the distribution; |
• | the proposed capital distribution raises safety and soundness concerns; or |
• | the capital distribution would violate a prohibition contained in any statute, regulation or agreement applicable to the Bank. |
Insurance of Deposit Accounts. The Bank is a member of the DIF, which is administered by the FDIC. All deposit accounts at the Bank are insured by the FDIC up to a maximum of $250,000 per depositor.
The FDIA, as amended by the Federal Deposit Insurance Reform Act and the Dodd-Frank Act, requires the FDIC to set a ratio of deposit insurance reserves to estimated insured deposits. In March 2016, the FDIC issued a final rule to increase the statutory minimum designated reserve ratio (the “DRR”) to 1.35% by September 30, 2020, the deadline imposed by the Dodd-Frank Act. The FDIC’s rules reduced assessment rates on all FDIC-insured financial institutions but imposed a surcharge on banks with assets of $10 billion or more until the DRR reaches 1.35% and provide assessment credits to banks with assets of less than $10 billion for the portion of their assessments that contribute to the increase of the DRR to 1.35%. The rules also changed the methodology used to determine risk-based assessment rates for established banks with less than $10 billion in assets to better ensure that banks taking on greater risks pay more for deposit insurance than banks that take on less risk.
FDIC insurance expense, including assessments relating to Financing Corporation (FICO) bonds, totaled $1.9 million for 2019, which included a $0.6 million small bank assessment credit.
Under the FDIA, the FDIC may terminate deposit insurance upon a finding that the institution has engaged in unsafe and unsound practices, is in an unsafe or unsound condition to continue operations or has violated any applicable law, regulation, rule, order or condition imposed by the FDIC.
7
Liquidity. The Bank is required to maintain a sufficient amount of liquid assets to ensure its safe and sound operation. To fund its operations, the Bank historically has relied upon deposits, Federal Home Loan Bank of Indianapolis (“FHLB”) borrowings, Fed Funds lines with correspondent banks and brokered deposits. The Bank believes it has sufficient liquidity to meet its funding obligations for at least the next twelve months.
Federal Home Loan Bank System. The Bank is a member of the FHLB, which is one of the regional Federal Home Loan Banks comprising the Federal Home Loan Bank System. Each Federal Home Loan Bank serves as a central credit facility primarily for its member institutions. The Bank, as a member of the FHLB, is required to acquire and hold shares of FHLB capital stock. While the required percentage of stock ownership is subject to change by the FHLB, the Bank is in compliance with this requirement with an investment in FHLB stock at December 31, 2019 of $25.7 million. Any advances from the FHLB must be secured by specified types of collateral, and long-term advances may be used for the purpose of providing funds to make residential mortgage or commercial loans and to purchase investments. Long-term advances may also be used to help alleviate interest rate risk for asset and liability management purposes. The Bank receives dividends on its FHLB stock.
Federal Reserve System. Although the Bank is not a member of the Federal Reserve System, it is subject to provisions of the Federal Reserve Act and the Federal Reserve’s regulations under which depository institutions may be required to maintain reserves against their deposit accounts and certain other liabilities. In 2008, the Federal Reserve Banks began paying interest on reserve balances. Currently, reserves must be maintained against transaction accounts. As of January 16, 2020, the Federal Reserve’s regulations required reserves equal to 3% on transaction account balances over $16.9 million and up to and including $127.5 million, plus 10% on the excess over $127.5 million. These requirements are subject to adjustment annually by the Federal Reserve. The Bank is in compliance with the foregoing reserve requirements. The balances maintained to meet the reserve requirements imposed by the Federal Reserve may be used to satisfy liquidity requirements imposed by the FDIC.
Anti-Money Laundering and the Bank Secrecy Act. Under the Bank Secrecy Act (the “BSA”), a financial institution is required to have systems in place to detect and report transactions of a certain size and nature. Financial institutions are generally required to report to the U.S. Treasury any cash transactions involving more than $10,000. In addition, financial institutions are required to file suspicious activity reports for transactions that involve more than $5,000 and which the financial institution knows, suspects or has reason to suspect involves illegal funds, is designed to evade the requirements of the BSA or has no lawful purpose. The Uniting and Strengthening America by Providing Appropriate Tools Required to Intercept and Obstruct Terrorism Act of 2001 (the “USA PATRIOT Act”), which amended the BSA, is designed to deny terrorists and others the ability to obtain anonymous access to the U.S. financial system. The USA PATRIOT Act has significant implications for financial institutions and businesses of other types involved in the transfer of money. The USA PATRIOT Act, in conjunction with the implementation of various federal regulatory agency regulations, has caused financial institutions, such as the Bank, to adopt and implement additional policies or amend existing policies and procedures with respect to, among other things, anti-money laundering compliance, suspicious activity, currency transaction reporting, customer identity verification and customer risk analysis.
The United States has imposed economic sanctions that affect transactions with designated foreign countries, nationals and others. These sanctions, which are administered by the Treasury Office of Foreign Assets Control (“OFAC”), take many different forms. Generally, however, they contain one or more of the following elements: (1) restrictions on trade with or investment in a sanctioned country, including prohibitions against direct or indirect imports from and exports to a sanctioned country and prohibitions on “U.S. persons” engaging in financial transactions relating to making investments in, or providing investment-related advice or assistance to, a sanctioned country; and (2) blocking of assets in which the government or specially designated nationals of the sanctioned country have an interest by prohibiting transfers of property subject to U.S. jurisdiction (including property in the possession or control of U.S. persons). Blocked assets (for example, property and bank deposits) cannot be paid out, withdrawn, set off or transferred in any manner without a license from OFAC.
Consumer Protection Laws. The Bank is subject to a number of federal and state laws designed to protect consumers and prohibit unfair or deceptive business practices. These laws include the Equal Credit Opportunity Act, Fair Housing Act, Home Ownership Protection Act, Fair Credit Reporting Act, as amended by the Fair and Accurate Credit Transactions Act of 2003 (the “FACT Act”), the Gramm-Leach-Bliley Act (the “GLBA”), the Truth in Lending Act, the CRA, the Home Mortgage Disclosure Act, the Real Estate Settlement Procedures Act, the National Flood Insurance Act and various state law counterparts. These laws and regulations mandate certain disclosure requirements and regulate the manner in which financial institutions must interact with customers when taking deposits, making loans, collecting loans and providing other services. Further, the Dodd-Frank Act established the CFPB, which has the responsibility for making and amending rules and regulations under the federal consumer protection laws relating to financial products and services. The CFPB also has a broad mandate to prohibit unfair or deceptive acts and practices and is specifically empowered to require certain disclosures to consumers and draft model disclosure forms. Failure to comply with consumer protection laws and regulations can subject financial institutions to enforcement actions, fines and other penalties. The FDIC enforces applicable CFPB rules with respect to the Bank.
8
Mortgage Reform. The Dodd-Frank Act prescribes certain standards that mortgage lenders must consider before making a residential mortgage loan, including verifying a borrower’s ability to repay such mortgage loan. The Dodd-Frank Act also allows borrowers to assert violations of certain provisions of the Truth-in-Lending Act as a defense to foreclosure proceedings. Under the Dodd-Frank Act, prepayment penalties are prohibited for certain mortgage transactions and creditors are prohibited from financing insurance policies in connection with a residential mortgage loan or home equity line of credit. The Dodd-Frank Act requires mortgage lenders to make additional disclosures prior to the extension of credit, in each billing statement and for negative amortization loans and hybrid adjustable rate mortgages. Additionally, the Dodd-Frank Act prohibits mortgage originators from receiving compensation based on the terms of residential mortgage loans and generally limits the ability of a mortgage originator to be compensated by others if compensation is received from a consumer.
Customer Information Security. The federal banking agencies have adopted final guidelines for establishing standards for safeguarding nonpublic personal information about customers. These guidelines implement provisions of the GLBA. Specifically, the Information Security Guidelines established by the GLBA require each financial institution, under the supervision and ongoing oversight of its board of directors or an appropriate committee thereof, to develop, implement and maintain a comprehensive written information security program designed to ensure the security and confidentiality of customer information (as defined under the GLBA), to protect against anticipated threats or hazards to the security or integrity of such information and to protect against unauthorized access to or use of such information that could result in substantial harm or inconvenience to any customer. The federal banking regulators have issued guidance for banks on response programs for unauthorized access to customer information. This guidance, among other things, requires notice to be sent to customers whose “sensitive information” has been compromised if unauthorized use of this information is “reasonably possible.”
Identity Theft Red Flags. Rules implementing Section 114 of the FACT Act require each financial institution or creditor to develop and implement a written Identity Theft Prevention Program to detect, prevent and mitigate identity theft in connection with the opening of certain accounts or certain existing accounts. In addition, the federal banking agencies issued guidelines to assist financial institutions and creditors in the formulation and maintenance of an Identity Theft Prevention Program that satisfies the requirements of the rules. Rules implementing Section 114 also require credit and debit card issuers to assess the validity of notifications of changes of address under certain circumstances. Additionally, the federal banking agencies issued joint rules under Section 315 of the FACT Act that provide guidance regarding reasonable policies and procedures that a user of consumer reports must employ when a consumer reporting agency sends the user a notice of address discrepancy.
Privacy. The GLBA requires financial institutions to implement policies and procedures regarding the disclosure of nonpublic personal information about consumers to nonaffiliated third parties. In general, the statute requires financial institutions to explain to consumers their policies and procedures regarding the disclosure of such nonpublic personal information and, except as otherwise required or permitted by law, financial institutions are prohibited from disclosing such information except as provided in their policies and procedures. The Bank is required to provide notice to its customers on an annual basis disclosing its policies and procedures on the sharing of nonpublic personal information. From time to time, Congress and state legislatures consider additional legislation relating to privacy and other aspects of consumer information. We cannot predict whether such legislation will be enacted, or what impact, if any, such legislation may have on our business, financial condition or results of operations.
The California Consumer Privacy Act of 2018 (the “CCPA”) grants all California residents the right to know what information a business has collected from them and the sourcing and sharing of that information, as well as a right to have a business delete their personal information (with some exceptions). Its definition of “personal information” is more expansive than those found in other privacy laws applicable to us in the United States. Failure to comply with the CCPA risks regulatory fines and the law grants a private right of action for any unauthorized disclosure of personal information as a result of failure to maintain reasonable security procedures. The CCPA became effective on January 1, 2020, but California's Attorney General cannot bring an enforcement action under the CCPA until July 1, 2020.
Cybersecurity. In 2015, federal regulators issued two related statements regarding cybersecurity. One statement indicates that financial institutions should design multiple layers of security controls to establish lines of defense and ensure that their risk management processes also address the risk posed by compromised customer credentials, including security measures to reliably authenticate customers accessing Internet-based services of the financial institution. The other statement indicates that a financial institution’s management is expected to maintain sufficient business continuity planning processes to ensure the rapid recovery, resumption, and maintenance of the institution’s operations after a cyber-attack involving destructive malware. A financial institution is also expected to develop appropriate processes to enable recovery of data and business operations and address rebuilding network capabilities and restoring data if the institution or its critical service providers fall victim to this type of cyber-attack. If we fail to observe the regulatory guidance, we could be subject to various regulatory sanctions, including financial penalties.
9
State regulators have also been increasingly active in implementing privacy and cybersecurity standards and regulations. For example, several states have adopted regulations requiring certain financial institutions to implement cybersecurity programs and providing detailed requirements with respect to these programs, including data encryption requirements. Many states have also recently implemented or modified their data breach notification and data privacy requirements. We expect this trend of increased activity and changes at the state level to continue.
In 2018, the SEC published interpretive guidance to assist public companies in preparing disclosures about cybersecurity risks and incidents. These SEC guidelines, and any other regulatory guidance, are in addition to notification and disclosure requirements under state and federal banking law and regulations.
In support of our Internet banking platform, we rely heavily on electronic communications and information systems to conduct our operations and store sensitive data. We employ an in-depth approach that leverages people, processes, and technology to manage and maintain cybersecurity controls. In addition, we employ a variety of preventative and detective tools to monitor, block, and provide alerts regarding suspicious activity, as well as to report on any suspected advanced persistent threats. Notwithstanding the strength of our defensive measures, the threat from cyber-attacks is severe, attacks are sophisticated and increasing in volume, and attackers respond rapidly to changes in defensive measures.
We continually strive to enhance our cyber and information security in order to be resilient against emerging threats and improve our ability to detect and respond to attempts to gain unauthorized access to our data and systems. We regularly conduct cybersecurity risk assessments, regularly engage with the Board or appropriate committees on cybersecurity matters, routinely update our incident response plans based on emerging threats, periodically practice implementation of incident response plans across applicable departments and train officers and employees to detect and report suspicious activity. Although to date we have not experienced any material losses relating to cyber-attacks or other information security breaches, our systems and those of our customers and third-party service providers are under constant threat, and it is possible that we could experience a significant event in the future due to the rapidly evolving nature and sophistication of these threats, as well as due to the expanding use of Internet and mobile banking and other technology-based products and services, by us and our consumers.
Employees
At December 31, 2019, we had 231 total employees, of which 227 were full-time employees.
10
Available Information
Our Internet address is www.firstinternetbancorp.com. We post important information for investors on our website and use this website as a means for complying with our disclosure obligations under Regulation FD. Accordingly, investors should monitor our website, in addition to following our press releases, SEC filings, public conference calls, presentations and webcasts. Investors can easily find or navigate to pertinent information about us, free of charge, on our website, including:
• | our Annual Reports on Form 10-K, Quarterly Reports on Form 10-Q, Current Reports on Form 8-K and amendments to those reports filed or furnished pursuant to Section 13(a) or 15(d) of the Securities Exchange Act of 1934, as amended (the “Exchange Act”), as soon as reasonably practicable after we electronically file such material with or furnish it to the SEC; |
• | announcements of investor conferences and events at which our executives talk about our products and competitive strategies. Archives of some of these events are also available; |
• | press releases on quarterly earnings, product announcements, legal developments and other material news that we may post from time to time; |
• | corporate governance information, including our Corporate Governance Principles, Code of Business Conduct and Ethics, information concerning our Board of Directors and its committees, including the charters of the Audit Committee, Compensation Committee, and Nominating and Corporate Governance Committee, and other governance-related policies; |
• | shareholder services information, including ways to contact our transfer agent; and |
• | opportunities to sign up for email alerts and RSS feeds to have information provided in real time. |
The information available on our website is not incorporated by reference in, or a part of, this or any other report we file with or furnish to the SEC.
Item 1A. Risk Factors
Risk factors which could cause actual results to differ from our expectations and which could negatively impact our financial condition and results of operations are discussed below and elsewhere in this report. Additional risks and uncertainties not presently known to us or that are currently not believed to be significant to our business may also affect our actual results and could harm our business, financial condition and results of operations. If any of the risks or uncertainties described below or any additional risks and uncertainties actually occur, our business, results of operations and financial condition could be materially and adversely affected.
RISKS RELATED TO OUR BUSINESS
A failure of, or interruption in, the communications and information systems on which we rely to conduct our business could adversely affect our revenues and profitability.
We rely heavily upon communications and information systems to conduct our business. Although we have built a level of redundancy into our information technology infrastructure and update our business continuity plan annually, any failure or interruption of our information systems, or the third-party information systems on which we rely, as a result of inadequate or failed processes or systems, human errors or external events, could adversely affect our Internet-based operations and slow the processing of applications, loan servicing, and deposit-related transactions. In addition, our communication and information systems may present security risks and could be susceptible to hacking or other unauthorized access. The occurrence of any of these events could have a material adverse effect on our business, financial condition and results of operations.
Our commercial loan portfolio exposes us to higher credit risks than residential real estate loans, including risks relating to the success of the underlying business and conditions in the market or the economy and concentrations in our commercial loan portfolio.
We have grown our CRE, healthcare finance and C&I loan portfolios. At December 31, 2019, CRE loans amounted to $1.1 billion, or 38.5% of total loans, healthcare finance loans amounted to $300.6 million, or 10.1% of total loans and C&I loans amounted to $96.4 million, or 3.3% of total loans. These loans generally involve higher credit risks than residential real estate
11
loans and are dependent upon our lenders maintaining close relationships with the borrowers. Payments on these loans are often dependent upon the successful operation and management of the underlying business or assets, and repayment of such loans may be influenced to a great extent by conditions in the market or the economy. Commercial loans typically involve larger loan balances than residential real estate loans and could lead to concentration risks within our commercial loan portfolio. In addition, our C&I, healthcare finance and small business loans have primarily been extended to small to medium sized businesses that generally have fewer financial resources in terms of capital or borrowing capacity than larger entities. Our failure to manage this commercial loan growth and the related risks could have a material adverse effect on our business, financial condition and results of operations.
In addition, with respect to CRE, federal and state banking regulators are examining CRE lending activity with heightened scrutiny and may require banks with higher levels of CRE loans to implement more stringent underwriting, internal controls, risk management policies and portfolio stress testing, as well as possibly higher levels of allowances for losses and capital levels as a result of CRE lending growth and exposures. Because a significant portion of our loan portfolio is comprised of CRE loans, our banking regulators may require us to maintain higher levels of capital than we would otherwise be expected to maintain, which could limit our ability to leverage our capital and have a material adverse effect on our business, financial condition, results of operations and prospects.
Weakness in the economy may materially adversely affect our business and results of operations.
Our results of operations are materially affected by conditions in the economy. Dramatic declines in the housing market following the 2008 financial crisis, with falling home prices and increasing foreclosures and unemployment, resulted in significant write-downs of asset values by financial institutions. While conditions have improved, another economic downturn could result in financial stress on our borrowers that would adversely affect consumer confidence, a reduction in general business activity and increased market volatility. The resulting economic pressure on consumers and businesses and the lack of confidence in the financial markets could adversely affect our business, financial condition, results of operations and stock price. Our ability to properly assess the creditworthiness of our customers and to estimate the losses inherent in our credit exposure would be made more complex by these difficult market and economic conditions. Accordingly, if market conditions worsen, we may experience increases in foreclosures, delinquencies, write-offs and customer bankruptcies, as well as more restricted access to funds.
Significant external events could adversely affect our business and results of operations.
Severe weather, natural disasters, acts of war or terrorism, widespread public health issues and other significant external events or continued circumstances could impair the ability of our customers to repay outstanding loans; impair the value of collateral, if any, securing outstanding loans; negatively impact our deposit base, loan originations or general demand for our services; cause significant property damage; result in loss of revenue or cause us to incur additional expenses or losses. For example, the emergence of a widespread health emergency or pandemic, such as the potential spread of the coronavirus (“COVID-19”) and actions intended to mitigate the same, could lead to regional quarantines, business shutdowns, labor shortages, disruptions to supply chains, and overall economic instability. We could also be adversely affected if key personnel or a significant number of employees were to become unavailable due to an outbreak in the places they live. Although we have business continuity plans and other safeguards in place, there is no assurance that such plans and safeguards will be effective in mitigating the adverse impacts of any significant external event. The occurrence or continuation of any such event could materially adversely impact our business, our ability to provide our services, demand for our services, asset quality, financial condition and results of operations.
The market value of some of our investments could decline and adversely affect our financial position.
As of December 31, 2019, we had a net unrealized pre-tax holding loss of approximately $5.8 million on our $540.9 million available-for-sale investment securities portfolio. In assessing the impairment of investment securities, we consider the length of time and extent to which the fair value has been less than cost, the financial condition and near-term prospects of the issuers, whether the market decline was affected by macroeconomic conditions and whether we have the intent to sell the security or will be required to sell the security before its anticipated recovery. We also use economic models to assist in the valuation of some of our investment securities. If our investment securities experience a decline in value, we would need to determine whether the decline represented an other-than-temporary impairment, in which case we would be required to record a write-down of the investment and a corresponding charge to our earnings.
Uncertainty about the future of London Inter-bank Offered Rate (“LIBOR”) may adversely affect our business.
In 2017, the Chief Executive of the United Kingdom Financial Conduct Authority (the “Authority”), which regulates LIBOR, announced that the Authority intends to stop persuading or compelling banks to submit rates for the calculation of LIBOR to the administrator of LIBOR after 2021. In response to concerns regarding the future of LIBOR, the Board of Governors of the
12
Federal Reserve System and the Federal Reserve Bank of New York convened the Alternative Reference Rates Committee (“ARRC”) to identify alternatives to LIBOR. The ARRC has recommended a benchmark replacement waterfall to assist issuers in continued capital market entry while safeguarding against LIBOR's discontinuation. The initial steps in the ARRC's recommended provision reference variations of the Secured Overnight Financing Rate (“SOFR”). At this time, it is not possible to predict whether SOFR will attain market traction as a LIBOR replacement. Additionally, it is uncertain if LIBOR will cease to exist after calendar year 2021, or whether additional reforms to LIBOR may be enacted, or whether alternative reference rates will gain market acceptance as a replacement for LIBOR. Further, other central banks have convened working groups to determine replacements or reforms of other interest rate benchmarks, such as Euro Interbank Offered Rate, and it is expected, although not known, that a transition away from the use of certain of these other interest rate benchmarks will occur over the course of the next few years and alternative reference rates will be established. At this time, it is not possible to predict the effect of the Authority’s announcement or other regulatory changes or announcements, any establishment of alternative reference rates, or any other reforms to LIBOR that may be enacted in the United Kingdom, the United States, or elsewhere. The uncertainty regarding the future of LIBOR as well as the transition from LIBOR to another benchmark rate or rates could have adverse impacts on floating-rate obligations, loans, deposits, derivatives, and other financial instruments that currently use LIBOR as a benchmark rate and, ultimately, adversely affect the Company’s financial condition and results of operations.
The implementation of CECL, including the design and maintenance of related internal controls over financial reporting, will require a significant amount of time and resources which may have a material impact on our results of operations.
A new accounting standard adopted by FASB, referred to as Current Expected Credit Loss, or (“CECL”), will require financial institutions, like the Bank, to determine periodic estimates of lifetime expected credit losses on loans, and recognize the expected credit loses as allowances for loan and lease losses beginning with our fiscal year ending December 31, 2023. Current GAAP requires an incurred loss methodology for recognizing credit losses that delays recognition until it is probable a loss has been incurred. CECL will represent a significant change in methodology and may greatly increase the types of data we will need to collect and review to determine the appropriate level of the allowance for loan and lease losses. We are in the process of evaluating the impact of the adoption of this guidance on our financial statements. However, the allowance for loan and lease losses may increase upon the adoption of CECL and any such increased allowance level would decrease shareholders' equity and the Company's and Bank's regulatory capital ratios.
A significant amount of time and resources may be needed to implement CECL effectively, including the design and implementation of adequate internal controls, which may adversely affect our results of operations. If we are unable to maintain effective internal control over financial reporting relating to CECL, or otherwise, our ability to report our financial condition and results of operations accurately and on a timely basis could also be adversely affected.
Because our business is highly dependent on technology that is subject to rapid change and transformation, we are subject to risks of obsolescence.
The Bank conducts its deposit gathering activities and a significant portion of its residential mortgage lending activities through the Internet. The financial services industry is undergoing rapid technological change, and we face constant evolution of customer demand for technology-driven financial and banking products and services. Many of our competitors have substantially greater resources to invest in technological improvement and product development, marketing and implementation. Any failure to successfully keep pace with and fund technological innovation in the markets in which we compete could have a material adverse effect on our business, financial condition and results of operations.
We may need additional capital resources in the future, and these capital resources may not be available when needed or at all, without which our financial condition, results of operations and prospects could be materially impaired.
If we continue to experience significant growth, we may need to raise additional capital. Our ability to raise capital, if needed, will depend upon our financial performance and conditions in the capital markets, as well as economic conditions generally. Accordingly, such financing may not be available to us on acceptable terms or at all. If we cannot raise additional capital when needed, it could have a material adverse effect on our business, financial condition and results of operations.
The competitive nature of the banking and financial services industry could negatively affect our ability to increase or maintain our market share and retain long-term profitability.
Competition in the banking and financial services industry is strong. We compete with commercial banks, savings institutions, mortgage brokerage firms, credit unions, finance companies, financial technology companies, mutual funds, insurance companies and securities brokerage and investment banking firms operating locally and nationwide. Some of our competitors have greater name recognition and market presence than we do and offer certain services that we do not or cannot provide. In
13
addition, larger competitors may be able to price loans and deposits more aggressively than we do, which could affect our ability to increase our market share and remain profitable on a long-term basis. Our success will depend on the ability of the Bank to compete successfully on a long-term basis within the financial services industry.
We rely on our management team and could be adversely affected by the unexpected loss of key officers.
Our future success and profitability are substantially dependent upon our management and the abilities of our senior executives. We believe that our future results will also depend in part upon our ability to attract and retain highly skilled and qualified management. Competition for senior personnel is intense, and we may not be successful in attracting and retaining such personnel. Changes in key personnel and their responsibilities may be disruptive to our business and could have a material adverse effect on our business, financial condition and results of operations. In particular, the loss of our chief executive officer could have a material adverse effect on our business, financial condition and results of operations.
Fluctuations in interest rates could reduce our profitability and affect the value of our assets.
Like other financial institutions, we are subject to interest rate risk. Our primary source of income is net interest income, which is the difference between interest earned on loans and investments and interest paid on deposits and borrowings. We expect that we will periodically experience imbalances in the interest rate sensitivities of our assets and liabilities and the relationships of various interest rates to each other. Over any defined period of time, our interest-earning assets may be more sensitive to changes in market interest rates than our interest-bearing liabilities, or vice-versa. In addition, the individual market interest rates underlying our loan and deposit products may not change to the same degree over a given time period. In any event, if market interest rates should move contrary to our position, earnings may be negatively affected. In addition, loan volume and quality and deposit volume and mix can be affected by market interest rates, as can the businesses of our clients. Changes in levels of market interest rates could have a material adverse effect on our net interest spread, asset quality, loan origination volume, deposit gathering efforts and overall profitability.
Market interest rates are beyond our control, and they fluctuate in response to economic conditions and the policies of various governmental and regulatory agencies, in particular, the Federal Reserve. Changes in monetary policy, including changes in interest rates, may negatively affect our ability to originate loans, the value of our assets and our ability to realize gains from the sale of our assets, all of which ultimately could affect our earnings.
An inadequate allowance for loan losses would reduce our earnings and adversely affect our financial condition and results of operations.
Our success depends to a significant extent upon the quality of our assets, particularly the credit quality of our loans. In originating loans, there is a substantial likelihood that credit losses will be experienced. We maintain an allowance for loan losses, which is a reserve established through a provision for loan losses charged to expense, that represents management’s best estimate of probable losses inherent in our loan portfolio. The level of the allowance reflects management’s continuing evaluation of industry concentrations; specific credit risks; loan loss experience; current loan portfolio quality; present economic, political and regulatory conditions; and unidentified losses inherent in the current loan portfolio. The determination of the appropriate level of the allowance for loan losses inherently involves a high degree of subjectivity and judgment and requires us to make significant estimates of current credit risks and future trends, all of which may undergo material changes. Changes in such estimates may have a significant impact on our financial statements. The allowance our management has established for loan losses may not be adequate to absorb losses in our loan portfolio. Continuing deterioration of economic conditions affecting borrowers, new information regarding existing loans, identification of additional problem loans and other factors, both within and outside our control, may require an increase in the allowance for loan losses.
Bank regulatory agencies periodically review our allowance for loan losses and may require us to increase our provision for loan losses or recognize further loan charge-offs, based on judgments different than those of our management. To the extent required charge-offs in future periods exceed the allowance for loan losses, we may need additional provisions to increase the allowance. Any increases in the allowance for loan losses will result in a decrease in net income, which would negatively impact capital, and may have a material adverse effect on our business, results of operations, financial condition and prospects.
14
Consumer loans in our portfolio generally have greater risk of loss or default than residential real estate loans and may make it necessary to increase our provision for loan losses.
At December 31, 2019, our consumer loans, excluding residential mortgage loans and home equity loans, totaled $295.3 million, representing approximately 10.0% of our total loan portfolio at such date. A substantial portion of our consumer loans are horse trailer and recreational vehicle loans acquired through our indirect dealer network. Consumer loans generally have a greater risk of loss or default than do residential mortgage loans, particularly in the case of loans that are secured by depreciating assets such as horse trailers and recreational vehicles. In such cases, any repossessed collateral for a defaulted consumer loan may not provide an adequate source of repayment of the outstanding loan balance as a result of the greater likelihood of damage, loss or depreciation. In addition, consumer loan collections are dependent on the borrower’s continuing financial stability, and thus are more likely to be adversely affected by job loss, divorce, illness or personal bankruptcy. Furthermore, the application of various federal and state laws, including federal and state bankruptcy and insolvency laws, may limit the amount which can be recovered on such loans. It may become necessary to increase our provision for loan losses in the event that our losses on these loans increase, which would reduce our earnings and could have a material adverse effect on our business, financial condition and results of operations.
Portions of our commercial lending activities are geographically concentrated in Central Indiana and adjacent markets, and changes in local economic conditions may impact their performance.
We offer our residential mortgage and consumer lending as well as public finance, healthcare finance, small business lending and single tenant financing products and services throughout the United States. However, we serve CRE and C&I borrowers primarily in Central Indiana and adjacent markets. Accordingly, the performance of our CRE and C&I lending depends upon demographic and economic conditions in those regions. The profitability of our CRE and C&I loan portfolio may be impacted by changes in those conditions. Additionally, unfavorable local economic conditions could reduce or limit the growth rate of our CRE and C&I loan portfolios for a significant period of time, or otherwise decrease the ability of those borrowers to repay their loans, which could have a material adverse effect on our business, financial condition and results of operations.
Because of our holding company structure, we depend on capital distributions from the Bank to fund our operations.
We are a separate and distinct legal entity from the Bank and have no business activities other than our ownership of the Bank. As a result, we primarily depend on dividends, distributions and other payments from the Bank to fund our obligations. The ability of the Bank to pay dividends to us is limited by state and federal law and depends generally on the Bank’s ability to generate net income. If we are unable to comply with applicable provisions of these statutes and regulations, the Bank may not be able to pay dividends to us, we would not be able to pay dividends on our outstanding common stock and our ability to service our debt would be materially impaired.
Lack of seasoning of our commercial loan portfolios may increase the risk of credit defaults in the future.
Due to our increasing emphasis on CRE, public finance, healthcare finance and small business lending, a substantial amount of the loans in our commercial loan portfolios and our lending relationships are of relatively recent origin. In general, loans do not begin to show signs of credit deterioration or default until they have been outstanding for some period of time, a process referred to as “seasoning.” A portfolio of older loans will usually behave more predictably than a newer portfolio. As a result, because a large portion of our commercial loan portfolio is relatively new, the current level of delinquencies and defaults may not be representative of the level that will prevail when the portfolio becomes more seasoned, which may be higher than current levels. If delinquencies and defaults increase, we may be required to increase our provision for loan losses, which could have a material adverse effect on our business, financial condition and results of operations.
15
A sustained decline in the residential mortgage loan market could reduce loan origination activity or increase delinquencies, defaults and foreclosures, which could adversely affect our financial results.
Historically, our mortgage loan business has provided a significant portion of our noninterest income and our ability to maintain or grow that revenue is dependent upon our ability to originate loans and sell them in the secondary market. Revenue from mortgage banking activities was $11.5 million for the twelve months ended December 31, 2019 and $5.7 million for the twelve months ended December 31, 2018. Mortgage loan originations are sensitive to changes in economic conditions, including decreased economic activity, a slowdown in the housing market, and higher market interest rates, and has historically been cyclical, enjoying periods of strong growth and profitability followed by periods of lower volumes and market-wide losses. During periods of rising interest rates, refinancing originations for many mortgage products tend to decrease as the economic incentives for borrowers to refinance their existing mortgage loans are reduced. In addition, the mortgage loan origination business is affected by changes in real property values. A reduction in real property values could also negatively affect our ability to originate mortgage loans because the value of the real properties underlying the loans is a primary source of repayment in the event of foreclosure. The national market for residential mortgage loan refinancing increased in 2019; however, any future declines could adversely impact our business. Any sustained period of increased delinquencies, foreclosures or losses could harm our ability to originate and sell mortgage loans, and the price received on the sale of such loans, which could have a material adverse effect on our business, financial condition and results of operations.
Reputational risk and social factors may negatively affect us.
Our ability to attract and retain customers is highly dependent upon other external perceptions of our business practices and financial condition. Adverse perceptions could damage our reputation to a level that could lead to difficulties in generating and maintaining lending and deposit relationships and accessing equity or credit markets, as well as increased regulatory scrutiny of our business. Adverse developments or perceptions regarding the business practices or financial condition of our competitors, or our industry as a whole, may also indirectly adversely affect our reputation.
In addition, adverse reputational developments with respect to third parties with whom we have important relationships may negatively affect our reputation. All of the above factors may result in greater regulatory and/or legislative scrutiny, which may lead to laws or regulations that may change or constrain the manner in which we engage with our customers and the products we offer and may also increase our litigation risk. If these risks were to materialize, they could negatively affect our business, financial condition and results of operations.
A failure in or breach of our operational or security systems or infrastructure, or those of our third-party vendors and other service providers, including as a result of cyber-attacks, could disrupt our business, result in the disclosure or misuse of confidential or proprietary information, damage our reputation, increase our costs and cause losses.
We depend upon our ability to process, record and monitor our client transactions on a continuous basis. As customer, public and regulatory expectations regarding operational and information security have increased, our operational systems and infrastructure must continue to be safeguarded and monitored for potential failures, disruptions and breakdowns. Our business, financial, accounting and data processing systems, or other operating systems and facilities, may stop operating properly or become disabled or damaged as a result of a number of factors, including events that are wholly or partially beyond our control. For example, there could be electrical or telecommunications outages; natural disasters such as earthquakes, tornadoes and hurricanes; disease pandemics; events arising from local or larger-scale political or social matters, including terrorist acts; and, as described below, cyber-attacks. Although we have business continuity plans and other safeguards in place, our business operations may be adversely affected by significant and widespread disruption to our physical infrastructure or operating systems that support our business.
Information security risks for financial institutions such as ours have generally increased in recent years in part because of the proliferation of new technologies, the use of the Internet and digital technologies to conduct financial transactions, and the increased sophistication and activities of organized crime, hackers, terrorists, activists and other external parties. As noted above, our operations rely on the secure processing, transmission and storage of confidential information in our computer systems and networks. Our business relies on our digital technologies, computer and email systems, software and networks to conduct its operations. In addition, to access our products and services, our customers may use smartphones, tablets, personal computers and other mobile devices that are beyond our control systems. Although we have information security procedures and controls in place, our technologies, systems, networks and our customers’ devices may become the target of cyber-attacks or information security breaches that could result in the unauthorized release, gathering, monitoring, misuse, loss or destruction of our or our customers’ confidential, proprietary and other information, or otherwise disrupt our or our customers’ or other third parties’ business operations.
16
Third parties with whom we do business or that facilitate our business activities, including financial intermediaries or vendors that provide services or security solutions for our operations, could also be sources of operational and information security risk to us, including from breakdowns or failures of their own systems or capacity constraints. Although to date we have not experienced any material losses relating to cyber-attacks or other information security breaches, there can be no assurance that we will not suffer such losses in the future. Our risk and exposure to these matters remains heightened because of the evolving nature of these threats. As a result, cybersecurity and the continued development and enhancement of our controls, processes and practices designed to protect our systems, computers, software, data and networks from attack, damage or unauthorized access remain a focus for us. As threats continue to evolve, we may be required to expend additional resources to continue to modify or enhance our protective measures or to investigate and remediate information security vulnerabilities.
Disruptions or failures in the physical infrastructure or operating systems that support our business and clients, or cyber-attacks or security breaches of the networks, systems or devices that our clients use to access our products and services, could result in client attrition, regulatory fines, penalties or intervention, reputational damage, claims or litigation, reimbursement or other compensation costs and/or additional compliance costs, any of which could materially and adversely affect our business, financial condition and results of operations.
RISKS RELATING TO THE REGULATION OF OUR INDUSTRY
We operate in a highly regulated environment, which could restrain our growth and profitability.
We are subject to extensive laws and regulations that govern almost all aspects of our operations. These laws and regulations, and the supervisory framework that oversees the administration of these laws and regulations, are primarily intended to protect depositors, the DIF and the banking system as a whole, and not shareholders. These laws and regulations, among other matters, affect our lending practices, capital structure, investment practices, dividend policy, operations and growth. Compliance with the myriad laws and regulations applicable to our organization can be difficult and costly. In addition, these laws, regulations and policies are subject to continual review by governmental authorities, and changes to these laws, regulations and policies, including changes in interpretation or implementation of these laws, regulations and policies, could affect us in substantial and unpredictable ways and often impose additional compliance costs. Further, any new laws, rules and regulations could make compliance more difficult or expensive. All of these laws and regulations, and the supervisory framework applicable to our industry, could have a material adverse effect on our business, financial condition and results of operations.
Federal and state regulators periodically examine our business and we may be required to remediate adverse examination findings.
The Federal Reserve, the FDIC and the DFI periodically examine our business, including our compliance with laws and regulations. If, as a result of an examination, a federal or state banking agency were to determine that our financial condition, capital resources, asset quality, earnings prospects, management, liquidity or other aspects of any of our operations had become unsatisfactory, or that we were in violation of any law or regulation, it may take a number of different remedial actions as it deems appropriate. These actions include the power to enjoin “unsafe or unsound” practices, to require affirmative action to correct any conditions resulting from any violation or practice, to issue an administrative order that can be judicially enforced, to direct an increase in our capital, to restrict our growth, to assess civil monetary penalties against our officers or directors, to remove officers and directors and, if it is concluded that such conditions cannot be corrected or there is an imminent risk of loss to depositors, to terminate our deposit insurance and place us into receivership or conservatorship. Any regulatory action against us could have a material adverse effect on our business, financial condition and results of operations.
Our FDIC deposit insurance premiums and assessments may increase, which would reduce our profitability.
The deposits of the Bank are insured by the FDIC up to legal limits and, accordingly, subject to the payment of FDIC deposit insurance assessments. The Bank’s regular assessments are determined by its risk classification, which is based on a number of factors, including regulatory capital levels, asset growth and asset quality. High levels of bank failures during and following the financial crisis and increases in the statutory deposit insurance limits have increased resolution costs to the FDIC and put significant pressure on the DIF. In order to maintain a strong funding position and restore the reserve ratios of the DIF, the FDIC may increase deposit insurance assessment rates and may charge a special assessment to all FDIC-insured financial institutions. Further increases in assessment rates or special assessments may occur in the future, especially if there are significant additional financial institution failures. Any future special assessments, increases in assessment rates or required prepayments in FDIC insurance premiums could reduce our profitability or limit our ability to pursue certain business opportunities, which could have a material adverse effect on our business, financial condition and results of operations.
17
The long-term impact of regulatory capital rules is uncertain and a significant increase in our capital requirements could have an adverse effect on our business and profitability.
In 2013, the FDIC and the Federal Reserve substantially amended the regulatory risk-based capital rules applicable to the Company and the Bank by implementing the “Basel III” regulatory capital reforms and changes required by the Dodd-Frank Act. The final rule included new minimum risk-based capital and leverage ratios, which became effective for the Company and the Bank in 2015, and refined the definition of what constitutes “capital” for purposes of calculating these ratios. The current minimum capital requirements are: (i) a common equity Tier 1 capital ratio of 7.0%; (ii) a Tier 1 to risk-based assets capital ratio of 8.5%; and (iii) a total capital ratio of 10.5%. The capital conservation buffer requirement began being phased-in in January 2016 at 0.625% of risk-weighted assets and increased by an additional 0.625% each year until fully implemented at 2.5% in January 2019. An institution will be subject to limitations on paying dividends, engaging in share repurchases, and paying discretionary bonuses if its capital level falls below the buffer amount. These limitations establish a maximum percentage of eligible retained income that can be used for such actions.
The application of more stringent capital requirements for both the Company and the Bank could, among other things, result in lower returns on equity, require the raising of additional capital, and result in regulatory actions constraining us from paying dividends or repurchasing shares if we were to be unable to comply with such requirements, any of which could have a material adverse effect on our business and profitability.
We are subject to numerous laws designed to protect consumers, including the CRA and fair lending laws, and failure to comply with these laws could lead to a wide variety of sanctions.
The CRA, the Equal Credit Opportunity Act, the Fair Housing Act and other fair lending laws and regulations impose nondiscriminatory lending requirements on financial institutions. The Department of Justice and other federal agencies are responsible for enforcing these laws and regulations. A successful regulatory challenge to an institution’s performance under the CRA or fair lending laws and regulations could result in a wide variety of sanctions, including damages and civil money penalties, injunctive relief, restrictions on mergers and acquisitions activity, restrictions on expansion and restrictions on entering new business lines. Private parties may also have the ability to challenge an institution’s performance under fair lending laws in private class action litigation. Such actions could have a material adverse effect on our business, financial condition and results of operations.
We are subject to evolving and expensive regulations and requirements. Our failure to adhere to these requirements or the failure or circumvention of our controls and procedures could seriously harm our business.
We are subject to extensive regulation as a financial institution and are also required to follow the corporate governance and financial reporting practices and policies required of a company whose stock is registered under the Exchange Act and listed on the Nasdaq Global Select Market. Compliance with these requirements means we incur significant legal, accounting and other expenses. Compliance also requires a significant diversion of management time and attention, particularly with regard to disclosure controls and procedures and internal control over financial reporting. Although we have reviewed, and will continue to review, our disclosure controls and procedures in order to determine whether they are effective, our controls and procedures may not be able to prevent errors or frauds in the future. Faulty judgments, simple errors or mistakes, or the failure of our personnel to adhere to established controls and procedures may make it difficult for us to ensure that the objectives of the control system will be met. A failure of our controls and procedures to detect other than inconsequential errors or fraud could seriously harm our business and results of operations.
We face a risk of noncompliance with and enforcement action under the BSA and other anti-money laundering statutes and regulations.
The BSA, the USA PATRIOT Act and other laws and regulations require financial institutions, among other duties, to institute and maintain an effective anti-money laundering program and file suspicious activity and currency transaction reports as appropriate. The federal Financial Crimes Enforcement Network is authorized to impose significant civil money penalties for violations of those requirements and has engaged in coordinated enforcement efforts with the individual federal banking regulators, as well as the U.S. Department of Justice, Drug Enforcement Administration and Internal Revenue Service. We are also subject to increased scrutiny of compliance with the rules enforced by the OFAC. If our policies, procedures and systems are deemed deficient, we would be subject to liability, including fines and regulatory actions, which may include restrictions on our ability to pay dividends and the necessity to obtain regulatory approvals to proceed with certain aspects of our business plan, including our acquisition plans. Failure to maintain and implement adequate programs to combat money laundering and terrorist financing could also have serious reputational consequences for us. Any of these results could have a material adverse effect on our business, financial condition and results of operations.
18
RISKS RELATED TO OUR SECURITIES
There is a limited trading market for our common stock and you may not be able to resell your shares.
Our common stock began trading on the Nasdaq Capital Market on February 22, 2013. We have since completed several offerings of our common stock and our securities have been listed on the Nasdaq Global Select Market since September 30, 2016. However, trading remains relatively limited. Although we expect that a more liquid market for our common stock will develop, we cannot guarantee that you would be able to resell shares of our common stock at an attractive price or at all.
The market price of our common stock can be volatile and may decline.
Securities that are not heavily traded can be more volatile than stock trading in an active market. Stock price volatility may make it more difficult for you to resell your common stock when you want and at prices you find attractive. Our stock price can fluctuate significantly and may decline in response to a variety of factors including:
• | actual or anticipated variations in quarterly results of operations; |
• | developments in our business or the financial sector generally; |
• | recommendations by securities analysts; |
• | operating and stock price performance of other companies that investors deem comparable to us; |
• | news reports relating to trends, concerns and other issues in the financial services industry; |
• | perceptions in the marketplace regarding us or our competitors; |
• | new technology used or services offered by competitors; |
• | significant acquisitions or business combinations, strategic partnerships, joint venture or capital commitments by or involving us or our competitors; |
• | failure to integrate acquisitions or realize anticipated benefits from acquisitions; |
• | regulatory changes affecting our industry generally or our business or operations; or |
• | geopolitical conditions such as acts or threats of terrorism or military conflicts. |
General market fluctuations, industry factors and general economic, political and social conditions and events, such as economic slowdowns or recessions, interest rate changes, credit loss trends, natural disasters or disease pandemics could also cause our stock price to decrease regardless of operating results.
Federal banking laws limit the acquisition and ownership of our common stock.
Because we are a bank holding company, any purchaser of certain specified amounts of our common stock may be required to file a notice with or obtain the approval of the Federal Reserve under the BHCA, as amended, and the Change in Bank Control Act of 1978, as amended. Specifically, under regulations adopted by the Federal Reserve, (1) any other bank holding company may be required to obtain the approval of the Federal Reserve before acquiring 5% or more of our common stock and (2) any person may be required to file a notice with and not be disapproved by the Federal Reserve to acquire 10% or more of our common stock and will be required to file a notice with and not be disapproved by the Federal Reserve to acquired 25% or more of our common stock.
Anti-takeover provisions could negatively impact our shareholders.
Provisions of Indiana law and provisions of our articles of incorporation could make it more difficult for a third party to acquire control of us or have the effect of discouraging a third party from attempting to acquire control of us. We are subject to certain anti-takeover provisions under the Indiana Business Corporation Law. Additionally, our articles of incorporation authorize our Board of Directors to issue one or more classes or series of preferred stock without shareholder approval and such preferred stock could be issued as a defensive measure in response to a takeover proposal.
Although these provisions do not preclude a takeover, they may have the effect of discouraging, delaying or deferring a tender offer or takeover attempt that a shareholder might consider in his or her best interest, including those attempts that might result in a premium over the market price of our common stock. Such provisions will also render the removal of the Board of Directors and of management more difficult and, therefore, may serve to perpetuate current management. These provisions could potentially adversely affect the market price of our common stock.
19
Our securities are not insured or guaranteed by the FDIC and as such are subject to loss of entire investment.
Neither shares of our common stock nor indebtedness of our Company are savings accounts, deposits or other obligations of the Bank or any of our nonbank subsidiaries and neither is insured or guaranteed by the FDIC or any other government agency or public or private insurer. An investment in our securities is subject to investment risk and an investor must be capable of affording the loss of the entire investment.
If we were to issue preferred stock or debt securities or undertake other debt financing, the rights of holders of our common stock and the value of such common stock could be adversely affected.
Our Board of Directors is authorized to issue classes or series of preferred stock and senior or subordinated debt securities or other debt financing, without any action on the part of our shareholders. The Board of Directors also has the power, without shareholder approval, to set the terms of any such classes or series of preferred stock, including voting rights, dividend rights and preferences over our common stock with respect to dividends or upon the liquidation, dissolution or winding-up of our business and other terms. Debt securities or other debt financing may be unsecured or secured by any or all of our assets. If we issue preferred or debt securities, or incur other indebtedness, that has a preference over our common stock with respect to the payment of dividends or upon liquidation, dissolution or winding-up, or if we issue preferred stock with voting rights that dilute the voting power of our common stock, the rights of holders of our common stock or the value of our common stock would be adversely affected.
We may issue additional shares of common or preferred stock in the future, which could dilute existing shareholders.
Our articles of incorporation authorize our Board of Directors, generally without shareholder approval, to, among other things, issue additional shares of common stock up to a total of forty-five million shares or up to five million shares of preferred stock. The issuance of any additional shares of common or preferred stock could be dilutive to a shareholder’s ownership of our common stock. To the extent that currently outstanding options to purchase our common stock are exercised, or to the extent that we issue additional options or warrants to purchase our common stock in the future and the options or warrants are exercised, our shareholders may experience further dilution. In addition, we may issue preferred stock that is convertible into shares of our common stock, and upon conversion would result in our common shareholders’ ownership interest being diluted. Holders of shares of our common stock have no preemptive rights that entitle holders to purchase their pro rata share of any offering of shares of any class or series and, therefore, shareholders may not be permitted to invest in future issuances of common or preferred stock. We and the Bank are required by federal and state regulatory authorities, as applicable, to maintain adequate levels of capital to support our operations. Accordingly, regulatory requirements and/or deterioration in our asset quality may require us to sell common stock to raise capital under circumstances and at prices which result in substantial dilution.
We may not be able to generate sufficient cash to service all of our debt.
Our ability to make scheduled payments of principal and interest, or to satisfy our obligations in respect of our debt or to refinance our debt, will depend on the future performance of our operating subsidiaries. Prevailing economic conditions (including interest rates), regulatory constraints, including, among other things, limiting distributions to us from the Bank and required capital levels with respect to the Bank and certain of our nonbank subsidiaries, and financial, business and other factors, many of which are beyond our control, will also affect our ability to meet these needs. Our subsidiaries may not be able to generate sufficient cash flows from operations, or we may be unable to obtain future borrowings in an amount sufficient to enable us to pay our debt, or to fund our other liquidity needs. We may need to refinance all or a portion of our debt on or before maturity. We may not be able to refinance any of our debt when needed on commercially reasonable terms or at all.
Item 1B. Unresolved Staff Comments
None.
Item 2. Properties
The Company owns an office building at 11201 USA Parkway, Fishers, Indiana 46037 with approximately 52,000 square feet of office space and related real estate located in Fishers, Indiana. This building houses the principal executive offices of the Company and the Bank.
The Bank is currently leasing all of the office space at the Fishers property. The lease is currently scheduled to expire on March 31, 2022 and provides for monthly rent in the amount of $18.50 per square foot.
20
In March 2013, the Company borrowed $4.0 million from the Bank for the purchase of the Company’s principal executive offices. The loan was originally scheduled to mature in March 2014 and had been extended annually through March 2020. In February 2020, the Company entered into an amendment that, among other things, extended its maturity to April 1, 2022. The principal balance of the loan is $3.0 million as of December 31, 2019 and its payment terms are interest only through April 1, 2022. The amounts borrowed under the loan bear interest at a variable rate equal to the then applicable prime rate (as determined by the Bank with reference to the “Prime Rate” published in The Wall Street Journal) plus 1.00% per annum. The loan agreement contains customary warranties and representations, affirmative covenants and events of default. The loan is secured by a first priority mortgage and lien on the property and requires that the Company, at all times, maintain collateral securing the loan with an “as is” market value of not less than 1.3 times the principal balance of the loan.
Item 3. Legal Proceedings
Neither we nor any of our subsidiaries are party to any material legal proceedings. From time to time, the Bank is a party to legal actions arising from its normal business activities.
Item 4. Mine Safety Disclosures
None.
21
PART II
Item 5. | Market for Registrant’s Common Equity, Related Stockholder Matters and Issuer Purchases of Equity Securities |
Market Information
The Company’s common stock trades on the Nasdaq Global Select Market under the symbol “INBK.”
As of March 6, 2020, the Company had 9,754,964 shares of common stock issued and outstanding, and there were 113 holders of record of common stock.
Dividends
The Company began paying regular quarterly cash dividends in 2013. Total dividends declared in 2019 were $0.24 per share. The Company expects to continue to pay cash dividends on a quarterly basis; however, the declaration and amount of any future cash dividends will be subject to the sole discretion of the Board of Directors and will depend upon many factors, including our results of operations, financial condition, capital requirements, regulatory and contractual restrictions (including with respect to the Company’s outstanding subordinated debt), business strategy and other factors deemed relevant by the Board of Directors.
Because the Company is a holding company and does not engage directly in business activities of a material nature, its ability to pay dividends to shareholders depends, in large part, upon the receipt of distributions from the Bank, which is also subject to numerous limitations on the payment of dividends under federal and state banking laws, regulations and policies. The present and future ability of the Bank to distribute funds to the Company are subject to the discretion of the Board of the Directors of the Bank and the Bank is not obligated to pay any distributions to the Company.
Issuer Purchases of Equity Securities
On December 18, 2018 the Company's Board of Directors approved a stock repurchase program authorizing the repurchase of up to $10.0 million of the Company's outstanding common stock from time to time on the open market or in privately negotiated transactions. The stock repurchase program was scheduled to expire on December 31, 2019. Under this program, the Company repurchased 482,970 shares of common stock through September 30, 2019, at an average price of $20.70, for a total repurchase amount of $10.0 million, thus repurchasing the maximum amount of stock authorized by the Company's Board of Directors under this program.
22
Stock Performance Graph
The following graph compares the five-year cumulative total return to shareholders of First Internet Bancorp common stock with that of the Nasdaq Composite Index and the SNL Small Cap U.S. Bank Index. The SNL Small Cap U.S. Bank Index is comprised of publicly traded banking institutions with market capitalizations between $250 million and $1 billion and total assets in a range comparable to the Company.
The following table assumes $100 was invested on December 31, 2014 in First Internet Bancorp, the Nasdaq Composite Index and the SNL Small Cap U.S. Bank Index, and assumes that dividends are reinvested.
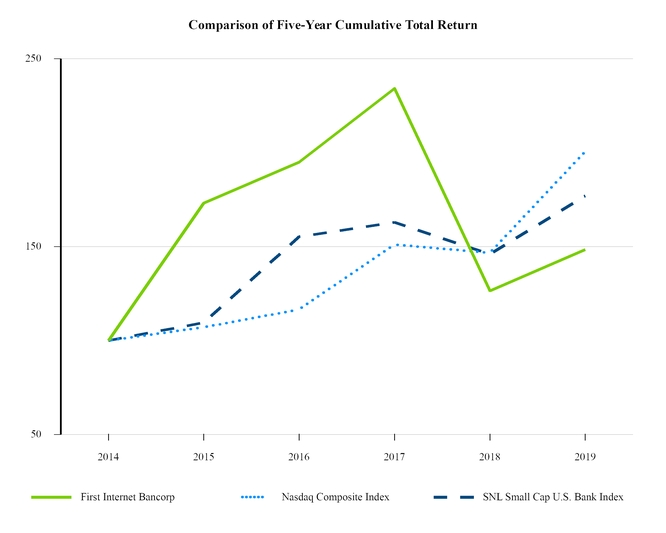
December 31, | |||||||||||||||||||||||
2014 | 2015 | 2016 | 2017 | 2018 | 2019 | ||||||||||||||||||
First Internet Bancorp | $ | 100.00 | $ | 173.06 | $ | 194.87 | $ | 234.08 | $ | 126.47 | $ | 148.38 | |||||||||||
Nasdaq Composite Index | 100.00 | 106.96 | 116.45 | 150.96 | 146.67 | 200.49 | |||||||||||||||||
SNL Small Cap U.S. Bank Index | 100.00 | 109.52 | 155.27 | 162.85 | 145.94 | 176.97 | |||||||||||||||||
23
Item 6. Selected Financial Data
Five Year Selected Financial and Other Data
The following selected consolidated financial and other data is qualified in its entirety by, and should be read in conjunction with, Management’s Discussion and Analysis of Financial Condition and Results of Operations and our consolidated financial statements and the notes thereto contained in this annual report on Form 10-K. Certain reclassifications have been made to prior period financial information as discussed in Note 1 to the consolidated financial statements.
(dollars in thousands, except per share data) | At Or For The Twelve Months Ended December 31, | |||||||||||||||||||
2019 | 2018 | 2017 | 2016 | 2015 | ||||||||||||||||
Balance Sheet Data: | ||||||||||||||||||||
Total assets | $ | 4,100,083 | $ | 3,541,692 | $ | 2,767,687 | $ | 1,854,335 | $ | 1,269,870 | ||||||||||
Cash and cash equivalents | 327,361 | 188,712 | 47,981 | 39,452 | 25,152 | |||||||||||||||
Loans | 2,963,547 | 2,716,228 | 2,091,193 | 1,250,789 | 953,859 | |||||||||||||||
Loans held-for-sale | 56,097 | 18,328 | 51,407 | 27,101 | 36,518 | |||||||||||||||
Total securities | 602,730 | 504,095 | 492,484 | 473,371 | 213,698 | |||||||||||||||
Deposits | 3,153,963 | 2,671,351 | 2,084,941 | 1,462,867 | 956,054 | |||||||||||||||
Tangible common equity 1 | 300,226 | 284,048 | 219,440 | 149,255 | 99,643 | |||||||||||||||
Total shareholders’ equity | 304,913 | 288,735 | 224,127 | 153,942 | 104,330 | |||||||||||||||
Income Statement Data: | ||||||||||||||||||||
Interest income | $ | 147,414 | $ | 115,467 | $ | 84,697 | $ | 58,899 | $ | 41,447 | ||||||||||
Interest expense | 84,447 | 53,200 | 30,715 | 19,210 | 10,694 | |||||||||||||||
Net interest income | 62,967 | 62,267 | 53,982 | 39,689 | 30,753 | |||||||||||||||
Provision for loan losses | 5,966 | 3,892 | 4,872 | 4,330 | 1,946 | |||||||||||||||
Net interest income after provision for loan losses | 57,001 | 58,375 | 49,110 | 35,359 | 28,807 | |||||||||||||||
Noninterest income | 16,789 | 8,760 | 10,541 | 14,077 | 10,141 | |||||||||||||||
Noninterest expense | 46,634 | 43,183 | 36,723 | 31,451 | 25,283 | |||||||||||||||
Income before income taxes | 27,156 | 23,952 | 22,928 | 17,985 | 13,665 | |||||||||||||||
Income tax provision | 1,917 | 2,052 | 7,702 | 5,911 | 4,736 | |||||||||||||||
Net income | $ | 25,239 | $ | 21,900 | $ | 15,226 | $ | 12,074 | $ | 8,929 | ||||||||||
Per Share Data: | ||||||||||||||||||||
Net income | ||||||||||||||||||||
Basic | $ | 2.51 | $ | 2.31 | $ | 2.14 | $ | 2.32 | $ | 1.97 | ||||||||||
Diluted | $ | 2.51 | $ | 2.30 | $ | 2.13 | $ | 2.30 | $ | 1.96 | ||||||||||
Book value per common share | $ | 31.30 | $ | 28.39 | $ | 26.65 | $ | 23.76 | $ | 23.28 | ||||||||||
Tangible book value per common share 1 | $ | 30.82 | $ | 27.93 | $ | 26.09 | $ | 23.04 | $ | 22.24 | ||||||||||
Weighted average common shares outstanding | ||||||||||||||||||||
Basic | 10,041,581 | 9,490,506 | 7,118,628 | 5,211,209 | 4,528,528 | |||||||||||||||
Diluted | 10,044,483 | 9,508,653 | 7,149,302 | 5,239,082 | 4,554,219 | |||||||||||||||
Common shares outstanding at end of period | 9,741,800 | 10,170,778 | 8,411,077 | 6,478,050 | 4,481,347 | |||||||||||||||
Dividends declared per share | $ | 0.24 | $ | 0.24 | $ | 0.24 | $ | 0.24 | $ | 0.24 | ||||||||||
Dividend payout ratio 2 | 9.56 | % | 10.43 | % | 11.27 | % | 10.43 | % | 12.24 | % | ||||||||||
___________________________________
1 | Refer to the “Reconciliation of Non-GAAP Financial Measures” section of Item 7 of Part II of this report, Management's Discussion and Analysis of Financial Condition and Results of Operations. |
2 | Dividends per share divided by diluted earnings per share. |
24
At Or For The Twelve Months Ended December 31, | |||||||||||||||
2019 | 2018 | 2017 | 2016 | 2015 | |||||||||||
Performance Ratios: | |||||||||||||||
Return on average assets | 0.65 | % | 0.72 | % | 0.66 | % | 0.74 | % | 0.81 | % | |||||
Return on average shareholders’ equity | 8.52 | % | 8.44 | % | 8.54 | % | 9.74 | % | 8.89 | % | |||||
Return on average tangible common equity 1 | 8.65 | % | 8.60 | % | 8.77 | % | 10.12 | % | 9.33 | % | |||||
Net interest margin 2 | 1.65 | % | 2.09 | % | 2.39 | % | 2.49 | % | 2.85 | % | |||||
Net interest margin FTE 1, 3 | 1.82 | % | 2.25 | % | 2.57 | % | 2.53 | % | 2.87 | % | |||||
Noninterest expense to average assets | 1.20 | % | 1.41 | % | 1.59 | % | 1.93 | % | 2.28 | % | |||||
Asset Quality Ratios: | |||||||||||||||
Nonperforming loans to total loans | 0.23 | % | 0.03 | % | 0.04 | % | 0.09 | % | 0.02 | % | |||||
Nonperforming assets to total assets | 0.22 | % | 0.10 | % | 0.21 | % | 0.31 | % | 0.37 | % | |||||
Nonperforming assets (including performing troubled debt restructurings) to total assets | 0.23 | % | 0.11 | % | 0.23 | % | 0.35 | % | 0.46 | % | |||||
Allowance for loan losses to total loans | 0.74 | % | 0.66 | % | 0.72 | % | 0.88 | % | 0.88 | % | |||||
Net charge-offs (recoveries) to average loans | 0.07 | % | 0.04 | % | 0.05 | % | 0.15 | % | (0.07 | )% | |||||
Allowance for loan losses to nonperforming loans | 324.4 | % | 2,013.1 | % | 1,784.3 | % | 1,013.9 | % | 5,000.6 | % | |||||
Capital Ratios: | |||||||||||||||
Total shareholders' equity to assets | 7.44 | % | 8.15 | % | 8.10 | % | 8.30 | % | 8.22 | % | |||||
Tangible common equity to tangible assets 1 | 7.33 | % | 8.03 | % | 7.94 | % | 8.07 | % | 7.88 | % | |||||
Tier 1 leverage ratio 4 | 7.64 | % | 9.00 | % | 8.45 | % | 8.65 | % | 8.28 | % | |||||
Common equity tier 1 capital ratio 4, 5 | 10.84 | % | 12.39 | % | 11.43 | % | 11.54 | % | 10.11 | % | |||||
Tier 1 capital ratio 4 | 10.84 | % | 12.39 | % | 11.43 | % | 11.54 | % | 10.11 | % | |||||
Total risk-based capital ratio 4 | 13.99 | % | 14.53 | % | 14.07 | % | 15.01 | % | 12.25 | % | |||||
Other Data: | |||||||||||||||
Full-time equivalent employees | 229 | 201 | 206 | 192 | 152 | ||||||||||
Number of banking and loan production offices | 2 | 2 | 2 | 2 | 3 | ||||||||||
___________________________________
1 | Refer to the “Reconciliation of Non-GAAP Financial Measures” section of Item 7 of Part II of this report, Management's Discussion and Analysis of Financial Condition and Results of Operations. |
2 | Net interest margin is net interest income divided by average earning assets. |
3 | On an FTE basis assuming a 21% tax rate in 2019 and 2018 and a 35% tax rate in 2017, 2016 and 2015. Net interest income is adjusted to reflect income from assets such as municipal loans and securities that are exempt from Federal income taxes. This is to recognize the income tax savings that facilitates a comparison between taxable and tax-exempt assets. The Company believes that it is a standard practice in the banking industry to present net interest margin and net interest income on a fully-taxable equivalent basis as these measures provide useful information to make peer comparisons. |
4 | Capital ratios are calculated in accordance with regulatory guidelines specified by our primary federal banking regulatory authority. |
5 | Introduced as part of the final implementation of the “Basel III” regulatory capital reforms as of January 1, 2015. |
25
Item 7. Management’s Discussion and Analysis of Financial Condition and Results of Operations
The following discussion and analysis of our financial condition and results of operations should be read in conjunction with our consolidated financial statements and related notes appearing elsewhere in this report. This discussion and analysis includes certain forward-looking statements that involve risks, uncertainties and assumptions. You should review the “Risk Factors” section of this report for a discussion of important factors that could cause actual results to differ materially from the results described in or implied by such forward-looking statements. See “Cautionary Note Regarding Forward-Looking Statements” at the beginning of this report.
Overview
We offer a wide range of commercial, small business, consumer and municipal banking products and services. We conduct our consumer and small business deposit operations primarily through online channels on a nationwide basis and have no traditional branch offices. Our residential mortgage products are offered nationwide primarily through an online direct-to-consumer platform and are supplemented with Central Indiana-based mortgage and construction lending. Our consumer lending products are primarily originated on a nationwide basis over the Internet as well as through relationships with dealerships and financing partners.
Our commercial banking products and services are delivered through a relationship banking model and include commercial real estate (“CRE”) banking, commercial and industrial (“C&I”) banking, public finance, healthcare finance, small business lending and commercial deposits and treasury management. Through our CRE team, we offer single tenant lease financing on a nationwide basis in addition to traditional investor CRE and construction loans primarily within Central Indiana and adjacent markets. To meet the needs of commercial borrowers and depositors located primarily in Central Indiana, Phoenix, Arizona and adjacent markets, our C&I banking team provides credit solutions such as lines of credit, term loans, owner-occupied CRE loans and corporate credit cards. Our public finance team provides a range of public and municipal lending and leasing products to government entities on a nationwide basis. Our healthcare finance team was established in conjunction with our strategic partnership with Lendeavor, Inc., a San Francisco-based technology-enabled lender to healthcare practices, and provides lending for healthcare practice finance or acquisition, acquisition or refinancing owner-occupied CRE and equipment purchases. This portfolio segment is generally concentrated in the Western and Southwestern regions of the United States with plans to continue expanding nationwide. Our commercial deposits and treasury management team works with the other commercial teams to provide deposit products and treasury management services to our commercial and municipal lending customers as well as pursues commercial deposit opportunities in business segments where we have no credit relationships.
In 2018, we identified small business as an area for potential growth in loans, revenue and deposits. We believe that we can differentiate ourselves from larger financial institutions through providing a full suite of services to emerging small businesses and entrepreneurs. We have begun adding experienced personnel to build out our capabilities in small business lending and U.S. government guaranteed lending programs, including loans originated under the Small Business Administration (“SBA”) guidelines. To accelerate our efforts in this area, on November 1, 2019, we acquired a loan portfolio, a servicing portfolio and a team of experienced small business lending servicing professionals from First Colorado National Bank. As of December 31, 2019, the principal balance of loans acquired was approximately $32.9 million and was comprised primarily of SBA 7(a) loans while the principal balance of the servicing portfolio acquired was approximately $104.0 million and consisted of guaranteed SBA 7(a) loans sold in the secondary market. We expect to continue adding personnel to build out a nationwide small business platform.
Results of Operations
Refer to Item 6 of this report for a summary of the Company's financial performance for the five most recent years.
During the twelve months ended December 31, 2019, net income was $25.2 million, or $2.51 per diluted share, compared to net income of $21.9 million, or $2.30 per diluted share, for the twelve months ended December 31, 2018 and net income of $15.2 million, or $2.13 per diluted share, for the twelve months ended December 31, 2017.
The $3.3 million increase in net income for the twelve months ended December 31, 2019 compared to the twelve months ended December 31, 2018 was due primarily to an $8.0 million increase in noninterest income, a $0.7 million increase in net interest income and a $0.1 million decrease in income tax expense, but was partially offset by a $3.5 million increase in noninterest expense and a $2.1 million increase in provision for loan losses.
26
The increase in net income of $6.7 million for the twelve months ended December 31, 2018 compared to the twelve months ended December 31, 2017 was due primarily to an $8.3 million increase in net interest income, a $5.7 million decrease in income tax expense and a $1.0 million decrease in provision for loan losses, but was partially offset by a $6.5 million increase in noninterest expense and a $1.8 million decrease in noninterest income.
During the twelve months ended December 31, 2019, return on average assets was 0.65%, compared to 0.72% for the twelve months ended December 31, 2018 and 0.66% for the twelve months ended December 31, 2017. During the twelve months ended December 31, 2019, return on average shareholders’ equity was 8.52%, compared to 8.44% for the twelve months ended December 31, 2018 and 8.54% for the twelve months ended December 31, 2017.
In 2018, the Company recorded a $2.4 million write-down of a commercial other real estate owned property that consists of two buildings. The revaluation of the other real estate owned was driven by deteriorating conditions in the market where the property is located and the commencement of a marketing strategy to move the property off the Company's balance sheet. As a result, this write-down decreased 2018 net income by $1.9 million and diluted earnings per share by $0.20. Adjusted for the write-down, 2018 net income was $23.8 million and diluted earnings per share was $2.50. The write-down also decreased return on average assets by 6 basis points (“bps”) and return on average shareholders' equity by 74 bps. Adjusted for the write-down, 2018 return on average assets was 0.78% and return on average shareholders' equity was 9.18%. Refer to the “Reconciliation of Non-GAAP Financial Measures” section of Item 7 of Part II of this report, Management's Discussion and Analysis of Financial Condition and Results of Operations.
In 2017, as a result of the Tax Cuts and Jobs Act (“Tax Act”), the Company’s net deferred tax asset (“net DTA”) was revalued as of December 31, 2017. The value of the net DTA was reduced by $1.8 million with the amount of the reduction recognized as additional income tax expense in 2017. Consequently, this revaluation decreased 2017 diluted earnings per share by $0.26. Adjusted for the net DTA revaluation, 2017 net income was $17.1 million and diluted earnings per share were $2.39. The revaluation also decreased return on average assets by 8 bps and return on average shareholders' equity by 104 bps. Adjusted for the net DTA revaluation, 2017 return on average assets was 0.74% and return on average shareholders' equity was 9.58%. Refer to the “Reconciliation of Non-GAAP Financial Measures” section of Item 7 of Part II of this report, Management’s Discussion and Analysis of Financial Condition and Results of Operations.
27
Consolidated Average Balance Sheets and Net Interest Income Analyses
For the periods presented, the following tables provide the average balances of interest-earning assets and interest-bearing liabilities and the related yields and cost of funds. The tables do not reflect any effect of income taxes. Balances are based on the average of daily balances. Nonaccrual loans are included in average loan balances.
Twelve Months Ended | |||||||||||||||||||||||||||||||||
December 31, 2019 | December 31, 2018 | December 31, 2017 | |||||||||||||||||||||||||||||||
(dollars in thousands) | Average Balance | Interest/Dividends | Yield/Cost | Average Balance | Interest/Dividends | Yield/Cost | Average Balance | Interest/Dividends | Yield/Cost | ||||||||||||||||||||||||
Assets | |||||||||||||||||||||||||||||||||
Interest-earning assets | |||||||||||||||||||||||||||||||||
Loans, including loans held-for-sale | $ | 2,894,174 | $ | 122,228 | 4.22 | % | $ | 2,382,504 | $ | 99,082 | 4.16 | % | $ | 1,682,249 | $ | 70,465 | 4.19 | % | |||||||||||||||
Securities - taxable | 462,704 | 13,807 | 2.98 | % | 391,958 | 10,630 | 2.71 | % | 400,449 | 10,036 | 2.51 | % | |||||||||||||||||||||
Securities - non-taxable | 97,613 | 2,595 | 2.66 | % | 94,072 | 2,810 | 2.99 | % | 95,694 | 2,786 | 2.91 | % | |||||||||||||||||||||
Other earning assets | 355,412 | 8,784 | 2.47 | % | 116,074 | 2,945 | 2.54 | % | 79,461 | 1,410 | 1.77 | % | |||||||||||||||||||||
Total interest-earning assets | 3,809,903 | 147,414 | 3.87 | % | 2,984,608 | 115,467 | 3.87 | % | 2,257,853 | 84,697 | 3.75 | % | |||||||||||||||||||||
Allowance for loan losses | (19,891 | ) | (16,097 | ) | (12,964 | ) | |||||||||||||||||||||||||||
Noninterest earning-assets | 100,696 | 86,713 | 68,580 | ||||||||||||||||||||||||||||||
Total assets | $ | 3,890,708 | $ | 3,055,224 | $ | 2,313,469 | |||||||||||||||||||||||||||
Liabilities | |||||||||||||||||||||||||||||||||
Interest-bearing liabilities | |||||||||||||||||||||||||||||||||
Interest-bearing demand deposits | $ | 118,874 | $ | 882 | 0.74 | % | $ | 90,229 | $ | 583 | 0.65 | % | $ | 89,081 | $ | 488 | 0.55 | % | |||||||||||||||
Savings accounts | 35,751 | 398 | 1.11 | % | 51,333 | 585 | 1.14 | % | 39,393 | 342 | 0.87 | % | |||||||||||||||||||||
Money market accounts | 637,360 | 12,661 | 1.99 | % | 544,802 | 8,803 | 1.62 | % | 415,910 | 4,227 | 1.02 | % | |||||||||||||||||||||
Certificates and brokered deposits | 2,146,637 | 55,372 | 2.58 | % | 1,585,673 | 32,513 | 2.05 | % | 1,169,219 | 18,918 | 1.62 | % | |||||||||||||||||||||
Total interest-bearing deposits | 2,938,622 | 69,313 | 2.36 | % | 2,272,037 | 42,484 | 1.87 | % | 1,713,603 | 23,975 | 1.40 | % | |||||||||||||||||||||
Other borrowed funds | 564,757 | 15,134 | 2.68 | % | 468,411 | 10,716 | 2.29 | % | 376,470 | 6,740 | 1.79 | % | |||||||||||||||||||||
Total interest-bearing liabilities | 3,503,379 | 84,447 | 2.41 | % | 2,740,448 | 53,200 | 1.94 | % | 2,090,073 | 30,715 | 1.47 | % | |||||||||||||||||||||
Noninterest-bearing deposits | 44,682 | 45,562 | 35,043 | ||||||||||||||||||||||||||||||
Other noninterest-bearing liabilities | 46,265 | 9,798 | 10,141 | ||||||||||||||||||||||||||||||
Total liabilities | 3,594,326 | 2,795,808 | 2,135,257 | ||||||||||||||||||||||||||||||
Shareholders' equity | 296,382 | 259,416 | 178,212 | ||||||||||||||||||||||||||||||
Total liabilities and shareholders' equity | $ | 3,890,708 | $ | 3,055,224 | $ | 2,313,469 | |||||||||||||||||||||||||||
Net interest income | $ | 62,967 | $ | 62,267 | $ | 53,982 | |||||||||||||||||||||||||||
Interest rate spread1 | 1.46 | % | 1.93 | % | 2.28 | % | |||||||||||||||||||||||||||
Net interest margin2 | 1.65 | % | 2.09 | % | 2.39 | % | |||||||||||||||||||||||||||
Net interest margin - FTE3 | 1.82 | % | 2.25 | % | 2.57 | % | |||||||||||||||||||||||||||
1 Yield on total interest-earning assets minus cost of total interest-bearing liabilities
2 Net interest income divided by average interest-earning assets
3 On a fully-taxable equivalent ("FTE") basis assuming a 21% tax rate in 2019 and 2018 and a 35% tax rate in 2017. Refer to the "Reconciliation of Non-GAAP Financial Measures" section of Item 7 of Part II of this report, Management's Discussion and Analysis of Financial Condition and Results of Operations
28
Rate/Volume Analysis
The following table illustrates the impact of changes in the volume of interest-earning assets and interest-bearing liabilities and interest rates on net interest income for the periods indicated. The change in interest not due solely to volume or rate has been allocated in proportion to the absolute dollar amounts of the change in each.
Rate/Volume Analysis of Net Interest Income | ||||||||||||||||||||||||
Twelve Months Ended December 31, 2019 vs. December 31, 2018 Due to Changes in | Twelve Months Ended December 31, 2018 vs. December 31, 2017 Due to Changes in | |||||||||||||||||||||||
(amounts in thousands) | Volume | Rate | Net | Volume | Rate | Net | ||||||||||||||||||
Interest income | ||||||||||||||||||||||||
Loans, including loans held-for-sale | $ | 21,689 | $ | 1,457 | $ | 23,146 | $ | 29,126 | $ | (509 | ) | $ | 28,617 | |||||||||||
Securities – taxable | 2,047 | 1,130 | 3,177 | (212 | ) | 806 | 594 | |||||||||||||||||
Securities – non-taxable | 103 | (318 | ) | (215 | ) | (49 | ) | 73 | 24 | |||||||||||||||
Other earning assets | 5,922 | (83 | ) | 5,839 | 789 | 746 | 1,535 | |||||||||||||||||
Total | 29,761 | 2,186 | 31,947 | 29,654 | 1,116 | 30,770 | ||||||||||||||||||
Interest expense | ||||||||||||||||||||||||
Interest-bearing deposits | 14,172 | 12,657 | 26,829 | 9,117 | 9,392 | 18,509 | ||||||||||||||||||
Other borrowed funds | 2,417 | 2,001 | 4,418 | 1,855 | 2,121 | 3,976 | ||||||||||||||||||
Total | 16,589 | 14,658 | 31,247 | 10,972 | 11,513 | 22,485 | ||||||||||||||||||
Increase (decrease) in net interest income | $ | 13,172 | $ | (12,472 | ) | $ | 700 | $ | 18,682 | $ | (10,397 | ) | $ | 8,285 | ||||||||||
2019 v. 2018
Net interest income for the twelve months ended December 31, 2019 was $63.0 million, an increase of $0.7 million, or 1.1%, compared to $62.3 million for the twelve months ended December 31, 2018. The increase in net interest income was the result of a $31.9 million, or 27.7%, increase in total interest income to $147.4 million for the twelve months ended December 31, 2019 compared to $115.5 million for the twelve months ended December 31, 2018. The increase in total interest income was partially offset by a $31.2 million, or 58.7%, increase in total interest expense to $84.4 million for the twelve months ended December 31, 2019 compared to $53.2 million for the twelve months ended December 31, 2018.
The increase in total interest income was due primarily to an increase in interest earned on loans resulting from an increase of $511.7 million, or 21.5%, in the average balance of loans, including loans held-for-sale, and a 6 bp increase in the yield earned on loans for the twelve months ended December 31, 2019 compared to the twelve months ended December 31, 2018. The increase in the average balance of loans was driven largely by higher average balances in the public finance, healthcare finance and single tenant lease financing portfolios. Further, the average balance of other earning assets increased $239.3 million during 2019 compared to 2018, primarily due to the Company carrying higher cash balances, which resulted in increased income from other earning assets. Finally, the average balance of the securities portfolio increased $74.3 million, or 15.3%, and the yield earned on the securities portfolio increased 16 bps, both of which contributed to increased interest income on the portfolio during 2019 compared to 2018.
The increase in total interest expense was driven primarily by an increase in interest expense related to interest-bearing deposits as a result of a $666.6 million, or 29.3%, increase in the average balance of interest-bearing deposits for the twelve months ended December 31, 2019 compared to the twelve months ended December 31, 2018, and an increase of 49 bps in the cost of funds related to these deposits. The increase in the average balance of interest-bearing deposits was due primarily to higher average balances in brokered deposits, certificates of deposit and money market accounts. Interest expense related to other borrowed funds also contributed to the increase in total interest expense, due to a $96.3 million, or 20.6%, increase in the average balance of other borrowed funds for the twelve months ended December 31, 2019 compared to the twelve months ended December 31, 2018 and an increase of 39 bps in the cost of other borrowed funds.
Net interest margin was 1.65% for the twelve months ended December 31, 2019 compared to 2.09% for the twelve months ended December 31, 2018. The decrease in net interest margin was due primarily to a 47 bp increase in the cost of interest-bearing liabilities. An increase in market interest rates and an increase in deposit competition during the second half of 2018 drove deposit rates higher and contributed to increased costs associated with certificates of deposits and money market account in 2019 compared to 2018. Further, during mid-to-late 2018, the Company initiated a liability hedging strategy using pay fixed/receive variable interest rate swaps intended to extend the duration of brokered variable rate money market deposits to increase asset sensitivity,
29
reduce long-term interest rate risk and reduce volatility in total shareholders’ equity due to the impact of changes in interest rates on other comprehensive income (loss). This long-term funding strategy also contributed to the increase in cost of deposit funding during 2019. The cost of funds related to other borrowed funds increased as we used longer-term Federal Home Loan Bank advances in 2019 and 2018 to extend the duration of liabilities and reduce long-term interest rate risk. Additionally, the cost of other borrowed funds was impacted by the issuance of $37.0 million of 6.0% fixed-to-floating rate subordinated notes in June 2019.
2018 v. 2017
Net interest income for the twelve months ended December 31, 2018 was $62.3 million, an increase of $8.3 million, or 15.3%, compared to $54.0 million for the twelve months ended December 31, 2017. The increase in net interest income was the result of a $30.8 million, or 36.3%, increase in total interest income to $115.5 million for the twelve months ended December 31, 2018 compared to $84.7 million for the twelve months ended December 31, 2017. The increase in total interest income was partially offset by an $22.5 million, or 73.2%, increase in total interest expense to $53.2 million for the twelve months ended December 31, 2018 compared to $30.7 million for the twelve months ended December 31, 2017.
The increase in total interest income was due primarily to an increase in interest earned on loans resulting from an increase of $700.3 million, or 41.6%, in the average balance of loans, including loans held-for-sale, as well as an increase in interest earned on securities resulting from a decrease of $10.1 million, or 2.0%, in the average balance of securities for the twelve months ended December 31, 2018 compared to the twelve months ended December 31, 2017. The increase in total interest income was also due to a 19 bp increase in the yield earned on the securities portfolio, partially offset by a decline of 3 bps in the yield earned on loans, including loans held-for-sale.
The increase in total interest expense was driven primarily by an increase in interest expense related to interest-bearing deposits as a result of a $558.4 million, or 32.6%, increase in the average balance of interest-bearing deposits for the twelve months ended December 31, 2018 compared to the twelve months ended December 31, 2017, and an increase of 47 bps in the cost of funds related to these deposits. Interest expense related to other borrowed funds also contributed to the increase in total interest expense, due to a $91.9 million, or 24.4%, increase in the average balance of other borrowed funds for the twelve months ended December 31, 2018 compared to the twelve months ended December 31, 2017, partially offset by an increase of 50 bps in the cost of other borrowed funds.
Net interest margin was 2.09% for the twelve months ended December 31, 2018 compared to 2.39% for the twelve months ended December 31, 2017. The decrease in net interest margin was primarily due to a 47 bp increase in the cost of interest-bearing liabilities, partially offset by a 12 bp increase in the yield on total interest-earning assets. The increase in the cost of total interest-bearing liabilities was due primarily to an increase in average certificates of deposits, money market balances and an increase in the related costs of those deposits. The increase in the cost of these deposits was due primarily to the rise of short-term interest rates throughout 2018. The increase in the yield on interest-earning assets was due primarily to increases in the yields earned on securities and other earning assets, partially offset by a decrease in the yield earned on loans. The decrease in the yield earned on loans was due primarily to continued strong growth in the public finance portfolio which typically has lower tax-exempt interest rates, partially offset by higher yields in other commercial loan categories and residential mortgage loans resulting from higher market interest rates.
Noninterest Income
The following table presents noninterest income for the five most recent years.
Twelve Months Ended December 31, | |||||||||||||||||||
(amounts in thousands) | 2019 | 2018 | 2017 | 2016 | 2015 | ||||||||||||||
Service charges and fees | $ | 885 | $ | 934 | $ | 888 | $ | 818 | $ | 764 | |||||||||
Loan servicing revenue | 166 | — | — | — | — | ||||||||||||||
Mortgage banking activities | 11,541 | 5,718 | 7,836 | 12,398 | 9,000 | ||||||||||||||
Gain on sale of loans | 2,074 | 503 | 395 | — | — | ||||||||||||||
Loss on sale of securities | (458 | ) | — | (8 | ) | — | — | ||||||||||||
Other | 2,581 | 1,605 | 1,430 | 861 | 377 | ||||||||||||||
Total noninterest income | $ | 16,789 | $ | 8,760 | $ | 10,541 | $ | 14,077 | $ | 10,141 | |||||||||
30
2019 v. 2018
During the twelve months ended December 31, 2019, noninterest income totaled $16.8 million, representing an increase of $8.0 million, or 91.7%, compared to $8.8 million for the twelve months ended December 31, 2018. The increase in noninterest income was driven primarily by an increase of $5.8 million, or 101.8%, in revenue from mortgage banking activities, as well as a $1.6 million increase in gain on sale of loans, a $1.0 million increase in other noninterest income and a $0.2 million increase in loan servicing revenue, partially offset by a $0.5 million loss on sale of securities. The increase in mortgage banking revenue was due mainly to an increase in refinancing activity, as mortgage interest rates declined significantly during the year. The increase in gain on sale of loans was due to a higher volume of sales of single tenant lease financing loans and public finance loans, as well as our first sales of SBA 7(a) guaranteed loans. The increase in other noninterest income was mainly the result of the $0.5 million gain on the sale of the Company's Visa Class B shares and $0.4 million of income associated with the Company's temporary ownership of the land described in Note 5 - Premises and Equipment. The $0.5 million loss on sale of securities during the twelve months ended December 31, 2019 resulted from the Company selling lower-yielding agency mortgage-backed and U.S. Government Agency securities with a book value of $30.6 million. The Company did not sell any securities during the twelve months ended December 31, 2018. The Company also began earning loan servicing revenue from the acquired small business lending portfolio, recognizing $0.2 million in the fourth quarter 2019.
2018 v. 2017
During the twelve months ended December 31, 2018, noninterest income totaled $8.8 million, representing a decrease of $1.8 million, or 16.9%, compared to $10.5 million for the twelve months ended December 31, 2017. The decrease in noninterest income was primarily driven by a decrease of $2.1 million, or 27.0%, in mortgage banking activities, partially offset by gains on sale of loans and other noninterest income. The decrease in revenue from mortgage banking activities was due primarily to decreases in mortgage held-for-sale origination and sales volumes, due to a decline in mortgage refinance activity, and a decrease in gain on sale margins.
Noninterest Expense
The following table presents noninterest expense for the five most recent years.
Twelve Months Ended December 31, | |||||||||||||||||||
(amounts in thousands) | 2019 | 2018 | 2017 | 2016 | 2015 | ||||||||||||||
Salaries and employee benefits | $ | 27,014 | $ | 23,174 | $ | 21,164 | $ | 17,387 | $ | 14,271 | |||||||||
Marketing, advertising and promotion | 1,800 | 2,468 | 2,393 | 1,823 | 1,756 | ||||||||||||||
Consulting and professional services | 3,669 | 3,055 | 3,091 | 3,143 | 2,374 | ||||||||||||||
Data processing | 1,338 | 1,233 | 971 | 1,127 | 1,016 | ||||||||||||||
Loan expenses | 1,142 | 942 | 1,027 | 891 | 631 | ||||||||||||||
Premises and equipment | 6,059 | 4,996 | 4,183 | 3,699 | 2,768 | ||||||||||||||
Deposit insurance premium | 1,903 | 1,956 | 1,410 | 1,159 | 643 | ||||||||||||||
Write-down of other real estate owned | — | 2,423 | — | — | — | ||||||||||||||
Other | 3,709 | 2,936 | 2,484 | 2,222 | 1,824 | ||||||||||||||
Total noninterest expense | $ | 46,634 | $ | 43,183 | $ | 36,723 | $ | 31,451 | $ | 25,283 | |||||||||
2019 v. 2018
Noninterest expense for the twelve months ended December 31, 2019 was $46.6 million, compared to $43.2 million for the twelve months ended December 31, 2018. The increase of $3.5 million, or 8.0%, compared to the twelve months ended December 31, 2018 was due primarily to a $3.8 million increase in salaries and employee benefits, a $1.1 million increase in premises and equipment expenses, a $0.8 million increase in other expenses and a $0.6 million increase in consulting and professional services, partially offset by decreases of $2.4 million in write-down of other real estate owned ("OREO") and $0.7 million in marketing, advertising and promotion expense. The increase in salaries and employee benefits was primarily the result of an increase in incentive compensation associated with increased mortgage production and personnel growth. Recent hires in the Company's commercial lending verticals and support areas were generally in higher skilled positions, which contributed to the increase in salaries and benefits expense. Additionally, we had an increase in personnel due to our expansion in the small business lending area. The increase in premises and equipment was due primarily to higher software expenses. The increase in other expense was due primarily to higher OREO operating expense. The increase in consulting and professional services was due primarily to higher recruiting fees and third party loan review fees. The write-down of OREO in 2018 was due to the revaluation
31
of one commercial property, as discussed earlier in the Results of Operations. The decrease in marketing, advertising and promotion expenses was driven by digital marketing initiatives and higher mortgage lead generation costs that occurred in 2018.
2018 v. 2017
Noninterest expense for the twelve months ended December 31, 2018 was $43.2 million, compared to $36.7 million for the twelve months ended December 31, 2017. The increase of $6.5 million, or 17.6%, compared to the twelve months ended December 31, 2017 was primarily due to a $2.4 million write-down of other real estate owned, as well as increases of $2.0 million in salaries and employee benefits, $0.8 million in premises and equipment expenses and $0.5 million in deposit insurance premium expenses. The write-down of other real estate owned was due to the revaluation of one commercial property, consisting of two buildings, driven by deteriorating conditions in the market where the properties are located and the commencement of a marketing strategy to move the property off the Company's balance sheet. The increase in salaries and employee benefits was due primarily to changes in employee mix. Although the number of full-time employees decreased from 2017, recent hires in the Company's commercial lending verticals and support areas were generally in higher skill positions and led to an increase in employee salary and equity compensation expense. Additionally, the Company experienced an increase in benefits expense, primarily related to higher medical, prescription drug and dental insurance claims. These increases were partially offset by a decrease in bonus expense primarily related to a reduction in senior management incentive compensation due to 2018 financial performance being below the targets established under the Company's Annual Bonus Plan for 2018. The increase in premises and equipment was primarily due to technology-related expenses and the increase in deposit insurance premium was due primarily to the Company's year-over-year asset growth, which impacts the formula used by the FDIC to calculate deposit insurance.
Income Taxes
The following table reconciles reported income tax expense to that computed at the statutory federal tax rate for the five most recent years.
Twelve Months Ended December 31, | |||||||||||||||||||
(amounts in thousands) | 2019 | 2018 | 2017 | 2016 | 2015 | ||||||||||||||
Statutory rate times pre-tax income | $ | 5,703 | $ | 5,030 | $ | 8,025 | $ | 6,115 | $ | 4,646 | |||||||||
(Subtract) add the tax effect of: | |||||||||||||||||||
Income from tax-exempt securities and loans | (4,881 | ) | (3,833 | ) | (2,512 | ) | (635 | ) | (132 | ) | |||||||||
State income taxes, net of federal tax effect | 1,285 | 1,164 | 693 | 567 | 154 | ||||||||||||||
Bank-owned life insurance | (198 | ) | (200 | ) | (318 | ) | (159 | ) | (137 | ) | |||||||||
Net deferred tax asset revaluation | — | — | 1,846 | — | — | ||||||||||||||
Tax credits | (181 | ) | (180 | ) | — | — | — | ||||||||||||
Other differences | 189 | 71 | (32 | ) | 23 | 205 | |||||||||||||
Income tax expense | $ | 1,917 | $ | 2,052 | $ | 7,702 | $ | 5,911 | $ | 4,736 | |||||||||
32
2019 v. 2018
The Company recognized income tax expense of $1.9 million in 2019, resulting in an effective tax rate of 7.1%, compared to $2.1 million and an effective tax rate of 8.6% in 2018. The Company's federal statutory tax rate was 21% in 2019 and 2018. In both 2019 and 2018, the variance from the federal statutory rate was due primarily to tax-exempt income, partially offset by state income taxes. Interest income on certain loans or securities issued by governmental, municipal and not-for-profit entities, and earnings from bank-owned life insurance were the primary components of tax-exempt income.
2018 v. 2017
The Company recognized income tax expense of $2.1 million in 2018, resulting in an effective tax rate of 8.6%, compared to $7.7 million and an effective tax rate of 33.6% in 2017. The Company's federal statutory tax rate was 21% in 2018 and 35% in 2017. In 2018, the variance from the federal statutory rate was due primarily to tax-exempt income, partially offset by state income taxes. Interest income on certain loans or securities issued by governmental, municipal and not-for-profit entities, and earnings from bank-owned life insurance were the primary components of tax-exempt income. In 2017, the variance from the federal statutory rate was due primarily to tax-exempt income, partially offset by state income taxes and the net deferred tax asset revaluation as a result of the Tax Act as discussed further in the paragraph below. Excluding the impact of the net deferred tax asset revaluation, income tax expense in 2017 was $5.9 million and the effective tax rate was 25.5%. Refer to the "Reconciliation of Non-GAAP Financial Measures" section of Item 7 of Part II of this report, Management's Discussion and Analysis of Financial Condition and Results of Operations.
On December 22, 2017, the Tax Act was signed into law, significantly reforming the Internal Revenue Code. The Tax Act, among other things, reduced the federal corporate tax rate from 35% to 21%. The reduction of the corporate tax rate resulted in a $1.8 million reduction to our net deferred tax asset in 2017.
33
Financial Condition
The following table presents summary balance sheet data as of the end of the last five years.
(amounts in thousands) | December 31, | |||||||||||||||||||
Balance Sheet Data: | 2019 | 2018 | 2017 | 2016 | 2015 | |||||||||||||||
Total assets | $ | 4,100,083 | $ | 3,541,692 | $ | 2,767,687 | $ | 1,854,335 | $ | 1,269,870 | ||||||||||
Loans | 2,963,547 | 2,716,228 | 2,091,193 | 1,250,789 | 953,859 | |||||||||||||||
Total securities | 602,730 | 504,095 | 492,484 | 473,371 | 213,698 | |||||||||||||||
Loans held-for-sale | 56,097 | 18,328 | 51,407 | 27,101 | 36,518 | |||||||||||||||
Noninterest-bearing deposits | 57,115 | 43,301 | 44,686 | 31,166 | 23,700 | |||||||||||||||
Interest-bearing deposits | 3,096,848 | 2,628,050 | 2,040,255 | 1,431,701 | 932,354 | |||||||||||||||
Total deposits | 3,153,963 | 2,671,351 | 2,084,941 | 1,462,867 | 956,054 | |||||||||||||||
Advances from Federal Home Loan Bank | 514,910 | 525,153 | 410,176 | 189,981 | 190,957 | |||||||||||||||
Total shareholders' equity | 304,913 | 288,735 | 224,127 | 153,942 | 104,330 | |||||||||||||||
Total assets increased $558.4 million, or 15.8%, to $4.1 billion as of December 31, 2019 as compared to $3.5 billion as of December 31, 2018. Balance sheet expansion during 2019 was funded by deposit growth of $482.6 million, or 18.1%. The deposit growth was deployed to fund total loan growth of $247.3 million, or 9.1%, and total securities growth of $98.6 million, or 19.6%. Additionally, cash balances increased $138.6 million, or 73.5%, as we carried a higher level of liquidity during 2019.
We used loan sales and other balance sheet management strategies throughout 2019 to manage overall balance sheet and loan portfolio growth and capital utilization, as well as to help improve profitability and net interest margin. As part of these activities, we sold $291.2 million of portfolio residential mortgage, single tenant lease financing and public finance loans during 2019.
34
Loan Portfolio Analysis
The following table provides information regarding the Company’s loan portfolio as of the end of the last five years.
December 31, | ||||||||||||||||||||||||||||||||||
(dollars in thousands) | 2019 | 2018 | 2017 | 2016 | 2015 | |||||||||||||||||||||||||||||
Commercial loans | ||||||||||||||||||||||||||||||||||
Commercial and industrial | $ | 96,420 | 3.3 | % | $ | 107,405 | 4.0 | % | $ | 121,966 | 5.8 | % | $ | 101,326 | 8.1 | % | $ | 100,299 | 10.5 | % | ||||||||||||||
Owner-occupied commercial real estate | 73,392 | 2.5 | % | 77,569 | 2.9 | % | 71,872 | 3.4 | % | 55,637 | 4.4 | % | 44,462 | 4.7 | % | |||||||||||||||||||
Investor commercial real estate | 12,567 | 0.4 | % | 5,391 | 0.2 | % | 7,273 | 0.4 | % | 13,181 | 1.0 | % | 16,184 | 1.7 | % | |||||||||||||||||||
Construction | 60,274 | 2.0 | % | 39,916 | 1.5 | % | 49,213 | 2.4 | % | 53,291 | 4.3 | % | 45,898 | 4.8 | % | |||||||||||||||||||
Single tenant lease financing | 995,879 | 33.6 | % | 919,440 | 33.8 | % | 803,299 | 38.5 | % | 606,568 | 48.5 | % | 374,344 | 39.2 | % | |||||||||||||||||||
Public finance | 687,094 | 23.2 | % | 706,342 | 26.0 | % | 438,341 | 21.0 | % | — | 0.0 | % | — | 0.0 | % | |||||||||||||||||||
Healthcare finance | 300,612 | 10.1 | % | 117,007 | 4.4 | % | 31,573 | 1.5 | % | — | 0.0 | % | — | 0.0 | % | |||||||||||||||||||
Small business lending | 60,279 | 2.1 | % | 17,370 | 0.5 | % | 4,870 | 0.2 | % | 3,142 | 0.3 | % | 1,701 | 0.2 | % | |||||||||||||||||||
Total commercial loans | 2,286,517 | 77.2 | % | 1,990,440 | 73.3 | % | 1,528,407 | 73.2 | % | 833,145 | 66.6 | % | 582,888 | 61.1 | % | |||||||||||||||||||
Consumer loans | ||||||||||||||||||||||||||||||||||
Residential mortgage | 313,849 | 10.6 | % | 399,898 | 14.7 | % | 299,935 | 14.3 | % | 205,554 | 16.4 | % | 214,559 | 22.5 | % | |||||||||||||||||||
Home equity | 24,306 | 0.8 | % | 28,735 | 1.1 | % | 30,554 | 1.5 | % | 35,036 | 2.8 | % | 43,279 | 4.5 | % | |||||||||||||||||||
Other consumer | 295,309 | 10.0 | % | 279,771 | 10.3 | % | 227,533 | 10.8 | % | 173,449 | 13.9 | % | 108,312 | 11.4 | % | |||||||||||||||||||
Total consumer loans | 633,464 | 21.4 | % | 708,404 | 26.1 | % | 558,022 | 26.6 | % | 414,039 | 33.1 | % | 366,150 | 38.4 | % | |||||||||||||||||||
Total commercial and consumer loans | 2,919,981 | 98.6 | % | 2,698,844 | 99.4 | % | 2,086,429 | 99.8 | % | 1,247,184 | 99.7 | % | 949,038 | 99.5 | % | |||||||||||||||||||
Net deferred loan origination costs and premiums and discounts on purchased loans and other (1) | 43,566 | 1.4 | % | 17,384 | 0.6 | % | 4,764 | 0.2 | % | 3,605 | 0.3 | % | 4,821 | 0.5 | % | |||||||||||||||||||
Total loans | 2,963,547 | 100.0 | % | 2,716,228 | 100.0 | % | 2,091,193 | 100.0 | % | 1,250,789 | 100.0 | % | 953,859 | 100.0 | % | |||||||||||||||||||
Allowance for loan losses | (21,840 | ) | (17,896 | ) | (14,970 | ) | (10,981 | ) | (8,351 | ) | ||||||||||||||||||||||||
Net loans | $ | 2,941,707 | $ | 2,698,332 | $ | 2,076,223 | $ | 1,239,808 | $ | 945,508 | ||||||||||||||||||||||||
1 Includes carrying value adjustments of $21.4 million, $5.0 million, $0.3 million, $0.0 million, $0.0 million and million as of December 31, 2019, 2018, 2017, 2016 and 2015, respectively, related to interest rate swaps associated with public finance loans.
The Company continued to experience strong loan growth as total loans rose to $3.0 billion as of December 31, 2019, an increase of $247.3 million, or 9.1%, compared to December 31, 2018. Growth in commercial loan balances of $296.1 million was partially offset by a decline of $74.9 million in consumer loan balances. The growth in commercial loan balances was driven primarily by growth of $183.6 million in healthcare finance, $76.4 million in single tenant lease financing and $42.9 million in small business lending balances. Continued loan growth in healthcare finance driven by our strategic partnership with Lendeavor, Inc., a San Francisco-based technology-enabled lender, drove the increase in this category. Strong single tenant lease financing originations resulted in an increase in 2019, but the increase was partially offset by sales throughout the year. The increase in small business lending balances is due mostly to the acquisition of a loan portfolio from First Colorado National Bank, which consisted primarily of SBA 7(a) loans and had a principal balance of $32.9 million at December 31, 2019. The decrease in consumer loan balances was due primarily to an $86.0 million decrease in residential mortgage loan balances, driven by the sale of $100.5 million of portfolio mortgage loans in 2019, partially offset by originations in other consumer loans, including loans to finance purchases of recreational vehicles and trailers.
The Company completed sales of single tenant lease financing loans, public finance loans and portfolio residential mortgage loans, totaling $291.2 million in the aggregate in 2019, resulting in a gain of $2.1 million in 2019. The Company completed sales of single tenant lease financing loans, totaling $41.1 million in the aggregate in 2018, resulting in a gain of $0.5 million.
35
Loan Maturities and Rate Sensitivity
The following table shows the contractual maturity distribution intervals (without regard to repayment schedules) of the outstanding loans in our portfolio as of December 31, 2019.
(amounts in thousands) | Within 1 Year | 1-3 Years | 4-5 Years | Beyond 5 Years | Total | |||||||||||||||
Commercial loans | ||||||||||||||||||||
Commercial and industrial | $ | 30,002 | $ | 23,149 | $ | 7,784 | $ | 35,485 | $ | 96,420 | ||||||||||
Owner-occupied commercial real estate | 7,053 | 16,267 | 15,710 | 34,362 | 73,392 | |||||||||||||||
Investor commercial real estate | 1,477 | 2,483 | 5,969 | 2,638 | 12,567 | |||||||||||||||
Construction | 17,815 | 28,855 | 5,723 | 7,881 | 60,274 | |||||||||||||||
Single tenant lease financing | 35,735 | 132,729 | 127,282 | 700,133 | 995,879 | |||||||||||||||
Public finance | 12,515 | 10,457 | 251 | 663,871 | 687,094 | |||||||||||||||
Healthcare finance | 494 | 30 | 324 | 299,764 | 300,612 | |||||||||||||||
Small business lending | 615 | 1,307 | 3,106 | 55,251 | 60,279 | |||||||||||||||
Total commercial loans | 105,706 | 215,277 | 166,149 | 1,799,385 | 2,286,517 | |||||||||||||||
Consumer loans | ||||||||||||||||||||
Residential mortgage | 7,740 | 46,565 | 114,111 | 145,433 | 313,849 | |||||||||||||||
Home equity | 86 | 2,446 | 4,342 | 17,432 | 24,306 | |||||||||||||||
Other consumer | 1,640 | 9,231 | 14,767 | 269,671 | 295,309 | |||||||||||||||
Total consumer loans | 9,466 | 58,242 | 133,220 | 432,536 | 633,464 | |||||||||||||||
Total commercial and consumer loans | $ | 115,172 | $ | 273,519 | $ | 299,369 | $ | 2,231,921 | $ | 2,919,981 | ||||||||||
The following table shows the rate sensitivity of the outstanding loans in our portfolio by the contractual maturity distribution intervals as of December 31, 2019. Beginning in 2017, the Company began hedging certain long-term fixed rate loans with interest rate swaps. Refer to Note 18 to the Company's consolidated financial statements for further information on derivative financial instruments. The following table does not include the effect of interest rate swaps on fixed-rate loans that have been hedged.
(amounts in thousands) | Within 1 Year | 1-3 Years | 4-5 Years | Beyond 5 Years | Total | |||||||||||||||
Predetermined rates | $ | 61,110 | $ | 213,662 | $ | 221,088 | $ | 2,016,268 | $ | 2,512,128 | ||||||||||
Adjustable rate | 54,062 | 59,857 | 78,281 | 215,653 | 407,853 | |||||||||||||||
Total commercial and consumer loans | $ | 115,172 | $ | 273,519 | $ | 299,369 | $ | 2,231,921 | $ | 2,919,981 | ||||||||||
Loan Approval Procedures and Authority
Our lending activities follow written, non-discriminatory policies with loan approval limits approved by the Board of Directors of the Bank. Loan officers have underwriting and approval authorization of varying amounts based on their lending experience and product type. Additionally, based on the amount of the loan, multiple approvals may be required. Based on the Bank’s legal lending limit, the maximum it could lend to any one borrower at December 31, 2019 was $54.5 million.
Our goal is to have a well-diversified and balanced loan portfolio. In order to manage our loan portfolio risk, we establish concentration limits by borrower, product type, industry and geography. To supplement our internal loan review resources, we have engaged independent third-party loan review groups, which are a key component of our overall risk management process related to credit administration.
36
Asset Quality
December 31, | |||||||||||||||||||
(dollars in thousands) | 2019 | 2018 | 2017 | 2016 | 2015 | ||||||||||||||
Nonaccrual loans | |||||||||||||||||||
Commercial loans: | |||||||||||||||||||
Commercial and industrial | 226 | 195 | — | — | — | ||||||||||||||
Owner-occupied commercial real estate | 464 | 325 | — | — | — | ||||||||||||||
Single tenant lease financing | 4,680 | — | — | — | — | ||||||||||||||
Total commercial loans | 5,370 | 520 | — | — | — | ||||||||||||||
Consumer loans: | |||||||||||||||||||
Residential mortgage | 761 | 175 | 724 | 1,024 | 103 | ||||||||||||||
Home equity | — | 55 | 83 | — | — | ||||||||||||||
Other consumer | 33 | 42 | 32 | 59 | 64 | ||||||||||||||
Total consumer loans | 794 | 272 | 839 | 1,083 | 167 | ||||||||||||||
Total nonaccrual loans | 6,164 | 792 | 839 | 1,083 | 167 | ||||||||||||||
Past Due 90 days and accruing loans | |||||||||||||||||||
Consumer loans: | |||||||||||||||||||
Residential mortgage | 416 | 97 | — | — | — | ||||||||||||||
Total consumer loans | 416 | 97 | — | — | — | ||||||||||||||
Total past due 90 days and accruing loans | 416 | 97 | — | — | — | ||||||||||||||
Total nonperforming loans | 6,580 | 889 | 839 | 1,083 | 167 | ||||||||||||||
Other real estate owned | |||||||||||||||||||
Investor commercial real estate | 2,065 | 2,066 | 4,488 | 4,488 | 4,488 | ||||||||||||||
Residential mortgage | — | 553 | 553 | 45 | — | ||||||||||||||
Total other real estate owned | 2,065 | 2,619 | 5,041 | 4,533 | 4,488 | ||||||||||||||
Other nonperforming assets | 75 | — | 12 | 85 | 85 | ||||||||||||||
Total nonperforming assets | $ | 8,720 | $ | 3,508 | $ | 5,892 | $ | 5,701 | $ | 4,740 | |||||||||
Total nonperforming loans to total loans | 0.23 | % | 0.03 | % | 0.04 | % | 0.09 | % | 0.02 | % | |||||||||
Total nonperforming assets to total assets | 0.22 | % | 0.10 | % | 0.21 | % | 0.31 | % | 0.37 | % | |||||||||
A loan is designated as impaired, in accordance with the impairment accounting guidance when, based on current information or events, it is probable that the Company will be unable to collect all amounts due (principal and interest) according to the contractual terms of the loan agreement. Payments with delays generally not exceeding 90 days outstanding are not considered impaired. Certain nonaccrual and substantially all delinquent loans more than 90 days past due may be considered to be impaired. Generally, loans are placed on nonaccrual status at 90 days past due and accrued interest is reversed against earnings, unless the loan is well secured and in the process of collection. The accrual of interest on impaired and nonaccrual loans is discontinued when, in management’s opinion, the borrower may be unable to meet payments as they become due.
Impaired loans include nonperforming loans but also include loans modified in troubled debt restructurings (“TDRs”) where concessions have been granted to borrowers experiencing financial difficulties. These concessions could include a reduction in the interest rate on the loan, payment extensions, forgiveness of principal, forbearance, or other actions intended to maximize collection.
Nonperforming loans are comprised of total nonaccrual loans and loans 90 days past due and accruing. Nonperforming assets include nonperforming loans, other real estate owned and other nonperforming assets, which consist of repossessed assets. Nonperforming assets can also include investments that were classified as other-than-temporarily impaired; however, we did not own any investments classified as such during the five-year period ended December 31, 2019.
37
Troubled Debt Restructurings
December 31, | |||||||||||||||||||
(amounts in thousands) | 2019 | 2018 | 2017 | 2016 | 2015 | ||||||||||||||
Troubled debt restructurings – nonaccrual | $ | 94 | $ | — | $ | — | $ | — | $ | — | |||||||||
Troubled debt restructurings – performing | 427 | 410 | 473 | 757 | 1,115 | ||||||||||||||
Total troubled debt restructurings | $ | 521 | $ | 410 | $ | 473 | $ | 757 | $ | 1,115 | |||||||||
Total nonperforming assets increased $5.4 million, or 152.9%, from December 31, 2018. The increase in total nonperforming assets was due primarily to a $4.7 million single tenant lease financing loan relationship being placed on nonaccrual during 2019 and an increase of $0.6 million in nonaccrual residential mortgage loans. Total nonperforming loans increased $5.8 million compared to December 31, 2018 due primarily to the loans mentioned above, as well as an increase of $0.3 million in accruing loans that are more than 90 days past due. The ratio of nonperforming loans to total loans increased to 0.23% as of December 31, 2019 compared to 0.03% as of December 31, 2018, as the rate of growth in nonperforming loans outpaced the growth in total loan balances. The ratio of nonperforming assets to total assets increased to 0.22% as of December 31, 2019 compared to 0.10% as of December 31, 2018, as the rate of growth in nonperforming assets outpaced the growth in total assets.
As of December 31, 2019 and December 31, 2018, the Company had one commercial property in OREO with a carrying value of $2.1 million. This balance consists of a property with two buildings which are residential units adjacent to a university campus. At December 31, 2018, the Company had one residential property in other real estate owned with a carrying value of $0.6 million. This property was sold in 2019.
Allowance for Loan Losses
December 31, | |||||||||||||||||||
(amounts in thousands) | 2019 | 2018 | 2017 | 2016 | 2015 | ||||||||||||||
Balance, beginning of period | $ | 17,896 | $ | 14,970 | $ | 10,981 | $ | 8,351 | $ | 5,800 | |||||||||
Provision charged to expense | 5,966 | 3,892 | 4,872 | 4,330 | 1,946 | ||||||||||||||
Losses charged off | |||||||||||||||||||
Commercial and industrial | (921 | ) | (92 | ) | (271 | ) | (1,582 | ) | — | ||||||||||
Residential mortgage | (76 | ) | (9 | ) | (116 | ) | (134 | ) | (185 | ) | |||||||||
Home equity | (68 | ) | — | — | (33 | ) | — | ||||||||||||
Other consumer | (1,292 | ) | (1,176 | ) | (895 | ) | (440 | ) | (451 | ) | |||||||||
Total losses charged off | (2,357 | ) | (1,277 | ) | (1,282 | ) | (2,189 | ) | (636 | ) | |||||||||
Recoveries | |||||||||||||||||||
Commercial and industrial | 29 | 3 | 69 | 187 | — | ||||||||||||||
Investor commercial real estate | — | — | — | — | 500 | ||||||||||||||
Small business lending | 5 | — | — | — | — | ||||||||||||||
Residential mortgage | 4 | 5 | 4 | 30 | 407 | ||||||||||||||
Home equity | 10 | 16 | 23 | 13 | 1 | ||||||||||||||
Other consumer | 287 | 287 | 303 | 259 | 333 | ||||||||||||||
Total recoveries | 335 | 311 | 399 | 489 | 1,241 | ||||||||||||||
Balance, end of period | $ | 21,840 | $ | 17,896 | $ | 14,970 | $ | 10,981 | $ | 8,351 | |||||||||
The determination of the allowance for loan losses and the related provision for loan losses are components of our significant accounting policies as discussed within Note 1 to the consolidated financial statements. The adequacy of the allowance for loan losses and the provision are based on the review and evaluation of the loan portfolio and reflect management’s assessment of the risks and potential losses within the portfolio. This evaluation considers historical loss experience as well as qualitative factors such as economic and business conditions, portfolio growth, concentrations of credit in the portfolio, trends in risk grades and delinquencies within the portfolio and changes in our lending policies and practices.
Management actively monitors asset quality and, when appropriate, charges off loans against the allowance for loan losses. Although management believes it uses the best information available to make determinations with respect to the allowance for loan losses, future adjustments may be necessary if economic conditions differ substantially from the economic conditions in the assumptions used to determine the size of the allowance for loan losses.
38
The allowance for loan losses was $21.8 million as of December 31, 2019, compared to $17.9 million as of December 31, 2018. The increase of $3.9 million, or 22.0%, was due primarily to the continued growth in loan balances, as well as $1.8 million in specific reserves, mainly associated with the $4.7 million single tenant lease financing relationship that was placed on nonaccrual during 2019.
The allowance for loan losses as a percentage of total loans was 0.74% as of December 31, 2019 compared to 0.66% as of December 31, 2018, and decreased as a percentage of nonperforming loans to 324.4% as of December 31, 2019, from to 2,013.1% as of December 31, 2018. The increase in the allowance for loan losses as a percentage of total loans was due primarily to the specific reserve related to the single tenant lease financing relationship, as well as changes in the composition of the loan portfolio, as loan categories with lower reserve factors declined as a percentage of the overall loan portfolio. The decline in the allowance for loan losses as a percentage of nonperforming loans was driven mainly by the impact of the single tenant lease financing relationship discussed above.
Investment Securities
In managing the Company’s investment securities portfolio, management focuses on providing an adequate level of liquidity and managing long-term interest rate risk, while earning an adequate level of investment income without taking undue risk. Investment securities that are acquired and held principally for the purpose of selling them in the near term with the objective of generating economic profits on short-term differences in market characteristics are classified as “trading securities.” Securities that we intend to hold until maturity are classified as “held-to-maturity” securities, and all other investment securities are classified as “available-for-sale.” The carrying values of available-for-sale investment securities are adjusted for unrealized gains or losses as a valuation allowance and any gain or loss is reported on an after-tax basis as a component of other comprehensive income (loss).
The Company periodically evaluates each security in an unrealized loss position to determine if the impairment is temporary or other-than-temporary. As of December 31, 2019, the unrealized losses in the Company’s investment securities portfolio were due primarily to interest rate changes. The Company has the ability and intent to hold all investment securities with identified impairments resulting from interest rate changes to the earlier of the forecasted recovery or the maturity of the underlying investment security. As of December 31, 2019, the Company did not have any investment securities of a single issuer that exceeded 10% of shareholders’ equity. The term "issuer" excludes the U.S. Government and its sponsored agencies and corporations.
39
The following tables present the amortized cost and approximate fair value of the Company’s investment securities portfolio by security type as of the end of the last five years.
(amounts in thousands) | December 31, | ||||||||||||||||||
Amortized Cost | 2019 | 2018 | 2017 | 2016 | 2015 | ||||||||||||||
Securities available-for-sale | |||||||||||||||||||
U.S. Government-sponsored agencies | $ | 77,715 | $ | 109,631 | $ | 133,424 | $ | 92,599 | $ | 38,093 | |||||||||
Municipal securities | 97,447 | 97,090 | 97,370 | 97,647 | 21,091 | ||||||||||||||
Agency mortgage-backed securities | 264,142 | 242,293 | 215,452 | 238,354 | 113,948 | ||||||||||||||
Private-label mortgage-backed securities | 63,704 | 9,199 | — | — | — | ||||||||||||||
Asset-backed securities | 5,000 | 5,002 | 5,000 | 19,470 | 19,444 | ||||||||||||||
Corporate securities | 38,632 | 36,678 | 27,111 | 20,000 | 20,000 | ||||||||||||||
Other securities | — | — | 3,000 | 3,000 | 3,000 | ||||||||||||||
Total securities available-for-sale | 546,640 | 499,893 | 481,357 | 471,070 | 215,576 | ||||||||||||||
Securities held-to-maturity | |||||||||||||||||||
Municipal securities | 10,142 | 10,157 | 10,164 | 10,171 | — | ||||||||||||||
Corporate securities | 51,736 | 12,593 | 9,045 | 6,500 | — | ||||||||||||||
Total securities held-to-maturity | 61,878 | 22,750 | 19,209 | 16,671 | — | ||||||||||||||
Total securities | $ | 608,518 | $ | 522,643 | $ | 500,566 | $ | 487,741 | $ | 215,576 | |||||||||
December 31, | |||||||||||||||||||
Approximate Fair Value | 2019 | 2018 | 2017 | 2016 | 2015 | ||||||||||||||
Securities available-for-sale | |||||||||||||||||||
U.S. Government-sponsored agencies | $ | 75,872 | $ | 107,585 | $ | 133,190 | $ | 91,896 | $ | 37,750 | |||||||||
Municipal securities | 97,652 | 92,506 | 96,377 | 91,886 | 21,469 | ||||||||||||||
Agency mortgage-backed securities | 261,440 | 233,734 | 209,720 | 231,641 | 113,052 | ||||||||||||||
Private-label mortgage-backed securities | 63,613 | 9,178 | — | — | — | ||||||||||||||
Asset-backed securities | 4,955 | 4,859 | 5,009 | 19,534 | 19,361 | ||||||||||||||
Corporate securities | 37,320 | 33,483 | 26,047 | 18,811 | 19,087 | ||||||||||||||
Other securities | — | — | 2,932 | 2,932 | 2,979 | ||||||||||||||
Total securities available-for-sale | 540,852 | 481,345 | 473,275 | 456,700 | 213,698 | ||||||||||||||
Securities held-to-maturity | |||||||||||||||||||
Municipal securities | 10,368 | 9,801 | 9,847 | 9,673 | — | ||||||||||||||
Corporate securities | 52,192 | 12,617 | 9,236 | 6,524 | — | ||||||||||||||
Total securities held-to-maturity | 62,560 | 22,418 | 19,083 | 16,197 | — | ||||||||||||||
Total securities | $ | 603,412 | $ | 503,763 | $ | 492,358 | $ | 472,897 | $ | 213,698 | |||||||||
The approximate fair value of investment securities available-for-sale increased $59.5 million, or 12.4%, to $540.9 million as of December 31, 2019 compared to $481.3 million as of December 31, 2018. The increase was due primarily to increases of $54.4 million in private-label mortgage-backed securities, $27.7 million in agency mortgage-backed securities, $5.1 million in municipal securities and $3.8 million in corporate securities. The increase in private-label and agency mortgage-backed securities was driven by purchases as excess liquidity was deployed, partially offset by prepayment activity and principal amortization. The increase in the approximate fair value of municipal securities was primarily caused by interest rate changes. Additional liquidity was also used to purchase corporate securities during 2019. These increases were offset by a decrease of $31.7 million in U.S. Government-sponsored agencies securities. The decrease in U.S. Government-sponsored agencies was due primarily to principal amortization and prepayments, as well as the sale of $8.5 million of lower-yielding securities. As of December 31, 2019, the Company had securities with an amortized cost basis of $61.9 million designated as held-to-maturity compared to $22.8 million as of December 31, 2018, an increase of $39.1 million, due mainly to the purchase of corporate securities described above.
40
Investment Maturities
The following table summarizes the contractual maturity schedule of the Company’s investment securities at their amortized cost and their weighted average yields at December 31, 2019.
1 year or less | More than 1 year to 5 years | More than 5 years to 10 years | More than 10 years | Total | |||||||||||||||||||||||||||||||
(dollars in thousands) | Amortized Cost | Wtd. Avg. Yield | Amortized Cost | Wtd. Avg. Yield | Amortized Cost | Wtd. Avg. Yield | Amortized Cost | Wtd. Avg. Yield | Amortized Cost | Wtd. Avg. Yield | |||||||||||||||||||||||||
Securities: | |||||||||||||||||||||||||||||||||||
U.S. Government-sponsored agencies | $ | 30 | 7.31 | % | $ | 2,368 | 3.03 | % | $ | 52,583 | 1.82 | % | $ | 22,734 | 2.37 | % | $ | 77,715 | 2.02 | % | |||||||||||||||
Municipal securities | — | 0.00 | % | 7,334 | 2.17 | % | 20,759 | 2.64 | % | 79,496 | 2.71 | % | 107,589 | 2.66 | % | ||||||||||||||||||||
Agency mortgage-backed securities | — | 0.00 | % | 1,305 | 2.80 | % | 14,666 | 2.24 | % | 248,171 | 2.65 | % | 264,142 | 2.63 | % | ||||||||||||||||||||
Private-label mortgage-backed securities | — | 0.00 | % | — | 0.00 | % | — | — | % | 63,704 | 3.11 | % | 63,704 | 3.11 | % | ||||||||||||||||||||
Asset-backed securities | — | 0.00 | % | — | 0.00 | % | 5,000 | 3.76 | % | — | 0.00 | % | 5,000 | 3.70 | % | ||||||||||||||||||||
Corporate securities | — | 0.00 | % | 18,514 | 2.05 | % | 66,854 | 4.20 | % | 5,000 | 3.03 | % | 90,368 | 3.76 | % | ||||||||||||||||||||
Total securities | $ | 30 | 7.31 | % | $ | 29,521 | 1.95 | % | $ | 159,862 | 3.02 | % | $ | 419,105 | 2.72 | % | $ | 608,518 | 2.78 | % | |||||||||||||||
Other Assets
Other assets were $67.1 million at December 31, 2019 compared to $37.7 million at December 31, 2018. The increase of $29.4 million, or 77.8%, was due primarily to cash collateral pledged for interest rate swaps. The Company pledged $42.3 million and $7.0 million of cash collateral to counterparties as security for its obligations related to these interest rate swap transactions at December 31, 2019 and December 31, 2018, respectively. Collateral posted and received is dependent on the market valuation of the underlying hedges.
Deposits
The following table presents the composition of the Company's deposit base as of the end of the last five years.
December 31, | |||||||||||||||||||||||||||||||||||
(dollars in thousands) | 2019 | 2018 | 2017 | 2016 | 2015 | ||||||||||||||||||||||||||||||
Noninterest-bearing deposits | $ | 57,115 | 1.8 | % | $ | 43,301 | 1.6 | % | $ | 44,686 | 2.1 | % | $ | 31,166 | 2.1 | % | $ | 23,700 | 2.5 | % | |||||||||||||||
Interest-bearing demand deposits | 129,020 | 4.1 | % | 121,055 | 4.5 | % | 94,674 | 4.5 | % | 93,074 | 6.4 | % | 84,241 | 8.8 | % | ||||||||||||||||||||
Savings accounts | 29,616 | 0.9 | % | 38,489 | 1.4 | % | 49,939 | 2.4 | % | 27,955 | 1.9 | % | 22,808 | 2.4 | % | ||||||||||||||||||||
Money market accounts | 786,390 | 24.9 | % | 528,533 | 19.9 | % | 499,501 | 24.0 | % | 340,240 | 23.3 | % | 341,732 | 35.7 | % | ||||||||||||||||||||
Certificates of deposits | 1,613,453 | 51.2 | % | 1,292,883 | 48.4 | % | 1,319,488 | 63.3 | % | 964,819 | 65.9 | % | 470,736 | 49.2 | % | ||||||||||||||||||||
Brokered deposits | 538,369 | 17.1 | % | 647,090 | 24.2 | % | 76,653 | 3.7 | % | 5,613 | 0.4 | % | 12,837 | 1.4 | % | ||||||||||||||||||||
Total | $ | 3,153,963 | 100.0 | % | $ | 2,671,351 | 100.0 | % | $ | 2,084,941 | 100.0 | % | $ | 1,462,867 | 100.0 | % | $ | 956,054 | 100.0 | % | |||||||||||||||
Total deposits increased $482.6 million, or 18.1%, to $3.2 billion as of December 31, 2019 as compared to $2.7 billion as of December 31, 2018. During 2019, certificates of deposits increased $320.6 million, or 24.8%, money market accounts increased $257.9 million, or 48.8%, noninterest-bearing deposits increased $13.8 million, or 31.9%, and interest-bearing demand deposits increased $8.0 million, or 6.6%. These increases were partially offset by declines of $108.7 million, or 16.8%, in brokered deposits and $8.9 million, or 23.1%, in savings accounts. In 2019, we placed greater emphasis on increasing small business money market account balances. The results of these efforts successfully contributed $180.7 million to the total growth in money market balances.
41
The following tables present contractual interest rates paid on time deposits, their scheduled maturities, and the scheduled maturities for time deposits $100,000 or greater.
Time Deposit Maturities at December 31, 2019
Period to Maturity | Percentage of Total Certificate Accounts | ||||||||||||||||||||||
(dollars in thousands) | Less than 1 year | > 1 year to 2 years | > 2 years to 3 years | More than 3 years | Total | ||||||||||||||||||
Interest Rate: | |||||||||||||||||||||||
<1.00% | $ | 4,780 | $ | — | $ | — | $ | — | $ | 4,780 | 0.3 | % | |||||||||||
1.00% – 1.99% | $ | 302,482 | $ | 334,829 | $ | 41,945 | $ | 9,216 | $ | 688,472 | 39.4 | % | |||||||||||
2.00% – 2.99% | 636,416 | 193,839 | 82,594 | 133,478 | 1,046,327 | 59.8 | % | ||||||||||||||||
3.00% – 3.99% | — | 89 | 5 | 8,084 | 8,178 | 0.5 | % | ||||||||||||||||
Total | $ | 943,678 | $ | 528,757 | $ | 124,544 | $ | 150,778 | $ | 1,747,757 | 100.0 | % | |||||||||||
Time Deposit Maturities of $100,000 or Greater
(dollars in thousands) | December 31, 2019 | ||
Maturity Period: | |||
3 months or less | $ | 195,761 | |
Over 3 through 6 months | 203,178 | ||
Over 6 through 12 months | 267,287 | ||
Over 12 months | 641,021 | ||
Total | $ | 1,307,247 | |
Federal Home Loan Bank Advances
Although deposits are the primary source of funds for our lending and investment activities and for general business purposes, we may use short-term advances from the Federal Home Loan Bank of Indianapolis (the "FHLB") to manage liquidity needs and longer-term advances to supplement balance sheet growth and manage interest rate risk. During 2018, the Company converted $110.0 million of short-term FHLB advances to longer term fixed-rate structures using interest rate swaps to reduce long-term interest rate risk. Refer to Note 18 to the Company's consolidated financial statements for additional information about derivative financial instruments. The following table is a summary of FHLB borrowings for the periods indicated.
At Or For The Twelve Months Ended December 31, | ||||||||||||
(dollars in thousands) | 2019 | 2018 | 2017 | |||||||||
Balance outstanding at end of period | $ | 514,910 | $ | 525,153 | $ | 410,176 | ||||||
Average amount outstanding during period | 511,093 | 433,211 | 339,823 | |||||||||
Maximum outstanding at any month end during period | 525,000 | 525,153 | 435,183 | |||||||||
Weighted average interest rate at end of period 1 | 1.98 | % | 2.15 | % | 1.50 | % | ||||||
Weighted average interest rate during period 1 | 2.25 | % | 1.92 | % | 1.24 | % | ||||||
1 Excludes the impact of interest rate swaps.
Other Liabilities
Other liabilities were $53.0 million at December 31, 2019 compared to $21.5 million at December 31, 2018. The increase of $31.5 million, or 146.9%, was due primarily to a $27.1 million decrease in the fair value of interest rate swaps.
Liquidity and Capital Resources
While the Company believes it has sufficient liquidity and capital resources to meet its cash and capital expenditure requirements for at least the next twelve months, including any cash dividends it may pay, the Company intends to continue pursuing its growth strategy, which may require additional capital. If the Company is unable to secure such capital at favorable terms, its ability to execute its growth strategy could be adversely affected.
42
Liquidity management is the process used by the Company to manage the continuing flow of funds necessary to meet its financial commitments on a timely basis and at a reasonable cost while also maintaining safe and sound operations. Liquidity, represented by cash, investment securities and other short-duration assets is a product of the Company’s operating, investing and financing activities. The primary sources of funds are deposits, principal and interest payments on loans and investment securities, maturing loans and investment securities, access to wholesale funding sources and collateralized borrowings. While scheduled payments and maturities of loans and investment securities are relatively predictable sources of funds, deposit flows are greatly influenced by interest rates, general economic conditions and competition. Therefore, the Company supplements organic deposit growth and enhances interest rate risk management through brokered deposits and borrowings.
The Company maintains cash and investment securities that qualify as liquid assets to maintain adequate liquidity to ensure safe and sound operations and meet its financial commitments. At December 31, 2019, on a consolidated basis, the Company had $868.2 million in cash and cash equivalents and investment securities available-for-sale, and $56.1 million in loans held-for-sale that were generally available for its cash needs. The Company can also generate funds from wholesale funding sources and collateralized borrowings. At December 31, 2019, the Bank had the ability to borrow an additional $530.1 million in advances from the FHLB and correspondent bank Fed Funds lines of credit.
The Company is a separate legal entity from the Bank and must provide for its own liquidity. In addition to its operating expenses, the Company is responsible for paying any dividends declared to its common shareholders and interest and principal on outstanding debt. The Company’s primary sources of funds are cash maintained at the holding company level and dividends from the Bank, the payment of which is subject to regulatory limits. At December 31, 2019, the Company, on an unconsolidated basis, had $38.3 million in cash generally available for its cash needs.
The Company uses its sources of funds primarily to meet ongoing financial commitments, including withdrawals by depositors, credit commitments to borrowers, operating expenses and capital expenditures. At December 31, 2019, approved outstanding loan commitments, including unused lines of credit, amounted to $254.4 million. Certificates of deposit scheduled to mature in one year or less at December 31, 2019 totaled $0.9 billion.
On December 18, 2018 the Company's Board of Directors approved a stock repurchase program authorizing the repurchase of up to $10.0 million of the Company's outstanding common stock from time to time on the open market or in privately negotiated transactions. The stock repurchase program was scheduled to expire on December 31, 2019. Under this program, the Company repurchased 482,970 shares of common stock through September 30, 2019, at an average price of $20.70, for a total repurchase amount of $10.0 million, thus repurchasing the maximum amount of stock authorized by the Company's Board of Directors under this program.
In March 2013, the Company borrowed $4.0 million from the Bank for the purchase of the Company’s principal executive offices. The loan was originally scheduled to mature in March 2014 and had been extended annually through March 2020. In February 2020, the Company entered into an amendment that, among other things, extended its maturity to April 1, 2022. The principal balance of the loan was $3.0 million as of December 31, 2019 and its payment terms are interest only through April 1, 2022. The amounts borrowed under the loan bear interest at a variable rate equal to the then applicable prime rate (as determined by the Bank with reference to the “Prime Rate” published in The Wall Street Journal) plus 1.00% per annum.
43
Reconciliation of Non-GAAP Financial Measures
This annual report on Form 10-K contains financial information determined by methods other than in accordance with U.S. generally accepted accounting principles (“GAAP”). Non-GAAP financial measures, specifically tangible common equity, tangible assets, tangible book value per common share, the ratio of tangible common equity to tangible assets, average tangible common equity, return on average tangible common equity, net interest income - FTE, net interest margin - FTE, adjusted income before income taxes, adjusted income tax provision, adjusted net income, adjusted diluted earnings per share, adjusted return on average assets, adjusted return on average shareholders' equity, adjusted return on average tangible common equity and adjusted effective income tax rate are used by management to measure the strength of the Company's capital and analyze profitability, including its ability to generate earnings on tangible capital invested by its shareholders. Management also believes that it is a standard practice in the banking industry to present net interest margin and net income on a fully-taxable equivalent basis as those measures provide useful information for peer comparisons. Although the Company believes these non-GAAP measures provide a greater understanding of its business, they should not be considered a substitute for financial measures determined in accordance with GAAP, nor are they necessarily comparable to non-GAAP performance measures that may be presented by other companies. Reconciliations of these non-GAAP financial measures to the most directly comparable GAAP financial measures are included in the following table.
44
(dollars in thousands, except share and per share data) | At Or For The Twelve Months Ended December 31, | ||||||||||||||||||
2019 | 2018 | 2017 | 2016 | 2015 | |||||||||||||||
Total equity - GAAP | $ | 304,913 | $ | 288,735 | $ | 224,127 | $ | 153,942 | $ | 104,330 | |||||||||
Adjustments: | |||||||||||||||||||
Goodwill | (4,687 | ) | (4,687 | ) | (4,687 | ) | (4,687 | ) | (4,687 | ) | |||||||||
Tangible common equity | $ | 300,226 | $ | 284,048 | $ | 219,440 | $ | 149,255 | $ | 99,643 | |||||||||
Total assets - GAAP | $ | 4,100,083 | $ | 3,541,692 | $ | 2,767,687 | $ | 1,854,335 | $ | 1,269,870 | |||||||||
Adjustments: | |||||||||||||||||||
Goodwill | (4,687 | ) | (4,687 | ) | (4,687 | ) | (4,687 | ) | (4,687 | ) | |||||||||
Tangible assets | $ | 4,095,396 | $ | 3,537,005 | $ | 2,763,000 | $ | 1,849,648 | $ | 1,265,183 | |||||||||
Total common shares outstanding | 9,741,800 | 10,170,778 | 8,411,077 | 6,478,050 | 4,481,347 | ||||||||||||||
Book value per common share | $ | 31.30 | $ | 28.39 | $ | 26.65 | $ | 23.76 | $ | 23.28 | |||||||||
Effect of goodwill | (0.48 | ) | (0.46 | ) | (0.56 | ) | (0.72 | ) | (1.04 | ) | |||||||||
Tangible book value per common share | $ | 30.82 | $ | 27.93 | $ | 26.09 | $ | 23.04 | $ | 22.24 | |||||||||
Total shareholders’ equity to assets ratio | 7.44 | % | 8.15 | % | 8.10 | % | 8.30 | % | 8.22 | % | |||||||||
Effect of goodwill | (0.11 | )% | (0.12 | )% | (0.16 | )% | (0.23 | )% | (0.34 | )% | |||||||||
Tangible common equity to tangible assets ratio | 7.33 | % | 8.03 | % | 7.94 | % | 8.07 | % | 7.88 | % | |||||||||
Total average equity - GAAP | $ | 296,382 | $ | 259,416 | $ | 178,212 | $ | 124,023 | $ | 100,428 | |||||||||
Adjustments: | |||||||||||||||||||
Average goodwill | (4,687 | ) | (4,687 | ) | (4,687 | ) | (4,687 | ) | (4,687 | ) | |||||||||
Average tangible common equity | $ | 291,695 | $ | 254,729 | $ | 173,525 | $ | 119,336 | $ | 95,741 | |||||||||
Return on average shareholders' equity | 8.52 | % | 8.44 | % | 8.54 | % | 9.74 | % | 8.89 | % | |||||||||
Effect of goodwill | 0.13 | % | 0.16 | % | 0.23 | % | 0.38 | % | 0.44 | % | |||||||||
Return on average tangible common equity | 8.65 | % | 8.60 | % | 8.77 | % | 10.12 | % | 9.33 | % | |||||||||
Net interest income | $ | 62,967 | $ | 62,267 | $ | 53,982 | $ | 39,689 | $ | 30,753 | |||||||||
Adjustments: | |||||||||||||||||||
Fully-taxable equivalent adjustments1 | 6,334 | 5,010 | 4,053 | 1,090 | 224 | ||||||||||||||
Net interest income - FTE | $ | 69,301 | $ | 67,277 | $ | 58,035 | $ | 40,779 | $ | 30,977 | |||||||||
Net interest margin | 1.65 | % | 2.09 | % | 2.39 | % | 2.49 | % | 2.85 | % | |||||||||
Effect of fully-taxable equivalent adjustments1 | 0.17 | % | 0.16 | % | 0.18 | % | 0.06 | % | 0.02 | % | |||||||||
Net interest margin - FTE | 1.82 | % | 2.25 | % | 2.57 | % | 2.55 | % | 2.87 | % | |||||||||
1Assuming a 21% tax rate in 2019 and 2018 and a 35% tax rate in 2017, 2016 and 2015
45
(dollars in thousands, except share and per share data) | At Or For The Twelve Months Ended December 31, | ||||||||||||||||||
2019 | 2018 | 2017 | 2016 | 2015 | |||||||||||||||
Income before income taxes - GAAP | $ | 27,156 | $ | 23,952 | $ | 22,928 | $ | 17,985 | $ | 13,665 | |||||||||
Adjustments: | |||||||||||||||||||
Write-down of other real estate owned | — | 2,423 | — | — | — | ||||||||||||||
Adjusted income before income taxes | $ | 27,156 | $ | 26,375 | $ | 22,928 | $ | 17,985 | $ | 13,665 | |||||||||
Income tax provision - GAAP | $ | 1,917 | $ | 2,052 | $ | 7,702 | $ | 5,911 | $ | 4,736 | |||||||||
Adjustments: | |||||||||||||||||||
Write-down of other real estate owned | — | 509 | — | — | — | ||||||||||||||
Net deferred tax asset revaluation | (1,846 | ) | — | — | |||||||||||||||
Adjusted income tax provision | $ | 1,917 | $ | 2,561 | $ | 5,856 | $ | 5,911 | $ | 4,736 | |||||||||
Net income - GAAP | $ | 25,239 | $ | 21,900 | $ | 15,226 | $ | 12,074 | $ | 8,929 | |||||||||
Adjustments: | |||||||||||||||||||
Write-down of other real estate owned | — | 1,914 | — | — | — | ||||||||||||||
Net deferred tax asset revaluation | — | — | 1,846 | — | — | ||||||||||||||
Adjusted net income | $ | 25,239 | $ | 23,814 | $ | 17,072 | $ | 12,074 | $ | 8,929 | |||||||||
Diluted average common shares outstanding | 10,044,483 | 9,508,653 | 7,149,302 | 5,239,082 | 4,554,219 | ||||||||||||||
Diluted earnings per share - GAAP | $ | 2.51 | $ | 2.30 | $ | 2.13 | $ | 2.30 | $ | 1.96 | |||||||||
Adjustments: | |||||||||||||||||||
Effect of write-down of other real estate owned | — | 0.20 | — | — | — | ||||||||||||||
Effect of net deferred tax asset revaluation | — | — | 0.26 | — | — | ||||||||||||||
Adjusted diluted earnings per share | $ | 2.51 | $ | 2.50 | $ | 2.39 | $ | 2.30 | $ | 1.96 | |||||||||
Return on average assets | 0.65 | % | 0.72 | % | 0.66 | % | 0.74 | % | 0.81 | % | |||||||||
Effect of write-down of other real estate owned | 0.00 | % | 0.06 | % | 0.00 | % | 0.00 | % | 0.00 | % | |||||||||
Effect of net deferred tax asset revaluation | 0.00 | % | 0.00 | % | 0.08 | % | 0.00 | % | 0.00 | % | |||||||||
Adjusted return on average assets | 0.65 | % | 0.78 | % | 0.74 | % | 0.74 | % | 0.81 | % | |||||||||
Return on average shareholders' equity | 8.52 | % | 8.44 | % | 8.54 | % | 9.74 | % | 8.89 | % | |||||||||
Effect of write-down of other real estate owned | 0.00 | % | 0.74 | % | 0.00 | % | 0.00 | % | 0.00 | % | |||||||||
Effect of net deferred tax asset revaluation | 0.00 | % | 0.00 | % | 1.04 | % | 0.00 | % | 0.00 | % | |||||||||
Adjusted return on average shareholders' equity | 8.52 | % | 9.18 | % | 9.58 | % | 9.74 | % | 8.89 | % | |||||||||
Return on average tangible common equity | 8.65 | % | 8.60 | % | 8.77 | % | 10.12 | % | 9.33 | % | |||||||||
Effect of write-down of other real estate owned | 0.00 | % | 0.75 | % | 0.00 | % | 0.00 | % | 0.00 | % | |||||||||
Effect of net deferred tax asset revaluation | 0.00 | % | 0.00 | % | 1.07 | % | 0.00 | % | 0.00 | % | |||||||||
Adjusted return on average tangible common equity | 8.65 | % | 9.35 | % | 9.84 | % | 10.12 | % | 9.33 | % | |||||||||
Effective income tax rate | 7.1 | % | 8.6 | % | 33.6 | % | 32.9 | % | 34.7 | % | |||||||||
Effect of write-down of other real estate owned | 0.0 | % | 1.1 | % | 0.0 | % | 0.0 | % | 0.0 | % | |||||||||
Effect of net deferred tax asset revaluation | 0.0 | % | 0.0 | % | (8.1 | )% | 0.0 | % | 0.0 | % | |||||||||
Adjusted effective income tax rate | 7.1 | % | 9.7 | % | 25.5 | % | 32.9 | % | 34.7 | % | |||||||||
Critical Accounting Policies and Estimates
Allowance for Loan Losses. We believe the allowance for loan losses is the critical accounting policy that requires the most significant judgments and assumptions used in the preparation of our consolidated financial statements. An estimate of potential losses inherent in the loan portfolio is determined and an allowance for those losses is established by considering factors including historical loss rates, expected cash flows, and estimated collateral values. The allowance for loan losses represents management’s best estimate of losses inherent in the existing loan portfolio. The allowance for loan losses is increased by the
46
provision for loan losses charged to expense and reduced by loans charged off, net of recoveries. Management evaluates the allowance for loan losses quarterly. If the underlying assumptions later prove to be inaccurate based on subsequent loss evaluations, the allowance for loan losses is adjusted.
Management estimates the appropriate level of allowance for loan losses by separately evaluating impaired and non-impaired loans. A specific allowance is assigned to an impaired loan when expected cash flows or collateral do not justify the carrying amount of the loan. The methodology used to assign an allowance to a non-impaired loan is more subjective. Generally, the allowance assigned to non-impaired loans is determined by applying historical loss rates to existing loans with similar risk characteristics, adjusted for qualitative factors including changes in economic conditions, changes in underwriting standards, and changes in concentrations of credit risk, and changes in industry conditions. Because the economic and business climate in any given industry or market, and its impact on any given borrower, can change rapidly, the risk profile of the loan portfolio is periodically assessed and adjusted when appropriate. Notwithstanding these procedures, there still exists the possibility that the assessment could prove to be significantly incorrect and that an immediate adjustment to the allowance for loan losses would be required.
Investments in Debt and Equity Securities. We classify investments in debt and equity securities as available-for-sale in accordance with Accounting Standards Codification, or ASC, Topic 320, “Accounting for Certain Investments in Debt and Equity Securities.” Securities classified as held-to-maturity would be recorded at cost or amortized cost. Available-for-sale securities are carried at fair value. Fair value calculations are based on quoted market prices when such prices are available. If quoted market prices are not available, estimates of fair value are computed using a variety of pricing sources, including Reuters/EJV, Interactive Data and Standard & Poors. Due to the subjective nature of the valuation process, it is possible that the actual fair values of these investments could differ from the estimated amounts, thereby affecting our financial position, results of operations and cash flows. If the estimated value of investments is less than the cost or amortized cost, management evaluates whether an event or change in circumstances has occurred that may have a significant adverse effect on the fair value of the investment. If such an event or change has occurred and management determines that the impairment is other-than-temporary, a further determination is made as to the portion of impairment that is related to credit loss. The impairment of the investment that is related to the credit loss is expensed in the period in which the event or change occurred. The remainder of the impairment is recorded in other comprehensive income (loss).
Other Real Estate Owned (“OREO”). OREO acquired through loan foreclosure is initially recorded at fair value less costs to sell when acquired, establishing a new cost basis. The adjustment at the time of foreclosure is recorded through the allowance for loan losses. Due to the subjective nature of establishing the fair value when the asset is acquired, the actual fair value of the OREO or foreclosed asset could differ from the original estimate. If it is determined that fair value declines subsequent to foreclosure, a valuation adjustment is recorded through noninterest expense. Net operating costs associated with the assets after acquisition are also recorded as noninterest expense. Gains and losses on the disposition of OREO and foreclosed assets are netted and posted through noninterest income.
Impairment of Goodwill. As a result of the Company’s previous acquisition of Landmark Financial Corporation, goodwill, an intangible asset with an indefinite life, is reflected on the balance sheet. Goodwill is evaluated for impairment annually, unless there are factors present that indicate a potential impairment, in which case, the goodwill impairment test is performed more frequently.
Deferred Income Tax Assets/Liabilities. Our net deferred income tax asset arises from differences in the dates that items of income and expense enter into our reported income and taxable income. Deferred tax assets and liabilities are established for these items as they arise. From an accounting standpoint, deferred tax assets are reviewed to determine if they are realizable based on the historical level of taxable income, estimates of future taxable income and the reversals of deferred tax liabilities. In most cases, the realization of the deferred tax asset is based on future profitability. If we were to experience net operating losses for tax purposes in a future period, the realization of deferred tax assets would be evaluated for a potential valuation reserve.
Recent Accounting Pronouncements
Refer to Note 23 to the Company’s consolidated financial statements.
Off-Balance Sheet Arrangements
In the ordinary course of business, the Company enters into financial transactions to extend credit, interest rate swaps and forms of commitments that may be considered off-balance sheet arrangements. Interest rate swaps are arranged to receive hedge accounting treatment and are classified as either fair value or cash flow hedges. Fair value hedges are purchased to convert certain fixed rate assets to floating rate. Cash flow hedges are used to convert certain variable rate liabilities into fixed rate
47
liabilities. At December 31, 2019 and December 31, 2018, the Company had interest rate swaps with notional amounts of $725.6 million and $734.1 million, respectively. Additionally, we enter into forward contracts relating to our mortgage banking business to hedge the exposures we have from commitments to extend new residential mortgage loans to our customers and from our mortgage loans held-for-sale. At December 31, 2019 and December 31, 2018, we had commitments to sell residential real estate loans of $115.0 million and $32.5 million, respectively. These contracts mature in less than one year. Refer to Note 18 to the Company's consolidated financial statements for additional information about derivative financial instruments.
Contractual Obligations
The following table presents significant fixed and determinable contractual obligations and significant commitments as of December 31, 2019. Further discussion of each obligation or commitment is included in the referenced note to the consolidated financial statements.
Payments Due In | |||||||||||||||||||||
(dollars in thousands) | Note Reference | Less than 1 year | 1-3 years | 3-5 years | More than 5 years | Total | |||||||||||||||
Deposits and brokered deposits without stated maturity1 | 8 | $ | 1,171,054 | $ | — | $ | — | $ | — | $ | 1,171,054 | ||||||||||
Certificates of deposits and brokered certificates of deposits1 | 8 | 980,288 | 734,343 | 268,028 | 250 | 1,982,909 | |||||||||||||||
FHLB advances1,2 | 9 | 110,000 | — | 180,000 | 225,000 | 515,000 | |||||||||||||||
Subordinated debt1 | 10 | — | — | — | 72,000 | 72,000 | |||||||||||||||
Operating lease commitments | 6 | 867 | 661 | 116 | — | 1,644 | |||||||||||||||
Total contractual obligations | $ | 2,262,209 | $ | 735,004 | $ | 448,144 | $ | 297,250 | $ | 3,742,607 | |||||||||||
1 Amounts do not include associated interest payments.
2 Amounts do not include the effect of interest rate swaps used to convert short-term advances into long-term funding.
Item 7A. Quantitative and Qualitative Disclosures about Market Risk
Market risk is the risk of loss arising from adverse changes in the fair value of financial instruments due to changes in interest rates, foreign exchange rates and equity prices. The primary source of market risk for the Company is interest rate risk. Interest rate risk is the risk to earnings and the value of the Company’s equity resulting from changes in market interest rates and arises in the normal course of business to the extent that there are timing and volume differences between the amount of interest-earning assets and the amount of interest-bearing liabilities that are prepaid, withdrawn, re-priced or mature in specified periods. The Company seeks to achieve consistent growth in net interest income and equity while managing volatility arising from shifts in market interest rates.
The Company monitors its interest rate risk position using income simulation models and economic value of equity (“EVE”) sensitivity analysis that capture both short-term and long-term interest rate risk exposure. Income simulation involves forecasting net interest income (“NII”) under a variety of interest rate scenarios. The Company uses EVE sensitivity analysis to understand the impact of changes in interest rates on long-term cash flows, income and capital. EVE is calculated by discounting the cash flows for all balance sheet instruments under different interest-rate scenarios. Modeling the sensitivity of NII and EVE to changes in market interest rates is highly dependent on the assumptions incorporated into the modeling process. The Company continually reviews and refines the assumptions used in its interest rate risk modeling.
Presented below is the estimated impact on the Company's NII and EVE position as of December 31, 2019, assuming parallel shifts in interest rates:
% Change from Base Case for Parallel Changes in Rates | |||||||||||
-100 Basis Points | -50 Basis Points | -25 Basis Points | +100 Basis Points | ||||||||
NII - next twelve months | (7.49 | )% | (3.14 | )% | (1.35 | )% | 3.42 | % | |||
NII - Year 2 | 5.41 | % | 7.85 | % | 8.57 | % | 4.74 | % | |||
EVE | (2.58 | )% | 0.54 | % | 0.69 | % | (10.36 | )% | |||
The Company’s objective is to manage the balance sheet with a “risk-neutral” position. A “risk-neutral” position refers to the absence of a strong bias toward either asset or liability sensitivity. An “asset sensitive” position refers to when the characteristics of the balance sheet are expected to generate higher net interest income when interest rates, primarily short-term rates, increase as rates earned on interest-earning assets would reprice upward more quickly or in greater quantities than rates paid on interest-bearing liabilities would reprice. A “liability sensitive” position refers to when the characteristics of the balance sheet
48
are expected to generate lower net interest income when short-term interest rates increase as rates paid on interest-bearing liabilities would reprice upward more quickly or in greater quantities than rates earned on interest-earning assets.
Item 8. Financial Statements and Supplementary Data
The consolidated financial statements and notes thereto required pursuant to this Item begin on page F-1 of this report.
Item 9. Changes in and Disagreements with Accountants on Accounting and Financial Disclosure
None.
Item 9A. Controls and Procedures
Evaluation of Disclosure Controls and Procedures
The Company maintains disclosure controls and procedures that are designed to ensure that information the Company is required to disclose in reports that the Company files or submits under the Exchange Act is recorded, processed, summarized and reported within the time period specified in SEC rules and forms. These controls and procedures are also designed to ensure that such information is accumulated and communicated to management, including our principal executive and principal financial officer, as appropriate, to allow timely decisions regarding required disclosure. In designing and evaluating disclosure controls and procedures, the Company has recognized that any controls and procedures, no matter how well designed and operated, can provide only reasonable assurance of achieving the desired control objectives. Management is required to apply judgment in evaluating its controls and procedures.
The Company performed an evaluation under the supervision and with the participation of management, including the Company’s principal executive officer and principal financial officer, to assess the effectiveness of the design and operation of our disclosure controls and procedures under the Exchange Act. Based on that evaluation, our management, including our principal executive officer and principal financial officer, concluded that our disclosure controls and procedures were effective as of December 31, 2019.
Report of Management's Assessment of Internal Control Over Financial Reporting
Management is responsible for establishing and maintaining adequate internal control over financial reporting for the Company, including accounting and other internal control systems that, in the opinion of management, provide reasonable assurance that (1) transactions are properly authorized, (2) the assets are properly safeguarded, and (3) transactions are properly recorded and reported to permit the preparation of the consolidated financial statements in conformity with accounting principles generally accepted in the United States. The Company’s management assessed the effectiveness of the Company’s internal control over financial reporting as of December 31, 2019. In making this assessment, management used the criteria set forth by the Committee of Sponsoring Organizations of the Treadway Commission (COSO) in Internal Control—Integrated Framework (2013). Based on that assessment, management concluded that, as of December 31, 2019, the Company’s internal control over financial reporting was effective based on those criteria. The Company’s internal control over financial reporting as of December 31, 2019 has been audited by BKD, LLP, an independent registered public accounting firm, as stated in its report appearing on page F-2.
Changes in Internal Control Over Financial Reporting
There has been no change in the Company’s internal control over financial reporting during the quarter ended December 31, 2019, that has materially affected or is reasonably likely to materially affect, the Company's internal control over financial reporting.
Item 9B. Other Information
None.
49
PART III
Certain information required by Part III is incorporated by reference from our definitive Proxy Statement for our 2020 Annual Meeting of Shareholders (the “Proxy Statement”), which we intend to file with the SEC pursuant to Regulation 14A within 120 days after December 31, 2019. Except for those portions specifically incorporated by reference from our Proxy Statement, no other portions of the Proxy Statement are deemed to be filed as part of this report.
Item 10. Directors, Executive Officers and Corporate Governance
Information about our Executive Officers
Our executive officers are as follows:
Name | Age | Position | ||
David B. Becker | 66 | Chairman, President, Chief Executive Officer and Director | ||
Kenneth J. Lovik | 50 | Executive Vice President and Chief Financial Officer | ||
Nicole S. Lorch | 45 | Executive Vice President and Chief Operating Officer | ||
C. Charles Perfetti | 75 | Executive Vice President and Secretary | ||
David B. Becker has served as our Chairman of the Board since 2006 and as our President and Chief Executive Officer since 2007. Mr. Becker is the founder of the Bank and has served as an officer and director of the Bank since 1998.
Kenneth J. Lovik has served as Executive Vice President and Chief Financial Officer of the Company since January 2017. Mr. Lovik joined the Company in August 2014 as Senior Vice President and Chief Financial Officer. Previously, he served as Senior Vice President, Investor Relations and Corporate Development, at First Financial Bancorp, a publicly traded bank holding company headquartered in Cincinnati, Ohio, from February 2013 to May 2014. Prior to that, he served as its Vice President, Investor Relations and Corporate Development, from 2010 to February 2013. Before First Financial Bancorp, he served as Vice President – Investment Banking at Milestone Advisors, LLC from October 2008 to September 2009 and in the same position at Howe Barnes Hoefer & Arnett, Inc. from 2004 to 2008.
Nicole S. Lorch has served as Executive Vice President and Chief Operating Officer since January 2017. Ms. Lorch joined the Company as Director of Marketing in 1999 and served as Vice President, Marketing & Technology from 2003 to 2011 and Senior Vice President, Retail Banking from 2011 to January 2017. She previously served as Director of Marketing at Virtual Financial Services, an online banking services provider, from 1996 to 1999.
C. Charles Perfetti has served as Executive Vice President since January 2017 and Secretary since May 2014. He previously served as Senior Vice President from 2012 until January 2017. Mr. Perfetti joined First Internet Bancorp in 2007 upon our acquisition of Landmark Financial Corporation, where he had served as President from 1989 to 2007. He previously conducted independent real estate and government consulting and served as the Chief Investment Manager of the State of Indiana from 1979 to 1986.
Executive officers are elected annually by our Board of Directors and serve a one-year period or until their successors are elected. None of the above-identified executive officers are related to each other or to any of our directors.
Code of Business Conduct and Ethics
We have adopted a code of business conduct and ethics that applies to all of our directors and officers and other employees, including our principal executive officer and principal financial officer. This code is publicly available through the Corporate Governance section of our website at www.firstinternetbancorp.com. To the extent permissible under applicable law, the rules of the SEC or Nasdaq listing standards, we intend to post on our website any amendment to the code of business conduct and ethics, or any grant of a waiver from a provision of the code of business conduct and ethics, that requires disclosure under applicable law, the rules of the SEC or Nasdaq listing standards.
The disclosure in the Proxy Statement under the headings “Proposal No. 1 - Election of Directors,” “Corporate Governance,” “Shareholder proposals for 2021 Annual Meeting,” and, if applicable “Delinquent Section 16(a) Reports” is incorporated into this Item by reference.
Item 11. Executive Compensation
50
Incorporated into this Item by reference is the information in the Proxy Statement regarding the compensation of our named executive officers appearing under the heading “Executive Compensation,” the information regarding compensation committee interlocks and insider participation under the heading “Corporate Governance” and the information regarding compensation of non-employee directors under the heading “Director Compensation.”
Item 12. Security Ownership of Certain Beneficial Owners and Management and Related Stockholder Matters
Incorporated into this Item by reference is the information in the Proxy Statement appearing under the headings “Security Ownership of Certain Beneficial Owners and Management” and “Equity Compensation Plan Information.”
Item 13. Certain Relationships and Related Transactions, and Director Independence
Incorporated into this Item by reference is the information in the Proxy Statement regarding director independence and related person transactions under the heading “Corporate Governance.”
Item 14. Principal Accountant Fees and Services
Incorporated into this Item by reference is the information in the Proxy Statement under the heading “Audit-Related Matters.”
51
PART IV
Item 15. Exhibits and Financial Statement Schedules
(a)Documents Filed as Part of this annual report on Form 10-K:
1. | See our financial statements beginning on page F-1. |
(b)Exhibits:
Exhibit No. | Description | |
52
Exhibit No. | Description | |
101 | Financial statements from the Annual Report on Form 10-K of First Internet Bancorp for the period ended December 31, 2019, filed with the SEC on March 12, 2020, formatted in Extensible Business Reporting Language (XBRL): (i) the Consolidated Balance Sheets at December 31, 2019 and 2018, (ii) the Consolidated Statements of Income for the fiscal years ended December 31, 2019, 2018, and 2017, (iii) the Consolidated Statements of Comprehensive Income for the fiscal years ended December, 2019, 2018, and 2017, (iv) the Consolidated Statements of Shareholders’ Equity for the fiscal years ended December 31, 2019, 2018, and 2017, (v) Consolidated Statements of Cash Flows for the fiscal years ended December 2019, 2018, and 2017, and (iv) Notes to Consolidated Financial Statements. | |
__________________________________
*Management contract, compensatory plan or arrangement required to be filed as an exhibit.
Item 16. Form 10-K Summary.
None.
53
SIGNATURES
Pursuant to the requirements of Section 13 or 15(d) of the Securities Exchange Act of 1934, the Registrant has duly caused this Report to be signed on its behalf by the undersigned, thereunto duly authorized, on March 12, 2020.
FIRST INTERNET BANCORP | ||
By: | /s/ David B. Becker | |
David B. Becker, Chairman, President and Chief Executive Officer | ||
Pursuant to the requirements of the Securities Exchange Act of 1934, this Report has been signed below by the following persons on behalf of the Registrant and in the capacities indicated on March 12, 2020.
/s/ David B. Becker | /s/ Kenneth J. Lovik | |
David B. Becker, Chairman, President, Chief Executive Officer and Director (Principal Executive Officer) | Kenneth J. Lovik, Executive Vice President and Chief Financial Officer (Principal Financial Officer and Principal Accounting Officer) | |
* | * | |
John K. Keach, Jr., Director | David R. Lovejoy, Director | |
* | * | |
Ann D. Murtlow, Director | Ralph R. Whitney, Jr., Director | |
* | * | |
Jerry Williams, Director | Jean L. Wojtowicz, Director | |
_____________________________
* | David B. Becker, by signing his name hereto, does hereby sign this document on behalf of each of the above-named directors of the Registrant pursuant to powers of attorney duly executed by such persons. |
By: | /s/ David B. Becker | |
David B. Becker, Attorney-in-Fact | ||
54
Reports of Independent Registered Public Accounting Firm
To the Shareholders, Board of Directors and Audit Committee
First Internet Bancorp
Fishers, Indiana
Opinion on the Financial Statements
We have audited the accompanying consolidated balance sheets of First Internet Bancorp (Company) as of December 31, 2019 and 2018, the related consolidated statements of income, comprehensive income, shareholders' equity and cash flows for each of the years in the three-year period ended December 31, 2019, and the related notes (collectively referred to as the "financial statements"). In our opinion, the consolidated financial statements referred to above present fairly, in all material respects, the financial position of the Company as of December 31, 2019 and 2018, and the results of its operations and its cash flows for each of the years in the three-year period ended December 31, 2019, in conformity with accounting principles generally accepted in the United States of America.
We also have audited, in accordance with the standards of the Public Company Accounting Oversight Board (United States) ("PCAOB"), the Company's internal control over financial reporting as of December 31, 2019, based on criteria established in Internal Control-Integrated Framework (2013) issued by the Committee of Sponsoring Organizations of the Treadway Commission (COSO) and our report dated March 11, 2020, expressed an unqualified opinion on the effectiveness of the Company’s internal control over financial reporting.
Basis for Opinion
These financial statements are the responsibility of the Company's management. Our responsibility is to express an opinion on the Company's financial statements based on our audits.
We are a public accounting firm registered with the PCAOB and are required to be independent with respect to the Company in accordance with the U.S. federal securities laws and the applicable rules and regulations of the Securities and Exchange Commission and the PCAOB.
We conducted our audits in accordance with the standards of the PCAOB. Those standards require that we plan and perform the audits to obtain reasonable assurance about whether the financial statements are free of material misstatement, whether due to error or fraud. Our audits included performing procedures to assess the risks of material misstatement of the financial statements, whether due to error or fraud, and performing procedures that respond to those risks. Such procedures include examining, on a test basis, evidence regarding the amounts and disclosures in the financial statements. Our audits also included evaluating the accounting principles used and significant estimates made by management, as well as evaluating the overall presentation of the financial statements. We believe that our audits provide a reasonable basis for our opinion.
/s/ BKD, LLP
We have served as the Company's auditor since 2004.
Indianapolis, Indiana
March 12, 2020
F-1
Reports of Independent Registered Public Accounting Firm
To the Shareholders, Board of Directors and Audit Committee
First Internet Bancorp
Fishers, Indiana
Opinion on the Internal Control over Financial Reporting
We have audited First Internet Bancorp's (the "Company") internal control over financial reporting as of December 31, 2019, based on criteria established in Internal Control - Integrated Framework: (2013) issued by the Committee of Sponsoring Organizations of the Treadway Commission (COSO).
In our opinion, the Company maintained, in all material respects, effective internal control over financial reporting as of December 31, 2019, based on criteria established in Internal Control - Integrated Framework: (2013) issued by COSO.
We also have audited, in accordance with the standards of the Public Company Accounting Oversight Board (United States) ("PCAOB"), the consolidated financial statements of the Company and our report dated March 11, 2020, expressed an unqualified opinion thereon.
Basis for Opinion
The Company's management is responsible for maintaining effective internal control over financial reporting and for its assessment of the effectiveness of internal control over financial reporting, included in the accompanying Report of Management’s Assessment of Internal Control Over Financial Reporting. Our responsibility is to express an opinion on the Company's internal control over financial reporting based on our audit.
We are a public accounting firm registered with the PCAOB and are required to be independent with respect to the Company in accordance with the U.S. federal securities laws and the applicable rules and regulations of the Securities and Exchange Commission and the PCAOB.
We conducted our audit in accordance with the standards of the PCAOB. Those standards require that we plan and perform the audit to obtain reasonable assurance about whether effective internal control over financial reporting was maintained in all material respects.
Our audit included obtaining an understanding of internal control over financial reporting, assessing the risk that a material weakness exists and testing and evaluating the design and operating effectiveness of internal control based on the assessed risk. Our audit also included performing such other procedures as we considered necessary in the circumstances. We believe that our audit provides a reasonable basis for our opinion.
Definitions and Limitations of Internal Control over Financial Reporting
A company's internal control over financial reporting is a process designed to provide reasonable assurance regarding the reliability of financial reporting and the preparation of financial statements for external purposes in accordance with generally accepted accounting principles. A company's internal control over financial reporting includes those policies and procedures that (1) pertain to the maintenance of records that, in reasonable detail, accurately and fairly reflect the transactions and dispositions of the assets of the company; (2) provide reasonable assurance that transactions are recorded as necessary to permit preparation of financial statements in accordance with generally accepted accounting principles, and that receipts and expenditures of the company are being made only in accordance with authorizations of management and directors of the company; and (3) provide reasonable assurance regarding prevention or timely detection of unauthorized acquisition, use or disposition of the company's assets that could have a material effect on the financial statements.
Because of its inherent limitations, internal control over financial reporting may not prevent or detect misstatements. Also, projections of any evaluation of effectiveness to future periods are subject to the risk that controls may become inadequate because of changes in conditions or that the degree of compliance with the policies or procedures may deteriorate.
F-2
/s/ BKD, LLP
Indianapolis, Indiana
March 12, 2020
F-3
First Internet Bancorp
Consolidated Balance Sheets
(Amounts in thousands except share data)
December 31, | ||||||||
2019 | 2018 | |||||||
Assets | ||||||||
Cash and due from banks | $ | 5,061 | $ | 7,080 | ||||
Interest-bearing demand deposits | 322,300 | 181,632 | ||||||
Total cash and cash equivalents | 327,361 | 188,712 | ||||||
Securities available-for-sale - at fair value (amortized cost of $546,640 in 2019 and $499,893 in 2018) | 540,852 | 481,345 | ||||||
Securities held-to-maturity - at amortized cost (fair value of $62,560 in 2019 and $22,418 in 2018) | 61,878 | 22,750 | ||||||
Loans held-for-sale (includes $56,097 in 2019 and $18,328 in 2018 at fair value) | 56,097 | 18,328 | ||||||
Loans | 2,963,547 | 2,716,228 | ||||||
Allowance for loan losses | (21,840 | ) | (17,896 | ) | ||||
Net loans | 2,941,707 | 2,698,332 | ||||||
Accrued interest receivable | 18,607 | 16,822 | ||||||
Federal Home Loan Bank of Indianapolis stock | 25,650 | 23,625 | ||||||
Cash surrender value of bank-owned life insurance | 37,002 | 36,059 | ||||||
Premises and equipment, net | 14,630 | 10,697 | ||||||
Goodwill | 4,687 | 4,687 | ||||||
Servicing asset | 2,481 | — | ||||||
Other real estate owned | 2,065 | 2,619 | ||||||
Accrued income and other assets | 67,066 | 37,716 | ||||||
Total assets | $ | 4,100,083 | $ | 3,541,692 | ||||
Liabilities and shareholders’ equity | ||||||||
Liabilities | ||||||||
Noninterest-bearing deposits | $ | 57,115 | $ | 43,301 | ||||
Interest-bearing deposits | 3,096,848 | 2,628,050 | ||||||
Total deposits | 3,153,963 | 2,671,351 | ||||||
Advances from Federal Home Loan Bank | 514,910 | 525,153 | ||||||
Subordinated debt, net of unamortized discounts and debt issuance costs of $2,472 in 2019 and $1,125 in 2018 | 69,528 | 33,875 | ||||||
Accrued interest payable | 3,767 | 1,108 | ||||||
Accrued expenses and other liabilities | 53,002 | 21,470 | ||||||
Total liabilities | 3,795,170 | 3,252,957 | ||||||
Commitments and Contingencies | ||||||||
Shareholders’ equity | ||||||||
Preferred stock, no par value; 4,913,779 shares authorized; issued and outstanding - none | — | — | ||||||
Voting common stock, no par value; 45,000,000 shares authorized; 9,741,800 and 10,170,778 shares issued and outstanding in 2019 and 2018, respectively | 219,423 | 227,587 | ||||||
Nonvoting common stock, no par value; 86,221 shares authorized; issued and outstanding - none | — | — | ||||||
Retained earnings | 99,681 | 77,689 | ||||||
Accumulated other comprehensive loss | (14,191 | ) | (16,541 | ) | ||||
Total shareholders’ equity | 304,913 | 288,735 | ||||||
Total liabilities and shareholders’ equity | $ | 4,100,083 | $ | 3,541,692 | ||||
See Notes to Consolidated Financial Statements
F-4
First Internet Bancorp
Consolidated Statements of Income
(Amounts in thousands except share and per share data)
Year Ended December 31, | ||||||||||||
2019 | 2018 | 2017 | ||||||||||
Interest income | ||||||||||||
Loans | $ | 122,228 | $ | 99,082 | $ | 70,465 | ||||||
Securities – taxable | 13,807 | 10,630 | 10,036 | |||||||||
Securities – non-taxable | 2,595 | 2,810 | 2,786 | |||||||||
Other earning assets | 8,784 | 2,945 | 1,410 | |||||||||
Total interest income | 147,414 | 115,467 | 84,697 | |||||||||
Interest expense | ||||||||||||
Deposits | 69,313 | 42,484 | 23,975 | |||||||||
Other borrowed funds | 15,134 | 10,716 | 6,740 | |||||||||
Total interest expense | 84,447 | 53,200 | 30,715 | |||||||||
Net interest income | 62,967 | 62,267 | 53,982 | |||||||||
Provision for loan losses | 5,966 | 3,892 | 4,872 | |||||||||
Net interest income after provision for loan losses | 57,001 | 58,375 | 49,110 | |||||||||
Noninterest income | ||||||||||||
Service charges and fees | 885 | 934 | 888 | |||||||||
Loan servicing revenue | 166 | — | — | |||||||||
Mortgage banking activities | 11,541 | 5,718 | 7,836 | |||||||||
Gain on sale of loans | 2,074 | 503 | 395 | |||||||||
Loss on sale of securities | (458 | ) | — | (8 | ) | |||||||
Other | 2,581 | 1,605 | 1,430 | |||||||||
Total noninterest income | 16,789 | 8,760 | 10,541 | |||||||||
Noninterest expense | ||||||||||||
Salaries and employee benefits | 27,014 | 23,174 | 21,164 | |||||||||
Marketing, advertising and promotion | 1,800 | 2,468 | 2,393 | |||||||||
Consulting and professional fees | 3,669 | 3,055 | 3,091 | |||||||||
Data processing | 1,338 | 1,233 | 971 | |||||||||
Loan expenses | 1,142 | 942 | 1,027 | |||||||||
Premises and equipment | 6,059 | 4,996 | 4,183 | |||||||||
Deposit insurance premium | 1,903 | 1,956 | 1,410 | |||||||||
Write-down of other real estate owned | — | 2,423 | — | |||||||||
Other | 3,709 | 2,936 | 2,484 | |||||||||
Total noninterest expense | 46,634 | 43,183 | 36,723 | |||||||||
Income before income taxes | 27,156 | 23,952 | 22,928 | |||||||||
Income tax provision | 1,917 | 2,052 | 7,702 | |||||||||
Net income | $ | 25,239 | $ | 21,900 | $ | 15,226 | ||||||
Income per share of common stock | ||||||||||||
Basic | $ | 2.51 | $ | 2.31 | $ | 2.14 | ||||||
Diluted | 2.51 | 2.30 | 2.13 | |||||||||
Weighted-average number of common shares outstanding | ||||||||||||
Basic | 10,041,581 | 9,490,506 | 7,118,628 | |||||||||
Diluted | 10,044,483 | 9,508,653 | 7,149,302 | |||||||||
Dividends declared per share | $ | 0.24 | $ | 0.24 | $ | 0.24 | ||||||
See Notes to Consolidated Financial Statements
F-5
First Internet Bancorp
Consolidated Statements of Comprehensive Income
(Amounts in thousands)
Year Ended December 31, | ||||||||||||
2019 | 2018 | 2017 | ||||||||||
Net income | $ | 25,239 | $ | 21,900 | $ | 15,226 | ||||||
Other comprehensive income (loss) | ||||||||||||
Net unrealized holding gains (losses) on securities available-for-sale recorded within other comprehensive income before income tax | 12,072 | (10,466 | ) | 6,280 | ||||||||
Reclassification adjustment for losses realized | 458 | — | 8 | |||||||||
Net unrealized holding losses on cash flow hedging derivatives recorded within other comprehensive income before income tax | (9,071 | ) | (4,358 | ) | — | |||||||
Other comprehensive income (loss) before tax | 3,459 | (14,824 | ) | 6,288 | ||||||||
Income tax provision (benefit) | 1,109 | (4,365 | ) | 2,039 | ||||||||
Other comprehensive income (loss) - net of tax | 2,350 | (10,459 | ) | 4,249 | ||||||||
Comprehensive income | $ | 27,589 | $ | 11,441 | $ | 19,475 | ||||||
See Notes to Consolidated Financial Statements
F-6
First Internet Bancorp
Consolidated Statements of Shareholders’ Equity
(Amounts in thousands except per share data)
Voting and Nonvoting Common Stock | Retained Earnings | Accumulated Other Comprehensive Loss | Total Shareholders’ Equity | |||||||||||||
Balance, January 1, 2017 | $ | 119,506 | $ | 43,704 | $ | (9,268 | ) | $ | 153,942 | |||||||
Net income | — | 15,226 | — | 15,226 | ||||||||||||
Other comprehensive income | — | — | 4,249 | 4,249 | ||||||||||||
Dividends declared ($0.24 per share) | — | (1,827 | ) | (1,827 | ) | |||||||||||
Net cash proceeds from common stock issuance | 51,636 | — | — | 51,636 | ||||||||||||
Recognition of the fair value of share-based compensation | 1,038 | — | — | 1,038 | ||||||||||||
Deferred stock rights and restricted stock units issued in lieu of cash dividends payable on outstanding deferred stock rights and restricted stock units | 36 | — | — | 36 | ||||||||||||
Common stock redeemed for the net settlement of share-based awards | (173 | ) | — | — | (173 | ) | ||||||||||
Balance, December 31, 2017 | $ | 172,043 | $ | 57,103 | $ | (5,019 | ) | $ | 224,127 | |||||||
Impact of adoption of new accounting standards (1) | — | 1,063 | (1,063 | ) | — | |||||||||||
Net income | — | 21,900 | — | 21,900 | ||||||||||||
Other comprehensive loss | — | — | (10,459 | ) | (10,459 | ) | ||||||||||
Dividends declared ($0.24 per share) | — | (2,377 | ) | — | (2,377 | ) | ||||||||||
Net cash proceeds from common stock issuance | 54,334 | — | — | 54,334 | ||||||||||||
Repurchase of common stock | (216 | ) | — | — | (216 | ) | ||||||||||
Recognition of the fair value of share-based compensation | 1,596 | — | — | 1,596 | ||||||||||||
Deferred stock rights and restricted stock units issued in lieu of cash dividends payable on outstanding deferred stock rights and restricted stock units | 40 | — | — | 40 | ||||||||||||
Common stock redeemed for the net settlement of share-based awards | (210 | ) | — | — | (210 | ) | ||||||||||
Balance, December 31, 2018 | $ | 227,587 | $ | 77,689 | $ | (16,541 | ) | $ | 288,735 | |||||||
Impact of adoption of new accounting standards (2) | — | (821 | ) | — | (821 | ) | ||||||||||
Net income | — | 25,239 | — | 25,239 | ||||||||||||
Other comprehensive income | — | — | 2,350 | 2,350 | ||||||||||||
Dividends declared ($0.24 per share) | — | (2,426 | ) | — | (2,426 | ) | ||||||||||
Repurchase of common stock | (9,784 | ) | — | — | (9,784 | ) | ||||||||||
Recognition of the fair value of share-based compensation | 1,680 | — | — | 1,680 | ||||||||||||
Deferred stock rights and restricted stock units issued in lieu of cash dividends payable on outstanding deferred stock rights and restricted stock units | 34 | — | — | 34 | ||||||||||||
Common stock redeemed for the net settlement of share-based awards | (94 | ) | — | — | (94 | ) | ||||||||||
Balance, December 31, 2019 | $ | 219,423 | $ | 99,681 | $ | (14,191 | ) | $ | 304,913 | |||||||
(1) Represents the impact of adopting Accounting Standards Update ("ASU") 2018-02 and ASU 2016-01. ASU 2018-02 increased retained earnings and accumulated other comprehensive loss by $1.1 million. ASU 2016-01 decreased retained earnings and accumulated other comprehensive loss by $0.1 million.
(2) Represents the impact of adopting ASU 2017-08.
See Notes to Consolidated Financial Statements
F-7
First Internet Bancorp
Consolidated Statements of Cash Flows
(Amounts in thousands)
Year Ended December 31, | ||||||||||||
2019 | 2018 | 2017 | ||||||||||
Operating activities | ||||||||||||
Net income | $ | 25,239 | $ | 21,900 | $ | 15,226 | ||||||
Adjustments to reconcile net income to net cash (used in) provided by operating activities: | ||||||||||||
Amortization of operating lease right-of-use assets | 729 | — | — | |||||||||
Depreciation and amortization | 6,926 | 5,667 | 5,299 | |||||||||
Write-down of other real estate owned | — | 2,423 | — | |||||||||
Increase in cash surrender value of bank-owned life insurance | (943 | ) | (954 | ) | (910 | ) | ||||||
Provision for loan losses | 5,966 | 3,892 | 4,872 | |||||||||
Share-based compensation expense | 1,680 | 1,596 | 1,038 | |||||||||
Loss from sale of available-for-sale securities | 458 | — | 8 | |||||||||
Loans originated for sale | (627,597 | ) | (364,630 | ) | (412,925 | ) | ||||||
Proceeds from sale of loans originated for sale | 601,215 | 376,535 | 425,262 | |||||||||
Gain on sale of loans | (12,349 | ) | (6,605 | ) | (8,170 | ) | ||||||
Increase in fair value of loans held-for-sale | (538 | ) | (57 | ) | (638 | ) | ||||||
(Gain) loss on derivatives | (671 | ) | 501 | 577 | ||||||||
Net change in servicing assets | (2,481 | ) | — | — | ||||||||
Deferred income tax | (4,402 | ) | 978 | (3,296 | ) | |||||||
Net change in other assets | (42,079 | ) | (11,807 | ) | (2,273 | ) | ||||||
Net change in other liabilities | 5,270 | (83 | ) | 554 | ||||||||
Net cash (used in) provided by operating activities | (43,577 | ) | 29,356 | 24,624 | ||||||||
Investing activities | ||||||||||||
Net loan activity, excluding sales and purchases | (191,070 | ) | (463,528 | ) | (870,181 | ) | ||||||
Net change in interest-bearing deposits | — | — | 250 | |||||||||
Purchase of bank owned life insurance | — | — | (10,000 | ) | ||||||||
Proceeds from sales of other real estate owned | 554 | 332 | 30 | |||||||||
Net proceeds from sales of portfolio loans | 293,708 | 41,916 | 67,696 | |||||||||
Maturities of securities available-for-sale | 92,610 | 62,507 | 68,342 | |||||||||
Proceeds from sales of securities available-for-sale | 30,137 | — | 9,192 | |||||||||
Purchase of securities available-for-sale | (171,997 | ) | (87,993 | ) | (91,463 | ) | ||||||
Purchase of securities held-to-maturity | (39,208 | ) | (3,554 | ) | (2,550 | ) | ||||||
Purchase of Federal Home Loan Bank of Indianapolis stock | (2,025 | ) | (4,050 | ) | (10,665 | ) | ||||||
Purchase of premises and equipment | (4,105 | ) | (2,219 | ) | (1,517 | ) | ||||||
Loans purchased | (332,945 | ) | (171,958 | ) | (67,285 | ) | ||||||
Other investing activities | 11,068 | (10,166 | ) | — | ||||||||
Net cash used in investing activities | (313,273 | ) | (638,713 | ) | (908,151 | ) | ||||||
Financing activities | ||||||||||||
Net increase in deposits | 482,612 | 586,410 | 622,074 | |||||||||
Cash dividends paid | (2,418 | ) | (2,230 | ) | (1,675 | ) | ||||||
Net proceeds from issuance of subordinated debt | 35,418 | — | — | |||||||||
Repayment of subordinated debt | — | (3,000 | ) | — | ||||||||
Net proceeds from common stock issuance | — | 54,334 | 51,636 | |||||||||
Repurchase of common stock | (9,784 | ) | (216 | ) | — | |||||||
Proceeds from advances from Federal Home Loan Bank | 595,000 | 375,000 | 542,000 | |||||||||
Repayment of advances from Federal Home Loan Bank | (605,000 | ) | (260,000 | ) | (321,806 | ) | ||||||
Other, net | (329 | ) | (210 | ) | (173 | ) | ||||||
Net cash provided by financing activities | 495,499 | 750,088 | 892,056 | |||||||||
Net increase in cash and cash equivalents | 138,649 | 140,731 | 8,529 | |||||||||
Cash and cash equivalents, beginning of year | 188,712 | 47,981 | 39,452 | |||||||||
Cash and cash equivalents, end of year | $ | 327,361 | $ | 188,712 | $ | 47,981 | ||||||
Supplemental disclosures of cash flows information | ||||||||||||
Initial recognition of right-of-use asset | $ | 2,096 | $ | — | $ | — | ||||||
Initial recognition of operating lease liabilities | 2,096 | — | — | |||||||||
Cash paid during the year for interest | 81,788 | 52,403 | 30,516 | |||||||||
Cash paid during the year for taxes | 4,561 | 485 | 6,568 | |||||||||
Loans transferred to other real estate owned | — | 227 | 648 | |||||||||
Loans transferred to held-for-sale from portfolio | 291,152 | 16,065 | 95,531 | |||||||||
Cash dividends declared, not paid | 585 | 611 | 504 | |||||||||
Transfer of mutual fund securities to other assets | — | 2,932 | — | |||||||||
See Notes to Consolidated Financial Statements
F-8
First Internet Bancorp
Notes to Consolidated Financial Statements
(Tabular dollar amounts in thousands except per share data)
Note 1: Basis of Presentation and Summary of Significant Accounting Policies
The accounting policies of First Internet Bancorp and its subsidiaries (the “Company”) conform to accounting principles generally accepted in the United States of America (“GAAP”). A summary of the Company’s significant accounting policies follows:
Description of Business
The Company was incorporated on September 15, 2005, and consummated a plan of exchange on March 21, 2006, by which the Company became a bank holding company and 100% owner of First Internet Bank of Indiana (the “Bank”).
The Bank provides commercial and retail banking services, with operations conducted on the Internet at www.firstib.com and primarily through its corporate office located in Fishers, Indiana as well as a loan production office in Tempe, Arizona. The majority of the Bank’s income is derived from commercial lending, retail lending, and mortgage banking activities. The Bank is subject to competition from other financial institutions. The Bank is regulated by certain state and federal agencies and undergoes periodic examinations by those regulatory authorities.
JKH Realty Services, LLC was established on August 20, 2012 as a single member limited liability company wholly owned by the Bank to manage other real estate owned properties as needed. First Internet Public Finance Corp., a wholly-owned subsidiary of the Bank, was incorporated on March 6, 2017 and was established to provide municipal finance lending and leasing products to government entities and to purchase, manage, service, and safekeep municipal securities. SPF15, Inc., a wholly-owned subsidiary of the Bank, was incorporated on August 31, 2018 and was established to acquire and hold real estate.
Principles of Consolidation
The consolidated financial statements include the accounts of the Company and its direct and indirect subsidiaries. All significant intercompany accounts and transactions have been eliminated in consolidation. The Company’s business activities are currently limited to one reporting unit and reportable segment, which is commercial banking.
Use of Estimates
The preparation of financial statements in conformity with GAAP requires management to make estimates and assumptions that affect the amounts reported in the consolidated financial statements and accompanying notes. The Company utilizes processes that involve the use of significant estimates and the judgment of management in determining the amount of the Company’s allowance for loan losses, income taxes, valuation and impairments of investment securities and goodwill, as well as fair value measurements of derivatives, loans held-for-sale and other real estate owned. Actual results could differ from those estimates.
Securities
The Company classifies its securities in one of three categories and accounts for the investments as follows:
• | Securities that the Company has the positive intent and ability to hold to maturity are classified as “held-to-maturity” and reported at amortized cost. |
• | Securities that are acquired and held principally for the purpose of selling them in the near term with the objective of generating economic profits on short-term differences in market characteristics are classified as “trading securities” and reported at fair value, with unrealized gains and losses included in earnings. The Company had no securities classified as “trading securities” at December 31, 2019 or 2018. |
F-9
First Internet Bancorp
Notes to Consolidated Financial Statements
(Tabular dollar amounts in thousands except per share data)
• | Securities not classified as either “held-to-maturity” or “trading securities” are classified as “available-for-sale” and reported at fair value, with unrealized gains and losses, after applicable taxes, excluded from earnings and reported in a separate component of shareholders’ equity. Declines in the value of debt securities and marketable equity securities that are considered to be other-than-temporary are recorded as an other-than-temporary impairment of securities available-for-sale with other-than-temporary impairment losses recorded in the consolidated statements of income. |
Interest and dividend income, adjusted by amortization of premium or discount, is included in earnings using the effective interest rate method. Purchases and sales of securities are recorded in the consolidated balance sheets on the trade date. Gains and losses from security sales or disposals are recognized as of the trade date in the consolidated statements of income for the period in which securities are sold or otherwise disposed of. Gains and losses on sales of securities are determined using the specific-identification method.
Loans Held-for-Sale
Loans originated and intended for sale in the secondary market under best-efforts pricing agreements are carried at the lower of cost or fair value in the aggregate. Net unrealized losses, if any, are recognized through a valuation allowance by charges to noninterest income.
Loans originated and intended for sale in the secondary market under mandatory pricing agreements are carried at fair value to facilitate hedging of the loans. Gains and losses resulting from changes in fair value are recognized in noninterest income.
Gains and losses on loan sales are recorded in noninterest income, and direct loan origination costs and fees are deferred at origination of the loan and are recognized in noninterest income upon sale of the loan.
Revenue Recognition
The Company recognizes revenues as they are earned based on contractual terms, as transactions occur, or as services are provided and collectability is reasonably assured. The Company's principal source of revenue is interest income from loans and leases and investment securities.
Interest income on loans is accrued as earned using the interest method based on unpaid principal balances except for interest on loans in nonaccrual status. Interest on loans in nonaccrual status is recorded as a reduction of loan principal when received.
Premiums and discounts are amortized using the effective interest rate method.
Loan fees, net of certain direct origination costs, primarily salaries and wages, are deferred and amortized to interest income as a yield adjustment over the life of the loan.
The Company also earns noninterest income through a variety of financial and transaction services provided to corporate and consumer clients such as deposit account, debit card, mortgage banking, portfolio loan sales and sales of the government-guaranteed portion of U.S. Small Business Administration loans. Revenue is recorded for noninterest income based on the contractual terms for the service or transaction performed. In certain circumstances, noninterest income is reported net of associated expenses.
Loans
Loans that management intends to hold until maturity are reported at their outstanding principal balance adjusted for unearned income, charge-offs, the allowance for loan losses (“ALLL”), any unamortized deferred fees or costs on originated loans, unamortized premiums or discounts on purchased loans and carrying value adjustments related to interest rate swaps associated with loans.
F-10
First Internet Bancorp
Notes to Consolidated Financial Statements
(Tabular dollar amounts in thousands except per share data)
For loans recorded at cost, interest income is accrued based on the unpaid principal balance. Loan origination fees, net of certain direct origination costs, as well as premiums and discounts, are deferred and amortized as a level yield adjustment over the respective term of the loan.
Allowance for Loan Losses Methodology
Company policy is designed to maintain an adequate ALLL. Primary responsibility for ensuring that the Company has processes in place to consistently assess the adequacy of the ALLL rests with the Board of Directors (the “Board”). The Board has charged management with responsibility for establishing the methodology to be used and to assess the adequacy of the ALLL. The Board reviews recommendations from management on a quarterly basis to adjust the allowance as appropriate.
The methodology employed by management for each portfolio segment, at a minimum, contains the following:
1. | Loans are segmented by type of loan. |
2. | The required ALLL for types of performing homogeneous loans which do not have a specific reserve is determined by applying a factor based on historical losses averaged over the past sixteen quarters. In those instances where the Company’s historical experience is not available, management develops factors based on industry experience and best practices. |
3. | All criticized, classified and impaired loans are tested for impairment by applying one of three methodologies: |
a. | Present value of future cash flows; |
b. | Fair value of collateral less costs to sell; or |
c. | The loan’s observable market price. |
4. | All troubled debt restructurings (“TDR”) are considered impaired loans. |
5. | Loans tested for impairment are removed from other pools to prevent layering (double-counting). |
6. | The required ALLL for each group of loans are added together to determine the total required ALLL for the Company. The required ALLL is compared to the existing ALLL to determine the provision required to increase the ALLL or credit to decrease the ALLL. |
The historical loss experience is determined by portfolio segment and considers two weighted average net charge-off trends: 1) the Company’s average loss history over the previous sixteen quarters; and 2) the average loss history over the previous sixteen quarters for a peer group. Management believes the historical loss experience methodology is appropriate in the current economic environment, as it captures loss rates that are comparable to the current period being analyzed.
The Company also factors in the following qualitative considerations:
1. | Changes in policies and procedures; |
2. | Changes in national, regional, and local economic and business conditions; |
3. | Changes in the composition and size of the portfolio and in the terms of loans; |
4. | Changes in the experience, ability, and depth of lending management and other relevant staff; |
5. | Changes in the volume and severity of past due loans, the volume of nonaccrual loans, and the volume and severity of adversely classified or graded loans; |
F-11
First Internet Bancorp
Notes to Consolidated Financial Statements
(Tabular dollar amounts in thousands except per share data)
6. | Changes in the quality of the Company’s loan review system; |
7. | Changes in the value of underlying collateral for collateral-dependent loans; |
8. | The existence and effect of any concentration of credit and changes in the level of such concentrations; and |
9. | The effect of other external factors such as competition and legal and regulatory requirements on the level of estimated credit losses in the existing portfolio. |
Provision for Loan Losses
A provision for estimated losses on loans is charged to income based upon management’s evaluation of the potential losses. Such an evaluation, which includes a review of all loans for which full repayment may not be reasonably assured, considers, among other matters, the estimated net realizable value of the underlying collateral, as applicable, economic conditions, loan loss experience, and other factors that are particularly susceptible to changes that could result in a material adjustment in the near term. While management attempts to use the best information available in making its evaluations, future allowance adjustments may be necessary if economic conditions change substantially from the assumptions used in making the evaluations.
Nonaccrual Loans
Any loan which becomes 90 days delinquent or for which the full collection of principal and interest may be in doubt will be considered for nonaccrual status. At the time a loan is placed on nonaccrual status, all accrued but unpaid interest will be reversed from interest income. Placing the loan on nonaccrual status does not relieve the borrower of the obligation to repay interest. A loan placed on nonaccrual status may be restored to accrual status when all delinquent principal and interest has been brought current, and the Company expects full payment of the remaining contractual principal and interest.
Impaired Loans
A loan is designated as impaired, in accordance with the impairment accounting guidance when, based on current information or events, it is probable that the Company will be unable to collect all amounts due (principal and interest) according to the contractual terms of the loan agreement. Payments with delays generally not exceeding 90 days outstanding are not considered impaired. Certain nonaccrual and substantially all delinquent loans more than 90 days past due may be considered to be impaired. Generally, loans are placed on nonaccrual status at 90 days past due and accrued interest is reversed against earnings, unless the loan is well secured and in the process of collection. The accrual of interest on impaired and nonaccrual loans is discontinued when, in management’s opinion, the borrower may be unable to meet payments as they become due.
Impaired loans include nonperforming loans but also include loans modified in TDRs where concessions have been granted to borrowers experiencing financial difficulties. These concessions could include a reduction in the interest rate on the loan, payment extensions, forgiveness of principal, forbearance, or other actions intended to maximize collection.
Accounting Standards Codification (“ASC”) Topic 310, Receivables, requires that impaired loans be measured based on the present value of expected future cash flows discounted at the loans’ effective interest rates or the fair value of the underlying collateral, less costs to sell, and allows existing methods for recognizing interest income.
Troubled Debt Restructurings
The loan portfolio includes certain loans that have been modified in a TDR, where economic concessions have been granted to borrowers who have experienced financial difficulties. These concessions typically result from loss mitigation efforts and could include reductions in the interest rate, payment extensions, forgiveness of principal, forbearance or other
F-12
First Internet Bancorp
Notes to Consolidated Financial Statements
(Tabular dollar amounts in thousands except per share data)
actions. Certain TDRs are classified as nonperforming at the time of restructuring and typically are returned to performing status after considering the borrower’s sustained repayment performance for a reasonable period, generally not less than six months.
When loans are modified in a TDR, any possible impairment similar to other impaired loans is evaluated based on either the present value of expected future cash flows, discounted at the contractual interest rate of the original loan agreement, or the current fair value of the collateral, less selling costs for collateral-dependent loans. If it is determined that the value of the modified loan is less than the recorded balance of the loan, impairment is recognized through a specific ALLL or charge-off to the ALLL. In periods subsequent to modification, all TDRs, including those that have payment defaults, are evaluated for possible impairment, and impairment is recognized through the ALLL.
Policy for Charging Off Loans
The Company’s policy is to charge off a loan at any point in time when it no longer can be considered a bankable asset, meaning collectible within the parameters of policy. A secured loan is generally charged down to the estimated fair value of the collateral, less costs to sell, no later than when it is 120 days past due as to principal or interest. An unsecured loan generally is charged off no later than when it is 180 days past due as to principal or interest. A home improvement loan generally is charged off no later than when it is 90 days past due as to principal or interest.
Federal Home Loan Bank (“FHLB”) of Indianapolis Stock
Federal law requires a member institution of the FHLB system to hold common stock of its district FHLB according to a predetermined formula. This investment is stated at cost, which represents redemption value, and may be pledged as collateral for FHLB advances.
Premises and Equipment
Premises and equipment is stated at cost, less accumulated depreciation. Depreciation is computed on the straight-line method over the estimated useful lives, which range from three to five years for software and equipment, ten years for land improvements, and 39 years for buildings.
Other Real Estate Owned
Other real estate owned represents real estate acquired through foreclosure or deed in lieu of foreclosure and is recorded at its fair value less estimated costs to sell. When property is acquired, it is recorded at its fair value at the date of acquisition with any resulting write-down charged against the ALLL. Any subsequent deterioration of the property is charged directly to operating expense. Costs relating to the development and improvement of other real estate owned are capitalized, whereas costs relating to holding and maintaining the property are charged to expense as incurred.
Derivative Financial Instruments
The Company uses derivative financial instruments to help manage exposure to interest rate risk and the effects that changes in interest rates may have on net income and the fair value of assets and liabilities. The Company enters into interest rate swap agreements as part of its asset liability management strategy to help manage its interest rate risk position. Additionally, the Company enters into forward contracts for the future delivery of mortgage loans to third-party investors and enters into interest rate lock commitments ("IRLCs") with potential borrowers to fund specific mortgage loans that will be sold into the secondary market. The forward contracts are entered into in order to economically hedge the effect of changes in interest rates resulting from the Company’s commitment to fund the loans.
Designating an interest rate swap as an accounting hedge allows the Company to recognize gains and losses, less any ineffectiveness, in the income statement within the same period that the hedged item affects earnings. The Company includes the gain or loss on the hedged items in the same line item as the offsetting loss or gain on the related interest rate swaps. For derivative instruments that are designated and qualify as cash flow hedges, any gains or losses related to changes in fair value are recorded in accumulated other comprehensive loss, net of tax. The fair value of interest rate
F-13
First Internet Bancorp
Notes to Consolidated Financial Statements
(Tabular dollar amounts in thousands except per share data)
swaps with a positive fair value are reported in accrued income and other assets in the consolidated balance sheets while interest rate swaps with a negative fair value are reported in accrued expenses and other liabilities in the consolidated balance sheets.
The IRLCs and forward contracts are not designated as accounting hedges, and are recorded at fair value with changes in fair value reflected in noninterest income in the consolidated statements of income. The fair value of derivative instruments with a positive fair value are reported in accrued income and other assets in the consolidated balance sheets, while derivative instruments with a negative fair value are reported in accrued expenses and other liabilities in the consolidated balance sheets.
Fair Value Measurements
The Company records or discloses certain assets and liabilities at fair value. ASC Topic 820, Fair Value Measurements, defines fair value as the price that would be received to sell an asset or paid to transfer a liability in an orderly transaction between market participants at the measurement date. Fair value measurements are classified within one of three levels in a valuation hierarchy. ASC Topic 820 describes three levels of inputs that may be used to measure fair value:
Level 1 | Quoted prices in active markets for identical assets or liabilities |
Level 2 | Observable inputs other than Level 1 prices, such as quoted prices for similar assets or liabilities; quoted prices in markets that are not active; or other inputs that are observable or can be corroborated by observable market data for substantially the full term of the assets or liabilities |
Level 3 | Unobservable inputs that are supported by little or no market activity and that are significant to the fair value of the assets or liabilities |
There were no transfers that occurred and, therefore, recognized, between any of the fair value hierarchy levels at December 31, 2019 or 2018.
Income Taxes
Deferred income tax assets and liabilities reflect the impact of temporary differences between amounts of assets and liabilities for financial reporting purposes and the basis of such assets and liabilities as measured by tax laws and regulations. Deferred income tax expense or benefit is based upon the change in deferred tax assets and liabilities from period to period, subject to an ongoing assessment of realization of deferred tax assets. Deferred tax assets are reduced by a valuation allowance if, based on the weight of evidence available, it is more likely than not that some portion or all of a deferred tax asset will not be realized.
The Company files income tax returns in the U.S. federal, Indiana, and other state jurisdictions. With few exceptions, the Company is no longer subject to U.S. federal, state and local examinations by tax authorities for years before 2016.
ASC Topic 740-10, Accounting for Uncertainty in Income Taxes, prescribes a recognition threshold and measurement attribute for the financial statement recognition and measurement of a tax position taken or expected to be taken in a tax return. It also provides guidance on derecognition, classification, interest and penalties, accounting in interim periods, disclosure and transition. The Company did not identify any material uncertain tax positions that it believes should be recognized in the consolidated financial statements.
F-14
First Internet Bancorp
Notes to Consolidated Financial Statements
(Tabular dollar amounts in thousands except per share data)
Earnings Per Share
Earnings per share of common stock is based on the weighted-average number of basic shares and dilutive shares outstanding during the year.
The following is a reconciliation of the weighted-average common shares for the basic and diluted earnings per share computations.
Year Ended December 31, | ||||||||||||
2019 | 2018 | 2017 | ||||||||||
Basic earnings per share | ||||||||||||
Net income available to common shareholders | $ | 25,239 | $ | 21,900 | $ | 15,226 | ||||||
Weighted-average common shares | 10,041,581 | 9,490,506 | 7,118,628 | |||||||||
Basic earnings per common share | $ | 2.51 | $ | 2.31 | $ | 2.14 | ||||||
Diluted earnings per share | ||||||||||||
Net income available to common shareholders | $ | 25,239 | $ | 21,900 | $ | 15,226 | ||||||
Weighted-average common shares | 10,041,581 | 9,490,506 | 7,118,628 | |||||||||
Dilutive effect of warrants | — | — | 6,120 | |||||||||
Dilutive effect of equity compensation | 2,902 | 18,147 | 24,554 | |||||||||
Weighted-average common and incremental shares | 10,044,483 | 9,508,653 | 7,149,302 | |||||||||
Diluted earnings per common share (1) | $ | 2.51 | $ | 2.30 | $ | 2.13 | ||||||
(1) Potential dilutive common shares are excluded from the computation of diluted EPS in the periods where the effect would be antidilutive. Excluded from the computation of diluted EPS were weighted-average antidilutive shares totaling 15,758 and 8,523 for the years ended December 31, 2019 and 2018, respectively.
Share-based Compensation
The Company has a share-based compensation plan using the fair value recognition provisions of ASC Topic 718, Compensation - Stock Compensation. The plan is described more fully in Note 11.
Comprehensive Income
Comprehensive income consists of net income and other comprehensive income (loss). Other comprehensive income (loss) includes unrealized gains and losses on securities available-for-sale and unrealized gains and losses on cash flow hedges.
Reclassification adjustments have been determined for all components of other comprehensive income or loss reported in the consolidated statements of changes in shareholders’ equity.
Statements of Cash Flows
Cash and cash equivalents are defined to include cash on-hand, noninterest and interest-bearing amounts due from other banks and federal funds sold. Generally, federal funds are sold for one-day periods. The Company reports net cash flows for customer loan transactions and deposit transactions.
Bank-Owned Life Insurance
Bank-owned life insurance policies are carried at their cash surrender value. The Company recognizes tax-free income from the periodic increases in the cash surrender value of these policies and from death benefits.
F-15
First Internet Bancorp
Notes to Consolidated Financial Statements
(Tabular dollar amounts in thousands except per share data)
Goodwill
Goodwill is tested at least annually for impairment. If the implied fair value of goodwill is lower than its carrying amount, goodwill impairment is indicated and goodwill is written down to its implied fair value. Subsequent increases in goodwill value are not recognized in the consolidated financial statements.
Servicing Asset
Servicing assets are related to small business lending loans sold and are recognized at the time of sale when servicing is retained with the income statement effect recorded in loan servicing revenue. Servicing assets are recorded at fair value in accordance with ASC 860. Fair value is based on a third-party valuation model that calculates the present value of estimated future loan servicing revenue.
Reclassifications
Certain reclassifications have been made to the 2018 and 2017 financial statements to conform to the 2019 financial statement presentation. These reclassifications had no effect on net income.
Note 2: Cash and Cash Equivalents
At December 31, 2019, the Company’s interest-bearing and noninterest-bearing cash accounts at other institutions exceeded the limits for full FDIC insurance coverage by $275.9 million. In addition, approximately $1.9 million and $44.6 million of cash was held by the FHLB of Indianapolis and Federal Reserve Bank of Chicago, respectively, which are not federally insured.
The Company is required to maintain reserve funds in cash and/or on deposit with the Federal Reserve Bank. The reserve required at December 31, 2019 was $1.7 million.
Note 3: Securities
The following tables summarize securities available-for-sale and securities held-to-maturity as of December 31, 2019 and 2018.
December 31, 2019 | ||||||||||||||||
Amortized | Gross Unrealized | Fair | ||||||||||||||
Cost | Gains | Losses | Value | |||||||||||||
Securities available-for-sale | ||||||||||||||||
U.S. Government-sponsored agencies | $ | 77,715 | $ | 99 | $ | (1,942 | ) | $ | 75,872 | |||||||
Municipal securities | 97,447 | 1,706 | (1,501 | ) | 97,652 | |||||||||||
Agency mortgage-backed securities | 264,142 | 1,304 | (4,006 | ) | 261,440 | |||||||||||
Private label mortgage-backed securities | 63,704 | 97 | (188 | ) | 63,613 | |||||||||||
Asset-backed securities | 5,000 | — | (45 | ) | 4,955 | |||||||||||
Corporate securities | 38,632 | 220 | (1,532 | ) | 37,320 | |||||||||||
Total available-for-sale | $ | 546,640 | $ | 3,426 | $ | (9,214 | ) | $ | 540,852 | |||||||
F-16
First Internet Bancorp
Notes to Consolidated Financial Statements
(Tabular dollar amounts in thousands except per share data)
December 31, 2019 | ||||||||||||||||
Amortized | Gross Unrealized | Fair | ||||||||||||||
Cost | Gains | Losses | Value | |||||||||||||
Securities held-to-maturity | ||||||||||||||||
Municipal securities | $ | 10,142 | $ | 226 | $ | — | $ | 10,368 | ||||||||
Corporate securities | 51,736 | 588 | (132 | ) | 52,192 | |||||||||||
Total held-to-maturity | $ | 61,878 | $ | 814 | $ | (132 | ) | $ | 62,560 | |||||||
December 31, 2018 | ||||||||||||||||
Amortized | Gross Unrealized | Fair | ||||||||||||||
Cost | Gains | Losses | Value | |||||||||||||
Securities available-for-sale | ||||||||||||||||
U.S. Government-sponsored agencies | $ | 109,631 | $ | 20 | $ | (2,066 | ) | $ | 107,585 | |||||||
Municipal securities | 97,090 | 90 | (4,674 | ) | 92,506 | |||||||||||
Agency mortgage-backed securities | 242,293 | 162 | (8,721 | ) | 233,734 | |||||||||||
Private label mortgage-backed securities | 9,199 | — | (21 | ) | 9,178 | |||||||||||
Asset-backed securities | 5,002 | — | (143 | ) | 4,859 | |||||||||||
Corporate securities | 36,678 | — | (3,195 | ) | 33,483 | |||||||||||
Total available-for-sale | $ | 499,893 | $ | 272 | $ | (18,820 | ) | $ | 481,345 | |||||||
December 31, 2018 | ||||||||||||||||
Amortized | Gross Unrealized | Fair | ||||||||||||||
Cost | Gains | Losses | Value | |||||||||||||
Securities held-to-maturity | ||||||||||||||||
Municipal securities | $ | 10,157 | $ | — | $ | (356 | ) | $ | 9,801 | |||||||
Corporate securities | 12,593 | 80 | (56 | ) | 12,617 | |||||||||||
Total held-to-maturity | $ | 22,750 | $ | 80 | $ | (412 | ) | $ | 22,418 | |||||||
The carrying value of securities at December 31, 2019 is shown below by their contractual maturity date. Actual maturities will differ because borrowers may have the right to call or prepay obligations with or without call or prepayment penalties.
Available-for-Sale | ||||||||
Amortized Cost | Fair Value | |||||||
Within one year | $ | 30 | $ | 31 | ||||
One to five years | 9,200 | 7,789 | ||||||
Five to ten years | 81,237 | 80,175 | ||||||
After ten years | 123,327 | 122,849 | ||||||
213,794 | 210,844 | |||||||
Agency mortgage-backed securities | 264,142 | 261,440 | ||||||
Private label mortgage-backed securities | 63,704 | 63,613 | ||||||
Asset-backed securities | 5,000 | 4,955 | ||||||
Total | $ | 546,640 | $ | 540,852 | ||||
F-17
First Internet Bancorp
Notes to Consolidated Financial Statements
(Tabular dollar amounts in thousands except per share data)
Held-to-Maturity | ||||||||
Amortized Cost | Fair Value | |||||||
One to five years | $ | 998 | $ | 1,005 | ||||
Five to ten years | 50,848 | 51,493 | ||||||
After ten years | 10,032 | 10,062 | ||||||
Total | $ | 61,878 | $ | 62,560 | ||||
There were no gross realized gains resulting from sales of available-for-sale securities recognized during the twelve months ended December 31, 2019, 2018, and 2017. There were gross realized losses of $0.5 million, $0.0 million, and $0.0 million resulting from sales of available-for-sale securities recognized during the twelve months ended December 31, 2019, 2018, and 2017, respectively.
As of December 31, 2019, the fair value of available-for-sale investment securities pledged as collateral was $469.0 million. The Company pledged the securities for various types of transactions, including FHLB advances, derivative financial instruments and to collateralize municipal deposits.
Certain investments in debt securities are reported in the consolidated financial statements at an amount less than their historical cost. Total fair value of these investments at December 31, 2019 and 2018 was $317.5 million and $469.8 million, which is approximately 53% and 93%, respectively, of the Company’s available-for-sale and held-to-maturity securities portfolio. These declines primarily resulted from fluctuations in market interest rates after purchase. Management believes the declines in fair value for these securities are temporary.
Should the impairment of any of these securities become other than temporary, the cost basis of the investment will be reduced with the resulting loss recognized in net income in the period the other-than-temporary impairment is identified.
U.S. Government-Sponsored Agencies, Municipal Securities, and Corporate Securities
The unrealized losses on the Company’s investments in securities issued by U.S. Government-sponsored agencies, municipal organizations and corporate entities were caused by interest rate changes. The contractual terms of those investments do not permit the issuer to settle the securities at a price less than the amortized cost bases of the investments. Because the Company does not intend to sell the investments and it is not likely that the Company will be required to sell the investments before recovery of their amortized cost bases, which may be maturity, the Company does not consider those investments to be other-than-temporarily impaired at December 31, 2019.
Agency Mortgage-Backed, Private-Label Mortgage-Backed and Asset-Backed Securities
The unrealized losses on the Company’s investments in agency mortgage-backed, private-label mortgage-backed and asset-backed securities were caused by interest rate changes. The Company expects to recover the amortized cost bases over the term of the securities. Because the Company does not intend to sell the investments and it is not likely that the Company will be required to sell the investments before recovery of their amortized cost bases, which may be maturity, the Company does not consider those investments to be other-than-temporarily impaired at December 31, 2019.
F-18
First Internet Bancorp
Notes to Consolidated Financial Statements
(Tabular dollar amounts in thousands except per share data)
The following tables show the securities portfolio’s gross unrealized losses and fair value, aggregated by investment category and length of time that individual securities have been in a continuous unrealized loss position at December 31, 2019 and 2018:
December 31, 2019 | ||||||||||||||||||||||||
Less Than 12 Months | 12 Months or Longer | Total | ||||||||||||||||||||||
Fair Value | Unrealized Losses | Fair Value | Unrealized Losses | Fair Value | Unrealized Losses | |||||||||||||||||||
Securities available-for-sale | ||||||||||||||||||||||||
U.S. Government-sponsored agencies | $ | 4,820 | $ | (61 | ) | $ | 62,182 | $ | (1,881 | ) | $ | 67,002 | $ | (1,942 | ) | |||||||||
Municipal securities | 1,279 | (1,501 | ) | — | — | 1,279 | (1,501 | ) | ||||||||||||||||
Agency mortgage-backed securities | 91,159 | (829 | ) | 83,212 | (3,177 | ) | 174,371 | (4,006 | ) | |||||||||||||||
Private label mortgage-backed securities | 30,077 | (180 | ) | 2,884 | (8 | ) | 32,961 | (188 | ) | |||||||||||||||
Asset-backed securities | — | — | 4,955 | (45 | ) | 4,955 | (45 | ) | ||||||||||||||||
Corporate securities | — | — | 22,985 | (1,532 | ) | 22,985 | (1,532 | ) | ||||||||||||||||
Total | $ | 127,335 | $ | (2,571 | ) | $ | 176,218 | $ | (6,643 | ) | $ | 303,553 | $ | (9,214 | ) | |||||||||
December 31, 2019 | ||||||||||||||||||||||||
Less Than 12 Months | 12 Months or Longer | Total | ||||||||||||||||||||||
Fair Value | Unrealized Losses | Fair Value | Unrealized Losses | Fair Value | Unrealized Losses | |||||||||||||||||||
Securities held-to-maturity | ||||||||||||||||||||||||
Corporate securities | 13,977 | (132 | ) | — | — | 13,977 | (132 | ) | ||||||||||||||||
Total | $ | 13,977 | $ | (132 | ) | $ | — | $ | — | $ | 13,977 | $ | (132 | ) | ||||||||||
December 31, 2018 | ||||||||||||||||||||||||
Less Than 12 Months | 12 Months or Longer | Total | ||||||||||||||||||||||
Fair Value | Unrealized Losses | Fair Value | Unrealized Losses | Fair Value | Unrealized Losses | |||||||||||||||||||
Securities available-for-sale | ||||||||||||||||||||||||
U.S. Government-sponsored agencies | $ | 69,798 | $ | (893 | ) | $ | 33,511 | $ | (1,173 | ) | $ | 103,309 | $ | (2,066 | ) | |||||||||
Municipals | 23,747 | (710 | ) | 59,938 | (3,964 | ) | 83,685 | (4,674 | ) | |||||||||||||||
Agency mortgage-backed securities | 47,000 | (509 | ) | 172,442 | (8,212 | ) | 219,442 | (8,721 | ) | |||||||||||||||
Private label mortgage-backed securities | 9,177 | (20 | ) | — | (1 | ) | 9,177 | (21 | ) | |||||||||||||||
Asset-backed securities | 4,859 | (143 | ) | — | — | 4,859 | (143 | ) | ||||||||||||||||
Corporate securities | 14,092 | (586 | ) | 19,391 | (2,609 | ) | 33,483 | (3,195 | ) | |||||||||||||||
Total | $ | 168,673 | $ | (2,861 | ) | $ | 285,282 | $ | (15,959 | ) | $ | 453,955 | $ | (18,820 | ) | |||||||||
December 31, 2018 | ||||||||||||||||||||||||
Less Than 12 Months | 12 Months or Longer | Total | ||||||||||||||||||||||
Fair Value | Unrealized Losses | Fair Value | Unrealized Losses | Fair Value | Unrealized Losses | |||||||||||||||||||
Securities held-to-maturity | ||||||||||||||||||||||||
Municipal securities | $ | 9,801 | $ | (356 | ) | $ | — | $ | — | $ | 9,801 | $ | (356 | ) | ||||||||||
Corporate securities | 6,037 | (56 | ) | — | — | 6,037 | (56 | ) | ||||||||||||||||
Total | $ | 15,838 | $ | (412 | ) | $ | — | $ | — | $ | 15,838 | $ | (412 | ) | ||||||||||
F-19
First Internet Bancorp
Notes to Consolidated Financial Statements
(Tabular dollar amounts in thousands except per share data)
Amounts reclassified from accumulated other comprehensive loss and the affected line items in the consolidated statements of income during the years ended December 31, 2019, 2018 and 2017 were as follows:
Details About Accumulated Other Comprehensive Loss Components | Amounts Reclassified from Accumulated Other Comprehensive Loss for the Year Ended December 31, | Affected Line Item in the Statements of Income | ||||||||||||
2019 | 2018 | 2017 | ||||||||||||
Unrealized gains and losses on securities available-for-sale | ||||||||||||||
Loss realized in earnings | $ | (458 | ) | $ | — | $ | (8 | ) | Loss on sale of securities | |||||
Total reclassified amount before tax | (458 | ) | — | (8 | ) | Income before income taxes | ||||||||
Tax benefit | (124 | ) | — | (3 | ) | Income tax provision | ||||||||
Total reclassifications out of accumulated other comprehensive loss | $ | (334 | ) | $ | — | $ | (5 | ) | Net Income | |||||
Note 4: Loans
Categories of loans include:
December 31, | ||||||||
2019 | 2018 | |||||||
Commercial loans | ||||||||
Commercial and industrial | $ | 96,420 | $ | 107,405 | ||||
Owner-occupied commercial real estate | 73,392 | 77,569 | ||||||
Investor commercial real estate | 12,567 | 5,391 | ||||||
Construction | 60,274 | 39,916 | ||||||
Single tenant lease financing | 995,879 | 919,440 | ||||||
Public finance | 687,094 | 706,342 | ||||||
Healthcare finance | 300,612 | 117,007 | ||||||
Small business lending | 60,279 | 17,370 | ||||||
Total commercial loans | 2,286,517 | 1,990,440 | ||||||
Consumer loans | ||||||||
Residential mortgage | 313,849 | 399,898 | ||||||
Home equity | 24,306 | 28,735 | ||||||
Other consumer | 295,309 | 279,771 | ||||||
Total consumer loans | 633,464 | 708,404 | ||||||
Total commercial and consumer loans | 2,919,981 | 2,698,844 | ||||||
Net deferred loan origination costs and premiums and discounts on purchased loans and other(1) | 43,566 | 17,384 | ||||||
Total loans | 2,963,547 | 2,716,228 | ||||||
Allowance for loan losses | (21,840 | ) | (17,896 | ) | ||||
Net loans | $ | 2,941,707 | $ | 2,698,332 | ||||
(1) Includes carrying value adjustments of $21.4 million and $5.0 million as of December 31, 2019 and 2018, respectively, related to interest rate swaps associated with public finance loans.
F-20
First Internet Bancorp
Notes to Consolidated Financial Statements
(Tabular dollar amounts in thousands except per share data)
The risk characteristics of each loan portfolio segment are as follows:
Commercial and Industrial: Commercial and industrial loans’ sources of repayment are primarily based on the identified cash flows of the borrower and secondarily on the underlying collateral provided by the borrower. The cash flows of borrowers, however, may not be as expected, and the collateral securing these loans may fluctuate in value. Loans are made for working capital, equipment purchases, or other purposes. Most commercial and industrial loans are secured by the assets being financed and may incorporate a personal guarantee. This portfolio segment is generally concentrated in Central Indiana and adjacent markets and the greater Phoenix, Arizona market.
Owner-Occupied Commercial Real Estate: The primary source of repayment is the cash flow from the ongoing operations and activities conducted by the borrower, or an affiliate of the borrower, who owns the property. This portfolio segment is generally concentrated in Central Indiana and adjacent markets and the greater Phoenix, Arizona market and its loans are often secured by manufacturing and service facilities, as well as office buildings.
Investor Commercial Real Estate: These loans are underwritten primarily based on the cash flow expected to be generated from the property and are secondarily supported by the value of the real estate. These loans typically incorporate a personal guarantee from the primary sponsor or sponsors. This portfolio segment generally involves larger loan amounts with repayment primarily dependent on the successful leasing and operation of the property securing the loan or the business conducted on the property securing the loan. Investor commercial real estate loans may be more adversely affected by changing economic conditions in the real estate markets, industry dynamics or the overall health of the local economy where the property is located. The properties securing the Company’s investor commercial real estate portfolio tend to be diverse in terms of property type and are generally located in the state of Indiana or markets immediately adjacent to Indiana. Management monitors and evaluates commercial real estate loans based on property financial performance, collateral value, guarantor strength, economic and industry conditions together with other risk grade criteria. As a general rule, the Company avoids financing special use projects or properties outside of its designated market areas unless other underwriting factors are present to mitigate these additional risks.
Construction: Construction loans are secured by land and related improvements and are made to assist in the construction of new structures, which may include commercial (retail, industrial, office, multi-family) properties or single family residential properties offered for sale by the builder. These loans generally finance a variety of project costs, including land, site preparation, architectural services, construction, closing and soft costs and interim financing needs. The cash flows of builders, while initially predictable, may fluctuate with market conditions, and the value of the collateral securing these loans may be subject to fluctuations based on general economic changes. This portfolio segment is generally concentrated in Central Indiana.
Single Tenant Lease Financing: These loans are made on a nationwide basis to property owners of real estate subject to long-term lease arrangements with single tenant operators. The real estate is typically operated by regionally, nationally or globally branded businesses. The loans are underwritten based on the financial strength of the borrower, characteristics of the real estate, cash flows generated from the lease arrangements and the financial strength of the tenant. Similar to the other loan portfolio segments, management monitors and evaluates these loans based on borrower and tenant financial performance, collateral value, industry trends and other risk grade criteria.
Public Finance: These loans are made to governmental and not-for-profit entities to provide both tax-exempt and taxable loans for a variety of purposes including: short-term cash-flow needs; debt refinancing; economic development; quality of life projects; infrastructure improvements; and equipment financing. The primary sources of repayment for public finance loans include pledged revenue sources including but not limited to: general obligations; property taxes; income taxes; tax increment revenue; utility revenue; gaming revenues; sales tax; and pledged general revenue. Certain loans may also include an additional collateral pledge of mortgaged property or a security interest in financed equipment. Public finance loans have been completed primarily in the Midwest, with plans to continue expanding nationwide.
Healthcare Finance: These loans are made to healthcare providers, primarily dentists, for practice acquisition refinancing that occasionally includes owner-occupied commercial real estate and equipment purchases. The sources of repayment are primarily based on the identified cash flows from operations of the borrower and related entities if the real estate is held in a separate entity and secondarily on the underlying collateral provided by the borrower. This portfolio segment
F-21
First Internet Bancorp
Notes to Consolidated Financial Statements
(Tabular dollar amounts in thousands except per share data)
was initially concentrated in the Western United States but has been growing rapidly throughout the rest of the country with the addition of a growing sales force located in Eastern and Midwestern markets.
Small Business Lending: These loans are to small businesses and generally carry a partial guaranty from the U.S. Small Business Administration ("SBA"). We generally sell the government guaranteed portion of SBA loans into the secondary market while retaining the non-guaranteed portion of the loan and the servicing rights. Loans in the small business lending portfolio have sources of repayment that are primarily based on the identified cash flows of the borrower and secondarily on any underlying collateral provided by the borrower. Loans may, but do not always, have a collateral shortfall. An SBA guaranty provides a tertiary source or repayment to the Bank in event of borrower default. Cash flows of borrowers; however, may not be as expected, and collateral securing these loans may fluctuate in value. Loans are made for a broad array of purposes including, but not limited to, providing operating cash flow, funding ownership changes, and facilitating equipment purchases. This portfolio segment has an emerging geography, with a nationwide focus.
Residential Mortgage: With respect to residential loans that are secured by 1 to 4 family residences and are generally owner occupied, the Company typically establishes a maximum loan-to-value ratio and requires private mortgage insurance if that ratio is exceeded. Repayment of these loans is primarily dependent on the financial circumstances of the borrowers, which can be impacted by economic conditions in their market areas such as unemployment levels. Repayment can also be impacted by changes in residential property values. Risk is mitigated by the fact that the loans are of smaller individual amounts and spread over a large number of borrowers in geographically diverse locations throughout the country.
Home Equity: Home equity loans and lines of credit are typically secured by a subordinate interest in 1 to 4 family residences. The properties securing the home equity portfolio segment are generally geographically diverse as the Company offers these products on a nationwide basis. Repayment of these loans and lines of credit is primarily dependent on the financial circumstances of the borrowers and may be impacted by changes in unemployment levels and property values on residential properties, among other economic conditions in the market.
Other Consumer: These loans primarily consist of consumer loans and credit cards. Consumer loans may be secured by consumer assets such as horse trailers or recreational vehicles. Some consumer loans are unsecured, such as small installment loans, home improvement loans and certain lines of credit. Repayment of consumer loans is primarily dependent upon the personal income of the borrowers, which can be impacted by economic conditions in their market areas such as unemployment levels. Risk is mitigated by the fact that the loans are of smaller individual amounts and spread over a large number of borrowers in geographically diverse locations throughout the country.
F-22
First Internet Bancorp
Notes to Consolidated Financial Statements
(Tabular dollar amounts in thousands except per share data)
The following tables present changes in the balance of the ALLL during the twelve months ended December 31, 2019, 2018, and 2017.
Twelve Months Ended December 31, 2019 | ||||||||||||||||||||
Balance, beginning of period | Provision (credit) charged to expense | Losses charged off | Recoveries | Balance, end of period | ||||||||||||||||
Allowance for loan losses: | ||||||||||||||||||||
Commercial and industrial | $ | 1,384 | $ | 1,029 | $ | (921 | ) | $ | 29 | $ | 1,521 | |||||||||
Owner-occupied commercial real estate | 783 | (222 | ) | — | — | 561 | ||||||||||||||
Investor commercial real estate | 61 | 48 | — | — | 109 | |||||||||||||||
Construction | 251 | 129 | — | — | 380 | |||||||||||||||
Single tenant lease financing | 8,827 | 2,348 | — | — | 11,175 | |||||||||||||||
Public finance | 1,670 | (90 | ) | — | — | 1,580 | ||||||||||||||
Healthcare finance | 1,264 | 1,983 | — | — | 3,247 | |||||||||||||||
Small business lending | 203 | (154 | ) | — | 5 | 54 | ||||||||||||||
Residential mortgage | 1,079 | (350 | ) | (76 | ) | 4 | 657 | |||||||||||||
Home equity | 53 | 51 | (68 | ) | 10 | 46 | ||||||||||||||
Other consumer | 2,321 | 1,194 | (1,292 | ) | 287 | 2,510 | ||||||||||||||
Total | $ | 17,896 | $ | 5,966 | $ | (2,357 | ) | $ | 335 | $ | 21,840 | |||||||||
Twelve Months Ended December 31, 2018 | ||||||||||||||||||||
Balance, beginning of period | Provision (credit) charged to expense | Losses charged off | Recoveries | Balance, end of period | ||||||||||||||||
Allowance for loan losses: | ||||||||||||||||||||
Commercial and industrial | $ | 1,724 | $ | (251 | ) | $ | (92 | ) | $ | 3 | $ | 1,384 | ||||||||
Owner-occupied commercial real estate | 762 | 21 | — | — | 783 | |||||||||||||||
Investor commercial real estate | 85 | (24 | ) | — | — | 61 | ||||||||||||||
Construction | 423 | (172 | ) | — | — | 251 | ||||||||||||||
Single tenant lease financing | 7,872 | 955 | — | — | 8,827 | |||||||||||||||
Public finance | 959 | 711 | — | — | 1,670 | |||||||||||||||
Healthcare finance | 313 | 951 | — | — | 1,264 | |||||||||||||||
Small business lending | 55 | 148 | — | — | 203 | |||||||||||||||
Residential mortgage | 956 | 127 | (9 | ) | 5 | 1,079 | ||||||||||||||
Home equity | 70 | (33 | ) | — | 16 | 53 | ||||||||||||||
Other consumer | 1,751 | 1,459 | (1,176 | ) | 287 | 2,321 | ||||||||||||||
Total | $ | 14,970 | $ | 3,892 | $ | (1,277 | ) | $ | 311 | $ | 17,896 | |||||||||
F-23
First Internet Bancorp
Notes to Consolidated Financial Statements
(Tabular dollar amounts in thousands except per share data)
Twelve Months Ended December 31, 2017 | ||||||||||||||||||||
Balance, beginning of period | Provision (credit) charged to expense | Losses charged off | Recoveries | Balance, end of period | ||||||||||||||||
Allowance for loan losses: | ||||||||||||||||||||
Commercial and industrial | $ | 1,352 | $ | 574 | $ | (271 | ) | $ | 69 | $ | 1,724 | |||||||||
Owner-occupied commercial real estate | 582 | 180 | — | — | 762 | |||||||||||||||
Investor commercial real estate | 168 | (83 | ) | — | — | 85 | ||||||||||||||
Construction | 544 | (121 | ) | — | — | 423 | ||||||||||||||
Single tenant lease financing | 6,248 | 1,624 | — | — | 7,872 | |||||||||||||||
Public finance | — | 959 | — | — | 959 | |||||||||||||||
Healthcare finance | — | 313 | — | — | 313 | |||||||||||||||
Small business lending | — | 55 | — | — | 55 | |||||||||||||||
Residential mortgage | 754 | 314 | (116 | ) | 4 | 956 | ||||||||||||||
Home equity | 102 | (55 | ) | — | 23 | 70 | ||||||||||||||
Other consumer | 1,231 | 1,112 | (895 | ) | 303 | 1,751 | ||||||||||||||
Total | $ | 10,981 | $ | 4,872 | $ | (1,282 | ) | $ | 399 | $ | 14,970 | |||||||||
F-24
First Internet Bancorp
Notes to Consolidated Financial Statements
(Tabular dollar amounts in thousands except per share data)
The following tables present the balance in the allowance for loan losses and the recorded investment in loans based on portfolio segment and impairment method as of December 31, 2019 and 2018.
Loans | Allowance for Loan Losses | ||||||||||||||||||||||
December 31, 2019 | Ending Balance: Collectively Evaluated for Impairment | Ending Balance: Individually Evaluated for Impairment | Ending Balance | Ending Balance: Collectively Evaluated for Impairment | Ending Balance: Individually Evaluated for Impairment | Ending Balance | |||||||||||||||||
Commercial and industrial | $ | 93,520 | $ | 2,900 | $ | 96,420 | $ | 1,412 | $ | 109 | $ | 1,521 | |||||||||||
Owner-occupied commercial real estate | 71,067 | 2,325 | 73,392 | 561 | — | 561 | |||||||||||||||||
Investor commercial real estate | 12,567 | — | 12,567 | 109 | — | 109 | |||||||||||||||||
Construction | 60,274 | — | 60,274 | 380 | — | 380 | |||||||||||||||||
Single tenant lease financing | 991,199 | 4,680 | 995,879 | 9,515 | 1,660 | 11,175 | |||||||||||||||||
Public finance | 687,094 | — | 687,094 | 1,580 | — | 1,580 | |||||||||||||||||
Healthcare finance | 300,612 | — | 300,612 | 3,247 | — | 3,247 | |||||||||||||||||
Small business lending | 56,941 | 3,338 | 60,279 | 54 | — | 54 | |||||||||||||||||
Residential mortgage | 312,714 | 1,135 | 313,849 | 657 | — | 657 | |||||||||||||||||
Home equity | 24,306 | — | 24,306 | 46 | — | 46 | |||||||||||||||||
Other consumer | 295,266 | 43 | 295,309 | 2,510 | — | 2,510 | |||||||||||||||||
Total | $ | 2,905,560 | $ | 14,421 | $ | 2,919,981 | $ | 20,071 | $ | 1,769 | $ | 21,840 | |||||||||||
Loans | Allowance for Loan Losses | ||||||||||||||||||||||
December 31, 2018 | Ending Balance: Collectively Evaluated for Impairment | Ending Balance: Individually Evaluated for Impairment | Ending Balance | Ending Balance: Collectively Evaluated for Impairment | Ending Balance: Individually Evaluated for Impairment | Ending Balance | |||||||||||||||||
Commercial and industrial | $ | 101,765 | $ | 5,640 | $ | 107,405 | $ | 1,384 | $ | — | $ | 1,384 | |||||||||||
Owner-occupied commercial real estate | 76,216 | 1,353 | 77,569 | 783 | — | 783 | |||||||||||||||||
Investor commercial real estate | 5,391 | — | 5,391 | 61 | — | 61 | |||||||||||||||||
Construction | 39,916 | — | 39,916 | 251 | — | 251 | |||||||||||||||||
Single tenant lease financing | 919,440 | — | 919,440 | 8,827 | — | 8,827 | |||||||||||||||||
Public finance | 706,342 | — | 706,342 | 1,670 | — | 1,670 | |||||||||||||||||
Healthcare finance | 117,007 | — | 117,007 | 1,264 | — | 1,264 | |||||||||||||||||
Small business lending | 16,414 | 956 | 17,370 | 203 | — | 203 | |||||||||||||||||
Residential mortgage | 399,328 | 570 | 399,898 | 1,079 | — | 1,079 | |||||||||||||||||
Home equity | 28,680 | 55 | 28,735 | 53 | — | 53 | |||||||||||||||||
Other consumer | 279,714 | 57 | 279,771 | 2,321 | — | 2,321 | |||||||||||||||||
Total | $ | 2,690,213 | $ | 8,631 | $ | 2,698,844 | $ | 17,896 | $ | — | $ | 17,896 | |||||||||||
F-25
First Internet Bancorp
Notes to Consolidated Financial Statements
(Tabular dollar amounts in thousands except per share data)
The Company utilizes a risk grading matrix to assign a risk grade to each of its commercial loans. A description of the general characteristics of the risk grades is as follows:
• | “Pass” - Higher quality loans that do not fit any of the other categories described below. |
• | “Special Mention” - Loans that possess some credit deficiency or potential weakness which deserve close attention. |
• | “Substandard” - Loans that possess a defined weakness or weaknesses that jeopardize the liquidation of the debt. Loans characterized by the distinct possibility that the institution will sustain some loss if the deficiencies are not corrected. Loans that are inadequately protected by the current net worth and paying capacity of the obligor or of the collateral pledged, if any. |
• | “Doubtful” - Such loans have been placed on nonaccrual status and may be heavily dependent upon collateral possessing a value that is difficult to determine or based upon some near-term event which lacks clear certainty. These loans have all of the weaknesses of those classified as Substandard; however, based on existing conditions, these weaknesses make full collection of the principal balance highly improbable. |
• | “Loss” - Loans that are considered uncollectible and of such little value that continuing to carry them as assets is not warranted. |
The following tables present the credit risk profile of the Company’s commercial and consumer loan portfolios based on rating category and payment activity as of December 31, 2019 and 2018.
December 31, 2019 | |||||||||||||||
Pass | Special Mention | Substandard | Total | ||||||||||||
Commercial and industrial | $ | 89,818 | $ | 3,973 | $ | 2,629 | $ | 96,420 | |||||||
Owner-occupied commercial real estate | 71,068 | 1,727 | 597 | 73,392 | |||||||||||
Investor commercial real estate | 12,567 | — | — | 12,567 | |||||||||||
Construction | 60,274 | — | — | 60,274 | |||||||||||
Single tenant lease financing | 983,448 | 7,751 | 4,680 | 995,879 | |||||||||||
Public finance | 687,094 | — | — | 687,094 | |||||||||||
Healthcare finance | 300,612 | — | — | 300,612 | |||||||||||
Small business lending | 55,206 | 1,735 | 3,338 | 60,279 | |||||||||||
Total commercial loans | $ | 2,260,087 | $ | 15,186 | $ | 11,244 | $ | 2,286,517 | |||||||
December 31, 2019 | ||||||||||||
Performing | Nonaccrual | Total | ||||||||||
Residential mortgage | $ | 313,088 | $ | 761 | $ | 313,849 | ||||||
Home equity | 24,306 | — | 24,306 | |||||||||
Other consumer | 295,276 | 33 | 295,309 | |||||||||
Total | $ | 632,670 | $ | 794 | $ | 633,464 | ||||||
F-26
First Internet Bancorp
Notes to Consolidated Financial Statements
(Tabular dollar amounts in thousands except per share data)
December 31, 2018 | |||||||||||||||
Pass | Special Mention | Substandard | Total | ||||||||||||
Commercial and industrial | $ | 100,689 | $ | 1,076 | $ | 5,640 | $ | 107,405 | |||||||
Owner-occupied commercial real estate | 73,593 | 2,623 | 1,353 | 77,569 | |||||||||||
Investor commercial real estate | 5,391 | — | — | 5,391 | |||||||||||
Construction | 39,916 | — | — | 39,916 | |||||||||||
Single tenant lease financing | 913,984 | 5,456 | — | 919,440 | |||||||||||
Public finance | 706,342 | — | — | 706,342 | |||||||||||
Healthcare finance | 117,007 | — | — | 117,007 | |||||||||||
Small business lending | 14,648 | 1,766 | 956 | 17,370 | |||||||||||
Total commercial loans | $ | 1,971,570 | $ | 10,921 | $ | 7,949 | $ | 1,990,440 | |||||||
December 31, 2018 | ||||||||||||
Performing | Nonaccrual | Total | ||||||||||
Residential mortgage | $ | 399,723 | $ | 175 | $ | 399,898 | ||||||
Home equity | 28,680 | 55 | 28,735 | |||||||||
Other consumer | 279,729 | 42 | 279,771 | |||||||||
Total | $ | 708,132 | $ | 272 | $ | 708,404 | ||||||
The following tables present the Company’s loan portfolio delinquency analysis as of December 31, 2019 and 2018.
December 31, 2019 | ||||||||||||||||||||||||||||||||
30-59 Days Past Due | 60-89 Days Past Due | 90 Days or More Past Due | Total Past Due | Current | Total loans | Nonaccrual Loans | Total Loans 90 Days or More Past Due and Accruing | |||||||||||||||||||||||||
Commercial and industrial | $ | 15 | $ | 96 | $ | 122 | $ | 233 | $ | 96,187 | $ | 96,420 | $ | 226 | $ | — | ||||||||||||||||
Owner-occupied commercial real estate | — | — | 464 | 464 | 72,928 | 73,392 | 464 | — | ||||||||||||||||||||||||
Investor commercial real estate | — | — | — | — | 12,567 | 12,567 | — | — | ||||||||||||||||||||||||
Construction | — | — | — | — | 60,274 | 60,274 | — | — | ||||||||||||||||||||||||
Single tenant lease financing | — | 4,680 | — | 4,680 | 991,199 | 995,879 | 4,680 | — | ||||||||||||||||||||||||
Public finance | — | — | — | — | 687,094 | 687,094 | — | — | ||||||||||||||||||||||||
Healthcare finance | — | — | — | — | 300,612 | 300,612 | — | — | ||||||||||||||||||||||||
Small business lending | 54 | — | — | 54 | 60,225 | 60,279 | — | — | ||||||||||||||||||||||||
Residential mortgage | — | — | 1,177 | 1,177 | 312,672 | 313,849 | 761 | 416 | ||||||||||||||||||||||||
Home equity | — | — | — | — | 24,306 | 24,306 | — | — | ||||||||||||||||||||||||
Other consumer | 240 | 107 | — | 347 | 294,962 | 295,309 | 33 | — | ||||||||||||||||||||||||
Total | $ | 309 | $ | 4,883 | $ | 1,763 | $ | 6,955 | $ | 2,913,026 | $ | 2,919,981 | $ | 6,164 | $ | 416 | ||||||||||||||||
F-27
First Internet Bancorp
Notes to Consolidated Financial Statements
(Tabular dollar amounts in thousands except per share data)
December 31, 2018 | ||||||||||||||||||||||||||||||||
30-59 Days Past Due | 60-89 Days Past Due | 90 Days or More Past Due | Total Past Due | Current | Total loans | Nonaccrual Loans | Total Loans 90 Days or More Past Due and Accruing | |||||||||||||||||||||||||
Commercial and industrial | $ | 9 | $ | — | $ | — | $ | 9 | $ | 107,396 | $ | 107,405 | $ | 195 | $ | — | ||||||||||||||||
Owner-occupied commercial real estate | 92 | 234 | — | 326 | 77,243 | 77,569 | 325 | — | ||||||||||||||||||||||||
Investor commercial real estate | — | — | — | — | 5,391 | 5,391 | — | — | ||||||||||||||||||||||||
Construction | — | — | — | — | 39,916 | 39,916 | — | — | ||||||||||||||||||||||||
Single tenant lease financing | — | — | — | — | 919,440 | 919,440 | — | — | ||||||||||||||||||||||||
Public finance | — | — | — | — | 706,342 | 706,342 | — | — | ||||||||||||||||||||||||
Healthcare finance | — | — | — | — | 117,007 | 117,007 | — | — | ||||||||||||||||||||||||
Small business lending | — | — | — | — | 17,370 | 17,370 | — | — | ||||||||||||||||||||||||
Residential mortgage | — | 3,118 | 98 | 3,216 | 396,682 | 399,898 | 175 | 97 | ||||||||||||||||||||||||
Home equity | — | — | 55 | 55 | 28,680 | 28,735 | 55 | — | ||||||||||||||||||||||||
Other consumer | 235 | 170 | 4 | 409 | 279,362 | 279,771 | 42 | — | ||||||||||||||||||||||||
Total | $ | 336 | $ | 3,522 | $ | 157 | $ | 4,015 | $ | 2,694,829 | $ | 2,698,844 | $ | 792 | $ | 97 | ||||||||||||||||
The following tables present the Company’s impaired loans as of December 31, 2019 and 2018.
December 31, 2019 | December 31, 2018 | |||||||||||||||||||||||
Recorded Balance | Unpaid Principal Balance | Specific Allowance | Recorded Balance | Unpaid Principal Balance | Specific Allowance | |||||||||||||||||||
Loans without a specific valuation allowance | ||||||||||||||||||||||||
Commercial and industrial | $ | 2,693 | $ | 2,694 | $ | — | $ | 5,640 | $ | 5,652 | $ | — | ||||||||||||
Owner-occupied commercial real estate | 2,325 | 2,327 | — | 1,353 | 1,353 | — | ||||||||||||||||||
Small business lending | 3,338 | 3,338 | — | 956 | 956 | |||||||||||||||||||
Residential mortgage | 1,135 | 1,209 | — | 570 | 570 | — | ||||||||||||||||||
Home equity | — | — | — | 55 | 55 | — | ||||||||||||||||||
Other consumer | 43 | 107 | — | 57 | 124 | — | ||||||||||||||||||
Total | 9,534 | 9,675 | — | 8,631 | 8,710 | — | ||||||||||||||||||
Loans with a specific valuation allowance | ||||||||||||||||||||||||
Commercial and industrial | $ | 207 | $ | 244 | $ | 109 | $ | — | $ | — | $ | — | ||||||||||||
Single tenant lease financing | 4,680 | 4,680 | 1,660 | — | — | — | ||||||||||||||||||
Total | 4,887 | 4,924 | 1,769 | — | — | — | ||||||||||||||||||
Total impaired loans | $ | 14,421 | $ | 14,599 | $ | 1,769 | $ | 8,631 | $ | 8,710 | $ | — | ||||||||||||
F-28
First Internet Bancorp
Notes to Consolidated Financial Statements
(Tabular dollar amounts in thousands except per share data)
The following table presents average balances and interest income recognized for impaired loans during the twelve months ended December 31, 2019, 2018, and 2017.
Twelve Months Ended | ||||||||||||||||||||||||
December 31, 2019 | December 31, 2018 | December 31, 2017 | ||||||||||||||||||||||
Average Balance | Interest Income | Average Balance | Interest Income | Average Balance | Interest Income | |||||||||||||||||||
Loans without a specific valuation allowance | ||||||||||||||||||||||||
Commercial and industrial | $ | 3,293 | $ | 289 | $ | 5,961 | $ | 426 | $ | 2,942 | $ | 146 | ||||||||||||
Owner-occupied commercial real estate | 3,292 | 170 | 833 | 44 | 3 | — | ||||||||||||||||||
Small business lending | 331 | 94 | 60 | 15 | — | — | ||||||||||||||||||
Residential mortgage | 2,265 | — | 720 | — | 1,546 | 6 | ||||||||||||||||||
Home equity | 10 | — | 61 | — | 5 | — | ||||||||||||||||||
Other consumer | 68 | 1 | 108 | — | 105 | 4 | ||||||||||||||||||
Total | 9,259 | 554 | 7,743 | 485 | 4,601 | 156 | ||||||||||||||||||
Loans with a specific valuation allowance | ||||||||||||||||||||||||
Commercial and industrial | 1,077 | — | — | — | 35 | — | ||||||||||||||||||
Single tenant lease financing | 1,464 | — | — | — | — | — | ||||||||||||||||||
Total | 2,541 | — | — | — | 35 | — | ||||||||||||||||||
Total impaired loans | $ | 11,800 | $ | 554 | $ | 7,743 | $ | 485 | $ | 4,636 | $ | 156 | ||||||||||||
The Company had $0.0 million and $0.6 million in residential mortgage other real estate owned as of December 31, 2019 and December 31, 2018, respectively. There were no loans in the process of foreclosure at December 31, 2019 and December 31, 2018, respectively.
Troubled Debt Restructurings
The loan portfolio includes TDRs, which are loans that have been modified to grant economic concessions to borrowers who have experienced financial difficulties. These concessions typically result from loss mitigation efforts and could include reductions in the interest rate, payment extensions, forgiveness of principal, forbearance, or other actions. Certain TDRs are classified as nonperforming at the time of restructuring and typically are returned to performing status after considering the borrower’s sustained repayment performance for a reasonable period, generally not less than six consecutive months.
When loans are modified in a TDR, any possible impairment similar to other impaired loans is evaluated based on the present value of expected future cash flows, discounted at the contractual interest rate of the original loan agreement, or using the current fair value of the collateral, less selling costs for collateral-dependent loans. If it is determined that the value of the modified loan is less than the recorded balance of the loan, impairment is recognized through a specific allowance or charge-off to the allowance. In periods subsequent to modification, all TDRs, including those that have payment defaults, are evaluated for possible impairment, and impairment is recognized through the allowance.
In the course of working with troubled borrowers, the Company may choose to restructure the contractual terms of certain loans in an effort to work out an alternative payment schedule with the borrower in order to optimize the collectability of the loan. Any loan modification is reviewed by the Company to identify whether a TDR has occurred when the Company grants a concession to the borrower that it would not otherwise consider based on economic or legal reasons related to a borrower’s financial difficulties. Terms may be modified to fit the ability of the borrower to repay in line with its current financial status or the loan may be restructured to secure additional collateral and/or guarantees to support the debt, or a combination of the two.
There were four commercial and industrial loans classified as new TDRs during the twelve months ended December 31, 2019 with a pre-modification and post-modification outstanding recorded investment of $2.0 million. The Company did not allocate a specific allowance for those loans as of December 31, 2019 and the modifications consisted of interest-only payments for a period of time. There were no loans classified as new TDRs during the twelve months ended December
F-29
First Internet Bancorp
Notes to Consolidated Financial Statements
(Tabular dollar amounts in thousands except per share data)
31, 2018. There were two commercial and industrial loans classified as new TDRs during the twelve months ended December 31, 2017 with a pre-modification and post-modification outstanding recorded investment of $1.8 million. These loans were paid-in-full in the fourth quarter of 2017. The 2017 modifications consisted of maturity date amendments and certain other term modifications.
There were no performing TDRs which had payment defaults within the twelve months following modification during the years ended December 31, 2019, 2018 and 2017.
Note 5: Premises and Equipment
The following table summarizes premises and equipment at December 31, 2019 and 2018.
December 31, | ||||||||
2019 | 2018 | |||||||
Land | $ | 2,500 | $ | 2,500 | ||||
Right of use leased asset | 1,602 | — | ||||||
Building and improvements | 10,004 | 6,752 | ||||||
Furniture and equipment | 9,689 | 9,076 | ||||||
Less: accumulated depreciation | (9,165 | ) | (7,631 | ) | ||||
$ | 14,630 | $ | 10,697 | |||||
During 2018, the Bank's subsidiary, SPF15, Inc., (“SPF15”) acquired several parcels of land consisting of approximately 3.3 acres located in Fishers, Indiana for approximately $10.2 million, inclusive of acquisition costs. Pursuant to a Land Acquisition Agreement with the City of Fishers, Indiana (the “City”), and its Redevelopment Commission, among others, the City agreed to reimburse SPF15 for the purchase price and other specified land acquisition costs. The Land Acquisition Agreement was replaced by a Project Agreement in December 2018, which extended the reimbursement deadline to October 31, 2019 and made additional financial incentives available to the Company for constructing an office building and associated parking garage on the property. As contemplated under the Project Agreement, the City transferred to SPF15 two additional parcels of land consisting of approximately 0.75 acres and SPF15 transferred to the Fishers Town Hall Building Corporation and third parties a certain parcel of land consisting of approximately 1.65 acres in connection with the development of the property. On October 25, 2019, the City satisfied its reimbursement obligation, resulting in the payment of SPF15 of an aggregate of $11.1 million for purchase prices and other specified land acquisition costs.
Site demolition has been completed and construction of a multi-use development, to include the Company's future headquarters, began on October 7, 2019. Development of the site is estimated to be substantially completed by September 30, 2021.
Note 6: | Leases |
A lease is defined as a contract, or part of a contract, that conveys the right to control the use of identified property or equipment for a period of time in exchange for consideration. On January 1, 2019, the Company adopted ASU 2016-02 - Leases (Topic 842) and elected the optional transition method, which allows the Company to not separate non-lease components from the associated lease component if certain conditions are met. In addition, the Company elected not to adjust prior comparative periods. Refer to Note 22 for further information regarding transition guidance related to the new standard.
The Company has three operating leases that are used for general office operations with remaining lease terms of two to four years. With the adoption of ASU 2016-02, operating lease agreements are required to be recognized on the consolidated balance sheets as a right-of-use asset and a corresponding lease liability.
F-30
First Internet Bancorp
Notes to Consolidated Financial Statements
(Tabular dollar amounts in thousands except per share data)
The following table shows the components of lease expense.
(in thousands) | Twelve Months Ended | |||||||||||
December 31, 2019 | December 31, 2018 | December 31, 2017 | ||||||||||
Operating lease cost | $ | 758 | $ | 724 | $ | 711 | ||||||
The following table shows supplemental cash flow information related to leases.
(in thousands) | Twelve Months Ended | |||
December 31, 2019 | ||||
Cash paid for amounts included in the measurement of lease liabilities: | ||||
Operating cash flows from operating leases | $ | 814 | ||
The following table shows the operating leases’ impact on the consolidated balance sheets. The Company elected not to include short-term leases (leases with original terms of 12 months or less) or equipment leases, as those amounts are insignificant. The Company’s leases do not provide an implicit rate. The discount rate utilized to determine the present value of lease payments is the Company’s incremental borrowing rate based on the information available at the lease inception date. The incremental borrowing rate is the rate of interest the Company would have to pay to borrow on a collateralized basis over a similar term in an amount equal to the lease payments in a similar economic environment.
(dollars in thousands) | ||||
December 31, 2019 | ||||
Operating lease right-of-use assets | $ | 1,602 | ||
Operating lease liabilities | 1,602 | |||
Weighted-average remaining lease term (years) | ||||
Operating leases | 2.4 | |||
Weighted-average discount rate | ||||
Operating leases | 2.0 | % | ||
The following table shows the future minimum payments of operating leases with initial or remaining terms of one year or more as of December 31, 2019.
(in thousands) | ||||
Twelve months ended December 31, 2019 | ||||
2020 | $ | 867 | ||
2021 | 423 | |||
2022 | 238 | |||
2023 | 116 | |||
2024 | — | |||
Thereafter | — | |||
Total lease payments | 1,644 | |||
Less imputed interest | (49 | ) | ||
Total | $ | 1,595 | ||
F-31
First Internet Bancorp
Notes to Consolidated Financial Statements
(Tabular dollar amounts in thousands except per share data)
Note 7: Goodwill
As of December 31, 2019 and 2018, the carrying amount of goodwill was $4.7 million. There have been no changes in the carrying amount of goodwill for the three years ended December 31, 2019, 2018, and 2017. Goodwill is tested for impairment on an annual basis as of August 31, or whenever events or changes in circumstances indicate the carrying amount of goodwill exceeds its implied fair value. The annual test indicated no impairment existed as of August 31, 2019 and no events or changes in circumstances have occurred since the August 31, 2019 annual impairment test that would suggest it was more likely than not goodwill impairment existed.
Note 8: Deposits
The following table presents the composition of the Company’s deposit base as of December 31, 2019 and 2018.
December 31, | ||||||||
2019 | 2018 | |||||||
Noninterest-bearing demand deposit accounts | $ | 57,115 | $ | 43,301 | ||||
Interest-bearing demand deposit accounts | 129,020 | 121,055 | ||||||
Regular savings accounts | 29,616 | 38,489 | ||||||
Money market accounts | 786,390 | 528,533 | ||||||
Certificates of deposits | 1,613,453 | 1,292,883 | ||||||
Brokered deposits | 538,369 | 647,090 | ||||||
Total deposits | $ | 3,153,963 | $ | 2,671,351 | ||||
Time deposits (in the amount of $250 or more) | $ | 536,028 | $ | 494,403 | ||||
The following table presents time deposit maturities by year as of December 31, 2019.
2020 | $ | 943,678 | |
2021 | 528,757 | ||
2022 | 124,544 | ||
2023 | 81,447 | ||
2024 | 69,081 | ||
Thereafter | 250 | ||
$ | 1,747,757 | ||
Note 9: FHLB Advances
The Company had outstanding FHLB advances of $514.9 million and $525.2 million as of December 31, 2019 and 2018, respectively. As of December 31, 2019, the stated interest rates on the Company’s outstanding FHLB advances ranged from 1.06% to 3.26%, with a weighted average interest rate of 1.98%. All advances are collateralized by residential mortgage loans and commercial real estate loans pledged and held by the Company and investment securities pledged by the Company and held in safekeeping with the FHLB. Residential mortgage loans pledged were approximately $166.6 million and $238.6 million as of December 31, 2019 and 2018, respectively, and commercial real estate loans pledged were approximately $956.3 million and $881.7 million as of December 31, 2019 and 2018, respectively. The fair value of investment securities pledged to the FHLB was approximately $356.8 million and $339.1 million as of December 31, 2019 and 2018, respectively. Based on this collateral and the Company’s holdings of FHLB stock, the Company is eligible to borrow up to an additional $496.1 million at year-end 2019. As of December 31, 2019, the Company had $305.0 million of putable advances with the FHLB.
F-32
First Internet Bancorp
Notes to Consolidated Financial Statements
(Tabular dollar amounts in thousands except per share data)
The Company’s FHLB advances are scheduled to mature according to the following schedule:
Amount | |||
2020 | $ | 110,000 | |
2021 | — | ||
2022 | — | ||
2023 | 35,000 | ||
2024 | 145,000 | ||
Thereafter | 225,000 | ||
515,000 | |||
Net deferred prepayment gain on advance restructure | (90 | ) | |
$ | 514,910 | ||
Note 10: Subordinated Debt
In October 2015, the Company entered into a term loan in the principal amount of $10.0 million, evidenced by a term note due 2025 (the “2025 Note”). The 2025 Note bears a fixed interest rate of 6.4375% per year, payable quarterly, and is scheduled to mature on October 1, 2025. The 2025 Note is an unsecured subordinated obligation of the Company and may be repaid, without penalty, on any interest payment date on or after October 15, 2020. The 2025 Note is intended to qualify as Tier 2 capital under regulatory guidelines.
In September 2016, the Company issued $25.0 million aggregate principal amount of 6.0% Fixed-to-Floating Rate Subordinated Notes due 2026 (the “2026 Notes”) in a public offering. The 2026 Notes initially bear a fixed interest rate of 6.00% per year to, but excluding, September 30, 2021, and thereafter a floating rate equal to the then-current three-month London Interbank Offered Rate (“LIBOR”) plus 485 basis points. LIBOR will be phased-out after 2021 and the transition to another benchmark rate could have an adverse effect on the 2026 Notes. Refer to Part I Item 1A. Risk Factors for more information on the LIBOR phase out. All interest on the 2026 Notes is payable quarterly. The 2026 Notes are scheduled to mature on September 30, 2026. The 2026 Notes are unsecured subordinated obligations of the Company and may be repaid, without penalty, on any interest payment date on or after September 30, 2021. The 2026 Notes are intended to qualify as Tier 2 capital under regulatory guidelines.
In June 2019, the Company issued $37.0 million aggregate principal amount of 6.0% Fixed-to-Floating Rate Subordinated Notes due 2029 (the “2029 Notes”) in a public offering. The 2029 Notes initially bear a fixed interest rate of 6.0% per year to, but excluding, June 30, 2024, and thereafter a floating rate equal to the then-current benchmark rate (initially three-month LIBOR rate) plus 411 basis points. All interest on the 2029 Notes is payable quarterly. The 2029 Notes are scheduled to mature on June 30, 2029. The 2029 Notes are unsecured subordinated obligations of the Company and may be repaid, without penalty, on any interest payment date on or after June 30, 2024. The 2029 Notes are intended to qualify as Tier 2 capital under regulatory guidelines.
F-33
First Internet Bancorp
Notes to Consolidated Financial Statements
(Tabular dollar amounts in thousands except per share data)
The following table presents the principal balance and unamortized discount and debt issuance costs for the 2025 Note, the 2026 Notes and the 2029 Notes as of December 31, 2019 and 2018.
December 31, 2019 | December 31, 2018 | |||||||||||
Principal | Unamortized Discount and Debt Issuance Costs | Principal | Unamortized Discount and Debt Issuance Costs | |||||||||
2025 Note | $ | 10,000 | (138 | ) | 10,000 | (162 | ) | |||||
2026 Notes | 25,000 | (839 | ) | 25,000 | (963 | ) | ||||||
2029 Notes | 37,000 | (1,495 | ) | — | — | |||||||
Total | $ | 72,000 | (2,472 | ) | 35,000 | (1,125 | ) | |||||
Note 11: Benefit Plans
401(k) Plan
The Company has a 401(k) plan established for substantially all full-time employees, as defined in the plan. Employee contributions are limited to the maximum established by the Internal Revenue Service on an annual basis. The Company has elected to match contributions equal to 100% of the first 1% of employee deferrals and then 50% on deferrals over 1% up to a maximum of 6% of an individual’s total eligible salary, as defined in the plan, which vests immediately. Discretionary employer-matching contributions begin vesting after one year at a rate of 50% per year of employment and are fully vested after the completion of two years of employment. Contributions totaled approximately $0.6 million, $0.5 million and $0.5 million in the twelve months ended December 31, 2019, 2018 and 2017, respectively.
Employment Agreement
The Company has entered into an employment agreement with its Chief Executive Officer that provides for an annual base salary and an annual bonus, if any, as determined from time to time by the Compensation Committee. The annual bonus is to be determined with reference to the achievement of annual performance objectives established by the Compensation Committee for the Chief Executive Officer and other senior officers. The agreement also provides that the Chief Executive Officer may be awarded additional compensation, benefits or consideration as the Compensation Committee may determine.
The agreement provides for the continuation of salary and certain other benefits for a specified period of time upon termination of his employment under certain circumstances, including his resignation for "good reason" or termination by the Company without "cause" at any time or any termination of his employment for any reason within twelve months following a "change in control," along with other specific conditions.
2013 Equity Incentive Plan
The 2013 Equity Incentive Plan (“2013 Plan”) authorizes the issuance of up to 750,000 shares of the Company’s common stock in the form of equity-based awards to employees, directors, and other eligible persons. Under the terms of the 2013 Plan, the pool of shares available for issuance may be used for available types of equity awards under the 2013 Plan, which includes stock options, stock appreciation rights, restricted stock awards, stock unit awards, and other share-based awards. All employees, consultants, and advisors of the Company or any subsidiary, as well as all non-employee directors of the Company, are eligible to receive awards under the 2013 Plan.
The Company recorded $1.7 million, $1.6 million, and $1.0 million of share-based compensation expense for the years ended December 31, 2019, 2018, and 2017, respectively, related to awards made under the 2013 Plan.
F-34
First Internet Bancorp
Notes to Consolidated Financial Statements
(Tabular dollar amounts in thousands except per share data)
The following table summarizes the status of the 2013 Plan awards as of December 31, 2019, and activity for the year ended December 31, 2019:
Restricted Stock Units | Weighted-Average Grant Date Fair Value Per Share | Restricted Stock Awards | Weighted-Average Grant Date Fair Value Per Share | Deferred Stock Units | Weighted-Average Grant Date Fair Value Per Unit | |||||||||||||||
Unvested at January 1, 2019 | 75,554 | $ | 35.34 | 1,666 | $ | 24.44 | — | $ | — | |||||||||||
Granted | 74,698 | 24.61 | 11,742 | 24.62 | 11 | 21.88 | ||||||||||||||
Vested | (36,218 | ) | 33.08 | (13,408 | ) | 24.60 | (11 | ) | 21.88 | |||||||||||
Forfeited | (6,790 | ) | 29.10 | — | — | — | — | |||||||||||||
Unvested at December 31, 2019 | 107,244 | $ | 29.03 | — | $ | — | — | $ | — | |||||||||||
As of December 31, 2019, the total unrecognized compensation cost related to unvested awards was $2.0 million, with a weighted-average expense recognition period of 1.8 years.
Directors Deferred Stock Plan
Until January 1, 2014, the Company had a stock compensation plan for non-employee members of the Board of Directors (“Directors Deferred Stock Plan”). The Company reserved 180,000 shares of common stock that could have been issued pursuant to the Directors Deferred Stock Plan. The plan provided directors the option to elect to receive up to 100% of their annual retainer in either common stock or deferred stock rights. Deferred stock rights were to be settled in common stock following the end of the deferral period payable on the basis of one share of common stock for each deferred stock right.
The following table summarizes the status of deferred stock rights related to the Directors Deferred Stock Plan for the year ended December 31, 2019.
Deferred Rights | |||
Outstanding, beginning of year | 83,521 | ||
Granted | 984 | ||
Exercised | — | ||
Outstanding, end of year | 84,505 | ||
All deferred stock rights granted during 2019 were additional rights issued in lieu of cash dividends payable on outstanding deferred stock rights.
Note 12: Income Taxes
The provision for income taxes consists of the following:
December 31, | ||||||||||||
2019 | 2018 | 2017 | ||||||||||
Current | $ | 6,319 | $ | 1,074 | $ | 10,998 | ||||||
Deferred | (4,402 | ) | 978 | (5,142 | ) | |||||||
Net deferred tax asset revaluation | — | — | 1,846 | |||||||||
Total | $ | 1,917 | $ | 2,052 | $ | 7,702 | ||||||
The Tax Cuts and Jobs Act of 2017 ("Tax Act") was enacted on December 22, 2017. Among other changes, the Tax Act reduced the federal corporate tax rate from 35% to 21%. Deferred tax assets and liabilities, as of December 31, 2017, were revalued based on the rate expected to reverse in the future, which was 21%.
F-35
First Internet Bancorp
Notes to Consolidated Financial Statements
(Tabular dollar amounts in thousands except per share data)
Income tax provision is reconciled to the statutory rate applied to pre-tax income. The statutory rate was 21%, 21% and 35% at December 31, 2019, 2018 and 2017, respectively.
December 31, | ||||||||||||
2019 | 2018 | 2017 | ||||||||||
Statutory rate times pre-tax income | $ | 5,703 | $ | 5,030 | $ | 8,025 | ||||||
(Subtract) add the tax effect of: | ||||||||||||
Income from tax-exempt securities and loans | (4,881 | ) | (3,833 | ) | (2,512 | ) | ||||||
State income tax, net of federal tax effect | 1,285 | 1,164 | 693 | |||||||||
Bank-owned life insurance | (198 | ) | (200 | ) | (318 | ) | ||||||
Net deferred tax asset revaluation | — | — | 1,846 | |||||||||
Tax credits | (181 | ) | (180 | ) | — | |||||||
Other differences | 189 | 71 | (32 | ) | ||||||||
Total income taxes | $ | 1,917 | $ | 2,052 | $ | 7,702 | ||||||
The net deferred tax asset at December 31, 2019 and 2018 consists of the following:
December 31, | ||||||||
2019 | 2018 | |||||||
Deferred tax assets (liabilities) | ||||||||
Allowance for loan losses | $ | 5,897 | $ | 4,832 | ||||
Unrealized loss on available-for-sale securities | 5,021 | 6,137 | ||||||
Fair value adjustments | (1,011 | ) | (5,016 | ) | ||||
Depreciation | (257 | ) | (398 | ) | ||||
Deferred compensation and accrued payroll | 1,358 | 1,043 | ||||||
Loan origination costs | (1,181 | ) | (1,081 | ) | ||||
Prepaid assets | (449 | ) | (406 | ) | ||||
Net operating loss | — | 455 | ||||||
Tax credits | — | 231 | ||||||
Other | 513 | 808 | ||||||
Total deferred tax assets, net | $ | 9,891 | $ | 6,605 | ||||
Note 13: Related Party Transactions
In the normal course of business, the Company may enter into transactions with various related parties. In management’s opinion, such loans, other extensions of credit, and deposits were made in the ordinary course of business and were made on substantially the same terms (including interest rates and collateral) as those prevailing at the time for comparable transactions with other persons. Further, in management’s opinion, these loans did not involve more than the normal risk of collectability or present other unfavorable features.
Management evaluated related party loans and extensions of credit at December 31, 2019 and 2018, and deemed the balances immaterial. Deposits from related parties held by the Company at December 31, 2019 and 2018 totaled $28.3 million and $24.0 million, respectively.
F-36
First Internet Bancorp
Notes to Consolidated Financial Statements
(Tabular dollar amounts in thousands except per share data)
Note 14: Regulatory Capital Requirements
The Company and the Bank are subject to various regulatory capital requirements administered by state and federal banking agencies. Capital adequacy guidelines and, additionally for banks, prompt corrective action regulations, involve quantitative measures of assets, liabilities, and certain off-balance sheet items calculated under regulatory accounting practices. Capital amounts and classifications are also subject to qualitative judgments by regulators about components, risk weighting and other factors.
The Basel III Capital Rules became effective for the Company and the Bank on January 1, 2015, subject to a phase-in period for certain provisions. Quantitative measures established by the Basel III Capital Rules to ensure capital adequacy require the maintenance of minimum amounts and ratios of Common Equity Tier 1 capital, Tier 1 capital and Total capital, as defined in the regulations, to risk-weighted assets, and of Tier 1 capital to adjusted quarterly average assets (“Leverage Ratio”).
The Basel III Capital Rules were fully phased in on January 1, 2019 and require the Company and the Bank to maintain: 1) a minimum ratio of Common Equity Tier 1 capital to risk-weighted assets of 4.5%, plus a 2.5% “capital conservation buffer” (resulting in a minimum ratio of Common Equity Tier 1 capital to risk-weighted assets of 7.0%); 2) a minimum ratio of Tier 1 capital to risk-weighted assets of 6.0%, plus the capital conservation buffer (resulting in a minimum Tier 1 capital ratio of 8.5%); 3) a minimum ratio of Total capital to risk-weighted assets of 8.0%, plus the capital conservation buffer (resulting in a minimum Total capital ratio of 10.5%); and 4) a minimum Leverage Ratio of 4.0%.
The implementation of the capital conservation buffer began on January 1, 2016 at the 0.625% level and was phased in over a four-year period, increasing by increments of that amount on each subsequent January 1 until it reached 2.5% on January 1, 2019. The capital conservation buffer is designed to absorb losses during periods of economic stress. Failure to maintain the minimum Common Equity Tier 1 capital ratio plus the capital conservation buffer will result in potential restrictions on a banking institution’s ability to pay dividends, repurchase stock and/or pay discretionary compensation to its employees.
F-37
First Internet Bancorp
Notes to Consolidated Financial Statements
(Tabular dollar amounts in thousands except per share data)
The following tables present actual and required capital ratios as of December 31, 2019 and 2018 for the Company and the Bank under the Basel III Capital Rules. The minimum required capital amounts presented include the minimum required capital levels as of December 31, 2019 and 2018 based on the Basel III Capital Rules. Capital levels required to be considered well capitalized are based upon prompt corrective action regulations, as amended to reflect the changes under the Basel III Capital Rules.
Actual | Minimum Capital Required - Basel III | Minimum Required to be Considered Well Capitalized | |||||||||||||||||
Capital Amount | Ratio | Capital Amount | Ratio | Capital Amount | Ratio | ||||||||||||||
As of December 31, 2019: | |||||||||||||||||||
Common equity tier 1 capital to risk-weighted assets | |||||||||||||||||||
Consolidated | $ | 313,803 | 10.84 | % | $ | 202,661 | 7.00 | % | N/A | N/A | |||||||||
Bank | 341,242 | 11.80 | % | 202,480 | 7.00 | % | 188,017 | 6.50 | % | ||||||||||
Tier 1 capital to risk-weighted assets | |||||||||||||||||||
Consolidated | 313,803 | 10.84 | % | 246,088 | 8.50 | % | N/A | N/A | |||||||||||
Bank | 341,242 | 11.80 | % | 245,869 | 8.50 | % | 231,406 | 8.00 | % | ||||||||||
Total capital to risk-weighted assets | |||||||||||||||||||
Consolidated | 405,171 | 13.99 | % | 303,991 | 10.50 | % | N/A | N/A | |||||||||||
Bank | 363,082 | 12.55 | % | 303,720 | 10.50 | % | 289,257 | 10.00 | % | ||||||||||
Leverage ratio | |||||||||||||||||||
Consolidated | 313,803 | 7.64 | % | 164,219 | 4.00 | % | N/A | N/A | |||||||||||
Bank | 341,242 | 8.32 | % | 164,121 | 4.00 | % | 205,151 | 5.00 | % | ||||||||||
Actual | Minimum Capital Required - Basel III Phase-In Schedule | Minimum Capital Required - Basel III | Minimum Required to be Considered Well Capitalized | |||||||||||||||||||||||
Capital Amount | Ratio | Capital Amount | Ratio | Capital Amount | Ratio | Capital Amount | Ratio | |||||||||||||||||||
As of December 31, 2018: | ||||||||||||||||||||||||||
Common equity tier 1 capital to risk-weighted assets | ||||||||||||||||||||||||||
Consolidated | $ | 300,589 | 12.39 | % | $ | 154,613 | 6.38 | % | $ | 169,771 | 7.00 | % | N/A | N/A | ||||||||||||
Bank | 286,012 | 11.81 | % | 154,407 | 6.38 | % | 169,545 | 7.00 | % | 157,435 | 6.50 | % | ||||||||||||||
Tier 1 capital to risk-weighted assets | ||||||||||||||||||||||||||
Consolidated | 300,589 | 12.39 | % | 190,992 | 7.88 | % | 206,150 | 8.50 | % | N/A | N/A | |||||||||||||||
Bank | 286,012 | 11.81 | % | 190,738 | 7.88 | % | 205,876 | 8.50 | % | 193,766 | 8.00 | % | ||||||||||||||
Total capital to risk-weighted assets | ||||||||||||||||||||||||||
Consolidated | 352,360 | 14.53 | % | 239,498 | 9.88 | % | 254,656 | 10.50 | % | N/A | N/A | |||||||||||||||
Bank | 300,908 | 12.55 | % | 239,180 | 9.88 | % | 254,318 | 10.50 | % | 242,207 | 10.00 | % | ||||||||||||||
Leverage ratio | ||||||||||||||||||||||||||
Consolidated | 300,589 | 9.00 | % | 133,602 | 4.00 | % | 133,602 | 4.00 | % | N/A | N/A | |||||||||||||||
Bank | 286,012 | 8.57 | % | 133,474 | 4.00 | % | 133,474 | 4.00 | % | 166,843 | 5.00 | % | ||||||||||||||
F-38
First Internet Bancorp
Notes to Consolidated Financial Statements
(Tabular dollar amounts in thousands except per share data)
Note 15: Commitments and Credit Risk
In the normal course of business, the Company makes various commitments to extend credit which are not reflected in the accompanying consolidated financial statements. At December 31, 2019 and 2018, the Company had outstanding loan commitments totaling approximately $254.4 million and $223.5 million, respectively.
In addition, the Company is a limited partner in a Small Business Investment Company fund (the “SBIC Fund”). As of December 31, 2019, the Company has committed to contribute up to $2.3 million of capital to the SBIC Fund.
Capital Commitments
Capital expenditures contracted for at the balance sheet date but not yet recognized in the financial statements are associated with the construction of premises intended to house our future corporate headquarters. The Company has entered into construction-related contracts in the amount of $65.1 million. As of December 31, 2019, $61.3 million of such contract commitments had not yet been incurred. These commitments are due within 2 years.
Note 16: Fair Value of Financial Instruments
ASC Topic 820, Fair Value Measurements, defines fair value as the price that would be received to sell an asset or paid to transfer a liability in an orderly transaction between market participants at the measurement date. ASU Topic 820 also specifies a fair value hierarchy which requires an entity to maximize the use of observable inputs and minimize the use of unobservable inputs when measuring fair value. The standard describes three levels of inputs that may be used to measure fair value:
Level 1 | Quoted prices in active markets for identical assets or liabilities |
Level 2 | Observable inputs other than Level 1 prices, such as quoted prices for similar assets or liabilities; quoted prices in markets that are not active; or other inputs that are observable or can be corroborated by observable market data for substantially the full term of the assets or liabilities |
Level 3 | Unobservable inputs that are supported by little or no market activity and that are significant to the fair value of the assets or liabilities |
Following is a description of the valuation methodologies and inputs used for assets measured at fair value on a recurring basis and recognized in the accompanying consolidated balance sheets, as well as the general classification of such assets pursuant to the valuation hierarchy.
Available-for-Sale Securities
Where quoted market prices are available in an active market, securities are classified within Level 1 of the valuation hierarchy. Level 1 securities include highly liquid mutual funds. If quoted market prices are not available, then fair values are estimated by using pricing models, quoted prices of securities with similar characteristics or discounted cash flows.
Level 2 securities include U.S. Government-sponsored agencies, municipal securities, mortgage and asset-backed securities and certain corporate securities. Matrix pricing is a mathematical technique widely used in the banking industry to value investment securities without relying exclusively on quoted prices for specific investment securities but also on the investment securities’ relationship to other benchmark quoted investment securities.
In certain cases where Level 1 or Level 2 inputs are not available, securities are classified within Level 3 of the hierarchy. Fair values are calculated using discounted cash flows. Discounted cash flows are calculated based off of the anticipated future cash flows updated to incorporate loss severities. Rating agency and industry research reports as well as default and deferral activity are reviewed and incorporated into the calculation. The Company did not own any securities classified within Level 3 of the hierarchy as of December 31, 2019 or 2018.
F-39
First Internet Bancorp
Notes to Consolidated Financial Statements
(Tabular dollar amounts in thousands except per share data)
Loans Held-for-Sale (mandatory pricing agreements)
The fair value of loans held-for-sale is determined using quoted prices for similar assets, adjusted for specific attributes of that loan (Level 2).
Servicing Asset
Fair value is based on a loan-by-loan basis taking into consideration the original to maturity of the loans, the current age of the loans and the remaining term to maturity. The valuation methodology utilized for the servicing assets begins with generating estimated future cash flows for each servicing asset, based on their unique characteristics and market-based assumptions for prepayment speeds and costs to service. The present value of the future cash flows is then calculated utilizing market-based discount rate assumptions (Level 3).
Interest Rate Swap Agreements
The fair values of interest rate swap agreements are estimated using current market interest rates as of the balance sheet date and calculated using discounted cash flows that are observable or that can be corroborated by observable market data (Level 2).
Forward Contracts
The fair values of forward contracts on to-be-announced securities are determined using quoted prices in active markets, or benchmarked thereto (Level 1).
Interest Rate Lock Commitments
The fair values of IRLCs are determined using the projected sale price of individual loans based on changes in market interest rates, projected pull-through rates (the probability that an IRLC will ultimately result in an originated loan), the reduction in the value of the applicant’s option due to the passage of time, and the remaining origination costs to be incurred based on management’s estimate of market costs (Level 3).
F-40
First Internet Bancorp
Notes to Consolidated Financial Statements
(Tabular dollar amounts in thousands except per share data)
The following tables present the fair value measurements of assets and liabilities recognized in the accompanying consolidated balance sheets measured at fair value on a recurring basis and the level within the fair value hierarchy in which the fair value measurements fall at December 31, 2019 and 2018.
December 31, 2019 | ||||||||||||||||
Fair Value Measurements Using | ||||||||||||||||
Fair Value | Quoted Prices in Active Markets for Identical Assets (Level 1) | Significant Other Observable Inputs (Level 2) | Significant Unobservable Inputs (Level 3) | |||||||||||||
U.S. Government-sponsored agencies | $ | 75,872 | $ | — | $ | 75,872 | $ | — | ||||||||
Municipal securities | 97,652 | — | 97,652 | — | ||||||||||||
Agency mortgage-backed securities | 261,440 | — | 261,440 | — | ||||||||||||
Private-label mortgage-backed securities | 63,613 | — | 63,613 | — | ||||||||||||
Asset-backed securities | 4,955 | — | 4,955 | — | ||||||||||||
Corporate securities | 37,320 | — | 37,320 | — | ||||||||||||
Total available-for-sale securities | $ | 540,852 | $ | — | $ | 540,852 | $ | — | ||||||||
Servicing asset | 2,481 | — | — | 2,481 | ||||||||||||
Interest rate swaps liabilities | (37,786 | ) | — | (37,786 | ) | — | ||||||||||
Loans held-for-sale (mandatory pricing agreements) | 56,097 | — | 56,097 | — | ||||||||||||
Forward contracts | (153 | ) | (153 | ) | — | — | ||||||||||
IRLCs | 910 | — | — | 910 | ||||||||||||
December 31, 2018 | ||||||||||||||||
Fair Value Measurements Using | ||||||||||||||||
Fair Value | Quoted Prices in Active Markets for Identical Assets (Level 1) | Significant Other Observable Inputs (Level 2) | Significant Unobservable Inputs (Level 3) | |||||||||||||
U.S. Government-sponsored agencies | $ | 107,585 | $ | — | $ | 107,585 | $ | — | ||||||||
Municipal securities | 92,506 | — | 92,506 | — | ||||||||||||
Agency mortgage-backed securities | 233,734 | — | 233,734 | — | ||||||||||||
Private-label mortgage-backed securities | 9,178 | — | 9,178 | — | ||||||||||||
Asset-backed securities | 4,859 | — | 4,859 | — | ||||||||||||
Corporate securities | 33,483 | 33,483 | ||||||||||||||
Total available-for-sale securities | $ | 481,345 | $ | — | $ | 481,345 | $ | — | ||||||||
Interest rate swaps assets | 1,579 | — | (271 | ) | — | |||||||||||
Interest rate swaps liabilities | (10,727 | ) | — | (10,727 | ) | — | ||||||||||
Loans held-for-sale (mandatory pricing agreements) | 18,328 | — | 18,328 | — | ||||||||||||
Forward contracts | (360 | ) | (360 | ) | — | — | ||||||||||
IRLCs | 389 | — | — | 389 | ||||||||||||
F-41
First Internet Bancorp
Notes to Consolidated Financial Statements
(Tabular dollar amounts in thousands except per share data)
The following table reconciles the beginning and ending balances of recurring fair value measurements recognized in the accompanying consolidated balance sheets using significant unobservable (Level 3) inputs.
Interest Rate Lock Commitments | |||
Balance as of January 1, 2017 | $ | 610 | |
Total realized gains (losses) | |||
Included in net income | (59 | ) | |
Balance, December 31, 2017 | 551 | ||
Total realized gains | |||
Included in net income | (162 | ) | |
Balance, December 31, 2018 | 389 | ||
Total realized gains | |||
Included in net income | 521 | ||
Balance, December 31, 2019 | $ | 910 | |
The following describes the valuation methodologies and inputs used for assets measured at fair value on a nonrecurring basis, as well as the general classification of such assets pursuant to the valuation hierarchy.
Impaired Loans (Collateral Dependent)
Loans for which it is probable that the Company will not collect all principal and interest due according to contractual terms are measured for impairment. The amount of the impairment may be determined based on the fair value of the underlying collateral, less costs to sell, the estimated present value of future cash flows or the loan’s observable market price.
If the impaired loan is identified as collateral dependent, the fair value of the underlying collateral, less costs to sell, is used to measure impairment. This method requires obtaining a current independent appraisal of the collateral and applying a discount factor to the value. If the impaired loan is not collateral dependent, the Company utilizes a discounted cash flow analysis to measure impairment.
Impaired loans with a specific valuation allowance based on the value of the underlying collateral or a discounted cash flow analysis are classified as Level 3 assets.
2019 | ||||||||||||
Fair Value Measurements Using | ||||||||||||
Fair Value | Quoted Prices in Active Markets for Identical Assets (Level 1) | Significant Other Observable Inputs (Level 2) | Significant Unobservable Inputs (Level 3) | |||||||||
Impaired loans | 3,019 | — | — | 3,019 | ||||||||
Other Real Estate Owned
Other real estate owned is a level 3 asset that is adjusted to fair value less estimated selling costs, upon transfer to other real estate owned. When a current appraised value is not available or management determines the fair value of the collateral is further impaired below the appraised value as a result of known changes in the market or the collateral and
F-42
First Internet Bancorp
Notes to Consolidated Financial Statements
(Tabular dollar amounts in thousands except per share data)
there is no observable market price, such valuation inputs result in a fair value measurement. To the extent a negotiated sales price or reduced listing price represents a significant discount to an observable market price, such valuation input would result in a fair value measurement that is also considered a Level 3 measurement.
The following tables present the fair value measurements of assets and liabilities recognized in the accompanying consolidated balance sheets measured at fair value on a nonrecurring basis and the level within the fair value hierarchy in which the fair value measurements fall at December 31, 2019 and 2018.
2018 | ||||||||||||
Fair Value Measurements Using | ||||||||||||
Fair Value | Quoted Prices in Active Markets for Identical Assets (Level 1) | Significant Other Observable Inputs (Level 2) | Significant Unobservable Inputs (Level 3) | |||||||||
Other real estate owned | 2,065 | — | — | 2,065 | ||||||||
Unobservable (Level 3) Inputs
The following tables present quantitative information about unobservable inputs used in recurring and nonrecurring Level 3 fair value measurements other than goodwill.
Fair Value at December 31, 2019 | Valuation Technique | Unobservable Inputs | Range | |||||||
Impaired loans | $ | 3,019 | Fair value of collateral | Discount for type of property and current market conditions | 10% | |||||
IRLCs | $ | 910 | Discounted cash flow | Loan closing rates | 50% - 100% | |||||
Servicing asset | $ | 2,481 | Discounted cash flow | Prepayment speeds | 0% - 25% | |||||
Fair Value at December 31, 2018 | Valuation Technique | Unobservable Inputs | Range | |||||||
Other real estate owned | $ | 2,065 | Fair value of collateral | Discount to reflect current market conditions | 10% | |||||
IRLCs | $ | 389 | Discounted cash flow | Loan closing rates | 34% - 100% | |||||
The following methods were used to estimate the fair value of all other financial instruments recognized in the accompanying consolidated balance sheets at amounts other than fair value:
Cash and Cash Equivalents
For these instruments, the carrying amount is a reasonable estimate of fair value.
Held-to-Maturity Securities
Fair values are determined by using models that are based on security-specific details, as well as relevant industry and economic factors. The most significant of these inputs are quoted market prices, and interest rate spreads on relevant benchmark securities.
F-43
First Internet Bancorp
Notes to Consolidated Financial Statements
(Tabular dollar amounts in thousands except per share data)
Loans
The fair value of loans is estimated on an exit price basis incorporating discounts for credit, liquidity and marketability factors.
Accrued Interest Receivable
The fair value of these financial instruments approximates carrying value.
Federal Home Loan Bank of Indianapolis Stock
The fair value approximates carrying value.
Deposits
The fair value of noninterest-bearing and interest-bearing demand deposits, savings and money market accounts approximates carrying value. The fair value of fixed maturity certificates of deposit and brokered deposits are estimated using rates currently offered for deposits of similar remaining maturities.
Advances from Federal Home Loan Bank
The fair value of fixed rate advances is estimated using rates currently offered for similar remaining maturities. The carrying value of variable rate advances approximates fair value.
Subordinated Debt
The fair value of the Company’s publicly traded subordinated debt is obtained from quoted market prices. The fair value of the Company’s remaining subordinated debt is estimated using discounted cash flow analysis, based on current borrowing rates for similar types of debt instruments.
Accrued Interest Payable
The fair value of these financial instruments approximates carrying value.
Commitments
The fair value of commitments to extend credit are based on fees currently charged to enter into similar agreements with similar maturities and interest rates. The Company determined that the fair value of commitments was zero based on the contractual value of outstanding commitments at December 31, 2019 and 2018.
F-44
First Internet Bancorp
Notes to Consolidated Financial Statements
(Tabular dollar amounts in thousands except per share data)
The following tables summarize the carrying value and estimated fair value of all financial assets and liabilities at December 31, 2019 and 2018:
December 31, 2019 | ||||||||||||||||||||
Fair Value Measurements Using | ||||||||||||||||||||
Carrying Amount | Fair Value | Quoted Prices In Active Market for Identical Assets (Level 1) | Significant Other Observable Inputs (Level 2) | Significant Unobservable Inputs (Level 3) | ||||||||||||||||
Cash and cash equivalents | $ | 327,361 | $ | 327,361 | $ | 327,361 | $ | — | $ | — | ||||||||||
Securities held-to-maturity | 61,878 | 62,560 | — | 62,560 | — | |||||||||||||||
Net loans | 2,941,707 | 2,876,688 | — | — | 2,876,688 | |||||||||||||||
Accrued interest receivable | 18,607 | 18,607 | 18,607 | — | — | |||||||||||||||
Federal Home Loan Bank of Indianapolis stock | 25,650 | 25,650 | — | 25,650 | — | |||||||||||||||
Deposits | 3,153,963 | 3,232,065 | 1,002,141 | — | 2,229,924 | |||||||||||||||
Advances from Federal Home Loan Bank | 514,910 | 520,950 | — | 520,950 | — | |||||||||||||||
Subordinated debt | 69,528 | 75,206 | 64,996 | 10,210 | — | |||||||||||||||
Accrued interest payable | 3,767 | 3,767 | 3,767 | — | — | |||||||||||||||
December 31, 2018 | ||||||||||||||||||||
Fair Value Measurements Using | ||||||||||||||||||||
Carrying Amount | Fair Value | Quoted Prices In Active Market for Identical Assets (Level 1) | Significant Other Observable Inputs (Level 2) | Significant Unobservable Inputs (Level 3) | ||||||||||||||||
Cash and cash equivalents | $ | 188,712 | $ | 188,712 | $ | 188,712 | $ | — | $ | — | ||||||||||
Securities held-to-maturity | 22,750 | 22,418 | — | 22,418 | — | |||||||||||||||
Net loans | 2,698,332 | 2,646,060 | — | — | 2,646,060 | |||||||||||||||
Accrued interest receivable | 16,822 | 16,822 | 16,822 | — | — | |||||||||||||||
Federal Home Loan Bank of Indianapolis stock | 23,625 | 23,625 | — | 23,625 | — | |||||||||||||||
Deposits | 2,671,351 | 2,687,666 | 731,378 | — | 1,956,288 | |||||||||||||||
Advances from Federal Home Loan Bank | 525,153 | 520,120 | — | 520,120 | — | |||||||||||||||
Subordinated debt | 33,875 | 34,490 | 24,250 | 10,240 | — | |||||||||||||||
Accrued interest payable | 1,108 | 1,108 | 1,108 | — | — | |||||||||||||||
Note 17: Mortgage Banking Activities
The Company’s residential real estate lending business originates mortgage loans for customers and sells a majority of the originated loans into the secondary market. The Company hedges its mortgage banking pipeline by entering into forward contracts for the future delivery of mortgage loans to third-party investors and entering into IRLCs with potential borrowers to fund specific mortgage loans that will be sold into the secondary market. To facilitate the hedging of the loans, the Company has elected the fair value option for loans originated and intended for sale in the secondary market under mandatory pricing agreements. Changes in the fair value of loans held-for-sale, IRLCs and forward contracts are recorded in the mortgage banking activities line item within noninterest income. Refer to Note 18 for further information on derivative financial instruments.
F-45
First Internet Bancorp
Notes to Consolidated Financial Statements
(Tabular dollar amounts in thousands except per share data)
During the years ended December 31, 2019, 2018, and 2017, the Company originated mortgage loans held-for-sale of $627.6 million, $364.6 million, and $412.9 million, respectively, and received $601.2 million, $376.5 million, and $425.3 million from the sale of mortgage loans, respectively, into the secondary market. During 2019, the Company sold $100.5 million of residential mortgage loans that were originally held for investment. There were no comparable sales in 2018. During 2017, the Company sold $42.3 million of residential mortgage loans that were originally held for investment.
The following table provides the components of income from mortgage banking activities for the years ended December 31, 2019, 2018, and 2017.
Year Ended December 31, | |||||||||||
2019 | 2018 | 2017 | |||||||||
Gain on loans sold | $ | 10,275 | $ | 6,102 | $ | 7,775 | |||||
Gain resulting from the change in fair value of loans held-for-sale | 538 | 57 | 638 | ||||||||
Gain (loss) resulting from the change in fair value of derivatives | 728 | (441 | ) | (577 | ) | ||||||
Net revenue from mortgage banking activities | $ | 11,541 | $ | 5,718 | $ | 7,836 | |||||
F-46
First Internet Bancorp
Notes to Consolidated Financial Statements
(Tabular dollar amounts in thousands except per share data)
Note 18: Derivative Financial Instruments
The Company uses derivative financial instruments to help manage exposure to interest rate risk and the effects that changes in interest rates may have on net income and the fair value of assets and liabilities. The Company enters into interest rate swap agreements as part of its asset/liability management strategy to help manage its interest rate risk position. Additionally, the Company enters into forward contracts for the future delivery of mortgage loans to third-party investors and enters into IRLCs with potential borrowers to fund specific mortgage loans that will be sold into the secondary market. The forward contracts are entered into in order to economically hedge the effect of changes in interest rates resulting from the Company’s commitment to fund the loans.
The Company entered into various interest rate swap agreements designated and qualifying as accounting hedges during the reported periods. Designating an interest rate swap as an accounting hedge allows the Company to recognize gains and losses, less any ineffectiveness, in the income statement within the same period that the hedged item affects earnings. The Company includes the gain or loss on the hedged items in the same line item as the offsetting loss or gain on the related interest rate swaps. For derivative instruments that are designated and qualify as cash flow hedges, any gains or losses related to changes in fair value are recorded in accumulated other comprehensive loss, net of tax. The fair value of interest rate swaps with a positive fair value are reported in accrued income and other assets in the consolidated balance sheets while interest rate swaps with a negative fair value are reported in accrued expenses and other liabilities in the consolidated balance sheets.
The IRLCs and forward contracts are not designated as accounting hedges and are recorded at fair value with changes in fair value reflected in noninterest income in the consolidated statements of income. The fair value of derivative instruments with a positive fair value are reported in accrued income and other assets in the consolidated balance sheets, while derivative instruments with a negative fair value are reported in accrued expenses and other liabilities in the consolidated balance sheets.
The following table presents amounts that were recorded in the consolidated balance sheets related to cumulative basis adjustments for interest rate swap derivatives designated as fair value accounting hedges as of December 31, 2019 and 2018.
Carrying amount of the hedged assets | Cumulative amount of fair value hedging adjustment included in the carrying amount of the hedged assets | |||||||||||||||
Line item in the consolidated balance sheet in which the hedged item is included | ||||||||||||||||
December 31, 2019 | December 31, 2018 | December 31, 2019 | December 31, 2018 | |||||||||||||
Loans | $ | 474,957 | $ | 474,233 | $ | 21,440 | $ | 4,961 | ||||||||
Securities available-for-sale1 | 151,538 | 159,188 | 2,802 | (229 | ) | |||||||||||
1 These amounts include the amortized cost basis of closed portfolios used to designate hedging relationships in which the hedged item is the last layer expected to be remaining at the end of the hedging relationship. The amounts of the designated hedged items were $88.2 million and $88.2 million, at December 31, 2019 and 2018, respectively.
F-47
First Internet Bancorp
Notes to Consolidated Financial Statements
(Tabular dollar amounts in thousands except per share data)
The following tables present a summary of interest rate swap derivatives designated as fair value accounting hedges of fixed-rate receivables used in the Company's asset/liability management activities at December 31, 2019 and December 31, 2018, identified by the underlying interest rate-sensitive instruments.
December 31, 2019 | Weighted Average Remaining Maturity (years) | Weighted-Average Rate | ||||||||||||
Instruments Associated With | ||||||||||||||
Notional Value | Fair Value | Receive | Pay | |||||||||||
Loans | $ | 427,446 | 5.5 | $ | (21,551 | ) | 3 month LIBOR | 2.86% | ||||||
Securities available-for-sale | 88,200 | 4.1 | (2,806 | ) | 3 month LIBOR | 2.54% | ||||||||
Total swap portfolio at December 31, 2019 | $ | 515,646 | 5.3 | $ | (24,357 | ) | 3 month LIBOR | 2.80% | ||||||
December 31, 2018 | Weighted Average Remaining Maturity (years) | Weighted-Average Rate | ||||||||||||
Instruments Associated With | ||||||||||||||
Notional Value | Fair Value | Receive | Pay | |||||||||||
Loans | $ | 435,926 | 6.5 | $ | (5,025 | ) | 3 month LIBOR | 2.86% | ||||||
Securities available-for-sale | 88,200 | 5.1 | 235 | 3 month LIBOR | 2.54% | |||||||||
Total swap portfolio at December 31, 2018 | $ | 524,126 | 6.3 | $ | (4,790 | ) | 3 month LIBOR | 2.80% | ||||||
The following tables present a summary of interest rate swap derivatives designated as cash flow accounting hedges of variable-rate liabilities used in the Company's asset/liability management activities at December 31, 2019 and December 31, 2018.
December 31, 2019 | Weighted Average Remaining Maturity (years) | Weighted-Average Rate | ||||||||||||
Cash Flow Hedges | ||||||||||||||
Notional Value | Fair Value | Receive | Pay | |||||||||||
Interest rate swaps | $ | 110,000 | 7.1 | $ | (8,390 | ) | 3 month LIBOR | 2.88% | ||||||
Interest rate swaps | 100,000 | 4.0 | (5,040 | ) | 1 month LIBOR | 2.88% | ||||||||
December 31, 2018 | Weighted Average Remaining Maturity (years) | Weighted-Average Rate | ||||||||||||
Cash Flow Hedges | ||||||||||||||
Notional Value | Fair Value | Receive | Pay | |||||||||||
Interest rate swaps | $ | 110,000 | 8.1 | $ | (2,293 | ) | 3 month LIBOR | 2.88% | ||||||
Interest rate swaps | 100,000 | 5.0 | (2,065 | ) | 1 month LIBOR | 2.88% | ||||||||
These derivative financial instruments were entered into for the purpose of managing the interest rate risk of certain assets and liabilities. The Company pledged $42.3 million and $7.0 million of cash collateral to counterparties as security for its obligations related to these interest rate swap transactions at December 31, 2019 and 2018, respectively. Collateral posted and received is dependent on the market valuation of the underlying hedges.
F-48
First Internet Bancorp
Notes to Consolidated Financial Statements
(Tabular dollar amounts in thousands except per share data)
The following table presents the notional amount and fair value of interest rate swaps, IRLCs and forward contracts utilized by the Company at December 31, 2019 and 2018.
December 31, 2019 | December 31, 2018 | |||||||||||||||
Notional Amount | Fair Value | Notional Amount | Fair Value | |||||||||||||
Asset Derivatives | ||||||||||||||||
Derivatives designated as hedging instruments | ||||||||||||||||
Interest rate swaps associated with loans | $ | — | $ | — | $ | 91,135 | $ | 986 | ||||||||
Interest rate swaps associated with securities available-for-sale | — | — | 50,000 | 593 | ||||||||||||
Derivatives not designated as hedging instruments | ||||||||||||||||
IRLCs | 56,256 | 910 | 15,136 | 389 | ||||||||||||
Total contracts | $ | 56,256 | $ | 910 | $ | 156,271 | $ | 1,968 | ||||||||
Liability Derivatives | ||||||||||||||||
Derivatives designated as hedging instruments | ||||||||||||||||
Interest rate swaps associated with loans | $ | 427,446 | $ | (21,551 | ) | $ | 344,791 | $ | (6,011 | ) | ||||||
Interest rate swaps associated with securities available-for-sale | 88,200 | (2,806 | ) | 38,200 | (358 | ) | ||||||||||
Interest rate swaps associated with liabilities | 210,000 | (13,429 | ) | 210,000 | (4,358 | ) | ||||||||||
Derivatives not designated as hedging instruments | ||||||||||||||||
Forward contracts | 115,000 | (153 | ) | 32,500 | (360 | ) | ||||||||||
Total contracts | $ | 840,646 | $ | (37,939 | ) | $ | 625,491 | $ | (11,087 | ) | ||||||
The fair values of interest rate swaps were estimated using a discounted cash flow method that incorporates current market interest rates as of the balance sheet date. Fair values of IRLCs and forward contracts were estimated using changes in mortgage interest rates from the date the Company entered into the IRLC and the balance sheet date.
The following table presents the effects of the Company's cash flow hedge relationships on the consolidated statements of comprehensive income during the twelve months ended December 31, 2019, 2018, and 2017.
Amount of Loss Recognized in Other Comprehensive Income in the Twelve Months Ended | ||||||||||||||||||
December 31, 2019 | December 31, 2018 | December 31, 2017 | ||||||||||||||||
Interest rate swap agreements | $ | (9,071 | ) | $ | (4,358 | ) | $ | — | ||||||||||
The following table summarizes the periodic changes in the fair value of the derivative financial instruments on the consolidated statements of income for the twelve months ended December 31, 2019, 2018, and 2017.
Amount of (loss) / gain recognized in the twelve months ended | |||||||||
December 31, 2019 | December 31, 2018 | December 31, 2017 | |||||||
Asset Derivatives | |||||||||
Derivatives not designated as hedging instruments | |||||||||
IRLCs | 521 | (162 | ) | (59 | ) | ||||
Forward contracts | 207 | (279 | ) | (519 | ) | ||||
F-49
First Internet Bancorp
Notes to Consolidated Financial Statements
(Tabular dollar amounts in thousands except per share data)
The following table presents the effects of the Company's interest rate swap agreements on the consolidated statements of income during the twelve months ended December 31, 2019, 2018, and 2017.
Line item in the consolidated statements of income | Twelve Months Ended | |||||||||||
December 31, 2019 | December 31, 2018 | December 31, 2017 | ||||||||||
Interest income | ||||||||||||
Loans | $ | (1,533 | ) | $ | (100 | ) | $ | — | ||||
Securities - taxable | (127 | ) | (153 | ) | — | |||||||
Securities - non-taxable | 36 | 23 | — | |||||||||
Total interest income | (1,624 | ) | (230 | ) | — | |||||||
Interest expense | ||||||||||||
Deposits | 618 | 151 | — | |||||||||
Other borrowed funds | 473 | 177 | — | |||||||||
Total interest expense | 1,091 | 328 | — | |||||||||
Net interest income | $ | (2,715 | ) | $ | (558 | ) | $ | — | ||||
Note 19: Shareholders’ Equity
In June 2018, the Company completed an underwritten public offering of 1,730,750 shares of its common stock at a price of $33.25 per share. The Company received net proceeds of approximately $54.3 million after deducting underwriting discounts and commissions and offering expenses.
In September 2017, the Company completed an underwritten public offering of 1,895,750 shares of its common stock at a price of $29.00 per share. The Company received net proceeds of approximately $51.6 million after deducting underwriting discounts and commissions and offering expenses.
F-50
First Internet Bancorp
Notes to Consolidated Financial Statements
(Tabular dollar amounts in thousands except per share data)
Note 20: Accumulated Other Comprehensive Loss
The components of accumulated other comprehensive loss, included in stockholders' equity, are presented in the table below.
Available-For-Sale Securities | Cash Flow Hedges | Total | ||||||||||
Balance, January 1, 2017 | $ | (9,268 | ) | $ | — | $ | (9,268 | ) | ||||
Net change in unrealized gain | 6,280 | — | 6,280 | |||||||||
Reclassification of net loss realized and included in earnings | 8 | — | 8 | |||||||||
Accumulated other comprehensive loss before income tax | (2,980 | ) | — | (2,980 | ) | |||||||
Income tax provision | 2,039 | — | 2,039 | |||||||||
Balance, December 31, 2017 | $ | (5,019 | ) | $ | — | $ | (5,019 | ) | ||||
Net change in unrealized loss | (10,466 | ) | (4,358 | ) | (14,824 | ) | ||||||
Reclassification of certain tax effects 1 | (1,063 | ) | — | (1,063 | ) | |||||||
Accumulated other comprehensive loss before income tax | (16,548 | ) | (4,358 | ) | (20,906 | ) | ||||||
Income tax benefit | (3,188 | ) | (1,177 | ) | (4,365 | ) | ||||||
Balance, December 31, 2018 | $ | (13,360 | ) | $ | (3,181 | ) | $ | (16,541 | ) | |||
Net change in unrealized gain (loss) | 12,072 | (9,071 | ) | 3,001 | ||||||||
Reclassification of net loss realized and included in earnings | 458 | — | 458 | |||||||||
Accumulated other comprehensive loss before income tax | (830 | ) | (12,252 | ) | (13,082 | ) | ||||||
Income tax provision (benefit) | 3,558 | (2,449 | ) | 1,109 | ||||||||
Balance, December 31, 2019 | $ | (4,388 | ) | $ | (9,803 | ) | $ | (14,191 | ) | |||
1 Represents the reclassification of stranded income tax effects to Retained Earnings upon adoption of ASU 2018-02 and ASU 2016-01.
Note 21: Condensed Financial Information (Parent Company Only)
Presented below is condensed financial information as to financial position, results of operations, and cash flows of the Company on a non-consolidated basis:
Condensed Balance Sheets
Year Ended December 31, | ||||||||
2019 | 2018 | |||||||
Assets | ||||||||
Cash and cash equivalents | $ | 38,303 | $ | 45,281 | ||||
Investment in common stock of subsidiaries | 332,352 | 274,158 | ||||||
Premises and equipment, net | 6,515 | 6,158 | ||||||
Accrued income and other assets | 2,156 | 1,554 | ||||||
Total assets | $ | 379,326 | $ | 327,151 | ||||
Liabilities and shareholders’ equity | ||||||||
Subordinated debt, net of unamortized discounts and debt issuance costs of $2,472 in 2019 and $1,125 in 2018 | $ | 69,528 | $ | 33,875 | ||||
Note payable to the Bank | 3,000 | 3,300 | ||||||
Accrued expenses and other liabilities | 1,885 | 1,241 | ||||||
Total liabilities | 74,413 | 38,416 | ||||||
Shareholders’ equity | 304,913 | 288,735 | ||||||
Total liabilities and shareholders’ equity | $ | 379,326 | $ | 327,151 | ||||
F-51
First Internet Bancorp
Notes to Consolidated Financial Statements
(Tabular dollar amounts in thousands except per share data)
Condensed Statements of Income
Year Ended December 31, | ||||||||||||
2019 | 2018 | 2017 | ||||||||||
Expenses | ||||||||||||
Interest on borrowings | $ | 3,804 | $ | 2,616 | $ | 2,724 | ||||||
Salaries and employee benefits | 804 | 564 | 354 | |||||||||
Consulting and professional fees | 1,610 | 958 | 664 | |||||||||
Premises and equipment | 285 | 285 | 302 | |||||||||
Other | 408 | 315 | 258 | |||||||||
Total expenses | 6,911 | 4,738 | 4,302 | |||||||||
Loss before income tax and equity in undistributed net income of subsidiaries | (6,911 | ) | (4,738 | ) | (4,302 | ) | ||||||
Income tax benefit | (1,783 | ) | (1,172 | ) | (1,539 | ) | ||||||
Loss before equity in undistributed net income of subsidiaries | (5,128 | ) | (3,566 | ) | (2,763 | ) | ||||||
Equity in undistributed net income of subsidiaries | 30,367 | 25,466 | 17,989 | |||||||||
Net income | $ | 25,239 | $ | 21,900 | $ | 15,226 | ||||||
Condensed Statements of Comprehensive Income
Year Ended December 31, | ||||||||||||
2019 | 2018 | 2017 | ||||||||||
Net income | $ | 25,239 | $ | 21,900 | $ | 15,226 | ||||||
Other comprehensive income (loss) | ||||||||||||
Net unrealized holding gains (losses) on securities available-for-sale recorded within other comprehensive income before income tax | 12,072 | (10,466 | ) | 6,280 | ||||||||
Reclassification adjustment for losses realized | 458 | — | 8 | |||||||||
Net unrealized holding losses on cash flow hedging derivatives recorded within other comprehensive income before income tax | (9,071 | ) | (4,358 | ) | — | |||||||
Other comprehensive income (loss) before tax | 3,459 | (14,824 | ) | 6,288 | ||||||||
Income tax provision (benefit) | 1,109 | (4,365 | ) | 2,039 | ||||||||
Other comprehensive income (loss) - net of tax | 2,350 | (10,459 | ) | 4,249 | ||||||||
Comprehensive income | $ | 27,589 | $ | 11,441 | $ | 19,475 | ||||||
F-52
First Internet Bancorp
Notes to Consolidated Financial Statements
(Tabular dollar amounts in thousands except per share data)
Condensed Statements of Cash Flows
Year Ended December 31, | ||||||||||||
2019 | 2018 | 2017 | ||||||||||
Operating activities | ||||||||||||
Net income | $ | 25,239 | $ | 21,900 | $ | 15,226 | ||||||
Adjustments to reconcile net income to net cash provided by operating activities: | ||||||||||||
Equity in undistributed net income of subsidiaries | (30,367 | ) | (25,466 | ) | (17,989 | ) | ||||||
Depreciation and amortization | 647 | 568 | 572 | |||||||||
Share-based compensation expense | 288 | 243 | 175 | |||||||||
Net change in other assets | (508 | ) | 1,769 | (1,453 | ) | |||||||
Net change in other liabilities | (87 | ) | 79 | (326 | ) | |||||||
Net cash used in operating activities | (4,788 | ) | (907 | ) | (3,795 | ) | ||||||
Investing activities | ||||||||||||
Capital contribution to the Bank | (25,000 | ) | (35,000 | ) | (42,000 | ) | ||||||
Purchase of premises and equipment | (13 | ) | — | (148 | ) | |||||||
Net cash used in investing activities | (25,013 | ) | (35,000 | ) | (42,148 | ) | ||||||
Financing activities | ||||||||||||
Cash dividends paid | (2,418 | ) | (2,230 | ) | (1,675 | ) | ||||||
Net proceeds from issuance of subordinated debt | 35,418 | — | — | |||||||||
Repayment of subordinated debt | — | (3,000 | ) | — | ||||||||
Principal payment on loan from the Bank | (300 | ) | (300 | ) | (400 | ) | ||||||
Net proceeds from common stock issuance | — | 54,334 | 51,636 | |||||||||
Repurchase of common stock | (9,784 | ) | (216 | ) | — | |||||||
Other, net | (93 | ) | (210 | ) | (173 | ) | ||||||
Net cash provided by financing activities | 22,823 | 48,378 | 49,388 | |||||||||
Net (decrease) increase in cash and cash equivalents | (6,978 | ) | 12,471 | 3,445 | ||||||||
Cash and cash equivalents at beginning of year | 45,281 | 32,810 | 29,365 | |||||||||
Cash and cash equivalents at end of year | $ | 38,303 | $ | 45,281 | $ | 32,810 | ||||||
F-53
First Internet Bancorp
Notes to Consolidated Financial Statements
(Tabular dollar amounts in thousands except per share data)
Note 22: Quarterly Financial Data (unaudited)
Three Months Ended | ||||||||||||||||
December 31, 2019 | September 30, 2019 | June 30, 2019 | March 31, 2019 | |||||||||||||
Income Statement Data: | ||||||||||||||||
Interest income | $ | 37,877 | $ | 37,694 | $ | 36,844 | $ | 34,999 | ||||||||
Interest expense | 22,503 | 22,450 | 20,739 | 18,755 | ||||||||||||
Net interest income | 15,374 | 15,244 | 16,105 | 16,244 | ||||||||||||
Provision for loan losses | 468 | 2,824 | 1,389 | 1,285 | ||||||||||||
Net interest income after provision for loan losses | 14,906 | 12,420 | 14,716 | 14,959 | ||||||||||||
Noninterest income | 5,405 | 5,558 | 3,454 | 2,372 | ||||||||||||
Noninterest expense | 12,613 | 11,203 | 11,709 | 11,109 | ||||||||||||
Income before income taxes | 7,698 | 6,775 | 6,461 | 6,222 | ||||||||||||
Income tax provision | 602 | 449 | 340 | 526 | ||||||||||||
Net income | $ | 7,096 | $ | 6,326 | $ | 6,121 | $ | 5,696 | ||||||||
Per Share Data: | ||||||||||||||||
Net income | ||||||||||||||||
Basic | $ | 0.72 | $ | 0.63 | $ | 0.60 | $ | 0.56 | ||||||||
Diluted | $ | 0.72 | $ | 0.63 | $ | 0.60 | $ | 0.56 | ||||||||
Weighted average common shares outstanding | ||||||||||||||||
Basic | 9,825,784 | 9,979,603 | 10,148,285 | 10,217,637 | ||||||||||||
Diluted | 9,843,829 | 9,980,612 | 10,148,285 | 10,230,531 | ||||||||||||
Three Months Ended | ||||||||||||||||
December 31, 2018 | September 30, 2018 | June 30, 2018 | March 31, 2018 | |||||||||||||
Income Statement Data: | ||||||||||||||||
Interest income | $ | 31,849 | $ | 30,223 | $ | 27,416 | $ | 25,979 | ||||||||
Interest expense | 16,428 | 14,253 | 11,955 | 10,564 | ||||||||||||
Net interest income | 15,421 | 15,970 | 15,461 | 15,415 | ||||||||||||
Provision for loan losses | 1,487 | 888 | 667 | 850 | ||||||||||||
Net interest income after provision for loan losses | 13,934 | 15,082 | 14,794 | 14,565 | ||||||||||||
Noninterest income | 2,047 | 1,994 | 2,177 | 2,542 | ||||||||||||
Noninterest expense | 12,739 | 10,045 | 10,182 | 10,217 | ||||||||||||
Income before income taxes | 3,242 | 7,031 | 6,789 | 6,890 | ||||||||||||
Income tax (benefit) provision | (334 | ) | 743 | 781 | 862 | |||||||||||
Net income | $ | 3,576 | $ | 6,288 | $ | 6,008 | $ | 6,028 | ||||||||
Per Share Data: | ||||||||||||||||
Net income | ||||||||||||||||
Basic | $ | 0.35 | $ | 0.61 | $ | 0.67 | $ | 0.71 | ||||||||
Diluted | $ | 0.35 | $ | 0.61 | $ | 0.67 | $ | 0.71 | ||||||||
Weighted average common shares outstanding | ||||||||||||||||
Basic | 10,263,086 | 10,261,967 | 8,909,913 | 8,499,196 | ||||||||||||
Diluted | 10,275,040 | 10,273,766 | 8,919,460 | 8,542,363 | ||||||||||||
F-54
First Internet Bancorp
Notes to Consolidated Financial Statements
(Tabular dollar amounts in thousands except per share data)
Note 23: Recent Accounting Pronouncements
ASU 2016-02 - Leases (Topic 842) (February 2016)
In February 2016, the Financial Accounting Standards Board (“FASB”) amended its standards with respect to the accounting for leases. This ASU replaces all current GAAP guidance on this topic and requires that an operating lease be recognized by the lessee on the balance sheet as a “right-of-use” asset along with a corresponding liability representing the rent obligation. Key aspects of current lessor accounting remain unchanged from existing guidance. The amended standard has resulted in an increase to assets and liabilities recognized and, therefore, increased risk-weighted assets for regulatory capital purposes.
In July 2018, the FASB issued ASU 2018-10 - Codification Improvements to Topic 842, Leases and ASU 2018-11, Leases (Topic 842): Targeted Improvements. ASU 2018-11 allows entities adopting ASU 2016-02 to choose an additional (and optional) transition method, under which an entity initially applies the new leases standard at the adoption date and recognizes a cumulative-effect adjustment to the opening balance of retained earnings in the period of adoption. The Company elected the optional transition method permitted by ASU 2018-11, which allowed the Company to recognize and measure leases that exist at the application date. Under this method, an entity must recognize and measure leases that exist at the application date and prior comparative periods are not adjusted.
The new ASU provides a number of optional practical expedients in transition. The Company has elected the practical expedients that allowed the Company to retain the classifications of existing leases, rather than re-assessing if existing leases have initial direct costs, and to use hindsight when determining the lease term and assessment of impairment. The Company also elected a practical expedient to not assess whether existing or expired land easements that were not previously accounted for as leases under ASC Topic 840 contain a lease.
The Company adopted the guidance on January 1, 2019 using the optional transition method and the adoption of the guidance did not have a material impact on the consolidated financial statements. As a result, the Company recognized a $2.1 million increase in assets and liabilities on the consolidated balance sheets. Refer to Note 6 for additional information.
In March 2019, the FASB issued ASU 2019-01 - Leases (Topic 842): Codification Improvements. This ASU (1) states that for lessors that are not manufacturers or dealers, the fair value of the underlying asset is its cost, less any volume or trade discounts, as long as there is not a significant amount of time between acquisition of the asset and lease commencement; (2) clarifies that lessors in the scope of ASC Topic 942, such as the Company, must classify principal payments received from sales-type and direct financing leases in investing activities in the statements of cash flows; and (3) clarifies the transition guidance related to certain interim disclosures provided in the year of adoption. To coincide with the adoption of ASU 2016-02, the Company elected to early adopt ASU 2019-01 on January 1, 2019. The adoption of the guidance did not have a material impact on the consolidated financial statements.
ASU 2016-13 - Financial Instruments - Credit Losses (Topic 326): Measurement of Credit Losses on Financial Instruments (June 2016)
The main objective of this update is to provide financial statement users with more decision-useful information about the expected credit losses on financial instruments and other commitments to extend credit held by a reporting entity at each reporting date. To achieve this objective, the amendments in this update replace the incurred loss impairment methodology in current GAAP with a methodology that reflects expected credit losses and requires consideration of a broader range of reasonable and supportable information to inform credit loss estimates.
F-55
First Internet Bancorp
Notes to Consolidated Financial Statements
(Tabular dollar amounts in thousands except per share data)
The amendments affect entities holding financial assets that are not accounted for at fair value through net income. The amendments affect loans, debt securities, off-balance-sheet credit exposures, and any other financial assets not excluded from the scope that have the contractual right to receive cash. The amendments in this update affect an entity to varying degrees depending on the credit quality of the assets held by the entity, their duration, and how the entity applies current GAAP. There is diversity in practice in applying the incurred loss methodology, which means that before transition some entities may be more aligned under current GAAP than others to the new measure of expected credit losses. The following describes the main provisions of this update.
•Assets Measured at Amortized Cost: The amendments in this update require a financial asset (or a group of financial assets) measured at amortized cost basis to be presented at the net amount expected to be collected. The allowance for credit losses is a valuation account that is deducted from the amortized cost basis of the financial asset(s) to present the net carrying value at the amount expected to be collected on the financial asset. The statements of income reflect the measurement of credit losses for newly recognized financial assets, as well as the expected increase or decrease of credit losses that have taken place during the period. The measurement of expected credit losses is based on relevant information about past events, including historical experience, current conditions, and reasonable and supportable forecasts that affect the collectability of the reported amount. An entity must use judgment in determining the relevant information and estimation methods that are appropriate in its circumstances.
•Available-for-Sale Debt Securities: Credit losses relating to available-for-sale debt securities should be recorded through an allowance for credit losses. Available-for-sale accounting recognizes that value may be realized either through collection of contractual cash flows or through sale of the security. Therefore, the amendments limit the amount of the allowance for credit losses to the amount by which fair value is below amortized cost because the classification as available-for-sale is premised on an investment strategy that recognizes that the investment could be sold at fair value if cash collection would result in the realization of an amount less than fair value.
•In May 2019, the FASB issued ASU 2019-05 - Financial Instruments - Credit Losses (Topic 326) - Targeted Transition Relief. This ASU allows an option for preparers to irrevocably elect the fair value option, on an instrument-by-instrument basis, for eligible financial assets measured at amortized cost basis upon adoption of the credit losses standard. This increases the comparability of financial statement information provided by institutions that otherwise would have reported similar financial instruments using different measurement methodologies, potentially decreasing costs for financial statement preparers while providing more useful information to investors and other users.
For public business entities that are SEC filers, the amendments in this update are effective for fiscal years beginning after December 15, 2019, including interim periods within those fiscal years. All entities may early adopt the amendments in this update as of the fiscal years beginning after December 15, 2018, including interim periods within those fiscal years. In November 2019, the FASB issued ASU 2019-10 - Financial Instruments - Credit Losses (Topic 326), Derivatives and Hedging (Topic 815), and Leases (Topic 842) - Effective Dates. This ASU delayed the effective date for smaller reporting companies to fiscal years beginning after December 15, 2022. An entity will apply the amendments in this update through a cumulative-effect adjustment to retained earnings as of the beginning of the first reporting period in which the guidance is effective (that is, a modified-retrospective approach). A prospective transition approach is required for debt securities for which an OTTI had been recognized before the effective date. The effect of a prospective transition approach is to maintain the same amortized cost basis before and after the effective date of this update.
The Company does not expect to early adopt and is currently evaluating the impact of the amendments on the Company’s consolidated financial statements. The Company currently cannot determine or reasonably quantify the impact of the adoption of the amendments due to the complexity and extensive changes. The Company intends to develop processes and procedures prior to the effective date to ensure it is fully compliant with the amendments at the adoption date. The Company has formed an implementation committee and has engaged a third-party consultant to assist in developing current expected credit losses (“CECL”) models using appropriate methodologies.
F-56
First Internet Bancorp
Notes to Consolidated Financial Statements
(Tabular dollar amounts in thousands except per share data)
ASU 2018-13 - Fair Value Measurement (Topic 820): Disclosure Framework - Changes to the Disclosure Requirements for Fair Value Measurement (August 2018)
The amendments in this update modify the disclosure requirements on fair value measurements in ASC Topic 820. This ASU eliminates the requirements to disclose the amount of and reasons for transfers between Level 1 and Level 2 of the fair value hierarchy, the policy for timing of transfers between levels and the valuation processes for Level 3 fair value measurements. In addition, this ASU requires entities that calculate net asset value to disclose the timing of liquidation of an investee’s assets and the date when restrictions from redemption might lapse only if the investee has communicated the timing to the entity or announced the timing publicly. This ASU also adds new requirements, which include the disclosure of the changes in unrealized gains and losses for the period included in other comprehensive income for recurring Level 3 fair value measurements held at the end of the reporting period and the range and weighted average of significant unobservable inputs used to develop Level 3 fair value measurements. The amendments in this ASU were effective for public companies for fiscal years, and interim fiscal periods within those fiscal years, beginning after December 15, 2019. The adoption of this guidance did not have a material impact on the consolidated financial statements.
ASU 2018-16 - Derivatives and Hedging (Topic 815): Inclusion of the Secured Overnight Financing Rate (“SOFR”) Overnight Index Swap (“OIS”) Rate as a Benchmark Interest Rate for Hedge Accounting Purposes (October 2018)
The amendments in this ASU allow all entities that elect to apply hedge accounting to benchmark interest rate hedges under ASC Topic 815, Derivatives and Hedging, to use the OIS rate based on SOFR as a benchmark interest rate, in addition to the four eligible benchmark interest rates. The Company adopted this ASU effective December 31, 2018 and it did not have a material impact on the consolidated financial statements.
ASU 2019-04 - Codification Improvements to Topic 326, Financial Instruments - Credit Losses, Topic 815, Derivatives and Hedging, and Topic 825, Financial Instruments (April 2019)
The amendments in this ASU clarify or correct the guidance in ASC Topic 326, Topic 815 and Topic 825. With respect to Topic 326, ASU 2019-04 addresses a number of issues as it relates to the CECL standard including consideration of accrued interest, recoveries, variable-rate financial instruments, prepayments, extension and renewal options, among other things, in the measurement of expected credit losses. The amendments to Topic 326 have the same effective dates as ASU 2016-13 and the Company is currently evaluating the potential impact of these amendments on the consolidated financial statements. With respect to Topic 815, ASU 2019-04 clarifies issues related to partial-term hedges, hedged debt securities, and transitioning from a quantitative method of assessing hedge effectiveness to a more simplified method. The amendments to Topic 815 are effective for interim and annual reporting periods beginning after December 15, 2019 and are not expected to have a material impact on the consolidated financial statements. With respect to Topic 825, ASU 2019-04 addresses the scope of the guidance, the requirement for remeasurement under ASC Topic 820 when using the measurement alternative, certain disclosure requirements, and which equity securities must be remeasured at historical exchanges rates. The amendments to Topic 825 were effective for interim and annual reporting periods beginning after December 15, 2019 and the adoption of this guidance did not have a material impact on the consolidated financial statements.
F-57