Attached files
| file | filename |
|---|---|
| 8-K - CUSTOMERS BANCORP, INC. FORM 8-K - Customers Bancorp, Inc. | cubi8k.htm |
Exhibit 99.1

Fixed Income Investor Presentation | August 2021 NYSE : CUBI “High Tech Forward - Thinking Bank Supported by High Touch” Customers Bancorp, Inc.
2 2 Forward - Looking Statements In addition to historical information, this presentation contains "forward - looking statements" within the meaning of the safe ha rbor provisions of the U.S. Private Securities Litigation Reform Act of 1995. These statements relate to future events or future predictions, including events or predictions relating to future financial perfor man ce, and are generally identifiable by the use of forward - looking terminology such as “believe,” “expect,” “may,” “will,” “should,” “plan,” “intend,” or “anticipate” or the negative thereof or comparable terminology. Forwa rd - looking statements reflect numerous assumptions, estimates and forecasts as to future events. No assurance can be given that the assumptions, estimates and forecasts underlying such forward - looking statements will accurately reflect future conditions, or that any guidance, goals, targets or projected results will be realized. The assumptions, estimates and forecasts underlying such forward - looking statements involve judgments with respect to, among other things, future economic, competitive, regulatory and financial market conditions and future business decisions, which may not be realized and which are inherently subject to sign ifi cant business, economic, competitive and regulatory uncertainties and known and unknown risks, including the risks described under “Risk Factors” in our Annual Report on Form 10 - K for the year ended December 31, 2020 and our Quarterly Report on Form 10 - Q for the quarter ended March 31, 2021, as such factors may be updated from time to time in our filings with the SEC. Our actual results may differ materially from those ref lec ted in the forward - looking statements. In addition to the risks described under “Risk Factors” in our filings with the SEC, other important factors to consider and evaluate with respect to our forward - looking statements inc lude: the impact of COVID - 19 on the U.S. and global economies, including business disruptions, reductions in employment and an increase in business failures, specifically among our clients; a prolonged downt urn in the economy, particularly in the geographic areas in which we do business, or an unexpected decline in real estate values within our market areas; the impact of COVID - 19 on our team members and our ability to provide services to our clients and respond to their needs; the impact of forbearances or deferrals we are required to provide or that we agree to as a result of customer requests and/or government actions, includin g, but not limited to our potential inability to fully recover deferred payments from the borrower or the collateral; potential claims, damages, penalties, fines and reputational damage arising from litigation and r egu latory and government actions relating to our participation in and execution of government programs related to the COVID - 19 pandemic or as a result of our action in response to, or failure to implement or effectively im plement, applicable federal, state and local laws, rules or executive orders requiring that we grant forbearances or not act to collect amounts due under our loans; the effects of changes in accounting policies and pr act ices, as may be adopted by the regulatory agencies, Financial Accounting Standards Board and other accounting standard setters, including Accounting Standards Update (ASU) 2016 - 13, Financial Instruments — Credit Losses (CECL); changes in external competitive market factors that might impact our results of operations; changes in laws and regulations, including, without limitation, changes in capital requirements under Basel III; the extensive federal and state regulation, supervision and examination governing almost every aspect of our operations and potential expenses associated with complying with such regulations; the potential effects of hei ght ened regulatory requirements applicable to banks with assets in excess of $10 billion; changes in our business strategy or an inability to execute our strategy due to the occurrence of unanticipated events; our a bil ity to identify potential candidates for, and consummate, acquisition or investment transactions; the timing of acquisition, investment or disposition transactions; constraints on our ability to consummate an att ractive acquisition or investment transaction because of significant competition for those opportunities; local, regional and national economic conditions and events and the impact they may have on us and our custome rs; costs and effects of regulatory and legal developments, including the results of regulatory examinations and the outcome of regulatory or other governmental inquiries and proceedings, such as fines or restr ict ions on our business activities; our ability to attract deposits and other sources of liquidity; changes in the financial performance and/or condition of our borrowers; changes in the level of non - performing and cl assified assets and charge - offs, which may require us to increase our allowance for credit losses, charge off loans and leases and incur elevated collection and carrying costs related to such non - performing assets; chan ges in estimates of our future loss reserve requirements under CECL based upon our periodic review thereof under relevant regulatory and accounting requirements; inflation, interest rate, securities market an d m onetary fluctuations; the planned phasing out of London interbank offered rate, or LIBOR, as a benchmark reference rate, and the transition to an alternative reference interest rate, including methodologies for calc ula ting the rate that are different from the LIBOR methodology and changed language for existing and new floating or adjustable rate contracts; timely development and acceptance of new banking products and service s a nd perceived overall value of these products and services by users; changes in consumer spending, borrowing and saving habits; technological changes; system failures or cybersecurity incidents or other breaches of ou r network security, particularly given widespread remote working arrangements; our ability to successfully implement our growth strategy, control expenses and maintain liquidity; continued volatility in the c red it and equity markets and its effect on the general economy; the businesses of Customers Bank and any acquisition targets or merger partners and subsidiaries not being integrated successfully or such integration be ing more difficult, time - consuming or costly than expected; material differences in the actual financial results of merger and acquisition activities compared with our expectations, such as with respect to the full reali zat ion of anticipated cost savings and revenue enhancements within the expected time frame; regulatory limits on our ability to receive dividends from our subsidiaries and pay dividends to our shareholders; risks rela ted to planned changes in our balance sheet, including our ability to: ( i ) reduce the size of our multi - family portfolio; (ii) execute our digital distribution strategy; (iii) manage the risks of change in our loan mix to incl ude a greater portion of consumer loans; (iv) manage originating, servicing and processing forgiveness of PPP loans; and (v) our ability to earn increased net interest income to recover reduced interchange income due to the loss of the small issuer exemption to the Durbin Amendment; and any reputation, credit, interest rate, market, operational, litigation, legal, liquidity, regulatory and compliance risk resulting from devel opm ents related to any of the risks discussed above. You are cautioned not to place undue reliance on these forward - looking statements, which speak only as of the date hereof. We do not undertake any obligation to release publi cly or otherwise provide any revisions to these forward - looking statements to reflect events or circumstances occurring after the date hereof or to reflect the occurrence of unanticipated events, except as may b e r equired under applicable law. This presentation does not constitute an offer to sell, or a solicitation of an offer to buy, any security in any state or jurisdiction in which such offer, solicitation or sale would be un lawful.
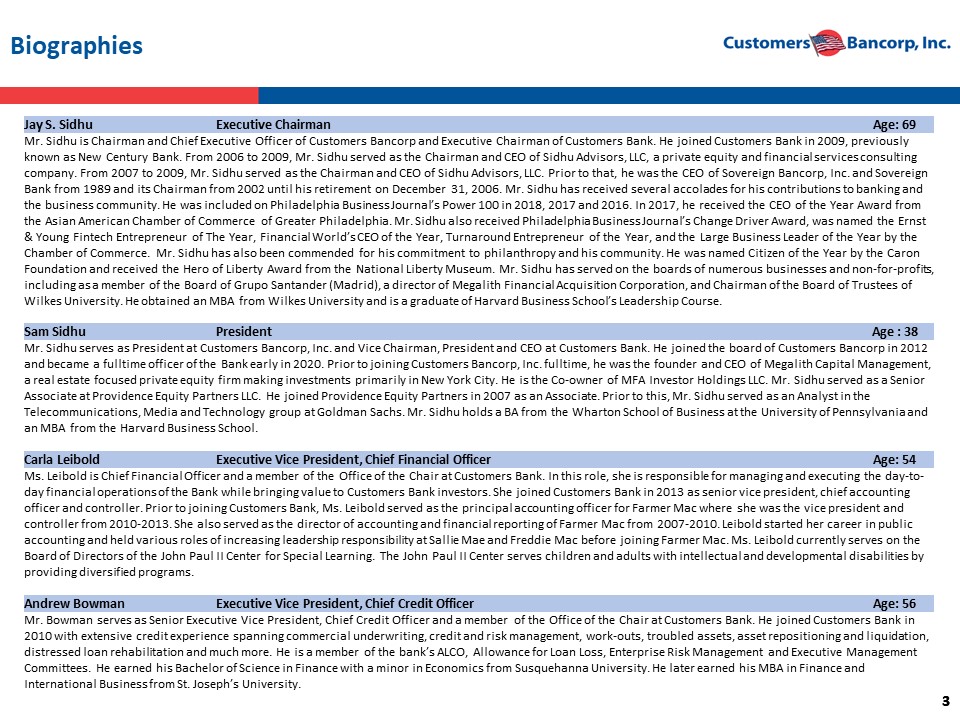
3 3 Biographies Jay S. Sidhu Executive Chairman Age: 69 Mr. Sidhu is Chairman and Chief Executive Officer of Customers Bancorp and Executive Chairman of Customers Bank. He joined Customers Bank in 2009, previously known as New Century Bank. From 2006 to 2009, Mr. Sidhu served as the Chairman and CEO of Sidhu Advisors, LLC, a private equi ty and financial services consulting company. From 2007 to 2009, Mr. Sidhu served as the Chairman and CEO of Sidhu Advisors, LLC. Prior to that, he was the CEO of Sovereig n B ancorp, Inc. and Sovereign Bank from 1989 and its Chairman from 2002 until his retirement on December 31, 2006. Mr. Sidhu has received several accolades fo r his contributions to banking and the business community. He was included on Philadelphia Business Journal’s Power 100 in 2018, 2017 and 2016. In 2017, he rece ive d the CEO of the Year Award from the Asian American Chamber of Commerce of Greater Philadelphia. Mr. Sidhu also received Philadelphia Business Journal’s Chang e D river Award, was named the Ernst & Young Fintech Entrepreneur of The Year, Financial World’s CEO of the Year, Turnaround Entrepreneur of the Year, and the Lar ge Business Leader of the Year by the Chamber of Commerce. Mr. Sidhu has also been commended for his commitment to philanthropy and his community. He was named Cit ize n of the Year by the Caron Foundation and received the Hero of Liberty Award from the National Liberty Museum. Mr. Sidhu has served on the boards of num ero us businesses and non - for - profits, including as a member of the Board of Grupo Santander (Madrid), a director of Megalith Financial Acquisition Corporation, and Chairman of the Board of Trustees of Wilkes University. He obtained an MBA from Wilkes University and is a graduate of Harvard Business School’s Leadership Course . Sam Sidhu President Age : 38 Mr. Sidhu serves as President at Customers Bancorp, Inc. and Vice Chairman, President and CEO at Customers Bank . He joined the board of Customers Bancorp in 2012 and became a fulltime officer of the Bank early in 2020. Prior to joining Customers Bancorp, Inc. fulltime, he was the founde r a nd CEO of Megalith Capital Management, a real estate focused private equity firm making investments primarily in New York City. He is the Co - owner of MFA Investor Hold ings LLC. Mr. Sidhu served as a Senior Associate at Providence Equity Partners LLC. He joined Providence Equity Partners in 2007 as an Associate. Prior to this, Mr. Si dhu served as an Analyst in the Telecommunications, Media and Technology group at Goldman Sachs. Mr. Sidhu holds a BA from the Wharton School of Business at the University of Pennsylvania and an MBA from the Harvard Business School. Carla Leibold Executive Vice President, Chief Financial Officer Age: 54 Ms. Leibold is Chief Financial Officer and a member of the Office of the Chair at Customers Bank. In this role, she is responsible for ma na ging and executing the day - to - day financial operations of the Bank while bringing value to Customers Bank investors. She joined Customers Bank in 2013 as s eni or vice president, chief accounting officer and controller. Prior to joining Customers Bank, Ms. Leibold served as the principal accounting officer for Farmer Mac where she was the vice president and controller from 2010 - 2013. She also served as the director of accounting and financial reporting of Farmer Mac from 2007 - 2010. Leibold started her career in public accounting and held various roles of increasing leadership responsibility at Sallie Mae and Freddie Mac before joining Farmer Ma c. Ms. Leibold currently serves on the Board of Directors of the John Paul II Center for Special Learning. The John Paul II Center serves children and adults with int ellectual and developmental disabilities by providing diversified programs. Andrew Bowman Executive Vice President, Chief Credit Officer Age: 56 Mr. Bowman serves as Senior Executive Vice President, Chief Credit Officer and a member of the Office of the Chair at Custome rs Bank. He joined Customers Bank in 2010 with extensive credit experience spanning commercial underwriting, credit and risk management, work - outs, troubled assets, asset repositioning and liquidation, distressed loan rehabilitation and much more. He is a member of the bank’s ALCO, Allowance for Loan Loss, Enterprise Risk Man age ment and Executive Management Committees. He earned his Bachelor of Science in Finance with a minor in Economics from Susquehanna University. He later earn ed his MBA in Finance and International Business from St. Joseph’s University.
Table of Contents I. Overview IV. Outlook & Takeaways ‒ Franchise Overview and Evolution ‒ Sling Shot Build in Capital Levels ‒ Balance Sheet Growth and Remix ‒ Capital Deployment Priorities: Capital Stack, ‒ Capital Growth Optimization and Balance Sheet Growth ‒ Risk Management Priorities ‒ Financial Guidance ‒ Key Takeaways II. Q2 2021 Results & Key Highlights V. Appendix ‒ Quarterly Update ‒ Liquidity Detail ‒ Loan and Deposit Portfolios ‒ Interest Coverage ‒ Net Interest Margin Trends ‒ Non-GAAP Reconciliations ‒ Execution on Corporate Strategies ‒ Disclaimers III. Credit Risk Management ‒ Credit Concerns Are Abating ‒ Reserves Coverage Remains Strong ‒ Consumer Portfolio Details and Performance ‒ COVID Deferments Have Improved
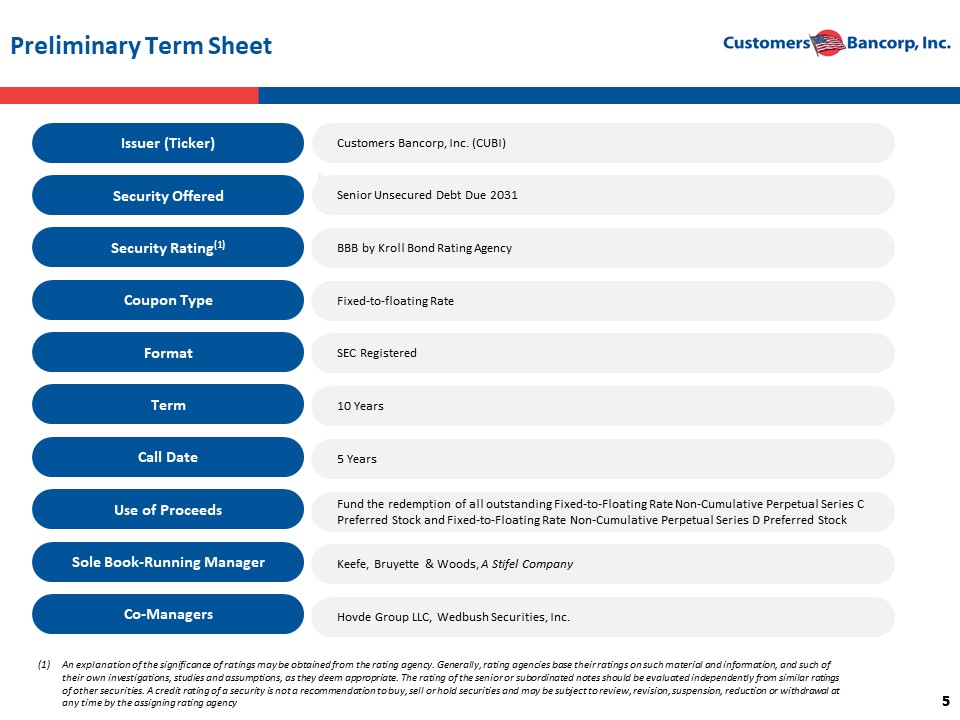
5 5 Issuer (Ticker) Preliminary Term Sheet (1) An explanation of the significance of ratings may be obtained from the rating agency. Generally, rating agencies base their rati ngs on such material and information, and such of their own investigations, studies and assumptions, as they deem appropriate. The rating of the senior or subordinated notes s hou ld be evaluated independently from similar ratings of other securities. A credit rating of a security is not a recommendation to buy, sell or hold securities and may be subject to review, revision, suspension, reduction or withdrawal at any time by the assigning rating agency Security Offered Senior Unsecured Debt Due 2031 Security Rating (1) BBB by Kroll Bond Rating Agency Coupon Type Fixed - to - floating Rate Format SEC Registered Term 10 Years Call Date 5 Years Use of Proceeds Fund the redemption of all outstanding Fixed - to - Floating Rate Non - Cumulative Perpetual Series C Preferred Stock and Fixed - to - Floating Rate Non - Cumulative Perpetual Series D Preferred Stock Sole Book - Running Manager Keefe, Bruyette & Woods, A Stifel Company Customers Bancorp, Inc . (CUBI) Co - Managers Hovde Group LLC, Wedbush Securities, Inc.
I. Overview
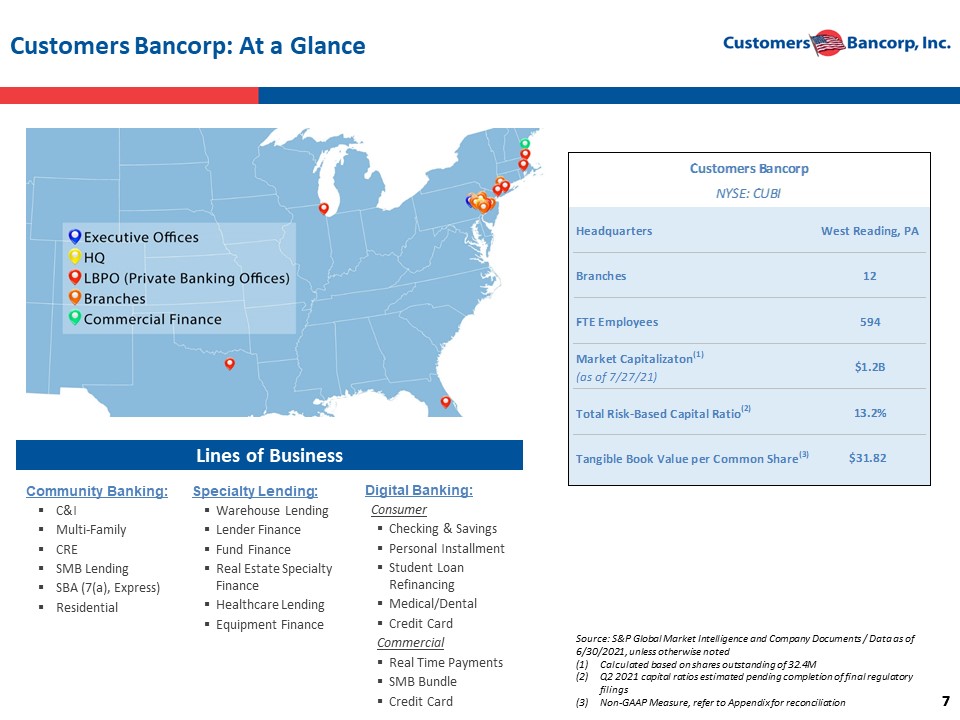
7 7 Customers Bancorp: At a Glance Source: S&P Global Market Intelligence and Company Documents / Data as of 6/30/2021, unless otherwise noted (1) Calculated based on shares outstanding of 32.4M (2) Q2 2021 capital ratios estimated pending completion of final regulatory filings (3) Non - GAAP Measure, refer to Appendix for reconciliation Lines of Business Community Banking: ▪ C&I ▪ Multi - Family ▪ CRE ▪ SMB Lending ▪ SBA (7(a), Express) ▪ Residential Specialty Lending: ▪ Warehouse Lending ▪ Lender Finance ▪ Fund Finance ▪ Real Estate Specialty Finance ▪ Healthcare Lending ▪ Equipment Finance Digital Banking: Consumer ▪ Checking & Savings ▪ Personal Installment ▪ Student Loan Refinancing ▪ Medical/Dental ▪ Credit Card Commercial ▪ Real Time Payments ▪ SMB Bundle ▪ Credit Card Customers Bancorp NYSE: CUBI Headquarters West Reading, PA Branches 12 FTE Employees 594 Market Capitalizaton (1) (as of 7/27/21) $1.2B Total Risk-Based Capital Ratio (2) 13.2% Tangible Book Value per Common Share (3) $31.82
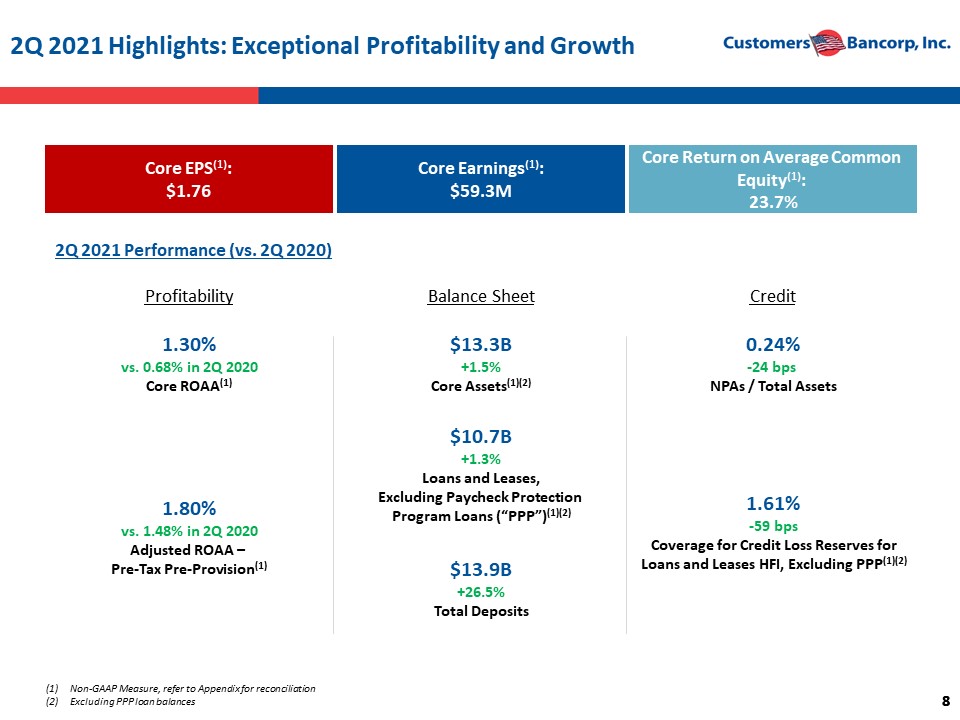
8 8 2Q 2021 Highlights: Exceptional Profitability and Growth Core EPS (1) : $1.76 Core Earnings (1) : $59.3M Core Return on Average Common Equity (1) : 23.7% 2Q 2021 Performance (vs. 2Q 2020) 1.30% vs. 0.68% in 2Q 2020 Core ROAA (1) $13.3B +1.5% Core Assets (1 )(2) 0.24% - 24 bps NPAs / Total Assets 1.80% vs. 1.48% in 2Q 2020 Adjusted ROAA – Pre - Tax Pre - Provision (1 ) $10.7B +1.3% Loans and Leases, Excluding Paycheck Protection Program Loans (“PPP”) (1 )(2) 1.61% - 59 bps Coverage for Credit Loss Reserves for Loans and Leases HFI, Excluding PPP (1 )(2) $13.9B +26.5% Total Deposits Profitability Balance Sheet Credit (1) Non - GAAP Measure, refer to Appendix for reconciliation (2) Excluding PPP loan balances
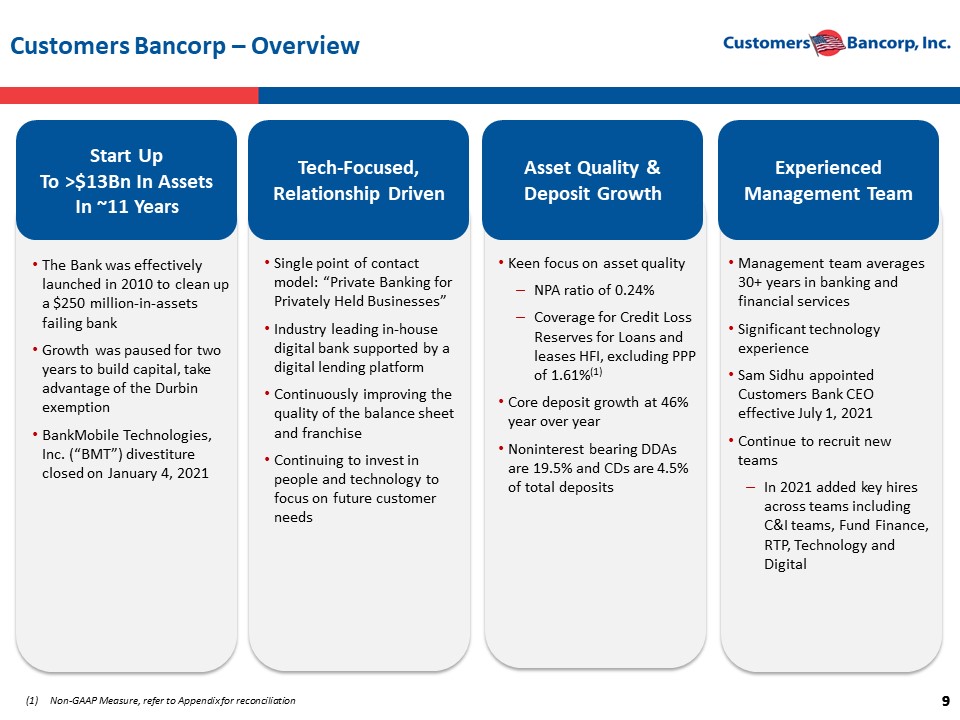
9 9 (1) Non - GAAP Measure, refer to Appendix for reconciliation Start Up T o >$13Bn In Assets I n ~11 Y ears Tech - Focused , Relationship Driven Asset Quality & Deposit Growth Experienced Management Team • The Bank was effectively launched in 2010 to clean up a $250 million - in - assets failing bank • Growth was paused for two years to build capital, take advantage of the Durbin exemption • BankMobile Technologies, Inc. (“BMT”) divestiture closed on January 4, 2021 • Single point of contact model: “Private Banking for Privately Held Businesses” • Industry leading in - house digital bank supported by a digital lending platform • Continuously improving the quality of the balance sheet and franchise • Continuing to invest in people and technology to focus on future customer needs • Keen focus on asset quality ‒ NPA ratio of 0.24% ‒ Coverage for Credit Loss Reserves for Loans and leases HFI, excluding PPP of 1.61% (1) • Core deposit growth at 46% year over year • Noninterest bearing DDAs are 19.5% and CDs are 4.5% of total deposits • Management team averages 30+ years in banking and financial services • Significant technology experience • Sam Sidhu appointed Customers Bank CEO effective July 1, 2021 • Continue to recruit new teams ‒ In 2021 added key hires across teams including C&I teams, Fund Finance, RTP, Technology and Digital Customers Bancorp – Overview
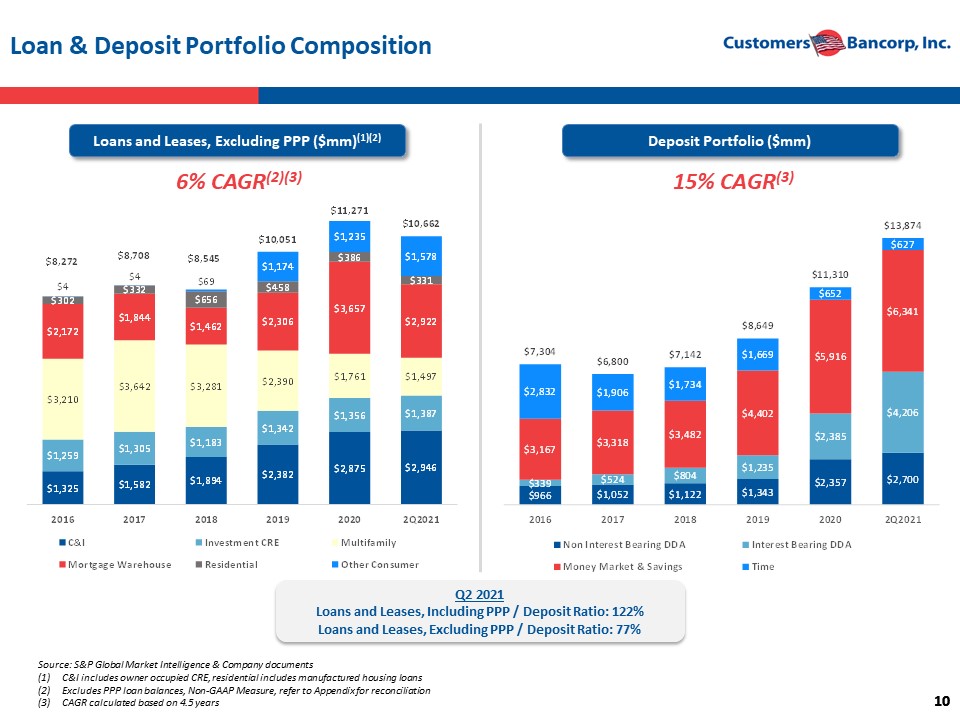
10 10 Loan & Deposit Portfolio Composition 6 % CAGR (2)(3) 15% CAGR (3) Deposit Portfolio ($mm) Loans and Leases, Excluding PPP ($mm) (1)(2) Source: S&P Global Market Intelligence & Company documents (1) C&I includes owner occupied CRE, r esidential includes manufactured housing loans (2) Excludes PPP loan balances, Non - GAAP Measure, refer to Appendix for reconciliation (3) CAGR calculated based on 4.5 years $1,325 $1,582 $1,894 $2,382 $2,875 $2,946 $1,259 $1,305 $1,183 $1,342 $1,356 $1,387 $3,210 $3,642 $3,281 $2,390 $1,761 $1,497 $2,172 $1,844 $1,462 $2,306 $3,657 $2,922 $302 $332 $656 $458 $386 $331 $4 $4 $69 $1,174 $1,235 $1,578 $8,272 $8,708 $8,545 $10,051 $11,271 $10,662 2016 2017 2018 2019 2020 2Q2021 C&I Investment CRE Multifamily Mortgage Warehouse Residential Other Consumer $966 $1,052 $1,122 $1,343 $2,357 $2,700 $339 $524 $804 $1,235 $2,385 $4,206 $3,167 $3,318 $3,482 $4,402 $5,916 $6,341 $2,832 $1,906 $1,734 $1,669 $652 $627 $7,304 $6,800 $7,142 $8,649 $11,310 $13,874 2016 2017 2018 2019 2020 2Q2021 Non Interest Bearing DDA Interest Bearing DDA Money Market & Savings Time Q2 2021 Loans and Leases, Including PPP / Deposit Ratio: 122% Loans and Leases, Excluding PPP / Deposit Ratio: 77%
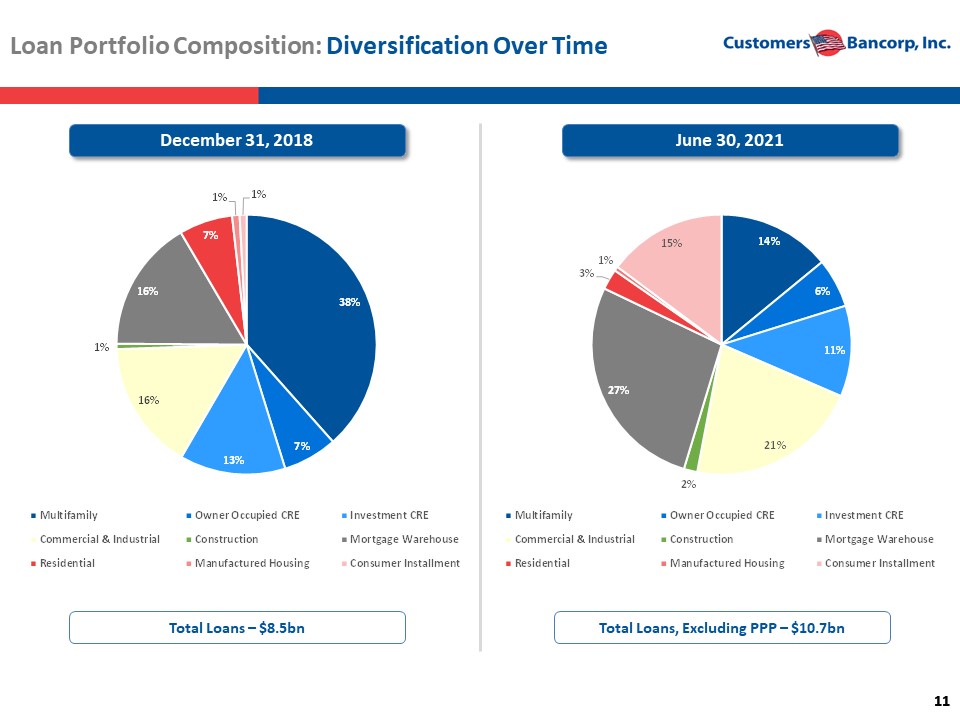
11 11 Loan Portfolio Composition : Diversification Over Time 38% 7% 13% 16% 1% 16% 7% 1% 1% Multifamily Owner Occupied CRE Investment CRE Commercial & Industrial Construction Mortgage Warehouse Residential Manufactured Housing Consumer Installment December 31, 2018 June 30, 2021 Total Loans – $8.5bn 14% 6% 11% 21% 2% 27% 3% 1% 15% Multifamily Owner Occupied CRE Investment CRE Commercial & Industrial Construction Mortgage Warehouse Residential Manufactured Housing Consumer Installment Total Loans, Excluding PPP – $10.7bn
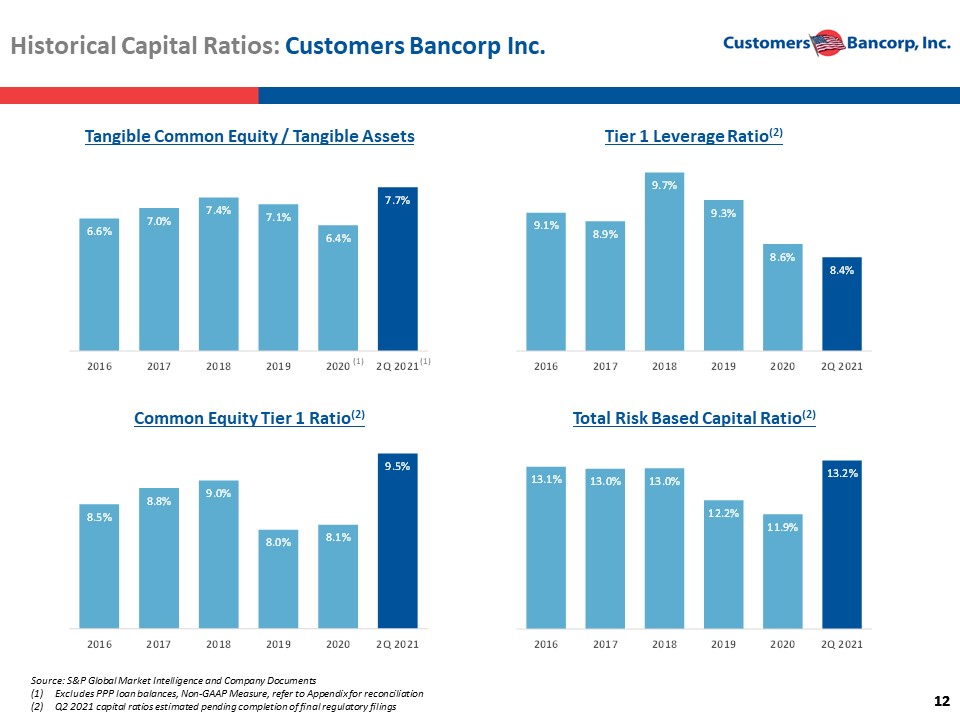
12 12 13.1% 13.0% 13.0% 12.2% 11.9% 13.2% 2016 2017 2018 2019 2020 2Q 2021 8.5% 8.8% 9.0% 8.0% 8.1% 9.5% 2016 2017 2018 2019 2020 2Q 2021 9.1% 8.9% 9.7% 9.3% 8.6% 8.4% 2016 2017 2018 2019 2020 2Q 2021 6.6% 7.0% 7.4% 7.1% 6.4% 7.7% 2016 2017 2018 2019 2020 2Q 2021 Historical Capital Ratios: Customers Bancorp Inc. Source: S&P Global Market Intelligence and Company Documents (1) Excludes PPP loan balances, Non - GAAP Measure, refer to Appendix for reconciliation (2) Q2 2021 capital ratios estimated pending completion of final regulatory filings Tier 1 Leverage Ratio (2) Common Equity Tier 1 Ratio (2) Total Risk Based Capital Ratio (2) Tangible Common Equity / Tangible Assets (1) (1)
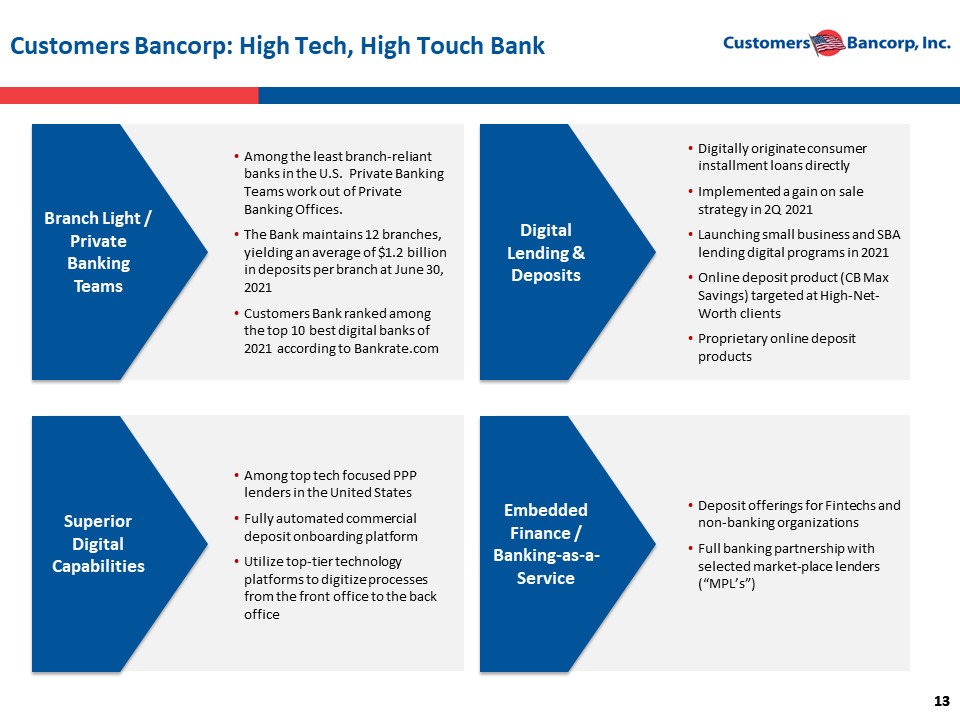
13 13 Customers Bancorp: High Tech, High Touch Bank Branch Light / Private Banking Teams Superior Digital Capabilities Digital Lending & Deposits Embedded Finance / Banking - as - a - Service • Among the least branch - reliant banks in the U.S. Private Banking Teams work out of Private Banking Offices. • The Bank maintains 12 branches, yielding an average of $1.2 billion in deposits per branch at June 30, 2021 • Customers Bank ranked among the top 10 best digital banks of 2021 according to Bankrate.com • Among top tech focused PPP lenders in the United States • Fully automated commercial deposit onboarding platform • Utilize top - tier technology platforms to digitize processes from the front office to the back office • Digitally originate consumer installment loans directly • Implemented a gain on sale strategy in 2Q 2021 • Launching small business and SBA lending digital programs in 2021 • Online deposit product (CB Max Savings) targeted at High - Net - Worth clients • Proprietary online deposit products • Deposit offerings for Fintechs and non - banking organizations • Full banking partnership with selected market - place lenders (“MPL’s”)
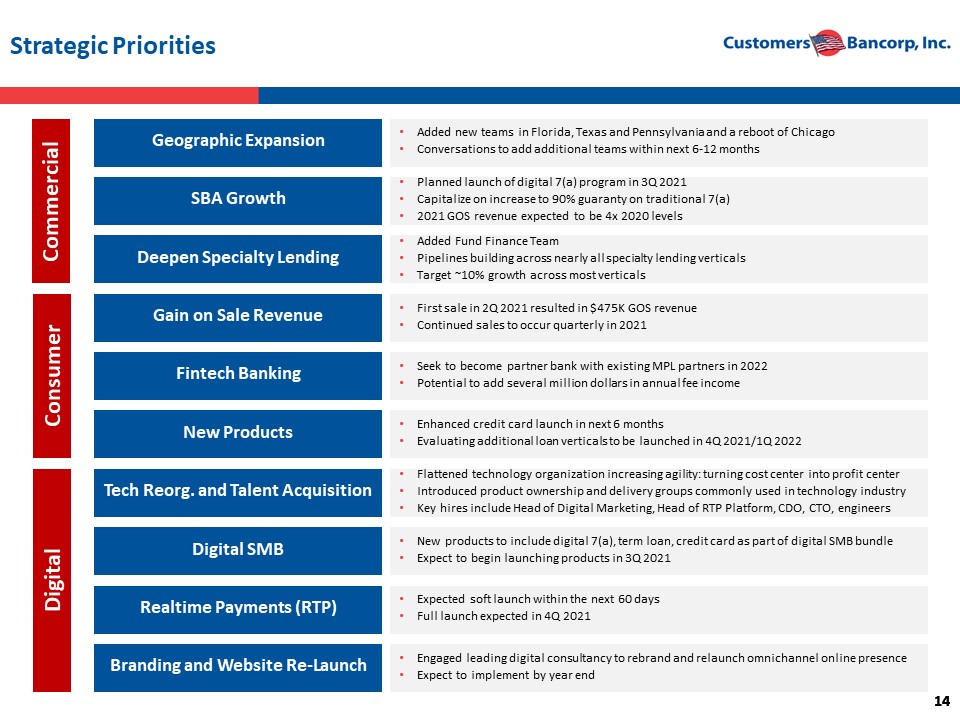
14 14 Strategic Priorities Geographic Expansion • Added new teams in Florida, Texas and Pennsylvania and a reboot of Chicago • Conversations to add additional teams within next 6 - 12 months SBA Growth • Planned launch of digital 7(a) program in 3Q 2021 • Capitalize on increase to 90% guaranty on traditional 7(a) • 2021 GOS revenue expected to be 4x 2020 levels Deepen Specialty Lending • Added Fund Finance Team • Pipelines building across nearly all specialty lending verticals • Target ~10% growth across most verticals Gain on Sale Revenue • First sale in 2Q 2021 resulted in $475K GOS revenue • Continued sales to occur quarterly in 2021 Fintech Banking • Seek to become partner bank with existing MPL partners in 2022 • Potential to add several million dollars in annual fee income New Products • Enhanced credit card launch in next 6 months • Evaluating additional loan verticals to be launched in 4Q 2021/1Q 2022 Tech Reorg. and Talent Acquisition • Flattened technology organization increasing agility: turning cost center into profit center • Introduced product ownership and delivery groups commonly used in technology industry • Key hires include Head of Digital Marketing, Head of RTP Platform, CDO, CTO, engineers Digital SMB • New products to include digital 7(a), term loan, credit card as part of digital SMB bundle • Expect to begin launching products in 3Q 2021 Realtime Payments (RTP) • Expected soft launch within the next 60 days • Full launch expected in 4Q 2021 Branding and Website Re - Launch • Engaged leading digital consultancy to rebrand and relaunch omnichannel online presence • Expect to implement by year end Commercial Consumer Digital
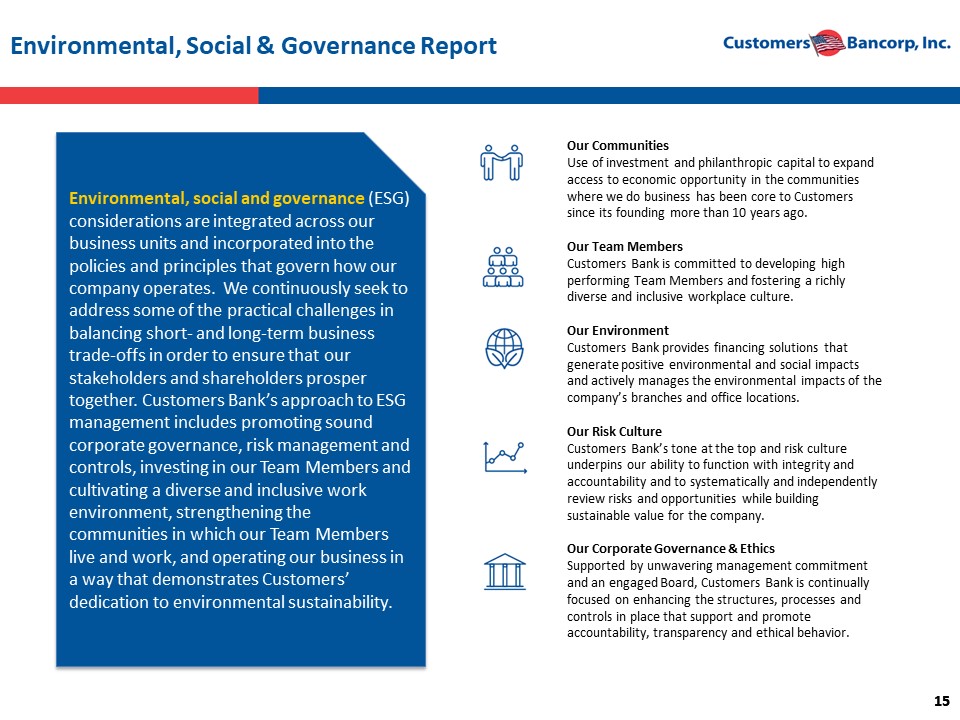
15 15 Environmental, Social & Governance Report Environmental, social and governance (ESG) considerations are integrated across our business units and incorporated into the policies and principles that govern how our company operates. We continuously seek to address some of the practical challenges in balancing short - and long - term business trade - offs in order to ensure that our stakeholders and shareholders prosper together. Customers Bank’s approach to ESG management includes promoting sound corporate governance, risk management and controls, investing in our Team Members and cultivating a diverse and inclusive work environment, strengthening the communities in which our Team Members live and work, and operating our business in a way that demonstrates Customers’ dedication to environmental sustainability. Our Communities Use of investment and philanthropic capital to expand access to economic opportunity in the communities where we do business has been core to Customers since its founding more than 10 years ago. Our Team Members Customers Bank is committed to developing high performing Team Members and fostering a richly diverse and inclusive workplace culture. Our Environment Customers Bank provides financing solutions that generate positive environmental and social impacts and actively manages the environmental impacts of the company’s branches and office locations. Our Risk Culture Customers Bank’s tone at the top and risk culture underpins our ability to function with integrity and accountability and to systematically and independently review risks and opportunities while building sustainable value for the company. Our Corporate Governance & Ethics Supported by unwavering management commitment and an engaged Board, Customers Bank is continually focused on enhancing the structures, processes and controls in place that support and promote accountability, transparency and ethical behavior.
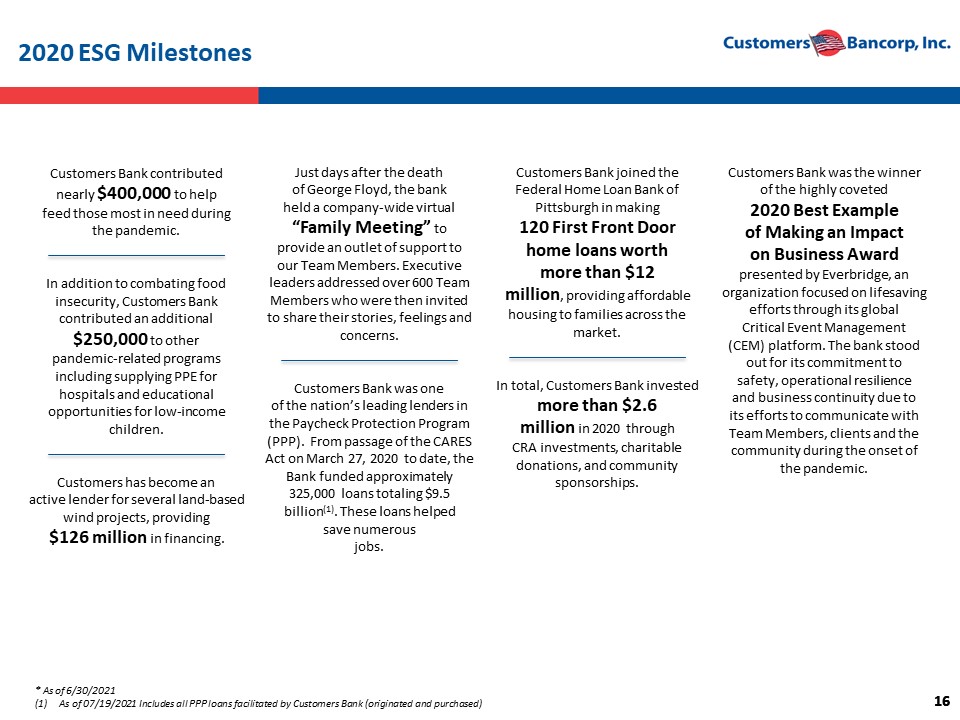
16 16 2020 ESG Milestones Just days after the death of George Floyd, the bank held a company - wide virtual “Family Meeting” to provide an outlet of support to our Team Members. Executive leaders addressed over 600 Team Members who were then invited to share their stories, feelings and concerns. Customers Bank was one of the nation’s leading lenders in the Paycheck Protection Program (PPP). From passage of the CARES A ct on March 27, 2020 to date, the Bank funded approximately 325,000 loans totaling $9.5 billion (1) . These loans helped save numerous jobs. Customers Bank joined the Federal Home Loan Bank of Pittsburgh in making 120 First Front Door home loans worth more than $12 million , providing affordable housing to families across the market. In total, Customers Bank invested more than $2.6 million in 2020 through CRA investments, charitable donations, and community sponsorships. Customers Bank was the winner of the highly coveted 2020 Best Example of Making an Impact on Business Award presented by Everbridge, an organization focused on lifesaving efforts through its global Critical Event Management (CEM) platform. The bank stood out for its commitment to safety, operational resilience and business continuity due to its efforts to communicate with Team Members, clients and the community during the onset of the pandemic. Customers Bank contributed nearly $400,000 to help feed those most in need during the pandemic. In addition to combating food insecurity, Customers Bank contributed an additional $250,000 to other pandemic - related programs including supplying PPE for hospitals and educational opportunities for low - income children. Customers has become an active lender for several land - based wind projects, providing $126 million in financing. * As of 6/30/2021 (1) As of 07/19/2021 Includes all PPP loans facilitated by Customers Bank (originated and purchased)
II. Q2 2021 Results & Key Highlights
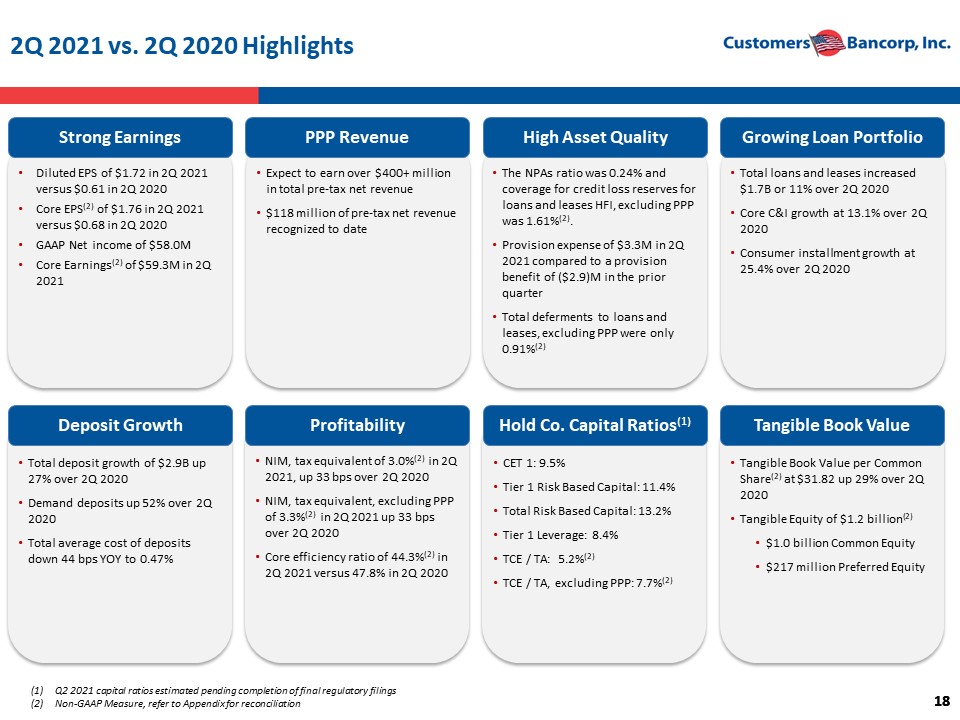
18 18 2Q 2021 vs. 2Q 2020 Highlights Strong Earnings PPP Revenue High Asset Quality Growing Loan Portfolio Deposit Growth Profitability Hold Co. Capital Ratios (1) Tangible Book Value • Diluted EPS of $1.72 in 2Q 2021 versus $0.61 in 2Q 2020 • Core EPS (2) of $1.76 in 2Q 2021 versus $0.68 in 2Q 2020 • GAAP Net income of $58.0M • Core Earnings (2 ) of $59.3M in 2Q 2021 • Expect to earn over $400+ million in total pre - tax net revenue • $118 million of pre - tax net revenue recognized to date • The NPAs ratio was 0.24% and coverage for credit loss reserves for loans and leases HFI, excluding PPP was 1.61% (2) . • Provision expense of $3.3M in 2Q 2021 compared to a provision benefit of ($2.9)M in the prior quarter • Total d eferments to loans and leases, excluding PPP were only 0.91% (2) • Total loans and leases increased $1.7B or 11% over 2Q 2020 • Core C&I growth at 13.1% over 2Q 2020 • Consumer installment growth at 25.4% over 2Q 2020 • Total deposit growth of $2.9B up 27% over 2Q 2020 • Demand deposits up 52% over 2Q 2020 • Total average cost of deposits down 44 bps YOY to 0.47% • NIM, tax equivalent of 3.0% (2) in 2Q 2021, up 33 bps over 2Q 2020 • NIM, tax equivalent, excluding PPP of 3.3% (2) in 2Q 2021 up 33 bps over 2Q 2020 • Core efficiency ratio of 44.3% (2) in 2Q 2021 versus 47.8% in 2Q 2020 • CET 1: 9.5% • Tier 1 Risk Based Capital: 11.4 % • Total Risk Based Capital: 13.2% • Tier 1 Leverage: 8.4% • TCE / TA: 5.2% (2) • TCE / TA, excluding PPP: 7.7 % (2) • Tangible Book Value per Common Share (2 ) at $31.82 up 29% over 2Q 2020 • Tangible Equity of $1.2 billion (2) • $1.0 billion Common Equity • $217 million Preferred Equity (1) Q2 2021 capital ratios estimated pending completion of final regulatory filings (2) Non - GAAP Measure, refer to Appendix for reconciliation
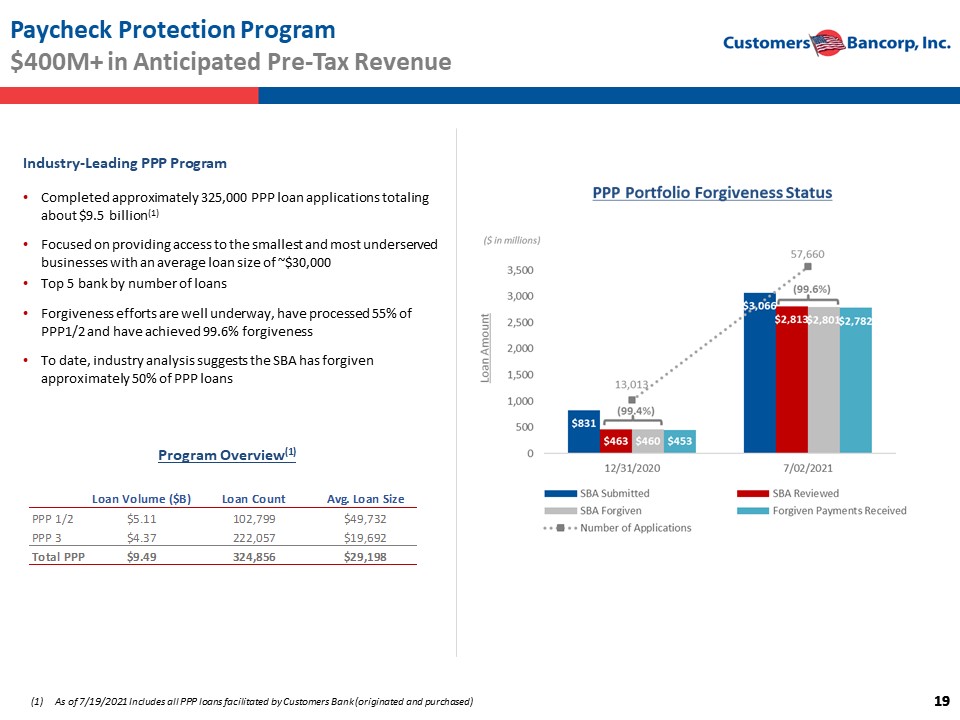
19 19 Paycheck Protection Program $ 400M + in Anticipated Pre - Tax Revenue (1) As of 7/19/2021 Includes all PPP loans facilitated by Customers Bank (originated and purchased) Industry - Leading PPP Program • Completed approximately 325,000 PPP loan applications totaling about $9.5 billion (1) • Focused on providing access to the smallest and most underserved businesses with an average loan size of ~$30,000 • Top 5 bank by number of loans • Forgiveness efforts are well underway, have processed 55% of PPP1/2 and have achieved 99.6% forgiveness • To date, industry analysis suggests the SBA has forgiven approximately 50% of PPP loans Loan Volume ($B) Loan Count Avg. Loan Size PPP 1/2 $5.11 102,799 $49,732 PPP 3 $4.37 222,057 $19,692 Total PPP $9.49 324,856 $29,198 Program Overview (1)
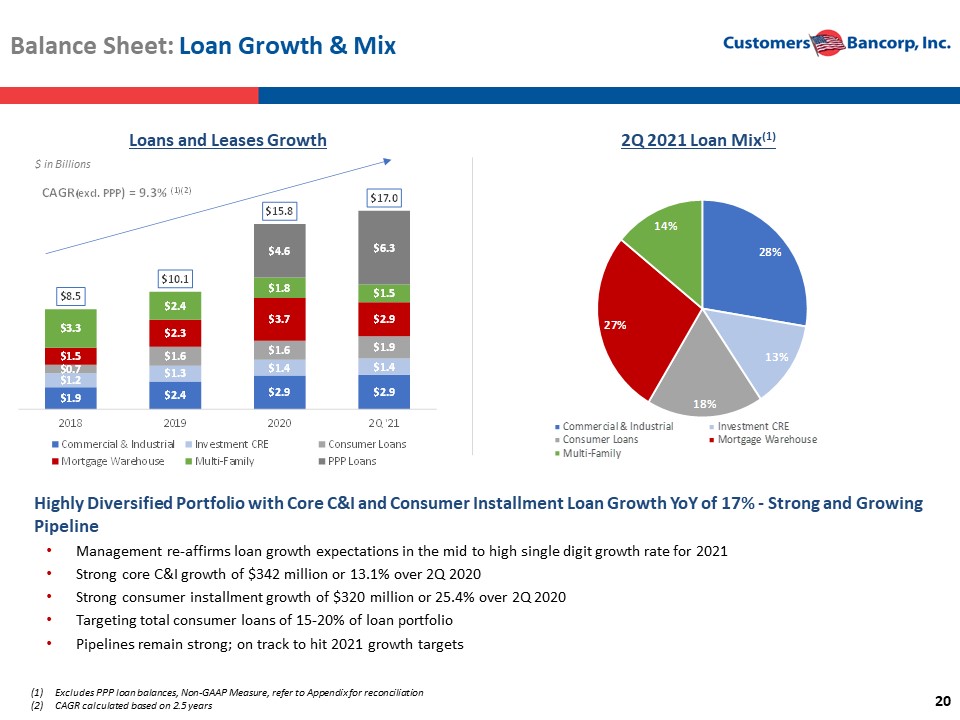
20 28% 13% 18% 27% 14% Commercial & Industrial Investment CRE Consumer Loans Mortgage Warehouse Multi-Family Balance Sheet: Loan Growth & Mix (1) Excludes PPP loan balances, Non - GAAP Measure, refer to Appendix for reconciliation (2) CAGR calculated based on 2.5 years Highly Diversified Portfolio with Core C&I and Consumer Installment Loan Growth YoY of 17% - Strong and Growing Pipeline • Management re - affirms loan growth expectations in the mid to high single digit growth rate for 2021 • Strong core C&I growth of $342 million or 13.1% over 2Q 2020 • Strong consumer installment growth of $320 million or 25.4% over 2Q 2020 • Targeting total consumer loans of 15 - 20% of loan portfolio • Pipelines remain strong; on track to hit 2021 growth targets $1.9 $2.4 $2.9 $2.9 $1.2 $1.3 $1.4 $1.4 $0.7 $1.6 $1.6 $1.9 $1.5 $2.3 $3.7 $2.9 $3.3 $2.4 $1.8 $1.5 $4.6 $6.3 $8.5 $10.1 $15.8 $17.0 2018 2019 2020 2Q '21 Commercial & Industrial Investment CRE Consumer Loans Mortgage Warehouse Multi-Family PPP Loans CAGR (excl. PPP ) = 9.3% (1)(2) Loans and Leases Growth 2Q 2021 Loan Mix (1) $ in Billions
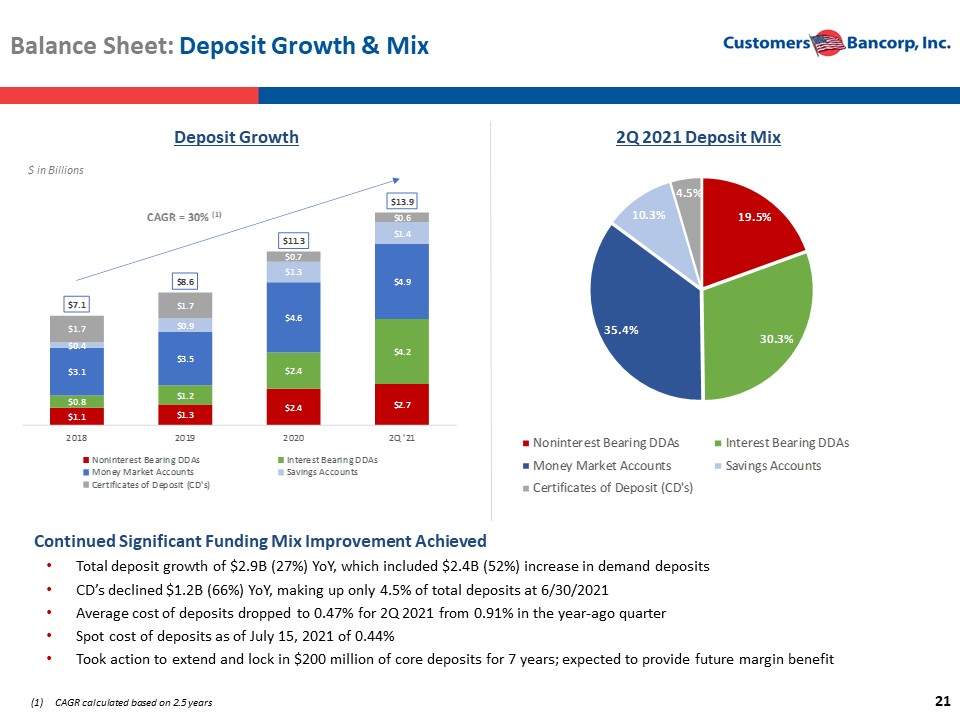
21 Balance Sheet: Deposit Growth & Mix Continued Significant Funding Mix Improvement Achieved • Total deposit growth of $2.9B (27%) YoY, which included $2.4B (52%) increase in demand deposits • CD’s declined $1.2B (66%) YoY, making up only 4.5% of total deposits at 6/30/2021 • Average cost of deposits dropped to 0.47% for 2Q 2021 from 0.91% in the year - ago quarter • Spot cost of deposits as of July 15, 2021 of 0.44% • Took action to extend and lock in $200 million of core deposits for 7 years; expected to provide future margin benefit (1) CAGR calculated based on 2.5 years Deposit Growth 2Q 2021 Deposit Mix $ in Billions 19.5% 30.3% 35.4% 10.3% 4.5% Noninterest Bearing DDAs Interest Bearing DDAs Money Market Accounts Savings Accounts Certificates of Deposit (CD's) $1.1 $1.3 $2.4 $2.7 $0.8 $1.2 $2.4 $4.2 $3.1 $3.5 $4.6 $4.9 $0.4 $0.9 $1.3 $1.4 $1.7 $1.7 $0.7 $0.6 $7.1 $8.6 $11.3 $13.9 2018 2019 2020 2Q '21 Noninterest Bearing DDAs Interest Bearing DDAs Money Market Accounts Savings Accounts Certificates of Deposit (CD's) CAGR = 30% (1)
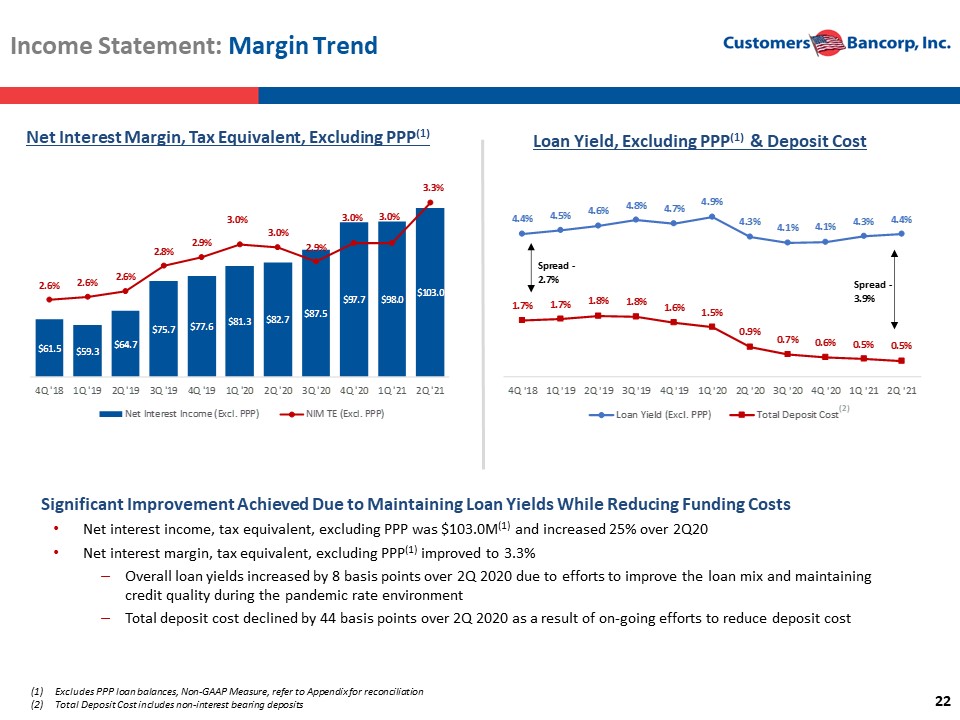
22 Income Statement: Margin Trend Significant Improvement Achieved Due to Maintaining Loan Yields While Reducing Funding Costs • Net interest income, tax equivalent, excluding PPP was $103.0M (1) and increased 25% over 2Q20 • Net interest margin, tax equivalent, excluding PPP (1 ) improved to 3.3% ‒ Overall loan yields increased by 8 basis points over 2Q 2020 due to efforts to improve the loan mix and maintaining credit quality during the pandemic rate environment ‒ Total deposit cost declined by 44 basis points over 2Q 2020 as a result of on - going efforts to reduce deposit cost Net Interest Margin, Tax Equivalent, Excluding PPP (1 ) Loan Yield, Excluding PPP (1 ) & Deposit Cost (1) Excludes PPP loan balances, Non - GAAP Measure, refer to Appendix for reconciliation (2) Total Deposit Cost includes non - interest bearing deposits 4.4% 4.5% 4.6% 4.8% 4.7% 4.9% 4.3% 4.1% 4.1% 4.3% 4.4% 1.7% 1.7% 1.8% 1.8% 1.6% 1.5% 0.9% 0.7% 0.6% 0.5% 0.5% 4Q '18 1Q '19 2Q '19 3Q '19 4Q '19 1Q '20 2Q '20 3Q '20 4Q '20 1Q '21 2Q '21 Loan Yield (Excl. PPP) Total Deposit Cost Spread - 2.7% Spread - 3.9% (2) $61.5 $59.3 $64.7 $75.7 $77.6 $81.3 $82.7 $87.5 $97.7 $98.0 $103.0 2.6% 2.6% 2.6% 2.8% 2.9% 3.0% 3.0% 2.9% 3.0% 3.0% 3.3% 4Q '18 1Q '19 2Q '19 3Q '19 4Q '19 1Q '20 2Q '20 3Q '20 4Q '20 1Q '21 2Q '21 Net Interest Income (Excl. PPP) NIM TE (Excl. PPP)
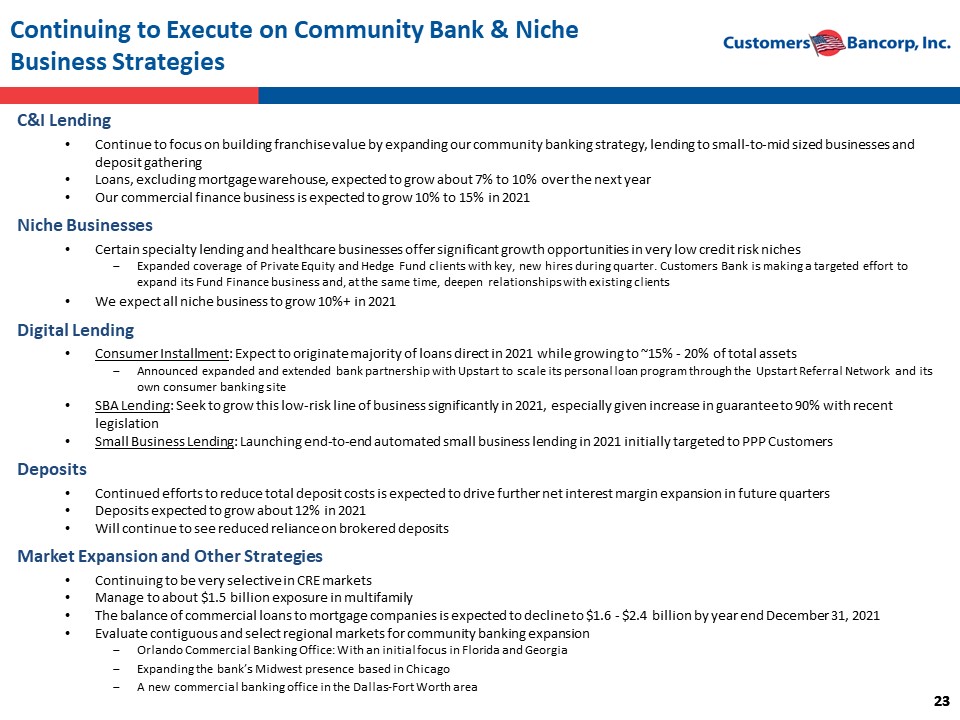
23 23 Continuing to Execute on Community Bank & Niche Business Strategies C&I Lending • Continue to focus on building franchise value by expanding our community banking strategy, lending to small - to - mid sized busines ses and deposit gathering • Loans, excluding mortgage warehouse, expected to grow about 7% to 10% over the next year • Our commercial finance business is expected to grow 10% to 15% in 2021 Niche Businesses • Certain specialty lending and healthcare businesses offer significant growth opportunities in very low credit risk niches ‒ Expanded coverage of Private Equity and Hedge Fund clients with key, new hires during quarter. Customers Bank is making a targeted effort to expand its Fund Finance business and, at the same time, deepen relationships with existing clients • We expect all niche business to grow 10%+ in 2021 Digital Lending • Consumer Installment : E xpect to originate majority of loans direct in 2021 while growing to ~15% - 20% of total assets ‒ Announced expanded and extended bank partnership with Upstart to scale its personal loan program through the Upstart Referral Network and its own consumer banking site • SBA Lending : Seek to grow this low - risk line of business significantly in 2021, especially given increase in guarantee to 90% with recent legislation • Small Business Lending : Launching end - to - end automated small business lending in 2021 initially targeted to PPP Customers Deposits • Continued efforts to reduce total deposit costs is expected to drive further net interest margin expansion in future quarters • Deposits expected to grow about 12% in 2021 • Will continue to see reduced reliance on brokered deposits Market Expansion and Other Strategies • Continuing to be very selective in CRE markets • Manage to about $1.5 billion exposure in multifamily • The balance of commercial loans to mortgage companies is expected to decline to $1.6 - $2.4 billion by year end December 31, 2021 • Evaluate contiguous and select regional markets for community banking expansion ‒ Orlando Commercial Banking Office: With an initial focus in Florida and Georgia ‒ Expanding the bank’s Midwest presence based in Chicago ‒ A new commercial banking office in the Dallas - Fort Worth area
III. Credit Risk Management
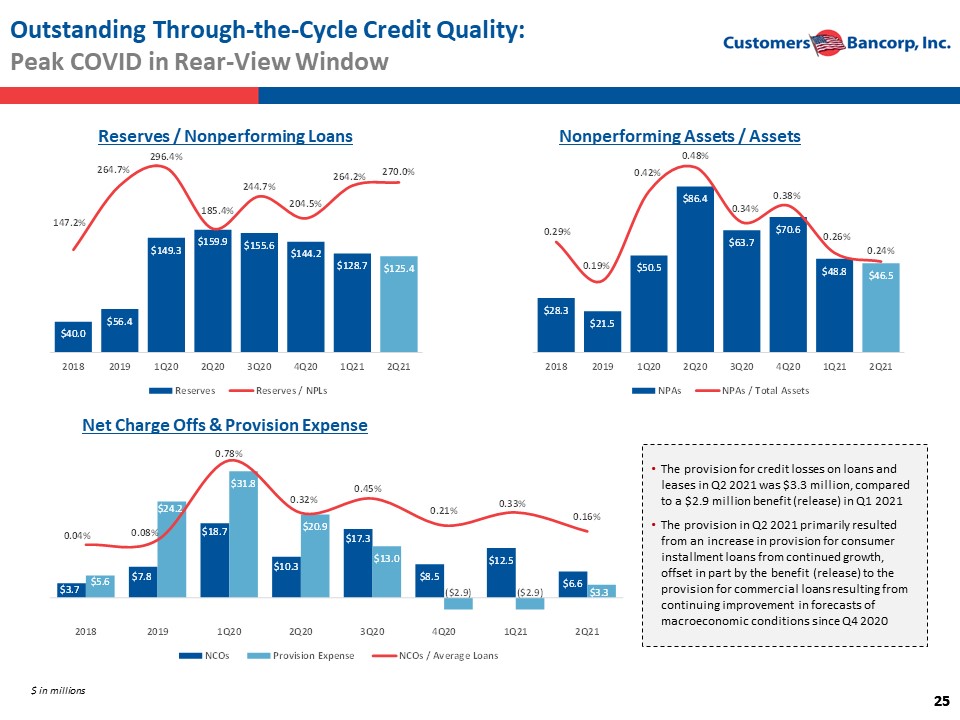
25 25 Outstanding Through - the - Cycle Credit Quality: Peak COVID in Rear - View Window $ in millions Nonperforming Assets / Assets Reserves / Nonperforming Loans Net Charge Offs & Provision Expense • The provision for credit losses on loans and leases in Q2 2021 was $3.3 million, compared to a $2.9 million benefit (release) in Q1 2021 • The provision in Q2 2021 primarily resulted from an increase in provision for consumer installment loans from continued growth, offset in part by the benefit (release) to the provision for commercial loans resulting from continuing improvement in forecasts of macroeconomic conditions since Q4 2020 $40.0 $56.4 $149.3 $159.9 $155.6 $144.2 $128.7 $125.4 147.2% 264.7% 296.4% 185.4% 244.7% 204.5% 264.2% 270.0% 2018 2019 1Q20 2Q20 3Q20 4Q20 1Q21 2Q21 Reserves Reserves / NPLs $28.3 $21.5 $50.5 $86.4 $63.7 $70.6 $48.8 $46.5 0.29% 0.19% 0.42% 0.48% 0.34% 0.38% 0.26% 0.24% 2018 2019 1Q20 2Q20 3Q20 4Q20 1Q21 2Q21 NPAs NPAs / Total Assets $3.7 $7.8 $18.7 $10.3 $17.3 $8.5 $12.5 $6.6 $5.6 $24.2 $31.8 $20.9 $13.0 ($2.9) ($2.9) $3.3 0.04% 0.08% 0.78% 0.32% 0.45% 0.21% 0.33% 0.16% 2018 2019 1Q20 2Q20 3Q20 4Q20 1Q21 2Q21 NCOs Provision Expense NCOs / Average Loans
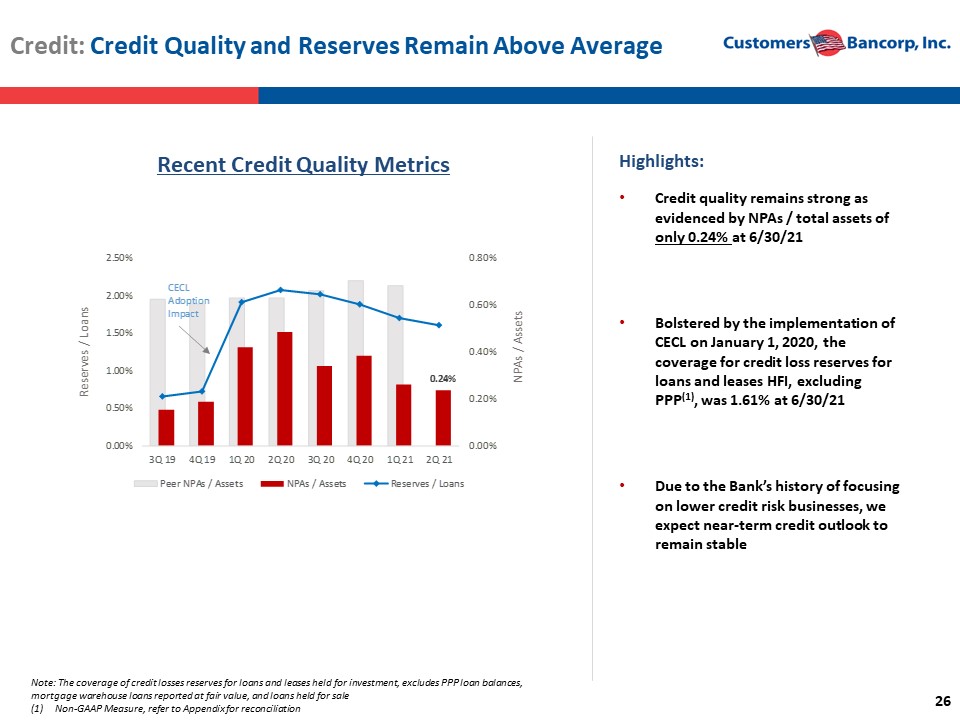
26 Credit: Credit Quality and Reserves Remain Above Average Highlights: • Credit quality remains strong as evidenced by NPAs / total assets of only 0.24% at 6/30/21 • Bolstered by the implementation of CECL on January 1, 2020, the coverage for credit loss reserves for loans and leases HFI, excluding PPP (1 ) , was 1.61% at 6/30/21 • Due to the Bank’s history of focusing on lower credit risk businesses, we expect near - term credit outlook to remain stable Note: The coverage of credit losses reserves for loans and leases held for investment, excludes PPP loan balances, mortgage warehouse loans reported at fair value, and loans held for sale (1) Non - GAAP Measure, refer to Appendix for reconciliation Recent Credit Quality Metrics 0.24% 0.00% 0.20% 0.40% 0.60% 0.80% 0.00% 0.50% 1.00% 1.50% 2.00% 2.50% 3Q 19 4Q 19 1Q 20 2Q 20 3Q 20 4Q 20 1Q 21 2Q 21 Peer NPAs / Assets NPAs / Assets Reserves / Loans Reserves / Loans NPAs / Assets CECL Adoption Impact
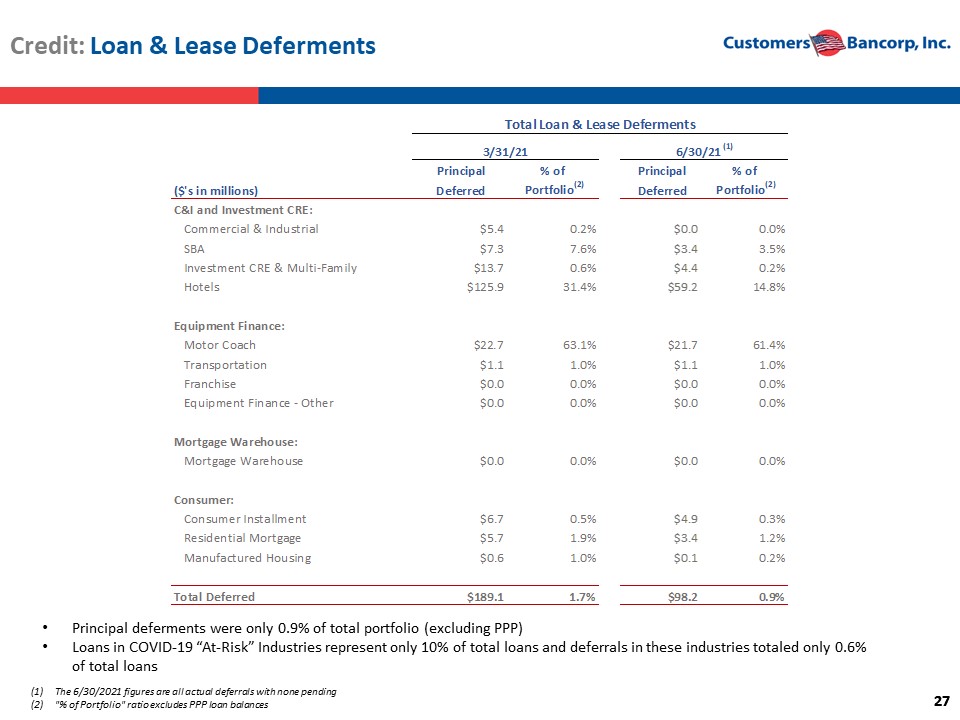
27 27 Credit: Loan & Lease Deferments (1) The 6/30/2021 figures are all actual deferrals with none pending (2) "% of Portfolio" ratio excludes PPP loan balances • Principal deferments were only 0.9% of total portfolio (excluding PPP) • Loans in COVID - 19 “At - Risk” Industries represent only 10% of total loans and deferrals in these industries totaled only 0.6% of total loans Principal % of Principal % of ($'s in millions) Deferred Portfolio (2) Deferred Portfolio (2) C&I and Investment CRE: Commercial & Industrial $5.4 0.2% $0.0 0.0% SBA $7.3 7.6% $3.4 3.5% Investment CRE & Multi-Family $13.7 0.6% $4.4 0.2% Hotels $125.9 31.4% $59.2 14.8% Equipment Finance: Motor Coach $22.7 63.1% $21.7 61.4% Transportation $1.1 1.0% $1.1 1.0% Franchise $0.0 0.0% $0.0 0.0% Equipment Finance - Other $0.0 0.0% $0.0 0.0% Mortgage Warehouse: Mortgage Warehouse $0.0 0.0% $0.0 0.0% Consumer: Consumer Installment $6.7 0.5% $4.9 0.3% Residential Mortgage $5.7 1.9% $3.4 1.2% Manufactured Housing $0.6 1.0% $0.1 0.2% Total Deferred $189.1 1.7% $98.2 0.9% 3/31/21 6/30/21 (1) Total Loan & Lease Deferments
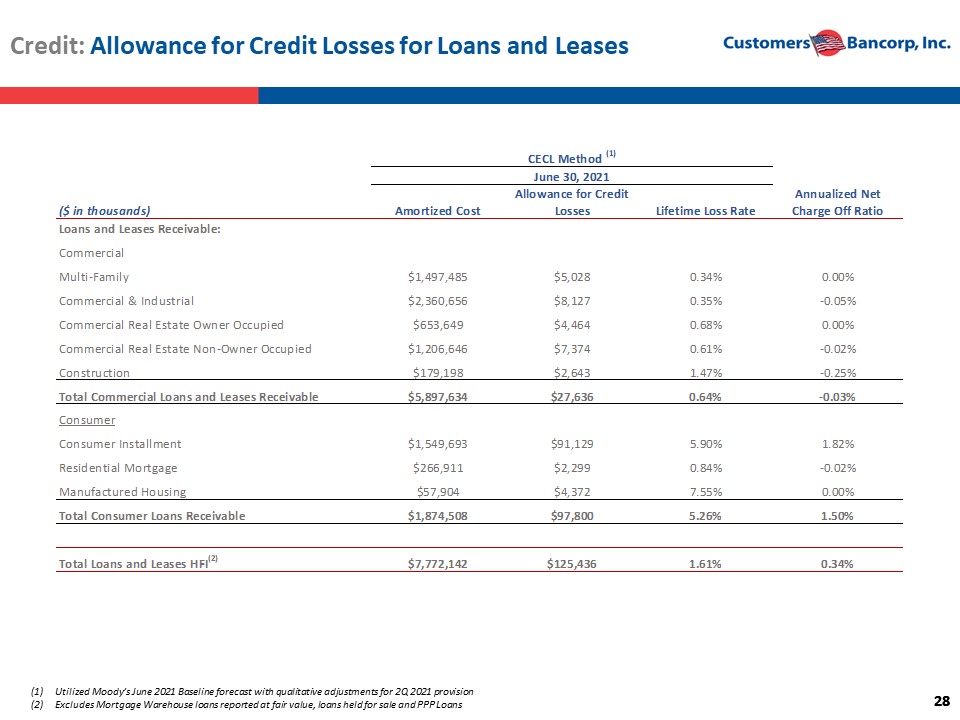
28 28 Credit: Allowance for Credit Losses for Loans and Leases (1) Utilized Moody’s June 2021 Baseline forecast with qualitative adjustments for 2Q 2021 provision (2) Excludes Mortgage Warehouse loans reported at fair value, loans held for sale and PPP Loans ($ in thousands) Amortized Cost Allowance for Credit Losses Lifetime Loss Rate Annualized Net Charge Off Ratio Loans and Leases Receivable: Commercial Multi-Family $1,497,485 $5,028 0.34% 0.00% Commercial & Industrial $2,360,656 $8,127 0.35% -0.05% Commercial Real Estate Owner Occupied $653,649 $4,464 0.68% 0.00% Commercial Real Estate Non-Owner Occupied $1,206,646 $7,374 0.61% -0.02% Construction $179,198 $2,643 1.47% -0.25% Total Commercial Loans and Leases Receivable $5,897,634 $27,636 0.64% -0.03% Consumer Consumer Installment $1,549,693 $91,129 5.90% 1.82% Residential Mortgage $266,911 $2,299 0.84% -0.02% Manufactured Housing $57,904 $4,372 7.55% 0.00% Total Consumer Loans Receivable $1,874,508 $97,800 5.26% 1.50% Total Loans and Leases HFI (2) $7,772,142 $125,436 1.61% 0.34% CECL Method (1) June 30, 2021
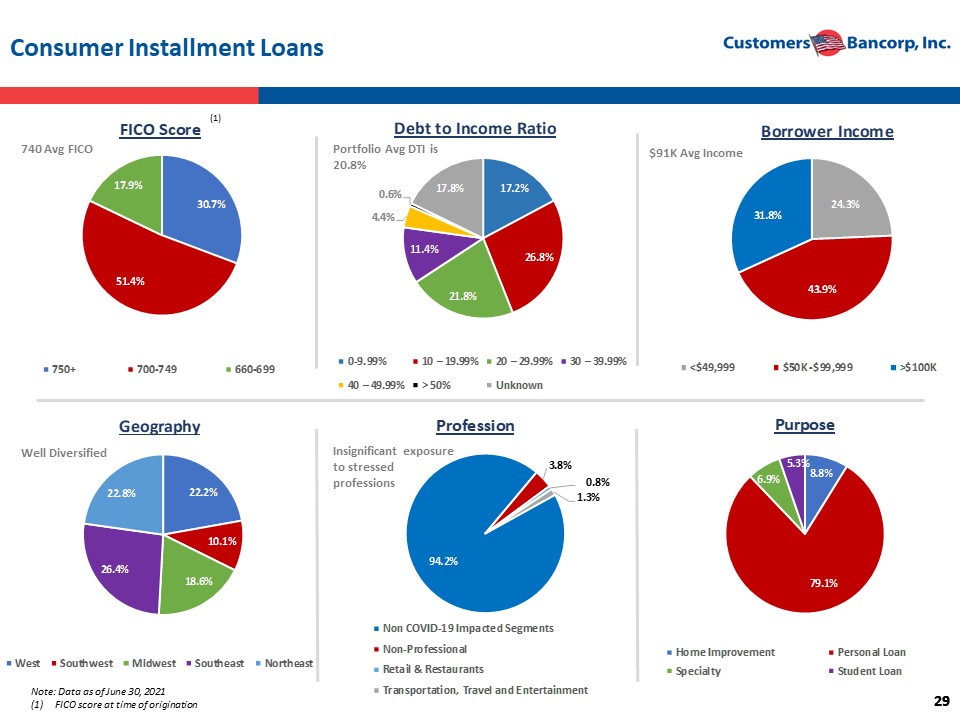
29 29 17.2% 26.8% 21.8% 11.4% 4.4% 0.6% 17.8% Debt to Income Ratio 0-9.99% 10 – 19.99% 20 – 29.99% 30 – 39.99% 40 – 49.99% > 50% Unknown Consumer Installment Loans Well Diversified Insignificant exposure to stressed professions $91K Avg Income 740 Avg FICO Portfolio Avg DTI is 20.8% Note: Data as of June 30, 2021 (1) FICO score at time of origination (1) 30.7% 51.4% 17.9% FICO Score 750+ 700-749 660-699 24.3% 43.9% 31.8% Borrower Income <$49,999 $50K -$99,999 >$100K 22.2% 10.1% 18.6% 26.4% 22.8% Geography West Southwest Midwest Southeast Northeast 94.2% 3.8% 0.8% 1.3% Profession Non COVID-19 Impacted Segments Non-Professional Retail & Restaurants Transportation, Travel and Entertainment 8.8% 79.1% 6.9% 5.3% Purpose Home Improvement Personal Loan Specialty Student Loan
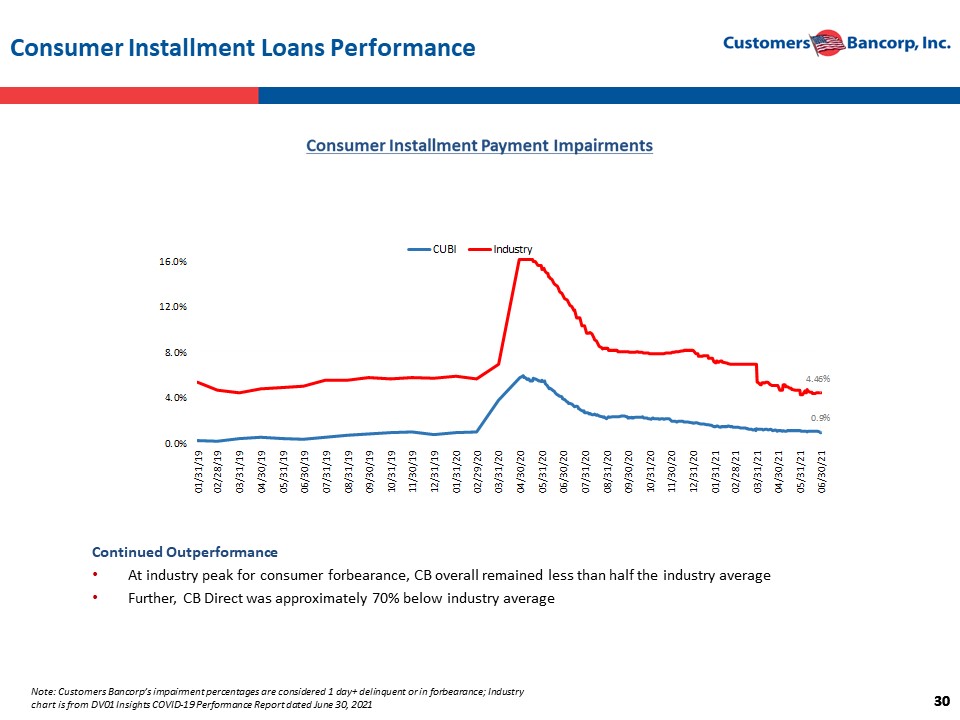
30 30 Consumer Installment Loans Performance Note: Customers Bancorp’s impairment percentages are considered 1 day+ delinquent or in forbearance; Industry chart is from DV01 Insights COVID - 19 Performance Report dated June 30, 2021 Continued Outperformance • At industry peak for consumer forbearance, CB overall remained less than half the industry average • Further, CB Direct was approximately 70% below industry average 4.46% 0.9% 0.0% 4.0% 8.0% 12.0% 16.0% 01/31/19 02/28/19 03/31/19 04/30/19 05/31/19 06/30/19 07/31/19 08/31/19 09/30/19 10/31/19 11/30/19 12/31/19 01/31/20 02/29/20 03/31/20 04/30/20 05/31/20 06/30/20 07/31/20 08/31/20 09/30/20 10/31/20 11/30/20 12/31/20 01/31/21 02/28/21 03/31/21 04/30/21 05/31/21 06/30/21 CUBI Industry
IV . Outlook & Takeaways
Financial Outlook ‒ Sling Shot Build in Capital Levels ‒ Capital Deployment Priorities: Capital Stack Optimization and Balance Sheet Growth ‒ Financial Guidance
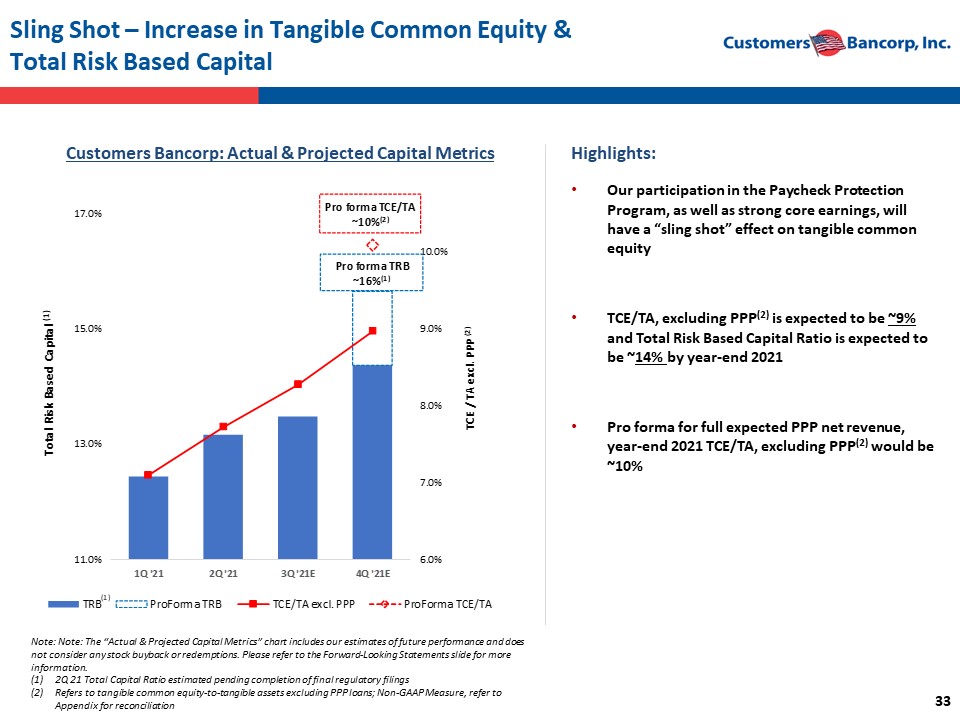
33 Sling Shot – Increase in Tangible Common Equity & Total Risk Based Capital Customers Bancorp: Actual & Projected Capital Metrics Note: Note: The “Actual & Projected Capital Metrics” chart includes our estimates of future performance and does not consider any stock buyback or redemptions. Please refer to the Forward - Looking Statements slide for more information . (1) 2Q 21 Total Capital Ratio estimated pending completion of final regulatory filings (2) Refers to tangible common equity - to - tangible assets excluding PPP loans ; Non - GAAP Measure, refer to Appendix for reconciliation Highlights: • Our participation in the Paycheck Protection Program, as well as strong core earnings, will have a “sling shot” effect on tangible common equity • TCE/TA, excluding PPP (2) is expected to be ~ 9% and Total Risk Based Capital Ratio is expected to be ~ 14% by year - end 2021 • Pro forma for full expected PPP net revenue, year - end 2021 TCE/TA, excluding PPP (2 ) would be ~10% 6.0% 7.0% 8.0% 9.0% 10.0% 11.0% 13.0% 15.0% 17.0% 1Q '21 2Q '21 3Q '21E 4Q '21E TCE / TA excl. PPP (2) TRB ProForma TRB TCE/TA excl. PPP ProForma TCE/TA Pro forma TCE/TA ~10% (2) Pro forma TRB ~16% (1) Total Risk Based Capital (1) (1)
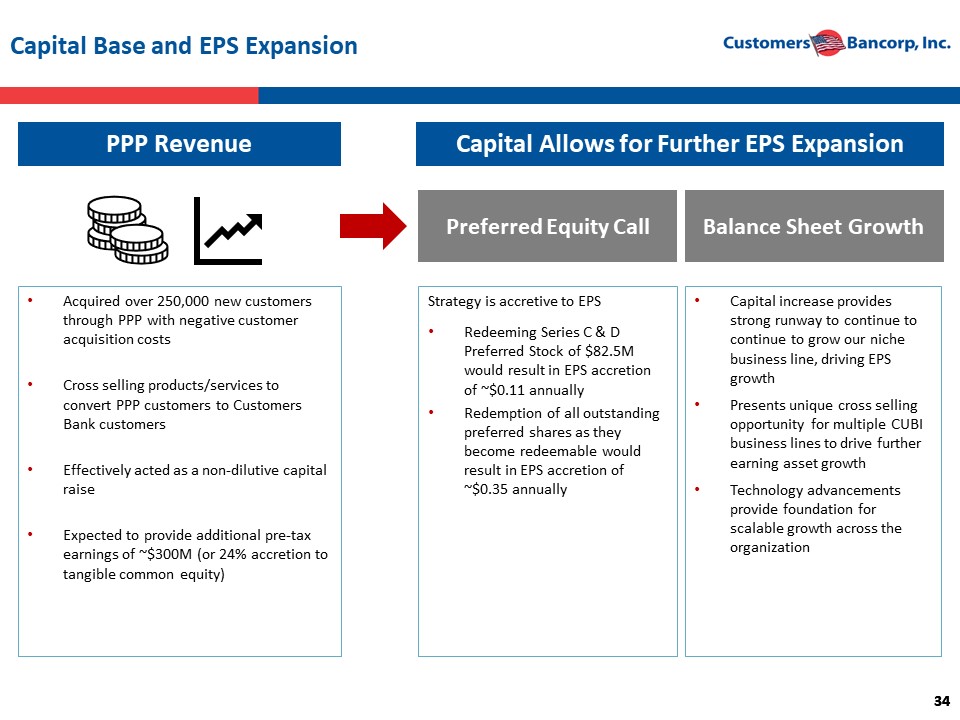
34 34 Capital Base and EPS Expansion PPP Revenue • Acquired over 250,000 new customers through PPP with negative customer acquisition costs • Cross selling products/services to convert PPP customers to Customers Bank customers • Effectively acted as a non - dilutive capital raise • Expected to provide additional pre - tax earnings of ~$300M (or 24% accretion to tangible common equity) Capital Allows for Further EPS Expansion Strategy is accretive to EPS • Redeeming Series C & D Preferred Stock of $82.5M would result in EPS accretion of ~$0.11 annually • Redemption of all outstanding preferred shares as they become redeemable would result in EPS accretion of ~$0.35 annually Preferred Equity Call • Capital increase provides strong runway to continue to continue to grow our niche business line, driving EPS growth • Presents unique cross selling opportunity for multiple CUBI business lines to drive further earning asset growth • Technology advancements provide foundation for scalable growth across the organization Balance Sheet Growth
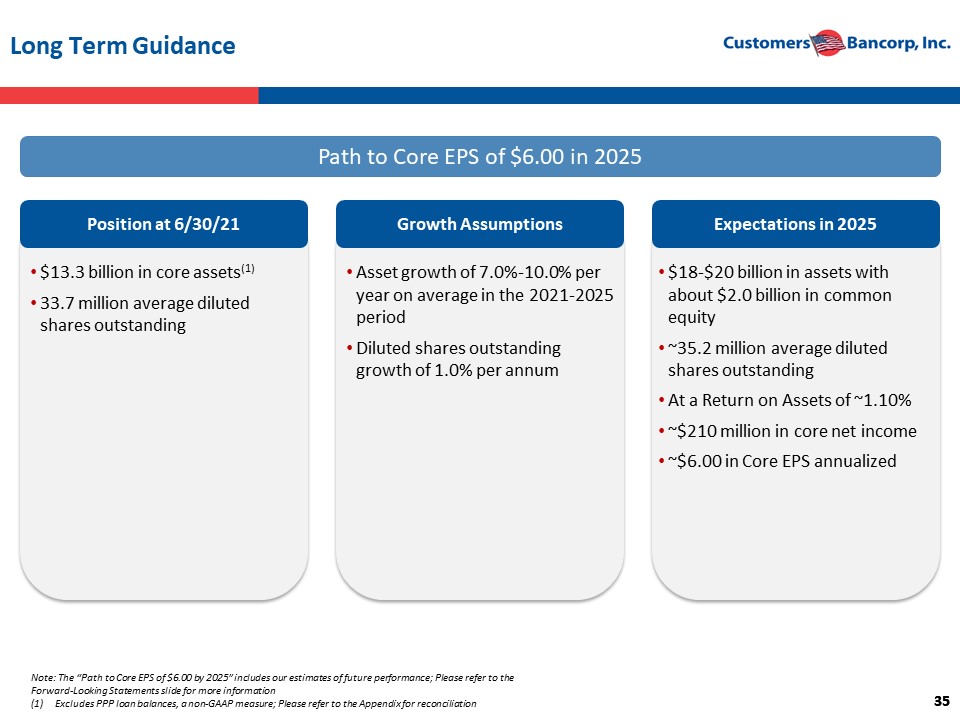
35 35 Long Term Guidance Note: The “Path to Core EPS of $6.00 by 2025” includes our estimates of future performance; Please refer to the Forward - Looking Statements slide for more information (1) Excludes PPP loan balances, a non - GAAP measure; Please refer to the Appendix for reconciliation Path to Core EPS of $6.00 in 2025 Position at 6/30/21 Growth Assumptions Expectations in 2025 • $13.3 billion in core assets (1 ) • 33.7 million average diluted shares outstanding • Asset growth of 7.0% - 10.0% per year on average in the 2021 - 2025 period • Diluted shares outstanding growth of 1.0% per annum • $18 - $20 billion in assets with about $2.0 billion in common equity • ~35.2 million average diluted shares outstanding • At a Return on Assets of ~1.10% • ~$210 million in core net income • ~$6.00 in Core EPS annualized
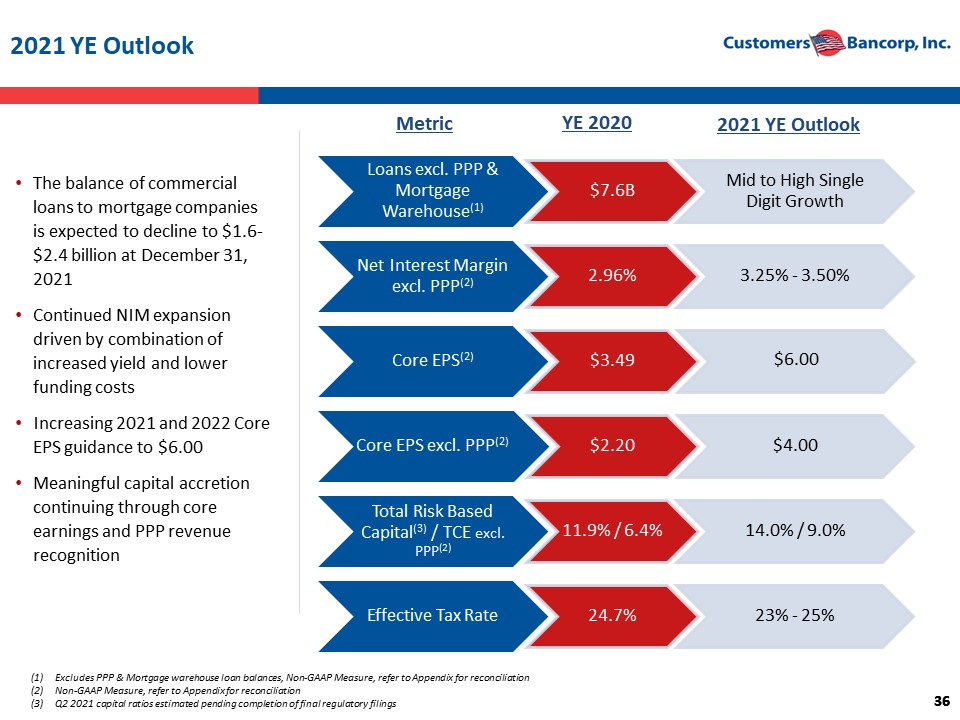
36 36 2021 YE Outlook • The balance of commercial loans to mortgage companies is expected to decline to $1.6 - $2.4 billion at December 31, 2021 • Continued NIM expansion driven by combination of increased yield and lower funding costs • Increasing 2021 and 2022 Core EPS guidance to $6.00 • Meaningful capital accretion continuing through core earnings and PPP revenue recognition Loans excl. PPP & Mortgage Warehouse (1) $7.6B Mid to High Single Digit Growth Net Interest Margin excl. PPP (2) 2.96% 3.25% - 3.50% Core EPS (2) $3.49 $6.00 Core EPS excl. PPP (2) $2.20 $4.00 Total Risk Based Capital (3) / TCE excl. PPP (2) 11.9% / 6.4% 14.0% / 9.0% Effective Tax Rate 24.7% 23% - 25% Metric YE 2020 2021 YE Outlook (1) Excludes PPP & Mortgage warehouse loan balances, Non - GAAP Measure, refer to Appendix for reconciliation (2) Non - GAAP Measure, refer to Appendix for reconciliation (3) Q2 2021 capital ratios estimated pending completion of final regulatory filings
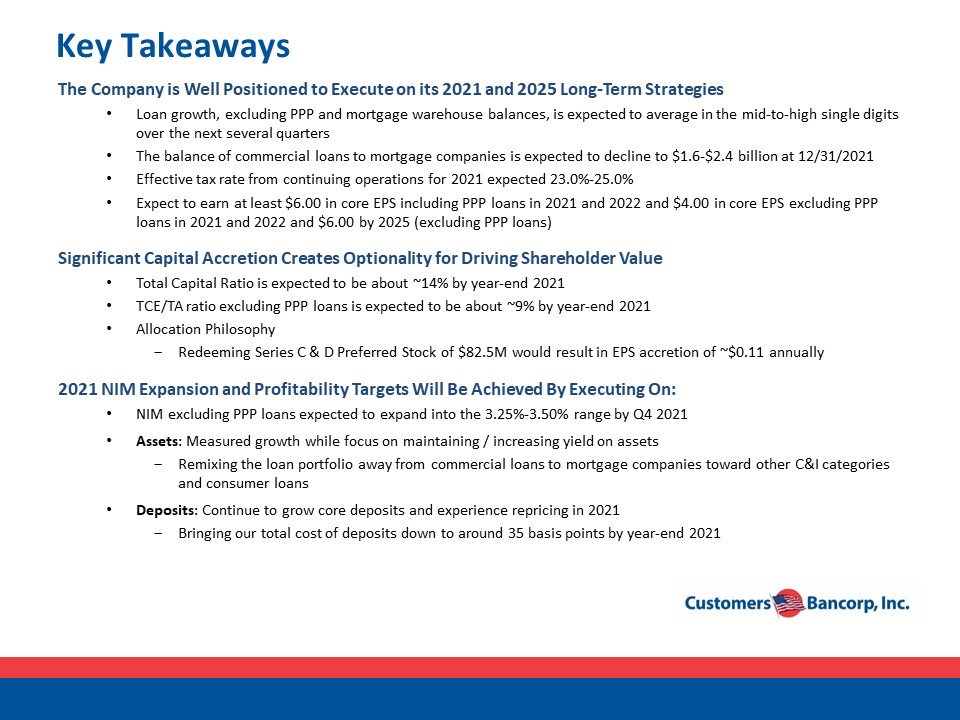
Key Takeaways The Company is Well Positioned to Execute on its 2021 and 2025 Long - Term Strategies • Loan growth, excluding PPP and mortgage warehouse balances, is expected to average in the mid - to - high single digits over the next several quarters • The balance of commercial loans to mortgage companies is expected to decline to $1.6 - $2.4 billion at 12/31/2021 • Effective tax rate from continuing operations for 2021 expected 23.0% - 25.0% • Expect to earn at least $6.00 in core EPS including PPP loans in 2021 and 2022 and $ 4 .00 in core EPS excluding PPP loans in 2021 and 2022 and $6.00 by 2025 (excluding PPP loans) Significant C apital A ccretion Creates Optionality for D riving Shareholder Value • Total Capital Ratio is expected to be about ~14% by year - end 2021 • TCE/TA ratio excluding PPP loans is expected to be about ~9% by year - end 2021 • Allocation Philosophy ‒ Redeeming Series C & D Preferred Stock of $82.5M would result in EPS accretion of ~$0.11 annually 2021 NIM Expansion and Profitability Targets W ill B e Achieved B y Executing On: • NIM excluding PPP loans expected to expand into the 3.25% - 3.50% range by Q4 2021 • Assets : Measured growth while focus on maintaining / increasing yield on assets ‒ Remixing the loan portfolio away from commercial loans to mortgage companies toward other C&I categories and consumer loans • Deposits : Continue to grow core deposits and experience repricing in 2021 ‒ Bringing our total cost of deposits down to around 35 basis points by year - end 2021
V. Appendix
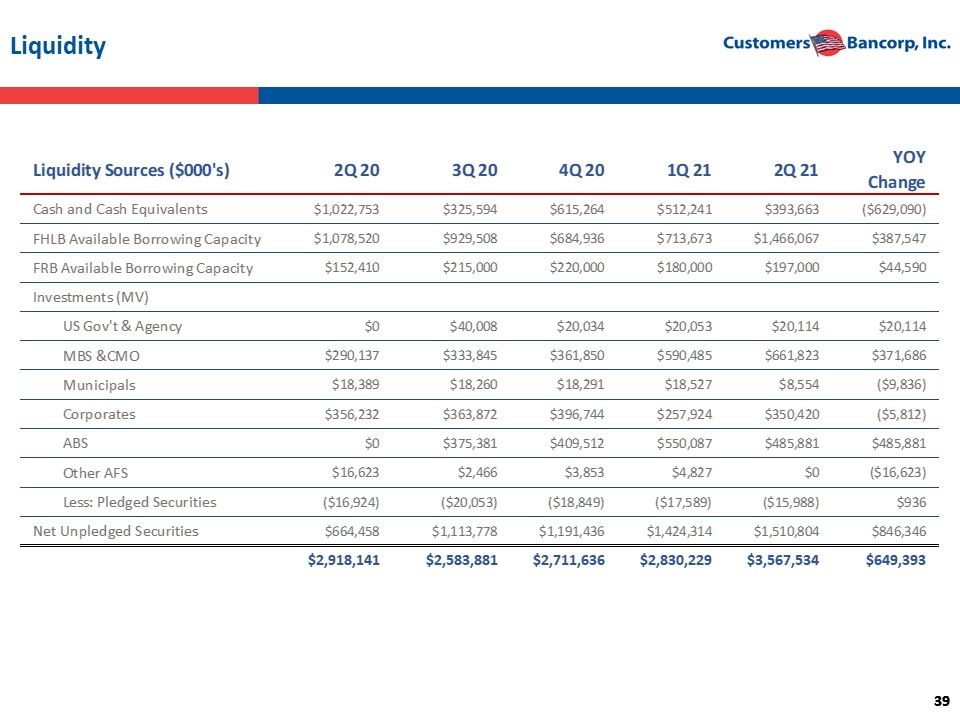
39 39 Liquidity Liquidity Sources ($000's) 2Q 20 3Q 20 4Q 20 1Q 21 2Q 21 YOY Change Cash and Cash Equivalents $1,022,753 $325,594 $615,264 $512,241 $393,663 ($629,090) FHLB Available Borrowing Capacity $1,078,520 $929,508 $684,936 $713,673 $1,466,067 $387,547 FRB Available Borrowing Capacity $152,410 $215,000 $220,000 $180,000 $197,000 $44,590 Investments (MV) US Gov't & Agency $0 $40,008 $20,034 $20,053 $20,114 $20,114 MBS &CMO $290,137 $333,845 $361,850 $590,485 $661,823 $371,686 Municipals $18,389 $18,260 $18,291 $18,527 $8,554 ($9,836) Corporates $356,232 $363,872 $396,744 $257,924 $350,420 ($5,812) ABS $0 $375,381 $409,512 $550,087 $485,881 $485,881 Other AFS $16,623 $2,466 $3,853 $4,827 $0 ($16,623) Less: Pledged Securities ($16,924) ($20,053) ($18,849) ($17,589) ($15,988) $936 Net Unpledged Securities $664,458 $1,113,778 $1,191,436 $1,424,314 $1,510,804 $846,346 $2,918,141 $2,583,881 $2,711,636 $2,830,229 $3,567,534 $649,393
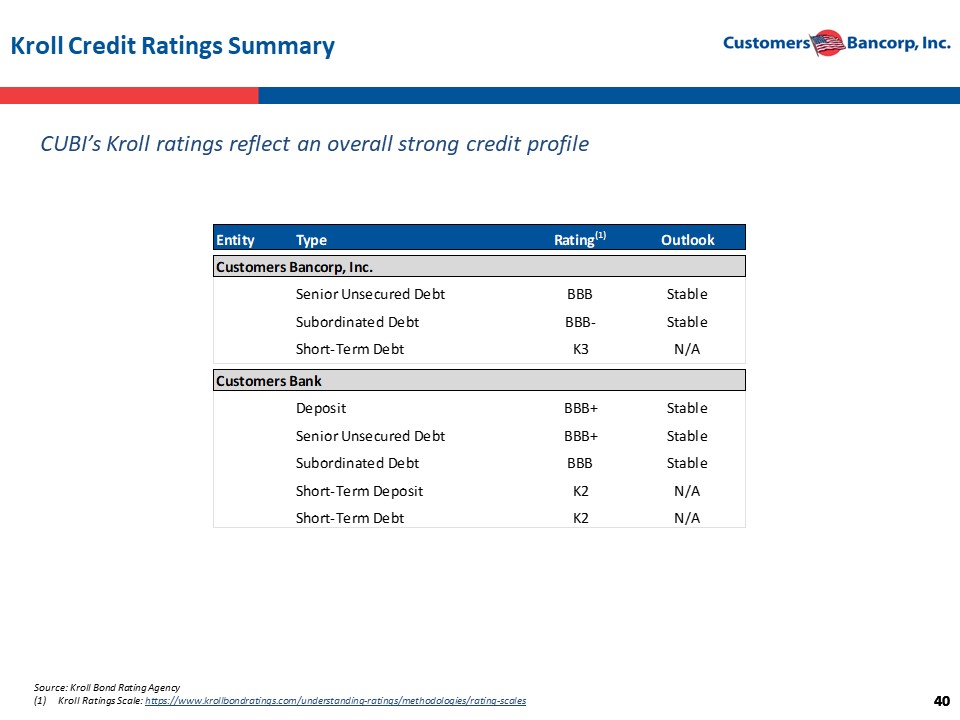
40 40 Kroll Credit Ratings Summary Source: Kroll Bond Rating Agency (1) Kroll Ratings Scale: https:// www.krollbondratings.com/understanding - ratings/methodologies/rating - scales CUBI’s Kroll ratings reflect an overall strong credit profile Entity Type Rating (1) Outlook Customers Bancorp, Inc. Senior Unsecured Debt BBB Stable Subordinated Debt BBB- Stable Short-Term Debt K3 N/A Customers Bank Deposit BBB+ Stable Senior Unsecured Debt BBB+ Stable Subordinated Debt BBB Stable Short-Term Deposit K2 N/A Short-Term Debt K2 N/A
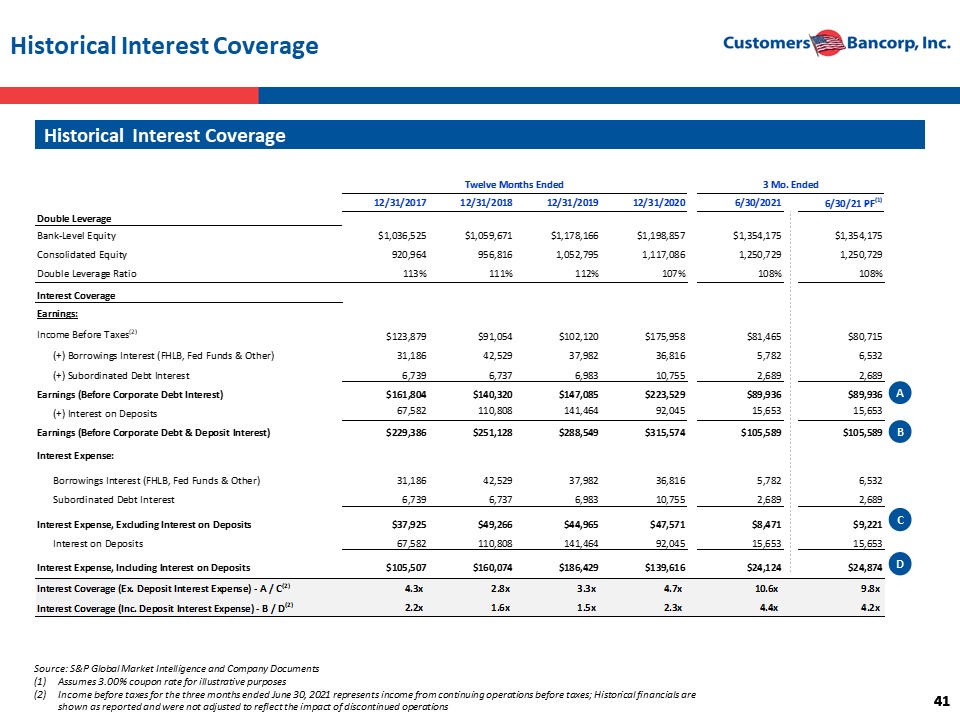
41 41 Historical Interest Coverage Historical Interest Coverage Source: S&P Global Market Intelligence and Company Documents (1) Assumes 3.00% coupon rate for illustrative purposes (2) Income before taxes for the three months ended June 30, 2021 represents income from continuing operations before taxes; Histo ric al financials are shown as reported and were not adjusted to reflect the impact of discontinued operations Twelve Months Ended 3 Mo. Ended 12/31/2017 12/31/2018 12/31/2019 12/31/2020 6/30/2021 6/30/21 PF (1) Double Leverage Bank-Level Equity $1,036,525 $1,059,671 $1,178,166 $1,198,857 $1,354,175 $1,354,175 Consolidated Equity 920,964 956,816 1,052,795 1,117,086 1,250,729 1,250,729 Double Leverage Ratio 113% 111% 112% 107% 108% 108% Interest Coverage Earnings: Income Before Taxes (2) $123,879 $91,054 $102,120 $175,958 $81,465 $80,715 (+) Borrowings Interest (FHLB, Fed Funds & Other) 31,186 42,529 37,982 36,816 5,782 6,532 (+) Subordinated Debt Interest 6,739 6,737 6,983 10,755 2,689 2,689 Earnings (Before Corporate Debt Interest) $161,804 $140,320 $147,085 $223,529 $89,936 $89,936 (+) Interest on Deposits 67,582 110,808 141,464 92,045 15,653 15,653 Earnings (Before Corporate Debt & Deposit Interest) $229,386 $251,128 $288,549 $315,574 $105,589 $105,589 Interest Expense: Borrowings Interest (FHLB, Fed Funds & Other) 31,186 42,529 37,982 36,816 5,782 6,532 Subordinated Debt Interest 6,739 6,737 6,983 10,755 2,689 2,689 Interest Expense, Excluding Interest on Deposits $37,925 $49,266 $44,965 $47,571 $8,471 $9,221 Interest on Deposits 67,582 110,808 141,464 92,045 15,653 15,653 Interest Expense, Including Interest on Deposits $105,507 $160,074 $186,429 $139,616 $24,124 $24,874 Interest Coverage (Ex. Deposit Interest Expense) - A / C (2) 4.3x 2.8x 3.3x 4.7x 10.6x 9.8x Interest Coverage (Inc. Deposit Interest Expense) - B / D (2) 2.2x 1.6x 1.5x 2.3x 4.4x 4.2x A B C D
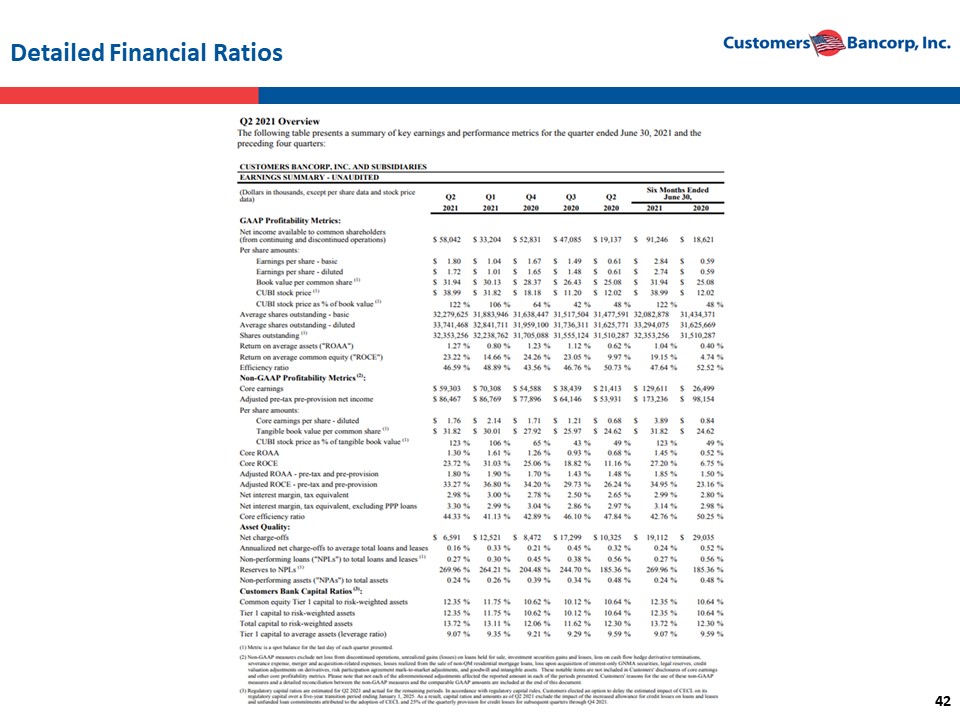
42 Detailed Financial Ratios
43 43 Customers believes that the non - GAAP measurements disclosed within this document are useful for investors, regulators, management and others to evaluate our core results of operations and financial condition relative to other financial institutions . These non - GAAP financial measures are frequently used by securities analysts, investors, and other interested parties in the evaluation of companies in Customers' industry . These non - GAAP financial measures exclude from corresponding GAAP measures the impact of certain elements that we do not believe are representative of our ongoing financial results, which we believe enhance an overall understanding of our performance and increases comparability of our period to period results . Investors should consider our performance and financial condition as reported under GAAP and all other relevant information when assessing our performance or financial condition . The non - GAAP measures presented are not necessarily comparable to non - GAAP measures that may be presented by other financial institutions . Although non - GAAP financial measures are frequently used in the evaluation of a company, they have limitations as analytical tools and should not be considered in isolation or as a substitute for analysis of our results of operations or financial condition as reported under GAAP . The following tables present reconciliations of GAAP to non - GAAP measures disclosed within this document . Reconciliation of Non - GAAP Measures - Unaudited
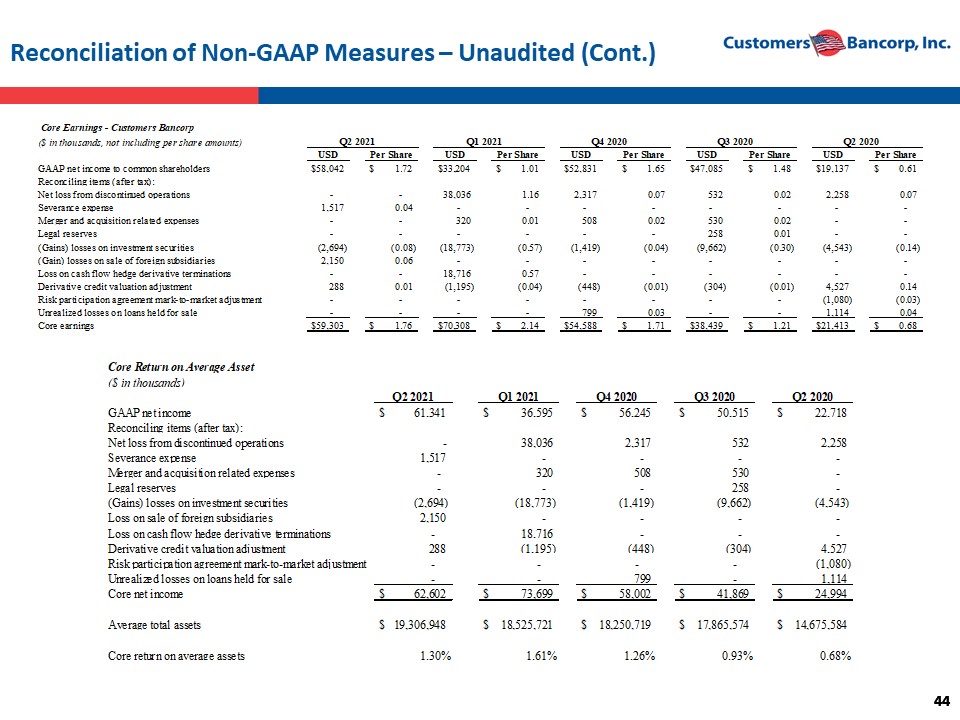
44 44 Reconciliation of Non - GAAP Measures – Unaudited (Cont.) ($ in thousands, not including per share amounts) Q2 2021 Q1 2021 Q4 2020 Q3 2020 Q2 2020 USD Per Share USD Per Share USD Per Share USD Per Share USD Per Share GAAP net income to common shareholders $58,042 $ 1.72 $33,204 $ 1.01 $52,831 $ 1.65 $47,085 $ 1.48 $19,137 $ 0.61 Reconciling items (after tax): Net loss from discontinued operations - - 38,036 1.16 2,317 0.07 532 0.02 2,258 0.07 Severance expense 1,517 0.04 - - - - - - - - Merger and acquisition related expenses - - 320 0.01 508 0.02 530 0.02 - - Legal reserves - - - - - - 258 0.01 - - (Gains) losses on investment securities (2,694) (0.08) (18,773) (0.57) (1,419) (0.04) (9,662) (0.30) (4,543) (0.14) (Gain) losses on sale of foreign subsidiaries 2,150 0.06 - - - - - - - - Loss on cash flow hedge derivative terminations - - 18,716 0.57 - - - - - - Derivative credit valuation adjustment 288 0.01 (1,195) (0.04) (448) (0.01) (304) (0.01) 4,527 0.14 Risk participation agreement mark-to-market adjustment - - - - - - - - (1,080) (0.03) Unrealized losses on loans held for sale - - - - 799 0.03 - - 1,114 0.04 Core earnings $59,303 $ 1.76 $70,308 $ 2.14 $54,588 $ 1.71 $38,439 $ 1.21 $21,413 $ 0.68 Core Earnings - Customers Bancorp Core Return on Average Asset ($ in thousands) Q2 2021 Q1 2021 Q4 2020 Q3 2020 Q2 2020 GAAP net income $ 61,341 $ 36,595 $ 56,245 $ 50,515 $ 22,718 Reconciling items (after tax): Net loss from discontinued operations - 38,036 2,317 532 2,258 Severance expense 1,517 - - - - Merger and acquisition related expenses - 320 508 530 - Legal reserves - - - 258 - (Gains) losses on investment securities (2,694) (18,773) (1,419) (9,662) (4,543) Loss on sale of foreign subsidiaries 2,150 - - - - Loss on cash flow hedge derivative terminations - 18,716 - - - Derivative credit valuation adjustment 288 (1,195) (448) (304) 4,527 Risk participation agreement mark-to-market adjustment - - - - (1,080) Unrealized losses on loans held for sale - - 799 - 1,114 Core net income $ 62,602 $ 73,699 $ 58,002 $ 41,869 $ 24,994 Average total assets $ 19,306,948 $ 18,525,721 $ 18,250,719 $ 17,865,574 $ 14,675,584 Core return on average assets 1.30% 1.61% 1.26% 0.93% 0.68%
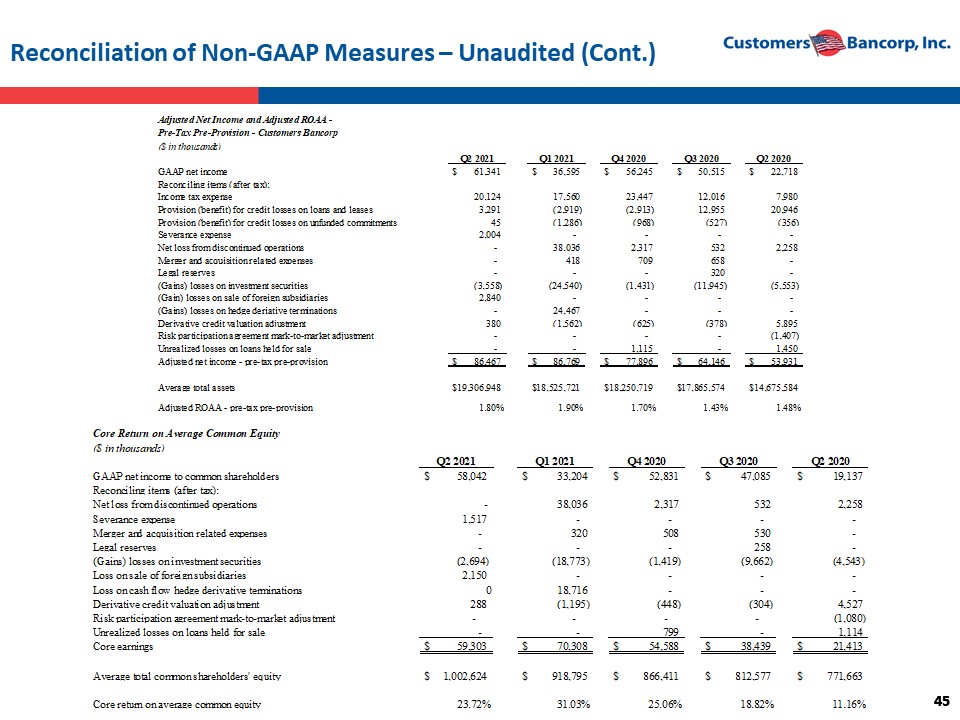
45 45 Reconciliation of Non - GAAP Measures – Unaudited (Cont.) Adjusted Net Income and Adjusted ROAA - Pre-Tax Pre-Provision - Customers Bancorp ($ in thousands) Q2 2021 Q1 2021 Q4 2020 Q3 2020 Q2 2020 GAAP net income $ 61,341 $ 36,595 $ 56,245 $ 50,515 $ 22,718 Reconciling items (after tax): Income tax expense 20,124 17,560 23,447 12,016 7,980 Provision (benefit) for credit losses on loans and leases 3,291 (2,919) (2,913) 12,955 20,946 Provision (benefit) for credit losses on unfunded commitments 45 (1,286) (968) (527) (356) Severance expense 2,004 - - - - Net loss from discontinued operations - 38,036 2,317 532 2,258 Merger and acquisition related expenses - 418 709 658 - Legal reserves - - - 320 - (Gains) losses on investment securities (3,558) (24,540) (1,431) (11,945) (5,553) (Gain) losses on sale of foreign subsidiaries 2,840 - - - - (Gains) losses on hedge deriative terminations - 24,467 - - - Derivative credit valuation adjustment 380 (1,562) (625) (378) 5,895 Risk participation agreement mark-to-market adjustment - - - - (1,407) Unrealized losses on loans held for sale - - 1,115 - 1,450 Adjusted net income - pre-tax pre-provision $ 86,467 $ 86,769 $ 77,896 $ 64,146 $ 53,931 Average total assets $19,306,948 $18,525,721 $18,250,719 $17,865,574 $14,675,584 Adjusted ROAA - pre-tax pre-provision 1.80% 1.90% 1.70% 1.43% 1.48% Core Return on Average Common Equity ($ in thousands) Q2 2021 Q1 2021 Q4 2020 Q3 2020 Q2 2020 GAAP net income to common shareholders $ 58,042 $ 33,204 $ 52,831 $ 47,085 $ 19,137 Reconciling items (after tax): Net loss from discontinued operations - 38,036 2,317 532 2,258 Severance expense 1,517 - - - - Merger and acquisition related expenses - 320 508 530 - Legal reserves - - - 258 - (Gains) losses on investment securities (2,694) (18,773) (1,419) (9,662) (4,543) Loss on sale of foreign subsidiaries 2,150 - - - - Loss on cash flow hedge derivative terminations 0 18,716 - - - Derivative credit valuation adjustment 288 (1,195) (448) (304) 4,527 Risk participation agreement mark-to-market adjustment - - - - (1,080) Unrealized losses on loans held for sale - - 799 - 1,114 Core earnings $ 59,303 $ 70,308 $ 54,588 $ 38,439 $ 21,413 Average total common shareholders' equity $ 1,002,624 $ 918,795 $ 866,411 $ 812,577 $ 771,663 Core return on average common equity 23.72% 31.03% 25.06% 18.82% 11.16%
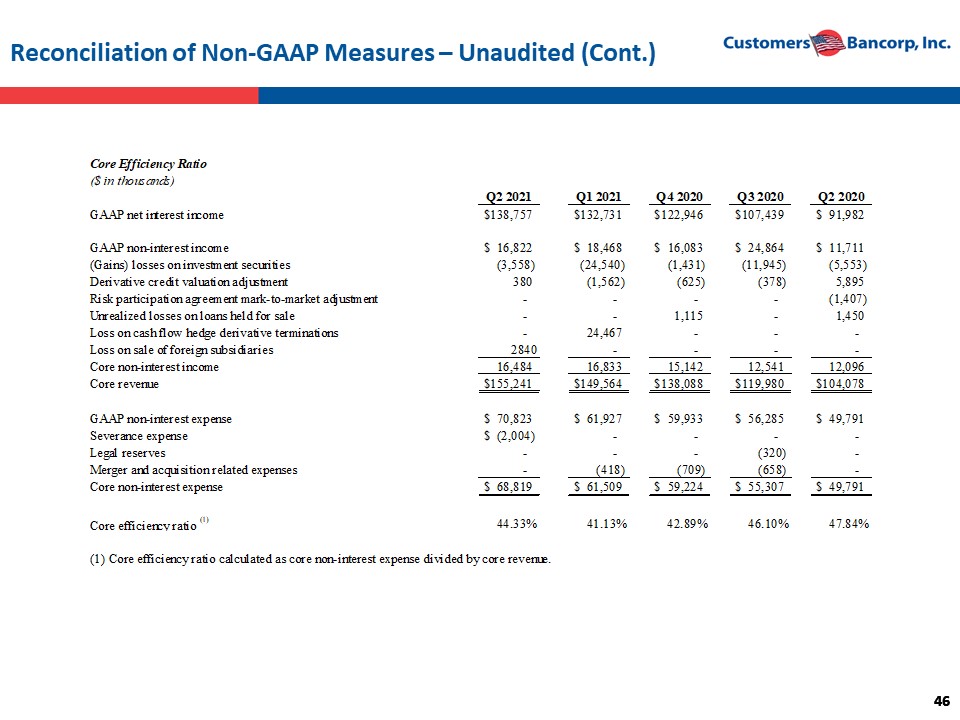
46 46 Reconciliation of Non - GAAP Measures – Unaudited (Cont.) Core Efficiency Ratio ($ in thousands) Q2 2021 Q1 2021 Q4 2020 Q3 2020 Q2 2020 GAAP net interest income $138,757 $132,731 $122,946 $107,439 $ 91,982 GAAP non-interest income $ 16,822 $ 18,468 $ 16,083 $ 24,864 $ 11,711 (Gains) losses on investment securities (3,558) (24,540) (1,431) (11,945) (5,553) Derivative credit valuation adjustment 380 (1,562) (625) (378) 5,895 Risk participation agreement mark-to-market adjustment - - - - (1,407) Unrealized losses on loans held for sale - - 1,115 - 1,450 Loss on cash flow hedge derivative terminations - 24,467 - - - Loss on sale of foreign subsidiaries 2840 - - - - Core non-interest income 16,484 16,833 15,142 12,541 12,096 Core revenue $155,241 $149,564 $138,088 $119,980 $104,078 GAAP non-interest expense $ 70,823 $ 61,927 $ 59,933 $ 56,285 $ 49,791 Severance expense $ (2,004) - - - - Legal reserves - - - (320) - Merger and acquisition related expenses - (418) (709) (658) - Core non-interest expense $ 68,819 $ 61,509 $ 59,224 $ 55,307 $ 49,791 Core efficiency ratio (1) 44.33% 41.13% 42.89% 46.10% 47.84% (1) Core efficiency ratio calculated as core non-interest expense divided by core revenue.
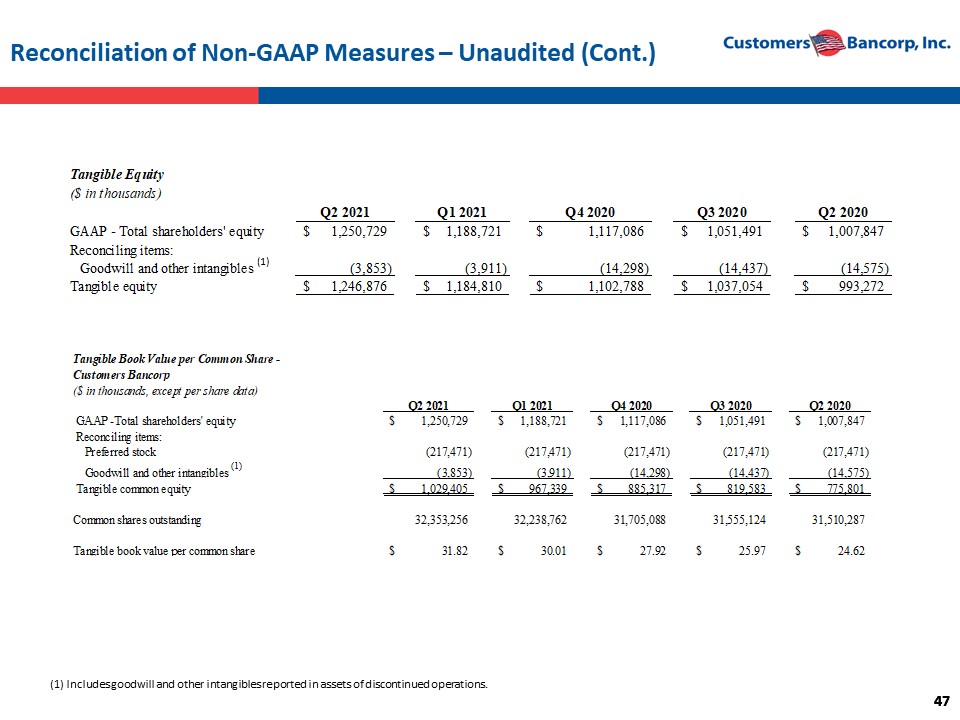
47 47 Reconciliation of Non - GAAP Measures – Unaudited (Cont.) Tangible Equity ($ in thousands) Q2 2021 Q1 2021 Q4 2020 Q3 2020 Q2 2020 GAAP - Total shareholders' equity 1,250,729$ 1,188,721$ 1,117,086$ 1,051,491$ 1,007,847$ Reconciling items: Goodwill and other intangibles (3,853) (3,911) (14,298) (14,437) (14,575) Tangible equity 1,246,876$ 1,184,810$ 1,102,788$ 1,037,054$ 993,272$ Tangible Book Value per Common Share - Customers Bancorp ($ in thousands, except per share data) Q2 2021 Q1 2021 Q4 2020 Q3 2020 Q2 2020 GAAP -Total shareholders' equity 1,250,729$ 1,188,721$ 1,117,086$ 1,051,491$ 1,007,847$ Reconciling items: Preferred stock (217,471) (217,471) (217,471) (217,471) (217,471) Goodwill and other intangibles (1) (3,853) (3,911) (14,298) (14,437) (14,575) Tangible common equity 1,029,405$ 967,339$ 885,317$ 819,583$ 775,801$ Common shares outstanding 32,353,256 32,238,762 31,705,088 31,555,124 31,510,287 Tangible book value per common share 31.82$ 30.01$ 27.92$ 25.97$ 24.62$ (1) Includes goodwill and other intangibles reported in assets of discontinued operations. (1)
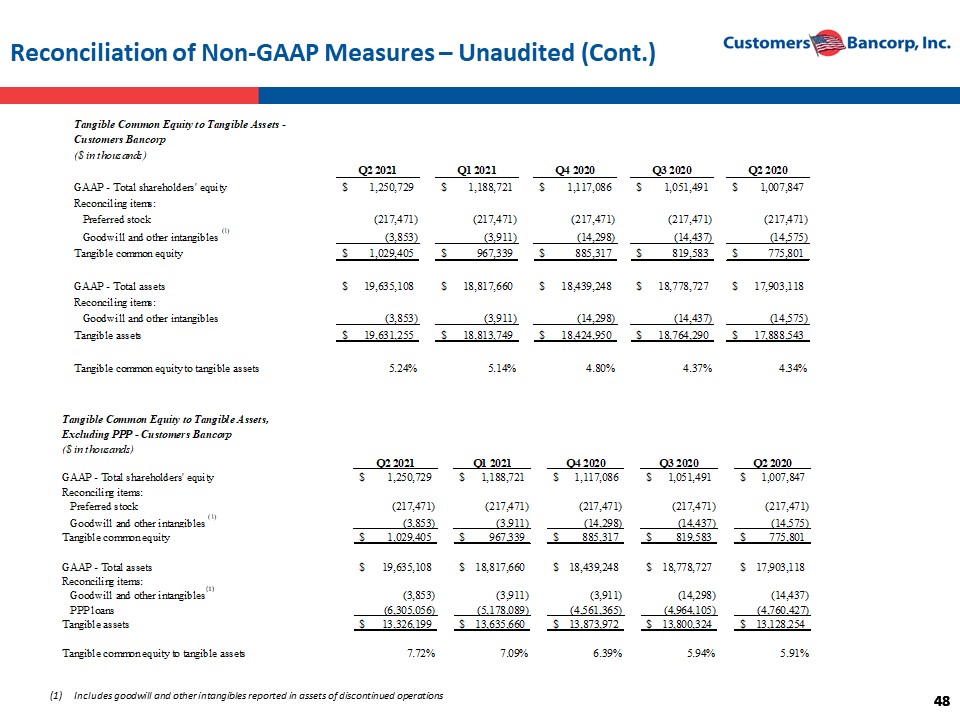
48 48 Reconciliation of Non - GAAP Measures – Unaudited (Cont.) Tangible Common Equity to Tangible Assets - Customers Bancorp ($ in thousands) Q2 2021 Q1 2021 Q4 2020 Q3 2020 Q2 2020 GAAP - Total shareholders' equity 1,250,729$ 1,188,721$ 1,117,086$ 1,051,491$ 1,007,847$ Reconciling items: Preferred stock (217,471) (217,471) (217,471) (217,471) (217,471) Goodwill and other intangibles (1) (3,853) (3,911) (14,298) (14,437) (14,575) Tangible common equity 1,029,405$ 967,339$ 885,317$ 819,583$ 775,801$ GAAP - Total assets 19,635,108$ 18,817,660$ 18,439,248$ 18,778,727$ 17,903,118$ Reconciling items: Goodwill and other intangibles (3,853) (3,911) (14,298) (14,437) (14,575) Tangible assets 19,631,255$ 18,813,749$ 18,424,950$ 18,764,290$ 17,888,543$ Tangible common equity to tangible assets 5.24% 5.14% 4.80% 4.37% 4.34% Tangible Common Equity to Tangible Assets, Excluding PPP - Customers Bancorp ($ in thousands) Q2 2021 Q1 2021 Q4 2020 Q3 2020 Q2 2020 GAAP - Total shareholders' equity 1,250,729$ 1,188,721$ 1,117,086$ 1,051,491$ 1,007,847$ Reconciling items: Preferred stock (217,471) (217,471) (217,471) (217,471) (217,471) Goodwill and other intangibles (1) (3,853) (3,911) (14,298) (14,437) (14,575) Tangible common equity 1,029,405$ 967,339$ 885,317$ 819,583$ 775,801$ GAAP - Total assets 19,635,108$ 18,817,660$ 18,439,248$ 18,778,727$ 17,903,118$ Reconciling items: Goodwill and other intangibles (3,853) (3,911) (3,911) (14,298) (14,437) PPP loans (6,305,056) (5,178,089) (4,561,365) (4,964,105) (4,760,427) Tangible assets 13,326,199$ 13,635,660$ 13,873,972$ 13,800,324$ 13,128,254$ Tangible common equity to tangible assets 7.72% 7.09% 6.39% 5.94% 5.91% (1) (1) Includes goodwill and other intangibles reported in assets of discontinued operations
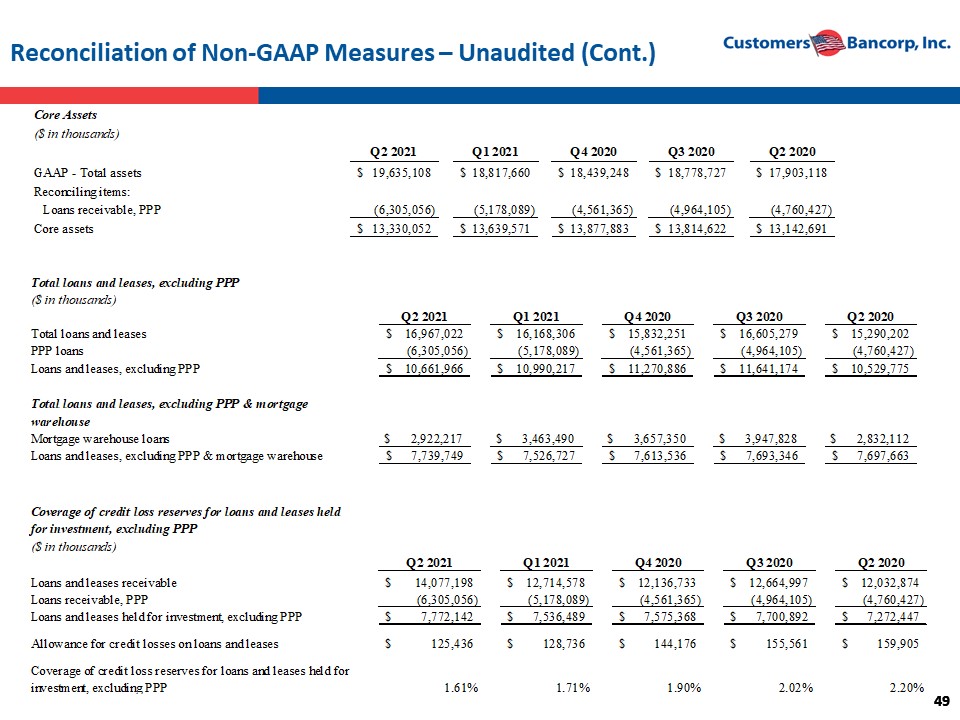
49 49 Reconciliation of Non - GAAP Measures – Unaudited (Cont.) Core Assets ($ in thousands) Q2 2021 Q1 2021 Q4 2020 Q3 2020 Q2 2020 GAAP - Total assets 19,635,108$ 18,817,660$ 18,439,248$ 18,778,727$ 17,903,118$ Reconciling items: Loans receivable, PPP (6,305,056) (5,178,089) (4,561,365) (4,964,105) (4,760,427) Core assets 13,330,052$ 13,639,571$ 13,877,883$ 13,814,622$ 13,142,691$ Total loans and leases, excluding PPP ($ in thousands) Q2 2021 Q1 2021 Q4 2020 Q3 2020 Q2 2020 Total loans and leases 16,967,022$ 16,168,306$ 15,832,251$ 16,605,279$ 15,290,202$ PPP loans (6,305,056) (5,178,089) (4,561,365) (4,964,105) (4,760,427) Loans and leases, excluding PPP 10,661,966$ 10,990,217$ 11,270,886$ 11,641,174$ 10,529,775$ Total loans and leases, excluding PPP & mortgage warehouse Mortgage warehouse loans $ 2,922,217 $ 3,463,490 $ 3,657,350 $ 3,947,828 $ 2,832,112 Loans and leases, excluding PPP & mortgage warehouse 7,739,749$ 7,526,727$ 7,613,536$ 7,693,346$ 7,697,663$ Coverage of credit loss reserves for loans and leases held for investment, excluding PPP ($ in thousands) Q2 2021 Q1 2021 Q4 2020 Q3 2020 Q2 2020 Loans and leases receivable 14,077,198$ 12,714,578$ 12,136,733$ 12,664,997$ 12,032,874$ Loans receivable, PPP (6,305,056) (5,178,089) (4,561,365) (4,964,105) (4,760,427) Loans and leases held for investment, excluding PPP 7,772,142$ 7,536,489$ 7,575,368$ 7,700,892$ 7,272,447$ Allowance for credit losses on loans and leases 125,436$ 128,736$ 144,176$ 155,561$ 159,905$ Coverage of credit loss reserves for loans and leases held for investment, excluding PPP 1.61% 1.71% 1.90% 2.02% 2.20%
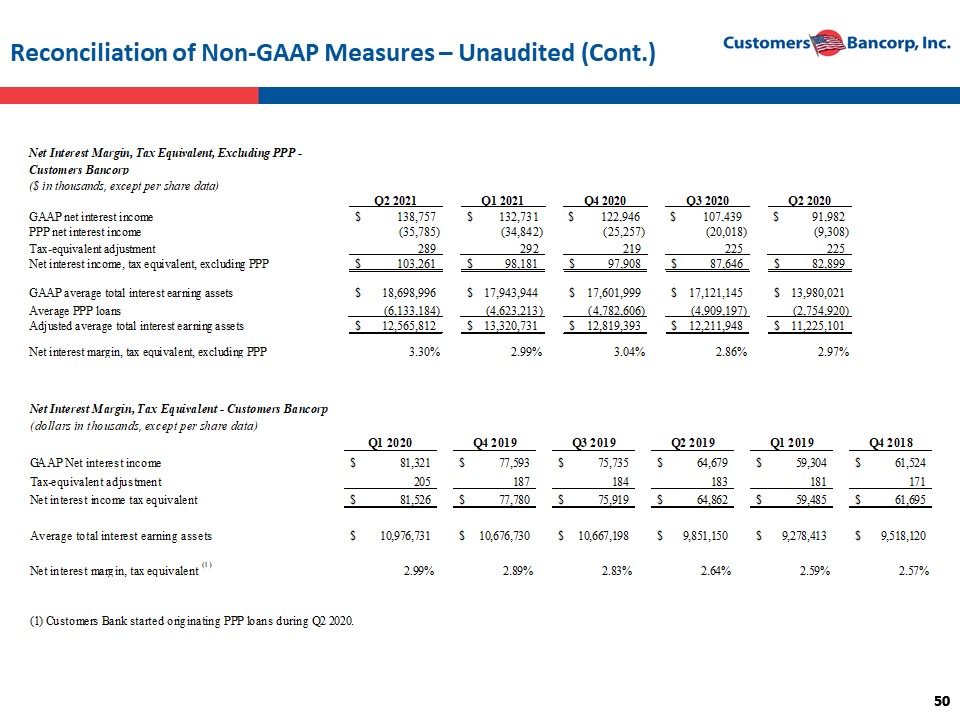
50 50 Reconciliation of Non - GAAP Measures – Unaudited (Cont.) Net Interest Margin, Tax Equivalent, Excluding PPP - Customers Bancorp ($ in thousands, except per share data) Q2 2021 Q1 2021 Q4 2020 Q3 2020 Q2 2020 GAAP net interest income 138,757$ 132,731$ $ 122,946 $ 107,439 $ 91,982 PPP net interest income (35,785) (34,842) (25,257) (20,018) (9,308) Tax-equivalent adjustment 289 292 219 225 225 Net interest income, tax equivalent, excluding PPP 103,261$ 98,181$ 97,908$ 87,646$ 82,899$ GAAP average total interest earning assets 18,698,996$ 17,943,944$ 17,601,999$ 17,121,145$ 13,980,021$ Average PPP loans (6,133,184) (4,623,213) (4,782,606) (4,909,197) (2,754,920) Adjusted average total interest earning assets 12,565,812$ 13,320,731$ 12,819,393$ 12,211,948$ 11,225,101$ Net interest margin, tax equivalent, excluding PPP 3.30% 2.99% 3.04% 2.86% 2.97% Net Interest Margin, Tax Equivalent - Customers Bancorp (dollars in thousands, except per share data) Q1 2020 Q4 2019 Q3 2019 Q2 2019 Q1 2019 Q4 2018 GAAP Net interest income 81,321$ 77,593$ 75,735$ 64,679$ 59,304$ 61,524$ Tax-equivalent adjustment 205 187 184 183 181 171 Net interest income tax equivalent 81,526$ 77,780$ 75,919$ 64,862$ 59,485$ 61,695$ Average total interest earning assets 10,976,731$ 10,676,730$ 10,667,198$ 9,851,150$ 9,278,413$ 9,518,120$ Net interest margin, tax equivalent (1) 2.99% 2.89% 2.83% 2.64% 2.59% 2.57% (1) Customers Bank started originating PPP loans during Q2 2020.
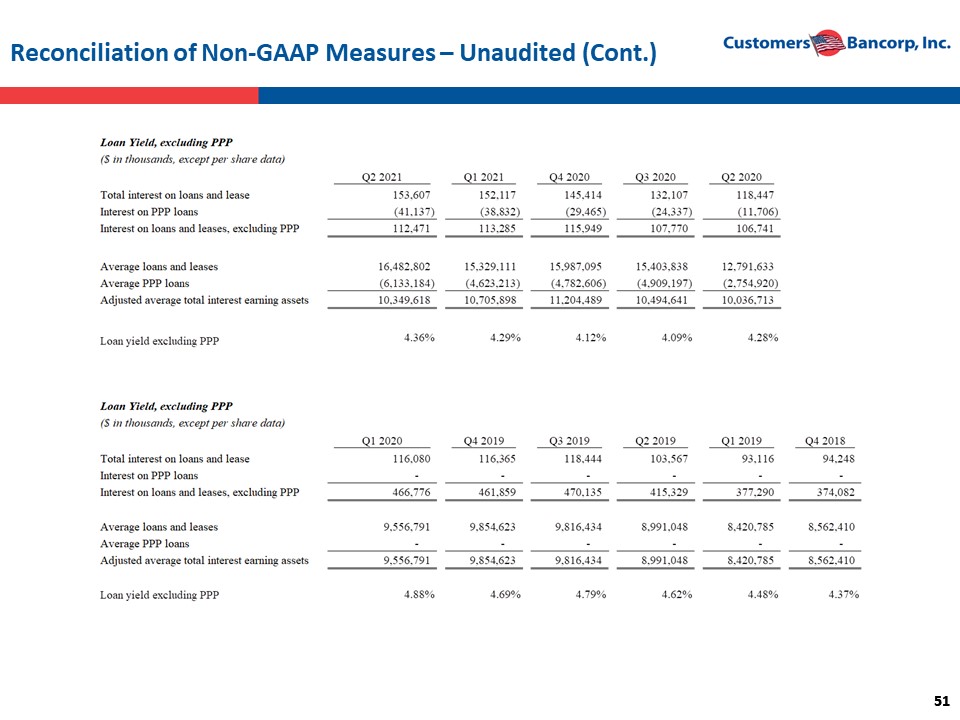
51 51 Reconciliation of Non - GAAP Measures – Unaudited (Cont.)
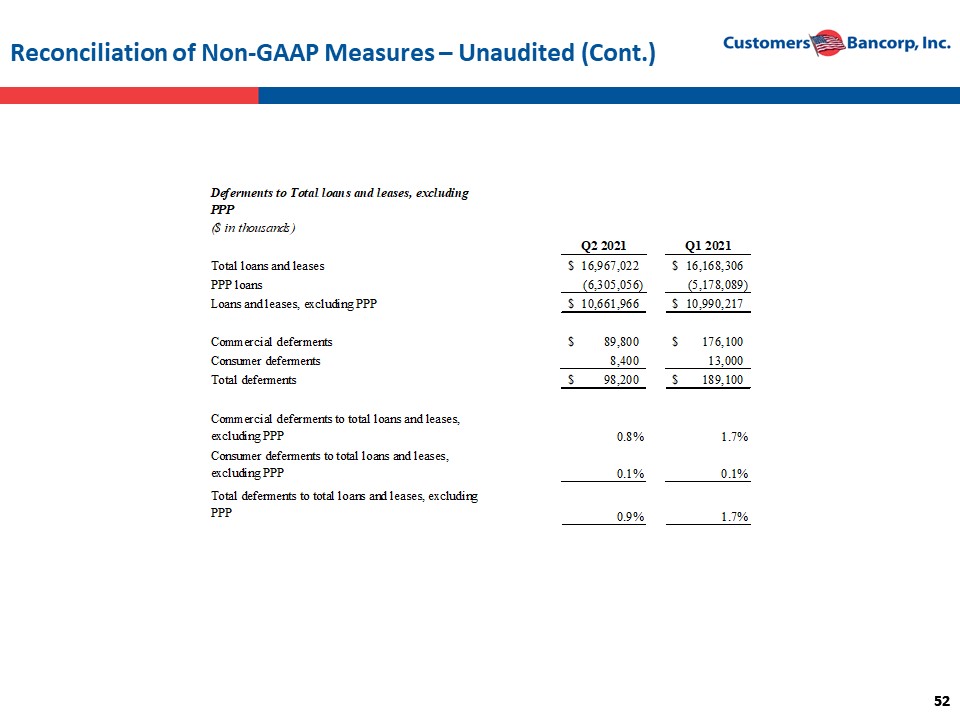
52 52 Reconciliation of Non - GAAP Measures – Unaudited (Cont.) Deferments to Total loans and leases, excluding PPP ($ in thousands) Q2 2021 Q1 2021 Total loans and leases 16,967,022$ 16,168,306$ PPP loans (6,305,056) (5,178,089) Loans and leases, excluding PPP 10,661,966$ 10,990,217$ Commercial deferments 89,800$ 176,100$ Consumer deferments 8,400 13,000 Total deferments 98,200$ 189,100$ Commercial deferments to total loans and leases, excluding PPP 0.8% 1.7% Consumer deferments to total loans and leases, excluding PPP 0.1% 0.1% Total deferments to total loans and leases, excluding PPP 0.9% 1.7%