Attached files
| file | filename |
|---|---|
| EX-99.1 - EXHIBIT 99.1 - SIMMONS FIRST NATIONAL CORP | exh_991.htm |
| 8-K - FORM 8-K - SIMMONS FIRST NATIONAL CORP | f8k_072621.htm |
Exhibit 99.2

Contents 4 Q2 Key Highlights 5 Q2 Results Overview 14 Loans 21 Deposits, Liquidity, Investments & Capital 27 Credit Quality 32 Performance Trends 38 Corporate Profile 46 Appendix 2 nd Quarter 2021 Investor Presentation | NASDAQ: SFNC
2 Forward - Looking Statements and Non - GAAP Financial Measures Forward - Looking Statements . Certain statements by Simmons First National Corporation (the “Company”, which where appropriate includes the Company’s wholly - owned banking subsidiary, Simmons Bank) contained in this presentation may not be based on historical facts and should be considered "forward - looking statements" within the meaning of the Private Securities Litigation Reform Act of 1995 . These forward - looking statements may be identified by reference to a future period(s) or by the use of forward - looking terminology, such as "anticipate," "estimate," "expect," "foresee,“ “project,” "may," "might," "will," "would," "could,“ “likely” or "intend," future or conditional verb tenses, and variations or negatives of such terms . These forward - looking statements include, without limitation, those relating to the Company’s future growth ; revenue ; expenses (including interest expense and non - interest expenses) ; assets ; asset quality ; profitability ; earnings ; critical accounting policies ; accretion ; net interest margin ; non - interest revenue ; market conditions related to and impact of the Company's common stock repurchase program ; adequacy of the allowance for loan losses ; income tax deductions ; credit quality ; level of credit losses from lending commitments ; net interest revenue ; interest rate sensitivity ; loan loss experience ; liquidity ; capital resources ; market risk ; the expected benefits, milestones, or costs associated with the Company’s merger and acquisition strategy and activity ; the Company’s ability to recruit and retain key employees ; the ability of the Company to manage the impact of the COVID - 19 pandemic ; the impacts of the Company’s and its customers participation in the Paycheck Protection Program (“PPP”) ; increases in the Company’s security portfolio ; legal and regulatory limitations and compliance and competition ; anticipated loan principal reductions ; fees associated with the PPP ; plans for investments in securities ; statements under the caption “Management’s Outlook” on slides 8 , 9 and 30 ; the charges, gains, and savings associated with completed and future branch closures and branch sales ; expectations and projections regarding the Company’s COVID - 19 loan modification program ; and projected dividends . Readers are cautioned not to place undue reliance on the forward - looking statements contained in this presentation in that actual results could differ materially from those indicated in or implied by such forward - looking statements, due to a variety of factors . These factors include, but are not limited to, changes in the Company's operating or expansion strategy ; the availability of and costs associated with obtaining adequate and timely sources of liquidity ; the ability to maintain credit quality ; the effect of steps the Company takes in response to the COVID - 19 pandemic ; the severity and duration of the pandemic, including the effectiveness of vaccination efforts and developments with respect to COVID - 19 variants ; the pace of recovery when the pandemic subsides and the heightened impact it has on many of the risks described herein ; the effects of the pandemic on, among other things, the Company’s operations, liquidity, and credit quality ; general market and economic conditions ; unemployment ; possible adverse rulings, judgments, settlements and other outcomes of pending or future litigation (including litigation arising from the Company’s participation in and administration of programs related to the COVID - 19 pandemic (including the PPP)) ; the ability of the Company to collect amounts due under loan agreements ; changes in consumer preferences and loan demand ; effectiveness of the Company's interest rate risk management strategies ; laws and regulations affecting financial institutions in general or relating to taxes ; the effect of pending or future legislation ; the ability of the Company to repurchase its common stock on favorable terms ; the ability of the Company to successfully implement its acquisition and branch strategy ; the ability to satisfy closing conditions and receive regulatory approvals associated with the Company’s pending mergers and acquisitions ; delays in closing the Company’s pending mergers and acquisitions ; changes in interest rates, deposit flows, real estate values, and capital markets ; inflation ; customer acceptance of the Company's products and services ; changes or disruptions in technology and IT systems (including cyber threats, attacks and events) ; changes in accounting principles relating to loan loss recognition (current expected credit losses, or CECL) ; the benefits associated with the Company’s early retirement program and completed and future branch closures and sales ; and other risk factors . Other relevant risk factors may be detailed from time to time in the Company's press releases and filings with the U . S . Securities and Exchange Commission, including, without limitation, the Company’s Form 10 - K for the year ended December 31 , 2020 . Any forward - looking statement speaks only as of the date of this presentation , and the Company undertakes no obligation to update these forward - looking statements to reflect events or circumstances that occur after the date of this presentation . Annualized, pro forma, projected and estimated numbers are used for illustrative purpose only, are not forecasts and may not reflect actual results . Non - GAAP Financial Measures . This presentation contains financial information determined by methods other than in accordance with U . S . generally accepted accounting principles (GAAP) . The Company's management uses these non - GAAP financial measures in their analysis of the Company's performance . These measures adjust GAAP performance measures to, among other things, include the tax benefit associated with revenue items that are tax - exempt, as well as exclude from income available to common shareholders, non - interest income, and non - interest expense certain income and expenses related to significant non - core activities, such as merger - related expenses, expenses related to the Company’s early retirement program, gain on sale of branches, and net branch right - sizing expenses . In addition, the Company also presents certain figures based on tangible common stockholders’ equity, tangible assets, and tangible book value, which exclude goodwill and other intangible assets . The Company further presents certain figures that are exclusive of the impact of PPP loans . The Company’s management believes that these non - GAAP financial measure are useful to investors because they, among other things, present the results of the Company’s ongoing operations without the effect of mergers or other items not central to the Company’s ongoing business, as well as normalize for tax effects . Management, therefore, believes presentations of these non - GAAP financial measures provide useful supplemental information that is essential to a proper understanding of the operating results of the Company's core businesses, and management uses these non - GAAP measures to assess the performance of the Company’s core businesses as related to prior financial periods . These non - GAAP disclosures should not be viewed as a substitute for operating results determined in accordance with GAAP, nor are they necessarily comparable to non - GAAP performance measures that may be presented by other companies . Where non - GAAP financial measures are used, the comparable GAAP financial measure, as well as the reconciliation to the comparable GAAP financial measure, can be found in the appendix to this presentation .
3 Important Additional Information and Where to Find It This communication does not constitute an offer to sell or the solicitation of an offer to buy any securities or a solicitation of any vote or approval with respect to the proposed transactions (“Proposed Transactions”) with Landmark Community Bank (“Landmark”) and Triumph Bancshares, Inc . (“Triumph”) . No offer of securities shall be made except by means of a prospectus meeting the requirements of the Securities Act of 1933 , as amended, and no offer to sell or solicitation of an offer to buy shall be made in any jurisdiction in which such offer, solicitation or sale would be unlawful . In connection with the Proposed Transactions, the Company has filed with the SEC a registration statement on Form S - 4 (the “Registration Statement”) that includes proxy statements of each of Landmark and Triumph and a prospectus of the Company (the “Joint Proxy Statement/Prospectus”), and the Company may file with the SEC other relevant documents concerning the Proposed Transactions . The definitive Joint Proxy Statement/Prospectus will be mailed to shareholders of Landmark and Triumph . SHAREHOLDERS ARE URGED TO READ THE REGISTRATION STATEMENT AND THE JOINT PROXY STATEMENT/PROSPECTUS REGARDING THE PROPOSED TRANSACTIONS CAREFULLY AND IN ITS ENTIRETY AND ANY OTHER RELEVANT DOCUMENTS FILED WITH THE SEC BY THE COMPANY, AS WELL AS ANY AMENDMENTS OR SUPPLEMENTS TO THOSE DOCUMENTS, BECAUSE THEY CONTAIN IMPORTANT INFORMATION ABOUT THE PROPOSED TRANSACTIONS . Free copies of the Joint Proxy Statement/Prospectus, as well as other filings containing information about the Company, may be obtained at the SEC’s Internet site (http : //www . sec . gov), when they are filed by the Company . You will also be able to obtain these documents, when they are filed, free of charge, from the Company at simmonsbank . com under the heading “Investor Relations . ” Copies of the Joint Proxy Statement/Prospectus can also be obtained, free of charge, by directing a request to Simmons First National Corporation, 501 Main Street, Pine Bluff, Arkansas 71601 , Attention : Ed Bilek, Director of Investor Relations, Email : ed . bilek@simmonsbank . com or ir@simmonsbank . com, Telephone : ( 870 ) 541 - 1000 , to Triumph Bancshares, Inc . , 5699 Poplar Avenue, Memphis, TN 38119 , Attention : Will Chase, President, Telephone : ( 901 ) 333 - 8800 , or to Landmark Community Bank, 1015 West Poplar Avenue, Collierville, TN 38017 , Attention : Jake Farrell, Chairman, Telephone : ( 901 ) 850 - 0555 . Participants in the Solicitation The Company, Landmark, Triumph and certain of their directors, executive officers and employees may be deemed to be participants in the solicitation of proxies from the shareholders of Landmark or Triumph in connection with the Proposed Transactions . Information about the Company’s directors and executive officers is available in its proxy statement for its 2021 annual meeting of shareholders, which was filed with the SEC on April 15 , 2021 . Information regarding all of the persons who may, under the rules of the SEC, be deemed participants in the proxy solicitation and a description of their direct and indirect interests, by security holdings or otherwise, are contained in the Joint Proxy Statement/Prospectus regarding the Proposed Transactions and other relevant materials to be filed with the SEC when they become available . Free copies of these documents may be obtained as described in the preceding paragraph .
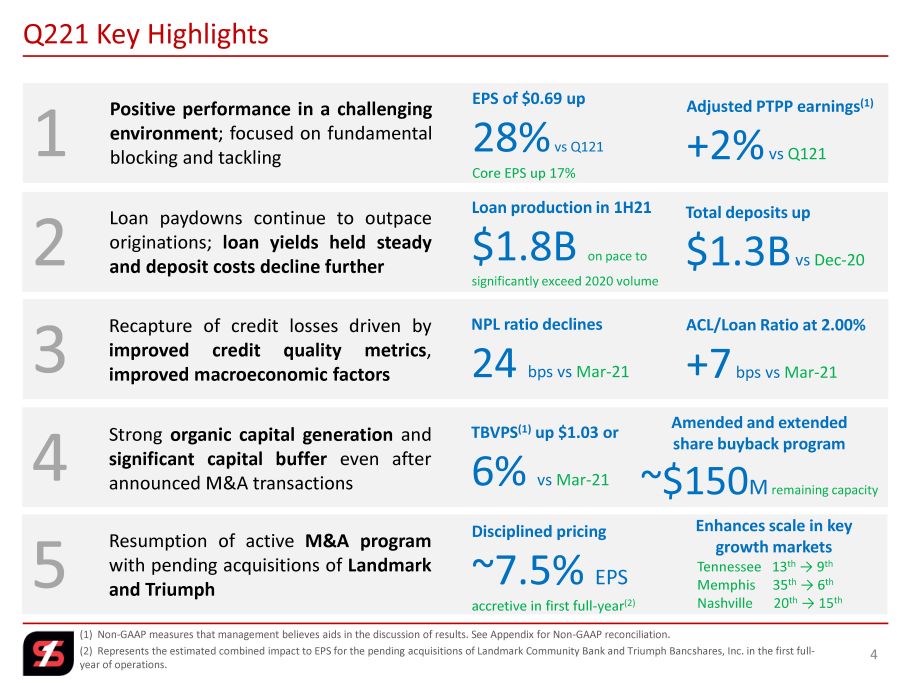
(1) Non - GAAP measures that management believes aids in the discussion of results. See Appendix for Non - GAAP reconciliation. (2) Represents the estimated combined impact to EPS for the pending acquisitions of Landmark Community Bank and Triumph Banc sha res, Inc. in the first full - year of operations. Q221 Key Highlights 4 1 2 3 4 5 Strong organic capital generation and significant capital buffer even after announced M&A transactions TBVPS ( 1 ) up $ 1 . 03 or 6 % vs Mar - 21 Amended and extended share buyback program ~$150 M remaining capacity Resumption of active M&A program with pending acquisitions of Landmark and Triumph Disciplined pricing ~7.5% EPS accretive in first full - year (2) Enhances scale in key growth markets Tennessee 13 th → 9 th Memphis 35 th → 6 th Nashville 20 th → 15 th Recapture of credit losses driven by improved credit quality metrics , improved macroeconomic factors NPL ratio declines 24 bps vs Mar - 21 ACL/Loan Ratio at 2 . 00 % + 7 bps vs Mar - 21 Loan paydowns continue to outpace originations ; loan yields held steady and deposit costs decline further Positive performance in a challenging environment ; focused on fundamental blocking and tackling EPS of $ 0 . 69 up 28% vs Q121 Core EPS up 17% Adjusted PTPP earnings ( 1 ) + 2 % vs Q 121 Loan production in 1 H 21 $1.8B on pace to significantly exceed 2020 volume Total deposits up $ 1 . 3 B vs Dec - 20

Q221 Results Overview 5
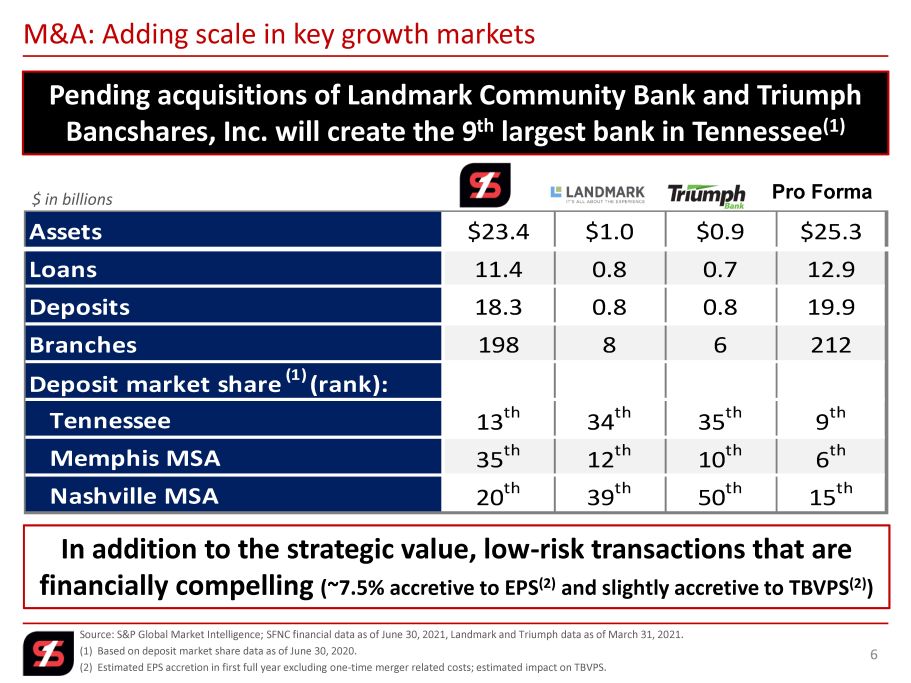
Source: S&P Global Market Intelligence; SFNC financial data as of June 30, 2021, Landmark and Triumph data as of March 31, 20 21. (1) Based on deposit market share data as of June 30, 2020. (2) Estimated EPS accretion in first full year excluding one - time merger related costs; estimated impact on TBVPS. 6 M&A: Adding scale in key growth markets Pending acquisitions of Landmark Community Bank and Triumph Bancshares, Inc. will create the 9 th largest bank in Tennessee (1) Pro Forma $ in billions In addition to the strategic value, low - risk transactions that are financially compelling (~7.5% accretive to EPS (2) and slightly accretive to TBVPS (2) ) Assets $23.4 $1.0 $0.9 $25.3 Loans 11.4 0.8 0.7 12.9 Deposits 18.3 0.8 0.8 19.9 Branches 198 8 6 212 Deposit market share (1) (rank): Tennessee 13 th 34 th 35 th 9 th Memphis MSA 35 th 12 th 10 th 6 th Nashville MSA 20 th 39 th 50 th 15 th
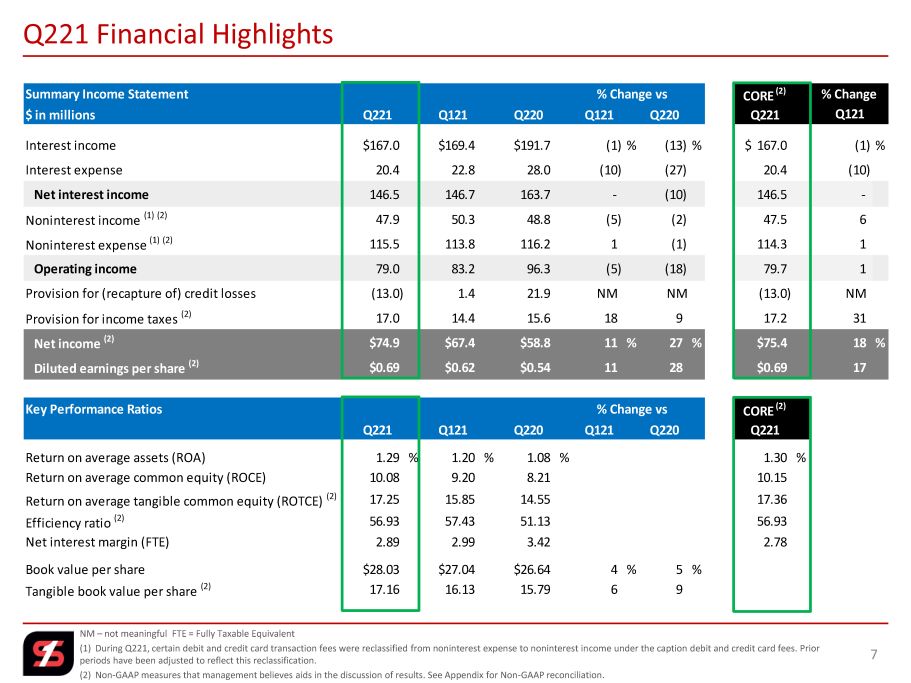
Summary Income Statement CORE (2) $ in millions Q221 Q121 Q220 Q121 Q220 Q221 Interest income $167.0 $169.4 $191.7 (1) % (13) % $ 167.0 (1) % Interest expense 20.4 22.8 28.0 (10) (27) 20.4 (10) Net interest income 146.5 146.7 163.7 - (10) 146.5 - Noninterest income (1) (2) 47.9 50.3 48.8 (5) (2) 47.5 6 Noninterest expense (1) (2) 115.5 113.8 116.2 1 (1) 114.3 1 Operating income 79.0 83.2 96.3 (5) (18) 79.7 1 Provision for (recapture of) credit losses (13.0) 1.4 21.9 NM NM (13.0) NM Provision for income taxes (2) 17.0 14.4 15.6 18 9 17.2 31 Net income (2) $74.9 $67.4 $58.8 11 % 27 % $75.4 18 % Diluted earnings per share (2) $0.69 $0.62 $0.54 11 28 $0.69 17 Key Performance Ratios CORE (2) Q221 Q121 Q220 Q121 Q220 Q221 Return on average assets (ROA) 1.29 % 1.20 % 1.08 % 1.30 % Return on average common equity (ROCE) 10.08 9.20 8.21 10.15 Return on average tangible common equity (ROTCE) (2) 17.25 15.85 14.55 17.36 Efficiency ratio (2) 56.93 57.43 51.13 56.93 Net interest margin (FTE) 2.89 2.99 3.42 2.78 Book value per share $28.03 $27.04 $26.64 4 % 5 % Tangible book value per share (2) 17.16 16.13 15.79 6 9 % Change vs % Change vs % Change Q121 NM – not meaningful FTE = Fully Taxable Equivalent (1) During Q221, certain debit and credit card transaction fees were reclassified from noninterest expense to noninterest in com e under the caption debit and credit card fees. Prior periods have been adjusted to reflect this reclassification. (2) Non - GAAP measures that management believes aids in the discussion of results. See Appendix for Non - GAAP reconciliation. 7 Q221 Financial Highlights
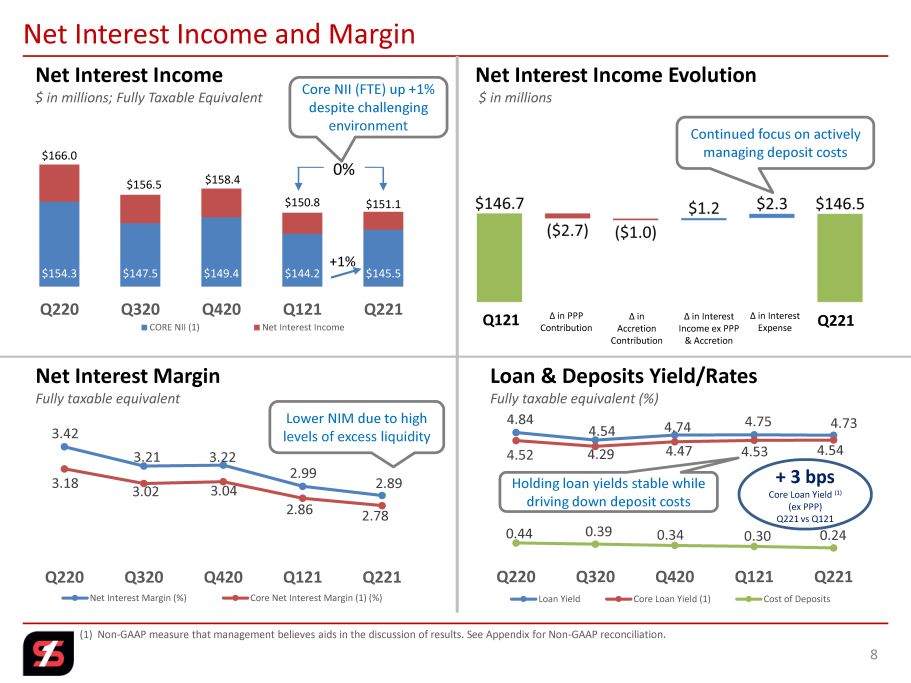
$154.3 $147.5 $149.4 $144.2 $145.5 $166.0 $156.5 $158.4 $150.8 $151.1 Q220 Q320 Q420 Q121 Q221 CORE NII (1) Net Interest Income (1) Non - GAAP measure that management believes aids in the discussion of results. See Appendix for Non - GAAP reconciliation. Net Interest Income and Margin 8 Net Interest Income $ in millions; Fully Taxable Equivalent Net Interest Income Evolution $ in millions 0% Q121 Δ in PPP Contribution Δ in Accretion Contribution Δ in Interest Income ex PPP & Accretion Δ in Interest Expense Q221 Continued focus on actively managing deposit costs +1% Net Interest Margin Fully taxable equivalent Loan & Deposits Yield/Rates Fully taxable equivalent (%) 3.42 3.21 3.22 2.99 2.89 3.18 3.02 3.04 2.86 2.78 Q220 Q320 Q420 Q121 Q221 Net Interest Margin (%) Core Net Interest Margin (1) (%) 4.84 4.54 4.74 4.75 4.73 4.52 4.29 4.47 4.53 4.54 0.44 0.39 0.34 0.30 0.24 Q220 Q320 Q420 Q121 Q221 Loan Yield Core Loan Yield (1) Cost of Deposits Core NII (FTE) up +1% despite challenging environment Holding loan yields stable while driving down deposit costs Lower NIM due to high levels of excess liquidity + 3 bps Core Loan Yield (1) (ex PPP) Q221 vs Q121
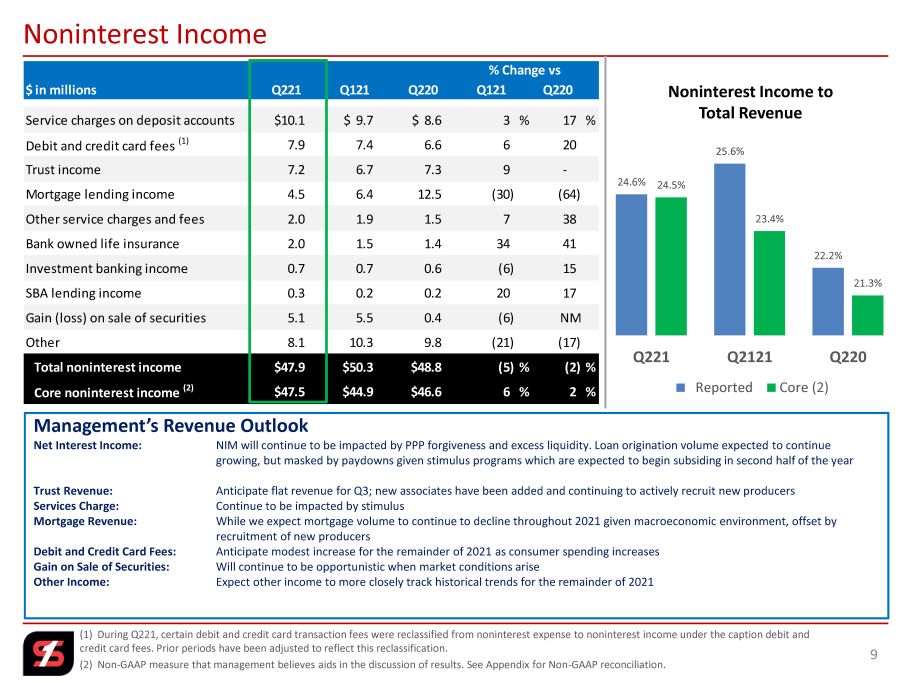
(1) During Q221, certain debit and credit card transaction fees were reclassified from noninterest expense to noninterest in com e under the caption debit and credit card fees. Prior periods have been adjusted to reflect this reclassification. (2) Non - GAAP measure that management believes aids in the discussion of results. See Appendix for Non - GAAP reconciliation. 9 Noninterest Income 24.6% 25.6% 22.2% 24.5% 23.4% 21.3% Q221 Q2121 Q220 Reported Core (2) Noninterest Income to Total Revenue Management’s Revenue Outlook Net Interest Income: NIM will continue to be impacted by PPP forgiveness and excess liquidity. Loan origination volume expected to continue growing, but masked by paydowns given stimulus programs which are expected to begin subsiding in second half of the year Trust Revenue: Anticipate flat revenue for Q3; new associates have been added and continuing to actively recruit new producers Services Charge: Continue to be impacted by stimulus Mortgage Revenue: While we expect mortgage volume to continue to decline throughout 2021 given macroeconomic environment, offset by recruitment of new producers Debit and Credit Card Fees: Anticipate modest increase for the remainder of 2021 as consumer spending increases Gain on Sale of Securities: Will continue to be opportunistic when market conditions arise Other Income: Expect other income to more closely track historical trends for the remainder of 2021 $ in millions Q221 Q121 Q220 Q121 Q220 Service charges on deposit accounts $10.1 $ 9.7 $ 8.6 3 % 17 % Debit and credit card fees (1) 7.9 7.4 6.6 6 20 Trust income 7.2 6.7 7.3 9 - Mortgage lending income 4.5 6.4 12.5 (30) (64) Other service charges and fees 2.0 1.9 1.5 7 38 Bank owned life insurance 2.0 1.5 1.4 34 41 Investment banking income 0.7 0.7 0.6 (6) 15 SBA lending income 0.3 0.2 0.2 20 17 Gain (loss) on sale of securities 5.1 5.5 0.4 (6) NM Other 8.1 10.3 9.8 (21) (17) Total noninterest income $47.9 $50.3 $48.8 (5) % (2)% Core noninterest income (2) $47.5 $44.9 $46.6 6 % 2 % % Change vs
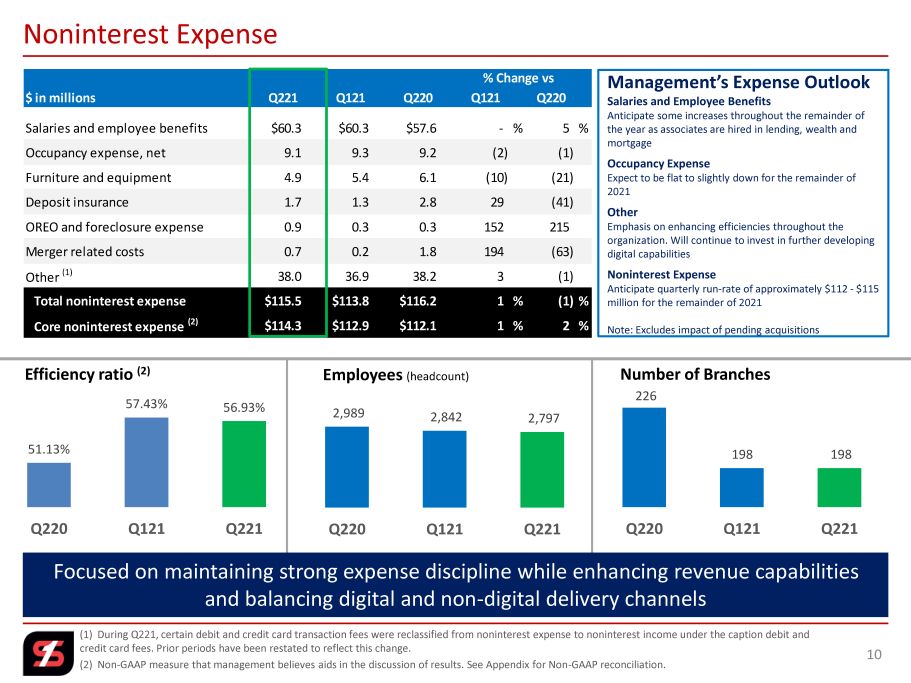
(1) During Q221, certain debit and credit card transaction fees were reclassified from noninterest expense to noninterest in com e under the caption debit and credit card fees. Prior periods have been restated to reflect this change. (2) Non - GAAP measure that management believes aids in the discussion of results. See Appendix for Non - GAAP reconciliation. 10 Noninterest Expense 51.13% 57.43% 56.93% Q220 Q121 Q221 Efficiency ratio (2) 2,989 2,842 2,797 Q220 Q121 Q221 Employees (headcount) 226 198 198 Q220 Q121 Q221 Number of Branches Focused on maintaining strong expense discipline while enhancing revenue capabilities and balancing digital and non - digital delivery channels Management’s Expense Outlook Salaries and Employee Benefits Anticipate some increases throughout the remainder of the year as associates are hired in lending, wealth and mortgage Occupancy Expense Expect to be flat to slightly down for the remainder of 2021 Other Emphasis on enhancing efficiencies throughout the organization. Will continue to invest in further developing digital capabilities Noninterest Expense Anticipate quarterly run - rate of approximately $112 - $115 million for the remainder of 2021 Note: Excludes impact of pending acquisitions $ in millions Q221 Q121 Q220 Q121 Q220 Salaries and employee benefits $60.3 $60.3 $57.6 - % 5 % Occupancy expense, net 9.1 9.3 9.2 (2) (1) Furniture and equipment 4.9 5.4 6.1 (10) (21) Deposit insurance 1.7 1.3 2.8 29 (41) OREO and foreclosure expense 0.9 0.3 0.3 152 215 Merger related costs 0.7 0.2 1.8 194 (63) Other (1) 38.0 36.9 38.2 3 (1) Total noninterest expense $115.5 $113.8 $116.2 1 % (1)% Core noninterest expense (2) $114.3 $112.9 $112.1 1 % 2 % % Change vs
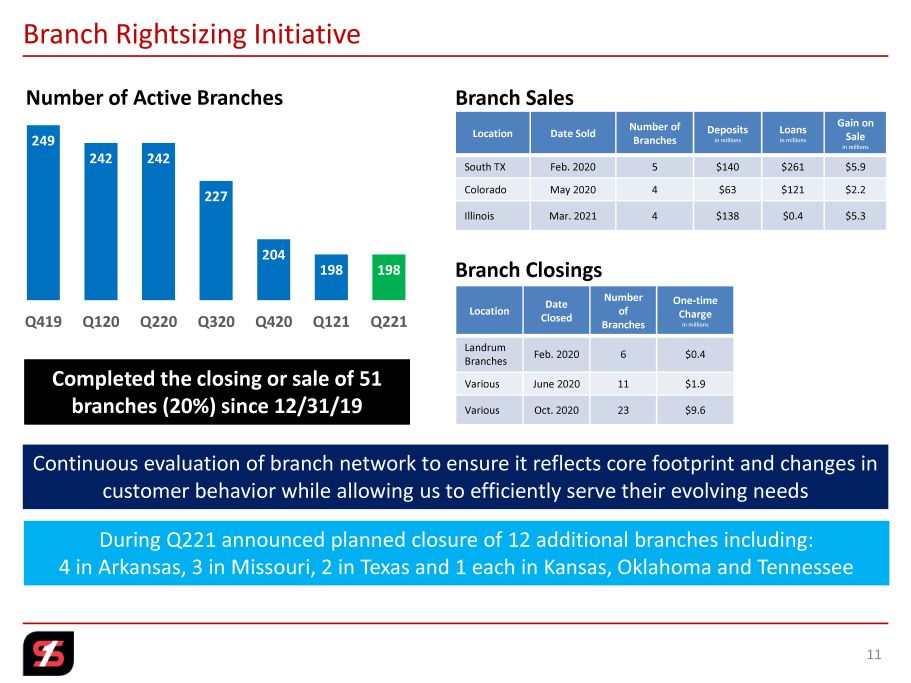
Branch Rightsizing Initiative 11 Location Date Sold Number of Branches Deposits in millions Loans in millions Gain on Sale in millions South TX Feb. 2020 5 $140 $261 $5.9 Colorado May 2020 4 $63 $121 $2.2 Illinois Mar. 2021 4 $138 $0.4 $5.3 Location Date Closed Number of Branches One - time Charge in millions Landrum Branches Feb. 2020 6 $0.4 Various June 2020 11 $1.9 Various Oct. 2020 23 $9.6 Completed the closing or sale of 51 branches (20%) since 12/31/19 249 242 242 227 204 198 198 Q419 Q120 Q220 Q320 Q420 Q121 Q221 Number of Active Branches Branch Closings Branch Sales Continuous evaluation of branch network to ensure it reflects core footprint and changes in customer behavior while allowing us to efficiently serve their evolving needs During Q221 announced planned closure of 12 additional branches including: 4 in Arkansas, 3 in Missouri, 2 in Texas and 1 each in Kansas, Oklahoma and Tennessee
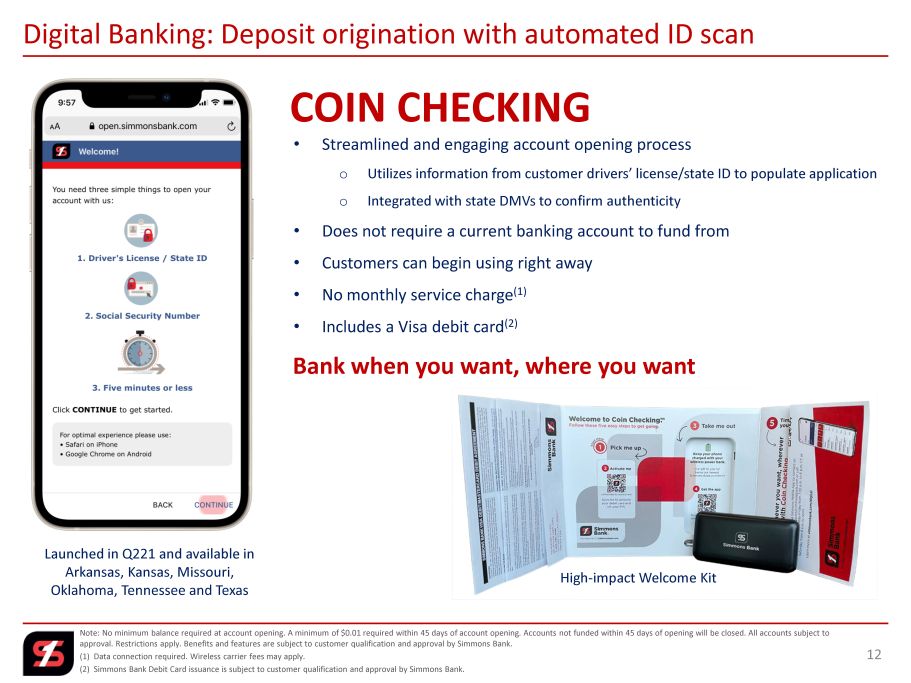
Digital Banking: Deposit origination with automated ID scan Note: No minimum balance required at account opening. A minimum of $0.01 required within 45 days of account opening. Accounts no t funded within 45 days of opening will be closed. All accounts subject to approval. Restrictions apply. Benefits and features are subject to customer qualification and approval by Simmons Bank. (1) Data connection required. Wireless carrier fees may apply. (2) Simmons Bank Debit Card issuance is subject to customer qualification and approval by Simmons Bank. 12 • Streamlined and engaging account opening process o Utilizes information from customer drivers’ license/state ID to populate application o Integrated with state DMVs to confirm authenticity • Does not require a current banking account to fund from • Customers can begin using right away • No monthly service charge (1) • Includes a Visa debit card (2) COIN CHECKING Bank when you want, where you want High - impact Welcome Kit Launched in Q221 and available in Arkansas, Kansas, Missouri, Oklahoma, Tennessee and Texas
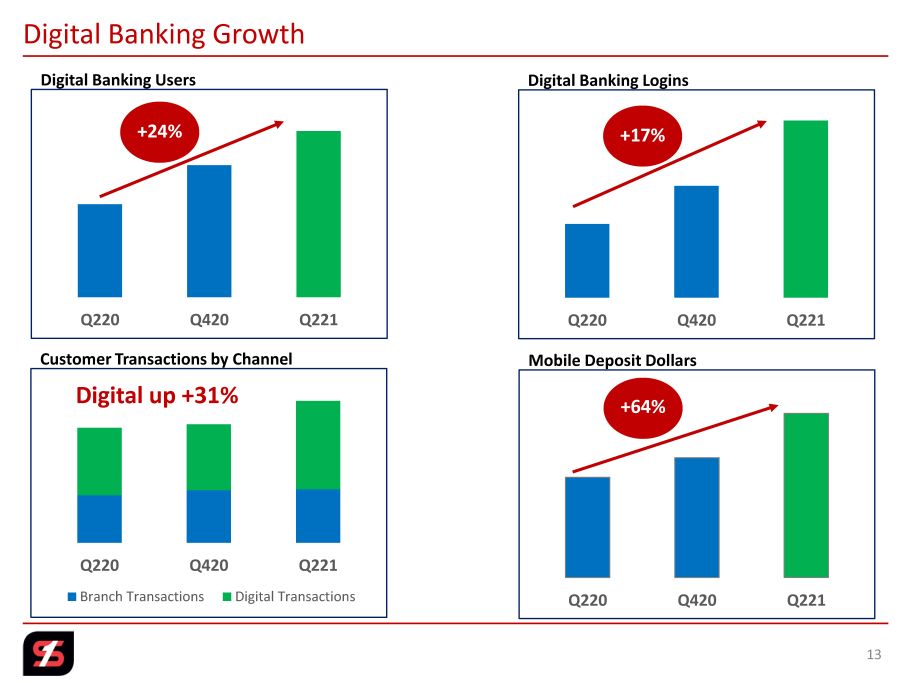
Digital Banking Growth 13 Digital Banking Users Q220 Q420 Q221 +24% Digital Banking Logins Q220 Q420 Q221 Customer Transactions by Channel Q220 Q420 Q221 Branch Transactions Digital Transactions Mobile Deposit Dollars Q220 Q420 Q221 +17% Digital up +31% +64%

LOANS 14
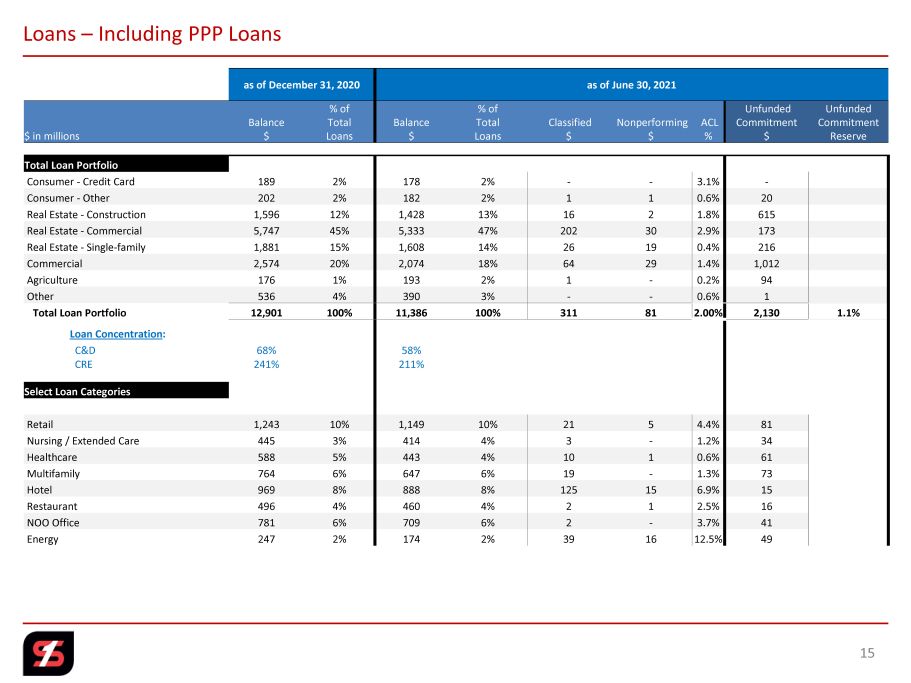
Loans – Including PPP Loans as of December 31, 2020 as of June 30, 2021 $ in millions Balance $ % of Total Loans Balance $ % of Total Loans Classified $ Nonperforming $ ACL % Unfunded Commitment $ Unfunded Commitment Reserve Total Loan Portfolio Consumer - Credit Card 189 2% 178 2% - - 3.1% - Consumer - Other 202 2% 182 2% 1 1 0.6% 20 Real Estate - Construction 1,596 12% 1,428 13% 16 2 1.8% 615 Real Estate - Commercial 5,747 45% 5,333 47% 202 30 2.9% 173 Real Estate - Single - family 1,881 15% 1,608 14% 26 19 0.4% 216 Commercial 2,574 20% 2,074 18% 64 29 1.4% 1,012 Agriculture 176 1% 193 2% 1 - 0.2% 94 Other 536 4% 390 3% - - 0.6% 1 Total Loan Portfolio 12,901 100% 11,386 100% 311 81 2.00% 2,130 1.1% Loan Concentration : C&D 68% 58% CRE 241% 211% Select Loan Categories Retail 1,243 10% 1,149 10% 21 5 4.4% 81 Nursing / Extended Care 445 3% 414 4% 3 - 1.2% 34 Healthcare 588 5% 443 4% 10 1 0.6% 61 Multifamily 764 6% 647 6% 19 - 1.3% 73 Hotel 969 8% 888 8% 125 15 6.9% 15 Restaurant 496 4% 460 4% 2 1 2.5% 16 NOO Office 781 6% 709 6% 2 - 3.7% 41 Energy 247 2% 174 2% 39 16 12.5% 49 15
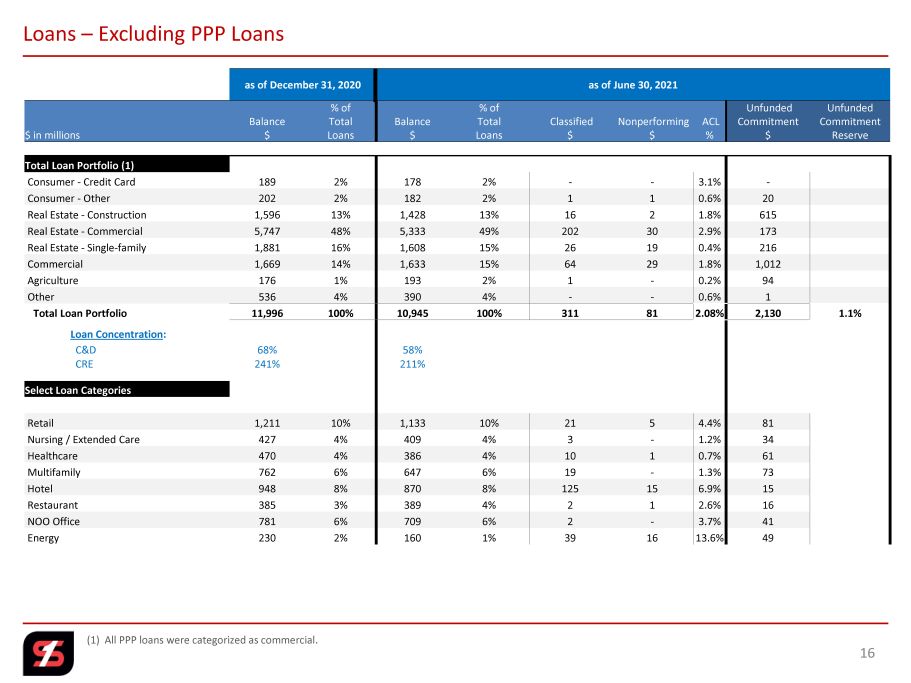
Loans – Excluding PPP Loans as of December 31, 2020 as of June 30, 2021 $ in millions Balance $ % of Total Loans Balance $ % of Total Loans Classified $ Nonperforming $ ACL % Unfunded Commitment $ Unfunded Commitment Reserve Total Loan Portfolio (1) Consumer - Credit Card 189 2% 178 2% - - 3.1% - Consumer - Other 202 2% 182 2% 1 1 0.6% 20 Real Estate - Construction 1,596 13% 1,428 13% 16 2 1.8% 615 Real Estate - Commercial 5,747 48% 5,333 49% 202 30 2.9% 173 Real Estate - Single - family 1,881 16% 1,608 15% 26 19 0.4% 216 Commercial 1,669 14% 1,633 15% 64 29 1.8% 1,012 Agriculture 176 1% 193 2% 1 - 0.2% 94 Other 536 4% 390 4% - - 0.6% 1 Total Loan Portfolio 11,996 100% 10,945 100% 311 81 2.08% 2,130 1.1% Loan Concentration : C&D 68% 58% CRE 241% 211% Select Loan Categories Retail 1,211 10% 1,133 10% 21 5 4.4% 81 Nursing / Extended Care 427 4% 409 4% 3 - 1.2% 34 Healthcare 470 4% 386 4% 10 1 0.7% 61 Multifamily 762 6% 647 6% 19 - 1.3% 73 Hotel 948 8% 870 8% 125 15 6.9% 15 Restaurant 385 3% 389 4% 2 1 2.6% 16 NOO Office 781 6% 709 6% 2 - 3.7% 41 Energy 230 2% 160 1% 39 16 13.6% 49 (1) All PPP loans were categorized as commercial. 16
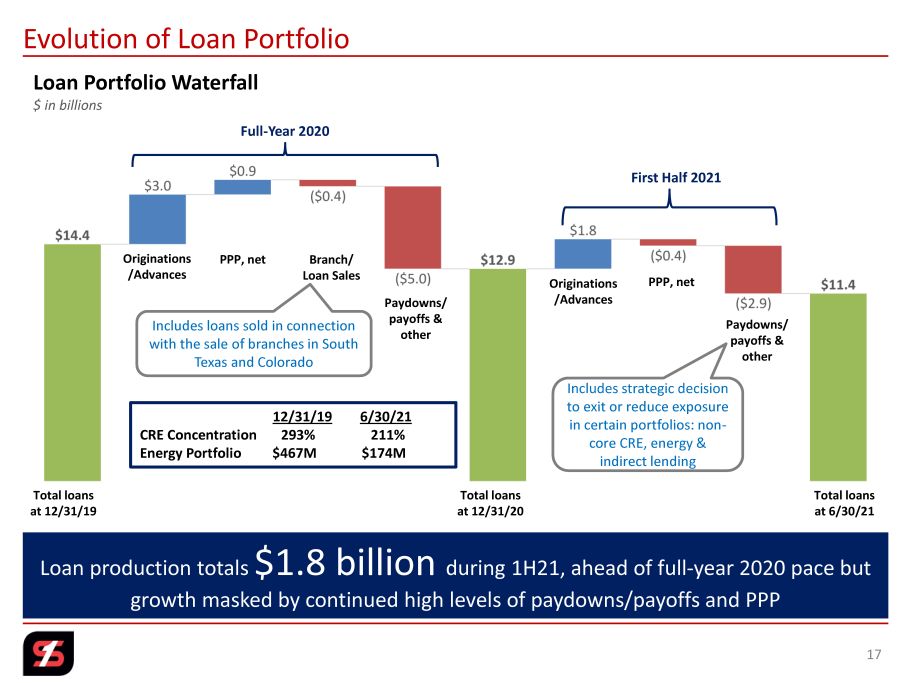
Evolution of Loan Portfolio 17 Total loans at 12/31/19 Originations /Advances PPP, net Branch/ Loan Sales Paydowns/ payoffs & other Total loans at 12/31/20 Originations /Advances PPP, net Paydowns/ payoffs & other Total loans at 6/30/21 Includes strategic decision to exit or reduce exposure in certain portfolios: non - core CRE, energy & indirect lending Loan production totals $1.8 billion during 1H21, ahead of full - year 2020 pace but growth masked by continued high levels of paydowns/payoffs and PPP Includes loans sold in connection with the sale of branches in South Texas and Colorado Loan Portfolio Waterfall $ in billions 12/31/19 6/30/21 CRE Concentration 293% 211% Energy Portfolio $467M $174M Full - Year 2020 First Half 2021
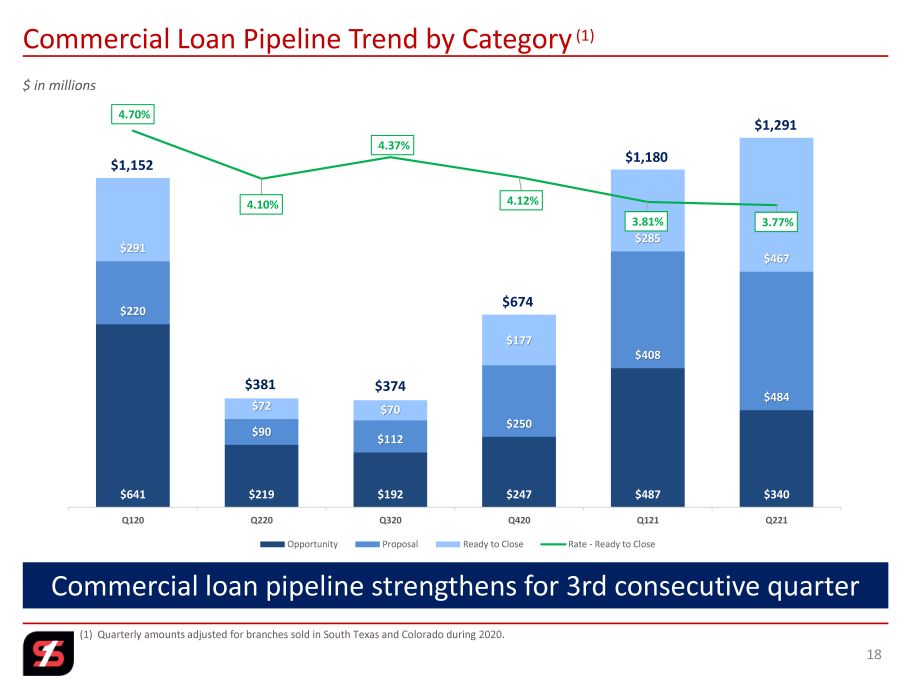
Commercial Loan Pipeline Trend by Category (1) 18 $ in millions (1) Quarterly amounts adjusted for branches sold in South Texas and Colorado during 2020. $641 $219 $192 $247 $487 $340 $220 $90 $112 $250 $408 $484 $291 $72 $70 $177 $285 $467 4.70% 4.10% 4.37% 4.12% 3.81% 3.77% 0.00% 0.50% 1.00% 1.50% 2.00% 2.50% 3.00% 3.50% 4.00% 4.50% 5.00% $0 $200 $400 $600 $800 $1,000 $1,200 $1,400 Q120 Q220 Q320 Q420 Q121 Q221 Opportunity Proposal Ready to Close Rate - Ready to Close $1,152 $381 $374 $674 $1,180 $1,291 Commercial loan pipeline strengthens for 3rd consecutive quarter
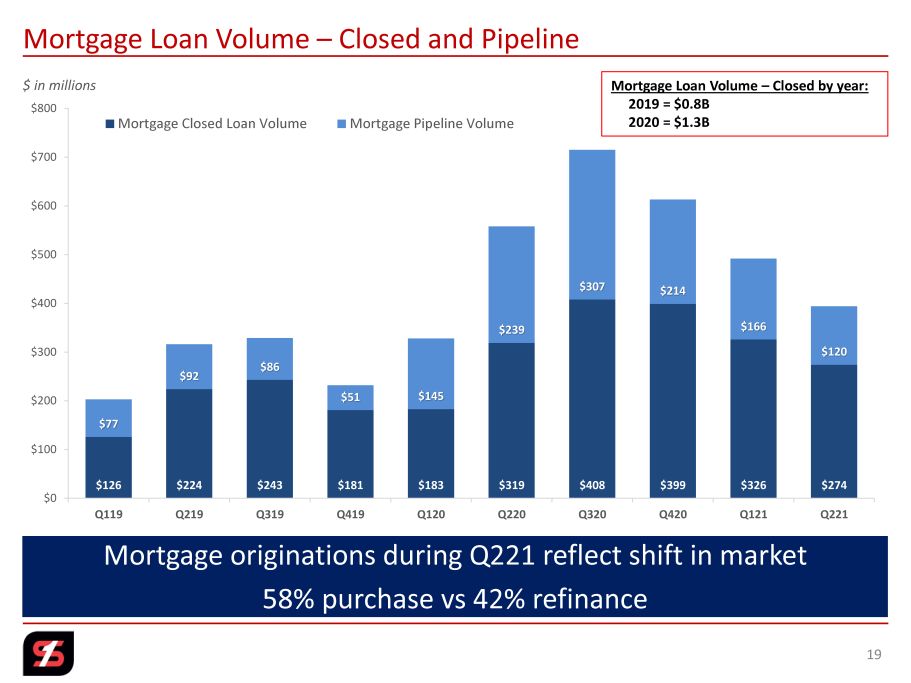
Mortgage Loan Volume – Closed and Pipeline 19 $ in millions $126 $224 $243 $181 $183 $319 $408 $399 $326 $274 $77 $92 $86 $51 $145 $239 $307 $214 $166 $120 $0 $100 $200 $300 $400 $500 $600 $700 $800 Q119 Q219 Q319 Q419 Q120 Q220 Q320 Q420 Q121 Q221 Mortgage Closed Loan Volume Mortgage Pipeline Volume Mortgage Loan Volume – Closed by year: 2019 = $0.8B 2020 = $1.3B Mortgage originations during Q221 reflect shift in market 58% purchase vs 42% refinance
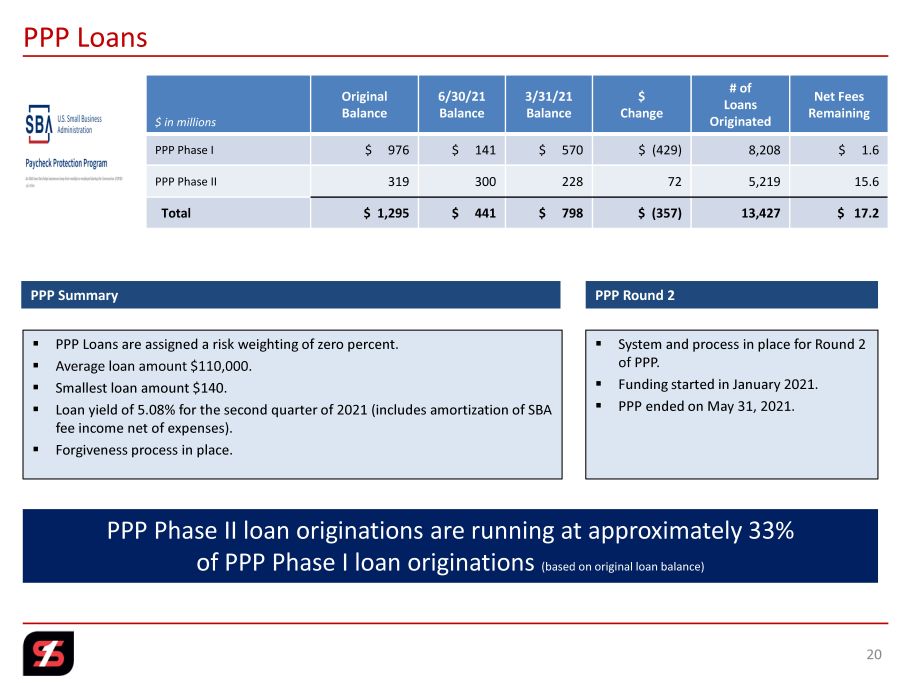
$ in millions Original Balance 6/30/21 Balance 3/31/21 Balance $ Change # of Loans Originated Net Fees Remaining PPP Phase I $ 976 $ 141 $ 570 $ (429) 8,208 $ 1.6 PPP Phase II 319 300 228 72 5,219 15.6 Total $ 1,295 $ 441 $ 798 $ (357) 13,427 $ 17.2 PPP Loans 20 PPP Summary ▪ PPP Loans are assigned a risk weighting of zero percent. ▪ Average loan amount $110,000. ▪ Smallest loan amount $140. ▪ Loan yield of 5.08% for the second quarter of 2021 (includes amortization of SBA fee income net of expenses). ▪ Forgiveness process in place. PPP Round 2 ▪ System and process in place for Round 2 of PPP. ▪ Funding started in January 2021. ▪ PPP ended on May 31, 2021. PPP Phase II loan originations are running at approximately 33% of PPP Phase I loan originations (based on original loan balance)

DEPOSITS, LIQUIDITY, INVESTMENTS AND CAPITAL 21
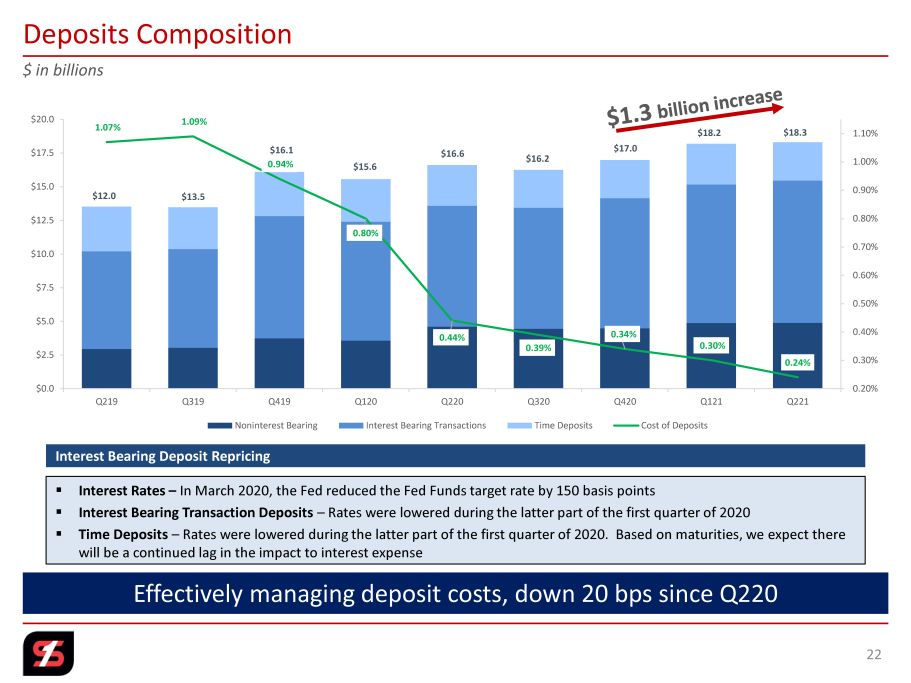
▪ Interest Rates – In March 2020, the Fed reduced the Fed Funds target rate by 150 basis points ▪ Interest Bearing Transaction Deposits – Rates were lowered during the latter part of the first quarter of 2020 ▪ Time Deposits – Rates were lowered during the latter part of the first quarter of 2020. Based on maturities, we expect there will be a continued lag in the impact to interest expense $ in billions Interest Bearing Deposit Repricing Deposits Composition 22 1.07% 1.09% 0.94% 0.80% 0.44% 0.39% 0.34% 0.30% 0.24% 0.20% 0.30% 0.40% 0.50% 0.60% 0.70% 0.80% 0.90% 1.00% 1.10% $0.0 $2.5 $5.0 $7.5 $10.0 $12.5 $15.0 $17.5 $20.0 Q219 Q319 Q419 Q120 Q220 Q320 Q420 Q121 Q221 Noninterest Bearing Interest Bearing Transactions Time Deposits Cost of Deposits $12.0 $13.5 $16.1 $15.6 $16.6 $16.2 $17.0 $18.2 $18.3 Effectively managing deposit costs, down 20 bps since Q220
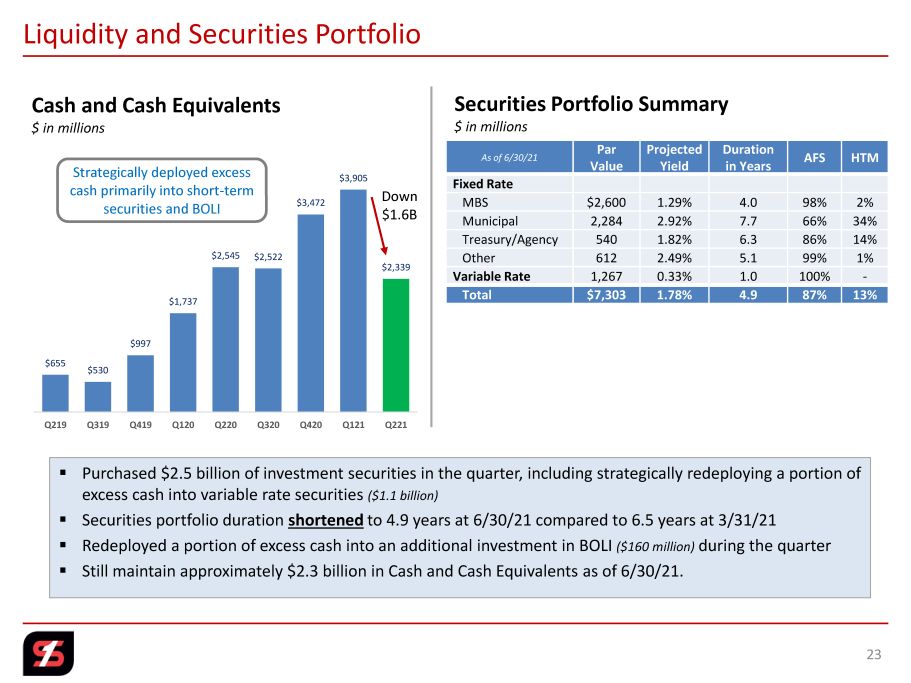
$655 $530 $997 $1,737 $2,545 $2,522 $3,472 $3,905 $2,339 Q219 Q319 Q419 Q120 Q220 Q320 Q420 Q121 Q221 Strategically deployed excess cash primarily into short - term securities and BOLI Down $1.6B ▪ Purchased $2.5 billion of investment securities in the quarter, including strategically redeploying a portion of excess cash into variable rate securities ($1.1 billion) ▪ Securities portfolio duration shortened to 4.9 years at 6/30/21 compared to 6.5 years at 3/31/21 ▪ Redeployed a portion of excess cash into an additional investment in BOLI ($160 million) during the quarter ▪ Still maintain approximately $2.3 billion in Cash and Cash Equivalents as of 6/30/21. 23 Cash and Cash Equivalents $ in millions Securities Portfolio Summary $ in millions Liquidity and Securities Portfolio As of 6/30/21 Par Value Projected Yield Duration in Years AFS HTM Fixed Rate MBS $2,600 1.29% 4.0 98% 2% Municipal 2,284 2.92% 7.7 66% 34% Treasury/Agency 540 1.82% 6.3 86% 14% Other 612 2.49% 5.1 99% 1% Variable Rate 1,267 0.33% 1.0 100% - Total $7,303 1.78% 4.9 87% 13%
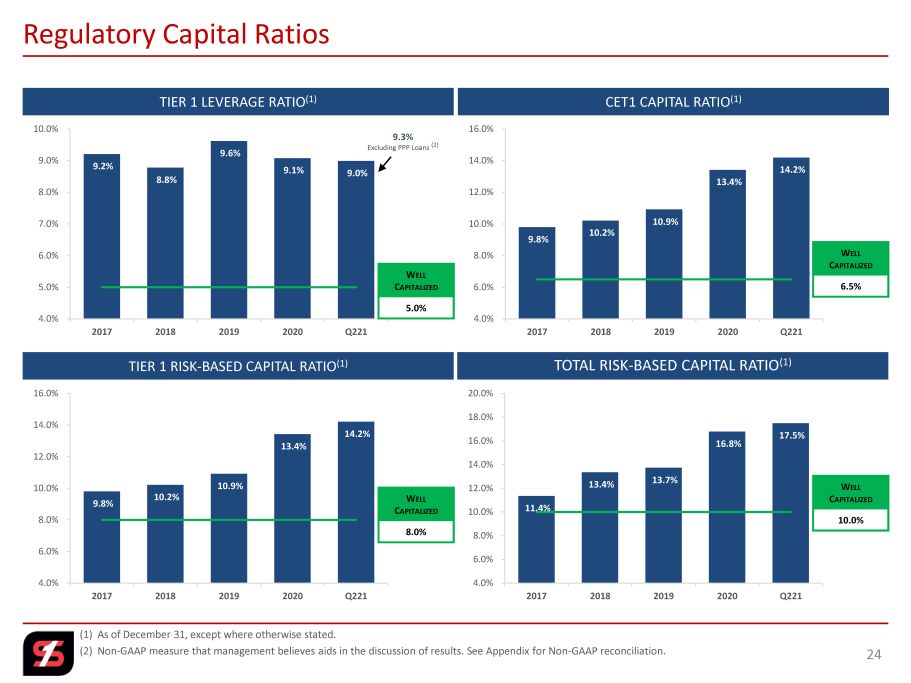
9.8% 10.2% 10.9% 13.4% 14.2% 4.0% 6.0% 8.0% 10.0% 12.0% 14.0% 16.0% 2017 2018 2019 2020 Q221 W ELL C APITALIZED 8.0% 11.4% 13.4% 13.7% 16.8% 17.5% 4.0% 6.0% 8.0% 10.0% 12.0% 14.0% 16.0% 18.0% 20.0% 2017 2018 2019 2020 Q221 9.8% 10.2% 10.9% 13.4% 14.2% 4.0% 6.0% 8.0% 10.0% 12.0% 14.0% 16.0% 2017 2018 2019 2020 Q221 9.2% 8.8% 9.6% 9.1% 9.0% 4.0% 5.0% 6.0% 7.0% 8.0% 9.0% 10.0% 2017 2018 2019 2020 Q221 (1) As of December 31, except where otherwise stated. (2) Non - GAAP measure that management believes aids in the discussion of results. See Appendix for Non - GAAP reconciliation. 24 Regulatory Capital Ratios TIER 1 LEVERAGE RATIO (1) TOTAL RISK - BASED CAPITAL RATIO (1) TIER 1 RISK - BASED CAPITAL RATIO (1) CET1 CAPITAL RATIO (1) W ELL C APITALIZED 5.0% W ELL C APITALIZED 10.0% W ELL C APITALIZED 6.5% 9.3% Excluding PPP Loans (2)
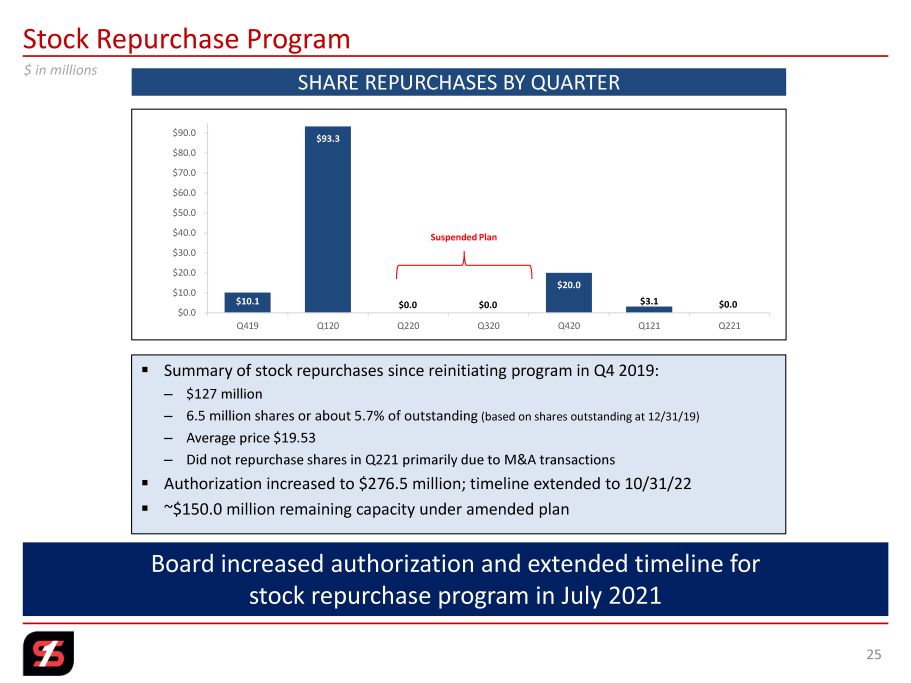
Stock Repurchase Program 25 $10.1 $93.3 $0.0 $0.0 $20.0 $3.1 $0.0 $0.0 $10.0 $20.0 $30.0 $40.0 $50.0 $60.0 $70.0 $80.0 $90.0 Q419 Q120 Q220 Q320 Q420 Q121 Q221 SHARE REPURCHASES BY QUARTER ▪ Summary of stock repurchases since reinitiating program in Q4 2019: – $127 million – 6.5 million shares or about 5.7% of outstanding (based on shares outstanding at 12/31/19) – Average price $19.53 – Did not repurchase shares in Q221 primarily due to M&A transactions ▪ Authorization increased to $276.5 million; timeline extended to 10/31/22 ▪ ~$150.0 million remaining capacity under amended plan $0.0 $0.0 Suspended Plan $ in millions $0.0 Board increased authorization and extended timeline for stock repurchase program in July 2021
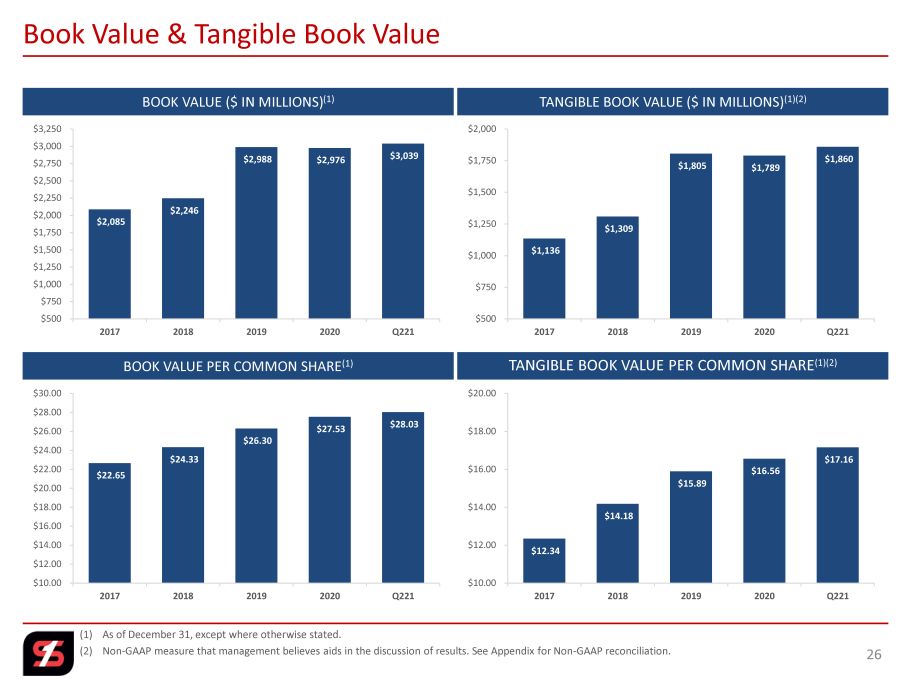
(1) As of December 31, except where otherwise stated. (2) Non - GAAP measure that management believes aids in the discussion of results. See Appendix for Non - GAAP reconciliation. 26 Book Value & Tangible Book Value BOOK VALUE ($ IN MILLIONS) (1) TANGIBLE BOOK VALUE PER COMMON SHARE (1)(2) BOOK VALUE PER COMMON SHARE (1) TANGIBLE BOOK VALUE ($ IN MILLIONS) (1)(2) $2,085 $2,246 $2,988 $2,976 $3,039 $500 $750 $1,000 $1,250 $1,500 $1,750 $2,000 $2,250 $2,500 $2,750 $3,000 $3,250 2017 2018 2019 2020 Q221 $22.65 $24.33 $26.30 $27.53 $28.03 $10.00 $12.00 $14.00 $16.00 $18.00 $20.00 $22.00 $24.00 $26.00 $28.00 $30.00 2017 2018 2019 2020 Q221 $12.34 $14.18 $15.89 $16.56 $17.16 $10.00 $12.00 $14.00 $16.00 $18.00 $20.00 2017 2018 2019 2020 Q221 $1,136 $1,309 $1,805 $1,789 $1,860 $500 $750 $1,000 $1,250 $1,500 $1,750 $2,000 2017 2018 2019 2020 Q221
Q221 Credit Quality 27
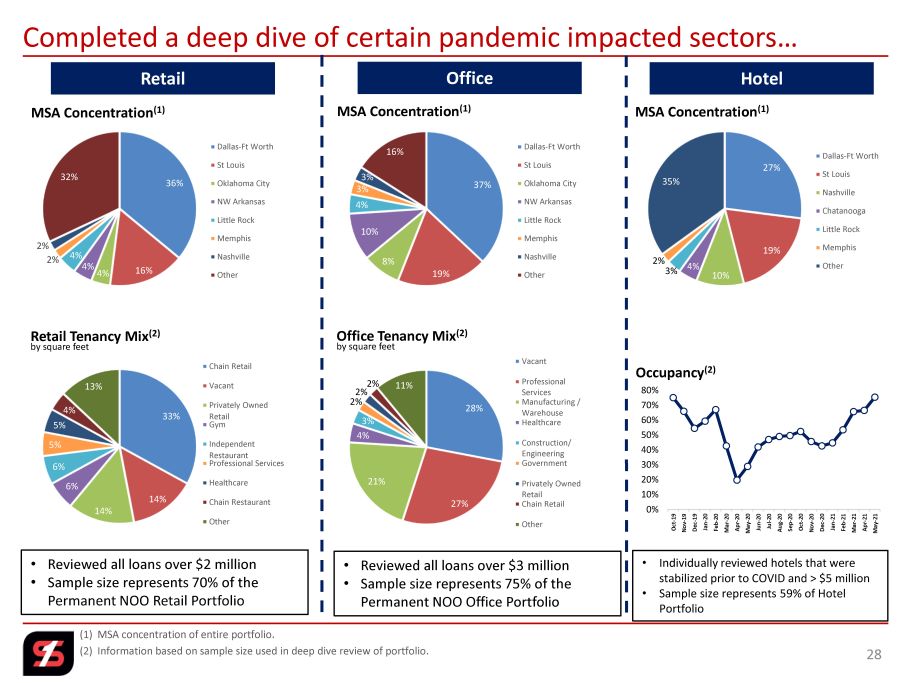
Completed a deep dive of certain pandemic impacted sectors… 28 (1) MSA concentration of entire portfolio. (2) Information based on sample size used in deep dive review of portfolio. MSA Concentration (1) Retail Tenancy Mix (2) by square feet Retail MSA Concentration (1) Office Tenancy Mix (2) by square feet Office Hotel MSA Concentration (1) 0% 10% 20% 30% 40% 50% 60% 70% 80% Oct-19 Nov-19 Dec-19 Jan-20 Feb-20 Mar-20 Apr-20 May-20 Jun-20 Jul-20 Aug-20 Sep-20 Oct-20 Nov-20 Dec-20 Jan-21 Feb-21 Mar-21 Apr-21 May-21 Occupancy (2) • Reviewed all loans over $2 million • Sample size represents 70% of the Permanent NOO Retail Portfolio • Reviewed all loans over $3 million • Sample size represents 75% of the Permanent NOO Office Portfolio • Individually reviewed hotels that were stabilized prior to COVID and > $5 million • Sample size represents 59% of Hotel Portfolio 36% 16% 4% 4% 4% 2% 2% 32% Dallas-Ft Worth St Louis Oklahoma City NW Arkansas Little Rock Memphis Nashville Other 37% 19% 8% 10% 4% 3% 3% 16% Dallas-Ft Worth St Louis Oklahoma City NW Arkansas Little Rock Memphis Nashville Other 27% 19% 10% 4% 3% 2% 35% Dallas-Ft Worth St Louis Nashville Chatanooga Little Rock Memphis Other 33% 14% 14% 6% 6% 5% 5% 4% 13% Chain Retail Vacant Privately Owned Retail Gym Independent Restaurant Professional Services Healthcare Chain Restaurant Other 28% 27% 21% 4% 3% 2% 2% 2% 11% Vacant Professional Services Manufacturing / Warehouse Healthcare Construction/ Engineering Government Privately Owned Retail Chain Retail Other
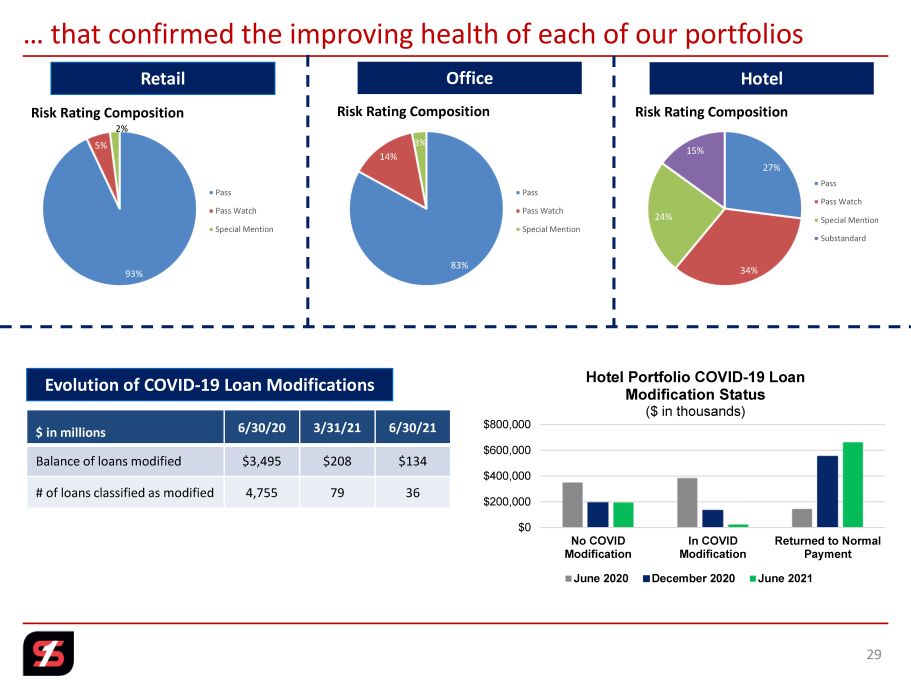
… that confirmed the improving health of each of our portfolios 29 Retail Office Hotel Evolution of COVID - 19 Loan Modifications $ in millions 6/30/20 3/31/21 6/30/21 Balance of loans modified $3,495 $208 $134 # of loans classified as modified 4,755 79 36 $0 $200,000 $400,000 $600,000 $800,000 No COVID Modification In COVID Modification Returned to Normal Payment Hotel Portfolio COVID - 19 Loan Modification Status ($ in thousands) June 2020 December 2020 June 2021 Risk Rating Composition Risk Rating Composition Risk Rating Composition 93% 5% 2% Pass Pass Watch Special Mention 83% 14% 3% Pass Pass Watch Special Mention 27% 34% 24% 15% Pass Pass Watch Special Mention Substandard
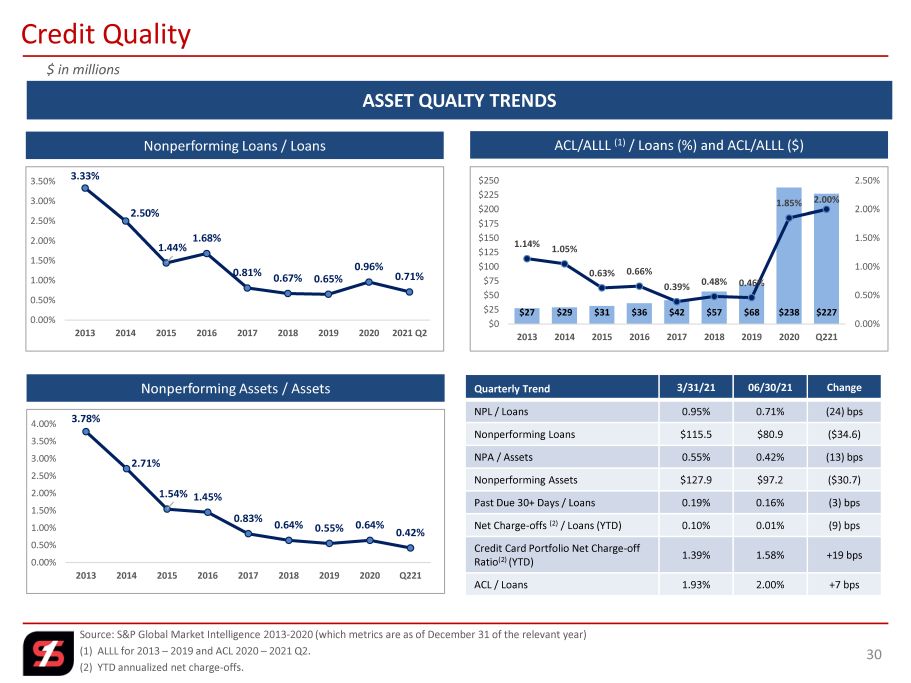
ASSET QUALTY TRENDS Credit Quality $ in millions Source: S&P Global Market Intelligence 2013 - 2020 (which metrics are as of December 31 of the relevant year) (1) ALLL for 2013 – 2019 and ACL 2020 – 2021 Q2. (2) YTD annualized net charge - offs. Nonperforming Loans / Loans 3.33% 2.50% 1.44% 1.68% 0.81% 0.67% 0.65% 0.96% 0.71% 0.00% 0.50% 1.00% 1.50% 2.00% 2.50% 3.00% 3.50% 2013 2014 2015 2016 2017 2018 2019 2020 2021 Q2 ACL/ALLL (1) / Loans (%) and ACL/ALLL ($) $27 $29 $31 $36 $42 $57 $68 $238 $227 1.14% 1.05% 0.63% 0.66% 0.39% 0.48% 0.46% 1.85% 2.00% 0.00% 0.50% 1.00% 1.50% 2.00% 2.50% $0 $25 $50 $75 $100 $125 $150 $175 $200 $225 $250 2013 2014 2015 2016 2017 2018 2019 2020 Q221 Quarterly Trend 3/31/21 06/30/21 Change NPL / Loans 0.95% 0.71% (24) bps Nonperforming Loans $115.5 $80.9 ($34.6) NPA / Assets 0.55% 0.42% (13) bps Nonperforming Assets $127.9 $97.2 ($30.7) Past Due 30+ Days / Loans 0.19% 0.16% (3) bps Net Charge - offs (2) / Loans (YTD) 0.10% 0.01% (9) bps Credit Card Portfolio Net Charge - off Ratio (2) (YTD) 1.39% 1.58% +19 bps ACL / Loans 1.93% 2.00% +7 bps Nonperforming Assets / Assets 3.78% 2.71% 1.54% 1.45% 0.83% 0.64% 0.55% 0.64% 0.42% 0.00% 0.50% 1.00% 1.50% 2.00% 2.50% 3.00% 3.50% 4.00% 2013 2014 2015 2016 2017 2018 2019 2020 Q221 30
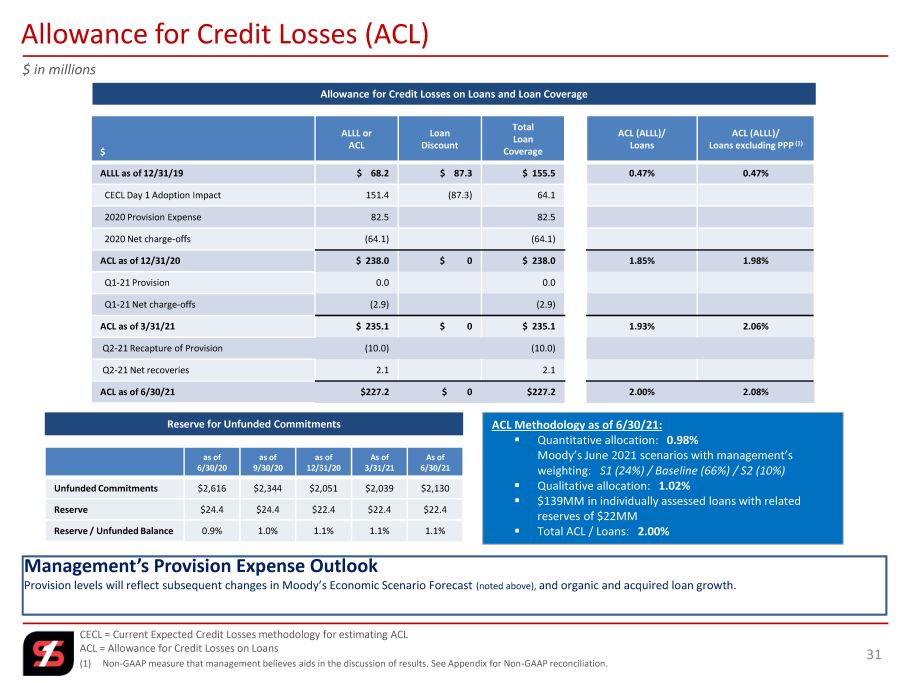
$ ALLL or ACL Loan Discount Total Loan Coverage ACL (ALLL)/ Loans ACL (ALLL)/ Loans excluding PPP (1) ALLL as of 12/31/19 $ 68.2 $ 87.3 $ 155.5 0.47% 0.47% CECL Day 1 Adoption Impact 151.4 (87.3) 64.1 2020 Provision Expense 82.5 82.5 2020 Net charge - offs (64.1) (64.1) ACL as of 12/31/20 $ 238.0 $ 0 $ 238.0 1.85% 1.98% Q1 - 21 Provision 0.0 0.0 Q1 - 21 Net charge - offs (2.9) (2.9) ACL as of 3/31/21 $ 235.1 $ 0 $ 235.1 1.93% 2.06% Q2 - 21 Recapture of Provision (10.0) (10.0) Q2 - 21 Net recoveries 2.1 2.1 ACL as of 6/30/21 $227.2 $ 0 $227.2 2.00% 2.08% Allowance for Credit Losses on Loans and Loan Coverage 31 Allowance for Credit Losses (ACL) CECL = Current Expected Credit Losses methodology for estimating ACL ACL = Allowance for Credit Losses on Loans (1) Non - GAAP measure that management believes aids in the discussion of results. See Appendix for Non - GAAP reconciliation. $ in millions as of 6/30/20 as of 9/30/20 as of 12/31/20 As of 3/31/21 As of 6/30/21 Unfunded Commitments $2,616 $2,344 $2,051 $2,039 $2,130 Reserve $24.4 $24.4 $22.4 $22.4 $22.4 Reserve / Unfunded Balance 0.9% 1.0% 1.1% 1.1% 1.1% Reserve for Unfunded Commitments ACL Methodology as of 6/30/21: ▪ Quantitative allocation: 0.98% Moody’s June 2021 scenarios with management’s weighting: S1 (24%) / Baseline (66%) / S2 (10%) ▪ Qualitative allocation: 1.02% ▪ $139MM in individually assessed loans with related reserves of $22MM ▪ Total ACL / Loans: 2.00% Management’s Provision Expense Outlook Provision levels will reflect subsequent changes in Moody’s Economic Scenario Forecast (noted above), and organic and acquired loan growth.

PERFORMANCE TRENDS 32
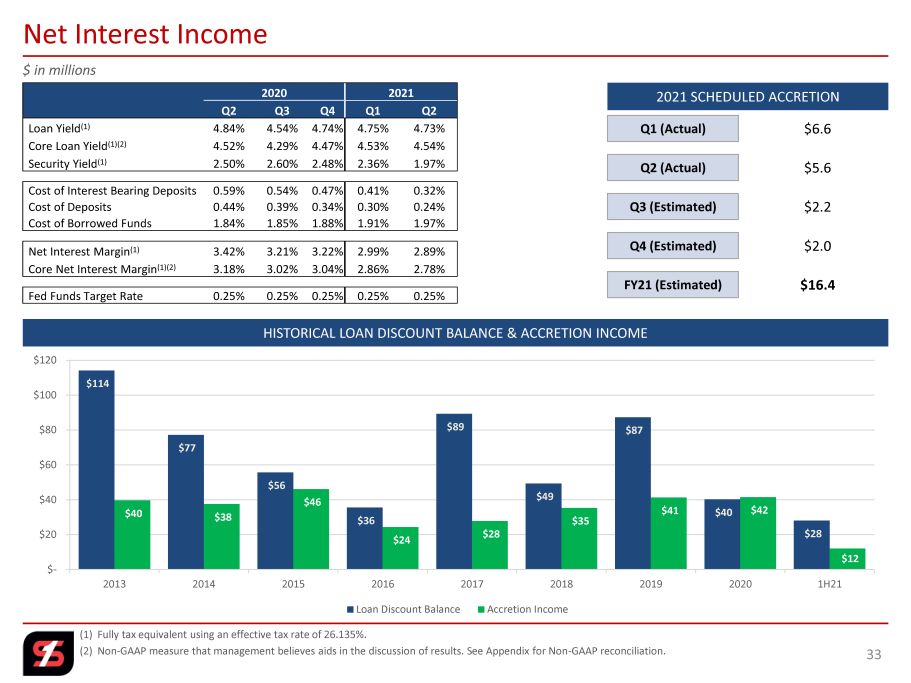
HISTORICAL LOAN DISCOUNT BALANCE & ACCRETION INCOME (1) Fully tax equivalent using an effective tax rate of 26.135%. (2) Non - GAAP measure that management believes aids in the discussion of results. See Appendix for Non - GAAP reconciliation. 33 Net Interest Income 2021 SCHEDULED ACCRETION Q1 (Actual) Q2 (Actual) Q4 (Estimated) Q3 (Estimated) FY21 (Estimated) $2.2 $6.6 $2.0 $ 5.6 $16.4 $ in millions 2020 2021 Q2 Q3 Q4 Q1 Q2 Loan Yield (1) 4.84% 4.54% 4.74% 4.75% 4.73% Core Loan Yield (1)(2) 4.52% 4.29% 4.47% 4.53% 4.54% Security Yield (1) 2.50% 2.60% 2.48% 2.36% 1.97% Cost of Interest Bearing Deposits 0.59% 0.54% 0.47% 0.41% 0.32% Cost of Deposits 0.44% 0.39% 0.34% 0.30% 0.24% Cost of Borrowed Funds 1.84% 1.85% 1.88% 1.91% 1.97% Net Interest Margin (1) 3.42% 3.21% 3.22% 2.99% 2.89% Core Net Interest Margin (1)(2) 3.18% 3.02% 3.04% 2.86% 2.78% Fed Funds Target Rate 0.25% 0.25% 0.25% 0.25% 0.25% $114 $77 $56 $36 $89 $49 $87 $40 $28 $40 $38 $46 $24 $28 $35 $41 $42 $12 $- $20 $40 $60 $80 $100 $120 2013 2014 2015 2016 2017 2018 2019 2020 1H21 Loan Discount Balance Accretion Income
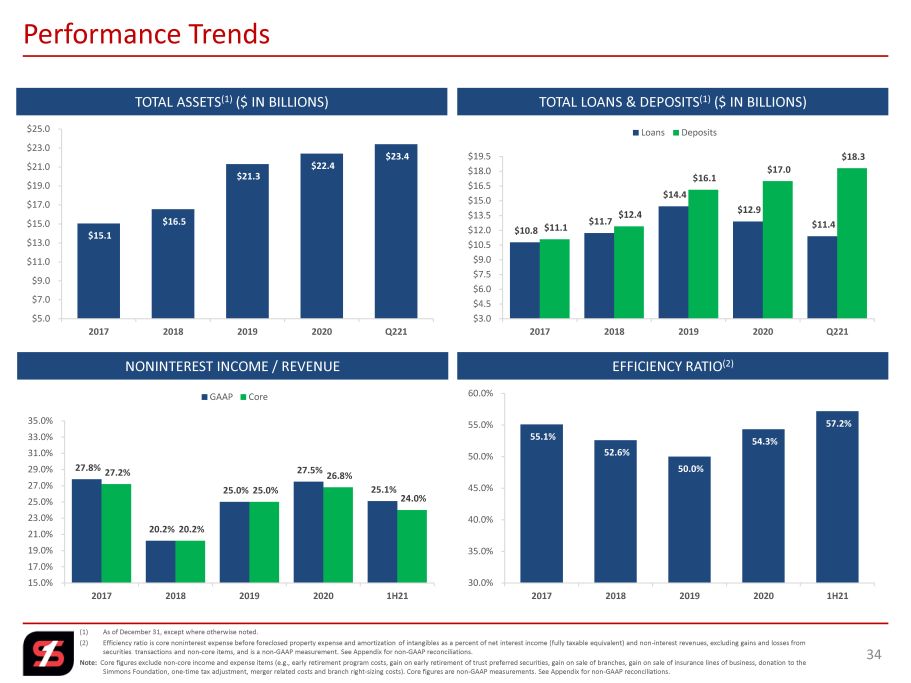
(1) As of December 31, except where otherwise noted. (2) Efficiency ratio is core noninterest expense before foreclosed property expense and amortization of intangibles as a percent of net interest income (fully taxable equivalent) and non - interest revenues, excluding gains and losses from securities transactions and non - core items, and is a non - GAAP measurement. See Appendix for non - GAAP reconciliations. Note: Core figures exclude non - core income and expense items (e.g., early retirement program costs, gain on early retirement of trus t preferred securities, gain on sale of branches, gain on sale of insurance lines of business, donation to the Simmons Foundation, one - time tax adjustment, merger related costs and branch right - sizing costs). Core figures are non - GAAP meas urements. See Appendix for non - GAAP reconciliations. 34 Performance Trends TOTAL ASSETS (1) ($ IN BILLIONS) EFFICIENCY RATIO (2) NONINTEREST INCOME / REVENUE TOTAL LOANS & DEPOSITS (1) ($ IN BILLIONS) $15.1 $16.5 $21.3 $22.4 $23.4 $5.0 $7.0 $9.0 $11.0 $13.0 $15.0 $17.0 $19.0 $21.0 $23.0 $25.0 2017 2018 2019 2020 Q221 55.1% 52.6% 50.0% 54.3% 57.2% 30.0% 35.0% 40.0% 45.0% 50.0% 55.0% 60.0% 2017 2018 2019 2020 1H21 $10.8 $11.7 $14.4 $12.9 $11.4 $11.1 $12.4 $16.1 $17.0 $18.3 $3.0 $4.5 $6.0 $7.5 $9.0 $10.5 $12.0 $13.5 $15.0 $16.5 $18.0 $19.5 2017 2018 2019 2020 Q221 Loans Deposits 27.8% 20.2% 25.0% 27.5% 25.1% 27.2% 20.2% 25.0% 26.8% 24.0% 15.0% 17.0% 19.0% 21.0% 23.0% 25.0% 27.0% 29.0% 31.0% 33.0% 35.0% 2017 2018 2019 2020 1H21 GAAP Core
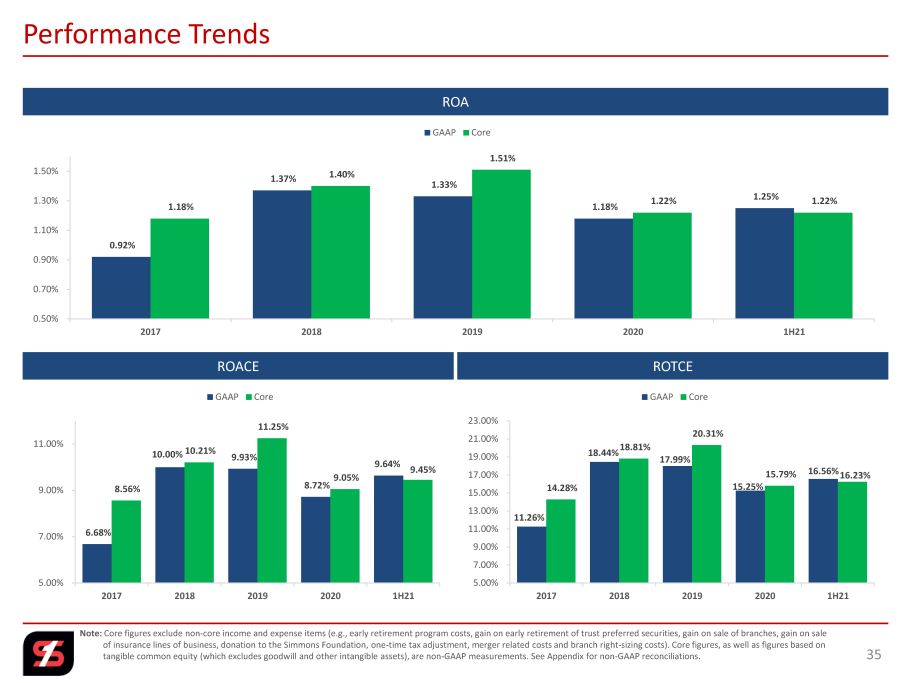
Note: Core figures exclude non - core income and expense items (e.g., early retirement program costs, gain on early retirement of trust preferred securities, gain on sale of branches, gain on sale of insurance lines of business, donation to the Simmons Foundation, one - time tax adjustment, merger related costs and branch rig ht - sizing costs). Core figures, as well as figures based on tangible common equity (which excludes goodwill and other intangible assets), are non - GAAP measurements. See Appendix for non - GA AP reconciliations. 35 Performance Trends ROA ROTCE ROACE 6.68% 10.00% 9.93% 8.72% 9.64% 8.56% 10.21% 11.25% 9.05% 9.45% 5.00% 7.00% 9.00% 11.00% 2017 2018 2019 2020 1H21 GAAP Core 11.26% 18.44% 17.99% 15.25% 16.56% 14.28% 18.81% 20.31% 15.79% 16.23% 5.00% 7.00% 9.00% 11.00% 13.00% 15.00% 17.00% 19.00% 21.00% 23.00% 2017 2018 2019 2020 1H21 GAAP Core 0.92% 1.37% 1.33% 1.18% 1.25% 1.18% 1.40% 1.51% 1.22% 1.22% 0.50% 0.70% 0.90% 1.10% 1.30% 1.50% 2017 2018 2019 2020 1H21 GAAP Core
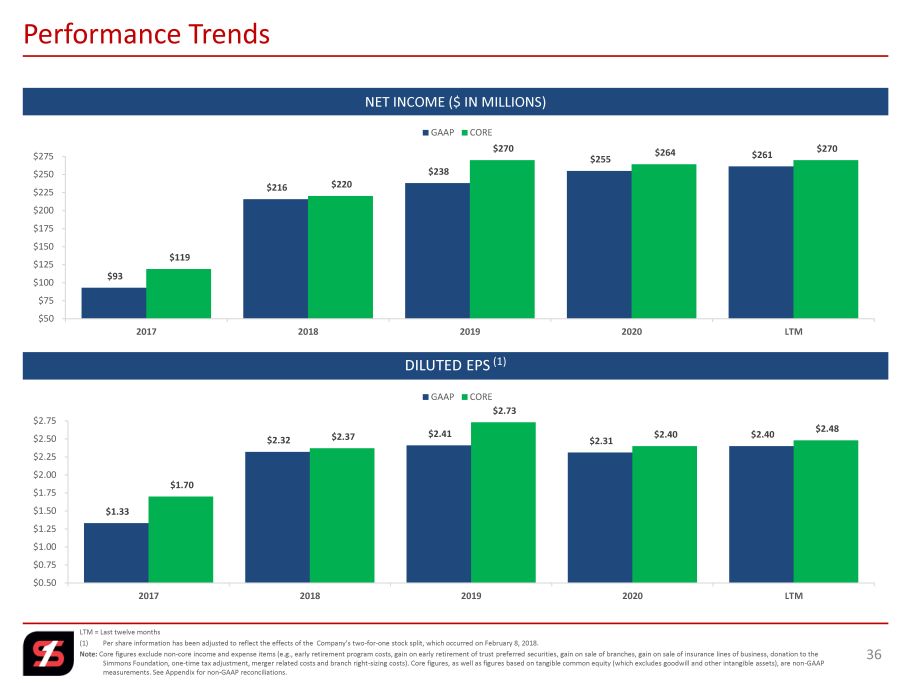
LTM = Last twelve months (1) Per share information has been adjusted to reflect the effects of the Company’s two - for - one stock split, which occurred on Febr uary 8, 2018. Note: Core figures exclude non - core income and expense items (e.g., early retirement program costs, gain on early retirement of trust preferred securities, gain on sale of branches, gain on sale of insurance lines of business, donation to the Simmons Foundation, one - time tax adjustment, merger related costs and branch right - sizing costs). Core figures, as well as figur es based on tangible common equity (which excludes goodwill and other intangible assets), are non - GAAP measurements. See Appendix for non - GAAP reconciliations. 36 Performance Trends DILUTED EPS (1) NET INCOME ($ IN MILLIONS) $93 $216 $238 $255 $261 $119 $220 $270 $264 $270 $50 $75 $100 $125 $150 $175 $200 $225 $250 $275 2017 2018 2019 2020 LTM GAAP CORE $1.33 $2.32 $2.41 $2.31 $2.40 $1.70 $2.37 $2.73 $2.40 $2.48 $0.50 $0.75 $1.00 $1.25 $1.50 $1.75 $2.00 $2.25 $2.50 $2.75 2017 2018 2019 2020 LTM GAAP CORE
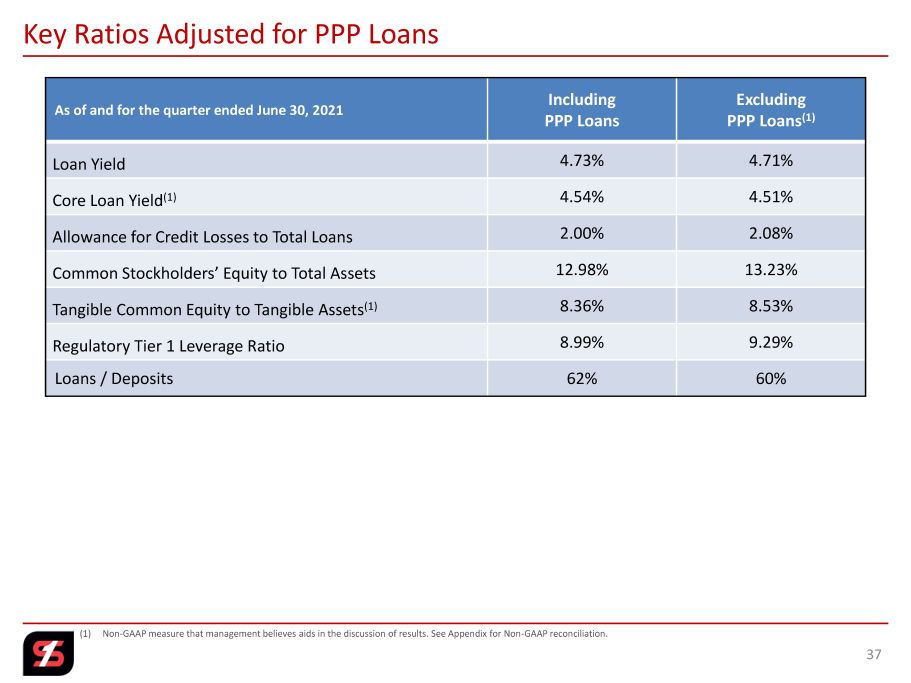
As of and for the quarter ended June 30, 2021 Including PPP Loans Excluding PPP Loans (1) Loan Yield 4.73% 4.71% Core Loan Yield (1) 4.54% 4.51% Allowance for Credit Losses to Total Loans 2.00% 2.08% Common Stockholders’ Equity to Total Assets 12.98% 13.23% Tangible Common Equity to Tangible Assets (1) 8.36% 8.53% Regulatory Tier 1 Leverage Ratio 8.99% 9.29% Loans / Deposits 62% 60% 37 Key Ratios Adjusted for PPP Loans (1) Non - GAAP measure that management believes aids in the discussion of results. See Appendix for Non - GAAP reconciliation.

CORPORATE PROFILE AND COMPANY HIGHLIGHTS 38
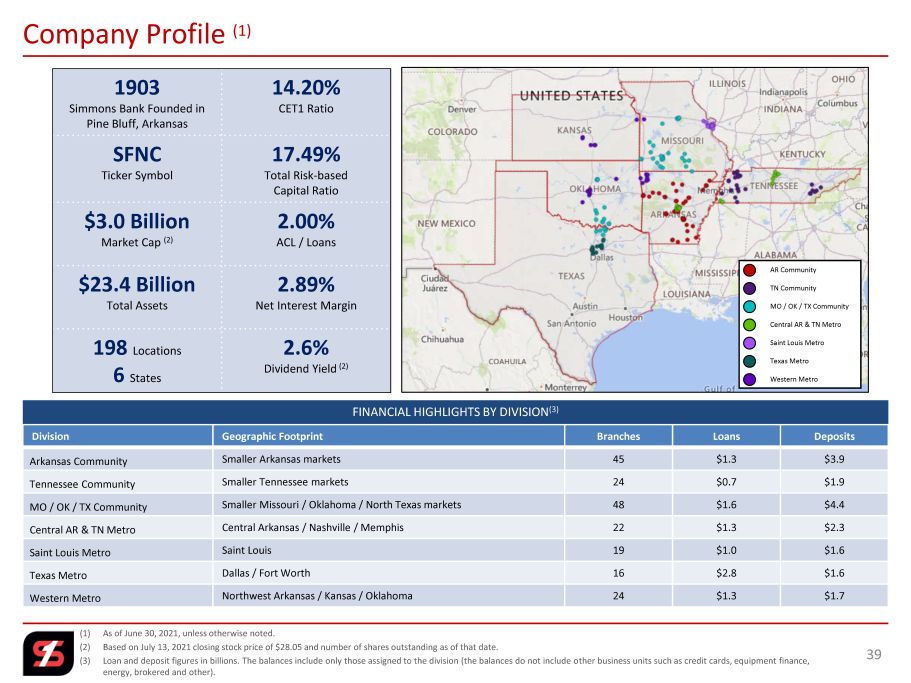
(1) As of June 30, 2021, unless otherwise noted. (2) Based on July 13, 2021 closing stock price of $28.05 and number of shares outstanding as of that date. (3) Loan and deposit figures in billions. The balances include only those assigned to the division (the balances do not include o the r business units such as credit cards, equipment finance, energy, brokered and other). Company Profile (1) FINANCIAL HIGHLIGHTS BY DIVISION (3) 39 Division Geographic Footprint Branches Loans Deposits Arkansas Community Smaller Arkansas markets 45 $1.3 $3.9 Tennessee Community Smaller Tennessee markets 24 $0.7 $1.9 MO / OK / TX Community Smaller Missouri / Oklahoma / North Texas markets 48 $1.6 $4.4 Central AR & TN Metro Central Arkansas / Nashville / Memphis 22 $1.3 $2.3 Saint Louis Metro Saint Louis 19 $1.0 $1.6 Texas Metro Dallas / Fort Worth 16 $2.8 $1.6 Western Metro Northwest Arkansas / Kansas / Oklahoma 24 $1.3 $1.7 1903 Simmons Bank Founded in Pine Bluff, Arkansas 14.20% CET1 Ratio SFNC Ticker Symbol 17.49% Total Risk - based Capital Ratio $3.0 Billion Market Cap (2) 2.00% ACL / Loans $23.4 Billion Total Assets 2.89% Net Interest Margin 198 Locations 6 States 2.6% Dividend Yield (2) AR Community TN Community MO / OK / TX Community Central AR & TN Metro Saint Louis Metro Texas Metro Western Metro
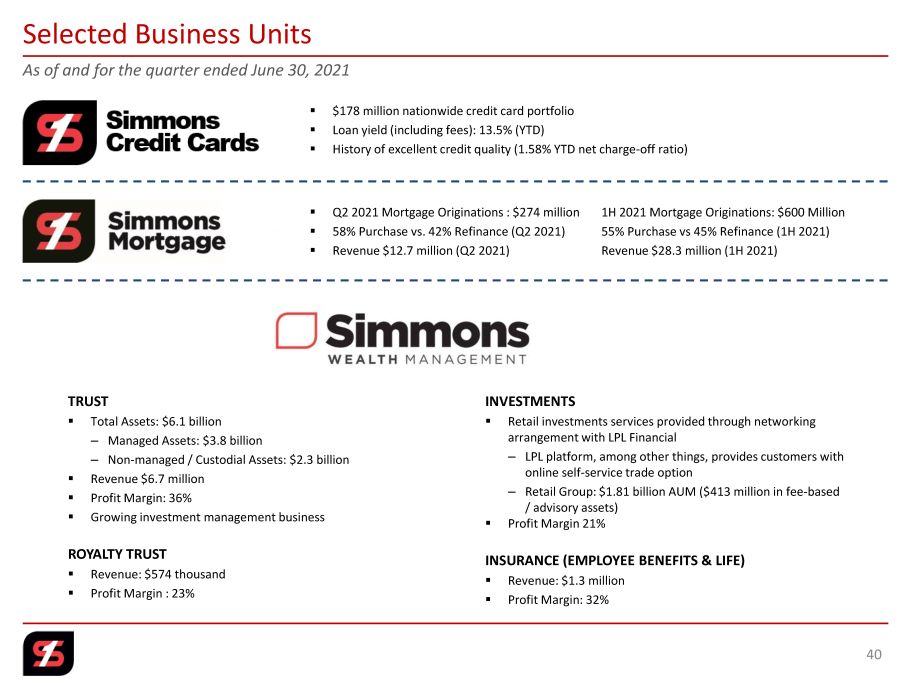
As of and for the quarter ended June 30, 2021 40 Selected Business Units ▪ $178 million nationwide credit card portfolio ▪ Loan yield (including fees): 13.5% (YTD) ▪ History of excellent credit quality (1.58% YTD net charge - off ratio) INVESTMENTS ▪ Retail investments services provided through networking arrangement with LPL Financial – LPL platform, among other things, provides customers with online self - service trade option – Retail Group: $1.81 billion AUM ($ 413 million in fee - based / advisory assets) ▪ Profit Margin 21% INSURANCE (EMPLOYEE BENEFITS & LIFE) ▪ Revenue: $1.3 million ▪ Profit Margin: 32% ▪ Q2 2021 Mortgage Originations : $2 74 million 1H 2021 Mortgage Originations: $600 Million ▪ 58 % Purchase vs. 42 % Refinance (Q2 2021) 55% Purchase vs 45% Refinance (1H 2021) ▪ Revenue $12.7 million (Q2 2021) Revenue $28.3 million (1H 2021) TRUST ▪ Total Assets: $ 6.1 billion – Managed Assets: $3.8 billion – Non - managed / Custodial Assets: $2.3 billion ▪ Revenue $6.7 million ▪ Profit Margin: 36 % ▪ Growing investment management business ROYALTY TRUST ▪ Revenue: $574 thousand ▪ Profit Margin : 23 %
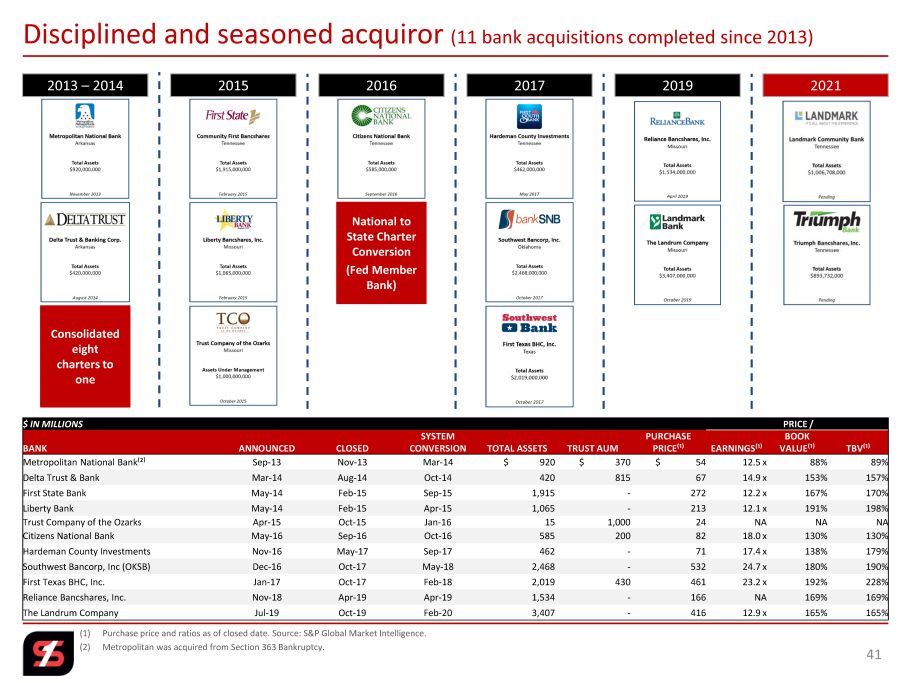
(1) Purchase price and ratios as of closed date. Source: S&P Global Market Intelligence. (2) Metropolitan was acquired from Section 363 Bankruptcy. 41 Disciplined and seasoned acquiror (11 bank acquisitions completed since 2013) 2013 – 2014 Consolidated eight charters to one National to State Charter Conversion (Fed Member Bank) 2015 2016 2017 2019 $ IN MILLIONS PRICE / BANK ANNOUNCED CLOSED SYSTEM CONVERSION TOTAL ASSETS TRUST AUM PURCHASE PRICE⁽¹⁾ EARNINGS⁽¹⁾ BOOK VALUE⁽¹⁾ TBV⁽¹⁾ Metropolitan National Bank⁽²⁾ Sep - 13 Nov - 13 Mar - 14 $ 920 $ 370 $ 54 12.5 x 88% 89% Delta Trust & Bank Mar - 14 Aug - 14 Oct - 14 420 815 67 14.9 x 153% 157% First State Bank May - 14 Feb - 15 Sep - 15 1,915 - 272 12.2 x 167% 170% Liberty Bank May - 14 Feb - 15 Apr - 15 1,065 - 213 12.1 x 191% 198% Trust Company of the Ozarks Apr - 15 Oct - 15 Jan - 16 15 1,000 24 NA NA NA Citizens National Bank May - 16 Sep - 16 Oct - 16 585 200 82 18.0 x 130% 130% Hardeman County Investments Nov - 16 May - 17 Sep - 17 462 - 71 17.4 x 138% 179% Southwest Bancorp, Inc (OKSB) Dec - 16 Oct - 17 May - 18 2,468 - 532 24.7 x 180% 190% First Texas BHC, Inc. Jan - 17 Oct - 17 Feb - 18 2,019 430 461 23.2 x 192% 228% Reliance Bancshares, Inc. Nov - 18 Apr - 19 Apr - 19 1,534 - 166 NA 169% 169% The Landrum Company Jul - 19 Oct - 19 Feb - 20 3,407 - 416 12.9 x 165% 165% 2021
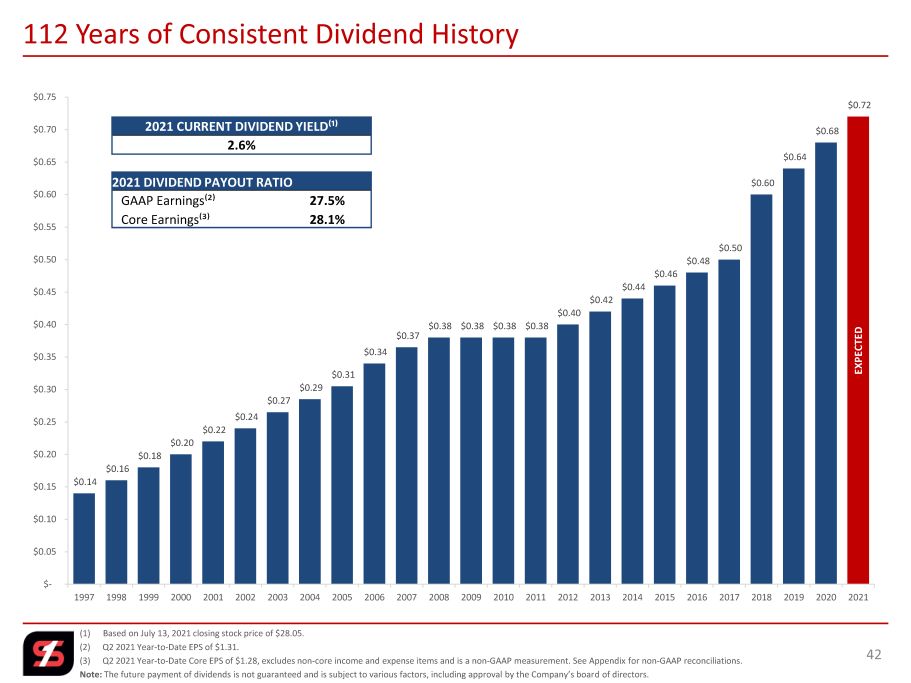
(1) Based on July 13, 2021 closing stock price of $28.05. (2) Q2 2021 Year - to - Date EPS of $1.31. (3) Q2 2021 Year - to - Date Core EPS of $1.28, excludes non - core income and expense items and is a non - GAAP measurement. See Appendix f or non - GAAP reconciliations. Note: The future payment of dividends is not guaranteed and is subject to various factors, including approval by the Company’s boar d of directors. 42 112 Years of Consistent Dividend History $0.14 $0.16 $0.18 $0.20 $0.22 $0.24 $0.27 $0.29 $0.31 $0.34 $0.37 $0.38 $0.38 $0.38 $0.38 $0.40 $0.42 $0.44 $0.46 $0.48 $0.50 $0.60 $0.64 $0.68 $0.72 $- $0.05 $0.10 $0.15 $0.20 $0.25 $0.30 $0.35 $0.40 $0.45 $0.50 $0.55 $0.60 $0.65 $0.70 $0.75 1997 1998 1999 2000 2001 2002 2003 2004 2005 2006 2007 2008 2009 2010 2011 2012 2013 2014 2015 2016 2017 2018 2019 2020 2021 2021 CURRENT DIVIDEND YIELD⁽¹⁾ 2.6% 2021 DIVIDEND PAYOUT RATIO GAAP Earnings⁽²⁾ 27.5% Core Earnings⁽³⁾ 28.1% EXPECTED
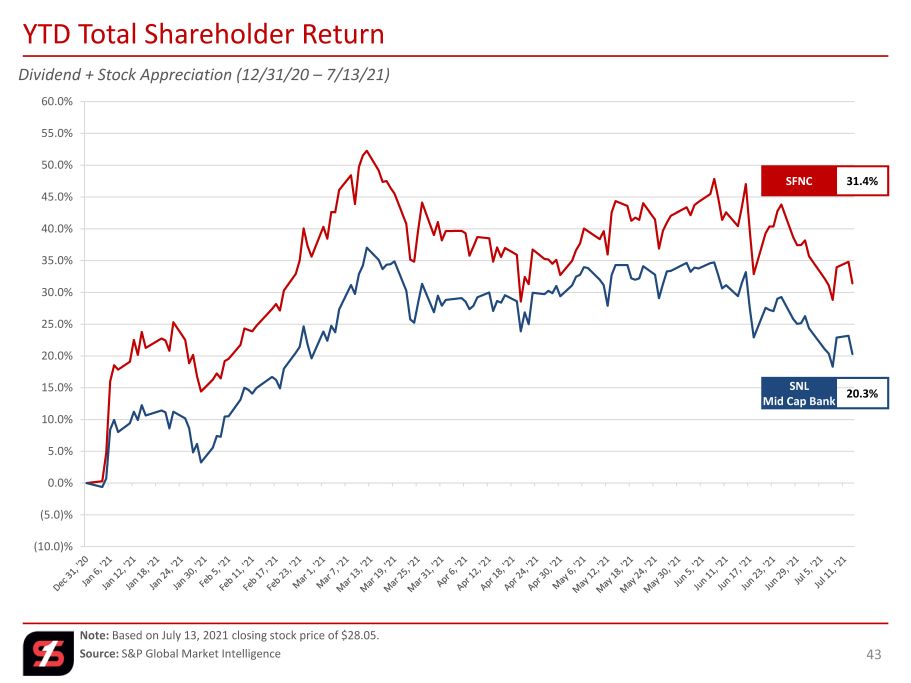
(10.0)% (5.0)% 0.0% 5.0% 10.0% 15.0% 20.0% 25.0% 30.0% 35.0% 40.0% 45.0% 50.0% 55.0% 60.0% Dividend + Stock Appreciation (12/31/20 – 7/13/21) Note: Based on July 13, 2021 closing stock price of $28.05. Source: S&P Global Market Intelligence 43 YTD Total Shareholder Return SFNC 31.4% SNL Mid Cap Bank 20.3%
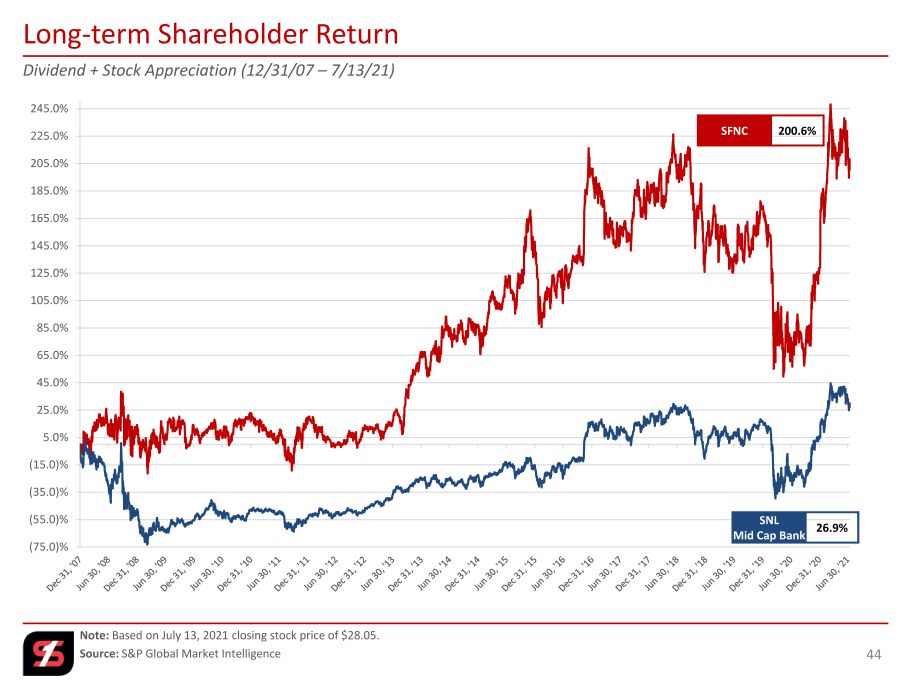
(75.0)% (55.0)% (35.0)% (15.0)% 5.0% 25.0% 45.0% 65.0% 85.0% 105.0% 125.0% 145.0% 165.0% 185.0% 205.0% 225.0% 245.0% Dividend + Stock Appreciation (12/31/07 – 7/13/21) Note: Based on July 13 , 2021 closing stock price of $28.05. Source: S&P Global Market Intelligence 44 Long - term Shareholder Return SFNC 200.6% SNL Mid Cap Bank 26.9%
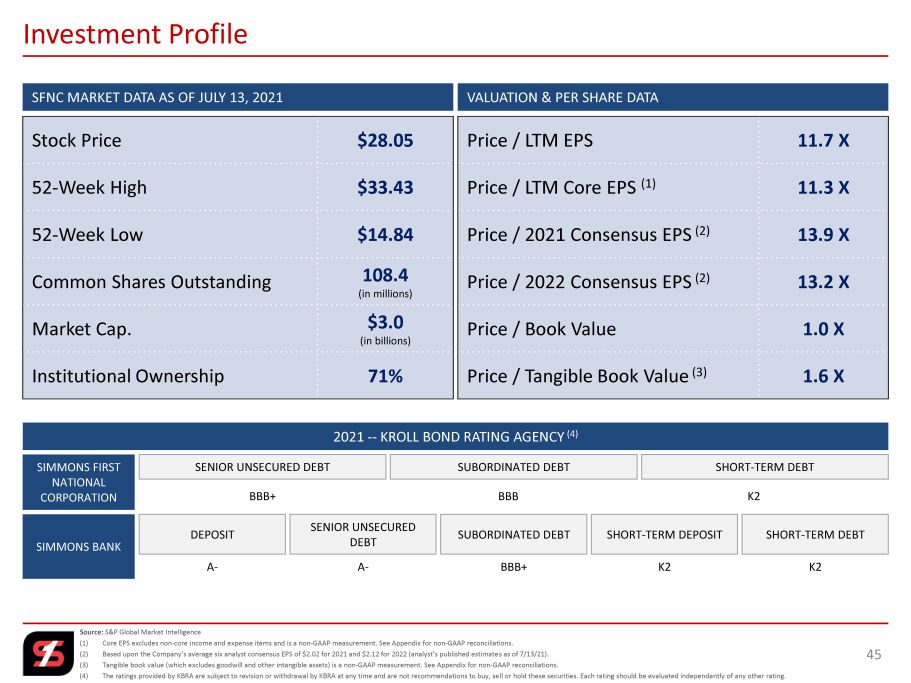
Source: S&P Global Market Intelligence (1) Core EPS excludes non - core income and expense items and is a non - GAAP measurement. See Appendix for non - GAAP reconciliations. (2) Based upon the Company’s average six analyst consensus EPS of $2.02 for 2021 and $2.12 for 2022 (analyst’s published estimate s a s of 7/13/21). (3) Tangible book value (which excludes goodwill and other intangible assets) is a non - GAAP measurement. See Appendix for non - GAAP reconciliations. (4) The ratings provided by KBRA are subject to revision or withdrawal by KBRA at any time and are not recommendations to buy, se ll or hold these securities. Each rating should be evaluated independently of any other rating. 45 Investment Profile SENIOR UNSECURED DEBT SHORT - TERM DEBT SUBORDINATED DEBT SENIOR UNSECURED DEBT SHORT - TERM DEBT SUBORDINATED DEBT SHORT - TERM DEPOSIT DEPOSIT BBB+ BBB K2 SIMMONS FIRST NATIONAL CORPORATION SIMMONS BANK A - A - BBB+ K2 K2 2021 -- KROLL BOND RATING AGENCY (4) SFNC MARKET DATA AS OF JULY 13, 2021 VALUATION & PER SHARE DATA Stock Price $28.05 52 - Week High $33.43 52 - Week Low $14.84 Common Shares Outstanding 108.4 (in millions) Market Cap. $3.0 (in billions) Institutional Ownership 71% Price / LTM EPS 11.7 X Price / LTM Core EPS (1) 11.3 X Price / 2021 Consensus EPS (2) 13.9 X Price / 2022 Consensus EPS (2) 13.2 X Price / Book Value 1.0 X Price / Tangible Book Value (3) 1.6 X

APPENDIX 46
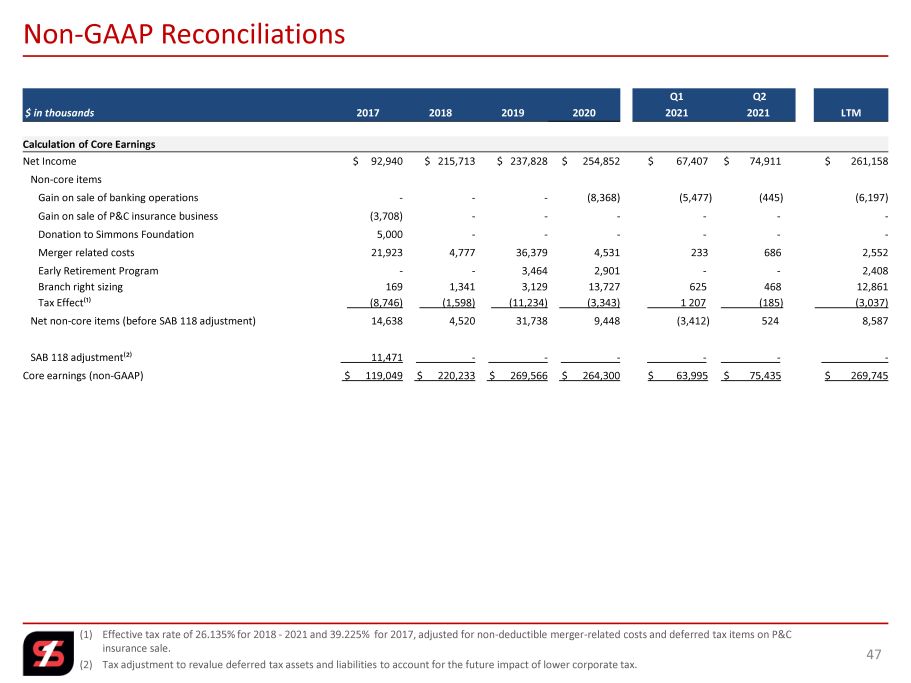
(1) Effective tax rate of 26.135% for 2018 - 2021 and 39.225% for 2017, adjusted for non - deductible merger - related costs and deferr ed tax items on P&C insurance sale. (2) Tax adjustment to revalue deferred tax assets and liabilities to account for the future impact of lower corporate tax. 47 Non - GAAP Reconciliations Q1 Q2 $ in thousands 2017 2018 2019 2020 2021 2021 LTM Calculation of Core Earnings Net Income $ 92,940 $ 215,713 $ 237,828 $ 254,852 $ 67,407 $ 74,911 $ 261,158 Non - core items Gain on sale of banking operations - - - (8,368) (5,477) (445) (6,197) Gain on sale of P&C insurance business (3,708) - - - - - - Donation to Simmons Foundation 5,000 - - - - - - Merger related costs 21,923 4,777 36,379 4,531 233 686 2,552 Early Retirement Program - - 3,464 2,901 - - 2,408 Branch right sizing 169 1,341 3,129 13,727 625 468 12,861 Tax Effect⁽¹⁾ (8,746) (1,598) (11,234) (3,343) 1 207 (185) (3,037) Net non - core items (before SAB 118 adjustment) 14,638 4,520 31,738 9,448 (3,412) 524 8,587 SAB 118 adjustment⁽²⁾ 11,471 - - - - - - Core earnings (non - GAAP) $ 119,049 $ 220,233 $ 269,566 $ 264,300 $ 63,995 $ 75,435 $ 269,745
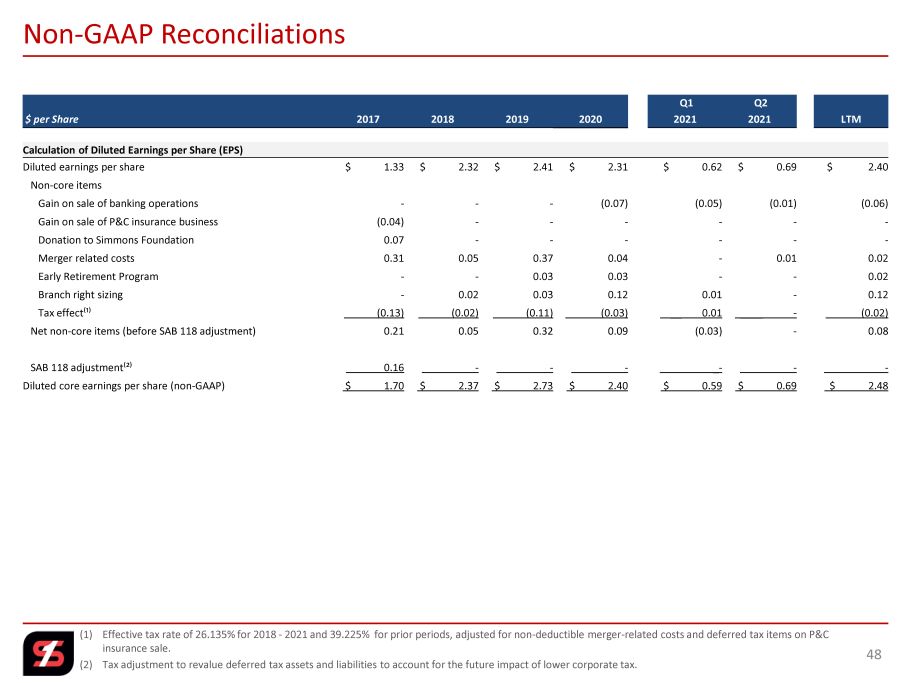
(1) Effective tax rate of 26.135% for 2018 - 2021 and 39.225% for prior periods, adjusted for non - deductible merger - related costs a nd deferred tax items on P&C insurance sale. (2) Tax adjustment to revalue deferred tax assets and liabilities to account for the future impact of lower corporate tax. 48 Non - GAAP Reconciliations Q1 Q2 $ per Share 2017 2018 2019 2020 2021 2021 LTM Calculation of Diluted Earnings per Share (EPS) Diluted earnings per share $ 1.33 $ 2.32 $ 2.41 $ 2.31 $ 0.62 $ 0.69 $ 2.40 Non - core items Gain on sale of banking operations - - - (0.07) (0.05) (0.01) (0.06) Gain on sale of P&C insurance business (0.04) - - - - - - Donation to Simmons Foundation 0.07 - - - - - - Merger related costs 0.31 0.05 0.37 0.04 - 0.01 0.02 Early Retirement Program - - 0.03 0.03 - - 0.02 Branch right sizing - 0.02 0.03 0.12 0.01 - 0.12 Tax effect⁽¹⁾ (0.13) (0.02) (0.11) (0.03) __ 0.01 ____ - (0.02) Net non - core items (before SAB 118 adjustment) 0.21 0.05 0.32 0.09 (0.03) - 0.08 SAB 118 adjustment⁽²⁾ 0.16 - - - _ - - - Diluted core earnings per share (non - GAAP) $ 1.70 $ 2.37 $ 2.73 $ 2.40 $ 0.59 $ 0.69 $ 2.48
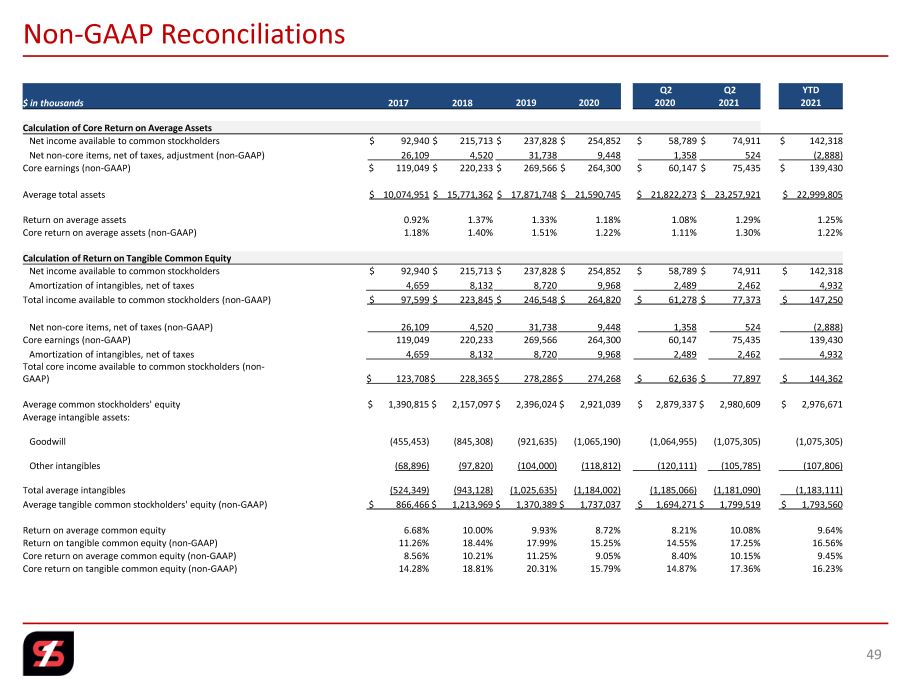
49 Non - GAAP Reconciliations Q2 Q2 YTD $ in thousands 2017 2018 2019 2020 2020 2021 2021 Calculation of Core Return on Average Assets Net income available to common stockholders $ 92,940 $ 215,713 $ 237,828 $ 254,852 $ 58,789 $ 74,911 $ 142,318 Net non - core items, net of taxes, adjustment (non - GAAP) 26,109 4,520 31,738 9,448 1,358 __ 524 __ ____(2,888) Core earnings (non - GAAP) $ 119,049 $ 220,233 $ 269,566 $ 264,300 $ 60,147 $ 75,435 $ 139,430 Average total assets $ 10,074,951 $ 15,771,362 $ 17,871,748 $ 21,590,745 $ 21,822,273 $ 23,257,921 $ 22,999,805 Return on average assets 0.92% 1.37% 1.33% 1.18% 1.08% 1.29% 1.25% Core return on average assets (non - GAAP) 1.18% 1.40% 1.51% 1.22% 1.11% 1.30% 1.22% Calculation of Return on Tangible Common Equity Net income available to common stockholders $ 92,940 $ 215,713 $ 237,828 $ 254,852 $ 58,789 $ 74,911 $ 142,318 Amortization of intangibles, net of taxes 4,659 8,132 8,720 9,968 2,489 2,462 4,932 Total income available to common stockholders (non - GAAP) $ 97,599 $ 223,845 $ 246,548 $ 264,820 $ 61,278 $ 77,373 $ 147,250 Net non - core items, net of taxes (non - GAAP) 26,109 4,520 31,738 9,448 1,358 524 (2,888) Core earnings (non - GAAP) 119,049 220,233 269,566 264,300 60,147 75,435 139,430 Amortization of intangibles, net of taxes 4,659 8,132 8,720 9,968 2,489 2,462 4,932 Total core income available to common stockholders (non - GAAP) $ 123,708 $ 228,365 $ 278,286 $ 274,268 $ 62,636 $ 77,897 $ 144,362 Average common stockholders' equity $ 1,390,815 $ 2,157,097 $ 2,396,024 $ 2,921,039 $ 2,879,337 $ 2,980,609 $ 2,976,671 Average intangible assets: Goodwill (455,453) (845,308) (921,635) (1,065,190) (1,064,955) (1,075,305) (1,075,305) Other intangibles (68,896) (97,820) (104,000) (118,812) (120,111) (105,785) (107,806) Total average intangibles (524,349) (943,128) (1,025,635) (1,184,002) (1,185,066) (1,181,090) ___(1,183,111) Average tangible common stockholders' equity (non - GAAP) $ 866,466 $ 1,213,969 $ 1,370,389 $ 1,737,037 $ 1,694,271 $ 1,799,519 $ 1,793,560 Return on average common equity 6.68% 10.00% 9.93% 8.72% 8.21% 10.08% 9.64% Return on tangible common equity (non - GAAP) 11.26% 18.44% 17.99% 15.25% 14.55% 17.25% 16.56% Core return on average common equity (non - GAAP) 8.56% 10.21% 11.25% 9.05% 8.40% 10.15% 9.45% Core return on tangible common equity (non - GAAP) 14.28% 18.81% 20.31% 15.79% 14.87% 17.36% 16.23%
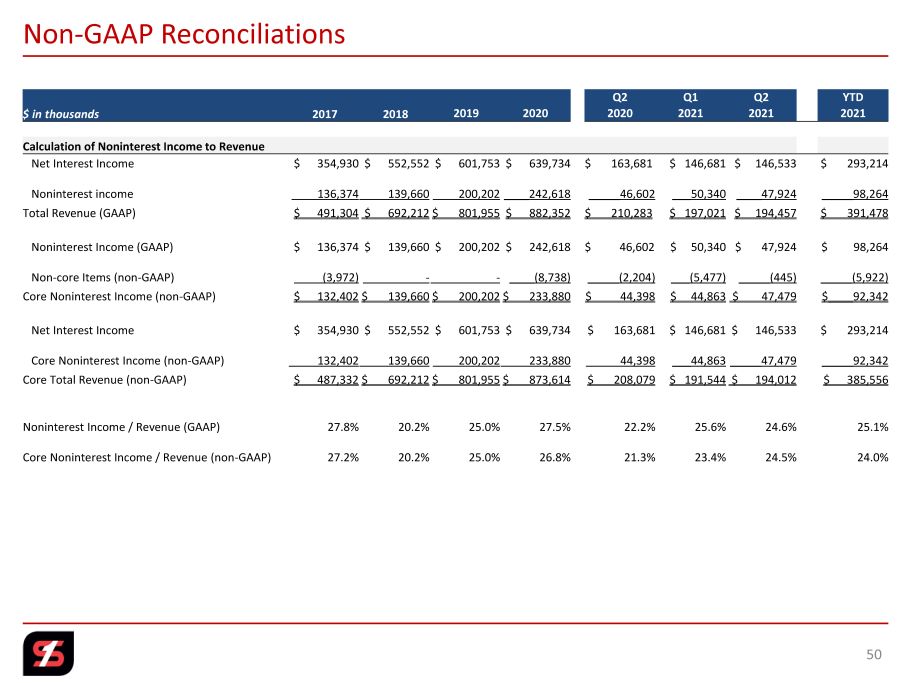
50 Non - GAAP Reconciliations Q2 Q1 Q2 YTD $ in thousands 2017 2018 2019 2020 2020 2021 2021 2021 Calculation of Noninterest Income to Revenue Net Interest Income $ 354,930 $ 552,552 $ 601,753 $ 639,734 $ 163,681 $ 146,681 $ 146,533 $ 293,214 Noninterest income 136,374 139,660 200,202 ____242,618 _____46,602 ___50,340 ____47,924 _____98,264 Total Revenue (GAAP) $ 491,304 $ 692,212 $ 801,955 $ 882,352 $ 210,283 $ 197,021 $ 194,457 $ 391,478 Noninterest Income (GAAP) $ 136,374 $ 139,660 $ 200,202 $ 242,618 $ 46,602 $ 50,340 $ 47,924 $ 98,264 Non - core Items (non - GAAP) (3,972) - - ____(8,738) _____(2,204) ___(5,477) _____(445) _____(5,922) Core Noninterest Income (non - GAAP) $ 132,402 $ 139,660 $ 200,202 $ 233,880 $ 44,398 $ 44,863 $ 47,479 $____92,342 Net Interest Income $ 354,930 $ 552,552 $ 601,753 $ 639,734 $ 163,681 $ 146,681 $ 146,533 $ 293,214 Core Noninterest Income (non - GAAP) 132,402 139,660 200,202 233,880 44,398 ___44,863 _____47,479 _____92,342 Core Total Revenue (non - GAAP) $ 487,332 $ 692,212 $ 801,955 $ 873,614 $ 208,079 $ 191,544 $ 194,012 $ 385,556 Noninterest Income / Revenue (GAAP) 27.8% 20.2% 25.0% 27.5% 22.2% 25.6% 24.6% 25.1% Core Noninterest Income / Revenue (non - GAAP) 27.2% 20.2% 25.0% 26.8% 21.3% 23.4% 24.5% 24.0%
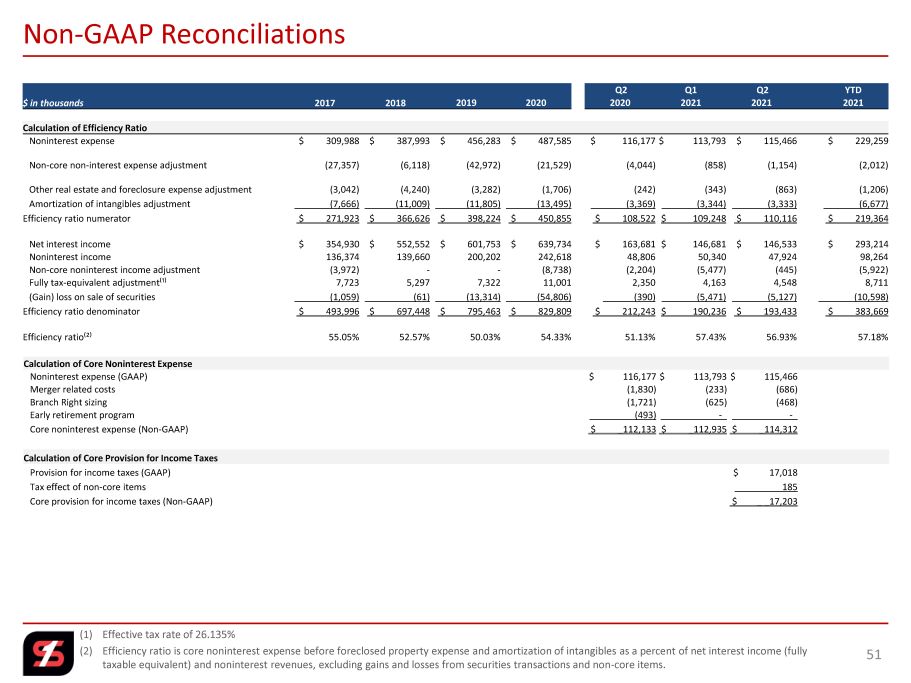
(1) Effective tax rate of 26.135% (2) Efficiency ratio is core noninterest expense before foreclosed property expense and amortization of intangibles as a percent of net interest income (fully taxable equivalent) and noninterest revenues, excluding gains and losses from securities transactions and non - core items. 51 Non - GAAP Reconciliations Q2 Q1 Q2 YTD $ in thousands 2017 2018 2019 2020 2020 2021 2021 2021 Calculation of Efficiency Ratio Noninterest expense $ 309,988 $ 387,993 $ 456,283 $ 487,585 $ 116,177 $ 113,793 $ 115,466 $ 229,259 Non - core non - interest expense adjustment (27,357) (6,118) (42,972) (21,529) (4,044) (858) (1,154) (2,012) Other real estate and foreclosure expense adjustment (3,042) (4,240) (3,282) (1,706) (242) (343) (863) (1,206) Amortization of intangibles adjustment (7,666) (11,009) (11,805) (13,495) (3,369) _______(3,344) (3,333) (6,677) Efficiency ratio numerator $ 271,923 $ 366,626 $ 398,224 $ 450,855 $ 108,522 $ 109,248 $ 110,116 $ 219,364 Net interest income $ 354,930 $ 552,552 $ 601,753 $ 639,734 $ 163,681 $ 146,681 $ 146,533 $ 293,214 Noninterest income 136,374 139,660 200,202 242,618 48,806 50,340 47,924 98,264 Non - core noninterest income adjustment (3,972) - - (8,738) (2,204) (5,477) (445) (5,922) Fully tax - equivalent adjustment⁽¹⁾ 7,723 5,297 7,322 11,001 2,350 4,163 4,548 8,711 (Gain) loss on sale of securities (1,059) (61) (13,314) (54,806) (390) _______(5,471) (5,127) (10,598) Efficiency ratio denominator $ 493,996 $ 697,448 $ 795,463 $ 829,809 $ 212,243 $ 190,236 $ 193,433 $ 383,669 Efficiency ratio⁽²⁾ 55.05% 52.57% 50.03% 54.33% 51.13% 57.43% 56.93% 57.18% Calculation of Core Noninterest Expense Noninterest expense (GAAP) $ 116,177 $ 113,793 $ 115,466 Merger related costs (1,830) (233) (686) Branch Right sizing (1,721) (625) (468) Early retirement program _________(493) ___________ - _ ___________ - _ Core noninterest expense (Non - GAAP) $ _112,133 $ _112,935 $ _114,312 Calculation of Core Provision for Income Taxes Provision for income taxes (GAAP) $ 17,018 Tax effect of non - core items _________185 Core provision for income taxes (Non - GAAP) $ _ _17,203
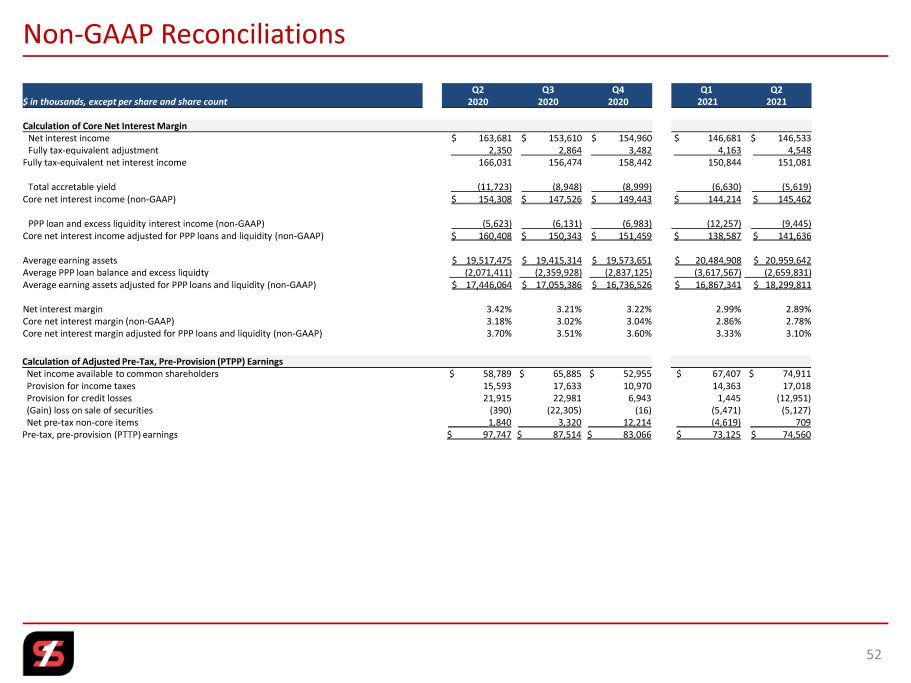
52 Non - GAAP Reconciliations Q2 Q3 Q4 Q1 Q2 $ in thousands, except per share and share count 2020 2020 2020 2021 2021 Calculation of Core Net Interest Margin Net interest income $ 163,681 $ 153,610 $ 154,960 $ 146,681 $ 146,533 Fully tax - equivalent adjustment 2,350 2,864 3,482 4,163 _______4,548 Fully tax - equivalent net interest income 166,031 156,474 158,442 150,844 151,081 Total accretable yield (11,723) (8,948) (8,999) (6,630) ______(5,619) Core net interest income (non - GAAP) $ 154,308 $ 147,526 $ 149,443 $ 144,214 $ 145,462 PPP loan and excess liquidity interest income (non - GAAP) (5,623) (6,131) (6,983) (12,257) (9,445) Core net interest income adjusted for PPP loans and liquidity (non - GAAP) $ 160,408 $ 150,343 $ 151,459 $ 138,587 $ 141,636 Average earning assets $ 19,517,475 $ 19,415,314 $ 19,573,651 $ 20,484,908 $ 20,959,642 Average PPP loan balance and excess liquidty (2,071,411) (2,359,928) (2,837,125) (3,617,567) (2,659,831) Average earning assets adjusted for PPP loans and liquidity (non - GAAP) $ 17,446,064 $ 17,055,386 $ 16,736,526 $ 16,867,341 $ 18,299,811 Net interest margin 3.42% 3.21% 3.22% 2.99% 2.89% Core net interest margin (non - GAAP) 3.18% 3.02% 3.04% 2.86% 2.78% Core net interest margin adjusted for PPP loans and liquidity (non - GAAP) 3.70% 3.51% 3.60% 3.33% 3.10% Calculation of Adjusted Pre - Tax, Pre - Provision (PTPP) Earnings Net income available to common shareholders $ 58,789 $ 65,885 $ 52,955 $ 67,407 $ 74,911 Provision for income taxes 15,593 17,633 10,970 14,363 17,018 Provision for credit losses 21,915 22,981 6,943 1,445 (12,951) (Gain) loss on sale of securities (390) (22,305) (16) (5,471) (5,127) Net pre - tax non - core items ________1,840 ________3,320 _______12,214 _______(4,619) _________709 Pre - tax, pre - provision (PTTP) earnings $ 97,747 $ 87,514 $ 83,066 $ 73,125 $ 74,560
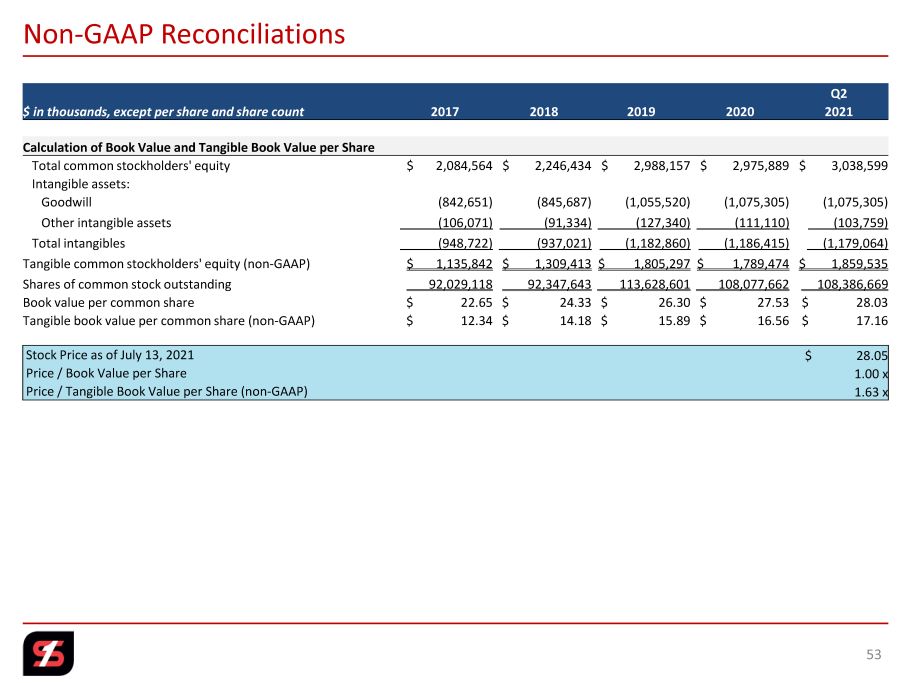
53 Non - GAAP Reconciliations Q2 $ in thousands, except per share and share count 2017 2018 2019 2020 2021 Calculation of Book Value and Tangible Book Value per Share Total common stockholders' equity $ 2,084,564 $ 2,246,434 $ 2,988,157 $ 2,975,889 $ 3,038,599 Intangible assets: Goodwill (842,651) (845,687) (1,055,520) (1,075,305) (1,075,305) Other intangible assets (106,071) (91,334) (127,340) (111,110) (103,759) Total intangibles (948,722) (937,021) (1,182,860) (1,186,415) (1,179,064) Tangible common stockholders' equity (non - GAAP) $ 1,135,842 $ 1,309,413 $ 1,805,297 $ 1,789,474 $ 1,859,535 Shares of common stock outstanding 92,029,118 92,347,643 113,628,601 108,077,662 108,386,669 Book value per common share $ 22.65 $ 24.33 $ 26.30 $ 27.53 $ 28.03 Tangible book value per common share (non - GAAP) $ 12.34 $ 14.18 $ 15.89 $ 16.56 $ 17.16 Stock Price as of July 13, 2021 $ 28.05 Price / Book Value per Share 1.00 x Price / Tangible Book Value per Share (non - GAAP) 1.63 x
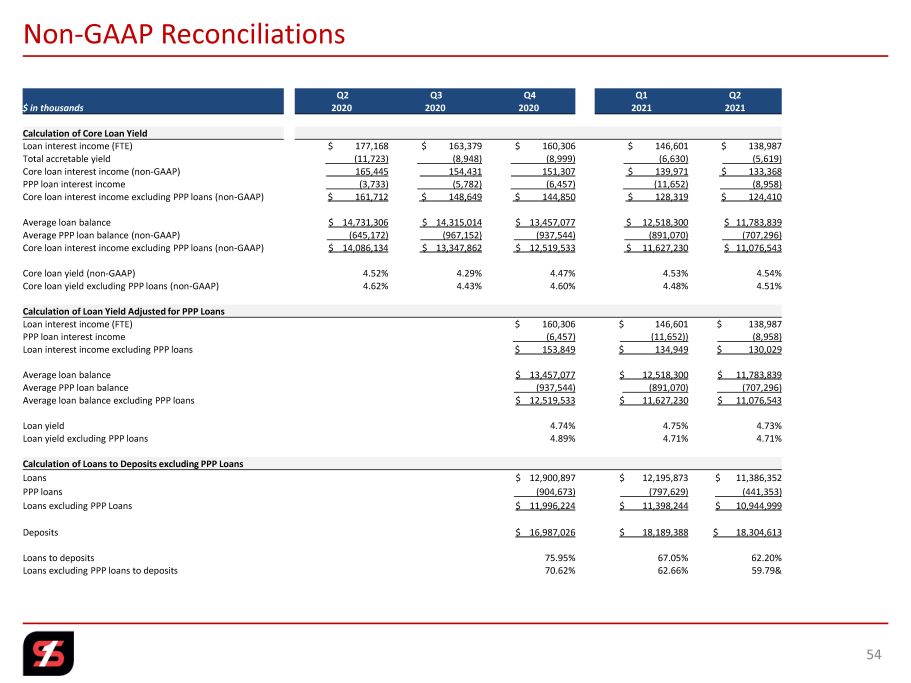
54 Non - GAAP Reconciliations Q2 Q3 Q4 Q1 Q2 $ in thousands 2020 2020 2020 2021 2021 Calculation of Core Loan Yield Loan interest income (FTE) $ 177,168 $ 163,379 $ 160,306 $ 146,601 $ 138,987 Total accretable yield (11,723) (8,948) (8,999) (6,630) ______(5,619) Core loan interest income (non - GAAP) 165,445 154,431 151,307 $ 139,971 $ 133,368 PPP loan interest income (3,733) (5,782) (6,457) (11,652) ______(8,958) Core loan interest income excluding PPP loans (non - GAAP) $ 161,712 $ 148,649 $ 144,850 $ 128,319 $ 124,410 Average loan balance $ 14,731,306 $ 14,315,014 $ 13,457,077 $ 12,518,300 $ 11,783,839 Average PPP loan balance (non - GAAP) (645,172) (967,152) (937,544) (891,070) ____(707,296) Core loan interest income excluding PPP loans (non - GAAP) $ 14,086,134 $ 13,347,862 $ 12,519,533 $ 11,627,230 $ 11,076,543 Core loan yield (non - GAAP) 4.52% 4.29% 4.47% 4.53% 4.54% Core loan yield excluding PPP loans (non - GAAP) 4.62% 4.43% 4.60% 4.48% 4.51% Calculation of Loan Yield Adjusted for PPP Loans Loan interest income (FTE) $ 160,306 $ 146,601 $ 138,987 PPP loan interest income (6,457) (11,652)) _______(8,958) Loan interest income excluding PPP loans $ 153,849 $ 134,949 $ 130,029 Average loan balance $ 13,457,077 $ 12,518,300 $ 11,783,839 Average PPP loan balance (937,544) (891,070) _____(707,296) Average loan balance excluding PPP loans $ 12,519,533 $ 11,627,230 $ 11,076,543 Loan yield 4.74% 4.75% 4.73% Loan yield excluding PPP loans 4.89% 4.71% 4.71% Calculation of Loans to Deposits excluding PPP Loans Loans $ 12,900,897 $ 12,195,873 $ 11,386,352 PPP loans (904,673) (797,629) _____(441,353) Loans excluding PPP Loans $ 11,996,224 $ 11,398,244 $ 10,944,999 Deposits $ 16,987,026 $ 18,189,388 $ 18,304,613 Loans to deposits 75.95% 67.05% 62.20% Loans excluding PPP loans to deposits 70.62% 62.66% 59.79&
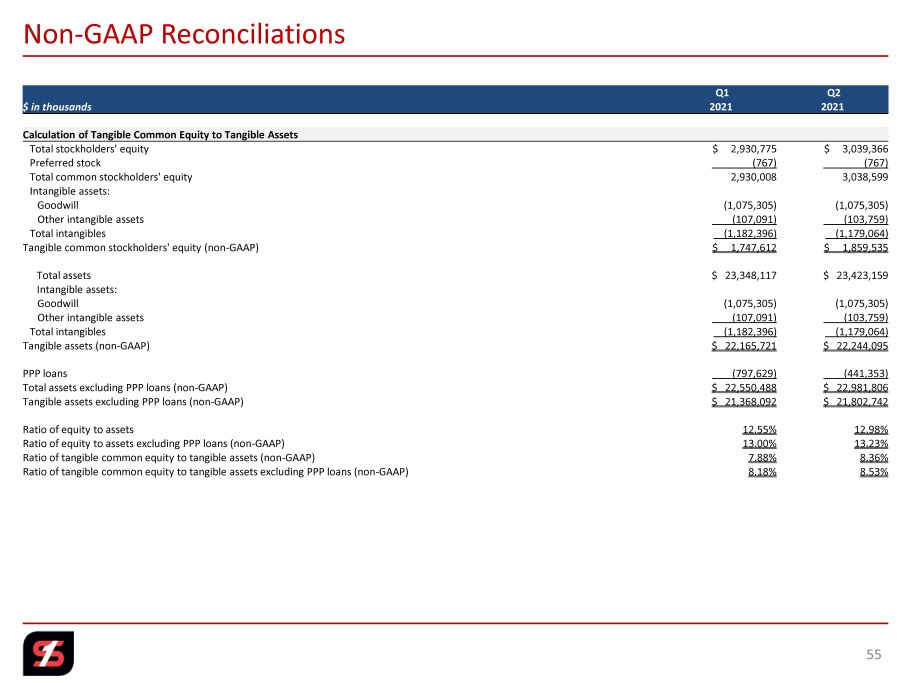
Non - GAAP Reconciliations 55 Q1 Q2 $ in thousands 2021 2021 Calculation of Tangible Common Equity to Tangible Assets Total stockholders' equity $ 2,930,775 $ 3,039,366 Preferred stock (767) (767) Total common stockholders' equity 2,930,008 3,038,599 Intangible assets: Goodwill (1,075,305) (1,075,305) Other intangible assets (107,091) (103,759) Total intangibles (1,182,396) (1,179,064) Tangible common stockholders' equity (non - GAAP) $ 1,747,612 $ 1,859,535 Total assets $ 23,348,117 $ 23,423,159 Intangible assets: Goodwill (1,075,305) (1,075,305) Other intangible assets (107,091) (103,759) Total intangibles (1,182,396) (1,179,064) Tangible assets (non - GAAP) $ 22,165,721 $ 22,244,095 PPP loans (797,629) (441,353) Total assets excluding PPP loans (non - GAAP) $ 22,550,488 $ 22,981,806 Tangible assets excluding PPP loans (non - GAAP) $ 21,368,092 $ 21,802,742 Ratio of equity to assets 12.55% 12.98% Ratio of equity to assets excluding PPP loans (non - GAAP) 13.00% 13.23% Ratio of tangible common equity to tangible assets (non - GAAP) 7.88% 8.36% Ratio of tangible common equity to tangible assets excluding PPP loans (non - GAAP) 8.18% 8.53%
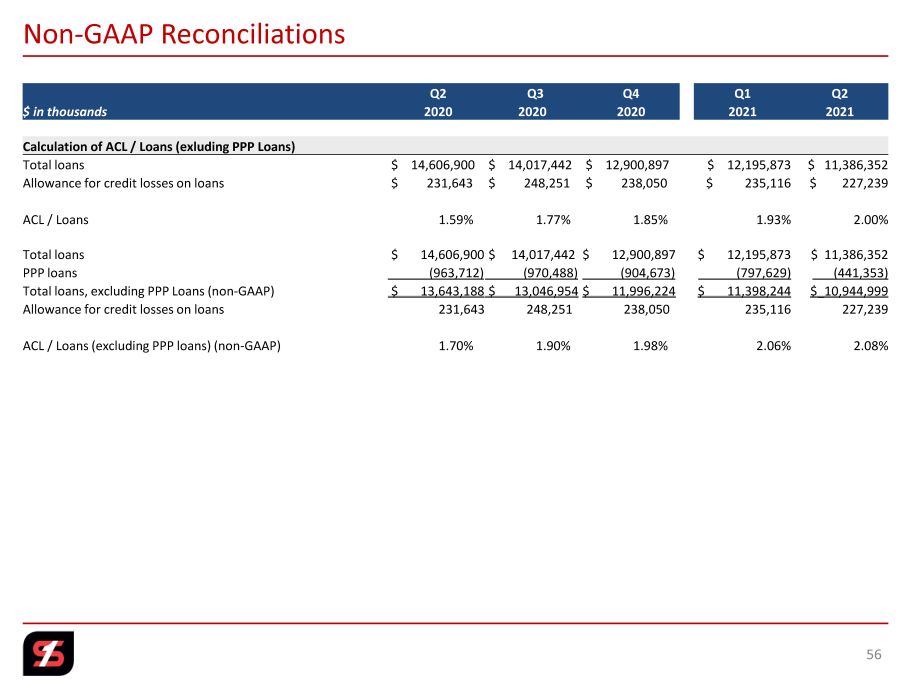
Non - GAAP Reconciliations 56 Q2 Q3 Q4 Q1 Q2 $ in thousands 2020 2020 2020 2021 2021 Calculation of ACL / Loans (exluding PPP Loans) Total loans $ 14,606,900 $ 14,017,442 $ 12,900,897 $ 12,195,873 $ 11,386,352 Allowance for credit losses on loans $ 231,643 $ 248,251 $ 238,050 $ 235,116 $ 227,239 ACL / Loans 1.59% 1.77% 1.85% 1.93% 2.00% Total loans $ 14,606,900 $ 14,017,442 $ 12,900,897 $ 12,195,873 $ 11,386,352 PPP loans (963,712) (970,488) (904,673) (797,629) ___(441,353) Total loans, excluding PPP Loans (non - GAAP) $ 13,643,188 $ 13,046,954 $ 11,996,224 $ 11,398,244 $_10,944,999 Allowance for credit losses on loans 231,643 248,251 238,050 235,116 227,239 ACL / Loans (excluding PPP loans) (non - GAAP) 1.70% 1.90% 1.98% 2.06% 2.08%
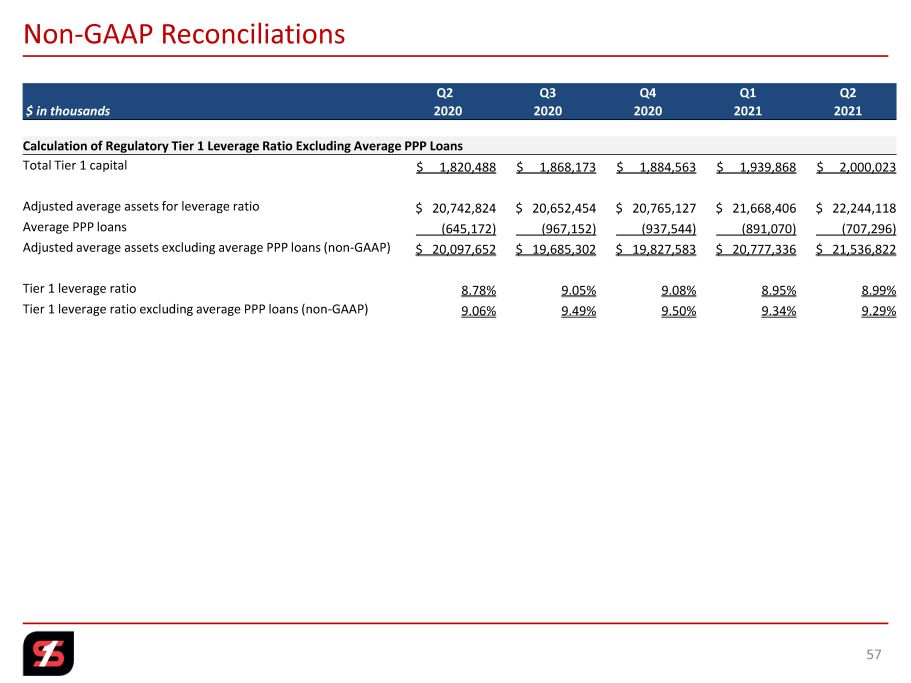
Non - GAAP Reconciliations 57 Q2 Q3 Q4 Q1 Q2 $ in thousands 2020 2020 2020 2021 2021 Calculation of Regulatory Tier 1 Leverage Ratio Excluding Average PPP Loans Total Tier 1 capital $ 1,820,488 $ 1,868,173 $ 1,884,563 $ 1,939,868 $ 2,000,023 Adjusted average assets for leverage ratio $ 20,742,824 $ 20,652,454 $ 20,765,127 $ 21,668,406 $ 22,244,118 Average PPP loans (645,172) (967,152) (937,544) (891,070) (707,296) Adjusted average assets excluding average PPP loans (non - GAAP) $ 20,097,652 $ 19,685,302 $ 19,827,583 $ 20,777,336 $ 21,536,822 Tier 1 leverage ratio 8.78% 9.05% 9.08% 8.95% 8.99% Tier 1 leverage ratio excluding average PPP loans (non - GAAP) 9.06% 9.49% 9.50% 9.34% 9.29%

Contents 4 Q2 Key Highlights 5 Q2 Results Overview 14 Loans 21 Deposits, Liquidity, Investments
& Capital 27 Credit Quality 32 Performance Trends 38 Corporate Profile 46 Appendix 2 nd Quarter 2021 Investor Presentation | NASDAQ: SFNC