Attached files
| file | filename |
|---|---|
| EX-32.2 - EXHIBIT 32.2 - Medalist Diversified REIT, Inc. | tm2111666d1_ex32-2.htm |
| EX-32.1 - EXHIBIT 32.1 - Medalist Diversified REIT, Inc. | tm2111666d1_ex32-1.htm |
| EX-31.2 - EXHIBIT 31.2 - Medalist Diversified REIT, Inc. | tm2111666d1_ex31-2.htm |
| EX-31.1 - EXHIBIT 31.1 - Medalist Diversified REIT, Inc. | tm2111666d1_ex31-1.htm |
UNITED STATES
SECURITIES AND EXCHANGE COMMISSION
WASHINGTON, D.C. 20549
FORM 10-Q
(Mark One)
| x | QUARTERLY REPORT PURSUANT TO SECTION 13 OR 15(d) OF THE SECURITIES EXCHANGE ACT OF 1934 |
For the quarterly period ended March 31, 2021
OR
| ¨ | TRANSITION REPORT PURSUANT TO SECTION 13 OR 15(d) OF THE SECURITIES EXCHANGE ACT OF 1934 |
For the transition period from ________ to ________
Commission file no: 001-38719
MEDALIST DIVERSIFIED REIT, INC.
| Maryland | 47-5201540 | |
(State or other jurisdiction of incorporation) |
(IRS Employer Identification No.) |
1051 E. Cary Street Suite 601
James Center Three
Richmond, VA, 23219
(Address of principal executive offices) (Zip Code)
Registrant’s telephone number, including area code: (804) 344-4435
| Title of Each Class | Name of each Exchange on Which Registered |
Trading Symbol(s) | ||
| Common Stock, $0.01 par value per share | The Nasdaq Capital Market | MDRR | ||
| 8.0%
Series A Cumulative Redeemable Preferred Stock, $0.01 par value per share |
The Nasdaq Capital Market | MDRRP |
Indicate by check mark whether the registrant: (1) has filed all reports required to be filed by Section 13 or 15(d) of the Securities Exchange Act of 1934 during the preceding 12 months (or for such shorter period that the registrant was required to file such reports), and (2) has been subject to such filing requirements for the past 90 days. Yes x No ¨
Indicate by check mark whether the registrant has submitted electronically and posted on its corporate Web site, if any, every Interactive Data File required to be submitted and posted pursuant to Rule 405 of Regulation S-T (§232.405 of this chapter) during the preceding 12 months (or for such shorter period that the registrant was required to submit and post such files). x Yes No ¨
Indicate by check mark whether the registrant is a large accelerated filer, an accelerated filer, a non-accelerated filer, smaller reporting company, or an emerging growth company. See the definitions of “large accelerated filer,” “accelerated filer,” “smaller reporting company,” and “emerging growth company” in Rule 12b-2 of the Exchange Act.
| Large accelerated filer | ¨ | Accelerated filer | ¨ | |||
| Non-accelerated filer | x | Smaller reporting company | x | |||
| Emerging growth company | x | |||||
If an emerging growth company, indicate by check mark if the registrant has elected not to use the extended transition period for complying with any new or revised financial accounting standards provided pursuant to Section 13(a) of the Exchange Act ¨
Indicate by check mark whether the registrant is a shell company (as defined in Rule 12b-2 of the Exchange Act). Yes ¨ No x
The number of shares of Common Stock, $0.01 par value, of the registrant outstanding at May 14, 2021 was 16,052,617.
Medalist Diversified REIT, Inc.
Quarterly Report on Form 10-Q
For the Quarter Ended March 31, 2021
Table of Contents
2
| PART I. | FINANCIAL INFORMATION |
| Item 1. | Financial Statements |
Medalist Diversified REIT, Inc. and Subsidiaries
Condensed Consolidated Balance Sheets
| March 31, 2021 | Dec. 31, 2020 | |||||||
| (Unaudited) | ||||||||
| ASSETS | ||||||||
| Investment properties, net | $ | 46,962,683 | $ | 57,055,862 | ||||
| Cash | 3,681,292 | 2,862,994 | ||||||
| Restricted cash | 2,669,952 | 2,233,934 | ||||||
| Rent and other receivables, net of allowance of $0 and $4,693, as of March 31, 2021 and December 31, 2020, respectively | 347,957 | 458,752 | ||||||
| Assets held for sale | 22,093,805 | 12,410,250 | ||||||
| Unbilled rent | 761,820 | 673,728 | ||||||
| Intangible assets, net | 3,004,290 | 3,256,362 | ||||||
| Other assets | 608,414 | 319,890 | ||||||
| Total Assets | $ | 80,130,213 | $ | 79,271,772 | ||||
| LIABILITIES | ||||||||
| Accounts payable and accrued liabilities | $ | 1,683,755 | $ | 1,308,056 | ||||
| Intangible liabilities, net | 972,121 | 1,022,497 | ||||||
| Line of credit, short term, net | 325,000 | 325,000 | ||||||
| Notes payable | 176,300 | 176,300 | ||||||
| Convertible debentures, net | 986,837 | 2,260,565 | ||||||
| Mortgages payable, net | 40,380,026 | 48,094,354 | ||||||
| Mortgages payable, net, associated with assets held for sale | 17,976,368 | 10,352,000 | ||||||
| Mandatorily redeemable preferred stock, net | 4,072,706 | 4,023,257 | ||||||
| Total Liabilities | $ | 66,573,113 | $ | 67,562,029 | ||||
| EQUITY | ||||||||
| Common stock, 6,945,476 and 4,803,287 shares issued and outstanding at March 31, 2021 and December 31, 2020, respectively | 69,453 | 48,032 | ||||||
| Additional paid-in capital | 37,316,979 | 33,105,099 | ||||||
| Offering costs | (3,058,559 | ) | (2,992,357 | ) | ||||
| Accumulated deficit | (21,576,511 | ) | (19,298,987 | ) | ||||
| Total Stockholders’ Equity | 12,751,362 | 10,861,787 | ||||||
| Noncontrolling interests - Hampton Inn Property | (249,621 | ) | (224,383 | ) | ||||
| Noncontrolling interests - Hanover Square Property | 170,764 | 189,784 | ||||||
| Noncontrolling interests - Operating Partnership | 884,595 | 882,555 | ||||||
| Total Equity | $ | 13,557,100 | $ | 11,709,743 | ||||
| Total Liabilities and Equity | $ | 80,130,213 | $ | 79,271,772 | ||||
See notes to condensed consolidated financial statements
| 3 |
Medalist Diversified REIT, Inc. and Subsidiaries
Condensed Consolidated Statements of Operations
(Unaudited)
| Three Months Ended March 31, | ||||||||
| 2021 | 2020 | |||||||
| REVENUE | ||||||||
| Retail center property revenues | $ | 1,010,293 | $ | 1,130,503 | ||||
| Retail center property tenant reimbursements | 183,348 | 245,787 | ||||||
| Flex center property revenues | 139,704 | 139,989 | ||||||
| Flex center property tenant reimbursements | 43,123 | 55,163 | ||||||
| Hotel property room revenues | 1,286,748 | 888,550 | ||||||
| Hotel property other revenues | 8,637 | 68,318 | ||||||
| Total Revenue | $ | 2,671,853 | $ | 2,528,310 | ||||
| OPERATING EXPENSES | ||||||||
| Retail center property operating expenses | $ | 327,930 | $ | 355,597 | ||||
| Flex center property operating expenses | 54,088 | 52,559 | ||||||
| Hotel property operating expenses | 797,395 | 962,696 | ||||||
| Bad debt expense | 3,196 | 6,003 | ||||||
| Share based compensation expenses | 149,981 | 569,995 | ||||||
| Legal, accounting and other professional fees | 498,612 | 402,795 | ||||||
| Corporate general and administrative expenses | 62,380 | 75,388 | ||||||
| Depreciation and amortization | 653,233 | 1,017,407 | ||||||
| Total Operating Expenses | 2,546,815 | 3,442,440 | ||||||
| Operating income (loss) | 125,038 | (914,130 | ) | |||||
| Interest expense | 2,434,132 | 918,132 | ||||||
| Net Loss from Operations | (2,309,094 | ) | (1,832,262 | ) | ||||
| Other income (loss) | 1,352 | (918 | ) | |||||
| Net Loss | (2,307,742 | ) | (1,833,180 | ) | ||||
| Less: Net loss attributable to Hampton Inn Property noncontrolling interests | (25,238 | ) | (84,960 | ) | ||||
| Less: Net (loss) income attributable to Hanover Square Property noncontrolling interests | (7,020 | ) | 4,966 | |||||
| Less: Net income (loss) attributable to Operating Partnership noncontrolling interests | 2,040 | (28,893 | ) | |||||
| Net Loss Attributable to Medalist Common Shareholders | $ | (2,277,524 | ) | $ | (1,724,293 | ) | ||
| Loss per share from operations - basic and diluted | $ | (0.39 | ) | $ | (0.38 | ) | ||
| Weighted-average number of shares - basic and diluted | 5,856,365 | 4,553,440 | ||||||
| Dividends paid per common share | $ | - | $ | 0.125 | ||||
See notes to condensed consolidated financial statements
| 4 |
Medalist Diversified REIT, Inc. and Subsidiaries
Condensed Consolidated Statement of Equity
For the three months ended March 31, 2021 and 2020
(Unaudited)
| Common Stock | Noncontrolling Interests | |||||||||||||||||||||||||||||||||||||||
| Shares | Par Value | Additional Paid in Capital | Offering Costs | Accumulated Deficit | Total Shareholders’ Equity | Hampton Inn Property | Hanover Square Property | Operating Partnership | Total Equity | |||||||||||||||||||||||||||||||
| Balance, January 1, 2021 | 4,803,287 | $ | 48,032 | $ | 33,105,099 | $ | (2,992,357 | ) | $ | (19,298,987 | ) | $ | 10,861,787 | $ | (224,383 | ) | $ | 189,784 | $ | 882,555 | $ | 11,709,743 | ||||||||||||||||||
| Common stock issuances | 2,074,933 | $ | 20,748 | $ | 3,778,520 | $ | - | $ | - | $ | 3,799,268 | $ | - | $ | - | $ | - | $ | 3,799,268 | |||||||||||||||||||||
| Share based compensation | 67,256 | 673 | 149,308 | - | - | 149,981 | - | - | - | 149,981 | ||||||||||||||||||||||||||||||
| Convertible debenture beneficial conversion feature | - | - | 284,052 | - | - | 284,052 | - | - | - | 284,052 | ||||||||||||||||||||||||||||||
| Offering costs | - | - | - | (66,202 | ) | - | (66,202 | ) | - | - | - | (66,202 | ) | |||||||||||||||||||||||||||
| Net (loss) income | - | - | - | - | (2,277,524 | ) | (2,277,524 | ) | (25,238 | ) | (7,020 | ) | 2,040 | (2,307,742 | ) | |||||||||||||||||||||||||
| Dividends and distributions | - | - | - | - | - | - | - | (12,000 | ) | - | (12,000 | ) | ||||||||||||||||||||||||||||
| Balance, March 31, 2021 | 6,945,476 | $ | 69,453 | $ | 37,316,979 | $ | (3,058,559 | ) | $ | (21,576,511 | ) | $ | 12,751,362 | $ | (249,621 | ) | $ | 170,764 | $ | 884,595 | $ | 13,557,100 | ||||||||||||||||||
| Balance January 1, 2020 | 4,500,144 | $ | 45,001 | $ | 31,702,347 | $ | (2,992,357 | ) | $ | (10,555,841 | ) | $ | 18,199,150 | $ | 1,282,782 | $ | 540,791 | $ | 830,512 | $ | 20,853,235 | |||||||||||||||||||
| Share based compensation | 247,824 | $ | 2,478 | $ | 567,517 | $ | - | $ | - | $ | 569,995 | $ | - | $ | - | $ | - | $ | 569,995 | |||||||||||||||||||||
| Offering costs | - | - | - | - | - | - | - | - | - | - | ||||||||||||||||||||||||||||||
| Net (loss) income | - | - | - | - | (1,724,293 | ) | (1,724,293 | ) | (84,960 | ) | 4,966 | (28,893 | ) | (1,833,180 | ) | |||||||||||||||||||||||||
| Dividends and distributions | - | - | - | - | (562,537 | ) | (562,537 | ) | - | (20,800 | ) | (27,356 | ) | (610,693 | ) | |||||||||||||||||||||||||
| Non-controlling interests | - | - | - | - | - | - | (375,400 | ) | - | 375,400 | - | |||||||||||||||||||||||||||||
| Balance, March 31, 2020 | 4,747,968 | $ | 47,479 | $ | 32,269,864 | $ | (2,992,357 | ) | $ | (12,842,671 | ) | $ | 16,482,315 | $ | 822,422 | $ | 524,957 | $ | 1,149,663 | $ | 18,979,357 | |||||||||||||||||||
See notes to condensed consolidated financial statements
| 5 |
Medalist Diversified REIT, Inc. and Subsidiaries
Condensed Consolidated Statements of Cash Flows
(Unaudited)
| Three Months Ended March 31, | ||||||||
| 2021 | 2020 | |||||||
| CASH FLOWS FROM OPERATING ACTIVITIES | ||||||||
| Net Loss | $ | (2,307,742 | ) | $ | (1,833,180 | ) | ||
| Adjustments to reconcile consolidated net loss to net cash flows from operating activities | ||||||||
| Depreciation | 454,774 | 767,314 | ||||||
| Amortization | 198,459 | 250,093 | ||||||
| Loan cost amortization | 44,190 | 82,345 | ||||||
| Mandatorily redeemable preferred stock issuance cost and discount amortization | 49,449 | 7,128 | ||||||
| Convertible debenture issuance cost, discount and beneficial conversion feature amortization | 1,455,324 | 13,171 | ||||||
| Amortization of tenant inducements | - | 4,260 | ||||||
| Above (below) market lease amortization, net | 3,237 | 3,093 | ||||||
| Bad debt expense | 3,196 | 6,003 | ||||||
| Share-based compensation | 149,981 | 569,995 | ||||||
| Changes in assets and liabilities | ||||||||
| Rent and other receivables, net | 107,599 | (5,056 | ) | |||||
| Unbilled rent | (88,092 | ) | (43,834 | ) | ||||
| Other assets | (288,524 | ) | 34,178 | |||||
| Accounts payable and accrued liabilities | 424,967 | 161,274 | ||||||
| Net cash flows from operating activities | 206,818 | 16,784 | ||||||
| CASH FLOWS FROM INVESTING ACTIVITIES | ||||||||
| Capital expenditures | (45,150 | ) | (163,246 | ) | ||||
| Net cash flows from investing activities | (45,150 | ) | (163,246 | ) | ||||
| CASH FLOWS FROM FINANCING ACTIVITIES | ||||||||
| Dividends and distributions paid | (12,000 | ) | (610,693 | ) | ||||
| Proceeds from line of credit, short term, net | - | 550,000 | ||||||
| Repayment of line of credit, short term | - | (2,000,000 | ) | |||||
| Repayment of related party notes payable, short term | - | (852,000 | ) | |||||
| Repayment of mortgages payable | (134,150 | ) | (50,924 | ) | ||||
| Proceeds from sale of mandatorily preferred stock, net of capitalized offering costs | - | 3,860,882 | ||||||
| Proceeds from sale of convertible debentures, net of capitalized offering costs | 1,305,000 | - | ||||||
| Offering costs paid related to common stock offering | (66,202 | ) | - | |||||
| Net cash flows from investing activities | 1,092,648 | 897,265 | ||||||
| INCREASE IN CASH, CASH EQUIVALENTS AND RESTRICTED CASH | 1,254,316 | 750,803 | ||||||
| CASH, CASH EQUIVALENTS AND RESTRICTED CASH, beginning of period | 5,096,928 | 2,072,190 | ||||||
| CASH, CASH EQUIVALENTS AND RESTRICTED CASH, end of period | $ | 6,351,244 | $ | 2,822,993 | ||||
| CASH AND CASH EQUIVALENTS, end of period, shown in condensed consolidated balance sheets | 3,681,292 | 701,719 | ||||||
| RESTRICTED CASH including assets restricted for capital and operating reserves and tenant deposits, end of period, shown in condensed consolidated balance sheets | 2,669,952 | 2,121,274 | ||||||
| CASH, CASH EQUIVALENTS AND RESTRICTED CASH, end of period shown in the condensed consolidated statements of cash flows | $ | 6,351,244 | $ | 2,822,993 | ||||
| - | ||||||||
| Supplemental Disclosures and Non-Cash Activities: | ||||||||
| Other cash transactions: | ||||||||
| Interest paid | $ | 897,369 | $ | 733,113 | ||||
| Non-cash transactions: | ||||||||
| Conversion of convertible debentures and accrued interest to common stock | $ | 3,799,268 | $ | - | ||||
| Transfer of investment properties, net to assets held for sale, net | 9,683,555 | - | ||||||
| Transfer of mortgages payable, net to mortgages payable associated with assets held for sale, net | 7,592,931 | - | ||||||
| Exchange for 7.55 percent of the noncontrolling interest in the Hampton Inn Property | - | 867,000 | ||||||
| Issuance of operating partnership interests in exchange for 3.45 percent of the noncontrolling interest in the Hampton Inn Property | - | 375,400 | ||||||
See notes to condensed consolidated financial statements
| 6 |
Medalist Diversified REIT, Inc. and Subsidiaries
Notes to Condensed Consolidated Financial Statements
| 1. | Organization and Basis of Presentation and Consolidation |
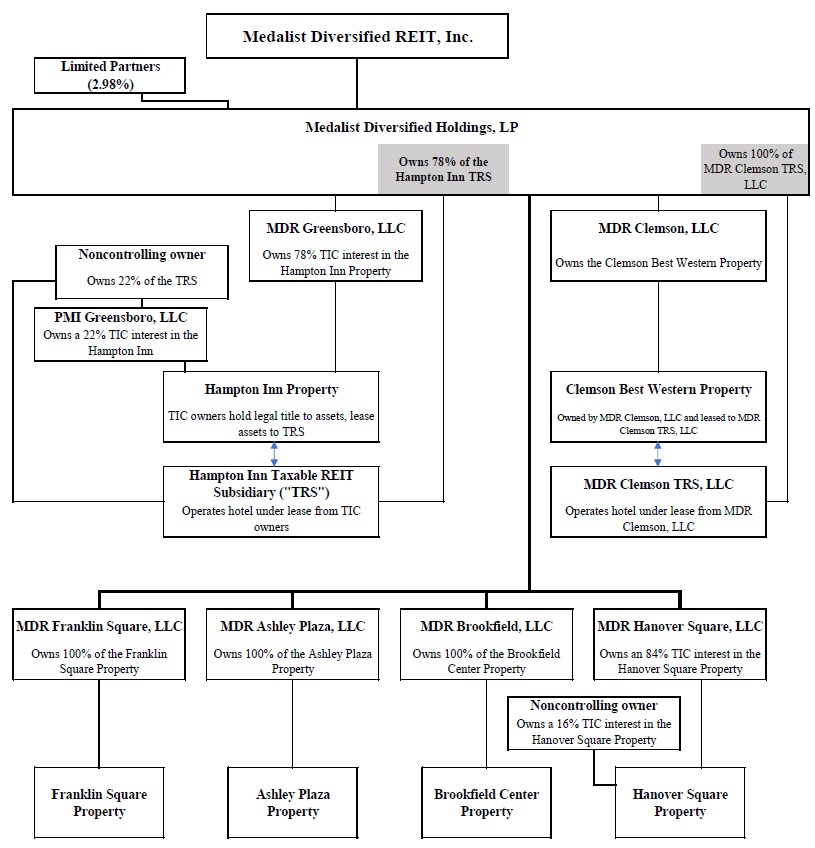
Medalist Diversified Real Estate Investment Trust, Inc. (the “REIT”) is a Maryland corporation formed on September 28, 2015. Beginning with the taxable year ended December 31, 2017, the REIT has elected to be taxed as a real estate investment trust for federal income tax purposes. The REIT serves as the general partner of Medalist Diversified Holdings, LP (the “Operating Partnership”) which was formed as a Delaware limited partnership on September 29, 2015. As of March 31, 2021, the REIT, through the Operating Partnership, owned and operated six properties, the Shops at Franklin Square, a 134,239 square foot retail property located in Gastonia, North Carolina (the “Franklin Square Property”), the Greensboro Airport Hampton Inn, a hotel with 125 rooms on 2.162 acres in Greensboro, North Carolina (the “Hampton Inn Property”), the Shops at Hanover Square North (the “Hanover Square Property”), a 73,440 square foot retail property located in Mechanicsville, Virginia, the Ashley Plaza Shopping Center (the “Ashley Plaza Property”), a 160,356 square foot retail property located in Goldsboro, North Carolina, the Clemson Best Western University Inn (the “Clemson Best Western Property”), a hotel with 148 rooms on 5.92 acres in Clemson, South Carolina and Brookfield Center, a 64,880 square foot mixed-use industrial/office property located in Greenville, South Carolina (the “Brookfield Center Property”). As of March 31, 2021, the Company owned 78 percent of the Hampton Inn Property as a tenant in common with a noncontrolling owner which owns the remaining 22 percent interest. The Company owns 84 percent of the Hanover Square Property as a tenant in common with a noncontrolling owner which owns the remaining 16 percent interest.
The use of the word “Company” refers to the REIT and its consolidated subsidiaries, except where the context otherwise requires. The Company includes the REIT, the Operating Partnership, wholly owned limited liability corporations which own or operate the properties, and the taxable REIT subsidiaries which operate the Hampton Inn Property and the Clemson Best Western Property. As a REIT, certain tax laws limit the amount of “non-qualifying” income that Company can earn, including income derived directly from the operation of hotels. As a result, the Company and, in the case of the Hampton Inn Property, the tenant in common (“TIC”) noncontrolling owner, leases its consolidated hotel properties to taxable REIT subsidiaries (“TRS”) for federal income tax purposes. The TRS subsidiaries are subject to income tax and are not limited as to the amount of nonqualifying income they can generate, but they are limited in terms of their value as a percentage of the total value of the Company’s assets. The TRS subsidiaries enter into agreements with a third party to manage the operations of the hotel. The Company prepared the accompanying condensed consolidated financial statements in accordance with accounting principles generally accepted in the United States of America (“GAAP”). References to the condensed consolidated financial statements and references to individual financial statements included herein, reference the condensed consolidated financial statements or the respective individual financial statement. All material balances and transactions between the consolidated entities of the Company have been eliminated.
The Company was formed to acquire, reposition, renovate, lease and manage income-producing properties, with a primary focus on (i) commercial properties, including flex-industrial, limited-service hotels, and retail properties, and (ii) multi-family residential properties in secondary and tertiary markets in the southeastern part of the United States, with an expected concentration in Virginia, North Carolina, South Carolina, Georgia, Florida and Alabama. The Company may also pursue, in an opportunistic manner, other real estate-related investments, including, among other things, equity or other ownership interests in entities that are the direct or indirect owners of real property, indirect investments in real property, such as those that may be obtained in a joint venture. While these types of investments are not intended to be a primary focus, the Company may make such investments in its Manager’s discretion.
| 7 |
The Company is externally managed by Medalist Fund Manager, Inc. (the ‘‘Manager’’). The Manager makes all investment decisions for the Company. The Manager and its affiliated companies specialize in acquiring, developing, owning and managing value-added commercial real estate in the Mid-Atlantic and Southeast regions. The Manager oversees the Company’s overall business and affairs and has broad discretion to make operating decisions on behalf of the Company and to make investment decisions. The Company’s stockholders are not involved in its day-to-day affairs.
| 8 |
| 2. | Summary of Significant Accounting Policies |
Investment Properties
The Company has adopted Accounting Standards Update (“ASU”) 2017-01, Business Combinations (Topic 805), which clarifies the framework for determining whether an integrated set of assets and activities meets the definition of a business. The revised framework establishes a screen for determining whether an integrated set of assets and activities is a business and narrows the definition of a business, which is expected to result in fewer transactions being accounted for as business combinations. Acquisitions of integrated sets of assets and activities that do not meet the definition of a business are accounted for as asset acquisitions. As a result, all of the Company’s acquisitions to date qualified as asset acquisitions and the Company expects future acquisitions of operating properties to qualify as asset acquisitions. Accordingly, third-party transaction costs associated with these acquisitions have been and will be capitalized, while internal acquisition costs will continue to be expensed.
Accounting Standards Codification (“ASC”) 805 mandates that “an acquiring entity shall allocate the cost of an acquired entity to the assets acquired and liabilities assumed based on their estimated fair values at date of acquisition.” ASC 805 results in an allocation of acquisition costs to both tangible and intangible assets associated with income producing real estate. Tangible assets include land, buildings, site improvements, tenant improvements and furniture, fixtures and equipment, while intangible assets include the value of in-place leases, lease origination costs (leasing commissions and tenant improvements), legal and marketing costs and leasehold assets and liabilities (above or below market leases), among others.
The Company uses independent, third party consultants to assist management with its ASC 805 evaluations. The Company determines fair value based on accepted valuation methodologies including the cost, market, and income capitalization approaches. The purchase price is allocated to the tangible and intangible assets identified in the evaluation.
The Company records depreciation on buildings and improvements utilizing the straight-line method over the estimated useful life of the asset, generally 5 to 40 years. The Company reviews depreciable lives of investment properties periodically and makes adjustments to reflect a shorter economic life, when necessary. Tenant allowances, tenant inducements and tenant improvements are amortized utilizing the straight-line method over the term of the related lease. Amounts allocated to buildings are depreciated over the estimated remaining life of the acquired building or related improvements.
Acquisition and closing costs are capitalized as part of each tangible asset on a pro rata basis. Improvements and major repairs and maintenance are capitalized when the repair and maintenance substantially extend the useful life, increases capacity or improves the efficiency of the asset. All other repair and maintenance costs are expensed as incurred.
The Company reviews investment properties for impairment on a property-by-property basis whenever events or changes in circumstances indicate that the carrying value of investment properties may not be recoverable, but at least annually. These circumstances include, but are not limited to, declines in the property’s cash flows, occupancy and fair market value. The Company measures any impairment of investment property when the estimated undiscounted cash flows plus its residual value, is less than the carrying value of the property. To the extent impairment has occurred, the Company charges to income the excess of the carrying value of the property over its estimated fair value. The Company estimates fair value using unobservable data such as projected future operating income, estimated capitalization rates, or multiples, leasing prospects and local market information. The Company may decide to sell properties that are held for use and the sale prices of these properties may differ from their carrying values.
The Company did not record any impairment adjustments to its investment properties resulting from events or changes in circumstances during the three months ended March 31, 2021 or 2020, respectively.
| 9 |
Assets Held for Sale
The Company may decide to sell properties that are held as investment properties. The Company records these properties, and any associated liabilities, as held for sale when management has committed to a plan to sell the assets, actively seeks a buyer for the assets, and the consummation of the sale is considered probable and is expected within one year. Properties classified as held for sale are reported at the lower of their carrying value or their fair value, less estimated costs to sell. When the carrying value exceeds the fair value, less estimated costs to sell, an impairment charge is recognized. The Company determines fair value based on the three-level valuation hierarchy for fair value measurement. Level 1 inputs are quoted prices in active markets for identical assets or liabilities. Level 2 inputs are quoted prices for similar assets or liabilities in active markets; quoted prices for identical or similar assets in markets that are not active; and inputs other than quoted prices. Level 3 inputs are unobservable inputs that are supported by little or no market activity and that are significant to the fair value of the assets or liabilities.
As of December 31, 2020, the Company had committed to a plan to sell the Hampton Inn Property. The Company’s plan includes the sale of an asset group that includes the land, site improvements, building, building improvements and furniture, fixtures and equipment associated with the Hampton Inn Property. As a result, the Company determined that as of December 31, 2020, the carrying value of the Hampton Inn Property exceeded its fair value, less estimated costs to sell, and recorded impairment of assets held for sale of $3,494,058 on its condensed consolidated statements of operations during the year ended December 31, 2020. There was no such impairment recorded during the three months ended March 31, 2021 and 2020, respectively. The impairment of assets held for sale represents the difference between the carrying value of the Hampton Inn Property and its estimated fair value, less estimated closing costs. The Company based its estimate of the fair value of the Hampton Inn Property on the actual contract sale price, less estimated closing costs, a level 2 input. The fair value measurement date is as of December 31, 2020. As of March 31, 2021, the Company does not believe that the estimated fair value of the Hampton Inn Property has changed, and the Company has not recorded any further impairment of assets held for sale related to the Hampton Inn Property.
During February 2021, the Company committed to a plan to sell the Clemson Best Western Hotel Property. The Company’s plan includes the sale of an asset group that includes the land, site improvements, building, building improvements and furniture, fixtures and equipment associated with the Clemson Best Western Property. The Company believes that the fair value, less estimated costs to sell, exceeds the Company’s carrying cost, so the Company has not recorded any impairment of assets held for sale related to the Clemson Best Western Property for the three months ended March 31, 2021.
See Note 3 for additional details on impairment of assets held for sale as of March 31, 2021 and December 31, 2020.
Intangible Assets and Liabilities, net
The Company determines, through the ASC 805 evaluation, the above and below market lease intangibles upon acquiring a property. Intangible assets (or liabilities) such as above or below-market leases and in-place lease value are recorded at fair value and are amortized as an adjustment to rental revenue or amortization expense, as appropriate, over the remaining terms of the underlying leases. The Company amortizes amounts allocated to tenant improvements, in-place lease assets and other lease-related intangibles over the remaining life of the underlying leases. The analysis is conducted on a lease-by-lease basis.
The Company reviews its intangible assets for impairment whenever events or changes in circumstances indicate that the carrying value of its intangible assets may not be recoverable, but at least annually. The Company did not record any impairment adjustments to its intangible assets during the three months ended March 31, 2021 or 2020, respectively.
Details of the deferred costs, net of amortization, arising from the Company’s purchases of the Franklin Square Property, Hanover Square Property, Ashley Plaza Property and Brookfield Center Property are as follows:
March 31, 2021 (unaudited) | December 31, 2020 | |||||||
| Intangible Assets | ||||||||
| Leasing commissions | $ | 905,182 | $ | 948,427 | ||||
| Legal and marketing costs | 80,492 | 86,786 | ||||||
| Above market leases | 349,282 | 402,895 | ||||||
| Net leasehold asset | 1,669,334 | 1,818,254 | ||||||
| $ | 3,004,290 | $ | 3,256,362 | |||||
| Intangible Liabilities | ||||||||
| Below market leases, net | $ | (972,121 | ) | $ | (1,022,497 | ) | ||
| 10 |
Capitalized above-market lease values are amortized as a reduction of rental income over the remaining terms of the respective leases. Capitalized below-market lease values are amortized as an increase to rental income over the remaining terms of the respective leases. Adjustments to rental revenue related to the above and below market leases during the three months ended March 31, 2021 and 2020, respectively, were as follows:
| For the three months ending March 31, | ||||||||
2021 (unaudited) | 2020 (unaudited) | |||||||
| Amortization of above market leases | $ | (53,613 | ) | $ | (60,547 | ) | ||
| Amortization of below market leases | 50,376 | 57,454 | ||||||
| $ | (3,237 | ) | $ | (3,093 | ) | |||
Amortization of lease origination costs, leases in place and legal and marketing costs represent a component of depreciation and amortization expense. Amortization related to these intangible assets during the three months ended March 31, 2021 and 2020, respectively, were as follows:
| For the three months ending March 31, | ||||||||
2021 (unaudited) | 2020 (unaudited) | |||||||
| Leasing commissions | $ | (43,245 | ) | $ | (46,480 | ) | ||
| Legal and marketing costs | (6,294 | ) | (8,343 | ) | ||||
| Net leasehold asset | (148,920 | ) | (186,621 | ) | ||||
| $ | (198,459 | ) | $ | (241,444 | ) | |||
As of March 31, 2021 and December 31, 2020, the Company’s accumulated amortization of lease origination costs, leases in place and legal and marketing costs totaled $2,551,562 and $2,353,103, respectively.
Future amortization of above and below market leases, lease origination costs, leases in place, legal and marketing costs and tenant relationships is as follows:
| For the remaining nine months ending December 31, 2021 | 2022 | 2023 | 2024 | 2025 | 2026-2039 | Total | ||||||||||||||||||||||
| Intangible Assets | ||||||||||||||||||||||||||||
| Leasing commissions | $ | 124,785 | $ | 133,682 | $ | 106,075 | $ | 88,222 | $ | 79,830 | $ | 372,588 | $ | 905,182 | ||||||||||||||
| Legal and marketing costs | 17,455 | 18,879 | 13,960 | 8,894 | 5,366 | 15,938 | 80,492 | |||||||||||||||||||||
| Above market leases | 160,839 | 121,137 | 33,311 | 7,692 | 7,692 | 18,611 | 349,282 | |||||||||||||||||||||
| Net leasehold asset | 421,162 | 341,480 | 195,139 | 143,256 | 122,282 | 446,015 | 1,669,334 | |||||||||||||||||||||
| $ | 724,241 | $ | 615,178 | $ | 348,485 | $ | 248,064 | $ | 215,170 | $ | 853,152 | $ | 3,004,290 | |||||||||||||||
| Intangible Liabilities | ||||||||||||||||||||||||||||
| Below market leases, net | $ | (149,668 | ) | $ | (177,581 | ) | $ | (131,112 | ) | $ | (89,303 | ) | $ | (63,039 | ) | $ | (361,418 | ) | $ | (972,121 | ) | |||||||
| 11 |
Conditional Asset Retirement Obligation
A conditional asset retirement obligation represents a legal obligation to perform an asset retirement activity in which the timing and/or method of settlement depends on a future event that may or may not be with the Company’s control. Currently, the Company does not have any conditional asset retirement obligations. However, any such obligations identified in the future would result in the Company recording a liability if the fair value of the obligation can be reasonably estimated. Environmental studies conducted at the time the Company acquired its properties did not reveal any material environmental liabilities, and the Company is unaware of any subsequent environmental matters that would have created a material liability.
The Company believes that its properties are currently in material compliance with applicable environmental, as well as non-environmental, statutory and regulatory requirements. The Company did not record any conditional asset retirement obligation liabilities during the three months ended March 31, 2021 and 2020, respectively.
Cash and Cash Equivalents and Restricted Cash
The Company considers all highly liquid investments purchased with an original maturity of 90 days or less to be cash and cash equivalents. Cash equivalents are carried at cost, which approximates fair value. Cash equivalents consist primarily of bank operating accounts and money markets. Financial instruments that potentially subject the Company to concentrations of credit risk include its cash and equivalents and its trade accounts receivable.
The Company places its cash and cash equivalents and any restricted cash held by the Company on deposit with financial institutions in the United States which are insured by the Federal Deposit Insurance Company ("FDIC") up to $250,000. The Company's credit loss in the event of failure of these financial institutions is represented by the difference between the FDIC limit and the total amounts on deposit. Management monitors the financial institutions credit worthiness in conjunction with balances on deposit to minimize risk. As of March 31, 2021, the Company held one cash account with a balance that exceeded the FDIC limit by $2,181,325. As of December 31, 2020, the Company held two cash accounts with balances that exceeded the FDIC limit by an aggregate amount of $1,719,233.
Restricted cash represents (i) amounts held by the Company for tenant security deposits, (ii) escrow deposits held by lenders for real estate tax, insurance, and operating reserves, (iii) capital reserves held by lenders for investment property capital improvements and (iv) an escrow for the first year of dividends on the Company’s mandatorily redeemable preferred stock (see Note 4, below).
Tenant security deposits are restricted cash balances held by the Company to offset potential damages, unpaid rent or other unmet conditions of its tenant leases. As of March 31, 2021 and December 31, 2020, the Company reported $109,059 and $109,059, respectively, in security deposits held as restricted cash.
Escrow deposits are restricted cash balances held by lenders for real estate taxes, insurance and other operating reserves. As of March 31, 2021 and December 31, 2020, the Company reported $1,847,252 and $1,352,723, respectively, in escrow deposits.
Capital reserves are restricted cash balances held by lenders for capital improvements, leasing commissions furniture, fixtures and equipment, and tenant improvements. As of March 31, 2021 and December 31, 2020, the Company reported $713,641 and $674,520, respectively, in capital property reserves. These funds are being held in reserve, as follows:
| Property and Purpose of Reserve | March 31, (unaudited) | December 31, 2020 | ||||||
| Hampton Inn Property – furniture, fixtures and equipment | $ | 18,460 | $ | 18,460 | ||||
| Clemson Best Western Property - improvements | 50,010 | 50,009 | ||||||
| Clemson Best Western Property - furniture, fixtures and equipment | 152,578 | 149,752 | ||||||
| Franklin Square Property - leasing costs | 433,490 | 408,278 | ||||||
| Brookfield Center Property – maintenance reserve | 59,103 | 48,021 | ||||||
| Total | $ | 713,641 | $ | 674,520 | ||||
| 12 |
Revenue Recognition
The Company adopted ASU No. 2014-09, Revenue from Contracts with Customers (Topic 606) effective on January 1, 2019. This adoption did not have a material impact on the Company’s recognition of revenues from either its retail, flex or hotel properties.
Retail and Flex Center Property Revenues
The Company recognizes minimum rents from its retail center properties (the Franklin Square, Hanover Square and Ashley Plaza properties) and flex center property (Brookfield Center) on a straight-line basis over the terms of the respective leases which results in an unbilled rent asset being recorded on the condensed consolidated balance sheets. As of March 31, 2021 and December 31, 2020, the Company reported $761,820 and $673,728, respectively, in unbilled rent.
The Company’s leases generally require the tenant to reimburse the Company for a substantial portion of its expenses incurred in operating, maintaining, repairing, insuring and managing the shopping center and common areas (collectively defined as Common Area Maintenance or “CAM” expenses). The Company includes these reimbursements, along with other revenue derived from late fees and seasonal events, on the condensed consolidated statements of operations under the captions "Retail center property tenant reimbursements” and “Flex center property tenant reimbursements." This significantly reduces the Company’s exposure to increases in costs and operating expenses resulting from inflation or other outside factors. The Company accrues reimbursements from tenants for recoverable portions of all these expenses as revenue in the period the applicable expenditures are incurred. The Company calculates the tenant’s share of operating costs by multiplying the total amount of the operating costs by a fraction, the numerator of which is the total number of square feet being leased by the tenant, and the denominator of which is the average total square footage of all leasable buildings at the property. The Company also receives payments for these reimbursements from substantially all its tenants on a monthly basis throughout the year.
The Company recognizes differences between previously estimated recoveries and the final billed amounts in the year in which the amounts become final. Since these differences are determined annually under the leases and accrued as of December 31 in the year earned, no such revenues were recognized during the three months ended March 31, 2021 and 2020.
The Company recognizes lease termination fees in the period that the lease is terminated and collection of the fees is reasonably assured. Upon early lease termination, the Company provides for losses related to unrecovered intangibles and other assets. During the three months ended March 31, 2021 and 2020, respectively, no such termination costs were recognized.
Hotel Property Revenues
Hotel revenues (from the Hampton Inn Property and Clemson Best Western Property) are recognized as earned, which is generally defined as the date upon which a guest occupies a room or utilizes the hotel’s services.
The Hampton Inn Property and Clemson Best Western Property are required to collect certain taxes and fees from customers on behalf of government agencies and remit them back to the applicable governmental agencies on a periodic basis. The Hampton Inn Property and Clemson Best Western Property have a legal obligation to act as a collection agent. The Hampton Inn Property and Clemson Best Western Property do not retain these taxes and fees; therefore, they are not included in revenues. The Hampton Inn Property and Clemson Best Western Property record a liability when the amounts are collected and relieves the liability when payments are made to the applicable taxing authority or other appropriate governmental agency.
| 13 |
Hotel Property Operating Expenses
All personnel of the Hampton Inn Property and Clemson Best Western Property are directly or indirectly employees of Marshall Hotels and Resorts, Inc. (“Marshall”), the Company’s hotel management firm. In addition to fees and services discussed above, the Hampton Inn Property and Clemson Best Western Property reimburse Marshall for all employee related service costs, including payroll salaries and wages, payroll taxes and other employee benefits paid by Marshall on behalf of the respective property. For the Hampton Inn Property, total amounts incurred for payroll salaries and wages, payroll taxes and other employee benefits for the three months ended March 31, 2021 and 2020 were $164,427 and $144,383, respectively. For the Clemson Best Western Property, total amounts incurred for payroll salaries and wages, payroll taxes and other employee benefits for the three months ended March 31, 2021 and 2020 were $103,553 and $150,178, respectively. The amounts are included in hotel property operating expenses in the accompanying condensed consolidated statements of operations.
Rent and other receivables
Rent and other receivables include tenant receivables related to base rents and tenant reimbursements. (Rent and other receivables do not include receivables attributable to recording rents on a straight-line basis, which are included in unbilled rent, discussed above.) The Company determines an allowance for the uncollectible portion of accrued rents and accounts receivable based upon customer credit worthiness (including expected recovery of a claim with respect to any tenants in bankruptcy), historical bad debt levels, and current economic trends. The Company considers a receivable past due once it becomes delinquent per the terms of the lease. A past due receivable triggers certain events such as notices, fees and other allowable and required actions per the lease. As of March 31, 2021 and December 31, 2020, the Company’s allowance for uncollectible rent totaled $0 and $4,693, respectively, which are comprised of amounts specifically identified based on management’s review of individual tenants’ outstanding receivables. Management determined that no additional general reserve is considered necessary as of March 31, 2021 and December 31, 2020, respectively.
Income Taxes
Beginning with the Company’s taxable year ended December 31, 2017, the REIT has elected to be taxed as a real estate investment trust for federal income tax purposes under Sections 856 through 860 of the Internal Revenue Code and applicable Treasury regulations relating to REIT qualification. In order to maintain this REIT status, the regulations require the Company to distribute at least 90% of its taxable income to shareholders and meet certain other asset and income tests, as well as other requirements. If the Company fails to qualify as a REIT, it will be subject to tax at regular corporate rates for the years in which it fails to qualify. If the Company loses its REIT status it could not elect to be taxed as a REIT for five years unless the Company’s failure to qualify was due to reasonable cause and certain other conditions were satisfied.
During the three months ended March 31, 2021 and 2020, respectively, the Company’s Hampton Inn TRS entity generated a tax loss, so no income tax expense was recorded. During the three months ended March 31, 2021 and 2020, respectively, the Company’s Clemson Best Western TRS entity generated taxable income, but the Company believes that its net operating loss carryforwards from prior periods will offset this taxable income, so no income tax expense was recorded.
Management has evaluated the effect of the guidance provided by GAAP on Accounting for Uncertainty of Income Taxes and has determined that the Company had no uncertain income tax positions.
Use of Estimates
The Company has made estimates and assumptions that affect the reported amounts of assets and liabilities, disclosure of contingent assets and liabilities at the date of the condensed consolidated financial statements, and revenues and expenses during the reported period. The Company’s actual results could differ from these estimates.
Noncontrolling Interests
There are three elements of noncontrolling interests in the capital structure of the Company. The ownership interests not held by the REIT are considered noncontrolling interests. Accordingly, noncontrolling interests have been reported in equity on the condensed consolidated balance sheets but separate from the Company’s equity. On the condensed consolidated statements of operations, the subsidiaries are reported at the condensed consolidated amount, including both the amount attributable to the Company and noncontrolling interests. The Company’s condensed consolidated statements of changes in stockholders’ equity includes beginning balances, activity for the period and ending balances for shareholders’ equity, noncontrolling interests and total equity.
| 14 |
The first noncontrolling interest is in the Hampton Inn Property. In 2017, the noncontrolling owner of the Hampton Inn Property provided $2.3 million as part of the acquisition of the Hampton Inn Property for a 36 percent tenancy in common ownership interest. The Company acquired a 64 percent tenancy in common interest through its subsidiaries. Effective on January 1, 2020, the Company entered into a transaction with the noncontrolling owner of the Hampton Inn Property by which the noncontrolling owner exchanged (i) 7.55 percent of its tenant in common interest in the Hampton Inn Property for the settlement of $867,000 in advances made by the Company to the Hampton Inn Property (of which $312,120, or 36 percent, were made on behalf of the noncontrolling owner); and (ii) 3.45 percent of its tenant in common interest in the Hampton Inn Property for 93,850 units of the Operating Partnership. As a result of this transaction, effective on January 1, 2020, the Company’s tenant-in-common interest in the Hampton Inn Property increased from 64 percent to 75 percent, and the noncontrolling owner’s tenant-in-common interest decreased from 36 percent to 25 percent. Effective on November 9, 2020, the noncontrolling owner exchanged 3 percent of its tenant in common interest in the Hampton Inn Property for the settlement of $1,021,960 in advances made by the Company to the Hampton Inn Property (of which $255,490, or 25 percent, were made on behalf of the noncontrolling owner). As a result of this transaction, the Company’s tenant-in-common interest in the Hampton Inn Property increased from 75 percent to 78 percent, and the noncontrolling owner’s tenant-in-common interest decreased from 25 percent to 22 percent. These transactions did not have any impact on the Company’s total assets, liabilities or shareholder’s equity or total equity as of March 31, 2021 or December 31, 2020.
The Hampton Inn Property’s net loss is allocated to the noncontrolling ownership interest based on its percent ownership. During the three months ended March 31, 2021, 22 percent of the Hampton Inn’s net loss of $114,717 or $25,238, was allocated to the noncontrolling partnership interest. During the three months ended March 31, 2020, 25 percent of the Hampton Inn’s net loss of $339,836, or $84,960 was allocated to the noncontrolling partnership interest.
The second noncontrolling interest is in the Hanover Square Property in which the Company owns an 84 percent tenancy in common interest through its subsidiary and an outside party owns a 16 percent tenancy in common interest. The Hanover Square Property’s net loss is allocated to the noncontrolling ownership interest based on its 16 percent ownership. During the three months ended March 31, 2021, 16 percent of the Hanover Square Property’s net loss of $43,882 or $7,020 was allocated to the noncontrolling ownership interest. During the three months ended March 31, 2020, 16 percent of the Hanover Square Property’s net income of $31,037 or $4,966 was allocated to the noncontrolling ownership interest.
The third noncontrolling ownership interest are the units in the Operating Partnership that are not held by the REIT. In 2017, 125,000 Operating Partnership units were issued to members of the selling LLC which owned the Hampton Inn Property who elected to participate in a 721 exchange, which allows the exchange of interests in real property for shares in a real estate investment trust. These members of the selling LLC invested $1,175,000 in the Operating Partnership in exchange for 125,000 Operating Partnership units. Additionally, as discussed above, effective on January 1, 2020, 93,850 Operating Partnership units were issued in exchange for approximately 3.45 percent of the noncontrolling owner’s tenant in common interest in the Hampton Inn Property. On August 31, 2020, a unitholder converted 5,319 Operating Partnership units into shares of Common Stock. As of March 31, 2021, there were 213,531 Operating Partnership units outstanding.
The Operating Partnership units not held by the REIT represent 2.98 percent and 4.41 percent of the outstanding Operating Partnership units as of March 31, 2021 and December 31, 2020, respectively. The noncontrolling interest percentage is calculated at any point in time by dividing the number of units not owned by the Company by the total number of units outstanding. The noncontrolling interest ownership percentage will change as additional common or preferred shares are issued by the REIT, or additional Operating Partnerships units are issued or as units are exchanged for the Company’s $0.01 par value per share Common Stock. During periods when the Operating Partnership’s noncontrolling interest changes, the noncontrolling ownership interest is calculated based on the weighted average Operating Partnership noncontrolling ownership interest during that period. The Operating Partnership’s net loss is allocated to the noncontrolling unit holders based on their ownership interest.
During the three months ended March 31, 2021, a weighted average of 3.37 percent of the Operating Partnership’s net income of $60,555, or $2,040, was allocated to the noncontrolling unit holders. During the three months ended March 31, 2020, a weighted average of 4.58 percent of the Operating Partnership’s net loss of $630,176, or $28,893, was allocated to the noncontrolling unit holders.
| 15 |
Recent Accounting Pronouncements
For each of the accounting pronouncements that affect the Company, the Company has elected or plans to elect to follow the rule that allows companies engaging in an initial public offering as an Emerging Growth Company to follow the private company implementation dates.
Accounting for Leases
In February 2016, the Financial Accounting Standards Board (“FASB”) issued ASU No. 2016-02, Leases (Topic 842). The amendments in this update govern a number of areas including, but not limited to, accounting for leases, replacing the existing guidance in ASC No. 840, Leases. Under this standard, among other changes in practice, a lessee’s rights and obligations under most leases, including existing and new arrangements, would be recognized as assets and liabilities, respectively, on the balance sheets. Other significant provisions of this standard include (i) defining the “lease term” to include the non-cancelable period together with periods for which there is a significant economic incentive for the lessee to extend or not terminate the lease; (ii) defining the initial lease liability to be recorded on the balance sheets to contemplate only those variable lease payments that depend on an index or that are in substance “fixed,” (iii) a dual approach for determining whether lease expense is recognized on a straight-line or accelerated basis, depending on whether the lessee is expected to consume more than an insignificant portion of the leased asset’s economic benefits and (iv) a requirement to bifurcate certain lease and non-lease components. The lease standard was effective for public companies for fiscal years beginning after December 15, 2018 (including interim periods within those fiscal years) and for private companies, fiscal years beginning after December 15, 2019, with early adoption permitted. The FASB subsequently deferred the effective date of ASU 2016-02 for private companies by one year, to fiscal years beginning after December 15, 2020, to provide those companies with additional time to address various implementation challenges and complexities. In June 2020, the FASB further deferred the effective date due to the effects on private companies from business and capital market disruptions caused by the novel coronavirus (“COVID-19”) pandemic. ASU 2016-02 is now effective for private companies for fiscal years beginning after December 15, 2021, and for interim periods within fiscal years beginning after December 15, 2022. The Company plans to adopt the standard effective on January 1, 2022. The accounting for leases under which the Company is the lessor remains largely unchanged and the Company is not currently a “lessee” under any lease agreements. Management does not believe the adoption will have a material impact on the Company’s condensed consolidated financial statements.
Due to the business disruptions and challenges severely affecting the global economy caused by the COVID-19 pandemic, lessors may provide rent deferrals and other lease concessions to lessees. In April 2020, the FASB staff issued a question and answer document (the “Lease Modification Q&A”) focused on the application of lease accounting guidance to lease concessions provided as a result of the COVID-19 pandemic. Under existing lease guidance, the Company would have to determine, on a lease-by-lease basis, if a lease concession was the result of a new arrangement reached with the tenant (treated within the lease modification accounting framework) or if a lease concession was under the enforceable rights and obligations within the existing lease agreement (precluded from applying the lease modification accounting framework). The Lease Modification Q&A allows the Company, if certain criteria have been met, to bypass the lease-by-lease analysis, and instead elect to either apply the lease modification accounting framework or not, with such election applied consistently to leases with similar characteristics and similar circumstances. The Company has elected the practical expedient and will not apply lease modification accounting on a lease-by-lease basis where applicable. As a result, $248,521 and $228,346 of deferred rent is included in accounts receivable on the Company’s condensed consolidated balance sheets as of March 31, 2021 and December 31, 2020, respectively.
| 16 |
In addition, to the deferred rent agreements granted by the Company, the Company has abated rent payments totaling $456,714 from various tenants that would have been paid from the March 2020 onset of the COVID-19 pandemic through March 31, 2021, as follows:
| Three months ended March 31, | Remaining nine months ended December 31, | |||||||||||||||
2021 Actual (1) (unaudited) | 2020 Actual | 2021 Future (2) | 2020 Actual (1) | |||||||||||||
| Rent abated | $ | 109,818 | $ | - | $ | 329,453 | $ | 346,896 | ||||||||
| (1) | Actual rent abatements reduce rental revenues recorded on the Company's condensed consolidated statement of operations. |
| (2) | Projected future rent abatements are reflected as reductions of future minimum rents in Note 6, below. | |
| As of March 31, | As of December 31, | |||||||||||||||
2021 (1) (unaudited) | 2020 (1) (unaudited) | 2021 (2) (unaudited) | 2020 (1) | |||||||||||||
| Cumulative rent abated | $ | 456,714 | $ | - | $ | 786,167 | $ | 346,896 | ||||||||
| (1) | Actual |
| (2) | Projected |
In the case of prospective rent abatements (those granted in advance of the due date of the abated rental payments), these amounts are recorded as a reduction to retail center property revenues on the Company’s condensed consolidated statement of operations for the three months ended March 31, 2021 and for the year ended December 31, 2020. In the case of retroactive rent abatements (those granted for past due, unpaid rent that has already been recognized as rent revenue on the Company’s condensed consolidated statement of operations), these amounts were recorded as a bad debt expense on the Company’s consolidated statement of operations for the year ended December 31, 2020. No such rent reductions were recorded for the three months ended March 31, 2021 or 2020. (See “other risks and uncertainties” in Note 8, below).
Credit Losses on Financial Instruments
In June 2016, the FASB issued ASU 2016-13, Financial Instruments - Credit Losses (Topic 326): Measurement of Credit Losses on Financial Instruments. This update enhances the methodology of measuring expected credit losses to include the use of forward-looking information to better calculate credit loss estimates. The guidance will apply to most financial assets measured at amortized cost and certain other instruments, such as accounts receivable and loans. The guidance will require that the Company estimate the lifetime expected credit loss with respect to these receivables and record allowances that, when deducted from the balance of the receivables, represent the net amounts expected to be collected. The Company will also be required to disclose information about how it developed the allowances, including changes in the factors that influenced the Company’s estimate of expected credit losses and the reasons for those changes. The Company is continuing to evaluate the impact the adoption of the guidance will have on its condensed consolidated financial statements and has not yet determined if it will adopt the update effective on the required effective date of January 1, 2023, or whether it will elect earlier adoption.
Effects of Reference Rate Reform
In March 2020, the FASB issued ASU 2020-04, Reference Rate Reform (Topic 848): Facilitation of the Effects of Reference Rate Reform on Financial Reporting. The London Interbank Offered Rate (LIBOR), which is widely used as a reference interest rate in debt agreements and other contracts, is scheduled to be discontinued for new contracts by December 31, 2021, and its publication for existing contracts is scheduled to be discontinued by June 30, 2023. Financial market regulators in certain jurisdictions throughout the world have undertaken reference rate reform initiatives to guide the transition and modification of debt agreements and other contracts that are currently based on LIBOR to the successor reference rate that will replace it. ASU 2020-04 was issued to provide companies that will be impacted by these changes with the opportunity to elect certain expedients and exceptions that are intended to ease the potential burden of accounting for or recognizing the effects of reference rate reform on financial reporting. Companies may generally elect to make use of the expedients and exceptions provided by ASU 2020-04 for any reference rate contract modifications that occur in reporting periods that encompass the timeline from March 12, 2020 to December 31, 2022. The Company currently has two outstanding mortgage loans with corresponding interest rate protection agreements and the line of credit, short term, which use USD LIBOR as the reference interest rate (see Note 5, below). The Hampton Inn Property mortgage loan matures on May 9, 2022. The Clemson Best Western Property mortgage loan matures in October 2022. Since both mortgage loans are expected to mature prior to the date that publication of the applicable USD LIBOR rate is discontinued, no transition to a replacement reference rate is currently expected for either loan. The line of credit, short term, was repaid on April 21, 2021. While the Company is continuing to review the guidance in ASU 2020-04, it does not currently expect that it will need to use the expedients and exceptions provided therein with respect to the replacement of USD LIBOR as the reference rate in any agreements.
Debt With Conversion Options
In August 2020, the FASB issued ASU 2020-06, Debt - Debt With Conversion and Other Options (Subtopic 470-20) and Derivatives and Hedging-Contracts in an Entity’s Own Equity (Subtopic 815-40): Accounting for Convertible Instruments and Contracts in an Entity’s Own Equity. The objective of ASU 2020-06 is to reduce the current complexity involved in accounting for convertible financial instruments by reducing the number of accounting models applicable to those instruments in the existing guidance. Following the adoption of ASU 2020-06, companies are expected to encounter fewer instances in which a convertible financial instrument must be separated into a debt or equity component and a derivative component for accounting purposes due to the embedded conversion feature. As a result of these revisions, debt instruments issued with a beneficial conversion feature will no longer require separation and thus will be accounted for as a single debt instrument under the updated guidance. In addition to those changes, ASU 2020-06 adds several incremental financial statement disclosures with respect to a company’s convertible financial instruments and makes certain refinements with respect to calculating the effect of those instruments on a company’s diluted earnings per share. ASU 2020-06 is effective for public companies for fiscal years beginning after December 15, 2021 (including interim periods within those fiscal years), and for private companies, fiscal years beginning after December 15, 2023. Early adoption of the guidance is permitted, but no earlier than fiscal years beginning after December 15, 2020. As discussed in Note 5, below, during the period from October 2020 to January 2021, the Company issued debentures that are convertible into shares of its common stock. Those debentures are subject to the accounting guidance for convertible financial instruments. During the three months ended March 31, 2021, $4,250,000 of the $5,000,000 total principal amount of the debentures was converted to common stock. The Company is currently evaluating the changes to the accounting guidance for convertible financial instruments set forth under ASU 2020-06, but is not required to adopt the updated guidance before January 1, 2024. No determination has been made at this time with respect to early adoption.
| 17 |
Evaluation of the Company’s Ability to Continue as a Going Concern
Under the accounting guidance related to the presentation of financial statements, the Company is required to evaluate, on a quarterly basis, whether or not the entity’s current financial condition, including its sources of liquidity at the date that the condensed consolidated financial statements are issued, will enable the entity to meet its obligations as they come due arising within one year of the date of the issuance of the Company’s condensed consolidated financial statements and to make a determination as to whether or not it is probable, under the application of this accounting guidance, that the entity will be able to continue as a going concern. The Company’s condensed consolidated financial statements have been presented on a going concern basis, which contemplates the realization of assets and the satisfaction of liabilities in the normal course of business.
In applying applicable accounting guidance, management considered the Company’s current financial condition and liquidity sources, including current funds available, forecasted future cash flows, the Company’s obligations due over the next twelve months as well as the Company’s recurring business operating expenses.
The Company concludes that it is probable that the Company will be able to meet its obligations arising within one year of the date of issuance of these condensed consolidated financial statements within the parameters set forth in the accounting guidance.
| 18 |
| 3. | Investment Properties |
Investment properties consist of the following:
March 31, 2021 (unaudited) | December 31, 2020 (1) | |||||||
| Land | $ | 10,223,987 | $ | 12,281,693 | ||||
| Site improvements | 3,285,639 | 3,751,212 | ||||||
| Buildings and improvements (2) | 38,125,403 | 45,137,682 | ||||||
| Furniture, fixtures and equipment | - | 825,147 | ||||||
| Investment properties at cost (3) | 51,635,029 | 61,995,734 | ||||||
| Less accumulated depreciation | 4,672,346 | 4,939,872 | ||||||
| Investment properties, net | $ | 46,962,683 | $ | 57,055,862 | ||||
| (1) | As of December 31, 2020, the Clemson Best Western Property is recorded as an investment property. As of March 31, 2021, the Clemson Best Western Property is recorded as an asset held for sale. Please see the note on “assets held for sale”, below. |
| (2) | Includes tenant improvements (both those acquired at the acquisition and those constructed after the acquisition), tenant inducements, capitalized leasing commissions and other capital costs incurred post-acquisition. |
| (3) | Excludes intangible assets and liabilities (see Note 2, above, for a discussion of the Company’s accounting treatment of intangible assets), escrow deposits and property reserves. |
The Company’s depreciation expense on investment properties was $454,774 and $767,314 for the three months ended March 31, 2021 and 2020, respectively.
Capitalized tenant improvements
The Company carries two categories of capitalized tenant improvements on its condensed consolidated balance sheets, both of which are recorded under Investment properties, net on the Company’s condensed consolidated balance sheets. The first category is the allocation of acquisition costs to tenant improvements that is recorded on the Company’s condensed consolidated balance sheet as of the date of the Company’s acquisition of the investment property. The second category are tenant improvement costs incurred and paid by the Company subsequent to the acquisition of the investment property. Both are recorded as a component of investment properties on the Company’s condensed consolidated balance sheets. Depreciation expense on both categories of tenant improvements is recorded as a component of depreciation expense on the Company’s condensed consolidated statement of operations.
The Company generally records depreciation of capitalized tenant improvements on a straight-line basis over the terms of the related leases. Details of these deferred costs, net of depreciation are as follows:
March 31, 2021 (unaudited) | December 31, 2020 | |||||||
| Capitalized tenant improvements – acquisition cost allocation, net | $ | 1,092,938 | $ | 1,155,505 | ||||
| Capitalized tenant improvements incurred subsequent to acquisition, net | 213,300 | 179,919 | ||||||
During the three months ended March 31, 2021 and 2020, the Company recorded $45,150 and $60,000, respectively, in capitalized tenant improvements. During June 2020, a tenant in the Company’s Franklin Square Property notified the Company that it was abandoning its leased premises and defaulting on its lease. The Company determined that the capitalized tenant improvement associated with this lease that was recorded as part of the purchase of the Franklin Square Property and carried on the Company’s condensed consolidated balance sheets related to this lease of $81,860 should be written off. This amount is included in the loss on impairment reported on the Company’s consolidated statement of operations for the year ended December 31, 2020.
Depreciation of capitalized tenant improvements incurred subsequent to acquisition was $11,769 and $10,536 for the three months ended March 31, 2021 and 2020, respectively.
Depreciation of capitalized tenant improvements arising from the acquisition cost allocation was $62,567 and $71,667 for the three months ended March 31, 2021 and 2020, respectively.
| 19 |
Capitalized leasing commissions
The Company carries two categories of capitalized leasing commissions on its condensed consolidated balance sheets. The first category is the allocation of acquisition costs to leasing commissions that is recorded as an intangible asset (see Note 2, above, for a discussion of the Company’s accounting treatment for intangible assets) on the Company’s condensed consolidated balance sheet as of the date of the Company’s acquisition of the investment property. The second category is leasing commissions incurred and paid by the Company subsequent to the acquisition of the investment property. These costs are carried on the Company’s condensed consolidated balance sheets under investment properties.
The Company generally records depreciation of capitalized leasing commissions on a straight-line basis over the terms of the related leases. Details of these deferred costs, net of depreciation are as follows:
March 31, 2021 (unaudited) | December 31, 2020 | |||||||
| Capitalized leasing commissions, net | $ | 331,725 | $ | 346,437 | ||||
During the three months ended March 31, 2021 and 2020, the Company recorded $0 and $56,746, respectively in capitalized leasing commissions. Depreciation of capitalized leasing commissions was $14,712 and $11,069 for the three months ended March 31, 2021 and 2020, respectively.
Assets held for sale
The Company records properties as held for sale when management has committed to a plan to sell the assets, actively seeks a buyer for the assets, and the consummation of the sale is considered probable and is expected within one year. Management believes that its plans to sell the Hampton Inn Property and Clemson Best Western Hotel Property meet these criteria and, as of March 31, 2021, the assets held for sale on the Company’s condensed consolidated balance sheets include certain assets associated with the Hampton Inn Property and Clemson Best Western Property.
As of December 31, 2020, the Company committed to a plan to sell an asset group associated with the Hampton Inn Property that includes the land, site improvements, building, building improvements and furniture, fixtures and equipment. As a result, as of December 31, 2020, the Company reclassified these assets, and the related mortgage payable, net, for the Hampton Inn Property as assets held for sale and liabilities associated with assets held for sale, respectively. The Company expects that it will retain cash and restricted cash and will be responsible for the extinguishment of any accounts payable and other liabilities associated with the Hampton Inn Property. Accordingly, these amounts are excluded from the assets and related liabilities that have been reclassified as assets held for sale and liabilities associated with assets held for sale as of December 31, 2020. For the year ended December 31, 2020, the Company recorded an impairment charge of $3,494,058 on assets held for sale. This impairment charge resulted from reducing the carrying value of the Hampton Inn Property for the amounts that exceeded the property’s estimated fair value less estimated selling costs. See Note 2, above.
During February 2021, the Company committed to a plan to sell an asset group associated with the Clemson Best Western Hotel Property that includes the land, site improvements, building, building improvements and furniture, fixtures and equipment. As a result, as of March 31, 2021, the Company reclassified these assets, and the related mortgage payable, net, for the Clemson Best Western Property as assets held for sale and liabilities associated with assets held for sale, respectively. The Company expects that it will retain cash and restricted cash and will be responsible for the extinguishment of any accounts payable and other liabilities associated with the Clemson Best Western Property. The Company believes that the fair value, less estimated costs to sell, exceeds the Company’s carrying cost, so the Company has not recorded any impairment of assets held for sale related to the Clemson Best Western Property for the three months ended March 31, 2021. For the three months ended March 31, 2020, no such impairment charges were recorded.
| 20 |
As of March 31, 2021 and December 31, 2020, assets held for sale and liabilities associated with assets held for sale consisted of the following:
| March 31, 2021 (unaudited) | December 31, 2020 | |||||||
| Investment properties, net | $ | 22,093,805 | $ | 12,410,250 | ||||
| Total assets held for sale | $ | 22,093,805 | $ | 12,410,250 | ||||
| March 31, 2021 (unaudited) | December 31, 2020 | |||||||
| Mortgages payable, net | $ | 17,976,368 | $ | 10,352,000 | ||||
| Total liabilities associated with assets held for sale | $ | 17,976,368 | $ | 10,352,000 | ||||
| 4. | Mandatorily Redeemable Preferred Stock |
On February 19, 2020, the Company issued and sold 200,000 shares of 8.0% Series A cumulative redeemable preferred stock at $23.00 per share, resulting in gross proceeds of $4,600,000. Net proceeds from the issuance were $3,860,882, which includes the impact of the underwriter’s discounts, selling commissions and legal, accounting and other professional fees, and is presented on the Company’s condensed consolidated balance sheets as mandatorily redeemable preferred stock. At issuance, the Company created an escrow for $371,111 for the first year of dividends, which is reported as restricted cash on the Company’s consolidated balance sheets. As of March 31, 2021 and December 31, 2020, respectively, the balance of the preferred dividend escrow was $0 and $97,632, respectively.
The mandatorily redeemable preferred stock has an aggregate liquidation preference of $5 million, plus any accrued and unpaid dividends thereon. The mandatorily redeemable preferred stock is senior to the Company’s common stock and any class or series of capital stock expressly designated as ranking junior to the mandatorily redeemable preferred stock as to distribution rights and rights upon liquidation, dissolution or winding up (“Junior Stock”). The mandatorily redeemable preferred stock is on a parity with any class or series of the Company’s capital stock expressly designated as ranking on a parity with the mandatorily redeemable preferred stock as to distribution rights and rights upon liquidation, dissolution or winding up (“Parity Stock”).
If outstanding on February 19, 2025, the mandatorily redeemable preferred stock must be redeemed by the Company on that date, the fifth anniversary of the date of issuance. Beginning on February 19, 2022, the second anniversary of the issuance, the Company may redeem the outstanding mandatorily redeemable preferred stock for an amount equal to its aggregate liquidation preference, plus any accrued but unpaid dividends. The holders of the mandatorily redeemable preferred stock may also require the Company to redeem the stock upon a change of control of the Company for an amount equal to its aggregate liquidation preference plus any accrued and unpaid dividends thereon.
Holders of the mandatorily redeemable preferred stock generally have no voting rights. However, if the Company does not pay dividends on the mandatorily redeemable preferred stock for six consecutive quarterly periods, the holders of that stock, voting together as a single class with the holders of any outstanding Parity Stock having similar voting rights, will be entitled to vote for the election of two additional directors to serve on the Company’s Board of Directors until the Company pays all dividends owed on the mandatorily redeemable preferred stock. The affirmative vote of the holders of at least two-thirds of the outstanding shares of mandatorily redeemable preferred stock, voting together as a single class with the holders of any other class or series of the Company’s preferred stock upon which like voting rights have been conferred and are exercisable, is required for the Company to authorize, create or increase the number of shares of any class or series of capital stock expressly designated as ranking senior to the mandatorily redeemable preferred stock as to distribution rights and rights upon the Company’s liquidation, dissolution or winding up. In addition, the affirmative vote of at least two-thirds of the outstanding shares of mandatorily redeemable preferred stock (voting as a separate class) is required to amend the Company’s charter (including the articles supplementary designating the mandatorily redeemable preferred stock) in a manner that materially and adversely affects the rights of the holders of mandatorily redeemable preferred stock. Among other things, the Company may, without any vote of the holders of mandatorily redeemable preferred stock, issue additional shares of mandatorily redeemable preferred stock and may authorize and issue additional shares of any class or series of any Junior Stock or Parity Stock.
The Company has classified the mandatorily redeemable preferred stock as a liability in accordance with ASC Topic No. 480, “Distinguishing Liabilities from Equity,” which states that mandatorily redeemable financial instruments should be classified as liabilities and therefore the related dividend payments are treated as a component of interest expense in the accompanying condensed consolidated statements of operations (see Note 5, below, for a discussion of interest expense associated with the mandatorily redeemable preferred stock).
| 21 |
For all periods the mandatorily redeemable preferred stock has been outstanding, the Company has paid a cash dividend on the stock equal to 8 percent per annum, paid quarterly, as follows:
| Payment Date | Record Date | Amount per share | For the period | |||||||
| April 27, 2020 | April 24, 2020 | $ | 0.37 | February 19, 2020 - April 27, 2020 | ||||||
| July 24, 2020 | July 22, 2020 | 0.50 | April 28, 2020 - July 24, 2020 | |||||||
| October 26, 2020 | October 23, 2020 | 0.50 | July 25, 2020 - October 26, 2020 | |||||||
| February 1, 2021 | January 29, 2021 | 0.50 | October 27, 2020 - February 1, 2021 | |||||||
| April 30, 2021 | April 26, 2021 | 0.50 | February 2, 2021 – April 30, 2021 | |||||||
As of March 31, 2021 and December 31, 2020, the Company reported $70,004 and $70,004, respectively, in accrued but unpaid dividends on the mandatorily redeemable preferred stock. This amount is reported in accounts payable and accrued liabilities on the Company’s condensed consolidated balance sheets.
The mandatorily redeemable preferred stock was issued at $23.00 per share, a $2.00 per share discount. The total discount of $400,000 is being amortized over the five-year life of the shares using the effective interest method. Additionally, the Company incurred $739,118 in legal, accounting, other professional fees and underwriting discounts related to this offering. These costs were recorded as deferred financing costs on the accompanying condensed consolidated balance sheets as a direct deduction from the carrying amount of the mandatorily redeemable preferred stock liability and are being amortized using the effective interest method over the term of the agreement.
Amortization of the discount and deferred financing costs related to the mandatorily redeemable preferred stock totaling $49,449 and $20,299 were included in interest expense for the three months ended March 31, 2021 and 2020, respectively, in the accompanying condensed consolidated statements of operations. Accumulated amortization of the discount and deferred financing costs was $211,824 and $162,375 as of March 31, 2021 and December 31, 2020, respectively.
| 5. | Loans Payable |
Mortgages Payable
The Company’s mortgages payables, net, consists of the following:
| Balance | ||||||||||||||||||||
| Property | Monthly Payment | Interest Rate | Maturity | March 31, (unaudited) | December 31, 2020 | |||||||||||||||
| Franklin Square (a) | Interest only | 4.70 | % | October 2021 | $ | 14,275,000 | $ | 14,275,000 | ||||||||||||
| Hanover Square (b) | $ | 56,882 | 4.25 | % | December 2027 | 10,320,244 | 10,380,791 | |||||||||||||
| Ashley Plaza (c) | $ | 52,795 | 3.75 | % | September 2029 | 11,297,387 | 11,349,518 | |||||||||||||
| Clemson Best Western (d) | Interest only | Variable | October 2022 | - | 7,750,000 | |||||||||||||||
| Brookfield Center (e) | $ | 22,876 | 3.90 | % | November 2029 | 4,821,415 | 4,842,887 | |||||||||||||
| Unamortized issuance costs, net | (334,020 | ) | (503,842 | ) | ||||||||||||||||
| Total mortgages payable, net | $ | 40,380,026 | $ | 48,094,354 | ||||||||||||||||
| (a) |
The mortgage loan for the Franklin Square Property matures in October 2021. The Company will commence efforts in mid-2021 to refinance this mortgage, but there is no guarantee that the Company’s efforts will be successful.
| |
| (b) |
On May 8, 2020, the Company entered into a refinancing transaction with the mortgage lender for the Hanover Square Property which increased the mortgage amount and reduced the interest rate. Under this transaction, the principal amount of the loan was increased to $10,500,000 and the interest rate reduced to a fixed rate of 4.25 percent until January 1, 2023, when the interest rate will adjust to a new fixed rate which will be determined by adding 3.00 percentage points to the daily average yield on United States Treasury securities adjusted to a constant maturity of five years, as made available by the Federal Reserve Board, with a minimum of 4.25 percent. The fixed monthly payment, which includes principal and interest, increased to $56,882. The Company has accounted for this transaction as a loan modification in accordance with ASC 470.
The mortgage loan agreement for the Hanover Square property includes covenants to (i) maintain a Debt Service Coverage Ratio (“DSCR”) in excess of 1.35 to 1.00 and (ii) maintain a loan-to-value of real estate ratio of 75 percent. As of March 31, 2021 and December 31, 2020, respectively, the Company believes that it is compliant with these covenants.
|
| 22 |
| (c) |
The mortgage loan for the Ashley Plaza Property bears interest at a fixed rate of 3.75 percent and is interest only for the first twelve months. Beginning on October 1, 2020, the monthly payment became $52,795 for the remaining term of the loan, which includes interest at the fixed rate, and principal, based on a thirty year amortization schedule.
| |
| (d) |
As of March 31, 2021, the Company reclassified the mortgage loan for the Clemson Best Western Property to mortgages payable, net, associated with assets held for sale (see below).
| |
| (e) | The mortgage loan for the Brookfield Property bears interest at a fixed rate of 3.90 percent and is interest only for the first twelve months. Beginning on November 1, 2020, the monthly payment became $22,876 for the remaining term of the loan, which includes interest at the fixed rate, and principal, based on a thirty year amortization schedule. |
Mortgages payable, net, associated with assets held for sale
The Company’s mortgages payables, net, associated with assets held for sale, consists of the following:
| Balance | ||||||||||||||||||
| Property | Monthly Payment | Interest Rate | Maturity | March 31, (unaudited) | December 31, 2020 | |||||||||||||
| Hampton Inn (a) | Interest only | Variable | May 2022 | $ | 10,400,000 | $ | 10,400,000 | |||||||||||
| Clemson Best Western (b) | Interest only | Variable | October 2022 | 7,750,000 | - | |||||||||||||
| Unamortized issuance costs, net | (173,632 | ) | (48,000 | ) | ||||||||||||||
| Total mortgages payable, net, associated with assets held for sale | 17,976,368 | 10,352,000 | ||||||||||||||||
| (a) |
As of December 31, 2020, the Company reclassified the mortgage loan for the Hampton Inn Property to mortgages payable, net, associated with assets held for sale. The mortgage loan for the Hampton Inn Property matured on November 9, 2020 and, on November 9, 2020 the Company entered into an amendment to extend the loan until May 2022. The Company has accounted for this transaction as a loan modification in accordance with ASC 470. Under this accounting treatment, the Company recorded $54,000 in capitalized loan issuance costs for loan fees paid to the lender and recorded $22,784 in third party costs associated with the transaction as an expense under hotel property operating expenses on the Company’s condensed consolidated statement of operations for the year ended December 31, 2020.
The mortgage loan for the Hampton Inn Property bears interest at a variable rate based on LIBOR with a minimum rate of 6.50 percent. The interest rate payable is the USD LIBOR one-month rate plus 6.25 percent. As of March 31, 2021 and December 31, 2020, the rate in effect for the Hampton Inn Property mortgage was 6.50 percent and 6.50 percent, respectively.
|
| 23 |
| (b) | As of March 31, 2021, the Company reclassified the mortgage loan for the Clemson Best Western Property to mortgages payable, net, associated with assets held for sale. The mortgage loan for the Clemson Best Western Property bears interest at a variable rate based on LIBOR with a minimum rate of 7.15 percent. The interest rate payable is the USD LIBOR one-month rate plus 4.9 percent. As of March 31, 2021 and December 31, 2020, respectively, the rate in effect for the Clemson Best Western Property mortgage was 7.15 percent. |
Convertible Debentures
On October 27, 2020, the Company entered into a definitive agreement with a financing entity to issue and sell convertible debentures in an aggregate principal amount of up to $5 million pursuant to a private offering exempt from registration under the Securities Act of 1933, as amended. The debentures were issued at a 5 percent discount to the principal amount, accrue interest at a rate of 5 percent per annum (payable at maturity), and were closed in three separate tranches as follows: (i) convertible debenture of $1.5 million issued and sold on October 27, 2020 upon the signing of the definitive agreement, (ii) convertible debenture of $2.0 million issued and sold on December 22, 2020 upon the filing of a registration statement with the U.S. Securities and Exchange Commission (“SEC”) relating to the shares of common stock that may be issued upon the conversion of the convertible debentures, and (iii) convertible debenture of $1.5 million issued and sold on January 5, 2021, the date the registration statement was declared effective by the SEC. The second and third closings of the convertible debentures were subject to the Company successfully obtaining approval from its common stockholders for the issuance of shares of common stock that may be issued upon the conversion of the convertible debentures. Net proceeds from the issuance and sale of the convertible debentures totaled $4,231,483.
| Tranche | Closing Date | Principal Amount | Discount | Debt Issuance Costs – Cash | Net Cash Proceeds | ||||||||||||||
| Tranche 1 | October 27, 2020 | $ | 1,500,000 | $ | (75,000 | ) | $ | (155,555 | ) | $ | 1,269,445 | ||||||||
| Tranche 2 | December 22, 2020 | 2,000,000 | (100,000 | ) | (207,407 | ) | 1,692,593 | ||||||||||||
| Tranche 3 | January 5, 2021 | 1,500,000 | (75,000 | ) | (155,555 | ) | 1,269,445 | ||||||||||||
| Total | $ | 5,000,000 | $ | 250,000 | $ | 518,517 | $ | 4,231,483 | |||||||||||
The 5 percent issue discount totaled $250,000 and is being amortized over the one-year term of the debentures using the effective interest method. The Company also paid a total of $518,517 in issuance costs, including legal, accounting, other professional fees, and underwriting discounts. In addition to the closing costs paid in cash, the Company paid $123,000 in debt issuance costs in common shares of the Company. These issuance costs were recorded as deferred debt issuance costs on the accompanying condensed consolidated balance sheets as a direct deduction from the carrying amount of the convertible debentures and are being amortized over the one-year term of the debentures using the effective interest method.
Based on the terms and relevant conversion details, the debt component and embedded conversion option of the debentures are not bifurcated for accounting purposes under ASC 815, Derivative Instruments and Hedging Activities. Because the variable conversion price of the debentures was lower than the market price of the Company’s common stock at the commitment date, the debentures have a beneficial conversion feature as outlined in ASC 470, Debt. The intrinsic value of the beneficial conversion feature totaled $946,840 and was recorded as an increase in additional paid-in capital and a corresponding incremental discount on the carrying value of the debentures.
Each tranche of the convertible debentures has a maturity date one year from its closing date. At its option, the holder at any time may elect to convert any portion of the principal and accrued interest into shares of the Company’s common stock. Conversions into common stock occur at the lower of (1) a fixed conversion price of $2.47, or (2) a variable conversion price equal to 88 percent of the volume-weighted average price of the Company’s common shares for the ten consecutive trading days preceding the conversion date, except that the conversion price cannot be lower than $0.6175. Based on securities and stock exchange regulations, the agreement limits the percentage of the Company’s common shares that may be held at any time by the debenture holder, which effectively limits the amount of principal and interest that the debenture holder may convert without disposing of shares received in earlier conversions. The agreement includes customary representations and warranties, as well as provisions for conversion price adjustments that prevent dilution of the holder’s conversion shares in the event the Company issues additional shares of its common stock prior to the maturity or full conversion of the debentures. At its option, the Company may redeem all or any portion of the outstanding principal and accrued interest prior to the maturity date at a 15% premium to the principal amount, provided that the trading price of its common stock at that time is less than the $2.47 fixed conversion price and it provides the holder with ten business days’ written notice to allow the holder the opportunity to elect conversion of the debentures prior to the redemption.
| 24 |
As of March 31, 2021, the convertible debenture holder has elected to convert a total of $3,750,000 in principal of the convertible debentures and $49,268 in accrued interest to the Company’s common shares, receiving 2,074,775 common shares at an average conversion price of $1.83, as set forth in the table below.
| Conversion Date | Principal Amount Converted | Accrued and Unpaid Interest Converted | Total Conversion Amount | Conversion Price | Common Shares Issued | |||||||||||||||
| January 6, 2021 | $ | 100,000 | $ | 411 | $ | 100,411 | $ | 1.9079 | 52,629 | |||||||||||
| January 14, 2021 | 200,000 | 1,534 | 201,534 | 1.9079 | 105,631 | |||||||||||||||
| January 15, 2021 | 300,000 | 164 | 300,164 | 1.9079 | 157,327 | |||||||||||||||
| January 21, 2021 | 300,000 | 740 | 300,740 | 2.0060 | 149,920 | |||||||||||||||
| January 26, 2021 | 500,000 | 411 | 500,411 | 2.0060 | 249,457 | |||||||||||||||
| February 9, 2021 | 100,000 | 192 | 100,192 | 2.0078 | 49,901 | |||||||||||||||
| February 9, 2021 | 400,000 | 13,699 | 413,699 | 2.0078 | 206,046 | |||||||||||||||
| February 10, 2021 | 500,000 | 219 | 500,219 | 2.0078 | 249,138 | |||||||||||||||
| February 17, 2021 | 200,000 | 1,055 | 201,055 | 2.0193 | 99,567 | |||||||||||||||
| March 10, 2021 | 400,000 | 2,589 | 402,589 | 1.5637 | 257,459 | |||||||||||||||
| March 11, 2021 | 250,000 | 69 | 250,068 | 1.5637 | 159,921 | |||||||||||||||
| March 12, 2021 | 250,000 | 34 | 250,034 | 1.5637 | 159,899 | |||||||||||||||
| March 12, 2021 | 250,000 | 28,151 | 278,151 | 1.5637 | 177,880 | |||||||||||||||
| Total Conversions | $ | 3,750,000 | $ | 49,268 | $ | 3,799,268 | 2,074,775 | |||||||||||||
The principal amount outstanding of the convertible debentures as of March 31, 2021 and December 31, 2020 was $1,250,000 and $3,500,000, respectively. As of March 31, 2021, and December 31, 2020, the carrying amount of the convertible debentures, net, was $986,837 and $2,260,565, respectively. A reconciliation of the carrying amount as of March 31, 2021 is set forth in the two tables, below.
| Convertible debentures – Reconciliation of Carrying Amount as of March 31, 2021 | |||||||||||||||||||||||||||||||||
| Principal Amount | Discount | Debt Issuance Costs – Cash | Net Cash Proceeds | Debt Issuance Costs – Stock | Beneficial Conversion Feature | 2020 Amortization of Discount, Issuance Costs and Beneficial Conversion Feature (1) | Net Carrying Amount prior to Conversions | ||||||||||||||||||||||||||
| Tranche 1 | $ | 1,500,000 | $ | (75,000 | ) | $ | (155,555 | ) | $ | 1,269,445 | $ | (36,900 | ) | $ | (284,052 | ) | $ | 99,724 | $ | 1,048,217 | |||||||||||||
| Tranche 2 | 2,000,000 | (100,000 | ) | (207,407 | ) | 1,692,593 | (49,200 | ) | (378,736 | ) | 20,146 | 1,284,803 | |||||||||||||||||||||
| Tranche 3 | 1,500,000 | (75,000 | ) | (155,555 | ) | 1,269,445 | (36,900 | ) | (284,052 | ) | - | 948,493 | |||||||||||||||||||||
| Total | $ | 5,000,000 | $ | (250,000 | ) | $ | (518,517 | ) | $ | 4,231,483 | $ | (123,000 | ) | $ | (946,840 | ) | $ | 119,870 | $ | 3,281,513 | |||||||||||||
| (1) | Amortization of convertible debenture discount, issuance costs and beneficial conversion feature for the year ended December 31, 2020 is recorded as a component of interest expense on the Company’s consolidated statements of operations. |
| 25 |
| Convertible debentures – Reconciliation of Carrying Amount as of March 31, 2021 | |||||||||||||||||||||
| Net Carrying Amount prior to Conversions | Amortization of Discount, Issuance Costs and Beneficial Conversion Feature for the three months ended March 31, 2021 (1) | Conversions of Principal Balance of Convertible Debentures | Write-off unamortized Issuance Costs and Beneficial Conversion (2) | Balance – March 31, 2021 | |||||||||||||||||
| Tranche 1 | $ | 1,048,217 | $ | 130,951 | $ | (250,000 | ) | $ | 57,669 | $ | 986,837 | ||||||||||
| Tranche 2 | 1,284,803 | 107,733 | (2,000,000 | ) | 607,464 | - | |||||||||||||||
| Tranche 3 | 948,493 | 23,873 | (1,500,000 | ) | 527,634 | - | |||||||||||||||
| Total | $ | 3,281,513 | $ | 262,557 | $ | (3,750,000 | ) | $ | 1,192,767 | $ | 986,837 | ||||||||||
| (1) | Amortization of convertible debenture discount, issuance costs and beneficial conversion feature for the three months ended March 31, 2021 are recorded as a component of interest expense on the Company’s condensed consolidated statements of operations. |
| (2) | Upon conversion of a portion of the convertible debentures, a pro rata share of the unamortized discount, issuance costs and beneficial conversion feature are written off. Any such amounts written off are recorded as a component of interest expense on the Company’s condensed consolidated statements of operations for the three months ended March 31, 2021. |
Line of credit, short term and note payable, short term
As of March 31, 2021 and December 31, 2020, the Company had a line of credit, short term, outstanding in the principal amount of $325,000 and $325,000, respectively. The line of credit, short term, was established on August 21, 2019 to provide short term funding for the Company’s acquisition of the Ashley Plaza Property and the Clemson Best Western Property (see discussion of 2019 acquisitions in Note 3, above). On February 20, 2020, the Company repaid the line of credit, short term, in the amount of $2,000,000 plus accrued interest of $21,437. Effective on February 21, 2020, the original maturity date of the line of credit, short term, the Company extended the line of credit, short term, for 60 days until April 21, 2020. On March 3, 2020 the Company received $550,000 in funding from the line of credit, short term, to fund working capital and dividend payments. On April 21, 2020, the Company extended the line of credit, short term, for 40 days until May 31, 2020. On May 31, 2020, the Company extended the line of credit, short term, for 90 days until August 31, 2020. On August 12, 2020, the Company extended the line of credit, short term, until September 30, 2020. On November 4, 2020, the Company made a $225,000 payment to reduce the balance of the line of credit, short term to $325,000, and extended the line of credit, short term, until March 31, 2021. On March 18, 2021 the Company extended the line of credit, short term, until April 30, 2021. On April 21, 2021 the Company repaid the line of credit, short term, in full.
The line of credit, short term, bears interest at a variable rate calculated at 250 basis points over USD 1-Month LIBOR as published in the Wall Street Journal. The rate adjusts on the first day of each month during which the loan is outstanding. As of March 31, 2021 and December 31, 2020, the rate in effect for the line of credit, short term, was 2.619 percent and 2.653 percent, respectively. Interest expense for the three months ended March 31, 2021 and 2020 includes amortization of the capitalized issuance costs of $0 and $10,000, respectively, using the straight-line method, which approximates to the effective interest method, over the initial, six-month term of the loan.
| 26 |
Notes payable
As of March 31, 2021 and December 31, 2020, the Company had a note payable outstanding in the principal amount of $176,300 and $176,300, respectively, under the Small Business Administration’s Paycheck Protection Program (the “SBA PPP Loan Program”). This note was issued on April 30, 2020, on behalf of a subsidiary, MDR PMI Greensboro TRS, LLC, the entity that operates the Hampton Inn Property. The Company used these funds pursuant to the limitations established by the SBA PPP Loan Program for payroll and other eligible expenses for the Hampton Inn Property. Under the terms of the loan, all, a portion or none of the loan may be forgiven, based on criteria established by the SBA PPP Loan Program. The Company believes that it has expended the loan funds in accordance with the criteria required for forgiveness and has submitted its forgiveness application to the SBA PPP Loan Program, but there is no assurance that all or a portion of the loan will be forgiven. Any portion of the loan that is not forgiven will bear interest at a fixed rate of 1 percent per annum and be repaid in 18 monthly installments of principal and interest of $9,923. Under the original terms of the SBA PPP Loan Program, principal and interest payments would have commenced on November 1, 2020. However, due to changes in regulations for the SBA PPP Loan Program, commencement of principal and interest payments were extended until ten months after the completion of the borrower’s “Covered Period”, as defined by the SBA PPP Loan Program to provide borrowers sufficient time to submit loan forgiveness applications. Under these guidelines, the Company’s principal and interest payments for the Hampton Inn PPP loan would commence on August 15, 2021 if the Company does not qualify for loan forgiveness.
Interest expense
Interest expense, including amortization of capitalized issuance costs consists of the following:
For the three months ended March 31, 2021 (unaudited) | ||||||||||||||||
| Mortgage Interest Expense | Amortization of discounts and capitalized issuance costs | Other interest expense | Total | |||||||||||||
| Franklin Square | $ | 167,731 | $ | 2,322 | $ | - | $ | 170,053 | ||||||||
| Hanover Square | 110,832 | 3,234 | - | 114,066 | ||||||||||||
| Hampton Inn | 169,000 | 9,000 | 4,378 | 182,378 | ||||||||||||
| Ashley Plaza | 106,086 | 4,359 | - | 110,445 | ||||||||||||
| Clemson Best Western | 138,531 | 22,437 | 1,576 | 162,544 | ||||||||||||
| Brookfield Center | 47,084 | 2,838 | - | 49,922 | ||||||||||||
| Amortization and preferred stock dividends on mandatorily redeemable preferred stock | - | 49,449 | 100,000 | 149,449 | ||||||||||||
| Amortization and interest on convertible debentures | - | 1,455,324 | 36,219 | 1,491,543 | ||||||||||||
| Line of credit, short term | - | - | 2,744 | 2,744 | ||||||||||||
| Other interest | - | - | 988 | 988 | ||||||||||||
| Total interest expense | $ | 739,264 | $ | 1,548,963 | $ | 145,905 | $ | 2,434,132 | ||||||||
For the three months ended March 31, 2020 (unaudited) | ||||||||||||||||
| Mortgage Interest Expense | Amortization of discounts and capitalized issuance costs | Other interest expense | Total | |||||||||||||
| Franklin Square | $ | 169,595 | $ | 4,638 | $ | - | $ | 174,233 | ||||||||
| Hanover Square | 103,684 | 3,183 | - | 106,867 | ||||||||||||
| Hampton Inn | 174,929 | 34,890 | 3,987 | 213,806 | ||||||||||||
| Ashley Plaza | 108,064 | 4,359 | - | 112,423 | ||||||||||||
| Clemson Best Western | 140,070 | 22,437 | 1,991 | 164,498 | ||||||||||||
| Brookfield Center | 47,813 | 2,838 | - | 50,651 | ||||||||||||
| Amortization and preferred stock dividends on mandatorily redeemable preferred stock | - | 20,299 | 44,444 | 64,743 | ||||||||||||
| Line of credit, short term | - | 10,000 | 13,572 | 23,572 | ||||||||||||
| Related party notes payable, short term | - | - | 5,835 | 5,835 | ||||||||||||
| Other interest | - | - | 1,504 | 1,504 | ||||||||||||
| Total interest expense | $ | 744,155 | $ | 102,644 | $ | 71,333 | $ | 918,132 | ||||||||
| 27 |
Interest accrued and accumulated amortization of capitalized issuance costs consist of the following:
As of March 31, 2021 (unaudited) | As of December 31, 2020 | |||||||||||||||
| Accrued interest | Accumulated amortization of capitalized issuance costs | Accrued interest | Accumulated amortization of capitalized issuance costs | |||||||||||||
| Franklin Square | $ | 57,774 | $ | 68,032 | $ | 57,774 | $ | 65,710 | ||||||||
| Hanover Square | 36,551 | 37,322 | 35,820 | 34,088 | ||||||||||||
| Hampton Inn | 58,211 | 433,691 | 58,211 | 424,691 | ||||||||||||
| Ashley Plaza | 36,481 | 27,607 | 36,649 | 23,248 | ||||||||||||
| Clemson Best Western | 47,716 | 134,622 | 47,716 | 112,185 | ||||||||||||
| Brookfield Center | 16,192 | 17,028 | 16,264 | 14,190 | ||||||||||||
| Amortization and preferred stock dividends on mandatorily redeemable preferred stock | 70,004 | 211,824 | 70,004 | 162,375 | ||||||||||||
| Amortization and interest on convertible debentures | 3,253 | 1,575,194 | 16,301 | 119,870 | ||||||||||||
| Line of credit, short term | 1,089 | - | 732 | - | ||||||||||||
| Total | $ | 327,271 | $ | 2,505,320 | $ | 339,471 | $ | 956,357 | ||||||||
Debt Maturity
The Company’s scheduled principal repayments on indebtedness as of March 31, 2021 are as follows:
| Mortgages Payable | Mortgages Payable Associated with Assets Held for Sale | Convertible | Line of Credit, Short Term | Notes Payable, Short Term | Total | |||||||||||||||||||
| For the remaining nine months ending December 31, 2021 | $ | 14,669,807 | $ | - | $ | 1,250,000 | $ | 325,000 | $ | 176,300 | $ | 16,421,107 | ||||||||||||
| 2022 | 552,038 | 18,150,000 | - | - | - | 18,702,038 | ||||||||||||||||||
| 2023 | 574,856 | - | - | - | - | 574,856 | ||||||||||||||||||
| 2024 | 595,788 | - | - | - | - | 595,788 | ||||||||||||||||||
| 2025 | 623,247 | - | - | - | - | 623,247 | ||||||||||||||||||
| Thereafter | 23,698,310 | - | - | - | - | 23,698,310 | ||||||||||||||||||
| Total principal payments and debt maturities | 40,714,046 | 18,150,000 | 1,250,000 | 325,000 | 176,300 | 60,615,346 | ||||||||||||||||||
| Less unamortized issuance costs | (334,020 | ) | (173,632 | ) | (263,163 | ) | - | - | (770,815 | ) | ||||||||||||||
| Net principal payments and debt maturities | $ | 40,380,026 | $ | 17,976,368 | $ | 986,837 | $ | 325,000 | $ | 176,300 | $ | 59,844,531 | ||||||||||||
| 28 |
| 6. | Rentals under Operating Leases |
Future minimum rents (based on recognizing future rents on the straight-line basis) to be received under noncancelable tenant operating leases for each of the next five years and thereafter, excluding common area maintenance and other expense pass-throughs, as of March 31, 2021 are as follows:
| For the remaining nine months ending December 31, 2021 | $ | 3,275,680 | ||
| 2022 | 3,946,592 | |||
| 2023 | 3,525,302 | |||
| 2024 | 2,816,405 | |||
| 2025 | 2,356,145 | |||
| Thereafter | 5,092,961 | |||
| Total minimum rents | $ | 21,013,085 |
| 7. | Equity |
The Company has authority to issue 1,000,000,000 shares consisting of 750,000,000 shares of common stock, $0.01 par value per share ("Common Shares"), and 250,000,000 shares of preferred stock, $0.01 par value per share ("Preferred Shares"). Substantially all of the Company’s business is conducted through its Operating Partnership. The REIT is the sole general partner of the Operating Partnership and owned a 96.88% and 95.74% interest in the Operating Partnership as of March 31, 2021 and December 31, 2020, respectively. Limited partners in the Operating Partnership who have held their units for one year or longer have the right to redeem their common units for cash or, at the REIT’s option, Common Shares at a ratio of one common unit for one common share. Under the Agreement of Limited Partnership, distributions to unit holders are made at the discretion of the REIT. The REIT intends to make distributions in a manner that will result in limited partners of the Operating Partnership receiving distributions at the same rate per unit as dividends per share are paid to the REIT’s holders of Common Shares.
Common shares and operating partnership units outstanding
As of March 31, 2021 and December 31, 2020, respectively, there were 7,159,007 and 5,016,818 common units of the Operating Partnership outstanding with the REIT owning 6,945,476 and 4,803,287, respectively, of these common units. As of March 31, 2021 and December 31, 2020, respectively, there were 6,945,476 and 4,803,287 Common Shares of the REIT outstanding. As of March 31, 2021 and December 31, 2020, respectively, there were 213,531 and 119,681 common units of the Operating Partnership that were eligible for conversion to the Company’s Common Shares.
2018 Equity Incentive Plan
The Company’s 2018 Equity Incentive Plan (the “Plan”) was adopted by the Company’s Board of Directors on July 27, 2018 and approved by the Company’s shareholders on August 23, 2018. The Plan permits the grant of stock options, stock appreciation rights, stock awards, performance units, incentive awards and other equity-based awards (including LTIP units of the Company’s Operating Partnership) to its employees or an affiliate (as defined in the Plan) of the Company and for up to the greater of (i) 240,000 shares of common stock and (ii) eight percent (8%) of the number of fully diluted shares of the Company’s Common Shares (taking into account interests in the Operating Partnership that may become convertible into Common Shares).
On March 11, 2020, the Company’s Compensation Committee approved a grant of 156,522 shares of Common Shares to two employees of the Manager who also serve as directors of the Company, a grant of 65,215 Common Shares to the Company’s five independent directors, and a grant of 26,087 shares to the chief financial officer of the Company. The effective date of the grants was March 11, 2020. The Common Shares granted vest immediately and are unrestricted. However, the Plan includes other restrictions on the sale of shares issued under the Plan. Because the Common Shares vested immediately, the fair value of the grants, or $569,995, was recorded to share based compensation expense on the Company’s condensed consolidated statements of operations on the effective date of the grant. The fair value of the grants was determined by the market price of the Company’s Common Shares on the effective date of the grant.
| 29 |
On March 16, 2021, the Company’s Compensation Committee approved a grant of 40,356 Common Shares to the Company’s three independent directors, and a grant of 26,900 shares to the chief financial officer of the Company. The effective date of the grants was March 16, 2020. The Common Shares granted vest immediately and are unrestricted. However, the Plan includes other restrictions on the sale of shares issued under the Plan. Because the Common Shares vested immediately, the fair value of the grants, or $149,981, was recorded to share based compensation expense on the Company’s condensed consolidated statements of operations on the effective date of the grant. The fair value of the grants was determined by the market price of the Company’s Common Shares on the effective date of the grant.
On each January 1 during the term of the Plan, the maximum number of shares of common stock that may be issued under the Plan will increase by eight percent (8%) of any additional shares of common stock or interests in the Operating Partnership issued (i) after the completion date the Company’s initial registered public offering of common stock, in the case of the January 1, 2019 adjustment, or (ii) in the preceding calendar year, in the case of any adjustment subsequent to January 1, 2020. As of January 1, 2021, the shares available for issuance under the plan was adjusted to 76,849 shares. As of March 31, 2021 the shares available for issuance under the plan was 9,593 shares.
Earnings per share
Basic earnings per share for the Company’s Common Shares is calculated by dividing income (loss) from continuing operations, excluding the net income (loss) attributable to noncontrolling interests, by the Company’s weighted-average number of Common Shares outstanding during the period. Diluted earnings per share is computed by dividing the net income attributable to common shareholders, excluding the net loss attributable to noncontrolling interests, by the weighted average number of Common Shares, including any dilutive shares. As of March 31, 2021 and December 31, 2020, respectively, 213,531 and 119,681 of the Operating Partnership’s 213,531 common units outstanding were eligible to be converted, on a one-to-one basis, into Common Shares. In addition, the outstanding balance of the Company’s convertible debentures outstanding as of March 31, 2021 was eligible to be converted at the option of the holder into Common Shares at the prevailing variable conversion price. The Operating Partnership’s common units and the equivalent common shares attributable to the convertible debentures have been excluded from the Company’s diluted earnings per share calculation because their inclusion would be antidilutive.
The Company's loss per common share is determined as follows:
| Three months ended March 31, | ||||||||
| 2021 | 2020 | |||||||
| Basic and diluted shares outstanding | ||||||||
| Weighted average Common Shares – basic | 5,856,365 | 4,553,440 | ||||||
| Effect of conversion of operating partnership units | 213,531 | 125,000 | ||||||
| Effect of conversion of convertible debentures (1) | 739,128 | - | ||||||
| Weighted average Common Shares – diluted | 6,809,024 | 4,678,440 | ||||||
| Calculation of earnings per share – basic and diluted | ||||||||
| Net loss attributable to common shareholders | $ | (2,277,524 | ) | $ | (1,724,293 | ) | ||
| Weighted average Common Shares – basic and diluted | 5,856,365 | 4,553,440 | ||||||
| Loss per share – basic and diluted | $ | (0.39 | ) | $ | (0.38 | ) | ||
| (1) | Represents the number of shares that would be issued if all outstanding convertible debentures and accrued interest were converted into Common Shares on March 31, 2021 at a price equal to 88 percent of the lowest volume weighted average price for the prior 10 trading days, or $1.6956 per share. |
Dividends and Distributions
During the three months ended March 31, 2020, a dividend in the amount of $0.125 was paid on March 10, 2020 to shareholders of record on February 11, 2020. During the three months ended March 31, 2021 no dividends were paid.
| 30 |
Total dividends and distributions to noncontrolling interests paid during the three months ended March 31, 2021 and 2020, respectively, are as follows:
| Three months ended March 31, | ||||||||
| 2021 | 2020 | |||||||
| Common shareholders (dividends) | $ | - | $ | 562,537 | ||||
| Hanover Square Property noncontrolling interest (distributions) | 12,000 | 20,800 | ||||||
| Operating Partnership unit holders (distributions) | - | 27,356 | ||||||
| Total dividends and distributions | $ | 12,000 | $ | 610,693 | ||||
| 8. | Commitments and Contingencies |
Insurance
The Company carries comprehensive liability, fire, extended coverage, business interruption and rental loss insurance covering all of the properties in its portfolio, in addition to other coverages that may be appropriate for certain of its properties. Additionally, the Company carries a directors and officers liability insurance policy that covers such claims made against the Company and its directors and officers. The Company believes the policy specifications and insured limits are appropriate and adequate for its properties given the relative risk of loss, the cost of the coverage and industry practice; however, its insurance coverage may not be sufficient to fully cover its losses.
Concentration of Credit Risk
The Company is subject to risks incidental to the ownership and operation of commercial real estate. These risks include, among others, the risks normally associated with changes in the general economic climate, trends in the retail industry, creditworthiness of tenants, competition for tenants and customers, changes in tax laws, interest rates, the availability of financing and potential liability under environmental and other laws. The Company’s portfolio of properties is dependent upon regional and local economic conditions and is geographically concentrated in the Mid-Atlantic, specifically in South Carolina, North Carolina and Virginia, which represented 100 percent of the total annualized base revenues of the properties in its portfolio as of December 31, 2020. The Company’s geographic concentration may cause it to be more susceptible to adverse developments in those markets than if it owned a more geographically diverse portfolio. Additionally, the Company’s retail shopping center properties depend on anchor stores or major tenants to attract shoppers and could be adversely affected by the loss of, or a store closure by, one or more of these tenants.
Mortgage Maturity
The Company’s Franklin Square Property mortgage in the principal amount of $14,275,000 matures during the year ending December 31, 2021. While the Company anticipates being able to refinance the mortgage at reasonable market terms upon maturity, inability to do so may materially impact the Company’s financial position and results of operations.
Other Risks and Uncertainties
Since March 2020, the Company’s investment properties have been significantly impacted by (i) measures taken by local, state and federal authorities to mitigate the impact of COVID-19, such as mandatory business closures, quarantines, restrictions on travel and “shelter-in-place” or “stay-at-home” orders and (ii) significant changes in consumer behavior and business and leisure travel patterns. While some of the measures have been relaxed by the respective governmental authorities, with the uncertainty resulting from the continued spread of COVID-19 and its new variants and the possibility of the re-imposition of mandatory business closures, quarantines, restrictions on travel and “shelter-in-place” or “stay-at-home” orders by some governmental authorities, and the possibility that changes in consumer behavior and business and leisure travel patters will continue, the negative impact on room demand for our hotel properties and consumer demand for the goods and services of our retail tenants within our portfolio could continue to be significant in the coming months.
| 31 |
Retail Center and Flex Center Properties
As of the date of this Quarterly Report on Form 10-Q, all of the tenants in the Company’s retail properties (the Franklin Square Property, Hanover Square Property and Ashley Plaza Property) and flex property (Brookfield Center) are open, with two exceptions. During the year ended December 31, 2020, a tenant in the Franklin Square Property defaulted on its lease and abandoned its premises, resulting in the recognition of the loss on impairment recorded during the year ended December 31, 2020. A second tenant in the Hanover Square Property which was operating under bankruptcy protection, did not renew its lease upon its expiration. However, this space has been re-leased.
As is the case with retail landlords across the U.S., the Company received a number of rent relief requests from tenants, which the Company evaluated on a case-by-case basis. As of the date of this Quarterly Report on Form 10-Q, the Company has granted lease concessions in the form of (i) rent deferrals or (ii) rent abatements. These deferral and abatement agreements will reduce the rent revenues the Company expects to receive in future periods, as discussed below.
Under the rent deferral agreements, the tenants have agreed to repay unpaid rent over a specified time period or before a certain date. Under these rent deferral agreements reached during the year ended December 31, 2020, the Company agreed to defer $20,174 in base rent payments during the three months ended March 31, 2021. No such deferrals were granted for the three months ended March 31, 2020. For the remaining nine months ending December 31, 2021, the Company has agreed to defer $61,599 in base rent payments. For the nine months ended December 31, 2020, the Company deferred $228,346 in base rent payments. Deferred rent is recognized as retail center property revenues or flex center property revenues on the Company’s condensed consolidated statement of operations and as rent and other receivables on the Company’s condensed consolidated balance sheets.
Under the rent abatement agreements reached during the year ended December 31, 2020, the Company agreed to permanently abate rent in exchange for lease extensions of between one and three years, depending on the amount of the abatement. In one case, the Company agreed to abate a portion of a tenant’s base rent in exchange for future rent payments based on the tenant’s monthly sales. For the three months ended March 31, 2021 and 2020, the Company abated rents of $109,818 and $0, respectively. For the remaining nine months ending December 31, 2021, the Company has agreed to abate an additional $329,453 in base rent. For the nine months ended December 31, 2020, the Company abated $346,896 in base rents. For the year ending December 31, 2022 the Company has agreed to abate rent of $174,330. Abated rent is excluded from future minimum rents in Note 6, above.
In addition to the deferrals and abatements, two tenants in the Company’s retail property centers declared bankruptcy and one tenant defaulted on its lease during the year ended December 31, 2020. While under bankruptcy protection, the first tenant’s term expired on June 30, 2020 and the Company was unable to collect rent totaling $18,750. This rent was recognized and then written off and is recorded as bad debt expense on the Company’s consolidated statement of operations for the year ended December 31, 2020. A second tenant declared bankruptcy and then emerged from bankruptcy protection during the year ended December 31, 2020. As part of the bankruptcy proceeding, the tenant’s lease was restructured, resulting in rent abatements of $16,440 and $0 for the three months ended March 31, 2021 and 2020. For the remaining nine months ending December 31, 2021, the Company agreed to abate an additional $37,320 in base rent. For the nine months ended December 31, 2020, the Company abated $77,653 in base rent. Additionally, the Company agreed to abate base rent of $22,760 for the year ended December 31, 2022 and $7,300 for the year ended December 31, 2023. Under the restructured lease, the Tenant’s lease term, which originally expired in 2023, was extended for one five-year period.
A third tenant defaulted on its lease and abandoned its premises. During the year ended December 31, 2020, the Company wrote off a total of $34,556 in rent and CAM. Of this amount, $16,842 was initially recorded as retail center property revenues, $8,817 was initially recorded as retail property tenant reimbursements on the Company’s condensed consolidated statement of operations for the year ended December 31, 2020 and $8,897 was initially recorded as retail center property revenues and retail property tenant reimbursements on the Company’s consolidated statement of operations for the year ended December 31, 2019. These amounts were then recorded as bad debt expense on the Company’s consolidated statement of operations for the year ended December 31, 2020. In addition, the Company was not able to collect rent totaling $61,055 for the year ending December 31, 2020 and will not collect future rents of $530,544 under this lease.
| 32 |
In return for (i) granting abatements and (ii) restructuring the lease of the tenant under bankruptcy protection, the Company received lease extension agreements of between one and five years, resulting in additional future rents payable under these leases as follows. These amounts are included in future minimum rents in Note 6, above.
| Additional Rent Under Term Extensions (1) | ||||||||||||||||||||||||||||||||
| For the year ended December 31, | ||||||||||||||||||||||||||||||||
| 2020 | 2021 | 2022 | 2023 | 2024 | 2025 | Thereafter | Total | |||||||||||||||||||||||||
| Franklin Square | $ | - | $ | - | $ | 161,849 | $ | 277,456 | $ | 333,039 | $ | 360,830 | $ | 111,165 | $ | 1,244,339 | ||||||||||||||||
| Hanover Square | - | - | 242,069 | 259,306 | 76,550 | - | - | 577,925 | ||||||||||||||||||||||||
| Ashley Plaza | - | - | - | 124,993 | 125,000 | 128,333 | 744,858 | 1,123,184 | ||||||||||||||||||||||||
| Brookfield Center | - | - | - | - | - | - | - | - | ||||||||||||||||||||||||
| Total | $ | - | $ | - | $ | 403,918 | $ | 661,755 | $ | 534,589 | $ | 489,163 | $ | 856,023 | $ | 2,945,448 | ||||||||||||||||
| (1) | Excludes future rent payments based on tenant’s monthly sales revenues. |
There is no assurance that the Company will receive these future rent payments.
While the Company’s rent collections from its retail and flex center properties have stabilized, the extent of the continued impact of COVID-19 on revenues from the Company’s retail and flex center properties and tenants remains uncertain and will depend on future developments, which are highly uncertain and cannot be predicted with confidence, including the scope, severity and duration of the pandemic, the speed and effectiveness of vaccine and treatment developments and deployment, and potential mutations of COVID-19 and the response thereto.
Revenues will be impacted by the deferral and abatement agreements (discussed above) that the Company has granted to various tenants. Additionally, revenues could continue to be negatively impacted until consumer demand for the goods and services of the Company’s retail and flex center tenants returns to levels prior to the virus outbreak. However, the direct and indirect economic effects of the pandemic and containment measures and the potential for changes in consumer behavior and business and leisure travel patterns could continue to have a significant negative impact on consumer demand for the goods and services of the Company’s retail tenants within its portfolio in the coming months.
Hotel Properties
Beginning in March 2020, COVID-19 caused widespread cancellations of both business and leisure travel throughout the United States, resulting in significant decreases in the Company’s hotel property (the Hampton Inn Property and the Clemson Best Western Property), revenues and the hospitality industry as a whole. With the overall uncertainty of the longevity of COVID-19 in the U.S. and the resulting economic decline, it is difficult to project the duration of revenue declines for the industry and the Company. However, the Company currently expects the decline in revenue and operating results as compared to 2019 to continue throughout 2021 and potentially into future years.
| 33 |
Operating statistics for the three months ended March 31, 2021 and 2020, respectively, and the years ended December 31, 2020 and 2019, respectively, for the Hampton Inn Property were as follows:
| Occupancy | Average Daily Rate | |||||||||||||||||||||||
| Hampton Inn Property | 2021 | 2020 | 2019 | 2021 | 2020 | 2019 | ||||||||||||||||||
| January | 47.8 | % | 41.6 | % | 43.9 | % | $ | 72.85 | $ | 100.41 | $ | 94.57 | ||||||||||||
| February | 68.3 | % | 72.0 | % | 51.9 | % | 81.74 | 102.73 | 105.15 | |||||||||||||||
| March | 51.8 | % | 33.3 | % | 64.1 | % | 94.10 | 106.98 | 109.11 | |||||||||||||||
| April | % | 25.7 | % | 62.3 | % | 65.15 | 149.33 | |||||||||||||||||
| May | % | 41.5 | % | 55.8 | % | 67.87 | 111.37 | |||||||||||||||||
| June | % | 49.6 | % | 72.1 | % | 73.40 | 103.89 | |||||||||||||||||
| July | % | 65.1 | % | 60.8 | % | 71.34 | 110.57 | |||||||||||||||||
| August | % | 50.3 | % | 75.7 | % | 77.73 | 107.29 | |||||||||||||||||
| September | % | 59.8 | % | 65.0 | % | 80.27 | 105.22 | |||||||||||||||||
| October | % | 41.8 | % | 75.0 | % | 99.43 | 160.01 | |||||||||||||||||
| November | % | 28.8 | % | 66.6 | % | 83.02 | 106.43 | |||||||||||||||||
| December | % | 24.4 | % | 48.7 | % | 75.67 | 99.43 | |||||||||||||||||
| Full Year | % | 44.4 | % | 60.6 | % | $ | 84.10 | $ | 113.41 | |||||||||||||||
During the period of the year ended December 31, 2020 that was impacted by COVID-19 (March through December, 2020) significant portions of the occupancy was generated by non-traditional sources, including an agreement with the City of Greensboro to house homeless families. During this period, this agreement resulted in 5,704 room nights of occupancy, or approximately 28 percent of the total occupied rooms during the year ended December 31, 2020 and 39 percent of the occupied rooms during the nine months of 2020 that were impacted by COVID-19 (March through December 2020). This agreement continued in January and ended in February 2021, resulting in 2,064 room nights of occupancy, or approximately 33 percent of the total occupied rooms during the three months ended March 31, 2021 and 49 percent of the rooms occupied during January and February 2021. While these non-traditional sources of occupancy generated room nights, the average daily rate was significantly lower than prior periods and resulted in significantly reduced hotel property revenues.
Operating statistics for the three months ended March 31, 2021 and 2020, respectively, and the years ended December 31, 2020 and 2019, respectively, for the Clemson Best Western Property were as follows:
| Occupancy | Average Daily Rate | |||||||||||||||||||||||
| Clemson Best Western Property | 2021 | 2020 | 2019 | 2021 | 2020 | 2019 | ||||||||||||||||||
| January | 100.0 | % | 24.8 | % | 27.4 | % | $ | 55.13 | $ | 77.04 | $ | 98.10 | ||||||||||||
| February | 100.0 | % | 31.9 | % | 34.8 | % | 58.83 | 94.07 | 92.03 | |||||||||||||||
| March | 100.0 | % | 26.7 | % | 67.3 | % | 56.05 | 90.58 | 92.61 | |||||||||||||||
| April | % | 24.5 | % | 47.4 | % | 68.97 | 103.92 | |||||||||||||||||
| May | % | 19.9 | % | 37.5 | % | 61.54 | 109.69 | |||||||||||||||||
| June | % | 24.0 | % | 38.4 | % | 61.24 | 93.80 | |||||||||||||||||
| July | % | 22.7 | % | 31.6 | % | 56.13 | 85.34 | |||||||||||||||||
| August | % | 27.0 | % | 47.2 | % | 64.35 | 111.60 | |||||||||||||||||
| September | % | 65.0 | % | 38.5 | % | 67.59 | 161.11 | |||||||||||||||||
| October | % | 100.0 | % | 38.3 | % | 58.99 | 143.35 | |||||||||||||||||
| November | % | 100.0 | % | 39.3 | % | 58.48 | 121.87 | |||||||||||||||||
| December | % | 99.7 | % | 28.4 | % | 26.94 | 83.12 | |||||||||||||||||
| Full Year | % | 47.2 | % | 34.9 | % | $ | 59.08 | $ | 118.64 | |||||||||||||||
| (1) | January through August 2019 data for the Clemson Best Western Property is from the prior owner. September 2019 data is from the September 2019 STR report for the Clemson Best Western Property. |
Occupancy rates from October 2020 through March 2021 were a result of an agreement by which the Company leased the entire Clemson Best Western Property to Clemson University from September 14, 2020 through December 15, 2020. In January 2021, this agreement was extended through May 5, 2020.
| 34 |
While intense efforts to reduce operating costs have resulted in expense reductions in the period during which the Company’s hotel operations have been impacted by COVID-19, the Company cannot be certain as to what level of savings can continue to be achieved overall to mitigate the material decline in hotel revenues it may continue to experience. The federal government has provided assistance to the industries negatively affected by the virus, including the hospitality industry, and our two hotel properties have received loans under one of these programs (see Note 5), but the aid has not mitigated the material reduction in revenue resulting from COVID-19 travel impacts. The Company was not eligible to participate in the new Payroll Protection Program loans announced in December 2020.
Due to the depressed outlook for leisure and business travel, on which both of the Company’s hotel properties rely significantly, the Company committed to a plan to sell the Hampton Inn Property and the Clemson Best Western Property as discussed above. There is no assurance that the Company will be able to complete the sales of the two hotel properties.
Until such time as the virus is contained or eradicated and room demand for the Company’s hotel properties and consumer demand for the goods and services of the Company’s retail and flex center tenants returns to more customary levels, the Company may continue to experience material reductions in its operating revenue. The anticipated negative impact on revenues, discussed above, from the Company’s retail, flex center and hotel properties has also, and will continue, to impact the Company’s liquidity, resulting in reduced cash flow to meet the Company’s obligations and to fund dividend distribution payments.
Regulatory and Environmental
As the owner of the buildings on its properties, the Company could face liability for the presence of hazardous materials (e.g., asbestos or lead) or other adverse conditions (e.g., poor indoor air quality) in its buildings. Environmental laws govern the presence, maintenance, and removal of hazardous materials in buildings, and if the Company does not comply with such laws, it could face fines for such noncompliance. Also, the Company could be liable to third parties (e.g., occupants of the buildings) for damages related to exposure to hazardous materials or adverse conditions in its buildings, and the Company could incur material expenses with respect to abatement or remediation of hazardous materials or other adverse conditions in its buildings. In addition, some of the Company’s tenants routinely handle and use hazardous or regulated substances and wastes as part of their operations at the Company’s properties, which are subject to regulation. Such environmental and health and safety laws and regulations could subject the Company or its tenants to liability resulting from these activities. Environmental liabilities could affect a tenant’s ability to make rental payments to the Company, and changes in laws could increase the potential liability for noncompliance. This may result in significant unanticipated expenditures or may otherwise materially and adversely affect the Company’s operations. The Company is not aware of any material contingent liabilities, regulatory matters or environmental matters that may exist.
Seasonality
The hotel industry historically has been seasonal in nature. Seasonal variations in occupancy at the Company’s hotels may cause quarterly fluctuations in its revenues. Occupancy rates and hotel revenues for the Company’s Hampton Inn Property are highest in April/May and October due to a local event that generates significant demand, and generally greater in the second and third quarters than in the first quarter and in November and December. Occupancy rates and hotel revenues for the Company’s Clemson Best Western Property are highest in the spring and fall months, due to sporting events at Clemson University. To the extent that cash flow from operations is insufficient during any quarter due to temporary or seasonal fluctuations in revenue, the Company expects to utilize cash on hand or available financing sources to meet cash requirements.
Litigation
The Company is not currently involved in any litigation or legal proceedings.
| 35 |
| 9. | Related Party Transactions |
Medalist Fund Manager, Inc. (the “Manager”)
The Company is externally managed by the Manager, which makes all investment decisions for the Company. The Manager oversees the Company’s overall business and affairs and has broad discretion to make operating decisions on behalf of the Company and to make investment decisions.
The Company pays the Manager a monthly asset management fee equal to 0.125% of stockholders’ equity, payable in arrears in cash. For purposes of calculating the asset management fee, the Company’s stockholders’ equity means: (a) the sum of (1) the net proceeds from (or equity value assigned to) all issuances of the Company’s equity and equity equivalent securities (including common stock, common stock equivalents, preferred stock and OP Units issued by the Company’s operating partnership) since inception (allocated on a pro rata daily basis for such issuances during the fiscal quarter of any such issuance), plus (2) the Company’s retained earnings at the end of the most recently completed calendar quarter (without taking into account any non-cash equity compensation expense incurred in current or prior periods), less (b) any amount that the Company has paid to repurchase its common stock issued in this or any subsequent offering. Stockholders’ equity also excludes (1) any unrealized gains and losses and other non-cash items (including depreciation and amortization) that have impacted stockholders’ equity as reported in the Company’s condensed consolidated financial statements prepared in accordance with GAAP, and (2) one-time events pursuant to changes in GAAP, and certain non-cash items not otherwise described above, in each case after discussions between the Company’s Manager and its independent director(s) and approval by a majority of its independent directors.
For the three months ended March 31, 2021 and 2020, the Company incurred $175,040 and $144,862, in asset management fees, respectively. Asset management fees are recorded on the Company’s condensed consolidated statements of operations as either (i) retail center property operating expenses, (ii) hotel property operating expenses or (iii) legal, accounting and other professional fees, depending on the basis on which the asset management fee is determined.
The Manager also receives an acquisition fee of 2.0% of the purchase price plus transaction costs, for each property acquired or investment made on the Company’s behalf at the closing of the acquisition of such property or investment, in consideration for the Manager’s assistance in effectuating such acquisition. Acquisition fees are allocated and added to the fair value of the tangible assets acquired and recorded as part of investment properties, net, on the Company’s condensed consolidated balance sheets. No acquisition fees were earned or paid during the three months ended March 31, 2021 or March 31, 2020, respectively.
The Manager will be entitled to an incentive fee, payable quarterly, equal to an amount, not less than zero, equal to the difference between (1) the product of (x) 20% and (y) the difference between (i) Adjusted Funds from Operations (AFFO) (as further defined below) for the previous 12-month period, and (ii) the product of (A) the weighted average of the issue price of equity securities issued in this offering and in future offerings and transactions, multiplied by the weighted average number of all shares of common stock outstanding on a fully-diluted basis (including any restricted stock units, any restricted shares of common stock and OP Units) in the previous 12-month period, exclusive of equity securities issued prior to this offering, and (B) 7%, and (2) the sum of any incentive fee paid to the Manager with respect to the first three calendar quarters of such previous 12-month period. For purposes of calculating the incentive fee during the first years after completion of this offering, adjusted funds from operations (“AFFO”) will be determined by annualizing the applicable period following completion of this offering. AFFO is calculated by removing the effect of items that do not reflect ongoing property operations. The Company further adjusts funds from operations (“FFO”) for certain items that are not added to net income in the National Association of Real Estate Investment Trusts’ (NAREIT) definition of FFO, such as acquisition expenses, equity based compensation expenses, and any other non-recurring or non-cash expenses, which are costs that do not relate to the operating performance of the Company’s properties, and subtract recurring capital expenditures (and, when calculating the incentive fee only, we further adjust FFO to include any realized gains or losses on real estate investments). No incentive fees were earned or paid during the three months ended March 31, 2021 or March 31, 2020.
Other related parties
The Company pays Shockoe Properties, LLC, a subsidiary of Dodson Properties, an entity in which one of the owners of the Manager holds a 6.32 percent interest, an annual property management fee of up to three percent of the monthly gross revenues of the Franklin Square, Hanover Square, Ashley Plaza and Brookfield properties. These fees are paid in arrears on a monthly basis. During the three months ended March 31, 2021 and 2020, the Company paid Shockoe Properties, LLC property management fees of $40,566 and $45,325, respectively.
| 36 |
| 10. | Segment Information |
The Company establishes operating segments at the property level and aggregates individual properties into reportable segments based on product types in which the Company has investments. As of December 31, 2020, the Company had the following reportable segments: retail center properties, flex center properties and hotel properties. During the periods presented, there have been no material intersegment transactions.
Although the Company’s flex center property has tenants that are similar to tenants in its retail center properties, the Company considers its flex center properties as a separate reportable segment. Flex properties are considered by the real estate industry as a distinct subset of the industrial market segment. Flex properties contain a mix of industrial/warehouse and office spaces. Warehouse space that is not air conditioned can be used flexibly by building office or showroom space that is air conditioned, depending on tenants’ needs.
Net operating income ("NOI") is a non-GAAP financial measure and is not considered a measure of operating results or cash flows from operations under GAAP. NOI is the primary performance measure reviewed by management to assess operating performance of properties and is calculated by deducting operating expenses from operating revenues. Operating revenues include rental income, tenant reimbursements, hotel income, and other property income; and operating expenses include retail center property and hotel operating costs. The NOI performance metric consists of only revenues and expenses directly related to real estate rental operations. NOI reflects property acquisitions and dispositions, occupancy levels, rental rate increases or decreases, and the recoverability of operating expenses. NOI, as the Company calculates it, may not be directly comparable to similarly titled, but differently calculated, measures for other REITs.
Asset information and capital expenditures by segment are not reported because the Company does not use these measures to assess performance. Depreciation and amortization expense, along with other expense and income items, are not allocated among segments.
The following table presents property operating revenues, expenses and NOI by product type:
| For the three months ended March 31, | ||||||||||||||||||||||||||||||||
| Hotel properties | Retail center properties | Flex center property | Total | |||||||||||||||||||||||||||||
| 2021 | 2020 | 2021 | 2020 | 2021 | 2020 | 2021 | 2020 | |||||||||||||||||||||||||
| Revenues | $ | 1,295,385 | $ | 956,868 | $ | 1,193,641 | $ | 1,376,290 | $ | 182,827 | $ | 195,152 | $ | 2,671,853 | $ | 2,528,310 | ||||||||||||||||
| Operating expenses | 797,395 | 962,696 | 327,930 | 355,597 | 54,088 | 52,559 | 1,179,413 | 1,370,852 | ||||||||||||||||||||||||
| Bad debt expense | - | - | 3,196 | 6,003 | - | - | 3,196 | 6,003 | ||||||||||||||||||||||||
| Net operating income | $ | 497,990 | $ | (5,828 | ) | $ | 862,515 | $ | 1,014,690 | $ | 128,739 | $ | 142,593 | $ | 1,489,244 | $ | 1,151,455 | |||||||||||||||
| 11. | Subsequent Events |
As of May 14, 2021, the following events have occurred subsequent to the March 31, 2021 effective date of the condensed consolidated financial statements:
Common Stock Issuance
On April 13, 2021, the Company issued and sold 8,000,000 Common Shares at an offering price of $1.50 per share. Estimated net proceeds from the issuance totaled $10,918,914, which includes the impact of discounts and offering costs, including the underwriter’s selling commissions and estimated legal and accounting fees.
Termination of the Contract for the Sale of the Hampton Inn Property
On February 17, 2021, the Company entered into a contract with an unrelated party to sell the Hampton Inn Property for $12,650,000. On April 19, 2021 the contract was terminated at the expiration of the purchaser’s due diligence period.
| 37 |
Line of Credit, Short Term, Repayment
On April 21, 2021, the Company repaid in full the line of credit, short term, in the amount of $325,000.
Mandatorily Redeemable Preferred Stock Dividend
On April 30, 2021, a dividend in the amount of $0.50 was paid to mandatorily redeemable preferred stock shareholders of record on April 26, 2021 for the period from February 2, 2021 through April 30, 2021.
Closing on the Lancer Center Acquisition
On May 14, 2021 the Company closed on the acquisition of the Lancer Center Shopping Center, a 178,626 square foot retail center in Lancaster, South Carolina for a purchase price of $10,100,000, exclusive of closing costs and a $200,000 credit to the Company for major repairs.
Conversions of Convertible Debentures
As of May 14, 2021, subsequent to the March 31, 2021 effective date of the condensed consolidated financial statements, the convertible debenture holder has elected to convert the remaining $1,250,000 in principal of the debentures and $9,520 in accrued interest to the Company’s common shares, receiving 1,107,141 common shares at an average conversion price of $1.14, as set forth in the table below.
| Conversion Date | Principal Amount Converted | Accrued and Unpaid Interest Converted | Total Conversion Amount | Conversion Price | Common Shares Issued | |||||||||||||||
| April 28, 2021 | $ | 250,000 | $ | 8,048 | $ | 258,048 | $ | 1.1007 | 234,440 | |||||||||||
| May 3, 2021 | 250,000 | 685 | 250,685 | 1.1007 | 227,750 | |||||||||||||||
| May 10, 2021 | 250,000 | 719 | 250,719 | 1.1641 | 215,376 | |||||||||||||||
| May 11, 2021 | 500,000 | 68 | 500,068 | 1.1641 | 429,575 | |||||||||||||||
| 1,250,000 | 9,520 | 1,259,520 | 1,107,141 | |||||||||||||||||
As of May 14, 2021, the outstanding principal amount of the convertible debentures was $0.
| 38 |
Item 2. Management’s Discussion and Analysis of Financial Condition and Results of Operations
The following discussion and analysis is based on, and should be read in conjunction with, the condensed, consolidated financial statements and the related notes thereto of Medalist Diversified REIT, Inc. contained in this Quarterly Report on Form 10-Q.
As used in this section, unless the context otherwise requires, references to “we,” “our,” “us,” and “our company” refer to Medalist Diversified REIT, Inc., a Maryland corporation, together with our consolidated subsidiaries, including Medalist Diversified Holdings, LP, a Delaware limited partnership of which we are the sole general partner, except where it is clear from the context that the term only means Medalist Diversified REIT, Inc..
Cautionary Statement Regarding Forward-Looking Statements
This Quarterly Report on Form 10-Q contains “forward-looking statements” within the meaning of the federal securities laws. These forward-looking statements are included throughout this Quarterly Report on Form 10-Q. We have used the words “approximately,” “anticipate,” “assume,” “believe,” “budget,” “contemplate,” “continue,” “could,” “estimate,” “expect,” “future,” “intend,” “may,” “outlook,” “plan,” “potential,” “predict,” “project,” “seek,” “should,” “target,” “will” and similar terms and phrases to identify forward-looking statements in this Quarterly Report on Form 10-Q.
The forward-looking statements included herein are based upon our current expectations, plans, estimates, assumptions and beliefs that involve numerous risks and uncertainties. Assumptions relating to the foregoing involve judgments with respect to, among other things, future economic, competitive and market conditions and future business decisions, all of which are difficult or impossible to predict accurately and many of which are beyond our control. Although we believe that the expectations reflected in such forward-looking statements are based on reasonable assumptions, our actual results and performance could differ materially from those set forth in the forward-looking statements. Factors which could have a material adverse effect on our operations and future prospects include, but are not limited to:
| • | the competitive environment in which we operate; |
| • | national, international, regional and local economic conditions; |
| • | capital expenditures; |
| • | the availability, terms and deployment of capital; |
| • | financing risks; |
| • | the general level of interest rates; | |
| • | changes in our business or strategy; | |
| • | fluctuations in interest rates and increased operating costs; | |
| • | our limited operating history; | |
| • | the degree and nature of our competition; | |
| • | our dependence upon our Manager and key personnel; | |
| • | defaults on or non-renewal of leases by tenants; | |
| • | decreased rental rates or increased vacancy rates; | |
| • | our ability to make distributions on shares of our common stock and preferred stock; | |
| • | difficulties in identifying properties to acquire and completing acquisitions; | |
| • | our ability to operate as a public company; | |
| • | potential natural disasters such as hurricanes; |
| • | COVID-19 pandemic; | |
| • | our ability to maintain our qualification as a REIT for U.S. federal income tax purposes; |
| • | potential changes in the law or governmental regulations that affect us and interpretations of those laws and regulations, including changes in real estate and zoning or tax laws, and potential increases in real property tax rates; and |
| • | related industry developments, including trends affecting our business, financial condition and results of operations. |
39
The forward-looking statements contained in this Quarterly Report on Form 10-Q are based on historical performance and management’s current plans, estimates and expectations in light of information currently available to us and are subject to uncertainty and changes in circumstances. There can be no assurance that future developments affecting us will be those that we have anticipated. Actual results may differ materially from these expectations due to the factors, risks and uncertainties described above, changes in global, regional or local political, economic, business, competitive, market, regulatory and other factors, many of which are beyond our control. Should one or more of these risks or uncertainties materialize, or should any of our assumptions prove to be incorrect, our actual results may vary in material respects from what we may have expressed or implied by these forward-looking statements. We caution that you should not place undue reliance on any of our forward-looking statements. Any forward-looking statement made by us in this Quarterly Report on Form 10-Q speaks only as of the date of this Quarterly Report on Form 10-Q. Factors or events that could cause our actual results to differ may emerge from time to time, and it is not possible for us to predict all of them. We undertake no obligation to publicly update any forward-looking statement, whether as a result of new information, future developments or otherwise, except as may be required by applicable securities laws.
Company Overview
Medalist Diversified REIT Inc. is a Maryland corporation formed on September 28, 2015. Beginning with our taxable year ended December 31, 2017, we believe that we have operated in a manner qualifying us as a real estate investment trust (“REIT”), and we have elected to be taxed as a REIT for federal income tax purposes. Our company serves as the general partner of Medalist Diversified Holdings, LP which was formed as a Delaware limited partnership on September 29, 2015.
Our company was formed to acquire, reposition, renovate, lease and manage income-producing properties, with a primary focus on (i) commercial properties, including flex-industrial and retail properties, (ii) multi-family residential properties and (iii) limited service hotel properties in secondary and tertiary markets in the southeastern part of the United States, with an expected concentration in Virginia, North Carolina, South Carolina, Georgia, Florida and Alabama. We may also pursue, in an opportunistic manner, other real estate-related investments, including, among other things, equity or other ownership interests in entities that are the direct or indirect owners of real property, and indirect investments in real property, such as those that may be obtained in a joint venture. While these types of investments are not intended to be a primary focus, we may make such investments in our Manager’s discretion.
Our company is externally managed by Medalist Fund Manager, Inc. (the “Manager”). The Manager makes all investment decisions for our company. The Manager and its affiliated companies specialize in acquiring, developing, owning and managing value-added commercial real estate in the Mid-Atlantic and Southeast regions. The Manager oversees our company’s overall business and affairs and has broad discretion to make operating decisions on behalf of our company and to make investment decisions. Our company’s stockholders are not involved in its day-to-day affairs.
As of March 31, 2021, our company owned and operated six investment properties, the Shops at Franklin Square (the “Franklin Square Property”), a 134,239 square foot retail property located in Gastonia, North Carolina, the Greensboro Hampton Inn (the “Hampton Inn Property”) a hotel with 125 rooms on 2.162 acres in Greensboro, North Carolina, the Hanover North Shopping Center (the “Hanover Square Property”), a 73,440 square foot retail property located in Mechanicsville, Virginia, the Ashley Plaza Shopping Center (the “Ashley Plaza Property”), a 160,356 square foot retail property located in Goldsboro, North Carolina, the Clemson Best Western University Inn (the “Clemson Best Western Property”), a hotel with 148 rooms on 5.92 acres in Clemson, South Carolina and Brookfield Center (the “Brookfield Center Property”), a 64,880 square foot mixed-use industrial/office property located in Greenville, South Carolina. As of March 31, 2021, we owned 78 percent of the Hampton Inn Property as a tenant in common with a noncontrolling owner which owned the remaining 22 percent interest. The tenants in common lease the Hampton Inn Property to a taxable REIT subsidiary that, as of March 31, 2021, is also owned 78 percent by us and 22 percent by the noncontrolling owner. As of March 31, 2021, we owned 84 percent of the Hanover Square Property as a tenant in common with a noncontrolling owner which owned the remaining 16 percent interest.
Reporting Segments
We establish operating segments at the property level and aggregate individual properties into reportable segments based on product types in which we have Investments. As of March 31, 2021, our reportable segments were retail center properties, flex center properties, and hotel properties.
Recent Trends and Activities
Significant events that have impacted our company are summarized below.
Equity Issuances
On April 13, 2021, our company issued and sold 8,000,000 Common Shares at an offering price of $1.50 per share. Estimated net proceeds from the issuance totaled $10,918,914, which includes the impact of discounts and offering costs, including the underwriter’s selling commissions and estimated legal and accounting fees.
40
Mandatorily redeemable preferred stock issuance
On February 19, 2020, our company issued and sold 200,000 shares of 8.0% Series A Cumulative Redeemable Preferred Stock (“Series A Preferred Stock”) at $23.00 per share, resulting in gross proceeds of $4,600,000. Net proceeds from the issuance were $3,860,882, which includes the impact of the underwriter’s discounts, selling commissions and legal, accounting and other professional fees. Our company has classified the Series A Preferred Stock as a liability in accordance with ASC Topic No. 480, “Distinguishing Liabilities from Equity,” which states that mandatorily redeemable financial instruments should be classified as liabilities and therefore the related dividend payments are treated as a component of interest expense in the accompanying consolidated statements of operations.
Common stock grants under the 2018 Equity Incentive Plan
On July 18, 2019, our company’s Compensation Committee approved a grant of 14,000 shares of our common stock to our company’s five independent directors. The effective date of the grants was July 18, 2019. The shares granted vested immediately and were unrestricted. However, the Plan includes other restrictions on the sale of shares issued under the Plan. Because the shares vested immediately, the fair value of the grants, or $61,600, was recorded to expense on the effective date of the grant. The fair value of the grants was determined by the market price of our company’s common stock on the effective date of the grant.
On March 11, 2020, our company’s Compensation Committee approved a grant of 156,522 shares of Common Shares to two employees of the Manager who also serve as directors of our company, a grant of 65,215 Common Shares to our company’s five independent directors, and a grant of 26,087 shares to the chief financial officer of our company. The effective date of the grants was March 11, 2020. The Common Shares granted vested immediately and were unrestricted. However, the Plan includes other restrictions on the sale of shares issued under the Plan. Because the Common Shares vested immediately, the fair value of the grants, or $569,995, was recorded to share based compensation expense on the effective date of the grant. The fair value of the grants was determined by the market price of our company’s Common Shares on the effective date of the grant.
On March 16, 2021, our company’s Compensation Committee approved a grant of 40,356 Common Shares to our company’s three independent directors, and a grant of 26,900 shares to the chief financial officer of our company. The effective date of the grants was March 16, 2020. The Common Shares granted vest immediately and are unrestricted. However, the Plan includes other restrictions on the sale of shares issued under the Plan. Because the Common Shares vested immediately, the fair value of the grants, or $149,981, was recorded to share based compensation expense on our company’s condensed consolidated statements of operations on the effective date of the grant. The fair value of the grants was determined by the market price of our company’s Common Shares on the effective date of the grant.
41
Financing Activities
Mortgages payable
Our company financed its acquisitions of its investment properties through mortgages, as follows:
| Balance | ||||||||||||||||||||
| Property | Monthly Payment |
Interest Rate |
Maturity | March 31, (unaudited) |
December 31, 2020 |
|||||||||||||||
| Franklin Square (a) | Interest only | 4.70 | % | October 2021 | $ | 14,275,000 | $ | 14,275,000 | ||||||||||||
| Hanover Square (b) | $ | 56,882 | 4.25 | % | December 2027 | 10,320,244 | 10,380,791 | |||||||||||||
| Ashley Plaza (c) | $ | 52,795 | 3.75 | % | September 2029 | 11,297,387 | 11,349,518 | |||||||||||||
| Clemson Best Western (d) | Interest only | Variable | October 2022 | - | 7,750,000 | |||||||||||||||
| Brookfield Center (e) | $ | 22,876 | 3.90 | % | November 2029 | 4,821,415 | 4,842,887 | |||||||||||||
| Unamortized issuance costs, net | (334,020 | ) | (503,842 | ) | ||||||||||||||||
| Total mortgages payable, net | $ | 40,380,026 | $ | 48,094,354 | ||||||||||||||||
| (a) | The mortgage loan for the Franklin Square Property matures in October 2021. Our company plans to commence efforts during mid-2021 to refinance this mortgage, but there is no guarantee that our efforts will be successful. See Future Liquidity Needs, below. |
| (b) | On May 8, 2020, our company entered into a refinancing transaction with the mortgage lender for the Hanover Square Property which increased the mortgage amount and reduced the interest rate. Under this transaction, the principal amount of the loan was increased to $10,500,000 and the interest rate reduced to a fixed rate of 4.25 percent until January 1, 2023, when the interest rate will adjust to a new fixed rate which will be determined by adding 3.00 percentage points to the daily average yield on United States Treasury securities adjusted to a constant maturity of five years, as made available by the Federal Reserve Board, with a minimum of 4.25 percent. The fixed monthly payment, which includes principal and interest, increased to $56,882. Our company has accounted for this transaction as a loan modification. Under this accounting treatment, our company recorded $1,500 in capitalized loan issuance costs for loan fees paid to the lender and recorded $43,852 in third party costs associated with the transaction as an expense under retail property operating expenses on our company’s consolidated statement of operations for the year ended December 31, 2020. |
42
The mortgage loan agreement for the Hanover Square property includes covenants to (i) maintain a Debt Service Coverage Ratio (“DSCR”) in excess of 1.35 to 1.00 and (ii) maintain a loan-to-value of real estate ratio of 75 percent. As of March 31, 2021 and December 31, 2020, respectively, our company believes that it is compliant with these covenants. | ||
| (c) | The mortgage loan for the Ashley Plaza Property bears interest at a fixed rate of 3.75 percent and is interest only for the first twelve months. Beginning on October 1, 2020, the monthly payment became $52,795 for the remaining term of the loan, which includes interest at the fixed rate, and principal, based on a thirty year amortization schedule. | |
| (d) | As of March 31, 2021, our company reclassified the mortgage loan for the Clemson Best Western Property to mortgages payable, net, associated with assets held for sale. | |
| (e) | The mortgage loan for the Brookfield Property bears interest at a fixed rate of 3.90 percent and is interest only for the first twelve months. Beginning on November 1, 2020, the monthly payment became $22,876 for the remaining term of the loan, which includes interest at the fixed rate, and principal, based on a thirty year amortization schedule. |
Our company financed its acquisitions of its assets held for sale through mortgages, which as of March 31, 2021 are recorded as mortgages payable, net, associated with assets held for sale, on our consolidated balance sheets, as follows:
| Balance | ||||||||||||||||||||
| Property | Monthly Payment |
Interest Rate |
Maturity | March 31, (unaudited) |
December 31, 2020 |
|||||||||||||||
| Hampton Inn (a) | Interest only | Variable | May 2022 | $ | 10,400,000 | $ | 10,400,000 | |||||||||||||
| Clemson Best Western (b) | Interest only | Variable | October 2022 | 7,750,000 | - | |||||||||||||||
| Unamortized issuance costs, net | (173,632 | ) | (48,000 | ) | ||||||||||||||||
| Total mortgages payable, net, associated with assets held for sale | 17,976,368 | 10,352,000 | ||||||||||||||||||
| (a) | As of December 31, 2020, our company reclassified the mortgage loan for the Hampton Inn property to liabilities associated with assets held for sale. The mortgage loan for the Hampton Inn property matured on November 9, 2020 and, on November 9, 2020 our company entered into an amendment to extend the loan until May 2022. Our company has accounted for this transaction as a loan modification in accordance with ASC 470. Under this accounting treatment, our company recorded $54,000 in capitalized loan issuance costs for loan fees paid to the lender and recorded $22,784 in third party costs associated with the transaction as an expense under hotel property operating expenses on our company’s consolidated statement of operations for the three months ended March 31, 2021.
The mortgage loan for the Hampton Inn Property bears interest at a variable rate based on LIBOR with a minimum rate of 6.50 percent. The interest rate payable is the USD LIBOR one-month rate plus 6.25 percent. As of March 31, 2021 and December 31, 2020, the rate in effect for the Hampton Inn Property mortgage was 6.50 percent and 6.50 percent, respectively.
| |
| (b) | As of March 31, 2021, our company reclassified the mortgage loan for the Clemson Best Western Property to mortgages payable, net, associated with assets held for sale. The mortgage loan for the Clemson Best Western Property bears interest at a variable rate based on LIBOR with a minimum rate of 7.15 percent. The interest rate payable is the USD LIBOR one-month rate plus 4.9 percent. As of March 31, 2021 and December 31, 2020, respectively, the rate in effect for the Clemson Best Western Property mortgage was 7.15 percent. |
Convertible debenture issuance
On October 27, 2020, our company entered into a definitive agreement with a financing entity to issue and sell convertible debentures in an aggregate principal amount of up to $5 million pursuant to a private offering exempt from registration under the Securities Act of 1933, as amended. The debentures were issued at a 5 percent discount to the principal amount, accrue interest at a rate of 5 percent per annum (payable at maturity), and were closed in three separate tranches as follows: (i) convertible debenture of $1.5 million issued and sold on October 27, 2020 upon the signing of the definitive agreement, (ii) convertible debenture of $2.0 million issued and sold on December 22, 2020 upon the filing of a registration statement with the U.S. Securities and Exchange Commission (“SEC”) relating to the shares of common stock that may be issued upon the conversion of the convertible debentures, and (iii) convertible debenture of $1.5 million issued and sold on January 5, 2021, the date the registration statement was declared effective by the SEC. The second and third closings of the convertible debentures were subject to our company successfully obtaining approval from its common stockholders for the issuance of shares of common stock that may be issued upon the conversion of the convertible debentures. Net proceeds from the issuance and sale of the convertible debentures totaled $4,231,483.
43
As of March 31, 2021, the convertible debenture holder has elected to convert a total of $3,750,000 in principal of the convertible debentures and $49,268 in accrued interest to our company’s common shares, receiving 2,074,775 common shares at an average conversion price of $1.83, as set forth in the table below.
| Conversion Date | Principal
Amount Converted |
Accrued
and Unpaid Interest Converted |
Total
Conversion Amount |
Conversion Price |
Common
Shares Issued |
|||||||||||||||
| January 6, 2021 | $ | 100,000 | $ | 411 | $ | 100,411 | $ | 1.9079 | 52,629 | |||||||||||
| January 14, 2021 | 200,000 | 1,534 | 201,534 | 1.9079 | 105,631 | |||||||||||||||
| January 15, 2021 | 300,000 | 164 | 300,164 | 1.9079 | 157,327 | |||||||||||||||
| January 21, 2021 | 300,000 | 740 | 300,740 | 2.0060 | 149,920 | |||||||||||||||
| January 26, 2021 | 500,000 | 411 | 500,411 | 2.0060 | 249,457 | |||||||||||||||
| February 9, 2021 | 100,000 | 192 | 100,192 | 2.0078 | 49,901 | |||||||||||||||
| February 9, 2021 | 400,000 | 13,699 | 413,699 | 2.0078 | 206,046 | |||||||||||||||
| February 10, 2021 | 500,000 | 219 | 500,219 | 2.0078 | 249,138 | |||||||||||||||
| February 17, 2021 | 200,000 | 1,055 | 201,055 | 2.0193 | 99,567 | |||||||||||||||
| March 10, 2021 | 400,000 | 2,589 | 402,589 | 1.5637 | 257,459 | |||||||||||||||
| March 11, 2021 | 250,000 | 69 | 250,068 | 1.5637 | 159,921 | |||||||||||||||
| March 12, 2021 | 250,000 | 34 | 250,034 | 1.5637 | 159,899 | |||||||||||||||
| March 12, 2021 | 250,000 | 28,151 | 278,151 | 1.5637 | 177,880 | |||||||||||||||
| Total Conversions | $ | 3,750,000 | $ | 49,268 | $ | 3,799,268 | 2,074,775 | |||||||||||||
The principal amount outstanding of the convertible debentures as of March 31, 2021 and December 31, 2020 was $1,250,000 and $3,500,000, respectively. As of March 31, 2021, and December 31, 2020, the carrying amount of the convertible debentures, net, was $986,837 and $2,260,565, respectively.
Line of credit, short term
As of March 31, 2021 and December 31, 2020, our company had a line of credit, short term, outstanding in the principal amount of $325,000 and $325,000, respectively. The line of credit, short term, was established on August 21, 2019 to provide short term funding for our company’s acquisition of the Ashley Plaza Property and the Clemson Best Western Property (see discussion of 2019 acquisitions in Note 3, above). On February 20, 2020, our company repaid the line of credit, short term, in the amount of $2,000,000 plus accrued interest of $21,437. Effective on February 21, 2020, the original maturity date of the line of credit, short term, our company extended the line of credit, short term, for 60 days until April 21, 2020. On March 3, 2020 our company received $550,000 in funding from the line of credit, short term, to fund working capital and dividend payments. On April 21, 2020, our company extended the line of credit, short term, for 40 days until May 31, 2020. On May 31, 2020, our company extended the line of credit, short term, for 90 days until August 31, 2020. On August 12, 2020, our company extended the line of credit, short term, until September 30, 2020. On November 4, 2020, our company made a $225,000 payment to reduce the balance of the line of credit, short term to $325,000, and extended the line of credit, short term, until March 31, 2021. On March 18, 2021, our company extended the line of credit, short term, until April 30, 2021. On April 21, 2021, our company repaid the line of credit, short term, in full.
The line of credit, short term, bears interest at a variable rate calculated at 250 basis points over USD 1-Month LIBOR as published in the Wall Street Journal. The rate adjusts on the first day of each month during which the loan is outstanding. As of March 31, 2021 and December 31, 2020, the rate in effect for the line of credit, short term, was 2.619 percent and 2.653 percent, respectively. Interest expense for the three months ended March 31, 2021 and 2020 includes amortization of the capitalized issuance costs of $0 and $10,000, respectively, using the straight-line method, which approximates to the effective interest method, over the initial, six-month term of the loan.
Notes payable
As of March 31, 2021 and December 31, 2020, our company had a note payable outstanding in the principal amount of $176,300 and $176,300, respectively, under the Small Business Administration’s Paycheck Protection Program (the “SBA PPP Loan Program”). This note was issued on April 30, 2020, on behalf of a subsidiary, MDR PMI Greensboro TRS, LLC, the entity that operates the Hampton Inn Property. Our company believes that it has used these funds pursuant to the limitations established by the SBA PPP Loan Program for payroll and other eligible expenses for the Hampton Inn Property. Under the terms of the loan, all, a portion or none of the loan may be forgiven, based on criteria established by the SBA PPP Loan Program. Our company believes that it has expended the loan funds in accordance with the criteria required for forgiveness and has submitted its forgiveness application to the SBA PPP Loan Program, but there is no assurance that all or a portion of the loan will be forgiven. Any portion of the loan that is not forgiven will bear interest at a fixed rate of 1 percent per annum and be repaid in 18 monthly installments of principal and interest of $9,923. Under the original terms of the SBA PPP Loan Program, principal and interest payments would have commenced on November 1, 2020. However, due to changes in regulations for the SBA PPP Loan Program, commencement of principal and interest payments were extended until ten months after the completion of the borrower’s “Covered Period”, as defined by the SBA PPP Loan Program to provide borrowers sufficient time to submit loan forgiveness applications. Under these guidelines, our company’s principal and interest payments for the Hampton Inn PPP loan would commence on August 15, 2021 if our company does not qualify for loan forgiveness.
44
COVID-19 Impact
The following discussion is intended to provide certain information regarding the impacts of the COVID-19 pandemic on our company’s business and management’s efforts to respond to those impacts. Unless otherwise specified, the statistical and other information regarding our company’s portfolio are estimates based on information available to our company as of the date of this Quarterly Report on Form 10-Q. As a result of the rapid development, fluidity and uncertainty surrounding this situation, our company expects that such statistical and other information will change, potentially significantly, going forward and may not be indicative of the actual impact of the COVID-19 pandemic on our company’s business, operations, cash flows and financial condition for future periods.
Since March 2020, our company’s investment properties have been significantly impacted by (i) measures taken by local, state and federal authorities to mitigate the impact of COVID-19, such as mandatory business closures, quarantines, restrictions on travel and “shelter-in-place” or “stay-at-home” orders and (ii) significant changes in consumer behavior and business and leisure travel patterns. While some of the measures have been relaxed by the respective governmental authorities, with the uncertainty resulting from the continued spread of COVID-19 and its new variants and the possibility of the re-imposition of mandatory business closures, quarantines, restrictions on travel and “shelter-in-place” or “stay-at-home” orders by some governmental authorities, and the possibility that changes in consumer behavior and business and leisure travel patters will continue, the negative impact on room demand for our hotel properties and consumer demand for the goods and services of our retail tenants within our portfolio could continue to be significant in the coming months.
Retail Center and Flex Center Properties
As of the date of this Quarterly Report on Form 10-Q, all of the tenants in our company’s retail properties (the Franklin Square Property, Hanover Square Property and Ashley Plaza Property) and flex property (Brookfield Center) are open, with two exceptions. During the year ended December 31, 2020, a tenant in the Franklin Square Property defaulted on its lease and abandoned its premises, resulting in the recognition of the loss on impairment recorded during the year ended December 31, 2020. A second tenant in the Hanover Square Property which was operating under bankruptcy protection, did not renew its lease upon its expiration. However, this space has been re-leased.
As is the case with retail landlords across the U.S., our company received a number of rent relief requests from tenants, which our company evaluated on a case-by-case basis. As of the date of this Quarterly Report on Form 10-Q, our company has granted lease concessions in the form of (i) rent deferrals or (ii) rent abatements. These deferral and abatement agreements will reduce the rent revenues our company expects to receive in future periods, as discussed below.
Under the rent deferral agreements, the tenants have agreed to repay unpaid rent over a specified time period or before a certain date. Under these rent deferral agreements reached during the year ended December 31, 2020, our company agreed to defer $20,174 in base rent payments during the three months ended March 31, 2021. No such deferrals were granted for the three months ended March 31, 2020. For the remaining nine months ending December 31, 2021, our company has agreed to defer $61,599 in base rent payments. For the nine months ended December 31, 2020, our company deferred $228,346 in base rent payments. Deferred rent is recognized as retail center property revenues or flex center property revenues on our company’s condensed consolidated statement of operations and as rent and other receivables on our company’s condensed consolidated balance sheets.
Under the rent abatement agreements reached during the year ended December 31, 2020, our company agreed to permanently abate rent in exchange for lease extensions of between one and three years, depending on the amount of the abatement. In one case, our company agreed to abate a portion of a tenant’s base rent in exchange for future rent payments based on the tenant’s monthly sales. For the three months ended March 31, 2021 and 2020, our company abated rents of $109,818 and $0, respectively. For the remaining nine months ending December 31, 2021, our company has agreed to abate an additional $329,453 in base rent. For the nine months ended December 31, 2020, our company abated $346,896 in base rents. For the year ending December 31, 2022 our company has agreed to abate rent of $174,330. Abated rent is excluded from future minimum rents in Note 6, above.
In addition to the deferrals and abatements, two tenants in our company’s retail property centers declared bankruptcy and one tenant defaulted on its lease during the year ended December 31, 2020. While under bankruptcy protection, the first tenant’s term expired on June 30, 2020 and our company was unable to collect rent totaling $18,750. This rent was recognized and then written off and is recorded as bad debt expense on our company’s consolidated statement of operations for year ended December 31, 2020. A second tenant declared bankruptcy and then emerged from bankruptcy protection during the year ended December 31, 2020. As part of the bankruptcy proceeding, the tenant’s lease was restructured, resulting in rent abatements of $16,440 and $0 for the three months ended March 31, 2021 and 2020. For the remaining nine months ending December 31, 2021, our company agreed to abate an additional $37,320 in base rent. For the nine months ended December 31, 2020, our company abated $77,653 in base rent. Additionally, our company agreed to abate base rent of $22,760 for the year ended December 31, 2022 and $7,300 for the year ended December 31, 2023. Under the restructured lease, the Tenant’s lease term, which originally expired in 2023, was extended for one five-year period.
45
A third tenant defaulted on its lease and abandoned its premises. During the year ended December 31, 2020, our company wrote off a total of $34,556 in rent and CAM. Of this amount, $16,842 was initially recorded as retail center property revenues, $8,817 was initially recorded as retail property tenant reimbursements on our company’s condensed consolidated statement of operations for the year ended December 31, 2020 and $8,897 was initially recorded as retail center property revenues and retail property tenant reimbursements on our company’s consolidated statement of operations during the year ended December 31, 2020. These amounts were then recorded as bad debt expense on our company’s condensed consolidated statement of operations for the year ended December 31, 2020. In addition, our company was not able to collect rent totaling $61,055 for the year ended December 31, 2020 and will not collect future rents of $530,544 under this lease.
In return for (i) granting abatements and (ii) restructuring the lease of the tenant under bankruptcy protection, our company received lease extension agreements of between one and five years, resulting in additional future rents payable under these leases as follows. These amounts are included in future minimum rents in Note 6, above.
| Additional Rent Under Term Extensions (1) | ||||||||||||||||||||||||||||||||
| For the year ended December 31, | ||||||||||||||||||||||||||||||||
| 2020 | 2021 | 2022 | 2023 | 2024 | 2025 | Thereafter | Total | |||||||||||||||||||||||||
| Franklin Square | $ | - | $ | - | $ | 161,849 | $ | 277,456 | $ | 333,039 | $ | 360,830 | $ | 111,165 | $ | 1,244,339 | ||||||||||||||||
| Hanover Square | - | - | 242,069 | 259,306 | 76,550 | - | - | 577,925 | ||||||||||||||||||||||||
| Ashley Plaza | - | - | - | 124,993 | 125,000 | 128,333 | 744,858 | 1,123,184 | ||||||||||||||||||||||||
| Brookfield Center | - | - | - | - | - | - | - | - | ||||||||||||||||||||||||
| Total | $ | - | $ | - | $ | 403,918 | $ | 661,755 | $ | 534,589 | $ | 489,163 | $ | 856,023 | $ | 2,945,448 | ||||||||||||||||
| (1) | Excludes future rent payments based on tenant’s monthly sales revenues. |
There is no assurance that our company will receive these future rent payments.
While our company’s rent collections from its retail and flex center properties have stabilized, the extent of the continued impact of COVID-19 on revenues from our company’s retail and flex center properties and tenants remains uncertain and will depend on future developments, which are highly uncertain and cannot be predicted with confidence, including the scope, severity and duration of the pandemic, the speed and effectiveness of vaccine and treatment developments and deployment, and potential mutations of COVID-19 and the response thereto.
Revenues will be impacted by the deferral and abatement agreements (discussed above) that our company has granted to various tenants. Additionally, revenues could continue to be negatively impacted until consumer demand for the goods and services of our company’s retail and flex center tenants returns to levels prior to the virus outbreak. However, the direct and indirect economic effects of the pandemic and containment measures and the potential for changes in consumer behavior and business and leisure travel patterns could continue to have a significant negative impact on consumer demand for the goods and services of our company’s retail tenants within its portfolio in the coming months.
Hotel Properties
Beginning in March 2020, COVID-19 caused widespread cancellations of both business and leisure travel throughout the United States, resulting in significant decreases in our company’s hotel property (the Hampton Inn Property and the Clemson Best Western Property), revenues and the hospitality industry as a whole. With the overall uncertainty of the longevity of COVID-19 in the U.S. and the resulting economic decline, it is difficult to project the duration of revenue declines for the industry and our company. However, our company currently expects the decline in revenue and operating results compared to a 2019 base year to continue throughout 2021 and potentially into future years.
Operating statistics for the three months ended March 31, 2021 and 2020, respectively, and the years ended December 31, 2020 and 2019, respectively, for the Hampton Inn Property were as follows:
| Occupancy | Average Daily Rate | ||||||||||||||||||||||
| Hampton Inn Property | 2021 | 2020 | 2019 | 2021 | 2020 | 2019 | |||||||||||||||||
| January | 47.8 | % | 41.6 | % | 43.9 | % | $ | 72.85 | $ | 100.41 | $ | 94.57 | |||||||||||
| February | 68.3 | % | 72.0 | % | 51.9 | % | 81.74 | 102.73 | 105.15 | ||||||||||||||
| March | 51.8 | % | 33.3 | % | 64.1 | % | 94.10 | 106.98 | 109.11 | ||||||||||||||
| April | % | 25.7 | % | 62.3 | % | 65.15 | 149.33 | ||||||||||||||||
| May | % | 41.5 | % | 55.8 | % | 67.87 | 111.37 | ||||||||||||||||
| June | % | 49.6 | % | 72.1 | % | 73.40 | 103.89 | ||||||||||||||||
| July | % | 65.1 | % | 60.8 | % | 71.34 | 110.57 | ||||||||||||||||
| August | % | 50.3 | % | 75.7 | % | 77.73 | 107.29 | ||||||||||||||||
| September | % | 59.8 | % | 65.0 | % | 80.27 | 105.22 | ||||||||||||||||
| October | % | 41.8 | % | 75.0 | % | 99.43 | 160.01 | ||||||||||||||||
| November | % | 28.8 | % | 66.6 | % | 83.02 | 106.43 | ||||||||||||||||
| December | % | 24.4 | % | 48.7 | % | 75.67 | 99.43 | ||||||||||||||||
| Full Year | % | 44.4 | % | 60.6 | % | $ | 84.10 | $ | 113.41 | ||||||||||||||
46
During the period of the year ended December 31, 2020 that was impacted by COVID-19 (March through December 2020), significant portions of the occupancy for the Hampton Inn Property was generated by non-traditional sources, including an agreement with the City of Greensboro to house homeless families. During this period, this agreement resulted in 5,704 room nights of occupancy, or approximately 28 percent of the total occupied rooms during the year ended December 31, 2020 and 39 percent of the occupied rooms during the nine months of 2020 that were impacted by COVID-19 (March through December 2020). This agreement continued in January and ended in February 2021, resulting in 2,064 room nights of occupancy, or approximately 33 percent of the total occupied rooms during the three months ended March 31, 2021 and 49 percent of the rooms occupied during January and February 2021. While these non-traditional sources of occupancy generated room nights, the average daily rate was significantly lower than prior periods and resulted in significantly reduced hotel property revenues.
Operating statistics for the three months ended March 31, 2021 and 2020, respectively, and the years ended December 31, 2020 and 2019, respectively, for the Clemson Best Western Property were as follows:
| Occupancy | Average Daily Rate | ||||||||||||||||||||||
| Clemson Best Western Property | 2021 | 2020 | 2019 | 2021 | 2020 | 2019 | |||||||||||||||||
| January | 100.0 | % | 24.8 | % | 27.4 | % | $ | 55.13 | $ | 77.04 | $ | 98.10 | |||||||||||
| February | 100.0 | % | 31.9 | % | 34.8 | % | 58.83 | 94.07 | 92.03 | ||||||||||||||
| March | 100.0 | % | 26.7 | % | 67.3 | % | 56.05 | 90.58 | 92.61 | ||||||||||||||
| April | % | 24.5 | % | 47.4 | % | 68.97 | 103.92 | ||||||||||||||||
| May | % | 19.9 | % | 37.5 | % | 61.54 | 109.69 | ||||||||||||||||
| June | % | 24.0 | % | 38.4 | % | 61.24 | 93.80 | ||||||||||||||||
| July | % | 22.7 | % | 31.6 | % | 56.13 | 85.34 | ||||||||||||||||
| August | % | 27.0 | % | 47.2 | % | 64.35 | 111.60 | ||||||||||||||||
| September | % | 65.0 | % | 38.5 | % | 67.59 | 161.11 | ||||||||||||||||
| October | % | 100.0 | % | 38.3 | % | 58.99 | 143.35 | ||||||||||||||||
| November | % | 100.0 | % | 39.3 | % | 58.48 | 121.87 | ||||||||||||||||
| December | % | 99.7 | % | 28.4 | % | 26.94 | 83.12 | ||||||||||||||||
| Full Year | % | 47.2 | % | 34.9 | % | $ | 59.08 | $ | 118.64 | ||||||||||||||
| (1) | January through August 2019 data for the Clemson Best Western Property is from the prior owner. September 2019 data is from the September 2019 STR report for the Clemson Best Western Property. |
Occupancy rates from October 2020 through March 2021 were a result of an agreement by which our company leased the entire Clemson Best Western Property to Clemson University from September 14, 2020 through December 15, 2020. In January 2021, this agreement was extended through May 5, 2020.
While intense efforts to reduce operating costs have resulted in expense reductions in the period during which our company’s hotel operations have been impacted by COVID-19, our company cannot be certain as to what level of savings can continue to be achieved overall to mitigate the material decline in hotel revenues it may continue to experience. The federal government has provided assistance to the industries negatively affected by the virus, including the hospitality industry, and our two hotel properties have received loans under one of these programs (see Note 5), but the aid has not mitigated the material reduction in revenue resulting from COVID-19 travel impacts. The Company was not eligible to participate in the new Payroll Protection Program loans announced in December 2020.
Due to the depressed outlook for leisure and business travel, on which both of our company’s hotel properties rely significantly, our company committed to a plan to sell the Hampton Inn Property and the Clemson Best Western Property as discussed above. There is no assurance that our company will be able to complete the sales of the two hotel properties.
Until such time as the virus is contained or eradicated and room demand for our company’s hotel properties and consumer demand for the goods and services of our company’s retail and flex center tenants returns to more customary levels, our company may continue to experience material reductions in its operating revenue. The anticipated negative impact on revenues, discussed above, from our company’s retail, flex center and hotel properties has also, and will continue, to impact our company’s liquidity, resulting in reduced cash flow to meet our company’s obligations and to fund dividend distribution payments.
Discussion of Potential Future Impact
While some of the containment measures have been relaxed by the respective governmental authorities, with the uncertainty resulting from new variants of COVID-19 and the possibilities of the re-imposition of mandatory business closures, quarantines, restrictions on travel and “shelter-in-place” or “stay-at-home” orders by some governmental authorities, the negative impact on room demand for our hotel properties and consumer demand for the goods and services of our retail tenants within our portfolio could continue to be significant in the coming months.
47
Our company derives revenues primarily from rents and reimbursement payments received from tenants under leases at our company’s properties. Our company’s operating results therefore depend materially on the ability of its tenants to make required rental payments. The extent to which the COVID-19 pandemic impacts the businesses of our company’s tenants, and our company’s operations and financial condition, will depend on future developments which are highly uncertain and cannot be predicted with confidence, including the scope, severity and duration of the pandemic, the actions taken to contain the pandemic or mitigate its impact, and the direct and indirect economic effects of the pandemic and such containment measures, among others. While the extent of the outbreak and its impact on our company, its tenants and the U.S. retail market is uncertain, a prolonged crisis could result in continued disruptions in the credit and financial markets, a continued rise in unemployment rates, decreases in consumer confidence and consumer spending levels and an overall worsening of global and U.S. economic conditions. The factors described above, as well as additional factors that our company may not currently be aware of, could materially negatively impact our company’s ability to collect rent and could lead to termination of leases by tenants, tenant bankruptcies, decreases in demand for retail space at our company’s properties, difficulties in accessing capital, impairment of our company’s long-lived assets and other impacts that could materially and adversely affect our company’s business, results of operations, financial condition and ability to pay distributions to stockholders.
Off-Balance Sheet Arrangements
As of March 31, 2021 and December 31, 2020, we have no off-balance sheet arrangements.
Summary of Critical Accounting Policies
The preparation of consolidated financial statements in conformity with accounting principles generally accepted in the United States of America (“GAAP”) requires management to use judgment in the application of accounting policies, including making estimates and assumptions. If our judgment or interpretation of the facts and circumstances relating to various transactions had been different, or different assumptions were made, it is possible that different accounting policies would have been applied, resulting in different financial results or a different presentation of our financial statements. Below is a discussion of the accounting policies that we consider critical to an understanding of our financial condition and operating results that may require complex or significant judgment in their application or require estimates about matters which are inherently uncertain. A discussion of our significant accounting policies, including further discussion of the accounting policies described below, can be found in Note 2, “Summary of Significant Accounting Policies,” of our Consolidated Financial Statements. We believe that the application of these policies on a consistent basis enables us to provide useful and reliable financial information about our operating results and financial condition.
Revenue Recognition
Principal components of our total revenues for our retail center properties and flex center properties include base rents and tenant reimbursements. We accrue minimum (base) rent on a straight-line basis over the terms of the respective leases which results in an unbilled rent asset or deferred rent liability being recorded on the balance sheet. Certain lease agreements contain provisions that grant additional rents based on tenants’ sales volumes (contingent or percentage rent) which we recognize when the tenants achieve the specified targets as defined in their lease agreements. We periodically review the valuation of the asset/liability resulting from the straight-line accounting treatment of our leases in light of any changes in lease terms, financial condition or other factors concerning our tenants.
For our hotel property, revenues are recognized as earned, which is generally defined as the date upon which a guest occupies a room or utilizes the hotel’s services.
Our company adopted Accounting Standards Update (“ASU”) No. 2014-09, Revenue from Contracts with Customers (Topic 606) effective on January 1, 2019. This adoption did not have a material impact on our company’s recognition of revenues from either its retail center properties, flex center property or hotel properties.
Rents and Other Tenant Receivables
For our retail center and flex center properties, we record a tenant receivable for amounts due from tenants such as base rents, tenant reimbursements and other charges allowed under the lease terms. We periodically review tenant receivables for collectability and determine the need for an allowance for the uncollectible portion of accrued rents and other accounts receivable based upon customer creditworthiness (including expected recovery of a claim with respect to any tenants in bankruptcy), historical bad debt levels and current economic trends. We consider a receivable past due once it becomes delinquent per the terms of the lease. A past due receivable triggers certain events such as notices, fees and other actions per the lease.
Acquisition of Investments in Real Estate
The adoption of ASU 2017-01, as discussed in Note 2, “Summary of Significant Accounting Policies” of the Consolidated Financial Statements included in this report, has impacted our accounting framework for the acquisition of investment properties. Upon acquisition of investment properties, our company estimates the fair value of acquired tangible assets (consisting of land, buildings and improvements, and furniture, fixtures and equipment) and identified intangible assets and liabilities, including in-place leases, above- and below-market leases, tenant relationships and assumed debt based on evaluation of information and estimates available at that date. Fair values for these assets are not directly observable and estimates are based on comparable market data and other information which is subjective in nature, including estimated cash flow projections that utilize appropriate discount and capitalization rates and available market information.
48
Impairment of Long-Lived Assets
We periodically review investment properties for impairment on a property-by-property basis to identify any events or changes in circumstances that indicate that the carrying value of investment properties may not be recoverable. These circumstances include, but are not limited to, declines in the property’s cash flows, occupancy and fair market value. If any such events or changes in circumstances are identified, we perform a formal impairment analysis. We measure any impairment of investment property when the estimated undiscounted operating income before depreciation and amortization, is less than the carrying value of the property. To the extent impairment has occurred, we charge to income the excess of carrying value of the property over its estimated fair value. We estimate fair value using data such as operating income, estimated capitalization rates or multiples, leasing prospects and local market information. Our company also reviews its intangible assets for impairment whenever events or changes in circumstances indicate that the carrying value of its intangible assets may not be recoverable, but at least annually.
REIT Status
We are a Maryland corporation that has elected to be treated, for U.S. federal income tax purposes, as a REIT. We elected to be taxed as a REIT under the Code For the year ended December 31, 2017 and have not revoked such election. A REIT is a corporate entity which holds real estate interests and must meet a number of organizational and operational requirements, including a requirement that it currently distribute at least 90 percent of its adjusted taxable income to stockholders. As a REIT, we generally will not be subject to corporate level federal income tax on our taxable income if we annually distribute 100 percent of our taxable income to our stockholders. If we fail to qualify as a REIT in any taxable year, we will be subject to regular federal and state corporate income taxes and may not be able to elect to qualify as a REIT for four subsequent taxable years. Our qualification as a REIT requires management to exercise significant judgment and consideration with respect to operational matters and accounting treatment. Therefore, we believe our REIT status is a critical accounting estimate.
Evaluation of our company’s Ability to Continue as a Going Concern
Under the accounting guidance related to the presentation of financial statements, our company is required to evaluate, on a quarterly basis, whether or not the entity’s current financial condition, including its sources of liquidity at the date that the condensed consolidated financial statements are issued, will enable the entity to meet its obligations as they come due arising within one year of the date of the issuance of our company’s condensed consolidated financial statements and to make a determination as to whether or not it is probable, under the application of this accounting guidance, that the entity will be able to continue as a going concern. Our company’s condensed consolidated financial statements have been presented on a going concern basis, which contemplates the realization of assets and the satisfaction of liabilities in the normal course of business. In applying applicable accounting guidance, management considered our company’s current financial condition and liquidity sources, including current funds available, forecasted future cash flows and our company’s obligations due over the next twelve months, as well as our company’s recurring business operating expenses.
Our company concludes that it is probable that our company will be able to meet its obligations arising within one year of the date of issuance of these consolidated financial statements within the parameters set forth in the accounting guidance. For additional information regarding our company’s liquidity, see Note 5 – Loans Payable and Note 8 – Commitments and Contingencies in the notes to our company’s consolidated financial statements.
Liquidity and Capital Resources
Our business model is intended to drive growth through acquisitions. Access to the capital markets is an important factor for our continued success. We expect to continue to issue equity in our company, with proceeds being used to acquire additional investment properties.
Our primary liquidity needs are funding for (1) operations, including operating expenses, corporate and administrative costs, payment of principal of, and interest on, outstanding indebtedness, and escrow and reserve payments associated with long-term debt financing for our properties; (2) investing needs, including property acquisitions and recurring capital expenditures; and (3) financing needs, including cash dividends and debt repayments.
Internal liquidity to fund operating needs will be provided primarily by the rental receipts from our retail properties and flex center property, and revenues from our hotel properties. During three months ended March 31, 2021, the COVID-19 pandemic continued to impact our financial and operational results that provide the liquidity for operating needs. While our company recognized only $3,196 bad debt expense for our retail and flex center properties during the three months ended March 31, 2021, our company’s retail property and flex property rent revenues were impacted by (i) rent abatement agreements that resulted in rent abatements of $109,818 for the three months ended March 31, 2021 and (ii) a restructured lease agreement (under a tenant’s bankruptcy proceedings) that resulted in a rent abatement of $16,440 for the three months ended March 31, 2021.
For our Hampton Inn Property, occupancy and revenues were significantly impacted by COVID-19. For the three months ended March 31, 2021, total revenues from our Hampton Inn Property were 91 percent of the revenues for the three months ended March 31, 2020 and 82 percent of the revenues for the three months ended March 31, 2019. Our Clemson Best Western Property saw increased revenues resulting from the lease with Clemson University. Room revenues for the three months ended March 31, 2021 were approximately 235 percent of the room revenues for the three months ended March 31, 2020. However, this trend is unlikely to continue when the Clemson University lease ends on May 5, 2021.
49
The full extent of the impact will be dictated by, among other things, its nature, duration and scope, the success of efforts to contain the spread of COVID-19 and the impact of actions taken in response to the pandemic including travel bans and restrictions, quarantines, shelter in place orders, the promotion of social distancing and limitations on business activity, including business closures. New variants of COVID-19 and continued delays in vaccine distribution could result in the re-imposition of limitations on business activity, travel and other restrictions that could increase the extent of the impact on our investment properties. Possible future declines in rental rates and expectations of future rental concessions, including granting free rent to induce tenants to renew their leases early, to retain tenants who are up for renewal, or to attract new tenants, or requests from tenants for rent abatements during periods when they are severely impacted by COVID-19, may result in decreases in our cash flows from our retail and flex properties. The past and potential for future travel bans and stay at home orders have and could continue to materially affect our hotel revenues. At this point, the extent to which the COVID-19 pandemic may impact the economy and our business is uncertain, but pandemics or other significant public health events could have a material adverse effect on our business, results of operations and internal liquidity.
Cash Flows
At March 31, 2021, our consolidated cash and restricted cash on hand totaled $6,351,244 compared to consolidated cash on hand of $2,822,993 at March 31, 2020. Cash from operating activities, investing activities and financing activities for the three months ended March 31, 2021 and 2020 are as follows:
Operating Activities
During the three months ended March 31, 2021 our cash provided by operating activities was $206,818 compared to cash provided by operating activities of $16,784 for the three months ended March 31, 2020, an increase of cash provided by operating activities of $190,034.
Cash used in operating activities has two components. The first component consists of net operating loss adjusted for non-cash operating activities. During the three months ended March 31, 2021, operating activities adjusted for non-cash items resulted in net cash provided by operating activities of $50,868. During the three months ended March 31, 2020, operating activities adjusted for non-cash items resulted in net cash used in operating activities of $129,778. The increase of $180,646 in cash used in operations for the three months ended March 31, 2021 was a result of improved hotel property room revenues and continued hotel property operating expense control. These improved hotel operations were slightly offset by a decline in retail center property revenues due to rent abatements granted as a result of COVID-19 and increased legal, accounting and other professional fees and corporate general and administrative expenses during the three months ended March 31, 2021.
The second component consists of changes in assets and liabilities. Increases in assets and decreases in liabilities result in cash used in operations. Decreases in assets and increases in liabilities result in cash provided by operations. During the three months ended March 31, 2021, net changes in asset and liability accounts resulted in $155,950 in cash provided by operations. During the three months ended March 31, 2020, net changes in asset and liability accounts resulted in $146,562 in cash provided by operations. This increase of $9,388 in changes in assets and liabilities is a result of an increased change in other assets of $322,702 due to deposits and other capitalized costs related to our company’s pending acquisition of the Lancer Center Shopping Center, and a $44,258 increased change in unbilled rent. These increases in changes in asset accounts were offset by decreases in changes of accounts payable and other liabilities of $263,693 and a larger decrease in the change in rent and other receivables of $112,655.
The net of (i) the $180,646 increase in cash used in operations from the first category and (ii) the $9,388 increase in cash used in operations from the second category results in a total increase of cash used in operations of $190,034.
Investing Activities
During the three months ended March 31, 2021, our cash used in investing activities was $45,150, compared to cash used in investing activities of $163,246 during the three months ended March 31, 2020, a decrease in cash used in investing activities of $118,096. During the three months ended March 31, 2021, cash used in investing activities consisted of $45,150 in capitalized tenant improvements for a new tenant in the Franklin Square Property. During the three months ended March 31, 2020, cash used investing activities consisted of $163,246 in capital expenditures, including $85,507 in interior construction costs and furniture, fixtures and equipment for the Property Improvement Plan for the Hampton Inn Property, $12,642 in leasing commissions for the Franklin Square Property, $2,597 in leasing commissions for the Hanover Square Property, and $62,500 in leasing commissions and tenant improvements for the Ashley Plaza Property.
The non-cash investing activity for the three months ended March 31, 2021, that did not affect our cash provided by investing activities, was the transfer of investment properties, net to assets held for sale, net of $9,683,555.
Financing Activities
During the three months ended March 31, 2021, our cash provided by financing activities was $1,092,648 compared to cash provided by financing activities of $897,265 during the three months ended March 31, 2020, an increase in cash provided by financing activities of $195,383. During the three months ended March 31, 2021, we generated net proceeds, after issuance costs, from the closing of the third tranche of our convertible debentures of $1,305,000. Additionally, our company used funds for mortgage debt principal payments associated with the Hanover Square Property, Ashley Square Property and Brookfield Center Property of $134,150, paid distributions to noncontrolling interests of $12,000 during the three months ended March 31, 2021 and paid $66,202 in capitalized offering costs related to our April 13, 2021 stock issuance.
50
During the three months ended March 31, 2020, we generated net proceeds, after offering costs, from our preferred stock issuance of $3,860,882, and we generated funds from a line of credit, short term, net, in the amount of $550,000. Additionally, our company used funds to repay a line of credit, short term, in the amount of $2,000,000, related party notes payable, short term, in the amount of $852,000, and mortgage debt principal associated with the Hanover Square Property of $50,924. Our company paid dividends and distributions of $610,693 during the three months ended March 31, 2020.
Non-cash financing activities for the three months ended March 31, 2021, that did not affect our cash provided by financing activities were the conversion of convertible debentures and accrued interest totaling $3,799,268 into common stock, and the transfer of the mortgage payable, net, of $7,592,931, for the Clemson Best Western Property from mortgages payable, net, to mortgages payable, net, associated with assets held for sale on our condensed consolidated balance sheets.
Future Liquidity Needs
Liquidity for general operating needs and our company’s investment properties is generally provided by the rental receipts from our retail properties and flex center property, and revenues from our hotel properties. Liquidity for growth (acquisition of new investment properties) will be provided by raising additional investment capital. In addition, our company continually reviews and evaluates its outstanding mortgages payable for refinancing opportunities. While some of our mortgages payable are not pre-payable, some mortgages payable may present opportunities for refinancing.
The primary liquidity needs of our company, in addition to the funding of our ongoing operations, are $14,275,000 in mortgage debt maturities (the Franklin Square Property mortgage), the maturity of the $325,000 balance of the line of credit, short term, which was repaid on April 21, 2021 (see subsequent events Note 11), the maturity of the $1,250,000 outstanding balance of the convertible debentures which, as of May 14, 2021, were fully redeemed and converted to common shares (see subsequent events Note 11 to the financial statements), $176,300 to repay the SBA PPP loan should it not be forgiven by the SBA, and funding the equity and closing costs for our acquisition of the Lancer Center Shopping Center. Our company also has approximately $394,807 in principal payments due on its mortgages payable during the remaining nine months ending December 31, 2021. In addition to liquidity required to fund these principal payments, we may also incur some level of capital expenditures for our existing properties that cannot be passed on to our tenants. Our company plans to pay these obligations through a combination of mortgage refinancings, capital raises, potential dispositions and operating cash. Management intends to refinance or extend the remaining maturing debt as it comes due.
As discussed above, the continuing COVID-19 pandemic outbreak has adversely impacted states and cities where our company’s tenants operate their businesses and where our company’s properties are located. The COVID-19 pandemic could have a material adverse effect on our company’s financial condition, results of operations and cash flows as the reduced economic activity severely impacts certain of our company’s tenants’ businesses, financial condition and liquidity and may cause certain tenants to be unable to meet their obligations to our company in full. Closures of stores operated by our company’s tenants could reduce our company’s cash flows.
To meet these future liquidity needs, we have the following resources:
| • | $3,681,292 in unrestricted cash as of March 31, 2021 |
| • | $2,669,952 held in lender reserves for the purpose of tenant improvements, lease commissions, real estate taxes and insurance premiums | |
| • | $10,918,914 in net proceeds from the April 13, 2021 share issuance and sale (see Note 11 of the notes to condensed consolidated financial statements included in this Form 10-Q) |
| • | cash generated from operations during the remaining nine months ended December 31, 2021, if any. |
In addition, the Board has not declared a dividend since the fourth quarter 2019 dividend, paid in March 2020. The Board plans to continually evaluate our company’s approach to dividends. The Board believes that forgoing quarterly dividends will provide our company funding to help meet its ongoing liquidity needs. Additionally, our company plans to undertake measures to grow its operations and increase liquidity through its continued efforts to raise capital and acquire additional investment properties.
Our success in refinancing the debt, and executing on our strategy will dictate our liquidity needs going forward. If we are unable to execute in these areas, our ability to grow and reinstate dividends may be limited without additional capital.
51
Results of Operations
Revenues
Total revenue was $2,671,853 for the three months ended March 31, 2021, consisting of $1,193,641 in revenues from retail center properties, $1,295,385 from hotel properties and $182,827 from the flex center property. Total revenues for the three months ended March 31, 2021 increased by $143,543 over the three months ended March 31, 2020. Increased hotel property revenues were offset by reduced retail center property and flex center property revenues.
| For
the three months ended March 31, |
Increase / | |||||||||||
| 2021 | 2020 | (Decrease) | ||||||||||
| Revenues | ||||||||||||
| Retail center properties | $ | 1,193,641 | $ | 1,376,290 | $ | (182,649 | ) | |||||
| Hotel properties | 1,295,385 | 956,868 | 338,517 | |||||||||
| Flex center property | 182,827 | 195,152 | (12,325 | ) | ||||||||
| $ | 2,671,853 | $ | 2,528,310 | $ | 143,543 | |||||||
Revenues from retail center properties were $1,193,641 for the three months ended March 31, 2021, a decrease of $182,649 over retail center property revenues for the three months ended March 31, 2020. Revenues from the Franklin Square Property decreased by $111,077 and the Hanover Square Property by $73,039 due to rent abatements resulting from COVID-19. These were offset by a slight increase in revenues from the Ashley Plaza Property of $1,467.
| For
the three months ended March 31, |
Increase / | |||||||||||
| 2021 | 2020 | (Decrease) | ||||||||||
| Retail Center Properties | ||||||||||||
| Franklin Square Property | $ | 468,822 | $ | 579,899 | $ | (111,077 | ) | |||||
| Hanover Square Property | 304,485 | 377,524 | (73,039 | ) | ||||||||
| Ashley Plaza Property | 420,334 | 418,867 | 1,467 | |||||||||
| $ | 1,193,641 | $ | 1,376,290 | $ | (182,649 | ) | ||||||
Revenues from hotel properties were $1,295,385 for the three months ended March 31, 2021, an increase of $338,517 over revenues from hotel properties for the three months ended March 31, 2020. Increased revenues of $392,667 from the Clemson Best Western Property due to the lease of the full hotel property for the three months ended March 31, 2021 offset a decline in revenues from the Hampton Inn Property of $54,150 due to reduced occupancy and revenues resulting from COVID-19.
| For
the three months ended March 31, |
Increase / | |||||||||||
| 2021 | 2020 | (Decrease) | ||||||||||
| Hotel Properties | ||||||||||||
| Hampton Inn Property | $ | 525,800 | $ | 579,950 | $ | (54,150 | ) | |||||
| Clemson Best Western Property | 769,585 | 376,918 | 392,667 | |||||||||
| $ | 1,295,385 | $ | 956,868 | $ | 338,517 | |||||||
52
Revenues from the flex center property were $182,827 for the three months ended March 31, 2021, a decrease of $12,325 over revenues from flex center properties for the three months ended March 31, 2020, resulting from reduced common area maintenance reimbursement revenues.
| For
the three months ended March 31, |
Increase / | |||||||||||
| 2021 | 2020 | (Decrease) | ||||||||||
| Brookfield Center Property | $ | 182,827 | $ | 195,152 | $ | (12,325 | ) | |||||
Operating Expenses
Total operating expenses were $2,546,815 for the three months ended March 31, 2021, consisting of $331,126 in expenses from retail center properties, $797,395 in expenses from hotel properties, $54,088 in expenses from the flex center property, $149,981 in share based compensation expenses, $498,612 in legal, accounting and other professional fees, $62,380 in corporate general and administrative expenses, and $653,233 in depreciation and amortization.
| For
the three months ended March 31, |
Increase / | |||||||||||
| 2021 | 2020 | (Decrease) | ||||||||||
| Operating Expenses | ||||||||||||
| Retail center properties (1) | $ | 331,126 | $ | 361,600 | $ | (30,474 | ) | |||||
| Hotel properties | 797,395 | 962,696 | (165,301 | ) | ||||||||
| Flex center property | 54,088 | 52,559 | 1,529 | |||||||||
| Total Investment Property Operating Expenses | 1,182,609 | 1,376,855 | (194,246 | ) | ||||||||
| Share based compensation expenses | 149,981 | 569,995 | (420,014 | ) | ||||||||
| Legal, accounting and other professional fees | 498,612 | 402,795 | 95,817 | |||||||||
| Corporate general and administrative expenses | 62,380 | 75,388 | (13,008 | ) | ||||||||
| Depreciation and amortization | 653,233 | 1,017,407 | (364,174 | ) | ||||||||
| Total Operating Expenses | $ | 2,546,815 | $ | 3,442,440 | $ | (895,625 | ) | |||||
| (1) | Includes $3,196 and $6,003 of bad debt expense for the three months ended March 31, 2021 and 2020, respectively. |
Operating expenses for retail center properties were $331,126 for the three months ended March 31, 2021, a decrease of $30,474 over retail center property operating expenses for the three months ended March 31, 2020. Decreased operating expenses at our company’s Franklin Square Property resulting from reduced maintenance costs, contract services and legal fees were the primary contributor to this reduction.
| For
the three months ended March 31, |
Increase / | |||||||||||
| 2021 | 2020 | (Decrease) | ||||||||||
| Retail Center Properties | ||||||||||||
| Franklin Square Property (1) | $ | 157,886 | $ | 187,796 | $ | (29,910 | ) | |||||
| Hanover Square Property | 88,411 | 86,629 | 1,782 | |||||||||
| Ashley Plaza Property (2) | 84,829 | 87,175 | (2,346 | ) | ||||||||
| $ | 331,126 | $ | 361,600 | $ | (30,474 | ) | ||||||
| (1) | Includes bad debt expense of $0 and $977 for the three months ending March 31, 2021 and 2020, respectively. |
| (2) | Includes bad debt expense of $3,196 and $5,026 for the three months ending March 31, 2021 and 2020, respectively. |
Operating expenses for hotel properties were $797,395 for the three months ended March 31, 2021, a decrease of $165,301 over operating expenses from hotel properties for the three months ended March 31, 2020. Both hotel properties continued to carefully manage variable expenses. Operating expenses at the Hampton Inn Property were lower due to decreased occupancy. While the Clemson Best Western Property was fully leased, the hotel was not fully occupied and, as a result, management was able to continue to control operating expenses.
| For
the three months ended March 31, |
Increase / | |||||||||||
| 2021 | 2020 | (Decrease) | ||||||||||
| Hotel Properties | ||||||||||||
| Hampton Inn Property | $ | 458,141 | $ | 536,035 | $ | (77,894 | ) | |||||
| Clemson Best Western Property | 339,254 | 426,661 | (87,407 | ) | ||||||||
| $ | 797,395 | $ | 962,696 | $ | (165,301 | ) | ||||||
53
Operating expenses from the flex center property were $54,088 for the three months ended March 31, 2021 an increase of $1,529 over flex center property operating expenses for the three months ended March 31, 2020 due to slightly increased repairs and maintenance expenses.
| For
the three months ended March 31, |
Increase / | |||||||||||
| 2021 | 2020 | (Decrease) | ||||||||||
| Brookfield Center Property | $ | 54,088 | $ | 52,559 | $ | 1,529 | ||||||
Operating Income (Loss)
Operating income for the three months ended March 31, 2021 was $125,038, an increase of $1,039,168 over the operating loss of $914,130 for the three months ended March 31, 2020. This increase was a result of (i) increased operating income from our hotel properties of $480,074 from the Clemson Best Western Property and $23,744 from the Hampton Inn Property, (ii) decreased operating income from our retail center properties of $81,167 from the Franklin Square Property, $74,821 from the Hanover Square Property slightly offset by an increase in operating income of $3,813 from the Ashley Plaza Property, (iii) reduced operating income of $13,854 from the Brookfield Center Property, (iv) decreased depreciation and amortization expense of $364,174 resulting from the reclassification of the two hotel properties to assets held for sale, which results in the cessation of the recordation of depreciation and amortization expenses, (v) increased legal, accounting and other professional fees of $95,817, and (vi) decreased corporate general and administrative expenses of $13,008.
Interest Expense
Interest expense was $2,434,132 and $918,132 for the three months ended March 31, 2021 and 2020, respectively, as follows:
| For
the three months ended March 31, |
Increase/ | |||||||||||
| 2021 | 2020 | (Decrease) | ||||||||||
| Franklin Square | $ | 170,053 | $ | 174,233 | $ | (4,180 | ) | |||||
| Hanover Square | 114,066 | 106,867 | 7,199 | |||||||||
| Hampton Inn | 182,378 | 213,806 | (31,428 | ) | ||||||||
| Ashley Plaza | 110,445 | 112,423 | (1,978 | ) | ||||||||
| Clemson Best Western | 162,544 | 164,498 | (1,954 | ) | ||||||||
| Brookfield Center | 49,922 | 50,651 | (729 | ) | ||||||||
| Amortization and preferred stock dividends on mandatorily redeemable preferred stock | 149,449 | 64,743 | 84,706 | |||||||||
| Amortization and interest on convertible debentures | 1,491,543 | - | 1,491,543 | |||||||||
| Line of credit, short term | 2,744 | 23,572 | (20,828 | ) | ||||||||
| Related party notes payable, short term | - | 5,835 | (5,835 | ) | ||||||||
| Other interest | 988 | 1,504 | (516 | ) | ||||||||
| Total interest expense | $ | 2,434,132 | $ | 918,132 | $ | 1,516,000 | ||||||
Total interest expense for the three months ended March 31, 2021 increased by $1,516,000 over the three months ended March 31, 2020. This increase was primarily a result of the write-off of unamortized discount, issuance costs and beneficial conversion feature resulting from the conversion of convertible debentures to common stock, and interest expense recorded on the mandatorily redeemable preferred stock and the convertible debentures, offset by reduced interest expense from the Hampton Inn Mortgage as a result of the principal reduction made as part of the loan extension, and from the line of credit, short term. Interest expense above includes non-cash amortization of discounts and capitalized issuance costs related to the mandatorily redeemable preferred stock and the convertible debentures. See Note 5 of the accompanying notes to the Condensed Consolidated Financial Statements.
Net Loss
Net loss was $2,307,742 for the three months ended March 31, 2021, before adjustments for net loss attributable to noncontrolling interests. After adjusting for noncontrolling interests, the net loss attributable to our common shareholders was $2,277,254. Net loss was $1,833,180 for the three months ended March 31, 2020, before adjustments for net loss attributable to noncontrolling interests. After adjusting for noncontrolling interests, the net loss attributable to Medalist common shareholders was $1,724,293 for the three months ended March 31, 2020.
Net loss for the three months ended March 31, 2021 increased by $474,562 over the three months ended March 31, 2020, before adjustments for net loss attributable to noncontrolling interests. This increase was due to increased interest expense of $1,516,000 offset by increased revenues of $143,543 and decreased operating expenses of $895,625, all as discussed above.
After adjusting for noncontrolling interests, the net loss attributable to Medalist common shareholders for the three months ended March 31, 2021 increased by $553,231 over the three months ended March 31, 2020.
54
Funds from Operations
We use Funds from operations (“FFO”), a non-GAAP measure, as an alternative measure of our operating performance, specifically as it relates to results of operations and liquidity. We compute FFO in accordance with standards established by the Board of Governors of the National Association of Real Estate Investment Trusts (“NAREIT”) in its March 1995 White Paper (as amended in November 1999, April 2002 and December 2018). As defined by NAREIT, FFO represents net income (computed in accordance with GAAP), excluding gains (or losses) from sales of property, plus real estate related depreciation and amortization (excluding amortization of loan origination costs and above and below market leases) and after adjustments for unconsolidated partnerships and joint ventures. Most industry analysts and equity REITs, including us, consider FFO to be an appropriate supplemental measure of operating performance because, by excluding gains or losses on dispositions and excluding depreciation, FFO is a helpful tool that can assist in the comparison of the operating performance of a company’s real estate between periods, or as compared to different companies. Management uses FFO as a supplemental measure to conduct and evaluate our business because there are certain limitations associated with using GAAP net income alone as the primary measure of our operating performance. Historical cost accounting for real estate assets in accordance with GAAP implicitly assumes that the value of real estate assets diminishes predictably over time, while historically real estate values have risen or fallen with market conditions. Accordingly, we believe FFO provides a valuable alternative measurement tool to GAAP when presenting our operating results.
NAREIT’s December 2018 White Paper states, “FFO of a REIT includes the FFO of all consolidated properties, including consolidated, partially owned affiliates”. Additionally, since the adjustments to GAAP net income, such as depreciation and amortization, used in the reconciliation of net income (loss) to determine FFO are not allocated between shareholders and noncontrolling interests (i.e. 100 percent of depreciation and amortization are “added back” without reduction to reflect the noncontrolling owners’ interest in such items), our company believes that the appropriate starting point for the calculation is the net income (loss) before allocation to noncontrolling interests. This allows our company to use FFO as a tool to measure the overall performance of its investment properties, as a whole, not just the portion of the investment properties controlled by our company’s shareholders.
Below is our company’s FFO, which is a non-GAAP measurement, for the three months ended March 31, 2021:
| Net income (loss) | $ | (2,307,742 | ) | |
| Depreciation of tangible real property assets (1) | 365,726 | |||
| Depreciation of tenant improvements (2) | 74,336 | |||
| Amortization of leasing commissions (3) | 14,712 | |||
| Amortization of intangible assets (4) | 198,459 | |||
| Funds from operations | (1,654,509 | ) |
| (1) | Depreciation expense for buildings, site improvements and furniture and fixtures. | |
| (2) | Depreciation of tenant improvements, including those (i) acquired as part of the purchase of the Franklin Square Property and Hanover Square Property and (ii) those constructed by our company subsequent to the acquisition of the properties. | |
| (3) | Amortization of leasing commissions paid for the Franklin Square Property, Hanover Square Property, Ashley Plaza Property and Brookfield Center Property subsequent to the acquisition of the properties. | |
| (4) | Amortization of (i) intangible assets acquired as part of the purchase of the Franklin Square Property, the Hanover Square Property, the Ashley Plaza Property and the Brookfield Center Property, including leasing commissions, leases in place and legal and marketing costs during the three months ended March 31, 2021. |
NAREIT’s December 2018 White Paper encourages companies reporting FFO to “make supplemental disclosure of all material non-cash revenues and expenses affecting their results for each period.” We believe that the computation of FFO in accordance with NAREIT’s definition includes certain items that are not indicative of the results provided by our operating portfolio and affect the comparability of our period-over-period performance. These items include non-cash items such as amortization of loans and above and below market leases, unbilled rent arising from applying straight line rent revenue recognition and share-based compensation expenses. Additionally, the impact of capital expenditures, including tenant improvement and leasing commissions, net of reimbursements of such expenditures by property escrow funds, is included in our calculation of AFFO. Therefore, in addition to FFO, management uses Adjusted FFO (“AFFO”), which we define to exclude such items. Management believes that these adjustments are appropriate in determining AFFO as their exclusion is not indicative of the operating performance of our assets. In addition, we believe that AFFO is a useful supplemental measure for the investing community to use in comparing us to other REITs as many REITs provide some form of adjusted or modified FFO. However, there can be no assurance that AFFO presented by us is comparable to the adjusted or modified FFO of other REITs.
55
Total AFFO for the three months ended March 31, 2021 was as follows:
| Funds from operations | $ | (1,654,509 | ) | |
| Amortization of above market leases (1) | 53,613 | |||
| Amortization of below market leases (2) | (50,376 | ) | ||
| Straight line rent (3) | (88,092 | ) | ||
| Capital expenditures (4) | (45,150 | ) | ||
| Decrease (Increase) in fair value of interest rate cap (5) | (160 | ) | ||
| Amortization of loan issuance costs (6) | 44,190 | |||
| Amortization of preferred stock discount and offering costs (7) | 49,449 | |||
| Amortization of convertible debenture discount, offering costs and beneficial conversion feature (8) | 1,455,324 | |||
| Share-based compensation (9) | 149,981 | |||
| Bad debt expense (10) | 3,196 | |||
| Adjusted funds from operations (AFFO) | (82,534 | ) |
| (1) | Adjustment to FFO resulting from non-cash amortization of intangible assets recorded as part of the purchase of the Franklin Square Property, the Hanover Square Property, the Ashley Plaza Property and the Brookfield Center Property during the three months ended March 31, 2021. | |
| (2) | Adjustment to FFO resulting from non-cash amortization of intangible liabilities recorded as part of the Franklin Square Property, the Hanover Square Property, the Ashley Plaza Property and the Brookfield Center Property during the three months ended March 31, 2021. | |
| (3) | Adjustment to FFO resulting from non-cash revenues recognized as a result of applying straight line revenue recognition for the Franklin Square Property, the Hanover Square Property, the Ashley Plaza Property and the Brookfield Center Property during the three months ended March 31, 2021. | |
| (4) | Adjustment to FFO for capital expenditures, including capitalized leasing commissions, tenant improvements, building and site improvements and purchases of furniture, fixtures and equipment that have not been reimbursed by property escrow accounts. During the three months ended March 31, 2021, our company paid $45,150 in tenant improvements for our Franklin Square Property. | |
| (5) | Adjustment to FFO resulting from non-cash expenses recognized as a result of decreases in the fair value of the interest rate caps for the Hampton Inn Property and the Clemson Best Western Property during the three months ended March 31, 2021. | |
| (6) | Adjustment to FFO for amortization of non-cash expenses recognized as a result of amortizing loan issuance costs over the terms of the respective mortgages during the three months ended March 31, 2021. | |
| (7) | Adjustment to FFO for amortization of non-cash expenses recognized as a result of amortizing the preferred stock discount over its five year term during the three months ended March 31, 2021. | |
| (8) | Adjustment to FFO for amortization of non-cash expenses recognized as a result of amortizing the preferred stock offering costs over its five year term during the three months ended March 31, 2021. | |
| (9) | Adjustment to FFO resulting from non-cash expenses recorded for share based compensation. | |
| (10) | NAREIT’s December 2018 White Paper provides guidance on non-cash revenues and expenses, stating, “To provide an opportunity for consistent analysis of operating results among REITs, NAREIT encourages those reporting FFO to make supplemental disclosure of all material non-cash revenues and expenses affecting their results for each period. Our company has elected to include non-cash revenues (debt forgiveness) and expenses (bad debt expense) in its calculation of AFFO. |
Item 3. Quantitative and Qualitative Disclosures about Market Risk
We have omitted a discussion of quantitative and qualitative disclosures about market risk because, as a smaller reporting company, we are not required to provide such information.
Item 4. Controls and Procedures
Evaluation of Disclosure Controls and Procedures
Based on the most recent evaluation, the Company’s principal executive officer and principal financial officer have determined that the Company’s disclosure controls and procedures (as defined in Rules 13a-15(e) and 15d-15(e) under the Securities and Exchange Act of 1934, as amended) were effective as of March 31, 2021.
56
Management’s Report on Internal Control Over Financial Reporting
There have been no changes to our internal control over financial reporting that occurred during the period covered by this report that have materially affected, or are reasonably likely to materially affect, our internal control over financial reporting.
We and our subsidiaries are, from time to time, parties to litigation arising from the ordinary course of their business. Our management does not believe that any such litigation will materially affect our financial position or operations.
We have omitted a discussion of risk factors because, as a smaller reporting company, we are not required to provide such information.
Item 2. Unregistered Sales of Equity Securities and Use of Proceeds
During January 2021, our company issued a $1,500,000 convertible debenture. The proceeds were used as working capital and general corporate purposes. The convertible debenture was issued pursuant to an exemption from registration pursuant to Section 4(a)(2) the Securities Act.
Item 3. Defaults Upon Senior Securities
None.
Item 4. Mine Safety Disclosures
Not applicable.
None.
| † | Filed herewith. |
| * | Previously filed with the Amendment to the Registrant’s Registration Statement on Form S-11 filed by the Registrant with the Securities and Exchange Commission on October 5, 2018. |
57
Pursuant to the requirements of the Securities Exchange Act of 1934, the registrant has duly caused this report to be signed on its behalf by the undersigned, thereunto duly authorized.
MEDALIST DIVERSIFIED REIT, INC.
Date: May 14, 2021
| By: | /s/ Thomas E. Messier | |
| Thomas E. Messier | ||
| Chief Executive Officer and Chairman of the Board | ||
| (principal executive officer)) |
| By: | /s/ C. Brent Winn | |
| C. Brent Winn | ||
| Chief Financial Officer | ||
| (principal accounting officer and principal financial officer) |