Attached files
| file | filename |
|---|---|
| 8-K - 8-K - MID PENN BANCORP INC | d103097d8k.htm |
| EX-99.1 - EX-99.1 - MID PENN BANCORP INC | d103097dex991.htm |

Exhibit 99.2 DRAFT 04.07.2021 MID PENN BANCORP, INC. Common Equity Follow-On Offering April 2021 1Exhibit 99.2 DRAFT 04.07.2021 MID PENN BANCORP, INC. Common Equity Follow-On Offering April 2021 1

DISCLOSURE AND FORWARD LOOKING STATEMENTS This presentation is solely for informational purposes and has been prepared to assist interested parties in making their own evaluation of Mid Penn Bancorp, Inc. (the “Company”) and does not purport to contain all of the information that may be relevant. This presentation does not constitute an offer to sell, nor a solicitation of an offer to buy, any securities of the Company by any person in any jurisdiction in which it is unlawful for such person to make such an offering or solicitation. Neither the Securities and Exchange Commission nor any other regulatory body has approved or disapproved of the securities of the Company or passed upon the accuracy or adequacy of this presentation. Any representation to the contrary is a criminal offense The Company has filed a shelf registration statement (including a prospectus) (File No. 333-233146) and a preliminary prospectus supplement with the Securities and Exchange Commission, or the SEC, for the offering to which this presentation relates. The sale of shares of common stock in the underwritten offering is being made solely pursuant to such prospectus supplement and accompanying base prospectus. Before you invest, you should read the prospectus in the registration statement and the preliminary prospectus supplement and other documents the Company has filed with the SEC for more complete information about the Company and the offering. You may obtain these documents for free by visiting EDGAR on the SEC website at www.sec.gov or by visiting the Company’s website at www.midpennbank.com. Alternatively, copies of the preliminary prospectus supplement and the accompanying prospectus relating to the offering may be obtained by contacting Piper Sandler & Co., 1251 Avenue of the Americas, 6th Floor, New York, New York 10020, or by phone at 1-866-805-4128. This presentation contains forward-looking statements. Any statements about our expectations, beliefs, plans, predictions, forecasts, objectives, assumptions or future events or performance are not historical facts and may be forward-looking. You can identify forward-looking statements by the use of forward-looking terminology such as “believes,” “expects,” “could,” “may,” “will,” “should,” “seeks,” “likely,” “intends,” “plans,” “pro forma,” “projects,” “estimates” or “anticipates” or the negative of these words and phrases or similar words or phrases that are predictions of or indicate future events or trends and that do not relate solely to historical matters. You can also identify forward-looking statements by discussions of strategy, plans or intentions. Forward-looking statements involve numerous risks and uncertainties and you should not rely on them as predictions of future events. Forward-looking statements depend on assumptions, data or methods that may be incorrect or imprecise and we may not be able to realize them. We do not guarantee that the transactions and events described will happen as described (or that they will happen at all). We have based these forward-looking statements largely on our current expectations and projections about future events and financial trends that we believe may affect our financial condition, results of operations, business strategy and financial needs. There are important factors that could cause our actual results, level of activity, performance or achievements to differ materially from the results, level of activity, performance or achievements expressed or implied by the forward-looking statements including, but not limited to: (1) changes in general economic and financial market conditions; (2) changes in the regulatory environment; (3) economic conditions generally and in the financial services industry; (4) changes in the economy affecting real estate values; (5) our ability to achieve loan and deposit growth; (6) the completion of any future acquisitions or business combinations and our ability to integrate any new business line or acquired business into our business model; (7) projected population and income growth in our current and targeted market areas; and (8) volatility and direction of market interest rates and a weakening of the economy which could materially impact credit quality trends and the ability to generate loans and grow deposits. We disclaim any obligation to publicly update or revise any forward-looking statement to reflect changes in underlying assumptions or factors of new information, data or methods, future events or other changes except as required by applicable law. All forward-looking statements are necessarily only estimates of future results. Accordingly, actual results may differ materially from those expressed in or contemplated by the particular forward-looking statement, and, therefore, you are cautioned not to place undue reliance on such statements. Any forward-looking statement is qualified in its entirety by reference to the matters discussed in this presentation. Further, any forward-looking statement speaks only as of the date on which it is made, and we undertake no obligation to update any forward-looking statement to reflect events or circumstances after the date on which the statement is made or to reflect the occurrence of unanticipated events or circumstances, except as required by applicable law. Certain information contained in this presentation and statements made orally during this presentation relate to or are based on publications and other data obtained from third-party sources. While we believe these third-party sources to be reliable as of the date of this presentation, we have not independently verified, and make no representation as to the adequacy, fairness, accuracy or completeness of, any information obtained from such third-party sources. This presentation includes certain non-GAAP financial measures intended to supplement, not substitute for, comparable GAAP measures. Reconciliations of certain non-GAAP financial measures to GAAP financial measures are provided throughout the presentation. Numbers in this presentation may not sum due to rounding. 2DISCLOSURE AND FORWARD LOOKING STATEMENTS This presentation is solely for informational purposes and has been prepared to assist interested parties in making their own evaluation of Mid Penn Bancorp, Inc. (the “Company”) and does not purport to contain all of the information that may be relevant. This presentation does not constitute an offer to sell, nor a solicitation of an offer to buy, any securities of the Company by any person in any jurisdiction in which it is unlawful for such person to make such an offering or solicitation. Neither the Securities and Exchange Commission nor any other regulatory body has approved or disapproved of the securities of the Company or passed upon the accuracy or adequacy of this presentation. Any representation to the contrary is a criminal offense The Company has filed a shelf registration statement (including a prospectus) (File No. 333-233146) and a preliminary prospectus supplement with the Securities and Exchange Commission, or the SEC, for the offering to which this presentation relates. The sale of shares of common stock in the underwritten offering is being made solely pursuant to such prospectus supplement and accompanying base prospectus. Before you invest, you should read the prospectus in the registration statement and the preliminary prospectus supplement and other documents the Company has filed with the SEC for more complete information about the Company and the offering. You may obtain these documents for free by visiting EDGAR on the SEC website at www.sec.gov or by visiting the Company’s website at www.midpennbank.com. Alternatively, copies of the preliminary prospectus supplement and the accompanying prospectus relating to the offering may be obtained by contacting Piper Sandler & Co., 1251 Avenue of the Americas, 6th Floor, New York, New York 10020, or by phone at 1-866-805-4128. This presentation contains forward-looking statements. Any statements about our expectations, beliefs, plans, predictions, forecasts, objectives, assumptions or future events or performance are not historical facts and may be forward-looking. You can identify forward-looking statements by the use of forward-looking terminology such as “believes,” “expects,” “could,” “may,” “will,” “should,” “seeks,” “likely,” “intends,” “plans,” “pro forma,” “projects,” “estimates” or “anticipates” or the negative of these words and phrases or similar words or phrases that are predictions of or indicate future events or trends and that do not relate solely to historical matters. You can also identify forward-looking statements by discussions of strategy, plans or intentions. Forward-looking statements involve numerous risks and uncertainties and you should not rely on them as predictions of future events. Forward-looking statements depend on assumptions, data or methods that may be incorrect or imprecise and we may not be able to realize them. We do not guarantee that the transactions and events described will happen as described (or that they will happen at all). We have based these forward-looking statements largely on our current expectations and projections about future events and financial trends that we believe may affect our financial condition, results of operations, business strategy and financial needs. There are important factors that could cause our actual results, level of activity, performance or achievements to differ materially from the results, level of activity, performance or achievements expressed or implied by the forward-looking statements including, but not limited to: (1) changes in general economic and financial market conditions; (2) changes in the regulatory environment; (3) economic conditions generally and in the financial services industry; (4) changes in the economy affecting real estate values; (5) our ability to achieve loan and deposit growth; (6) the completion of any future acquisitions or business combinations and our ability to integrate any new business line or acquired business into our business model; (7) projected population and income growth in our current and targeted market areas; and (8) volatility and direction of market interest rates and a weakening of the economy which could materially impact credit quality trends and the ability to generate loans and grow deposits. We disclaim any obligation to publicly update or revise any forward-looking statement to reflect changes in underlying assumptions or factors of new information, data or methods, future events or other changes except as required by applicable law. All forward-looking statements are necessarily only estimates of future results. Accordingly, actual results may differ materially from those expressed in or contemplated by the particular forward-looking statement, and, therefore, you are cautioned not to place undue reliance on such statements. Any forward-looking statement is qualified in its entirety by reference to the matters discussed in this presentation. Further, any forward-looking statement speaks only as of the date on which it is made, and we undertake no obligation to update any forward-looking statement to reflect events or circumstances after the date on which the statement is made or to reflect the occurrence of unanticipated events or circumstances, except as required by applicable law. Certain information contained in this presentation and statements made orally during this presentation relate to or are based on publications and other data obtained from third-party sources. While we believe these third-party sources to be reliable as of the date of this presentation, we have not independently verified, and make no representation as to the adequacy, fairness, accuracy or completeness of, any information obtained from such third-party sources. This presentation includes certain non-GAAP financial measures intended to supplement, not substitute for, comparable GAAP measures. Reconciliations of certain non-GAAP financial measures to GAAP financial measures are provided throughout the presentation. Numbers in this presentation may not sum due to rounding. 2

Offering Summary Issuer: Mid Penn Bancorp, Inc. Offering: Follow-on common stock Gross Amount Offered: $65 million Over-Allotment Option: 15% Exchange / Symbol: NASDAQ GM: MPB To increase capital structure, support the continued growth of our franchise and other general corporate purposes. We may also use a portion of the net proceeds Use of Proceeds: for future acquisitions, although we have no present commitments or agreements to do so Joint Book-Running Managers: 3Offering Summary Issuer: Mid Penn Bancorp, Inc. Offering: Follow-on common stock Gross Amount Offered: $65 million Over-Allotment Option: 15% Exchange / Symbol: NASDAQ GM: MPB To increase capital structure, support the continued growth of our franchise and other general corporate purposes. We may also use a portion of the net proceeds Use of Proceeds: for future acquisitions, although we have no present commitments or agreements to do so Joint Book-Running Managers: 3

Franchise Snapshot Attractive footprint with large, affluent segments in both urban and suburban communities. Franchise Highlights • Banking subsidiary: Mid Penn Bank, (est. 1868) state chartered non member bank and trust company, headquartered in Millersburg, PA • A PA based commercial bank operating strategically in western, central and eastern markets • 36 full-service retail banking locations in the counties of Berks, Bucks, Chester, Cumberland, Dauphin, Fayette, Lancaster, Luzerne, Montgomery, Northumberland, Schuylkill and Westmoreland • Dedicated to providing comprehensive banking and trust services including, but not limited to: • Commercial and consumer loans • Mortgage and home equity loans • Lines of credit • Construction financing Assets Loans Deposits • Farm loans • Community development • Local government loans • Various types of time and demand deposits $2.7 B $3.4 B $2.6 B • Wealth management & insurance services Note: Financial information as of March 31, 2021 Source: S&P Global Market Intelligence, Company Documents 4Franchise Snapshot Attractive footprint with large, affluent segments in both urban and suburban communities. Franchise Highlights • Banking subsidiary: Mid Penn Bank, (est. 1868) state chartered non member bank and trust company, headquartered in Millersburg, PA • A PA based commercial bank operating strategically in western, central and eastern markets • 36 full-service retail banking locations in the counties of Berks, Bucks, Chester, Cumberland, Dauphin, Fayette, Lancaster, Luzerne, Montgomery, Northumberland, Schuylkill and Westmoreland • Dedicated to providing comprehensive banking and trust services including, but not limited to: • Commercial and consumer loans • Mortgage and home equity loans • Lines of credit • Construction financing Assets Loans Deposits • Farm loans • Community development • Local government loans • Various types of time and demand deposits $2.7 B $3.4 B $2.6 B • Wealth management & insurance services Note: Financial information as of March 31, 2021 Source: S&P Global Market Intelligence, Company Documents 4

Franchise Snapshot: Corporate Structure Mid Penn Bancorp, Inc. Mid Penn Bank MPB Financial Services ü Consumer Banking ü Commercial Banking MPB Wealth MPB Risk MPB Management ü Trust and Wealth Management Services ü High / Ultra-High-ü Property & Casualtyü Tax Advisory Net Worth ü Retail Brokerage ü Accident & Healthü Family Office Comprehensive ü Private Banking Investment & ü Lifeü Philanthropic Wealth Management ü Residential Lending Management ü Disability ü Employee Benefits Source: Company Documents 5Franchise Snapshot: Corporate Structure Mid Penn Bancorp, Inc. Mid Penn Bank MPB Financial Services ü Consumer Banking ü Commercial Banking MPB Wealth MPB Risk MPB Management ü Trust and Wealth Management Services ü High / Ultra-High-ü Property & Casualtyü Tax Advisory Net Worth ü Retail Brokerage ü Accident & Healthü Family Office Comprehensive ü Private Banking Investment & ü Lifeü Philanthropic Wealth Management ü Residential Lending Management ü Disability ü Employee Benefits Source: Company Documents 5

Franchise Snapshot: Financial Highlights Market Statistics Financial Highlights 3 MRQ ROAA 1.19% Mkt. Cap $215M 3 MRQ ROAE 14.58% Div. Yield 3.13% MRQ NIM 3.46% NPAs / Assets 0.26% Current Annual $0.80 Dividend MRQ NCOs / Avg. 0.03% 3 Loans 1 TCE / TA 5.95% 1 P / TBV 109% Total Capital 12.50% P / 2022 Estimated 9.8x 2 EPS Loans / Deposits 99.2% (1) Non-GAAP financial metric. Please see Appendix for GAAP to non-GAAP reconciliations (2) Represents Wall Street consensus median estimate as of April 28, 2021 6 (3) Annualized financial metric Note: Financial information as of March 31, 2021; Market data as of April 28, 2021: Source: S&P Global Market IntelligenceFranchise Snapshot: Financial Highlights Market Statistics Financial Highlights 3 MRQ ROAA 1.19% Mkt. Cap $215M 3 MRQ ROAE 14.58% Div. Yield 3.13% MRQ NIM 3.46% NPAs / Assets 0.26% Current Annual $0.80 Dividend MRQ NCOs / Avg. 0.03% 3 Loans 1 TCE / TA 5.95% 1 P / TBV 109% Total Capital 12.50% P / 2022 Estimated 9.8x 2 EPS Loans / Deposits 99.2% (1) Non-GAAP financial metric. Please see Appendix for GAAP to non-GAAP reconciliations (2) Represents Wall Street consensus median estimate as of April 28, 2021 6 (3) Annualized financial metric Note: Financial information as of March 31, 2021; Market data as of April 28, 2021: Source: S&P Global Market Intelligence

Experienced Management Team RORY RITRIEVI Chief Executive Officer Mr. Rory G. Ritrievi joined Mid Penn B ank and parent company Mid Penn Bancorp, Inc. in 2009 as President and Chief Executive Officer. Prior to joining Mid Penn, Mr. Ritrievi s erved as Market President and Chief Lending Officer of Commerce Bank/Harrisburg. Mr. Ritrievi has over 35 years of experience in the financial services industry and is a licensed, but non-practicing attorney in the Commonwealth of Pennsylvania. He currently serves on the Advisory Board for Widener Law Commonw ealth’s Business Advising Certificate Program and on the Board of Directors of the Harrisburg Area YMCA and is an active member of his community. Mr. Ritrievi holds a Juris Doctor from Widener University School of Law and a Bachelor’s Degree in Economics from the University of Pittsburgh. MICHAEL PEDUZZI Chief Financial Officer, SEVP Mr. Michael D. Peduzzi joined Mid Penn Bank and parent company Mid Penn Bancorp, Inc. in 2016. He currently serves as Senior Executive Vice President and Chief Financial Officer. Prior to joining Mid Penn, Mr. Peduzzi served as Senior Vice President and Chief Financial Officer of Codorus Valley Bancorp, Inc. and PeoplesBank of York, PA. He is a licensed CPA, a member of the American Institute of Certified Public Account ants (AICPA), a member of the Pennsylvania Institute of Certified Public Accountants (PICPA), and is currently serving on the Board of Directors of the Pennsylvania Association of Community Bank ers. Mr. Peduzzi holds a Bachelor’s Degree in Accounting from The Pennsylvania State University. JUSTIN WEBB Chief Operating Officer, SEVP Mr. Justin T. Webb joined Mid Penn Bank in 2012 as Chief Credit Officer. In his current role as Senior Executive Vice President and Chief Operating Officer, he oversees the Bank’s administration, operations, credit, s ecurity/facilities groups , as well as the Bank’s acquisition transitions. H e was previously employed by Bank of America and served as Vice President – Cr edit Risk Manager for the Commercial Real Estate Bank . Mr. Webb serves on the Board of Directors for Big Brothers Big Sisters of the Capital Region. Mr. Webb holds a Bachelor’s Degree in Finance from the University of Pittsburgh. SCOTT MICKLEWRIGHT Chief Revenue Officer, SEVP Mr. Scott W. Micklewright joined Mid Penn B ank in 2009 as Vice President and Senior Middle Market Loan Manager. Now serving as Senior Executive Vice President and Chief Revenue Officer, Mr. Micklewright oversees all aspects of net interest income gener ation, including all loan and deposit functions. As the primary catalyst to the development of a high performing calling team in commercial lending, cas h management, residential mortgage, SBA and agricultural lending, he has built an integrated business development team during his time with Mid Penn. Mr. Micklewright holds a Bachelor’s Degr ee in B usiness Management from Millersville University. JOAN DICKINSON Chief of Staff Ms. Joan E. Dickinson, Executive Vice President and Chief of St aff, joined Mid Penn Bank in 2013 as a Vice President and Commercial Loan Officer and later served as a Regional President. Prior to joining Mid Penn, Ms. Dickinson served as a Vice President and Business Bank er at Sant ander Bank. She st arted her career in banking at the former Meridian B ank in Reading, PA. Ms. Dickinson is very active in the community as a Rotarian and has s erved on many boards throughout the greater Harrisburg area. Ms. Dickinson has a Bachelor’s Degree in Accounting from Moravian College and an MBA from Lehigh University. MICHAEL SALERNO Managing Partner – MPB Financial Services Mr. Michael ”Mik e” Salerno has over 20 years of experience as a family wealth and investment professional. He co-founded AUA Capit al Management, the family office of the Unanue family in 2013. Previously, Mike was a managing director and partner of the investment and executive committees of QFS Asset Management. He was a co-founder and CIO of Cenario Capital Management . Pr eviously, he was the founding managing director and CIO for the family office for the Ortenzio Family. Earlier in his career, Mr. Salerno was the President of M&T Capital. He holds a Master’s in Business Administration from The Wharton School. Source: Company Documents 7Experienced Management Team RORY RITRIEVI Chief Executive Officer Mr. Rory G. Ritrievi joined Mid Penn B ank and parent company Mid Penn Bancorp, Inc. in 2009 as President and Chief Executive Officer. Prior to joining Mid Penn, Mr. Ritrievi s erved as Market President and Chief Lending Officer of Commerce Bank/Harrisburg. Mr. Ritrievi has over 35 years of experience in the financial services industry and is a licensed, but non-practicing attorney in the Commonwealth of Pennsylvania. He currently serves on the Advisory Board for Widener Law Commonw ealth’s Business Advising Certificate Program and on the Board of Directors of the Harrisburg Area YMCA and is an active member of his community. Mr. Ritrievi holds a Juris Doctor from Widener University School of Law and a Bachelor’s Degree in Economics from the University of Pittsburgh. MICHAEL PEDUZZI Chief Financial Officer, SEVP Mr. Michael D. Peduzzi joined Mid Penn Bank and parent company Mid Penn Bancorp, Inc. in 2016. He currently serves as Senior Executive Vice President and Chief Financial Officer. Prior to joining Mid Penn, Mr. Peduzzi served as Senior Vice President and Chief Financial Officer of Codorus Valley Bancorp, Inc. and PeoplesBank of York, PA. He is a licensed CPA, a member of the American Institute of Certified Public Account ants (AICPA), a member of the Pennsylvania Institute of Certified Public Accountants (PICPA), and is currently serving on the Board of Directors of the Pennsylvania Association of Community Bank ers. Mr. Peduzzi holds a Bachelor’s Degree in Accounting from The Pennsylvania State University. JUSTIN WEBB Chief Operating Officer, SEVP Mr. Justin T. Webb joined Mid Penn Bank in 2012 as Chief Credit Officer. In his current role as Senior Executive Vice President and Chief Operating Officer, he oversees the Bank’s administration, operations, credit, s ecurity/facilities groups , as well as the Bank’s acquisition transitions. H e was previously employed by Bank of America and served as Vice President – Cr edit Risk Manager for the Commercial Real Estate Bank . Mr. Webb serves on the Board of Directors for Big Brothers Big Sisters of the Capital Region. Mr. Webb holds a Bachelor’s Degree in Finance from the University of Pittsburgh. SCOTT MICKLEWRIGHT Chief Revenue Officer, SEVP Mr. Scott W. Micklewright joined Mid Penn B ank in 2009 as Vice President and Senior Middle Market Loan Manager. Now serving as Senior Executive Vice President and Chief Revenue Officer, Mr. Micklewright oversees all aspects of net interest income gener ation, including all loan and deposit functions. As the primary catalyst to the development of a high performing calling team in commercial lending, cas h management, residential mortgage, SBA and agricultural lending, he has built an integrated business development team during his time with Mid Penn. Mr. Micklewright holds a Bachelor’s Degr ee in B usiness Management from Millersville University. JOAN DICKINSON Chief of Staff Ms. Joan E. Dickinson, Executive Vice President and Chief of St aff, joined Mid Penn Bank in 2013 as a Vice President and Commercial Loan Officer and later served as a Regional President. Prior to joining Mid Penn, Ms. Dickinson served as a Vice President and Business Bank er at Sant ander Bank. She st arted her career in banking at the former Meridian B ank in Reading, PA. Ms. Dickinson is very active in the community as a Rotarian and has s erved on many boards throughout the greater Harrisburg area. Ms. Dickinson has a Bachelor’s Degree in Accounting from Moravian College and an MBA from Lehigh University. MICHAEL SALERNO Managing Partner – MPB Financial Services Mr. Michael ”Mik e” Salerno has over 20 years of experience as a family wealth and investment professional. He co-founded AUA Capit al Management, the family office of the Unanue family in 2013. Previously, Mike was a managing director and partner of the investment and executive committees of QFS Asset Management. He was a co-founder and CIO of Cenario Capital Management . Pr eviously, he was the founding managing director and CIO for the family office for the Ortenzio Family. Earlier in his career, Mr. Salerno was the President of M&T Capital. He holds a Master’s in Business Administration from The Wharton School. Source: Company Documents 7

2020 Highlights Selected Highlights Key Statistics 1 • Organic loan growth (excluding PPP and mortgage loans held for sale) of over 13%; (organic loan growth CAGR of 23.3% 2016 - 2020) • Originated over 4,100 PPP loans totaling ~$630 million of principal Balance balance • Deposits grew at a rate of more than 29%, with non-interest bearing Sheet deposits increasing over $225 million • Added $4 million to the reserve for loan losses, while incurring less than $350 thousand in net losses • Record annual net income of $26.2 million • Increased non-interest income over 42%, driven by record years in both Income our mortgage division and in our fiduciary and wealth management Statement • Generated $20.9 million of PPP loan processing fees ($13.1 million in PPP fees recognized; $7.7 million deferred) • Continued to add business development professionals in our new nonbank subsidiaries focused on wealth management and insurance services Strategic • Consolidated 3 branches and will continue to evaluate opportunities to further streamline our delivery channels Actions • Issued $27.125 million of subordinated debt and redeemed $9.5 million in higher cost subordinated debt (1) Paycheck Protection Program administered by the U.S. Small Business Administration Note: Financial information as of or for the year ended December 31, 2020 8 Source: S&P Global Market Intelligence, Company Documents2020 Highlights Selected Highlights Key Statistics 1 • Organic loan growth (excluding PPP and mortgage loans held for sale) of over 13%; (organic loan growth CAGR of 23.3% 2016 - 2020) • Originated over 4,100 PPP loans totaling ~$630 million of principal Balance balance • Deposits grew at a rate of more than 29%, with non-interest bearing Sheet deposits increasing over $225 million • Added $4 million to the reserve for loan losses, while incurring less than $350 thousand in net losses • Record annual net income of $26.2 million • Increased non-interest income over 42%, driven by record years in both Income our mortgage division and in our fiduciary and wealth management Statement • Generated $20.9 million of PPP loan processing fees ($13.1 million in PPP fees recognized; $7.7 million deferred) • Continued to add business development professionals in our new nonbank subsidiaries focused on wealth management and insurance services Strategic • Consolidated 3 branches and will continue to evaluate opportunities to further streamline our delivery channels Actions • Issued $27.125 million of subordinated debt and redeemed $9.5 million in higher cost subordinated debt (1) Paycheck Protection Program administered by the U.S. Small Business Administration Note: Financial information as of or for the year ended December 31, 2020 8 Source: S&P Global Market Intelligence, Company Documents

Q1 2021 Highlights Selected Highlights Key Statistics 1 • Organic loan growth (excluding PPP and mortgage loans held for sale) of $60.5 million, representing an annualized growth rate of over 12% • Originated over 2,800 PPP loans totaling over $350 million of principal Balance balance • Deposits grew at an annualized rate of more than 31%, with non-interest Sheet bearing deposits increasing over $140 million • Non performing assets decreased by over $8.8 million, reducing non- performing assets to total loans plus OREO to 0.26% • Record quarterly net income of $9.3 million • Increased non-interest income over 61% vs. Q1 2020, driven by continued strong performance of our mortgage division and in fiduciary and wealth Income management Statement • Generated an additional $15.9 million of PPP loan processing fees (an additional $5.0 million in PPP fees recognized; total of $18.6 million expected to be recognized in future quarters as of March 31, 2021) • Continued buildout of MPB Financial Services executive management team Strategic • Continued growth from new PPP customers Actions (1) Paycheck Protection Program administered by the U.S. Small Business Administration Note: Financial information as of or for the quarter ended March 31, 2021 9 Source: S&P Global Market Intelligence, Company DocumentsQ1 2021 Highlights Selected Highlights Key Statistics 1 • Organic loan growth (excluding PPP and mortgage loans held for sale) of $60.5 million, representing an annualized growth rate of over 12% • Originated over 2,800 PPP loans totaling over $350 million of principal Balance balance • Deposits grew at an annualized rate of more than 31%, with non-interest Sheet bearing deposits increasing over $140 million • Non performing assets decreased by over $8.8 million, reducing non- performing assets to total loans plus OREO to 0.26% • Record quarterly net income of $9.3 million • Increased non-interest income over 61% vs. Q1 2020, driven by continued strong performance of our mortgage division and in fiduciary and wealth Income management Statement • Generated an additional $15.9 million of PPP loan processing fees (an additional $5.0 million in PPP fees recognized; total of $18.6 million expected to be recognized in future quarters as of March 31, 2021) • Continued buildout of MPB Financial Services executive management team Strategic • Continued growth from new PPP customers Actions (1) Paycheck Protection Program administered by the U.S. Small Business Administration Note: Financial information as of or for the quarter ended March 31, 2021 9 Source: S&P Global Market Intelligence, Company Documents

Investment Highlights Experienced management team focused on driving franchise value Long track record and demonstrated ability to drive balance sheet growth Complimentary markets of operation provide low cost, stable deposits and higher growth lending opportunities Proven ability to acquire and successfully integrate franchises Clearly identified strategic initiatives to drive profitability and shareholder returns Strong asset quality results over the last 8 years resulting from an exceptional risk management culture History of consistent earnings, dividend and book value growth 10Investment Highlights Experienced management team focused on driving franchise value Long track record and demonstrated ability to drive balance sheet growth Complimentary markets of operation provide low cost, stable deposits and higher growth lending opportunities Proven ability to acquire and successfully integrate franchises Clearly identified strategic initiatives to drive profitability and shareholder returns Strong asset quality results over the last 8 years resulting from an exceptional risk management culture History of consistent earnings, dividend and book value growth 10

Compelling History of Organic and M&A based Growth • Infrastructure investments from 2009 – 2014 paved the way for a successful run of organic and acquired growth • Three successful bank acquisitions from 2015 to 2018 added over $1 billion in assets while diversifying and expanding our markets of operation • New initiatives launched in 2019 and 2020 to help drive fee income businesses, including a notable expansion of the mortgage banking operation and wealth management and insurance businesses Track Record of Successful Growth Announced the rebranding Announced closure of three Announced acquisition of The of branches and offices in Rory Ritrievi joins MPB as full service branches Scottdale Bank & Trust (“SB&T”) the FPB Division to the Mid Chief Executive Officer and Named 20th Best Bank To Company, adding $262M of assets Penn Bank brand President Work For in the country, (2017) (2021) (2009) best in PA by American Banker MPB Financial (2020) Announced acquisition of Services Announced First Priority Financial formed acquisition of Corp. (“FPB”), adding Expansion of (2020) Phoenix Bancorp, $610M of assets mortgage banking adding $141M of (2018) operation $3.4 assets (2019) $3.0 (2014) $2.2 $2.1 $1.2 $1.0 $0.9 $0.8 $0.7 $0.7 $0.7 $0.6 $0.6 2009 2010 2011 2012 2013 2014 2015 2016 2017 2018 2019 2020 2021Q1 Total Assets ($B) Source: S&P Global Market Intelligence, Company Documents 11Compelling History of Organic and M&A based Growth • Infrastructure investments from 2009 – 2014 paved the way for a successful run of organic and acquired growth • Three successful bank acquisitions from 2015 to 2018 added over $1 billion in assets while diversifying and expanding our markets of operation • New initiatives launched in 2019 and 2020 to help drive fee income businesses, including a notable expansion of the mortgage banking operation and wealth management and insurance businesses Track Record of Successful Growth Announced the rebranding Announced closure of three Announced acquisition of The of branches and offices in Rory Ritrievi joins MPB as full service branches Scottdale Bank & Trust (“SB&T”) the FPB Division to the Mid Chief Executive Officer and Named 20th Best Bank To Company, adding $262M of assets Penn Bank brand President Work For in the country, (2017) (2021) (2009) best in PA by American Banker MPB Financial (2020) Announced acquisition of Services Announced First Priority Financial formed acquisition of Corp. (“FPB”), adding Expansion of (2020) Phoenix Bancorp, $610M of assets mortgage banking adding $141M of (2018) operation $3.4 assets (2019) $3.0 (2014) $2.2 $2.1 $1.2 $1.0 $0.9 $0.8 $0.7 $0.7 $0.7 $0.6 $0.6 2009 2010 2011 2012 2013 2014 2015 2016 2017 2018 2019 2020 2021Q1 Total Assets ($B) Source: S&P Global Market Intelligence, Company Documents 11

Demonstrated Ability to Drive Balance Sheet Growth 1 Total Assets ($M) Gross Loans ($M) $3,382 $2,999 $2,646 $2,384 $2,231 $2,078 $1,763 $1,624 $1,170 $1,033 $910 $814 2016 2017 2018 2019 2020 1Q21 2016 2017 2018 2019 2020 1Q21 2 Total Deposits ($M) Core Loans ($M) $1,805 $1,719 $2,667 $2,475 $1,348 $1,912 $1,726 $1,043 $856 $743 $1,024 $935 2016 2017 2018 2019 2020 1Q21 2016 2017 2018 2019 2020 1Q21 (1) Excludes Loans Held for Sale (2) Represents organic loan growth (total loans (excluding HFS and PPP loans) net of acquired loans) 12 Source: S&P Global Market Intelligence, Company DocumentsDemonstrated Ability to Drive Balance Sheet Growth 1 Total Assets ($M) Gross Loans ($M) $3,382 $2,999 $2,646 $2,384 $2,231 $2,078 $1,763 $1,624 $1,170 $1,033 $910 $814 2016 2017 2018 2019 2020 1Q21 2016 2017 2018 2019 2020 1Q21 2 Total Deposits ($M) Core Loans ($M) $1,805 $1,719 $2,667 $2,475 $1,348 $1,912 $1,726 $1,043 $856 $743 $1,024 $935 2016 2017 2018 2019 2020 1Q21 2016 2017 2018 2019 2020 1Q21 (1) Excludes Loans Held for Sale (2) Represents organic loan growth (total loans (excluding HFS and PPP loans) net of acquired loans) 12 Source: S&P Global Market Intelligence, Company Documents

Markets of Operation: Low cost, Stable deposits and Higher Growth Lending Opportunities Capital Southeast, PA Western, PA % of Franchise 66% 24% 10% % Proj. Population Change 1.3% 0.5% (2.0%) (’21 – ’26) Median HH Income $62,744 $89,160 $61,189 % Proj. HH Income Change 9.5% 9.4% 7.9% (’21 – ’26) ü Stable, consistent growth with minimal economic peaks and ü Affluent area with a diversity valleys of growing businesses ü Region supported by government enterprises andü Highest household income ü Mature market providing small and mid-sized levels in PA Market Characteristics “sticky” low cost deposits businesses ü Market expected to drive loan, ü Leading employers include deposit and wealth Commonwealth of PA, The management growth Hershey Company, Highmark, Blue Shield, Tyco Electronics Note: Western region defined as Fayette and Westmoreland counties; Capital region defined as Cumberland, Dauphin, Luzerne, Northumberland and Schuylkill counties; Southeast region defined as Berks, Bucks, Chester, Lancaster and Montgomery counties. All 13 region metrics based on population weighted average Source: S&P Global Market IntelligenceMarkets of Operation: Low cost, Stable deposits and Higher Growth Lending Opportunities Capital Southeast, PA Western, PA % of Franchise 66% 24% 10% % Proj. Population Change 1.3% 0.5% (2.0%) (’21 – ’26) Median HH Income $62,744 $89,160 $61,189 % Proj. HH Income Change 9.5% 9.4% 7.9% (’21 – ’26) ü Stable, consistent growth with minimal economic peaks and ü Affluent area with a diversity valleys of growing businesses ü Region supported by government enterprises andü Highest household income ü Mature market providing small and mid-sized levels in PA Market Characteristics “sticky” low cost deposits businesses ü Market expected to drive loan, ü Leading employers include deposit and wealth Commonwealth of PA, The management growth Hershey Company, Highmark, Blue Shield, Tyco Electronics Note: Western region defined as Fayette and Westmoreland counties; Capital region defined as Cumberland, Dauphin, Luzerne, Northumberland and Schuylkill counties; Southeast region defined as Berks, Bucks, Chester, Lancaster and Montgomery counties. All 13 region metrics based on population weighted average Source: S&P Global Market Intelligence

Markets of Operation: Low cost, Stable deposits and Higher Growth Lending Opportunities Significant Player in the Harrisburg Market Rapid Growth in Attractive Southeastern PA Markets Harrisburg Metropolitan Statistical Area (MSA) Year-over-Year Deposit Growth Deposit Market Share Berks County Chester County 2020 2019 YoY 2020 No. of Deposits Deposits Growth 66% MPB Growth: MPB Growth: Rank Company Name Branches ($M) ($M) (%) 18% 2x Market 4x Market 1 PNC Financial Services Group 10 $4,413 $5,148 (14%) 9% 2 M&T Bank Corp. 22 2,174 1,583 37% 15% 3 F.N.B. Corp. 12 1,728 1,455 19% MPB Overall Market MPB Overall Market 4 Wells Fargo & Co. 8 1,430 974 47% Bucks County 5 Mid Penn Bancorp Inc. 14 1,231 942 31% 74% 6 Fulton Financial Corp. 9 1,067 843 27% MPB Growth: 4x Market 7 Orrstown Financial Services 8 1,039 991 5% 19% 8 Citizens Financial Group Inc. 8 877 653 34% 9 Centric Financial Corp. 4 762 594 28% MPB Overall Market 10 Truist Financial Corp. 11 598 507 18% Median Household Income ($000) Total for Harrisburg MSA 17,950 15,923 13% $106 $95 $69 $68 $66 #1 Ranked Community Bank with Less Than $10 billion in Assets in Harrisburg by Market Share Berks, PA Chester, PA Bucks, PA Pennsylvania U.S. Overall Note: FDIC deposit data as of June 30, 2020 Source: S&P Global Market Intelligence, FDIC 14Markets of Operation: Low cost, Stable deposits and Higher Growth Lending Opportunities Significant Player in the Harrisburg Market Rapid Growth in Attractive Southeastern PA Markets Harrisburg Metropolitan Statistical Area (MSA) Year-over-Year Deposit Growth Deposit Market Share Berks County Chester County 2020 2019 YoY 2020 No. of Deposits Deposits Growth 66% MPB Growth: MPB Growth: Rank Company Name Branches ($M) ($M) (%) 18% 2x Market 4x Market 1 PNC Financial Services Group 10 $4,413 $5,148 (14%) 9% 2 M&T Bank Corp. 22 2,174 1,583 37% 15% 3 F.N.B. Corp. 12 1,728 1,455 19% MPB Overall Market MPB Overall Market 4 Wells Fargo & Co. 8 1,430 974 47% Bucks County 5 Mid Penn Bancorp Inc. 14 1,231 942 31% 74% 6 Fulton Financial Corp. 9 1,067 843 27% MPB Growth: 4x Market 7 Orrstown Financial Services 8 1,039 991 5% 19% 8 Citizens Financial Group Inc. 8 877 653 34% 9 Centric Financial Corp. 4 762 594 28% MPB Overall Market 10 Truist Financial Corp. 11 598 507 18% Median Household Income ($000) Total for Harrisburg MSA 17,950 15,923 13% $106 $95 $69 $68 $66 #1 Ranked Community Bank with Less Than $10 billion in Assets in Harrisburg by Market Share Berks, PA Chester, PA Bucks, PA Pennsylvania U.S. Overall Note: FDIC deposit data as of June 30, 2020 Source: S&P Global Market Intelligence, FDIC 14

Proven Ability to Acquire and Successfully Integrate Franchises Transaction History Deal Value Target Total Assets Purchase Price / TBV MPB Issue Price / TBV Announcement Date ($M) ($M) (%) (%) Target Company 1/16/2018 $90.7 $612 1 .9x 2 .2x 3/29/2017 59.1 263 1 .3x 1 .7x 8/27/2014 14.5 141 1 .1x 1 .1x Total --- $164.4 $1,016.4 --- --- MPB Legacy First Priority Growth market expansion Scottdale B&T Miners High quality core deposit funding Source: S&P Global Market Intelligence, Company Documents 15Proven Ability to Acquire and Successfully Integrate Franchises Transaction History Deal Value Target Total Assets Purchase Price / TBV MPB Issue Price / TBV Announcement Date ($M) ($M) (%) (%) Target Company 1/16/2018 $90.7 $612 1 .9x 2 .2x 3/29/2017 59.1 263 1 .3x 1 .7x 8/27/2014 14.5 141 1 .1x 1 .1x Total --- $164.4 $1,016.4 --- --- MPB Legacy First Priority Growth market expansion Scottdale B&T Miners High quality core deposit funding Source: S&P Global Market Intelligence, Company Documents 15

Strategic Initiatives to Drive Profitability and Shareholder Returns Leveraging the Mortgage Banking Platform Average Branch Size Mortgage Division Benefited from Rate Environment and Our Ability MPB has Significant Opportunity to Create Additional Efficiencies to Monetize Customer Relationships Through Additional Branch Consolidation Mortgage Loans Mortgage Banking Gain on Sale Margin Originated for Sale ($M) Revenues ($M) $114 $356 2.7% $103 $10 $163 2.3% $4 $65 2019 2020 2019 2020 2019 2020 Wealth & Fiduciary Wealth & Insurance Income Build Out MPB Harrisburg Philly MSA $ in millionsü 2020 was a record year for (Ex. Top 5) bank level fiduciary and wealth revenues $1.7 $1.4 ü Talent continuing to be $1.2 added After Closing Three Branches in 2020, MPB $0.8 ü Significant momentum Average Branch Size Signals Opportunity for leveraging new customers $0.5 participating in PPP Additional Consolidation ü Business expected to benefit from economies of scale 2016 2017 2018 2019 2020 Note: FDIC deposit data as of June 30, 2020 Source: S&P Global Market Intelligence, Company Documents 16Strategic Initiatives to Drive Profitability and Shareholder Returns Leveraging the Mortgage Banking Platform Average Branch Size Mortgage Division Benefited from Rate Environment and Our Ability MPB has Significant Opportunity to Create Additional Efficiencies to Monetize Customer Relationships Through Additional Branch Consolidation Mortgage Loans Mortgage Banking Gain on Sale Margin Originated for Sale ($M) Revenues ($M) $114 $356 2.7% $103 $10 $163 2.3% $4 $65 2019 2020 2019 2020 2019 2020 Wealth & Fiduciary Wealth & Insurance Income Build Out MPB Harrisburg Philly MSA $ in millionsü 2020 was a record year for (Ex. Top 5) bank level fiduciary and wealth revenues $1.7 $1.4 ü Talent continuing to be $1.2 added After Closing Three Branches in 2020, MPB $0.8 ü Significant momentum Average Branch Size Signals Opportunity for leveraging new customers $0.5 participating in PPP Additional Consolidation ü Business expected to benefit from economies of scale 2016 2017 2018 2019 2020 Note: FDIC deposit data as of June 30, 2020 Source: S&P Global Market Intelligence, Company Documents 16

Outperforming Peers as Asset Quality Continues to Improve Key Highlights NCOs / Avg. Loans • Asset quality has been historically strong MPB PA Banks $1B-$5B Assets • MPB recorded a $4.2 million provision for loan losses in 2020 0.12% despite limited charge-offs of $333 thousand 0.10% 0.09% 0.11% 0.06% • 1Q21 charge-offs ($791 thousand) associated with the 0.04% workout of two larger NPLs (one of which was sold) 0.03% • Non-performing assets to total assets ratio was 0.20% as of 0.02% 0.01% March 31, 2021 (0.01%) (0.02%) • Loan modifications have declined to 0.2% of gross loans as of 1 March 31, 2021 2016 2017 2018 2019 2020 1Q21 NPAs / Assets Reserves / NPLs MPB PA Banks $1B-$5B Assets MPB PA Banks $1B-$5B Assets 1.01% 204.00% 0.97% 0.90% 0.64% 129.77% 0.59% 113.28% 111.28% 111.75% 0.77% 99.02% 0.56% 0.59% 0.54% 0.52% 99.24% 86.28% 79.55% 74.53% 68.41% 0.20% 2016 2017 2018 2019 2020 1Q21 2016 2017 2018 2019 2020 1Q21 (1) See Appendix (Page 31) for additional information on historical COVID-19 related loan modifications and deferrals Note: PA Banks $1-$5B Assets peer group includes CCNE, PFIS, ORRF, ACNB, CZNC, CVLY, CZFS, ESSA, NWFL, PWOD, MRBK, FDBC, SOME, FRAF, 17 FNCB, ENBP, EMYB, QNBC, CBFV, RIVE, ASRV, FSMK, MLVF, PBIP, FKYS, FBIP, CFCX, KISB and EMCF Source: S&P Global Market Intelligence, Company DocumentsOutperforming Peers as Asset Quality Continues to Improve Key Highlights NCOs / Avg. Loans • Asset quality has been historically strong MPB PA Banks $1B-$5B Assets • MPB recorded a $4.2 million provision for loan losses in 2020 0.12% despite limited charge-offs of $333 thousand 0.10% 0.09% 0.11% 0.06% • 1Q21 charge-offs ($791 thousand) associated with the 0.04% workout of two larger NPLs (one of which was sold) 0.03% • Non-performing assets to total assets ratio was 0.20% as of 0.02% 0.01% March 31, 2021 (0.01%) (0.02%) • Loan modifications have declined to 0.2% of gross loans as of 1 March 31, 2021 2016 2017 2018 2019 2020 1Q21 NPAs / Assets Reserves / NPLs MPB PA Banks $1B-$5B Assets MPB PA Banks $1B-$5B Assets 1.01% 204.00% 0.97% 0.90% 0.64% 129.77% 0.59% 113.28% 111.28% 111.75% 0.77% 99.02% 0.56% 0.59% 0.54% 0.52% 99.24% 86.28% 79.55% 74.53% 68.41% 0.20% 2016 2017 2018 2019 2020 1Q21 2016 2017 2018 2019 2020 1Q21 (1) See Appendix (Page 31) for additional information on historical COVID-19 related loan modifications and deferrals Note: PA Banks $1-$5B Assets peer group includes CCNE, PFIS, ORRF, ACNB, CZNC, CVLY, CZFS, ESSA, NWFL, PWOD, MRBK, FDBC, SOME, FRAF, 17 FNCB, ENBP, EMYB, QNBC, CBFV, RIVE, ASRV, FSMK, MLVF, PBIP, FKYS, FBIP, CFCX, KISB and EMCF Source: S&P Global Market Intelligence, Company Documents
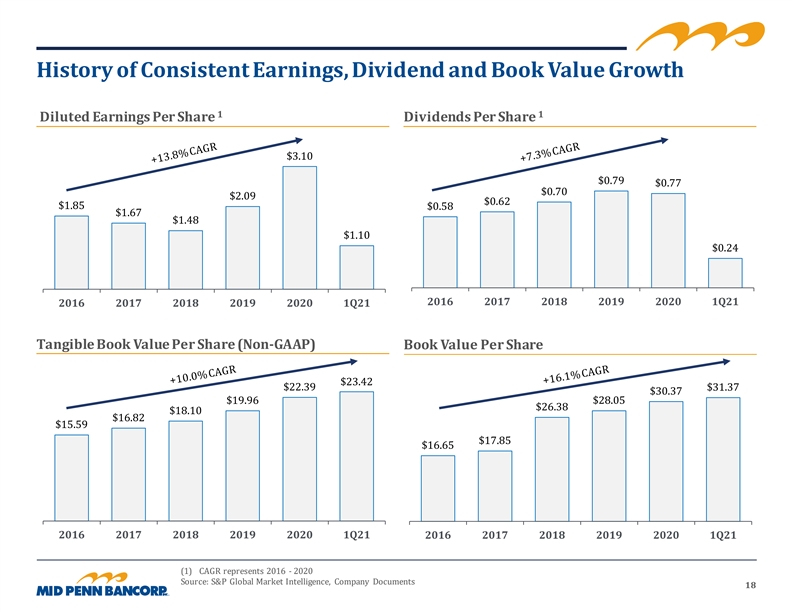
History of Consistent Earnings, Dividend and Book Value Growth 1 1 Diluted Earnings Per Share Dividends Per Share $3.10 $0.79 $0.77 $0.70 $2.09 $0.62 $1.85 $0.58 $1.67 $1.48 $1.10 $0.24 2016 2017 2018 2019 2020 1Q21 2016 2017 2018 2019 2020 1Q21 Tangible Book Value Per Share (Non-GAAP) Book Value Per Share $23.42 $22.39 $31.37 $30.37 $19.96 $28.05 $26.38 $18.10 $16.82 $15.59 $17.85 $16.65 2016 2017 2018 2019 2020 1Q21 2016 2017 2018 2019 2020 1Q21 (1) CAGR represents 2016 - 2020 Source: S&P Global Market Intelligence, Company Documents 18History of Consistent Earnings, Dividend and Book Value Growth 1 1 Diluted Earnings Per Share Dividends Per Share $3.10 $0.79 $0.77 $0.70 $2.09 $0.62 $1.85 $0.58 $1.67 $1.48 $1.10 $0.24 2016 2017 2018 2019 2020 1Q21 2016 2017 2018 2019 2020 1Q21 Tangible Book Value Per Share (Non-GAAP) Book Value Per Share $23.42 $22.39 $31.37 $30.37 $19.96 $28.05 $26.38 $18.10 $16.82 $15.59 $17.85 $16.65 2016 2017 2018 2019 2020 1Q21 2016 2017 2018 2019 2020 1Q21 (1) CAGR represents 2016 - 2020 Source: S&P Global Market Intelligence, Company Documents 18

Long History of Enhancing Shareholder Value Franchise Growth With Superior Resulting in Superior & Expansion Top-Line Growth Value Creation Compound Tangible Book Value per Share Revenue per Common Share Total Asset Growth + Dividends (Non-GAAP) MPB National Peers MPB National Peers MPB National Peers 90% 83% 400% 180% 370% 158% 80% 160% 350% 70% 140% 300% 127% 60% 120% 250% 50% 100% 200% 40% 32% 80% 141% 30% 150% 60% 20% 100% 40% 10% 50% 20% 0% 0% 0% (10%) Total Assets CAGR Revenue per Shar e CAGR Compound TBV + Dividends CAGR MPB National Peers MPB National Peers MPB National Peers 1 Year 34.4% 17.9% 1 Year 30.8% 10.2% 1 Year 13.4% 10.2% 5 Years 26.3% 11.9% 5 Years 6.6% 6.2% 5 Years 9.9% 9.5% 10 Years 16.7% 9.2% 10 Years 6.3% 2.8% 10 Years 10.0% 8.5% Note: National Peers include 161 nationwide banks with between $1-5B of Total Assets as of December 31, 2020 Source: S&P Global Market Intelligence 19Long History of Enhancing Shareholder Value Franchise Growth With Superior Resulting in Superior & Expansion Top-Line Growth Value Creation Compound Tangible Book Value per Share Revenue per Common Share Total Asset Growth + Dividends (Non-GAAP) MPB National Peers MPB National Peers MPB National Peers 90% 83% 400% 180% 370% 158% 80% 160% 350% 70% 140% 300% 127% 60% 120% 250% 50% 100% 200% 40% 32% 80% 141% 30% 150% 60% 20% 100% 40% 10% 50% 20% 0% 0% 0% (10%) Total Assets CAGR Revenue per Shar e CAGR Compound TBV + Dividends CAGR MPB National Peers MPB National Peers MPB National Peers 1 Year 34.4% 17.9% 1 Year 30.8% 10.2% 1 Year 13.4% 10.2% 5 Years 26.3% 11.9% 5 Years 6.6% 6.2% 5 Years 9.9% 9.5% 10 Years 16.7% 9.2% 10 Years 6.3% 2.8% 10 Years 10.0% 8.5% Note: National Peers include 161 nationwide banks with between $1-5B of Total Assets as of December 31, 2020 Source: S&P Global Market Intelligence 19

Strategic Initiatives Going Forward Core Loan Production • Generate low double digit annual loan growth • Continue to convert new “PPP” customers into commercial relationships • Attract and retain high quality commercial lenders Southeast PA Market Development • Leverage position and brand to meaningfully increase loan growth • Gain deposit market share (growth has been at least 2x greater than market since 2019) • Seize new business opportunities resulting from continued M&A dislocation Fee Income Expansion • Generate 20-25% of revenues from fee income sources (intermediate goal) • Build upon success of mortgage operations to drive additional originations and revenue • Continue development of wealth management and insurance businesses Opportunistic M&A • Continuously evaluating opportunities to engage in strategic combinations and acquisitions of bank and nonbank businesses • Prepared to acquire businesses that further our strategic goals of increasing and diversifying revenue streams and enhancing shareholder value Expense Rationalization • Continue to evaluate branch network for opportunities to increases efficiencies • Maintain a 60-65% efficiency ratio Note: FDIC deposit data as of June 30, 2020 Source: S&P Global Market Intelligence, Company Documents 20Strategic Initiatives Going Forward Core Loan Production • Generate low double digit annual loan growth • Continue to convert new “PPP” customers into commercial relationships • Attract and retain high quality commercial lenders Southeast PA Market Development • Leverage position and brand to meaningfully increase loan growth • Gain deposit market share (growth has been at least 2x greater than market since 2019) • Seize new business opportunities resulting from continued M&A dislocation Fee Income Expansion • Generate 20-25% of revenues from fee income sources (intermediate goal) • Build upon success of mortgage operations to drive additional originations and revenue • Continue development of wealth management and insurance businesses Opportunistic M&A • Continuously evaluating opportunities to engage in strategic combinations and acquisitions of bank and nonbank businesses • Prepared to acquire businesses that further our strategic goals of increasing and diversifying revenue streams and enhancing shareholder value Expense Rationalization • Continue to evaluate branch network for opportunities to increases efficiencies • Maintain a 60-65% efficiency ratio Note: FDIC deposit data as of June 30, 2020 Source: S&P Global Market Intelligence, Company Documents 20

Financial Overview 21Financial Overview 21

Accelerated Historical Profitability 1 1 Return on Average Assets Return on Average Equity MBP PA Banks $1B-$5B Assets MBP PA Banks $1B-$5B Assets 14.58% 1.19% 1.01% 0.95% 0.94% 10.71% 10.76% 10.54% 9.98% 9.48% 0.83% 0.69% 0.87% 0.82% 9.14% 0.78% 8.37% 7.67% 0.64% 0.63% 7.11% 5.98% 2016 2017 2018 2019 2020 1Q21 2016 2017 2018 2019 2020 1Q21 Net Interest Margin Efficiency Ratio MBP PA Banks $1B-$5B Assets MBP PA Banks $1B-$5B Assets 3.82% 3.68% 3.67% 71.55% 3.57% 3.48% 69.26% 3.46% 68.93% 68.15% 64.66% 3.52% 3.47% 3.47% 3.43% 67.18% 3.25% 64.97% 64.70% 64.18% 64.09% 58.45% 2016 2017 2018 2019 2020 1Q21 2016 2017 2018 2019 2020 1Q21 (1) 1Q21 represents annualized financial metrics Note: PA Banks $1-$5B Assets peer group includes CCNE, PFIS, ORRF, ACNB, CZNC, CVLY, CZFS, ESSA, NWFL, PWOD, MRBK, FDBC, 22 SOME, FRAF, FNCB, ENBP, EMYB, QNBC, CBFV, RIVE, ASRV, FSMK, MLVF, PBIP, FKYS, FBIP, CFCX, KISB and EMCF Source: S&P Global Market Intelligence, Company DocumentsAccelerated Historical Profitability 1 1 Return on Average Assets Return on Average Equity MBP PA Banks $1B-$5B Assets MBP PA Banks $1B-$5B Assets 14.58% 1.19% 1.01% 0.95% 0.94% 10.71% 10.76% 10.54% 9.98% 9.48% 0.83% 0.69% 0.87% 0.82% 9.14% 0.78% 8.37% 7.67% 0.64% 0.63% 7.11% 5.98% 2016 2017 2018 2019 2020 1Q21 2016 2017 2018 2019 2020 1Q21 Net Interest Margin Efficiency Ratio MBP PA Banks $1B-$5B Assets MBP PA Banks $1B-$5B Assets 3.82% 3.68% 3.67% 71.55% 3.57% 3.48% 69.26% 3.46% 68.93% 68.15% 64.66% 3.52% 3.47% 3.47% 3.43% 67.18% 3.25% 64.97% 64.70% 64.18% 64.09% 58.45% 2016 2017 2018 2019 2020 1Q21 2016 2017 2018 2019 2020 1Q21 (1) 1Q21 represents annualized financial metrics Note: PA Banks $1-$5B Assets peer group includes CCNE, PFIS, ORRF, ACNB, CZNC, CVLY, CZFS, ESSA, NWFL, PWOD, MRBK, FDBC, 22 SOME, FRAF, FNCB, ENBP, EMYB, QNBC, CBFV, RIVE, ASRV, FSMK, MLVF, PBIP, FKYS, FBIP, CFCX, KISB and EMCF Source: S&P Global Market Intelligence, Company Documents
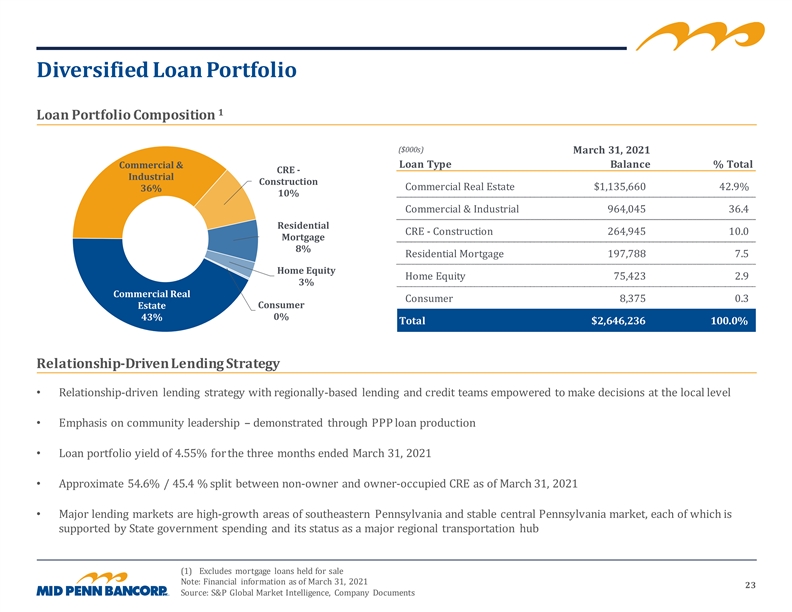
Diversified Loan Portfolio 1 Loan Portfolio Composition ($000s) March 31, 2021 Commercial & Loan Type Balance % Total CRE - Industrial Construction Commercial Real Estate $1,135,660 42.9% 36% 10% Commercial & Industrial 964,045 36.4 Residential CRE - Construction 264,945 10.0 Mortgage 8% Residential Mortgage 197,788 7.5 Home Equity Home Equity 75,423 2.9 3% Commercial Real Consumer 8,375 0.3 Consumer Estate 43% 0% Total $2,646,236 100.0% Relationship-Driven Lending Strategy • Relationship-driven lending strategy with regionally-based lending and credit teams empowered to make decisions at the local level • Emphasis on community leadership – demonstrated through PPP loan production • Loan portfolio yield of 4.55% for the three months ended March 31, 2021 • Approximate 54.6% / 45.4 % split between non-owner and owner-occupied CRE as of March 31, 2021 • Major lending markets are high-growth areas of southeastern Pennsylvania and stable central Pennsylvania market, each of which is supported by State government spending and its status as a major regional transportation hub (1) Excludes mortgage loans held for sale Note: Financial information as of March 31, 2021 23 Source: S&P Global Market Intelligence, Company DocumentsDiversified Loan Portfolio 1 Loan Portfolio Composition ($000s) March 31, 2021 Commercial & Loan Type Balance % Total CRE - Industrial Construction Commercial Real Estate $1,135,660 42.9% 36% 10% Commercial & Industrial 964,045 36.4 Residential CRE - Construction 264,945 10.0 Mortgage 8% Residential Mortgage 197,788 7.5 Home Equity Home Equity 75,423 2.9 3% Commercial Real Consumer 8,375 0.3 Consumer Estate 43% 0% Total $2,646,236 100.0% Relationship-Driven Lending Strategy • Relationship-driven lending strategy with regionally-based lending and credit teams empowered to make decisions at the local level • Emphasis on community leadership – demonstrated through PPP loan production • Loan portfolio yield of 4.55% for the three months ended March 31, 2021 • Approximate 54.6% / 45.4 % split between non-owner and owner-occupied CRE as of March 31, 2021 • Major lending markets are high-growth areas of southeastern Pennsylvania and stable central Pennsylvania market, each of which is supported by State government spending and its status as a major regional transportation hub (1) Excludes mortgage loans held for sale Note: Financial information as of March 31, 2021 23 Source: S&P Global Market Intelligence, Company Documents

PPP Program Results Significant PPP success • We originated over 6,900 PPP loans, totaling over $980 million • Our participation in the PPP program helped to protect over 80,000 jobs in the community • As of March 31, 2021, we had ~$590 million of PPP loans outstanding, net of deferred fees, or ~22% of total loans outstanding • The PPP loans have generated $36.8 million in loan processing fees • As of March 31, 2021, $18.2 million has been recognized, with another $18.6 million expected to be recognized in future quarters • Our PPP success has enabled us to efficiently generate new business and acquire new customers PPP Loans / Total Gross Loans Key Statistics as of March 31, 2021 PPP loans as a % of total gross loans as of 4Q20 PPP PPP Total ($M) Round 1 Round 2 PPP 16.1% MPB PPP / Gross PPP Loans (#) 4,104 2,816 6,920 Loans Over 2x Peers 7.2% PPP Loans ($) $630 $351 $980 PPP Fees $20.9 $15.9 $36.8 MPB National Peers Note: Financial information as of March 31, 2021 unless otherwise noted. National Peers include 161 nationwide banks with between $1-5B of Total Assets as of December 31, 2020 24 Source: S&P Global Market Intelligence, Company DocumentsPPP Program Results Significant PPP success • We originated over 6,900 PPP loans, totaling over $980 million • Our participation in the PPP program helped to protect over 80,000 jobs in the community • As of March 31, 2021, we had ~$590 million of PPP loans outstanding, net of deferred fees, or ~22% of total loans outstanding • The PPP loans have generated $36.8 million in loan processing fees • As of March 31, 2021, $18.2 million has been recognized, with another $18.6 million expected to be recognized in future quarters • Our PPP success has enabled us to efficiently generate new business and acquire new customers PPP Loans / Total Gross Loans Key Statistics as of March 31, 2021 PPP loans as a % of total gross loans as of 4Q20 PPP PPP Total ($M) Round 1 Round 2 PPP 16.1% MPB PPP / Gross PPP Loans (#) 4,104 2,816 6,920 Loans Over 2x Peers 7.2% PPP Loans ($) $630 $351 $980 PPP Fees $20.9 $15.9 $36.8 MPB National Peers Note: Financial information as of March 31, 2021 unless otherwise noted. National Peers include 161 nationwide banks with between $1-5B of Total Assets as of December 31, 2020 24 Source: S&P Global Market Intelligence, Company Documents

Core Deposit Franchise Stable & Growing Deposit Composition Interest-Bearing ($000s) March 31, 2021 Noninterest- Demand Bearing Deposit Type Balance % Total 23% Demand 25% Money Market $770,800 28.9% Noninterest-Bearing Demand 676,717 25.4 Retail Time Interest-Bearing Demand 601,220 22.5 13% Retail Time 350,292 13.1 Savings 201,225 7.5 Savings 8% Jumbo Time 66,573 2.5 Money Market Jumbo Time 29% Total $2,666,827 100.0% 2% Deposit Base Comprised of Low Cost, Core Deposits • Strong deposit base with sticky funding • 0.46% cost of deposits for the three months ended March 31, 2021 • ~25% of deposits are noninterest bearing; ~36% of deposits are MMDA and Savings Accounts • 99.2% total loan/deposit ratio • No brokered deposits Note: Jumbo time deposits comprised of time deposits greater than $250 thousand; financial information as of March 31, 2021 Source: S&P Global Market Intelligence, Company Documents 25Core Deposit Franchise Stable & Growing Deposit Composition Interest-Bearing ($000s) March 31, 2021 Noninterest- Demand Bearing Deposit Type Balance % Total 23% Demand 25% Money Market $770,800 28.9% Noninterest-Bearing Demand 676,717 25.4 Retail Time Interest-Bearing Demand 601,220 22.5 13% Retail Time 350,292 13.1 Savings 201,225 7.5 Savings 8% Jumbo Time 66,573 2.5 Money Market Jumbo Time 29% Total $2,666,827 100.0% 2% Deposit Base Comprised of Low Cost, Core Deposits • Strong deposit base with sticky funding • 0.46% cost of deposits for the three months ended March 31, 2021 • ~25% of deposits are noninterest bearing; ~36% of deposits are MMDA and Savings Accounts • 99.2% total loan/deposit ratio • No brokered deposits Note: Jumbo time deposits comprised of time deposits greater than $250 thousand; financial information as of March 31, 2021 Source: S&P Global Market Intelligence, Company Documents 25

Well Capitalized: Consolidated Consolidated Capital Overview Tier 1 Leverage Tier 1 RBC Total RBC 12.6% 12.5% 12.3% 11.9% 11.3% 11.0% 10.0% 9.8% 9.7% 9.6% 9.1% 8.5% 8.0% 7.8% 6.8% 6.8% 6.7% 6.5% 2016 2017 2018 2019 2020 1Q21 Both MPB and Mid Penn Bank have consistently maintained regulatory capital ratios significantly above the federal “well capitalized” regulatory standards Source: S&P Global Market Intelligence, Company Documents 26Well Capitalized: Consolidated Consolidated Capital Overview Tier 1 Leverage Tier 1 RBC Total RBC 12.6% 12.5% 12.3% 11.9% 11.3% 11.0% 10.0% 9.8% 9.7% 9.6% 9.1% 8.5% 8.0% 7.8% 6.8% 6.8% 6.7% 6.5% 2016 2017 2018 2019 2020 1Q21 Both MPB and Mid Penn Bank have consistently maintained regulatory capital ratios significantly above the federal “well capitalized” regulatory standards Source: S&P Global Market Intelligence, Company Documents 26

Appendix 27Appendix 27

Historical Balance Sheet ($000s) As of December 31, x March 31, Assets 2016 2017 2018 2019 2020 2021 Total Cash and Cash Equivalents $45,973 $23,514 $40,065 $139,030 $303,724 $427,371 Available for Sale Securities 133,625 93,465 111,923 37,009 5,748 3,250 Held to Maturity Securities - 101,356 168,370 136,477 128,292 130,560 Other Securities 2,443 4,890 7,138 5,409 545 508 Total Securities $136,068 $199,711 $287,431 $178,895 $134,585 $134,318 Loans Held for Sale 1,959 1,040 1,702 8,422 25,506 25,842 Gross Loans Held for Investment 813,924 910,404 1,624,067 1,762,756 2,384,041 2,646,236 Loan Loss Reserve 7,183 7,606 8,397 9,515 13,382 13,591 Total Net Loans $808,700 $903,838 $1,617,372 $1,761,663 $2,396,165 $2,658,487 Total Intangible Assets 4,457 4,352 70,061 68,598 67,200 66,919 Other Assets 37,401 38,939 63,052 82,989 97,274 94,943 Total Assets $1,032,599 $1,170,354 $2,077,981 $2,231,175 $2,998,948 $3,382,038 Liabilities Total Deposits $935,373 $1,023,568 $1,726,026 $1,912,394 $2,474,580 $2,666,827 Borrowings 13,581 46,963 91,124 45,447 211,932 382,783 Total Subordinated Debt 7,414 17,338 27,082 27,070 44,580 44,586 Total Other Liabilities 5,764 6,782 10,540 8,390 12,168 23,806 Total Liabilities $962,132 $1,094,651 $1,854,772 $1,993,301 $2,743,260 $3,118,002 Equity Total Shareholders' Equity $70,467 $75,703 $223,209 $237,874 $255,688 $264,036 Source: S&P Global Market Intelligence, Company Filings 28Historical Balance Sheet ($000s) As of December 31, x March 31, Assets 2016 2017 2018 2019 2020 2021 Total Cash and Cash Equivalents $45,973 $23,514 $40,065 $139,030 $303,724 $427,371 Available for Sale Securities 133,625 93,465 111,923 37,009 5,748 3,250 Held to Maturity Securities - 101,356 168,370 136,477 128,292 130,560 Other Securities 2,443 4,890 7,138 5,409 545 508 Total Securities $136,068 $199,711 $287,431 $178,895 $134,585 $134,318 Loans Held for Sale 1,959 1,040 1,702 8,422 25,506 25,842 Gross Loans Held for Investment 813,924 910,404 1,624,067 1,762,756 2,384,041 2,646,236 Loan Loss Reserve 7,183 7,606 8,397 9,515 13,382 13,591 Total Net Loans $808,700 $903,838 $1,617,372 $1,761,663 $2,396,165 $2,658,487 Total Intangible Assets 4,457 4,352 70,061 68,598 67,200 66,919 Other Assets 37,401 38,939 63,052 82,989 97,274 94,943 Total Assets $1,032,599 $1,170,354 $2,077,981 $2,231,175 $2,998,948 $3,382,038 Liabilities Total Deposits $935,373 $1,023,568 $1,726,026 $1,912,394 $2,474,580 $2,666,827 Borrowings 13,581 46,963 91,124 45,447 211,932 382,783 Total Subordinated Debt 7,414 17,338 27,082 27,070 44,580 44,586 Total Other Liabilities 5,764 6,782 10,540 8,390 12,168 23,806 Total Liabilities $962,132 $1,094,651 $1,854,772 $1,993,301 $2,743,260 $3,118,002 Equity Total Shareholders' Equity $70,467 $75,703 $223,209 $237,874 $255,688 $264,036 Source: S&P Global Market Intelligence, Company Filings 28

Historical Income Statement ($000s) As of or for the year ended December 31, x March 31, 1 2016 2017 2018 2019 2020 2021 Interest Income $40,212 $43,892 $68,654 $95,312 $107,935 $29,168 Interest Expense 5,367 6,304 12,720 25,164 19,727 3,843 Net Interest Income $34,845 $37,588 $55,934 $70,148 $88,208 $25,325 Provision for Loan Losses 1,870 325 500 1,390 4,200 1,000 Total Noninterest Income 5,924 5,707 7,462 12,621 17,908 4,712 Total Noninterest Expense 28,818 31,381 50,171 59,953 70,577 17,558 Net Income before Income Taxes $10,081 $11,589 $12,725 $21,426 $31,339 $11,479 Income Taxes 2,277 4,500 2,129 3,725 5,130 2,167 Net Income $7,804 $7,089 $10,596 $17,701 $26,209 $9,312 Performance Analysis Return on Average Assets 0.78% 0.64% 0.63% 0.82% 0.95% 1.19% Return on Average Equity 10.71% 9.48% 5.98% 7.67% 10.76% 14.58% Net Interest Margin 3.82% 3.68% 3.67% 3.57% 3.48% 3.46% Noninterest Income / Average Assets 0.48% 0.51% 0.40% 0.49% 0.63% 0.59% Efficiency Ratio 68.15% 68.93% 69.26% 71.55% 64.66% 58.45% (1) As of or for the three months ended March 31, 2021 Note: Performance Analysis as of March 31, 2021 represents annualized metrics where applicable 29 Source: S&P Global Market Intelligence, Company FilingsHistorical Income Statement ($000s) As of or for the year ended December 31, x March 31, 1 2016 2017 2018 2019 2020 2021 Interest Income $40,212 $43,892 $68,654 $95,312 $107,935 $29,168 Interest Expense 5,367 6,304 12,720 25,164 19,727 3,843 Net Interest Income $34,845 $37,588 $55,934 $70,148 $88,208 $25,325 Provision for Loan Losses 1,870 325 500 1,390 4,200 1,000 Total Noninterest Income 5,924 5,707 7,462 12,621 17,908 4,712 Total Noninterest Expense 28,818 31,381 50,171 59,953 70,577 17,558 Net Income before Income Taxes $10,081 $11,589 $12,725 $21,426 $31,339 $11,479 Income Taxes 2,277 4,500 2,129 3,725 5,130 2,167 Net Income $7,804 $7,089 $10,596 $17,701 $26,209 $9,312 Performance Analysis Return on Average Assets 0.78% 0.64% 0.63% 0.82% 0.95% 1.19% Return on Average Equity 10.71% 9.48% 5.98% 7.67% 10.76% 14.58% Net Interest Margin 3.82% 3.68% 3.67% 3.57% 3.48% 3.46% Noninterest Income / Average Assets 0.48% 0.51% 0.40% 0.49% 0.63% 0.59% Efficiency Ratio 68.15% 68.93% 69.26% 71.55% 64.66% 58.45% (1) As of or for the three months ended March 31, 2021 Note: Performance Analysis as of March 31, 2021 represents annualized metrics where applicable 29 Source: S&P Global Market Intelligence, Company Filings

Non-GAAP Reconciliation ($000s) As of December 31, x As of March 31, 2016 2017 2018 2019 2020 2021 Total Common Equity $70,467 $75,703 $223,209 $237,874 $255,688 $264,036 Goodwill 3,918 3,918 62,840 62,840 62,840 62,840 Other Intangibles 539 434 7,221 5,758 4,360 4,079 Less: Total Intangible Assets 70,061 68,598 67,200 66,919 4,457 4,352 Tangible Common Equity $66,010 $71,351 $153,148 $169,276 $188,488 $197,117 Total Assets $1,032,599 $1,170,354 $2,077,981 $2,231,175 $2,998,948 $3,382,038 Goodwill 3,918 3,918 62,840 62,840 62,840 62,840 Other Intangibles 539 434 7,221 5,758 4,360 4,079 Less: Total Intangible Assets 70,061 68,598 67,200 66,919 4,457 4,352 Tangible Assets $1,028,142 $1,166,002 $2,007,920 $2,162,577 $2,931,748 $3,315,119 Tangible Common Equity / Tangible Assets 6.42% 6.12% 7.63% 7.83% 6.43% 5.95% Tangible Book Value Per Share $15.59 $16.82 $18.10 $19.96 $22.39 $23.42 Source: S&P Global Market Intelligence, Company Filings 30Non-GAAP Reconciliation ($000s) As of December 31, x As of March 31, 2016 2017 2018 2019 2020 2021 Total Common Equity $70,467 $75,703 $223,209 $237,874 $255,688 $264,036 Goodwill 3,918 3,918 62,840 62,840 62,840 62,840 Other Intangibles 539 434 7,221 5,758 4,360 4,079 Less: Total Intangible Assets 70,061 68,598 67,200 66,919 4,457 4,352 Tangible Common Equity $66,010 $71,351 $153,148 $169,276 $188,488 $197,117 Total Assets $1,032,599 $1,170,354 $2,077,981 $2,231,175 $2,998,948 $3,382,038 Goodwill 3,918 3,918 62,840 62,840 62,840 62,840 Other Intangibles 539 434 7,221 5,758 4,360 4,079 Less: Total Intangible Assets 70,061 68,598 67,200 66,919 4,457 4,352 Tangible Assets $1,028,142 $1,166,002 $2,007,920 $2,162,577 $2,931,748 $3,315,119 Tangible Common Equity / Tangible Assets 6.42% 6.12% 7.63% 7.83% 6.43% 5.95% Tangible Book Value Per Share $15.59 $16.82 $18.10 $19.96 $22.39 $23.42 Source: S&P Global Market Intelligence, Company Filings 30

COVID-19 Related Loan Deferrals and Improvement 1 Loan Deferrals (#) 1,019 921 102 12 7 April 24, June 30, Sept. 30, Dec. 31, March 31, 2020 2020 2020 2020 2021 1 1 Loan Deferrals ($M) Loan Deferrals / Gross Loans 22.8% $444.9 $409.7 18.2% $32.9 1.3% $11.7 0.5% $5.1 0.2% April 24, June 30, Sept. 30, Dec. 31, March 31, April 24, June 30, Sept. 30, Dec. 31, March 31, 2020 2020 2020 2020 2021 2020 2020 2020 2020 2021 (1) April 24, 2020 data reported on Mid Penn's Q1 2020 Earnings Release filed with the SEC on April 27, 2020 Source: S&P Global Market Intelligence, Company Documents 31COVID-19 Related Loan Deferrals and Improvement 1 Loan Deferrals (#) 1,019 921 102 12 7 April 24, June 30, Sept. 30, Dec. 31, March 31, 2020 2020 2020 2020 2021 1 1 Loan Deferrals ($M) Loan Deferrals / Gross Loans 22.8% $444.9 $409.7 18.2% $32.9 1.3% $11.7 0.5% $5.1 0.2% April 24, June 30, Sept. 30, Dec. 31, March 31, April 24, June 30, Sept. 30, Dec. 31, March 31, 2020 2020 2020 2020 2021 2020 2020 2020 2020 2021 (1) April 24, 2020 data reported on Mid Penn's Q1 2020 Earnings Release filed with the SEC on April 27, 2020 Source: S&P Global Market Intelligence, Company Documents 31

Conservatively Managed Securities Portfolio Securities Portfolio Breakdown (As of March 31, 2021) Portfolio Characteristics (As of March 31, 2021) • At March 31, 2021, securities portfolio totaled $134.3 million: U.S. Government Bonds (Incl. • $3.2 million, or 2.4% available-for-sale Treasury) Mortgage-Backed 13% Securities 23% • $131.1 million, or 97.6% held-to-maturity Corporate Debt • Of the total book, $65.3 million (or ~49%) are municipal bonds 11% Collateralized • The portfolio yielded 2.24% as of the three months ended Mortgage March 31, 2021 Obligation 3% Other Municipal Bonds • Average rating on municipal bonds of A; average rating on 1% 49% corporate debt of BBB+ • The portfolio has a modified duration of 3.7 years as of March 31, 2021 Total Investment Portfolio: $134.3 Million 4.0% of assets Note: Financial information as of March 31, 2021 Source: S&P Global Market Intelligence, Company Documents 32Conservatively Managed Securities Portfolio Securities Portfolio Breakdown (As of March 31, 2021) Portfolio Characteristics (As of March 31, 2021) • At March 31, 2021, securities portfolio totaled $134.3 million: U.S. Government Bonds (Incl. • $3.2 million, or 2.4% available-for-sale Treasury) Mortgage-Backed 13% Securities 23% • $131.1 million, or 97.6% held-to-maturity Corporate Debt • Of the total book, $65.3 million (or ~49%) are municipal bonds 11% Collateralized • The portfolio yielded 2.24% as of the three months ended Mortgage March 31, 2021 Obligation 3% Other Municipal Bonds • Average rating on municipal bonds of A; average rating on 1% 49% corporate debt of BBB+ • The portfolio has a modified duration of 3.7 years as of March 31, 2021 Total Investment Portfolio: $134.3 Million 4.0% of assets Note: Financial information as of March 31, 2021 Source: S&P Global Market Intelligence, Company Documents 32