Attached files
Table of Contents
UNITED STATES
SECURITIES AND EXCHANGE COMMISSION
WASHINGTON, DC 20549
FORM 10-K
(Mark One)
| x | ANNUAL REPORT PURSUANT TO SECTION 13 OR 15(d) OF THE SECURITIES EXCHANGE ACT OF 1934 |
For the fiscal year ended December 31, 2009
OR
| ¨ | TRANSITION REPORT PURSUANT TO SECTION 13 OR 15(d) OF THE SECURITIES EXCHANGE ACT OF 1934 |
For the transition period from to
Commission file number 1-13677
MID PENN BANCORP, INC.
(Exact Name of Registrant as Specified in its Charter)
| Pennsylvania | 25-1666413 | |
| (State or Other Jurisdiction of Incorporation or Organization) |
(I.R.S. Employer Identification Number) |
| 349 Union Street Millersburg, Pennsylvania |
17061 | |
| (Address of Principal Executive Offices) | (Zip Code) |
Registrant’s telephone number, including area code 717.692.2133
Securities registered pursuant to Section 12(b) of the Act:
| Title of Each Class |
Name of Each Exchange on Which Registered | |
| Common Stock, $1.00 | The NASDAQ Stock Market, Inc. |
Securities registered pursuant to Section 12(g) of the Act: None.
Indicate by check mark if the registrant is a well-known seasoned issuer, as defined in Rule 405 of the Securities Act. Yes ¨ No x
Indicate by check mark if the registrant is not required to file reports pursuant to Section 13 or Section 15(d) of the Act. Yes ¨ No x
Indicate by check mark whether the registrant: (1) has filed all reports required to be filed by Section 13 or 15(d) of the Securities Exchange Act of 1934 during the preceding 12 months (or for such shorter period that the registrant was required to file such reports), and (2) has been subject to such filing requirements for the past 90 days. Yes x No ¨
Indicate by check mark if disclosure of delinquent filers pursuant to Item 405 of Regulation S-K is not contained herein, and will not be contained, to the best of registrant’s knowledge, in definitive proxy or information statements incorporated by reference in Part III of this Form 10-K or any amendment to this Form 10-K. x
Indicate by check mark whether the registrant has submitted electronically and posted on its corporate Web site, if any, every Interactive Data File required to be submitted and posted pursuant to Rule 405 of Regulation S-T (§232.405 of this chapter) during the preceding 12 months (or for such shorter period that the registrant was required to submit and post such files). Yes ¨ No ¨
Indicate by check mark whether the registrant is a large accelerated filer, an accelerated filer, a non-accelerated filer or a smaller reporting company. See definition of “large accelerated filer”, “accelerated filer”, and “smaller reporting company” in Rule 12b-2 of the Exchange Act. (Check One).
| Large accelerated filer | ¨ | Accelerated Filer | x | |||
| Non-accelerated Filer | ¨ | Smaller Reporting Company | ¨ | |||
Indicated by check mark whether the registrant is a shell company (as defined in Rule 12b-2 of the Act). Yes ¨ No x
The aggregate market value of the registrant’s voting and non-voting common equity held by non-affiliates computed by reference to the closing price of the common equity of $15.80 per share, as reported by NASDAQ, on June 30, 2009, the last business day of the registrant’s most recently completed second fiscal quarter was approximately $54,980,524.
As of February 1, 2010, the registrant had 3,479,780 shares of common stock outstanding.
DOCUMENTS INCORPORATED BY REFERENCE
Portions of the registrant’s definitive proxy statement to be used in connection with the 2010 Annual Meeting of Shareholders is incorporated herein by reference in partial response to Part III, hereof.
Table of Contents
MID PENN BANCORP, INC.
FORM 10-K
2
Table of Contents
MID PENN BANCORP, INC.
PART I
The disclosures set forth in this Item are qualified by the section captioned “Special Cautionary Notice Regarding Forward-Looking Statements” contained in Part II, Item 7. Management’s Discussion and Analysis of Financial Condition and Results of Operations of this report and other cautionary statements set forth elsewhere in this report.
Mid Penn Bancorp, Inc., Inc.
Mid Penn Bancorp, Inc., Inc. is a one-bank holding company, incorporated in the Commonwealth of Pennsylvania in August 1991. Mid Penn Bancorp, Inc., Inc. and its wholly owned subsidiaries are collectively referred to herein as “Mid Penn” or the “Corporation.” On December 31, 1991, Mid Penn acquired, as part of the holding company formation, all of the outstanding common stock of Mid Penn Bank, and the Bank became a wholly owned subsidiary of Mid Penn. Mid Penn’s other wholly owned subsidiaries are Mid Penn Insurance Services, LLC, which provides a range of personal and investment insurance products and Mid Penn Investment Corporation, which is engaged in investing activities. Mid Penn’s primary business is to supervise and coordinate the business of its subsidiaries and to provide them with capital and resources.
Mid Penn’s consolidated financial condition and results of operations consist almost entirely of that of Mid Penn Bank, which is managed as a single business segment. At December 31, 2009, Mid Penn had total consolidated assets of $606,010,000, total deposits of $500,015,000, and total shareholders’ equity of $46,704,000.
As of December 31, 2009, Mid Penn Bancorp, Inc., Inc. did not own or lease any properties. Mid Penn Bank owns the banking offices as identified in Item 2.
All Mid Penn employees are employed by Mid Penn Bank. At December 31, 2009, the Bank had 155 full-time and 33 part-time employees. The Bank and its employees are not subject to a collective bargaining agreement, and the Bank believes it enjoys good relations with its personnel.
Mid Penn Bank
Millersburg Bank, the predecessor to Mid Penn Bank (the “Bank”), was organized in 1868, and became a state chartered bank in 1931, obtaining trust powers in 1935, at which time its name was changed to Millersburg Trust Company. In 1962, the Lykens Valley Bank merged with and into Millersburg Trust Company. In 1971, Farmer’s State Bank of Dalmatia merged with Millersburg Trust Company and the resulting entity adopted the name “Mid Penn Bank.” In 1985, the Bank acquired Tower City National Bank. In 1998, Mid Penn acquired Miners Bank of Lykens, which was merged into Mid Penn Bank. The Pennsylvania Department of Banking and the Federal Deposit Insurance Corporation supervise the Bank. Mid Penn’s and the Bank’s legal headquarters are located at 349 Union Street, Millersburg, Pennsylvania 17061. The Bank presently has 14 offices located in Dauphin, Northumberland, Schuylkill, and Cumberland Counties, Pennsylvania.
Mid Penn’s primary business consists of attracting deposits from its network of community banking offices operated by the Bank. The Bank engages in full-service commercial banking and trust business, making available to the community a wide range of financial services, including, but not limited to, installment loans, personal loans, mortgage and home equity loans, secured and unsecured commercial and consumer loans, lines of credit, construction financing, farm loans, community development and local government loans and various types of time and demand deposits. Deposits of the Bank are insured by the Bank Insurance Fund of the FDIC to the maximum extent provided by law. In addition, the Bank provides a full range of trust services through its Trust Department. The Bank also offers other services such as Internet banking, telephone banking, cash management services, automated teller services and safe deposit boxes.
Business Strategy
The Bank provides an array of sophisticated products typically found only in major regional banks. These services are provided to small and middle market businesses, high net worth individuals, and retail consumers through 14 full service banking facilities. Several banking locations have seasoned management with significant lending experience who are responsible for credit and pricing decisions, subject to loan committee approval for larger credits. This decentralized relationship management approach, coupled with the continuity of service by its banking officers, enables the Bank to develop long-term customer relationships, maintain high quality service and provide quick responses to customer needs. Mid Penn believes that its emphasis on local relationship building, together with its conservative approach to lending, are important factors in the success and the growth of Mid Penn.
The Bank seeks credit opportunities of good quality within its target market that exhibit positive historical trends, stable cash flows and secondary sources of repayment from tangible collateral. The Bank extends credit for the purpose of obtaining and continuing long-term relationships. Lenders are provided with detailed underwriting policies for all types of credit risks accepted by the Bank and must obtain appropriate approvals for credit extensions in excess of conservatively assigned lending limits. The Bank also maintains strict documentation requirements and extensive credit quality assurance practices in order to identify credit portfolio weaknesses as early as possible so any exposures that are discovered might be reduced.
1
Table of Contents
MID PENN BANCORP, INC.
Lending Activities
The Bank offers a variety of loan products to its customers, including loans secured by real estate, commercial and consumer loans. The Bank’s lending objectives are as follows:
| • | to establish a diversified commercial loan portfolio; and |
| • | to provide a satisfactory return to Mid Penn’s shareholders by properly pricing loans to include the cost of funds, administrative costs, bad debts, local economic conditions, competition, customer relationships, the term of the loan, credit risk, collateral quality and a reasonable profit margin. |
Credit risk is managed through portfolio diversification, underwriting policies and procedures and loan monitoring practices. The Bank generally secures its loans with real estate with such collateral values dependent and subject to change based on real estate market conditions within its market area. As of December 31, 2009, the Bank’s highest concentrations of credit were in Commercial Real Estate, Hotel/Motel, Commercial Construction and Land Development, and Restaurant financings. Most of the Bank’s business activity with customers was located in Central Pennsylvania, specifically in Dauphin, lower Northumberland, western Schuylkill, and eastern Cumberland Counties.
Investment Activities
Mid Penn’s investment portfolio is used to improve earnings through investments of funds in higher-yielding assets, while maintaining asset quality, which provides the necessary balance sheet liquidity for Mid Penn. Mid Penn does not have any significant concentrations within investment securities.
Mid Penn’s entire portfolio of investment securities is considered available for sale. As such, the investments are recorded on the balance sheet at fair value. Mid Penn’s investments include US Treasury, agency and municipal securities that are given a market price relative to investments of the same type with similar maturity dates. As the interest rate environment changes, Mid Penn’s fair value of existing securities will change. This difference in value, or unrealized gain, amounted to $1,238,000, as of December 31, 2009. A majority of the investments are high quality United States and municipal securities that, if held to maturity, are expected to result in no loss to the Bank.
For additional information with respect to Mid Penn’s business activities, see Part II, Item 7 of this report, which is incorporated herein by reference.
Sources of Funds
The Bank primarily uses deposits and borrowings to finance lending and investment activities. Borrowing sources include advances from the Federal Home Loan Bank of Pittsburgh, reverse repurchase agreements with investment banks and overnight borrowings from the Bank’s customers and correspondent bank. All borrowings, except for the line of credit with the Bank’s correspondent bank, require collateral in the form of loans or securities. Collateral levels therefore, limit borrowings and the available lines of credit extended by the Bank’s creditors. As a result, deposits remain key to the future funding and growth of the business. Deposit growth within the banking industry has been subject to strong competition from a variety of financial services companies. This competition may require financial institutions to adjust their product offerings and pricing to adequately grow deposits.
Competition
The banking business is highly competitive, and the profitability of Mid Penn depends principally upon the Bank’s ability to compete in its market area. The Bank actively competes with other financial services companies for deposit and loan business. Competitors include other commercial banks, savings banks, savings and loan associations, insurance companies, securities brokerage firms, credit unions, finance companies, mutual funds, and money market funds. Financial institutions compete primarily on the quality of services rendered, interest rates on loans and deposits, service charges, the convenience of banking facilities, location and hours of operation and, in the case of loans to larger commercial borrowers, relative lending limits.
Many competitors are significantly larger than the Bank and have significantly greater financial resources, personnel and locations from which to conduct business. In addition, the Bank is subject to banking regulations while certain competitors may not be. There are relatively few barriers for companies wanting to enter into the financial services industry. For more information, see the “Supervision and Regulation” section below.
2
Table of Contents
MID PENN BANCORP, INC.
Mid Penn has been able to compete effectively with other financial institutions by emphasizing technology and customer service, including local decision making on loans, establishing long-term customer relationships and building customer loyalty, and providing products and services designed to address the specific needs of its customers. The Gramm-Leach-Bliley Act (see discussion below), which breaks down many barriers between the banking, securities and insurance industries, may significantly affect the competitive environment in which Mid Penn operates.
The growth of mutual funds over the past decade has made it increasingly difficult for financial institutions to attract deposits. The continued flow of cash into mutual funds, much of which is made through tax deferred investment vehicles such as 401(k) plans, and a generally strong economy, have, until recently, fueled high returns for these investments, in particular, certain equity funds. The recent economic turmoil has negatively impacted the returns on many of these investments and impacted the manner in which investors distribute their funds across investment alternatives. The safety of traditional bank products has recently become an attractive option during this period of market volatility. Mid Penn’s ability to attract funds in the future will be impacted by the public’s appetite for the safety of insured or local investments versus the returns offered by alternative choices as part of their personal investment mix.
Mid Penn’s success is dependent to a significant degree on economic conditions in Central Pennsylvania, especially in Dauphin, lower Northumberland, western Schuylkill and eastern Cumberland Counties, which Mid Penn defines as our primary market. The banking industry is affected by general economic conditions including the effects of inflation, recession, unemployment, real estate values, trends in the national and global economics, and other factors beyond our control. An economic recession or a delayed recovery over a prolonged period of time in the Central Pennsylvania area could cause an increase in the level of the Bank’s non-performing assets and loan and lease losses, thereby causing operating losses, impairing liquidity and eroding capital. Mid Penn cannot assure you that adverse changes in the local economy would not have a material adverse effect on Mid Penn’s consolidated financial condition, results of operations, and cash flows.
Supervision and Regulation
General
Bank holding companies and banks are extensively regulated under both Federal and state laws. The regulation and supervision of Mid Penn and the Bank are designed primarily for the protection of depositors, the Deposit Insurance Fund, and the monetary system, and not Mid Penn or its shareholders. Enforcement actions may include the imposition of a conservator or receiver, cease-and-desist orders and written agreements, the termination of insurance on deposits, the imposition of civil money penalties and removal and prohibition orders. If a banking regulator takes any enforcement action, the value of an equity investment in Mid Penn could be substantially reduced or eliminated.
Federal and state banking laws contain numerous provisions affecting various aspects of the business and operations of Mid Penn and the Bank. Mid Penn is subject to, among others, the regulations of the Securities and Exchange Commission and the Federal Reserve Board, and the Bank is subject to, among others, the regulations of the Pennsylvania Department of Banking and the Federal Deposit Insurance Corporation. The following descriptions of and references to applicable statutes and regulations are not intended to be complete descriptions of these provisions or their effects on Mid Penn or the Bank. They are summaries only and are qualified in their entirety by reference to such statutes and regulations.
Holding Company Regulation
Mid Penn is a registered bank holding company subject to supervision and regulation by the Board of Governors of the Federal Reserve System (the “Federal Reserve”). As such, it is subject to the Bank Holding Company Act of 1956 (“BHCA”) and many of the Federal Reserve’s regulations promulgated thereunder. The Federal Reserve has broad enforcement powers over bank holding companies, including the power to impose substantial fines and civil penalties.
The BHCA requires Mid Penn to file an annual report with the Federal Reserve regarding the holding company and its subsidiary bank. The Federal Reserve Board also makes examinations of the holding company. The Bank is not a member of the Federal Reserve System; however, the Federal Reserve possesses cease-and-desist powers over bank holding companies and their subsidiaries where their actions would constitute an unsafe or unsound practice or violation of law. The Federal Reserve Board also makes policy that guides the declaration and distribution of dividends by bank holding companies.
The BHCA restricts a bank holding company’s ability to acquire control of additional banks. In addition, the BHCA restricts the activities in which bank holding companies may engage directly or through non-bank subsidiaries.
Gramm-Leach-Bliley Financial Modernization Act
The Gramm-Leach-Bliley Act (“GLB”) became effective on March 11, 2000. The primary purpose of GLB was to eliminate barriers between investment banking and commercial banking and to permit, within certain limitations, the affiliation of financial service providers. Generally, GLB:
| • | repealed the historical restrictions against, and eliminated many federal and state law barriers to affiliations among banks, securities firms, insurance companies and other financial service providers; |
| • | provided a uniform framework for the activities of banks, savings institutions and their holding companies; |
3
Table of Contents
MID PENN BANCORP, INC.
| • | broadened the activities that may be conducted by and through national banks and other banking subsidiaries of bank holding companies; |
| • | provided an enhanced framework for protecting the privacy of consumers’ information; |
| • | adopted a number of provisions related to the capitalization, membership, corporate governance and other measures designed to modernize the Federal Home Loan Bank System; |
| • | modified the laws governing the implementation of the Community Reinvestment Act; and |
| • | addressed a variety of other legal and regulatory issues affecting both day-to-day operations and long-term activities of financial institutions. |
More specifically, under GLB, bank holding companies, such as Mid Penn, that meet certain management, capital, and Community Reinvestment Act standards, are permitted to become financial holding companies and, by doing so, to affiliate with securities firms and insurance companies and to engage in other activities that are financial in nature, incidental to such financial activities, or complementary to such activities. A bank holding company may become a financial holding company if each of its subsidiary banks is well capitalized under the FDIC Improvement Act’s prompt corrective action provisions, is well managed and has at least a satisfactory rating under the Community Reinvestment Act. The required filing is a declaration that the bank holding company wishes to become a financial holding company and meets all applicable requirements. Mid Penn has not elected to become a financial holding company at this time.
No prior regulatory approval will be required for a financial holding company to acquire a company, other than a bank or savings association, engaged in activities permitted under GLB. Activities cited by GLB as being financial in nature include:
| • | securities underwriting, dealing and market making; |
| • | sponsoring mutual funds and investment companies; |
| • | insurance underwriting and agency; |
| • | merchant banking activities; and |
| • | activities that the Federal Reserve has determined to be closely related to banking. |
In addition to permitting financial services providers to enter into new lines of business, the law allows firms the freedom to streamline existing operations and to potentially reduce costs. The Act may increase both opportunity as well as competition. Many community banks are less able to devote the capital and management resources needed to facilitate broad expansion of financial services including insurance and brokerage services.
Corporate Governance
On July 30, 2002, the Sarbanes-Oxley Act of 2002 was enacted. The Sarbanes-Oxley Act represents a comprehensive revision of laws affecting corporate governance, auditor independence and accounting standards, executive compensation, insider loans, whistleblower protection, and enhanced and timely disclosure of corporate information. The Sarbanes-Oxley Act is applicable to all companies with equity securities registered or that file reports under the Securities Exchange Act of 1934. In particular, the Sarbanes-Oxley Act established:
| • | new requirements for audit committees, including independence, expertise and responsibilities; |
| • | additional responsibilities regarding financial statements for the Chief Executive Officer and Chief Financial Officer of the reporting company; |
| • | new standards for auditors and regulation of audits; |
| • | increased disclosure and reporting obligations for the reporting company and its directors and executive officers; and |
| • | new and increased civil and criminal penalties for violations of the securities laws. |
The SEC and NASDAQ have adopted numerous rules implementing the provisions of the Sarbanes-Oxley Act that affect Mid Penn. The changes are intended to allow shareholders to monitor more effectively the performance of companies and management.
Bank Regulation
The Bank, a Pennsylvania-chartered institution, is subject to supervision, regulation and examination by the Pennsylvania Department of Banking and the FDIC. The deposits of the Bank are insured by the FDIC to the extent provided by law. The FDIC assesses deposit insurance premiums the amount of which may, in the future, depend in part on the condition of the Bank. Moreover, the FDIC may terminate deposit insurance of the Bank under certain circumstances. The Bank regulatory agencies have broad enforcement powers over depository institutions under their jurisdiction, including the power to terminate deposit insurance, to impose fines and other civil and criminal penalties, and to appoint a conservator or receiver if any of a number of conditions is met. In addition, the Bank is subject to a variety of local, state and federal laws that affect its operations.
Banking regulations include, but are not limited to, permissible types and amounts of loans, investments and other activities, capital adequacy, branching, interest rates on loans and the safety and soundness of banking practices.
4
Table of Contents
MID PENN BANCORP, INC.
Capital Requirements
Under risk-based capital requirements for bank holding companies, Mid Penn is required to maintain a minimum ratio of total capital to risk-weighted assets (including certain off-balance-sheet activities, such as standby letters of credit) of eight percent. At least half of the total capital is to be composed of common equity, retained earnings and qualifying perpetual preferred stock, less goodwill (“Tier 1 Capital” and together with Tier 2 Capital, Total Capital”). The remainder may consist of subordinated debt, non-qualifying preferred stock and a limited amount of the loan loss allowance (“Tier 2 Capital”).
In addition, the Federal Reserve Board has established minimum leverage ratio requirements for bank holding companies. These requirements provide for a minimum leverage ratio of Tier 1 Capital to adjusted average quarterly assets (“leverage ratio”) equal to 3% for bank holding companies that meet certain specified criteria, including having the highest regulatory rating. All other bank holding companies will generally be required to maintain a leverage ratio of at least 4-5%. The requirements also provide that bank holding companies experiencing internal growth or making acquisitions will be expected to maintain strong capital positions substantially above the minimum supervisory levels without significant reliance on intangible assets. Furthermore, the requirements indicate that the Federal Reserve Board will continue to consider a “Tangible Tier 1 Leverage Ratio” (deducting all intangibles) in evaluating proposals for expansion or new activity. The Federal Reserve Board has not advised Mid Penn of any specific minimum Tier 1 leverage ratio.
The Bank is subject to similar capital requirements adopted by the FDIC. The FDIC has not advised the Bank of any specific minimum leverage ratios.
The capital ratios of Mid Penn and the Bank are described in Note 18 to Mid Penn’s Consolidated Financial Statements, which are incorporated herein by reference.
Banking regulators continue to indicate their desire to further develop capital requirements applicable to banking organizations. Changes to capital requirements could materially affect the profitability of Mid Penn or the fair value of Mid Penn stock.
FDIC Improvement Act
As a result of the FDIC Improvement Act of 1991, banks are subject to increased reporting requirements and more frequent examinations by the bank regulatory agencies. The agencies also have the authority to dictate certain key decisions that formerly were left to management, including compensation standards, loan underwriting standards, asset growth, and payment of dividends. Failure to comply with these standards, or failure to maintain capital above specified levels set by the regulators, could lead to the imposition of penalties or the forced resignation of management. If a bank becomes critically undercapitalized, the banking agencies have the authority to place an institution into receivership.
Safety and Soundness Standards
Pursuant to FDICIA, the federal banking regulatory agencies have adopted a set of guidelines prescribing safety and soundness standards for depository institutions such as the Bank. The guidelines establish general standards relating to internal controls and information systems, internal audit systems, loan documentation, credit underwriting, interest rate exposure, asset growth, asset quality, earnings and compensation, fees and benefits. In general, the guidelines require, among other things, appropriate systems and practices to identify and manage the risks and exposures specified in the guidelines. The guidelines prohibit excessive compensation as an unsafe and unsound practice and describe compensation as excessive when the amounts paid are unreasonable or disproportionate to the services performed by an executive officer, employee, director or principal shareholder. In addition, the agencies adopted regulations that authorize an agency to order an institution that has been given notice by an agency that it is not satisfying any of such safety and soundness standards to submit a compliance plan. If the institution fails to submit an acceptable compliance plan or fails to implement an accepted plan, the agency must issue an order directing action to correct the deficiency and may issue an order directing other actions be taken, including restricting asset growth, restricting interest rates paid on deposits, and requiring an increase in the institution’s ratio of tangible equity to assets.
Payment of Dividends and Other Restrictions
Mid Penn is a legal entity separate and distinct from its subsidiary, the Bank. There are various legal and regulatory limitations on the extent to which the Bank can, among other things, finance, or otherwise supply funds to, Mid Penn. Specifically, dividends from the Bank are the principal source of Mid Penn’s cash funds and there are certain legal restrictions under Pennsylvania law and Pennsylvania banking regulations on the payment of dividends by state-chartered banks. The relevant regulatory agencies also have authority to prohibit Mid Penn and the Bank from engaging in what, in the opinion of such regulatory body, constitutes an unsafe or unsound banking practice. The payment of dividends could, depending upon the financial condition of Mid Penn and the Bank, be deemed to constitute such an unsafe or unsound practice. Further, under the terms of the Capital Purchase Program (“CPP”), Mid Penn is restricted from increasing its dividends on its common stock above the last per share quarterly dividend declared prior to October 14, 2008 ($0.20 per share) without permission as long as the CPP preferred stock is outstanding.
5
Table of Contents
MID PENN BANCORP, INC.
Prompt Corrective Action
In addition to the required minimum capital levels described above, federal law establishes a system of “prompt corrective actions” which Federal banking agencies are required to take, and certain actions which they have discretion to take, based upon the capital category into which a federally regulated depository institution falls. Regulations set forth detailed procedures and criteria for implementing prompt corrective action in the case of any institution, which is not adequately capitalized. Under the rules, an institution will be deemed to be “adequately capitalized” if it exceeds the minimum Federal regulatory capital requirements. However, it will be deemed “undercapitalized” if it fails to meet the minimum capital requirements, “significantly undercapitalized” if it has a total risk-based capital ratio that is less than 6.0%, a Tier 1 risk-based capital ratio that is less than 3.0%, or a leverage ratio that is less than 3.0%, and “critically undercapitalized” if the institution has a ratio of tangible equity to total assets that is equal to or less than 2.0%.
The prompt corrective action rules require an undercapitalized institution to file a written capital restoration plan, along with a performance guaranty by its holding company or a third party. In addition, an undercapitalized institution becomes subject to certain automatic restrictions including a prohibition on payment of dividends, a limitation on asset growth and expansion, in certain cases, a limitation on the payment of bonuses or raises to senior executive officers, and a prohibition on the payment of certain “management fees” to any “controlling person”. Institutions that are classified as undercapitalized are also subject to certain additional supervisory actions, including increased reporting burdens and regulatory monitoring, a limitation on the institution’s ability to make acquisitions, open new branch offices, or engage in new lines of business, obligations to raise additional capital, restrictions on transactions with affiliates, and restrictions on interest rates paid by the institution on deposits. In certain cases, bank regulatory agencies may require replacement of senior executive officers or directors, or sale of the institution to a willing purchaser. If an institution is deemed “critically undercapitalized” and continues in that category for four quarters, the statute requires, with certain narrowly limited exceptions, that the institution be placed in receivership.
Deposit Insurance
The FDIC insures deposits of the Bank through the Deposit Insurance Fund (“DIF”). The FDIC maintains the DIF by assessing depository institutions an insurance premium. The amount each institution is assessed is based upon a variety of factors that include the balance of insured deposits as well as the degree of risk the institution poses to the insurance fund. The FDIC recently increased the amount of deposits it insures from $100,000 to $250,000. This increase is temporary and will continue through December 31, 2013. The Bank pays an insurance premium into the DIF based on the quarterly average daily deposit liabilities net of certain exclusions. The FDIC uses a risk-based premium system that assesses higher rates on those institutions that pose greater risks to the DIF. The FDIC places each institution in one of four risk categories using a two-step process based first on capital ratios (the capital group assignment) and then on other relevant information (the supervisory group assignment). Subsequently, the rate for each institution within a risk category may be adjusted depending upon different factors that either enhance or reduce the risk the institution poses to the DIF, including the unsecured debt, secured liabilities and brokered deposits related to each institution. Finally, certain risk multipliers may be applied to the adjusted assessment. In 2009, the FDIC increased the amount assessed from financial institutions by increasing its risk-based deposit insurance assessment scale. The quarterly annualized assessment scale for 2009 ranged from twelve basis points of assessable deposits for the strongest institutions to 77.5 basis points for the weakest. In 2009, the FDIC also adopted a uniform special assessment rate for all institutions not to exceed 10 basis points on the individual bank’s assessment base. The total amount paid by the Bank for FDIC insurance for the year ended December 31, 2009 under these provisions was $1,163,000.
On November 12, 2009, the FDIC approved a rule to require insured institutions to prepay their estimated quarterly risk-based assessments for the fourth quarter of 2009, and for all of 2010, 2011, and 2012. An insured institution’s risk-based deposit insurance assessments will continue to be calculated on a quarterly basis, but will be paid from the amount the institution prepaid until the later of the date that amount is exhausted or June 30, 2013, at which point any remaining funds would be returned to the insured institution. Consequently, Mid Penn’s prepayment of DIF premiums made in December 2009 resulted in a prepaid asset of $2,719,000.
Environmental Laws
Management does not anticipate that compliance with environmental laws and regulations will have any material effect on Mid Penn’s capital, expenditures, earnings, or competitive position. However, environmentally related hazards have become a source of high risk and potentially unlimited liability for financial institutions.
In 1995, the Pennsylvania General Assembly enacted the Economic Development Agency, Fiduciary and Lender Environmental Liability Protection Act, which among other things, provides protection to lenders from environmental liability and remediation costs under the environmental laws for releases and contamination caused by others. A lender who engages in activities involved in the routine practices of commercial lending, including, but not limited to, the providing of financial services, holding of security interests, workout practices, foreclosure or the recovery of funds from the sale of property shall not be liable under the environmental acts or common law equivalents to the Pennsylvania Department of Environmental Resources or to any other person by virtue of the fact that the lender engages in such commercial lending practice. A lender, however, will be liable if it, its employees or agents, directly cause an immediate release or directly exacerbate a release of regulated substance on or from the property, or known and willfully compelled the borrower to commit an action which caused such release or violate an environmental act. The Economic Development Agency, Fiduciary and Lender Environmental Liability Protection Act does not limit federal liability which still exists under certain circumstances.
6
Table of Contents
MID PENN BANCORP, INC.
Consumer Protection Laws
A number of laws govern the relationship between the Bank and its customers. For example, the Community Reinvestment Act is designed to encourage lending by banks to persons in low and moderate income areas. The Home Mortgage Disclosure Act and the Equal Credit Opportunity Act attempt to minimize lending decisions based on impermissible criteria, such as race or gender. The Truth-in-Lending Act and the Truth-in-Savings Act require banks to provide certain disclosure of relevant terms related to loans and savings accounts, respectively. Anti-tying restrictions (which prohibit conditioning the availability or terms of credit on the purchase of another banking product) further restrict the Bank’s relationships with its customers.
Privacy Laws
In 2000, the federal banking regulators issued final regulations implementing certain provisions of GLB governing the privacy of consumer financial information. The regulations limit the disclosure by financial institutions, such as Mid Penn and the Bank, of nonpublic personal information about individuals who obtain financial products or services for personal, family, or household purposes. Subject to certain exceptions allowed by law, the regulations cover information sharing between financial institutions and nonaffiliated third parties. More specifically, the regulations require financial institutions to:
| • | provide initial notices to customers about their privacy policies, describing the conditions under which they may disclose nonpublic personal financial information to nonaffiliated third parties and affiliates; |
| • | provide annual notices of their privacy policies to their current customers; and |
| • | provide a reasonable method for consumers to “opt out” of disclosures to nonaffiliated third parties. |
Protection of Customer Information
In 2001, the federal banking regulators issued final regulations implementing the provisions of GLB relating to the protection of customer information. The regulations, applicable to Mid Penn and the Bank, relate to administrative, technical, and physical safeguards for customer records and information. These safeguards are intended to:
| • | insure the security and confidentiality of customer records and information; |
| • | protect against any anticipated threats or hazards to the security or integrity of such records; and |
| • | protect against unauthorized access to or use of such records or information that could result in substantial harm or inconvenience to any customer. |
Affiliate Transactions
Transactions between Mid Penn and the Bank and its affiliates are governed by Sections 23A and 23B of the Federal Reserve Act. An “affiliate” of a bank or savings institution is any company or entity that controls, is controlled by, or is under common control with the bank or savings institution. Generally, a subsidiary of a depository institution that is not also a depository institution is not treated as an affiliate of the bank for purposes of Sections 23A and 23B. Sections 23A and 23B are intended to protect insured depository institutions from suffering losses arising from transactions with non-insured affiliates, by limiting the extent to which a bank or its subsidiaries may engage in covered transactions with any one affiliate and with all affiliates of the bank in the aggregate, and requiring that such transactions be on terms that are consistent with safe and sound banking practices.
Effective April 1, 2003, Regulation W of the Federal Reserve comprehensively amended Sections 23A and 23B. The regulation unifies and updates staff interpretations issued over the years, incorporates several new interpretative proposals (such as to clarify when transactions with an unrelated third party will be attributed to an affiliate), and addresses new issues arising as a result of the expanded scope of non-banking activities engaged in by bank and bank holding companies in recent years and authorized for financial holding companies under the GLB.
The USA Patriot Act
In 2001, the Uniting and Strengthening America by Providing Appropriate Tools Required to Intercept and Obstruct Terrorism Act of 2001 (USA Patriot Act) was signed into law. The USA Patriot Act broadened the application of anti-money laundering regulations to apply to additional types of financial institutions, such as broker-dealers, and strengthened the ability of the U.S. government to detect and prosecute international money laundering and the financing of terrorism. The principal provisions of Title III of the USA Patriot Act require that regulated financial institutions, including state-chartered banks:
| • | establish an anti-money laundering program that includes training and audit components; |
| • | comply with regulations regarding the verification of the identity of any person seeking to open an account; |
| • | take additional required precautions with non-U.S. owned accounts; and |
| • | perform certain verification and certification of money laundering risk for their foreign correspondent banking relationships. |
The USA Patriot Act also expanded the conditions under which funds in a U.S. interbank account may be subject to forfeiture and increased the penalties for violation of anti-money laundering regulations. Failure of a financial institution to comply with the USA Patriot Acts requirements could have serious legal and reputational consequences for the institution. The Bank has adopted policies, procedures and controls to address compliance with the requirements of the USA Patriot Act under the existing regulations and will continue to revise and update its policies, procedures and controls to reflect changes required by the USA Patriot Act and implementing regulations.
7
Table of Contents
MID PENN BANCORP, INC.
Anti-Money Laundering and Anti-Terrorism Financing
Under Title III of the USA PATRIOT Act, also known as the International Money Laundering Abatement and Anti-Terrorism Financing Act of 2001, all financial institutions, including Mid Penn and the Bank, are required in general to identify their customers, adopt formal and comprehensive anti-money laundering programs, scrutinize or prohibit altogether certain transactions of special concern, and be prepared to respond to inquiries from U.S. law enforcement agencies concerning their customers and their transactions. Additional information-sharing among financial institutions, regulators, and law enforcement authorities is encouraged by the presence of an exemption from the privacy provisions of the GLB Act for financial institutions that comply with this provision and the authorization of the Secretary of the Treasury to adopt rules to further encourage cooperation and information-sharing. The effectiveness of a financial institution in combating money-laundering activities is a factor to be considered in any application submitted by the financial institution under the Bank Merger Act, which applies to the Bank.
Emergency Economic Stabilization Act of 2008 and Related Programs
Mid Penn is subject to the rules and regulations promulgated under the Emergency Economic Stabilization Act of 2008 (“EESA”) and related legislation as a result of its sale of preferred stock to the U.S. Treasury under the U.S. Treasury’s Capital Purchase Program (“CPP”). Additional information relating to the CPP, including restrictions on dividends and redemptions of common stock, is included in the information set forth in Item 7 of this report under the caption, “Capital Purchase Program Participation.” Furthermore, under rules and regulations of EESA to which the Mid Penn is subject, no dividends may be declared or paid on Mid Penn’s common stock and Mid Penn may not repurchase or redeem any common stock unless dividends then due and payable with respect to Treasury’s preferred stock have been paid in full. Moreover, the consent of Treasury would be required for any increase in the per share dividend amount on the common stock beyond the per share dividend declared immediately prior to October 14, 2008 ($0.20 per share per quarter) until the third anniversary of the date of Treasury’s investment, unless prior to the third anniversary, Treasury’s preferred stock is redeemed in whole or Treasury has transferred all of its preferred shares to third parties. Because of Mid Penn’s participation in the CPP, Mid Penn is subject to certain restrictions on its executive compensation practices, which are discussed in Item 7 of this report under the caption, “Capital Purchase Program Participation.”
In November 2008, the FDIC created the Temporary Liquidity Guaranty Program to strengthen confidence and encourage liquidity in the banking system by guaranteeing newly issued senior unsecured debt of banks, thrifts, and certain holding companies via its Debt Guaranty Program, and by providing full coverage of noninterest bearing deposit transaction accounts and capped NOW accounts, regardless of dollar amount via its Temporary Account Guaranty Program. As of October 31, 2009, banks were no longer eligible to issue additional debt under the Temporary Liquidity Guaranty Program and Mid Penn has opted not to participate in the Temporary Account Guaranty Program beyond December 31, 2009.
Effects of Government Policy and Potential Changes in Regulation
Changes in regulations applicable to Mid Penn or the Bank, or shifts in monetary or other government policies, could have a material affect on our business. Mid Penn’s and the Bank’s business is also affected by the state of the financial services industry in general. As a result of legal and industry changes, management believes that the industry will continue to experience an increased rate of change as the financial services industry strives for greater product offerings, market share and economies of scale.
From time to time, legislation is enacted that has the effect of increasing the cost of doing business, limiting or expanding permissible activities or affecting the competitive balance between banks and other financial institutions. Proposals to change the laws and regulations governing the operations and taxation of banks, bank holding companies and other financial institutions are frequently made in Congress, and before various bank regulatory agencies. Mid Penn cannot predict the likelihood of any major changes or the impact such changes might have on Mid Penn and/or the Bank. Various congressional bills and other proposals have proposed a sweeping overhaul of the banking system, including provisions for: limitations on deposit insurance coverage; changing the timing and method financial institutions use to pay for deposit insurance; expanding the power of banks by removing the restrictions on bank underwriting activities; and tightening the regulation of bank derivatives activities; and allowing commercial enterprises to own banks.
Mid Penn’s earnings are, and will be affected by domestic economic conditions and the monetary and fiscal policies of the United States government and its agencies. The monetary policies of the Federal Reserve have had, and will likely continue to have, an impact on the operating results of commercial banks because of the Federal Reserve’s power to implement national monetary policy to, among other things, curb inflation or combat recession. The Federal Reserve has a major impact on the levels of bank loans, investments and deposits through its open market operations in United States government securities and through its regulation of, among other things, the discount rate on borrowings of member banks and the reserve requirements against member bank deposits. It is not possible to predict the nature and impact of future changes in monetary and fiscal policies.
From time to time, various types of federal and state legislation have been proposed that could result in additional regulation of, and restrictions on, the business of Mid Penn and the Bank. As a consequence of the extensive regulation of commercial banking activities in the United States,
8
Table of Contents
MID PENN BANCORP, INC.
the Bank’s business is particularly susceptible to being affected by federal legislation and regulations that may increase the costs of doing business. Congress is currently debating major legislation that may fundamentally change the regulatory oversight of banking institutions in the United States. Whether any legislation will be enacted or additional regulations will be adopted, and how they might impact Mid Penn cannot be determined at this time.
Available Information
Mid Penn’s common stock is registered under Section 12(b) of the Securities Exchange Act of 1934 and is traded on the NASDAQ Stock Market under the trading symbol MPB. Mid Penn is subject to the informational requirements of the Exchange Act, and, accordingly, files reports, proxy statements and other information with the Securities and Exchange Commission. The reports, proxy statements and other information filed with the SEC are available for inspection and copying at the SEC’s Public Reference Room at 100 F Street, NE, Room 1580, Washington, D.C. 20549. You may obtain information on the operation of the Public Reference Room by calling the SEC at (202) 551-8090. Mid Penn is an electronic filer with the SEC. The SEC maintains an Internet site that contains reports, proxy and information statements, and other information regarding issuers that file electronically with the SEC. The SEC’s Internet site address is www.sec.gov.
Mid Penn’s headquarters are located at 349 Union Street, Millersburg, Pennsylvania 17061, and its telephone number is (717) 692-2133. Mid Penn’s Internet address is www.midpennbank.com. Mid Penn makes available through its website, free of charge, its annual report on Form 10-K, quarterly reports on Form 10-Q, current reports on Form 8-K, and amendments to those reports as soon as reasonably practicable after filing with the Securities and Exchange Commission. Mid Penn has adopted a Code of Ethics that applies to all employees. This document is also available on Mid Penn’s website. The information included on our website is not a part of this document.
| ITEM 1A. | RISK FACTORS |
Future dividend payments and common stock repurchases are restricted by the terms of the U.S. Treasury’s equity investment in Mid Penn
Under the terms of the CPP, for so long as any preferred stock issued under the CPP remains outstanding, Mid Penn is prohibited from increasing dividends to holders of its common stock above the last per share quarterly amount in effect immediately prior to October 14, 2008 ($0.20 per share), and from making certain repurchases of equity securities, including our common stock, without the U.S. Treasury’s consent until the third anniversary of the U.S. Treasury’s investment or until the U.S. Treasury has transferred all of the preferred stock it purchased under the CPP to third parties. As long as the preferred stock issued to the U.S. Treasury is outstanding, dividend payments and repurchases or redemptions relating to certain equity securities, including Mid Penn’s common stock, are prohibited until all accrued and unpaid dividends are paid on such preferred stock, subject to certain limited exceptions.
Mid Penn is subject to interest rate risk
Mid Penn’s earnings and cash flows are largely dependent upon its net interest income. Net interest income is the difference between interest income earned on interest-earning assets such as loans and securities and interest expense paid on interest-bearing liabilities such as deposits and borrowed funds. Interest rates are highly sensitive to many factors that are beyond Mid Penn’s control, including general economic conditions and policies of various governmental and regulatory agencies and, in particular, the Board of Governors of the Federal Reserve System. Changes in monetary policy, including changes in interest rates, could influence not only the interest Mid Penn receives on loans and securities and the amount of interest it pays on deposits and borrowings, but such changes could also affect (i) Mid Penn’s ability to originate loans and obtain deposits, (ii) the fair value of Mid Penn’s financial assets and liabilities, and (iii) the average duration of Mid Penn’s mortgage-backed securities portfolio. If the interest rates paid on deposits and other borrowings increase at a faster rate than the interest rates received on loans and other investments, Mid Penn’s net interest income, and therefore earnings, could be adversely affected. Earnings could also be adversely affected if the interest rates received on loans and other investments fall more quickly than the interest rates paid on deposits and other borrowings.
Management believes it has implemented effective asset and liability management strategies to reduce the potential effects of changes in interest rates on Mid Penn’s results of operations. Any substantial, unexpected, prolonged change in market interest rates could have a material adverse effect on Mid Penn’s financial condition and results of operations.
Mid Penn is subject to lending risk
As of December 31, 2009, approximately 70.7% of Mid Penn’s loan portfolio consisted of commercial and industrial, construction and commercial real estate loans. These types of loans are generally viewed as having more risk of default than residential real estate loans or consumer loans. These types of loans are also typically larger than residential real estate loans and consumer loans. Because Mid Penn’s loan portfolio contains a significant number of commercial and industrial, construction and commercial real estate loans with relatively large balances, the deterioration of one or a few of these loans could cause a significant increase in non-performing loans. An increase in non-performing loans could result in a net loss of earnings from these loans, an increase in the provision for possible loan and lease losses and an increase in loan charge-offs, all of which could have a material adverse effect on Mid Penn’s financial condition and results of operations.
9
Table of Contents
MID PENN BANCORP, INC.
Mid Penn’s allowance for possible loan and lease losses may be insufficient
Mid Penn maintains an allowance for possible loan and lease losses, which is a reserve established through provisions for possible losses charged to expense, that represents management’s best estimate of probable losses that have been incurred within the existing portfolio of loans. The allowance, in the judgment of management, is necessary to reserve for estimated loan and lease losses and risks inherent in the loan portfolio. The level of the allowance reflects management’s continuing evaluation of industry concentrations; specific credit risks; loan loss experience; current loan portfolio quality; present economic, political and regulatory conditions and unidentified losses inherent in the current loan portfolio. The determination of the appropriate level of the allowance for possible loan and lease losses inherently involves a high degree of subjectivity and requires Mid Penn to make significant estimates of current credit risks and future trends, all of which may undergo material changes. Changes in economic conditions affecting borrowers, new information regarding existing loans, identification of additional problem credits and other factors, both within and outside of Mid Penn’s control, may require an increase in the allowance. In addition, bank regulatory agencies periodically review Mid Penn’s allowance for possible loan and lease losses and may require an increase in the provision for possible loan and lease losses or the recognition of further loan charge-offs, based on judgments different than those of management. In addition, if charge-offs in future periods exceed the allowance, Mid Penn will need additional provisions to increase the allowance for possible loan and lease losses. Any increases in the allowance will result in a decrease in net income and, possibly, capital, and may have a material adverse effect on Mid Penn’s financial condition and results of operations.
Competition from other financial institutions may adversely affect Mid Penn’s profitability
Mid Penn’s banking subsidiary faces substantial competition in originating, both commercial and consumer loans. This competition comes principally from other banks, savings institutions, mortgage banking companies and other lenders. Many of its competitors enjoy advantages, including greater financial resources and higher lending limits, a wider geographic presence, more accessible branch office locations, the ability to offer a wider array of services or more favorable pricing alternatives, as well as lower origination and operating costs. This competition could reduce the Corporation’s net income by decreasing the number and size of loans that its banking subsidiary originates and the interest rates it may charge on these loans.
In attracting business and consumer deposits, its banking subsidiary faces substantial competition from other insured depository institutions such as banks, savings institutions and credit unions, as well as institutions offering uninsured investment alternatives, including money market funds. Many of Mid Penn’s competitors enjoy advantages, including greater financial resources, more aggressive marketing campaigns, better brand recognition and more convenient branch locations. These competitors may offer higher interest rates than Mid Penn, which could decrease the deposits that Mid Penn attracts or require Mid Penn to increase its rates to retain existing deposits or attract new deposits. Increased deposit competition could adversely affect Mid Penn’s ability to generate the funds necessary for lending operations. As a result, Mid Penn may need to seek other sources of funds that may be more expensive to obtain and could increase its cost of funds.
Mid Penn’s banking subsidiary also competes with non-bank providers of financial services, such as brokerage firms, consumer finance companies, credit unions, insurance agencies and governmental organizations, which may offer more favorable terms. Some of its non-bank competitors are not subject to the same extensive regulations that govern its banking operations. As a result, such non-bank competitors may have advantages over Mid Penn’s banking subsidiary in providing certain products and services. This competition may reduce or limit Mid Penn’s margins on banking services, reduce its market share and adversely affect its earnings and financial condition.
Mid Penn’s controls and procedures may fail or be circumvented
Management regularly reviews and updates Mid Penn’s internal controls, disclosure controls and procedures, and corporate governance policies and procedures. Any system of controls, however well designed and operated, is based in part on certain assumptions and can provide only reasonable, not absolute, assurances that the objectives of the system are met. Any failure or circumvention of Mid Penn’s controls and procedures or failure to comply with regulations related to controls and procedures could have a material adverse effect on Mid Penn’s business, results of operations, and financial condition.
Mid Penn’s ability to pay dividends depends primarily on dividends from its banking subsidiary, which is subject to regulatory limits
Mid Penn is a bank holding company and its operations are conducted by its subsidiaries. Its ability to pay dividends depends on its receipt of dividends from its subsidiaries. Dividend payments from its banking subsidiary are subject to legal and regulatory limitations, generally based on net profits and retained earnings, imposed by the various banking regulatory agencies. The ability of Mid Penn’s subsidiaries to pay dividends is also subject to their profitability, financial condition, capital expenditures and other cash flow requirements. There is no assurance that Mid Penn’s subsidiaries will be able to pay dividends in the future or that Mid Penn will generate adequate cash flow to pay dividends in the future. Mid Penn’s failure to pay dividends on its common stock could have a material adverse effect on the market price of its common stock.
10
Table of Contents
MID PENN BANCORP, INC.
Mid Penn may not be able to attract and retain skilled people
Mid Penn’s success depends, in large part, on its ability to attract and retain key people. Competition for the best people in most activities engaged in by Mid Penn can be intense and Mid Penn may not be able to hire people or to retain them. The unexpected loss of services of one or more of Mid Penn’s key personnel could have a material adverse impact on Mid Penn’s business because of their skills, knowledge of Mid Penn’s market, years of industry experience, and the difficulty of promptly finding qualified replacement personnel.
Mid Penn is subject to claims and litigation pertaining to fiduciary responsibility
From time to time, customers make claims and take legal action pertaining to Mid Penn’s performance of its fiduciary responsibilities. Whether customer claims and legal action related to Mid Penn’s performance of its fiduciary responsibilities are founded or unfounded, if such claims and legal actions are not resolved in a manner favorable to Mid Penn they may result in significant financial liability and/or adversely affect the market perception of Mid Penn and its products and services as well as impact customer demand for those products and services. Any financial liability or reputation damage could have a material adverse effect on Mid Penn’s business, which, in turn, could have a material adverse effect on Mid Penn’s financial condition and results of operations.
The trading volume in Mid Penn’s common stock is less than that of other larger financial services companies
Mid Penn’s common stock is listed for trading on NASDAQ; the trading volume in its common stock is less than that of other larger financial services companies. A public trading market having the desired characteristics of depth, liquidity and orderliness depends on the presence in the marketplace of willing buyers and sellers of Mid Penn’s common stock at any given time. This presence depends on the individual decisions of investors and general economic and market conditions over which Mid Penn has no control. Given the lower trading volume of Mid Penn’s common stock, significant sales of Mid Penn’s common stock, or the expectation of these sales, could cause Mid Penn’s stock price to fall.
Mid Penn operates in a highly regulated environment and may be adversely affected by changes in federal, state and local laws and regulations
Mid Penn is subject to extensive regulation, supervision and examination by federal and state banking authorities. Any change in applicable regulations or federal, state or local legislation could have a substantial impact on Mid Penn and its operations. Additional legislation and regulations that could significantly affect Mid Penn’s powers, authority and operations may be enacted or adopted in the future, which could have a material adverse effect on its financial condition and results of operations. Further, regulators have significant discretion and authority to prevent or remedy unsafe or unsound practices or violations of laws by banks and bank holding companies in the performance of their supervisory and enforcement duties. The exercise of regulatory authority may have a negative impact on Mid Penn’s results of operations and financial condition.
Mid Penn must comply with significant anti-money laundering and anti-terrorism laws. Under these laws, Mid Penn is required, among other things, to enforce a customer identification program and file currency transaction and suspicious activity reports with the federal government. Government agencies have substantial discretion to impose significant monetary penalties on institutions, which fail to comply with these laws or make required reports.
The soundness of other financial institutions may adversely affect Mid Penn
Financial services institutions are interrelated as a result of trading, clearing, counterparty, or other relationships. Mid Penn has exposure to many different industries and counterparties, and routinely executes transactions with counterparties in the financial services industry, including commercial banks, brokers and dealers, investment banks, and other institutional clients. Many of these transactions expose Mid Penn to credit risk in the event of a default by a counterparty or client. In addition, Mid Penn’s credit risk may be exacerbated when the collateral held by Mid Penn cannot be realized upon or is liquidated at prices not sufficient to recover the full amount of the credit or derivative exposure due to Mid Penn. Any such losses could have a material adverse affect on the Mid Penn’s financial condition and results of operations.
Current levels of market volatility are unprecedented and may have materially adverse effects on our liquidity and financial condition
The capital and credit markets have been experiencing extreme volatility and disruption for more than two years. In some cases, the markets have exerted downward pressure on stock prices, security prices and credit availability for certain issuers without regard to their underlying financial strength. If the current levels of market disruption and volatility continue or worsen, there can be no assurance that we will not experience adverse effects, which may be material, on our liquidity, financial condition, and profitability.
ITEM 1B. UNRESOLVED STAFF COMMENTS
None.
11
Table of Contents
MID PENN BANCORP, INC.
With the exception of the Market Square Office in Harrisburg, PA, the Bank owns its main office, branch offices and certain parking facilities related to its banking offices, all of which are free and clear of any lien. The Bank’s main office and all branch offices are located in Pennsylvania. All of these properties are in good condition and are deemed by management to be adequate for the Bank’s purposes. The table below sets forth the location of each of the Bank’s properties.
| Property Location |
Description of Property |
Property Location |
Description of Property | |||
| Main Office |
Lykens Office | |||||
| 349 Union Street |
Main Bank Office | 550 Main Street | Branch Office | |||
| Millersburg, PA 17061 |
Lykens, PA 17048 | |||||
| Elizabethville Office |
Allentown Boulevard Office | |||||
| 4642 State Route 209 |
Branch Office | 5500 Allentown Boulevard | Branch Office | |||
| Elizabethville, PA 17023 |
Harrisburg, PA 17112 | |||||
| Dalmatia Office |
Market Square Office | |||||
| 132 School House Road |
Branch Office | 17 N. Second Street | Branch Office | |||
| Dalmatia, PA 17017 |
Harrisburg, PA 17101 | |||||
| Carlisle Pike Office |
Steelton Office | |||||
| 4622 Carlisle Pike |
Branch Office | 51 South Front Street | Branch Office | |||
| Mechanicsburg, PA 17050 |
Steelton, PA 17113 | |||||
| Derry Street Office |
Middletown Office | |||||
| 4098 Derry Street |
Branch Office | 1100 Spring Garden Drive | Branch Office | |||
| Harrisburg, PA 17111 |
Middletown, PA 17057 | |||||
| Front Street Office |
Camp Hill Office | |||||
| 2615 North Front Street |
Branch Office | 2101 Market Street | Branch Office | |||
| Harrisburg, PA 17110 |
Camp Hill, PA 17011 | |||||
| Tower City Office |
Operations Center | |||||
| 545 East Grand Avenue |
Branch Office | 894 N. River Road | Operations Center | |||
| Tower City, PA 17980 |
Halifax, PA 17032 | |||||
| Dauphin Office |
||||||
| 1001 Peters Mountain Road |
Branch Office | |||||
| Dauphin, PA 17018 |
||||||
Management is not aware of any litigation that would have a material adverse effect on the consolidated financial position of the Corporation. Mid Penn and the Bank have no proceedings pending other than ordinary routine litigation occurring in the normal course of business. In addition, management does not know of any material proceedings contemplated by governmental authorities against Mid Penn or the Bank or any of its properties.
ITEM 4. (REMOVED AND RESERVED)
12
Table of Contents
MID PENN BANCORP, INC.
PART II
ITEM 5. MARKET FOR REGISTRANT’S COMMON EQUITY, RELATED SHAREHOLDER MATTERS AND ISSUER PURCHASES OF EQUITY SECURITIES
The Corporation’s common stock is traded on the NASDAQ Stock Market under the symbol MPB. The following table shows the range of high and low sale prices for the Corporation’s stock and cash dividends paid for the quarters indicated.
| High | Low | Cash Dividends Paid | |||||||
| Quarter Ended: |
|||||||||
| March 31, 2009 |
$ | 22.00 | $ | 17.36 | $ | 0.20 | |||
| June 30, 2009 |
24.00 | 15.80 | 0.16 | ||||||
| September 30, 2009 |
17.99 | 14.00 | 0.16 | ||||||
| December 31, 2009 |
15.06 | 9.75 | — | ||||||
| March 31, 2008 |
$ | 26.70 | $ | 23.00 | $ | 0.20 | |||
| June 30, 2008 |
27.50 | 22.85 | 0.20 | ||||||
| September 30, 2008 |
25.85 | 21.60 | 0.20 | ||||||
| December 31, 2008 |
24.00 | 14.75 | 0.20 | ||||||
Transfer Agent: Registrar and Transfer Company, 10 Commerce Drive, Cranford, NJ 07016. Phone: 1-800-368-5948.
Number of Shareholders: As of February 16, 2010, there were approximately 1,476 shareholders of record of Mid Penn’s common stock.
Dividends: Quarterly cash dividends of $0.52 in the aggregate were paid during 2009. Quarterly cash dividends of $0.80 in the aggregate were paid during 2008. The quarterly dividend payment was suspended during the fourth quarter of 2009 consistent with the Federal Reserve Board policy that dividend payouts should not exceed net income for the previous four quarters, net of dividends previously paid during that period. Mid Penn presently plans to resume a quarterly dividend payment to common shareholders once the provisions of the Federal Reserve policy can be satisfied.
Dividend Reinvestment and Stock Purchases: Shareholders of Mid Penn may acquire additional shares of common stock by reinvesting their cash dividends under the Dividend Reinvestment Plan without paying a brokerage fee. Voluntary cash contributions may also be made under the Plan. For additional information about the Plan, contact the Transfer Agent.
Annual Meeting: The Annual Meeting of the Shareholders of Mid Penn will be held at 10:00 a.m. on Tuesday, May 4, 2010, at 349 Union Street, Millersburg, Pennsylvania.
Accounting, Auditing and Internal Control Complaints: Information on how to report a complaint regarding accounting, internal accounting controls or auditing matters is available at Mid Penn’s website: www.midpennbank.com.
13
Table of Contents
MID PENN BANCORP, INC.
Stock Performance Graph
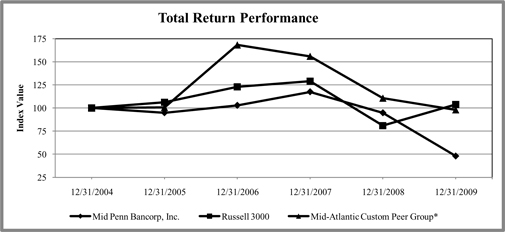
| Period Ending | ||||||||||||
| Index |
12/31/2004 | 12/31/2005 | 12/31/2006 | 12/31/2007 | 12/31/2008 | 12/31/2009 | ||||||
| Mid Penn Bancorp, Inc. |
100.0 | 94.8 | 102.8 | 117.5 | 94.7 | 47.9 | ||||||
| Russell 3000 |
100.0 | 106.1 | 122.8 | 129.1 | 80.9 | 103.9 | ||||||
| Mid-Atlantic Custom Peer Group* |
100.0 | 100.7 | 168.2 | 155.9 | 110.7 | 98.0 | ||||||
| * | Mid-Atlantic Custom Peer Group consists of Mid-Atlantic commercial banks with assets less than $1B. |
Source : SNL Financial LC, Charlottesville, VA
© 2010
A detailed list of the Banks comprising the Mid-Atlantic Custom Peer Group is incorporated herein by reference to Exhibit 99.1, which is attached to this Annual Report on Form 10-K.
14
Table of Contents
MID PENN BANCORP, INC.
ITEM 6. SELECTED FINANCIAL DATA
Summary of Selected Financial Data
| (Dollars in thousands, except per share data) | ||||||||||||||||||||
| 2009 | 2008 | 2007 | 2006 | 2005 | ||||||||||||||||
| INCOME: |
||||||||||||||||||||
| Total Interest Income |
$ | 31,336 | $ | 31,856 | $ | 31,444 | $ | 28,214 | $ | 23,294 | ||||||||||
| Total Interest Expense |
13,304 | 14,890 | 15,339 | 12,732 | 9,557 | |||||||||||||||
| Net Interest Income |
18,032 | 16,966 | 16,105 | 15,482 | 13,737 | |||||||||||||||
| Provision for Loan and Lease Losses |
9,520 | 1,230 | 925 | 735 | 225 | |||||||||||||||
| Noninterest Income |
3,656 | 3,682 | 3,481 | 3,028 | 2,953 | |||||||||||||||
| Noninterest Expense |
16,671 | 14,726 | 12,596 | 11,263 | 10,262 | |||||||||||||||
| Income (Loss) Before (Benefit from) Provision for Income Taxes |
(4,503 | ) | 4,692 | 6,065 | 6,512 | 6,203 | ||||||||||||||
| (Benefit from) Provision for Income Taxes |
(2,208 | ) | 1,104 | 1,394 | 1,624 | 1,600 | ||||||||||||||
| Net (Loss) Income |
(2,295 | ) | 3,588 | 4,671 | 4,888 | 4,603 | ||||||||||||||
| Preferred Stock Dividends and Discount Accretion |
514 | 16 | — | — | — | |||||||||||||||
| Net (Loss) Income Available to Common Shareholders |
(2,809 | ) | 3,572 | 4,671 | 4,888 | 4,603 | ||||||||||||||
| COMMON STOCK DATA PER SHARE: |
||||||||||||||||||||
| (Loss) Earnings Per Common Share (Basic) |
$ | (0.81 | ) | $ | 1.03 | $ | 1.34 | $ | 1.39 | $ | 1.31 | |||||||||
| (Loss) Earnings Per Common Share (Fully Diluted) |
(0.81 | ) | 1.03 | 1.34 | 1.39 | 1.31 | ||||||||||||||
| Cash Dividends |
0.52 | 0.80 | 0.80 | 0.80 | 0.80 | |||||||||||||||
| Book Value |
10.55 | 11.75 | 11.56 | 11.12 | 10.48 | |||||||||||||||
| AVERAGE SHARES OUTSTANDING (BASIC) |
3,479,780 | 3,483,097 | 3,497,806 | 3,514,820 | 3,515,714 | |||||||||||||||
| AVERAGE SHARES OUTSTANDING (FULLY DILUTED) |
3,479,780 | 3,483,153 | 3,497,806 | 3,514,820 | 3,515,714 | |||||||||||||||
| AT YEAR-END: |
||||||||||||||||||||
| Investments |
$ | 47,345 | $ | 52,739 | $ | 50,250 | $ | 57,261 | $ | 54,549 | ||||||||||
| Loans and Leases, Net of Unearned Discount |
480,385 | 434,643 | 377,128 | 358,612 | 311,837 | |||||||||||||||
| Allowance for Loan and Lease Losses |
7,686 | 5,505 | 4,790 | 4,187 | 3,704 | |||||||||||||||
| Total Assets |
606,010 | 572,999 | 509,757 | 491,694 | 438,110 | |||||||||||||||
| Total Deposits |
500,015 | 436,824 | 372,817 | 364,226 | 325,274 | |||||||||||||||
| Short-term Borrowings |
16,044 | 23,977 | 37,349 | 24,275 | 12,342 | |||||||||||||||
| Long-term Debt |
38,057 | 55,223 | 54,581 | 59,713 | 59,838 | |||||||||||||||
| Shareholders’ Equity |
46,704 | 50,890 | 40,444 | 39,085 | 36,861 | |||||||||||||||
| RATIOS: |
||||||||||||||||||||
| Return on Average Assets |
-0.39 | % | 0.67 | % | 0.94 | % | 1.08 | % | 1.10 | % | ||||||||||
| Return on Average Shareholders’ Equity |
-4.43 | % | 8.87 | % | 11.84 | % | 12.93 | % | 12.87 | % | ||||||||||
| Cash Dividend Payout Ratio |
-64.40 | % | 77.67 | % | 59.70 | % | 54.79 | % | 55.56 | % | ||||||||||
| Allowance for Loan and Lease Losses to Loans and Leases |
1.60 | % | 1.27 | % | 1.27 | % | 1.17 | % | 1.19 | % | ||||||||||
| Average Shareholders’ Equity to Average Assets |
8.88 | % | 7.55 | % | 7.82 | % | 8.34 | % | 8.55 | % | ||||||||||
15
Table of Contents
| MID PENN BANCORP, INC. | Management’s Discussion and Analysis |
ITEM 7. MANAGEMENT’S DISCUSSION AND ANALYSIS OF FINANCIAL CONDITION AND RESULTS OF OPERATIONS
SPECIAL CAUTIONARY NOTICE REGARDING FORWARD-LOOKING STATEMENTS
Certain of the matters discussed in this document may constitute forward-looking statements for purposes of the Securities Act of 1933, as amended, and the Securities Exchange Act of 1934, as amended, and as such may involve known and unknown risks, uncertainties and other factors which may cause the actual results, performance or achievements of Mid Penn to be materially different from future results, performance or achievements expressed or implied by such forward-looking statements. The words “expect,” “anticipate,” “intend,” “plan,” “believe,” “estimate,” and similar expressions are intended to identify such forward-looking statements.
Mid Penn’s actual results may differ materially from the results anticipated in these forward-looking statements due to a variety of factors, including, without limitation:
| • | The effects of future economic conditions on Mid Penn and its customers; |
| • | Governmental monetary and fiscal policies, as well as legislative and regulatory changes; |
| • | The effect of changes in accounting policies and practices, as may be adopted by the regulatory agencies, as well as the Financial Accounting Standards Board and other accounting standard setters; |
| • | The risks of changes in interest rates on the level and composition of deposits, loan demand, and the values of loan collateral, securities and interest rate protection agreements, as well as interest rate risks; |
| • | The effects of economic deterioration on current customers, specifically the effect of the economy on loan customers’ ability to repay loans; |
| • | The effects of competition from other commercial banks, thrifts, mortgage banking firms, consumer finance companies, credit unions, securities brokerage firms, insurance companies, money market and other mutual funds and other financial institutions operating in Mid Penn’s market area and elsewhere, including institutions operating locally, regionally, nationally and internationally, together with such competitors offering banking products and services by mail, telephone, computer and the internet; |
| • | The costs and effects of litigation and of unexpected or adverse outcomes in such litigation; |
| • | Technological changes; |
| • | Acquisitions and integration of acquired businesses; |
| • | The failure of assumptions underlying the establishment of reserves for loan and lease losses and estimations of values of collateral and various financial assets and liabilities; |
| • | Acts of war or terrorism; |
| • | Volatilities in the securities markets; |
| • | Deteriorating economic conditions. |
All written or oral forward-looking statements attributable to Mid Penn are expressly qualified in their entirety by these cautionary statements.
Management’s Discussion and Analysis of Financial Condition and Results of Operations analyzes the major elements of Mid Penn’s consolidated financial statements and should be read in conjunction with the Consolidated Financial Statements of the Corporation and Notes thereto and other detailed information appearing elsewhere in this Annual Report. Mid Penn is not aware of any known trends, events, uncertainties or of any current recommendations by the regulatory authorities which, if they were to be implemented, would have a material effect on Mid Penn’s liquidity, capital resources or operations.
Financial Summary
The consolidated earnings of Mid Penn are derived primarily from the operations of its wholly owned subsidiary, Mid Penn Bank.
Mid Penn recorded a net loss available to common shareholders of ($2,809,000) for the year 2009, compared to net income available to common shareholders of $3,572,000 in 2008, which was a decrease of $6,381,000 or 178.6%. This represents a net loss in 2009 of ($0.81) per common share compared to net income of $1.03 per common share in 2008 and $1.34 per common share in 2007.
Total assets of Mid Penn continued to grow in 2009, reaching the level of $606,010,000, an increase of $33,011,000 or 5.8% over $572,999,000 at year-end 2008. The majority of growth came from increases in commercial and commercial real estate loans. These increases were funded primarily through growth in deposits.
Mid Penn’s return on average shareholders’ equity, (ROE), a widely recognized performance indicator in the financial industry, was (4.43%) in 2009, 8.87% in 2008 and 11.84% in 2007. Return on average assets (ROA), another performance indicator, was (0.39%) in 2009, 0.67% in 2008 and 0.94% in 2007.
Mid Penn’s performance during 2009 was adversely impacted by several factors. First was an increase in provision for loan and lease losses, driven by deterioration in the overall quality of the loan portfolio. The recession and problems in the commercial real estate sector of the economy negatively impacted a number of loans in the portfolio, causing a precipitous increase in non-performing loans. Mid Penn also experienced strong growth in loan volumes. Further discussion of this increase can be found in the Provision for Loan and Lease Losses section below.
16
Table of Contents
| MID PENN BANCORP, INC. | Management’s Discussion and Analysis |
Second was the dramatic increase in FDIC insurance expense. This increase of $1,047,000 or 902.6% over 2008 levels resulted primarily from an industry-wide assessment by the FDIC on all of its member banks to restore the Deposit Insurance Fund to address future bank failures should they occur. This increase is not a reflection on Mid Penn’s financial performance, but rather on the number of bank failures throughout the country which had depleted the Deposit Insurance Fund. Further discussion of this and other expense increases can be found in the Noninterest Expense section below.
Finally is the decline in interest rate environment that occurred late in 2008 and early 2009. While Mid Penn exhibited strong growth in both loans and deposits, the Federal Reserve’s program of interest rate cuts to spur a loosening of the credit markets blunted the benefit of this growth. Mid Penn’s net interest margin declined to 3.42% in 2009 from 3.50% in 2008. Mid Penn’s net interest margin was also negatively impacted by the interest lost on nonperforming loans and leases. Net interest income on a tax equivalent basis rose $1,150,000 or 6.4% over 2008 levels in spite of an 8.8% increase in average earning assets. Further discussion of net interest margin can be found in the Net Interest Income section below.
Mid Penn’s fundamental operating performance in 2009 was sound despite these issues and the general economic conditions and credit crisis issues experienced by the banking industry as a whole. Mid Penn’s ongoing investment in marketing and business development in 2009 and 2008 was rewarded with strong growth in loans and deposits in its markets.
The Bank’s tier one capital (to risk weighted assets) of $44,434,000 or 9.2% and total capital (to risk weighted assets) of $50,496,000 or 10.4% at December 31, 2009, are above the regulatory requirements, which is 4% for tier one capital and 8% for total capital. Tier one capital consists primarily of the Bank’s shareholders’ equity. Total capital includes qualifying subordinated debt, if any, and the allowance for loan and lease losses, within permitted limits. Risk-weighted assets are determined by assigning various levels of risk to different categories of assets and off-balance sheet activities.
Critical Accounting Estimates
Mid Penn’s consolidated financial statements are prepared in accordance with accounting principles generally accepted in the United States of America (“GAAP”) and conform to general practices within the banking industry. Application of these principles involves significant judgments and estimates by management that have a material impact on the carrying value of certain assets and liabilities. The judgments and estimates that we used are based on historical experiences and other factors, which are believed to be reasonable under the circumstances. Because of the nature of the judgments and estimates that we have made, actual results could differ from these judgments and estimates, which could have a material impact on the carrying values of assets and liabilities and the results of our operations.
Management of the Corporation considers the accounting judgments relating to the allowance for loan and lease losses and the evaluation of the Corporation’s investment securities for other-than-temporary impairment to be the accounting areas that require the most subjective and complex judgments.
The allowance for loan and lease losses represents management’s estimate of probable incurred credit losses inherent in the loan and lease portfolio. Determining the amount of the allowance for loan and lease losses is considered a critical accounting estimate because it requires significant judgment and the use of estimates related to the amount and timing of expected future cash flows on impaired loans, estimated losses on pools of homogeneous loans based on historical loss experience, and consideration of current economic trends and conditions, all of which may be susceptible to significant change. The loan and lease portfolio also represents the largest asset type on the consolidated balance sheet. Throughout the remainder of this report, the terms “loan” or “loans” refers to both loans and leases.
Valuations for the investment portfolio are determined using quoted market prices, where available. If quoted market prices are not available, investment valuation is based on pricing models, quotes for similar investment securities, and observable yield curves and spreads. In addition to valuation, management must assess whether there are any declines in value below the carrying value of the investments that should be considered other than temporary or otherwise require an adjustment in carrying value and recognition of the loss in the consolidated statement of operations.
Net Interest Income
Net interest income, Mid Penn’s primary source of revenue, represents the difference between interest income and interest expense. Net interest income is affected by changes in interest rates and changes in average balances (volume) in the various interest-sensitive assets and liabilities.
17
Table of Contents
| MID PENN BANCORP, INC. | Management’s Discussion and Analysis |
TABLE 1: AVERAGE BALANCES, EFFECTIVE INTEREST DIFFERENTIAL AND INTEREST YIELDS
Income and Rates on a Taxable Equivalent Basis for Years Ended
| (Dollars in thousands) | |||||||||||||||||||||||||||
| December 31, 2009 | December 31, 2008 | December 31, 2007 | |||||||||||||||||||||||||
| Average Balance |
Interest | Average Rates |
Average Balance |
Interest | Average Rates |
Average Balance |
Interest | Average Rates |
|||||||||||||||||||
| ASSETS: |
|||||||||||||||||||||||||||
| Interest Earning Balances |
$ | 41,925 | $ | 1,460 | 3.48 | % | $ | 54,804 | $ | 2,499 | 4.56 | % | $ | 46,900 | $ | 2,546 | 5.43 | % | |||||||||
| Investment Securities: |
|||||||||||||||||||||||||||
| Taxable |
18,829 | 665 | 3.53 | % | 19,870 | 831 | 4.18 | % | 21,709 | 959 | 4.42 | % | |||||||||||||||
| Tax-Exempt |
25,188 | 1,774 | 7.04 | % | 27,287 | 1,895 | 6.94 | % | 29,726 | 2,062 | 6.94 | % | |||||||||||||||
| Total Securities |
44,017 | 47,157 | 51,435 | ||||||||||||||||||||||||
| Federal Funds Sold |
279 | 1 | 0.30 | % | — | — | — | 624 | 33 | 5.29 | % | ||||||||||||||||
| Loans and Leases, Net: |
|||||||||||||||||||||||||||
| Taxable |
446,649 | 27,370 | 6.13 | % | 394,674 | 26,713 | 6.77 | % | 361,324 | 26,592 | 7.36 | % | |||||||||||||||
| Tax-Exempt |
17,504 | 1,013 | 5.79 | % | 8,994 | 648 | 7.20 | % | — | — | — | ||||||||||||||||
| Total Loans and Leases, Net |
464,153 | 403,668 | 361,324 | ||||||||||||||||||||||||
| Restricted Investment in Bank Stocks |
3,929 | 1 | 0.03 | % | 3,657 | 134 | 3.66 | % | 3,334 | 191 | 5.73 | % | |||||||||||||||
| Total Earning Assets |
554,303 | 32,284 | 5.82 | % | 509,286 | 32,720 | 6.42 | % | 463,617 | 32,383 | 6.98 | % | |||||||||||||||
| Cash and Due from Banks |
6,795 | 7,745 | 7,559 | ||||||||||||||||||||||||
| Other Assets |
22,071 | 21,326 | 25,012 | ||||||||||||||||||||||||
| Total Assets |
$ | 583,169 | $ | 538,357 | $ | 496,188 | |||||||||||||||||||||
| LIABILITIES & SHAREHOLDERS’ EQUITY: |
|||||||||||||||||||||||||||
| Interest Bearing Deposits: |
|||||||||||||||||||||||||||
| NOW |
$ | 38,198 | 33 | 0.09 | % | $ | 36,551 | 108 | 0.30 | % | $ | 35,048 | 144 | 0.41 | % | ||||||||||||
| Money Market |
87,427 | 1,383 | 1.58 | % | 69,251 | 1,456 | 2.10 | % | 63,927 | 2,208 | 3.45 | % | |||||||||||||||
| Savings |
26,241 | 17 | 0.06 | % | 25,607 | 65 | 0.25 | % | 25,513 | 72 | 0.28 | % | |||||||||||||||
| Time |
255,123 | 9,293 | 3.64 | % | 230,773 | 9,903 | 4.29 | % | 203,671 | 9,006 | 4.42 | % | |||||||||||||||
| Short-term Borrowings |
19,715 | 112 | 0.57 | % | 29,144 | 608 | 2.09 | % | 22,528 | 1,049 | 4.66 | % | |||||||||||||||
| Long-term Debt |
47,241 | 2,466 | 5.22 | % | 52,843 | 2,750 | 5.20 | % | 56,908 | 2,860 | 5.03 | % | |||||||||||||||
| Total Interest Bearing Liabilities |
473,945 | 13,304 | 2.81 | % | 444,169 | 14,890 | 3.35 | % | 407,595 | 15,339 | 3.76 | % | |||||||||||||||
| Demand Deposits |
51,464 | 47,274 | 44,021 | ||||||||||||||||||||||||
| Other Liabilities |
5,985 | 6,456 | 5,734 | ||||||||||||||||||||||||
| Shareholders’ Equity |
51,775 | 40,458 | 38,838 | ||||||||||||||||||||||||
| Total Liabilities and Shareholders’ Equity |
$ | 583,169 | $ | 538,357 | $ | 496,188 | |||||||||||||||||||||
| Net Interest Income |
$ | 18,980 | $ | 17,830 | $ | 17,044 | |||||||||||||||||||||
| Net Yield on Interest Earning Assets: |
|||||||||||||||||||||||||||
| Total Yield on Earning Assets |
5.82 | % | 6.42 | % | 6.98 | % | |||||||||||||||||||||
| Rate on Supporting Liabilities |
2.81 | % | 3.35 | % | 3.76 | % | |||||||||||||||||||||
| Average Interest Spread |
3.01 | % | 3.07 | % | 3.22 | % | |||||||||||||||||||||
| Net Interest Margin |
3.42 | % | 3.50 | % | 3.68 | % | |||||||||||||||||||||
Interest and average rates are presented on a fully taxable equivalent basis, using an effective tax rate of 34%. For purposes of calculating loan yields, average loan balances include nonaccrual loans.
Loan fees of $683,000, $637,000 and $604,000 are included with interest income in Table 1 for the years 2009, 2008 and 2007, respectively.
18
Table of Contents
| MID PENN BANCORP, INC. | Management’s Discussion and Analysis |
TABLE 2: VOLUME ANALYSIS OF CHANGES IN NET INTEREST INCOME
| (Dollars in thousands) | 2009 Compared to 2008 Increase (Decrease) Due to Change In: |
2008 Compared to 2007 Increase (Decrease) Due to Change In: |
||||||||||||||||||||||
| Taxable Equivalent Basis | Volume | Rate | Net | Volume | Rate | Net | ||||||||||||||||||
| INTEREST INCOME: |
||||||||||||||||||||||||
| Interest Bearing Balances |
$ | (587 | ) | $ | (452 | ) | $ | (1,039 | ) | $ | 429 | $ | (476 | ) | $ | (47 | ) | |||||||
| Investment Securities: |
||||||||||||||||||||||||
| Taxable |
(44 | ) | (122 | ) | (166 | ) | (81 | ) | (47 | ) | (128 | ) | ||||||||||||
| Tax-Exempt |
(146 | ) | 25 | (121 | ) | (169 | ) | 2 | (167 | ) | ||||||||||||||
| Total Investment Securities |
(190 | ) | (97 | ) | (287 | ) | (250 | ) | (45 | ) | (295 | ) | ||||||||||||
| Federal Funds Sold |
1 | — | 1 | (33 | ) | — | (33 | ) | ||||||||||||||||
| Loans and Leases, Net |
4,703 | (3,681 | ) | 1,022 | 3,116 | (2,347 | ) | 769 | ||||||||||||||||
| Restricted Investment Bank Stocks |
10 | (143 | ) | (133 | ) | 19 | (76 | ) | (57 | ) | ||||||||||||||
| Total Interest Income |
3,937 | (4,373 | ) | (436 | ) | 3,281 | (2,944 | ) | 337 | |||||||||||||||
| INTEREST EXPENSE: |
||||||||||||||||||||||||
| Interest Bearing Deposits: |
||||||||||||||||||||||||
| NOW |
5 | (80 | ) | (75 | ) | 6 | (42 | ) | (36 | ) | ||||||||||||||
| Money Market |
382 | (455 | ) | (73 | ) | 184 | (936 | ) | (752 | ) | ||||||||||||||
| Savings |
2 | (50 | ) | (48 | ) | — | (7 | ) | (7 | ) | ||||||||||||||
| Time |
1,045 | (1,655 | ) | (610 | ) | 1,198 | (301 | ) | 897 | |||||||||||||||
| Total Interest Bearing Deposits |
1,434 | (2,240 | ) | (806 | ) | 1,388 | (1,286 | ) | 102 | |||||||||||||||
| Short-term Borrowings |
(197 | ) | (299 | ) | (496 | ) | 308 | (749 | ) | (441 | ) | |||||||||||||
| Long-term Debt |
(292 | ) | 8 | (284 | ) | (204 | ) | 94 | (110 | ) | ||||||||||||||
| Total Interest Expense |
945 | (2,531 | ) | (1,586 | ) | 1,492 | (1,941 | ) | (449 | ) | ||||||||||||||
| NET INTEREST INCOME |
$ | 2,992 | $ | (1,842 | ) | $ | 1,150 | $ | 1,789 | $ | (1,003 | ) | $ | 786 | ||||||||||
The effect of changing volume and rate has been allocated entirely to the rate column. Tax-exempt income is shown on a tax equivalent basis assuming a federal income tax rate of 34%.
During 2009, net interest income increased $1,150,000 or 6.4% as compared to an increase of $786,000 or 4.6% in 2008. The average balances, effective interest differential, and interest yields for the years ended December 31, 2009, 2008, and 2007 and the components of net interest income, are presented in Table 1. A comparative presentation of the changes in net interest income for 2009 compared to 2008, and 2008 compared to 2007, is provided in Table 2. This analysis indicates the changes in interest income and interest expense caused by the volume and rate components of interest earning assets and interest bearing liabilities.
The yield on earning assets decreased to 5.82% in 2009 from 6.42% in 2008. The yield on earning assets for 2007 was 6.98%. The change in the yield on earning assets was due primarily to changes in market interest rates and extreme rate competition within our market. The average “prime rate” for 2009 was 3.25% as compared to 5.21% for 2008 and 8.08% for 2007. The yield on earning assets is also negatively impacted by the loss of interest on nonperforming loans. During 2009, this loss of interest amounted to $608,000. Had this interest been included in Mid Penn’s earnings, the yield on earning assets would have increased 0.11%.
Interest expense decreased by $1,586,000, or 10.7%, in 2009 as compared to a decrease of $449,000, or 2.9%, in 2008. The cost of interest bearing liabilities decreased to 2.81% in 2009 from 3.35% in 2008. The cost of interest bearing liabilities for 2007 was 3.76%. The reduction in cost of interest bearing liabilities was due to changes in market interest rates and Mid Penn’s ability to reduce the rates on Money Market accounts and Certificates of Deposit. The reduction in market interest rates also had a positive impact on Mid Penn’s cost for short-term borrowings.
Net interest margin, on a tax equivalent basis, influenced by the increase in nonaccrual loans in 2009, was 3.42% compared to 3.50% in 2008 and 3.68% in 2007. The interest rate impact of earning assets and funding sources due to changes in interest rates can be reasonably estimated at current interest rate levels, the options selected by customers, and the future mix of the loan, investment, and deposit products in the Bank’s portfolios, may significantly change the estimates used in the simulation models. In addition, our net interest income may be impacted by further interest rate actions of the Federal Reserve Bank. Management continues to monitor the net interest margin closely.
19
Table of Contents
| MID PENN BANCORP, INC. | Management’s Discussion and Analysis |
Provision for Loan and Lease Losses
The provision for loan and lease losses is the expense necessary to maintain the allowance for loan and lease losses at a level adequate to absorb management’s estimate of probable losses in the loan and lease portfolio. Mid Penn’s provision for loan and lease losses is based upon management’s monthly review of the loan portfolio. The purpose of the review is to assess loan quality, identify impaired loans and leases, analyze delinquencies, ascertain loan and lease growth, evaluate potential charge-offs and recoveries, and assess general economic conditions in the markets we serve.
During 2009, Mid Penn continued to experience a challenging economic and operating environment. Given the economic pressures that impact some borrowers and borrowing segments, the Corporation has increased the allowance for loan and lease losses in accordance with Mid Penn’s assessment process, which took into consideration the decrease in collateral values from December 31, 2008 to December 31, 2009.
Following its model for loan and lease loss allowance adequacy, management recorded a $9,520,000 provision in 2009, as well as a provision of $1,230,000 in 2008, and $925,000 in 2007. The allowance for loan and lease losses as a percentage of total loans was 1.60% at December 31, 2009, compared to 1.27% at December 31, 2008 and 2007, which has been higher than that of peer financial institutions due to Mid Penn’s higher level of loans to finance commercial real estate. A summary of charge-offs and recoveries of loans and leases are presented in Table 3.
TABLE 3: ANALYSIS OF THE ALLOWANCE FOR LOAN AND LEASE LOSSES
| (Dollars in thousands) | Years ended December 31, | ||||||||||||||
| 2009 | 2008 | 2007 | 2006 | 2005 | |||||||||||
| Balance, beginning of year |
$ | 5,505 | $ | 4,790 | $ | 4,187 | $ | 3,704 | $ | 3,643 | |||||
| Loans and leases charged off: |
|||||||||||||||
| Commercial real estate, construction and land development |
2,841 | 384 | — | 17 | 32 | ||||||||||
| Commercial, industrial and agricultural |
4,158 | 70 | 100 | 158 | 29 | ||||||||||
| Real estate - residential |
115 | — | — | — | — | ||||||||||
| Consumer |
209 | 188 | 231 | 134 | 138 | ||||||||||
| Leases |
108 | 5 | 129 | — | — | ||||||||||
| Total loans and leases charged off |
7,431 | 647 | 460 | 309 | 199 | ||||||||||
| Recoveries on loans and leases previously charged off: |
|||||||||||||||
| Commercial real estate, construction and land development |
— | 1 | — | — | — | ||||||||||
| Commercial, industrial and agricultural |
16 | 20 | 5 | 3 | 12 | ||||||||||
| Consumer |
76 | 111 | 49 | 54 | 23 | ||||||||||
| Leases |
— | — | 84 | — | — | ||||||||||
| Total loans and leases recovered |
92 | 132 | 138 | 57 | 35 | ||||||||||
| Net charge-offs |
7,339 | 515 | 322 | 252 | 164 | ||||||||||
| Provision for loan and lease losses |
9,520 | 1,230 | 925 | 735 | 225 | ||||||||||
| Balance, end of year |
$ | 7,686 | $ | 5,505 | $ | 4,790 | $ | 4,187 | $ | 3,704 | |||||
20
Table of Contents
| MID PENN BANCORP, INC. | Management’s Discussion and Analysis |
| Years ended December 31, | |||||||||||||||
| 2009 | 2008 | 2007 | 2006 | 2005 | |||||||||||
| Ratio of net charge-offs during the year to average loans and leases outstanding during the year, net of unearned discount |
1.58 | % | 0.13 | % | 0.09 | % | 0.08 | % | 0.06 | % | |||||
| Allowance for loan and lease losses as a percentage of total loans and leases at December 31 |
1.60 | % | 1.27 | % | 1.27 | % | 1.17 | % | 1.18 | % | |||||
| Allowance for loan and lease losses as a percentage of non-performing assets at December 31 |
48.33 | % | 96.92 | % | 97.68 | % | 290.97 | % | 166.02 | % | |||||
Noninterest Income
A summary of the major components of noninterest income for the years ended December 31, 2009, 2008, and 2007 is found in Table 4. During 2009, Mid Penn earned $3,656,000 in noninterest income, compared to $3,682,000 earned in 2008 and $3,481,000 earned in 2007.
Service charges on deposit accounts amounted to $1,479,000 for 2009, a decrease of $175,000 or 10.6% compared to $1,654,000 for 2008, which was an increase of $155,000 or 10.3% above 2007. The decrease in service charges in 2009 occurred in spite of general growth in transaction accounts during 2009. This is attributable to more prudent account management by customers in the face of a challenging economic environment.
Mid Penn owns cash surrender value of life insurance policies on its directors. The income on these policies amounted to $280,000 during the year 2009, $267,000 in 2008, and $271,000 in 2007. In addition to the income on these life insurance policies, Mid Penn recognized a gain on life insurance proceeds in 2009 of $158,000 from the death of a retired director in February 2009.
Trust department income for 2009 was $243,000, a $70,000 or 22.4% decrease from $313,000 in 2008, which was a $6,000 or 1.9% decrease from $319,000 in 2007. Trust Department income can fluctuate from year to year, due to the number of estates settled during the year.
Significant revenue originated from our portfolio of ATM and debit cards. This is in the form of interchange fees generated by cardholder transactions. During 2009, Mid Penn increased the number of outstanding ATM and debit cardholders by over 36%. In spite of this increase in cardholders, the challenging economic environment, our customers reduced their transaction volumes during the year, reducing these earnings to $341,000, a $34,000 or 9.1% decrease from $375,000 in 2008, which was a $44,000 increase from 2007.
Mid Penn also earned $173,000 in 2009, $175,000 in 2008, and $155,000 in 2007 in fees from the third-party seller of investments whose services the Bank has contracted.
Other income amounted to $730,000 in 2009, $722,000 in 2008, and $741,000 in 2007.
TABLE 4: NONINTEREST INCOME
| (Dollars in thousands) | Years ended December 31, | ||||||||
| 2009 | 2008 | 2007 | |||||||
| Trust department income |
$ | 243 | $ | 313 | $ | 319 | |||
| Service charges on deposits |
1,479 | 1,654 | 1,499 | ||||||
| Investment securities gains, net |
— | 9 | — | ||||||
| Earnings from cash surrender value of life insurance |
280 | 267 | 271 | ||||||
| Gain on life insurance proceeds |
158 | — | — | ||||||
| Mortgage banking income |
124 | 78 | 77 | ||||||
| Merchant services revenue |
128 | 89 | 88 | ||||||
| ATM debit card interchange income |
341 | 375 | 331 | ||||||
| Retail investment revenue |
173 | 175 | 155 | ||||||
| Other income |
730 | 722 | 741 | ||||||
| Total Noninterest Income |
$ | 3,656 | $ | 3,682 | $ | 3,481 | |||
21
Table of Contents
| MID PENN BANCORP, INC. | Management’s Discussion and Analysis |
Noninterest Expense
A summary of the major components of noninterest expense for the years ended December 31, 2009, 2008, and 2007 is reflected in Table 5. Noninterest expense increased to $16,671,000 in 2009 from $14,726,000 in 2008 and $12,596,000 in 2007.
The major component of noninterest expense is salaries and employee benefits. The number of full-time equivalent employees increased from 152 to 170 during 2009. Increases in the 2009 workforce primarily included additions to loan support functions within the Corporation, in order to provide enhanced controls over the credit process and to support future growth. Mid Penn also recognized in 2009 a full year of salary and employee benefits expense from the 2008 additions within the support functions throughout the Corporation to enhance controls and support future growth.
Severance expenses related to the departure of the former CEO in October of 2008 were $478,000. This reflects the contractual payments due under the terms of his employment contract with Mid Penn.
FDIC insurance expense took a dramatic leap from $116,000 in 2008 to $1,163,000 during 2009. This increase stemmed from the escalation in Deposit Insurance premiums assessed by the FDIC on all its member banks to restore the Deposit Insurance Fund and keep it solvent to handle future bank failures should they occur. Included in this expense line is the special assessment of $265,000, levied on all FDIC member banks in June of 2009 to aid in the restoration of the Insurance Fund.
Occupancy and equipment expenses also increased in 2009 primarily in connection with the renovation and relocation of staff to a newly acquired and refurbished Operations Center in Halifax, PA. This facility was designed to meet our operation’s needs well into the future.
Legal and professional expenses increased in 2009 to $814,000 from $769,000 in 2008. Mid Penn incurred increased legal fees associated with its loan workout efforts. The increase was also driven by ongoing projects within the technology area to implement enhanced efficiencies within the support areas and enhance Mid Penn’s ability to offer new products and services in the upcoming year.
Marketing and advertising expense increased from $525,000 in 2008 to $679,000 in 2009, which is attributed to the promotion surrounding Mid Penn’s sponsorship of the annual 4th of July fireworks celebration in Millersburg in 2009 as well as continuing promotion of loan and deposit products to enhance market share.
Computer expense increased from $319,000 in 2008 to $435,000 in 2009. Mid Penn has been making significant enhancements to technology platforms to enhance efficiencies within the support departments and enable updated products and services to customers. These charges reflect the ongoing service contracts for these enhancements.
Telephone expense increased in 2009 to $302,000 from $193,000 in 2008. Mid Penn incurred increased telephone expenses associated with the opening of the new Operations Center in April of 2009 as well as ongoing upgrades to the infrastructure between office locations to enhance customer service capabilities.
The final significant item was the loss on sale or write-down on foreclosed assets of $110,000 in 2009 and $281,000 in 2008. This item resulted from Mid Penn’s ongoing analysis of the carrying values of our repossessed properties and the adjustment of their values to current market rates in the face of the overall decline in real estate values plaguing the economy.
22
Table of Contents
| MID PENN BANCORP, INC. | Management’s Discussion and Analysis |
TABLE 5: NONINTEREST EXPENSE
| (Dollars in thousands) | Years ended December 31, | ||||||||
| 2009 | 2008 | 2007 | |||||||
| Salaries and employee benefits |
$ | 8,173 | $ | 7,197 | $ | 6,554 | |||
| Severance expense |
— | 478 | — | ||||||
| Occupancy expense, net |
844 | 967 | 868 | ||||||
| Equipment expense |
1,170 | 870 | 828 | ||||||
| Pennsylvania Bank Shares tax expense |
366 | 315 | 329 | ||||||
| Legal and Professional fees |
814 | 769 | 562 | ||||||
| Marketing and advertising expense |
679 | 525 | 403 | ||||||
| ATM debit card processing expense |
126 | 169 | 140 | ||||||
| Director fees and benefits expense |
293 | 354 | 322 | ||||||
| Computer expense |
435 | 319 | 350 | ||||||
| Telephone expense |
302 | 193 | 115 | ||||||
| Stationery and supplies expense |
151 | 242 | 263 | ||||||
| Postage expense |
156 | 162 | 152 | ||||||
| Meals, travel, and lodging expense |
200 | 146 | 109 | ||||||
| Contributions expense |
77 | 134 | 97 | ||||||
| Internet banking expense |
88 | 112 | 88 | ||||||
| Courier expense |
96 | 112 | 107 | ||||||
| Core deposit intangible expense |
65 | 66 | 131 | ||||||
| Correspondent service charge expense |
95 | 90 | 88 | ||||||
| FDIC Assessment |
1,163 | 116 | 43 | ||||||
| Loss / write-down on sale of foreclosed assets |
110 | 281 | — | ||||||
| Other expenses |
1,268 | 1,109 | 1,047 | ||||||
| Total Noninterest Expense |
$ | 16,671 | $ | 14,726 | $ | 12,596 | |||
Investments
Mid Penn’s investment portfolio is utilized to provide liquidity and managed to maximize return within reasonable risk parameters.
Mid Penn’s entire portfolio of investment securities is considered available for sale. As such, the investments are recorded at fair value. Our investments are valued at a market price relative to investments of the same type with similar maturity dates. As the interest rate environment of these securities changes, the value of securities changes accordingly.
As of December 31, 2009, the unrealized gain on investment securities resulted in an increase in shareholders’ equity of $817,000 (unrealized gain on securities of $1,238,000 less estimated income tax expense of $421,000). At December 31, 2008, the unrealized gain on investment securities resulted in an increase in shareholders’ equity of $553,000 (unrealized gain on securities of $837,000 less estimated income tax expense of $284,000) compared to a December 31, 2007 increase in the unrealized gain included in other comprehensive income of $434,000 (unrealized gain on securities of $657,000, less estimated income tax expense of $223,000). Mid Penn does not have any significant concentrations within investment securities. Table 6 provides a summary of our available for sale investment securities.
TABLE 6: FAIR VALUE OF INVESTMENT SECURITIES
| (Dollars in thousands) | December 31, | ||||||||
| 2009 | 2008 | 2007 | |||||||
| U.S. Treasury and U.S. government agencies |
$ | 15,700 | $ | 23,086 | $ | 12,063 | |||
| Mortgage-backed U.S. government agencies |
4,619 | 4,173 | 6,858 | ||||||
| State and political subdivision obligations |
26,781 | 25,244 | 31,088 | ||||||
| Equity securities |
245 | 236 | 241 | ||||||
| $ | 47,345 | $ | 52,739 | $ | 50,250 | ||||
23
Table of Contents
| MID PENN BANCORP, INC. | Management’s Discussion and Analysis |
Maturity and yield information relating to the investment portfolio is shown in Table 7.
TABLE 7: INVESTMENT MATURITY AND YIELD
| (Dollars in thousands) As of December 31, 2009 |
One Year and Less |
After One Year thru Five Years |
After Five Years thru Ten Years |
After Ten Years |
Total | |||||||||||||||
| U.S. Treasury and U.S. government agencies |
$ | 502 | $ | 8,760 | $ | 6,438 | $ | — | $ | 15,700 | ||||||||||
| Mortgage-backed U.S. government agencies |
— | 13 | 19 | 4,587 | 4,619 | |||||||||||||||
| State and political subdivision obligations |
524 | 3,361 | 11,979 | 10,917 | 26,781 | |||||||||||||||
| Equity securities |
— | — | — | 245 | 245 | |||||||||||||||
| $ | 1,026 | $ | 12,134 | $ | 18,436 | $ | 15,749 | $ | 47,345 | |||||||||||
| One Year and Less |
After One Year thru Five Years |
After Five Years thru Ten Years |
After Ten Years |
Total | ||||||||||||||||
| Weighted Average Yields |
||||||||||||||||||||
| U.S. Treasury and U.S. government agencies |
0.40 | % | 2.10 | % | 4.30 | % | — | 2.95 | % | |||||||||||
| Mortgage-backed U.S. government agencies |
— | 6.15 | % | 3.07 | % | 4.80 | % | 4.80 | % | |||||||||||
| State and political subdivision obligations (FTE) |
6.81 | % | 7.12 | % | 6.33 | % | 6.21 | % | 6.39 | % | ||||||||||
| Equity securities |
— | — | — | 5.00 | % | 5.00 | % | |||||||||||||
| 3.67 | % | 3.49 | % | 5.62 | % | 5.78 | % | 5.09 | % | |||||||||||
Loans
At December 31, 2009, loans and leases totaled $480,385,000; a $45,742,000 or 10.5% increase from December 31, 2008. During 2009, Mid Penn experienced a net increase in commercial real estate and commercial/industrial loans of approximately $33,526,000.
At December 31, 2009, loans, net of unearned income, represented 84.8% of earning assets as compared to 80.2% on December 31, 2008, and 77.9% on December 31, 2007.
The Bank’s loan portfolio is diversified among individuals, farmers, and small and medium-sized businesses generally located within the Bank’s trading area of Dauphin County, lower Northumberland County, western Schuylkill County and eastern Cumberland County. Commercial real estate, construction and land development loans are collateralized mainly by mortgages on the income-producing real estate or land involved. Commercial, industrial and agricultural loans are made to business entities and may be secured by business assets, including commercial real estate, or may be unsecured. Residential real estate loans are secured by liens on the residential property. Consumer loans include installment loans, lines of credit and home equity loans. The Bank has no concentration of credit to any one borrower. The Bank’s highest concentration of credit is in Commercial Real Estate, Hotel/Motel, Commercial Construction and Land Development, and Restaurant financings.
24
Table of Contents
| MID PENN BANCORP, INC. | Management’s Discussion and Analysis |
A distribution of the Bank’s loan portfolio according to major loan classification is shown in Table 8.
TABLE 8: LOAN PORTFOLIO
| (Dollars in thousands) | December 31, | |||||||||||||||||||||||||||||
| 2009 | 2008 | 2007 | 2006 | 2005 | ||||||||||||||||||||||||||
| Amount | % | Amount | % | Amount | % | Amount | % | Amount | % | |||||||||||||||||||||
| Commercial real estate, construction and land development |
$ | 253,878 | 52.8 | $ | 234,762 | 53.9 | $ | 197,192 | 52.1 | $ | 191,420 | 53.1 | $ | 183,543 | 58.6 | |||||||||||||||
| Commercial, industrial and agricultural |
85,795 | 17.8 | 71,385 | 16.4 | 65,421 | 17.3 | 60,566 | 16.8 | 39,820 | 12.7 | ||||||||||||||||||||
| Real estate - residential |
128,522 | 26.7 | 118,547 | 27.2 | 106,141 | 28.0 | 98,323 | 27.3 | 80,530 | 25.7 | ||||||||||||||||||||
| Consumer |
12,884 | 2.7 | 11,103 | 2.5 | 9,987 | 2.6 | 10,027 | 2.8 | 9,530 | 3.0 | ||||||||||||||||||||
| Total Loans |
481,079 | 100.0 | 435,797 | 100.0 | 378,741 | 100.0 | 360,336 | 100.0 | 313,423 | 100.0 | ||||||||||||||||||||
| Unearned income |
(694 | ) | (1,154 | ) | (1,613 | ) | (1,763 | ) | (1,586 | ) | ||||||||||||||||||||
| Loans net of unearned discount |
480,385 | 434,643 | 377,128 | 358,573 | 311,837 | |||||||||||||||||||||||||
| Allowance for loan and lease losses |
(7,686 | ) | (5,505 | ) | (4,790 | ) | (4,187 | ) | (3,704 | ) | ||||||||||||||||||||
| Net loans |
$ | 472,699 | $ | 429,138 | $ | 372,338 | $ | 354,386 | $ | 308,133 | ||||||||||||||||||||
Mid Penn’s maturity and rate sensitivity information related to the loan portfolio is reflected in Table 9.
TABLE 9: LOAN MATURITY AND INTEREST SENSITIVITY
| (Dollars in thousands) As of December 31, 2009 |
One Year and Less |
After One Year thru Five Years |
After Five Years |
Total | ||||||||
| Commercial real estate, construction and land development |
$ | 71,105 | $ | 163,119 | $ | 19,654 | $ | 253,878 | ||||
| Commercial, industrial and agricultural |
27,298 | 49,589 | 8,908 | 85,795 | ||||||||
| Real estate - residential mortgages |
24,971 | 80,742 | 22,809 | 128,522 | ||||||||
| Consumer |
4,728 | 5,588 | 1,874 | 12,190 | ||||||||
| $ | 128,102 | $ | 299,038 | $ | 53,245 | $ | 480,385 | |||||
| Rate Sensitivity |
||||||||||||
| Predetermined rate |
$ | 27,596 | $ | 91,359 | $ | 49,717 | $ | 168,672 | ||||
| Floating or adjustable rate |
100,506 | 207,679 | 3,528 | 311,713 | ||||||||
| $ | 128,102 | $ | 299,038 | $ | 53,245 | $ | 480,385 | |||||
25
Table of Contents
| MID PENN BANCORP, INC. | Management’s Discussion and Analysis |
Allowance for Loan and Lease Losses
The allocation of the allowance for loan and lease losses among the major classifications is shown in Table 10 as of December 31 of each of the past five years.
TABLE 10: ALLOCATION OF THE ALLOWANCE FOR LOAN AND LEASE LOSSES
| (Dollars in thousands) | December 31, | ||||||||||||||
| 2009 | 2008 | 2007 | 2006 | 2005 | |||||||||||
| Commercial real estate, construction and land development |
$ | 3,334 | $ | 3,326 | $ | 2,908 | $ | 2,462 | $ | 2,037 | |||||
| Commercial, industrial and agricultural |
3,545 | 1,860 | 1,607 | 1,515 | 1,481 | ||||||||||
| Real estate - residential |
175 | 87 | 75 | 54 | 52 | ||||||||||
| Consumer |
467 | 172 | 148 | 124 | 110 | ||||||||||
| General |
165 | 60 | 52 | 32 | 24 | ||||||||||
| $ | 7,686 | $ | 5,505 | $ | 4,790 | $ | 4,187 | $ | 3,704 | ||||||
The 2009 provision of $9,520,000 is an increase of $8,290,000 over the $1,230,000 provision in 2008. The larger provision is reflective of the deterioration in the overall quality of our loan portfolio caused by the recession and problems in the commercial real estate sector as well as the robust growth in the loan portfolio during 2009.
The allowance for loan and lease losses at December 31, 2009 was $7,686,000, or 1.60% of total loans less unearned discount as compared to $5,505,000, or 1.27% at December 31, 2008 and $4,790,000 or 1.27% at December 31, 2007.
Nonperforming Assets
Nonperforming assets, other than consumer loans and 1-4 family residential mortgages, include nonaccrual loans, restructured loans and other real estate (including residential property). Nonaccrual loans are loans on which we no longer recognize daily interest income. A loan is generally classified as nonaccrual when principal or interest has consistently been in default for a period of 90 days or more, or because of deterioration in the financial condition of the borrower, payment in full of principal or interest is not expected. Restructured loans are those loans whose terms have been modified to lower interest or principal payments because of borrower financial difficulties. Foreclosed assets held for sale include those assets that have been acquired through foreclosure for debts previously contracted, in settlement of debt. Loans past due 90 days or more and still accruing interest are loans that are generally well secured and in the process of collection or repayment and comprise additional risk elements in the loan portfolio.
Consumer loans are generally recommended for charge-off when they become 90 days delinquent. All 1-4 family residential mortgages 90 days or more past due are reviewed by Management, and collection decisions are made in light of the analysis of each individual loan. The amount of consumer and residential mortgage loans past due 90 days or more at year-end was $250,000, $465,000 and $916,000 in 2009, 2008 and 2007, respectively.
A presentation of nonperforming assets as of December 31 for each of the past five years is given in Table 11. At December 31, 2009, there were seven parcels of primarily residential real estate in Other Real Estate Owned. The foreclosed assets held for sale at December 31, 2008, consisted of ten parcels of primarily residential real estate in Other Real Estate Owned.
26
Table of Contents
| MID PENN BANCORP, INC. | Management’s Discussion and Analysis |
TABLE 11: NONPERFORMING ASSETS
| (Dollars in thousands) | December 31, | |||||||||||||||||||
| 2009 | 2008 | 2007 | 2006 | 2005 | ||||||||||||||||
| Nonperforming Assets: |
||||||||||||||||||||
| Nonaccrual loans |
$ | 14,933 | $ | 4,113 | $ | 4,317 | $ | 1,293 | $ | 1,773 | ||||||||||
| Loans renegotiated with borrowers |
308 | 51 | — | — | — | |||||||||||||||
| Total nonperforming loans |
15,241 | 4,164 | 4,317 | 1,293 | 1,773 | |||||||||||||||
| Foreclosed real estate |
663 | 1,516 | 528 | 146 | 458 | |||||||||||||||
| Other repossessed property |
— | — | 59 | — | — | |||||||||||||||
| Total non-performing assets |
15,904 | 5,680 | 4,904 | 1,439 | 2,231 | |||||||||||||||
| Accruing loans 90 days or more past due |
661 | 1,860 | 2,439 | 995 | 1,086 | |||||||||||||||
| Total risk elements |
$ | 16,565 | $ | 7,540 | $ | 7,343 | $ | 2,434 | $ | 3,317 | ||||||||||
| Nonperforming loans as a % of total loans outstanding |
3.17 | % | 0.96 | % | 1.14 | % | 0.36 | % | 0.57 | % | ||||||||||
| Nonperforming assets as a % of total loans outstanding and other real estate |
3.31 | % | 1.30 | % | 1.30 | % | 0.40 | % | 0.71 | % | ||||||||||
| Ratio of allowance for loan losses to nonperforming loans |
50.43 | % | 132.20 | % | 110.96 | % | 323.82 | % | 208.91 | % | ||||||||||
Mid Penn considers a loan or lease to be impaired when, based upon current information and events, it is probable that all interest and principal payments due according to the contractual terms of the loan or lease agreement will not be collected. An insignificant delay or shortfall in the amounts of payments would not cause a loan or lease to be considered impaired. Management determines the significance of payment delays and payment shortfalls on a case-by-case basis, taking into consideration all of the circumstances surrounding the loan or lease and the borrower, including the length of the delay, the reasons for the delay, the borrower’s prior payment record and the amount of the shortfall in relation to the principal and interest owed. Larger groups of small-balance loans, such as residential mortgages and consumer installment loans are collectively evaluated for impairment. Accordingly, individual consumer and residential loans are not separately identified for impairment disclosures unless such loans are the subject of a restructuring agreement. As discussed in Note 13 of these consolidated financial statements, Mid Penn determines the fair value of impaired loans on a case-by-case basis based primarily upon the fair value of the underlying collateral using Level 3 inputs comprised of customized collateral value discounting analyses.
As of December 31, 2009, the Corporation had several unrelated loan relationships, with an aggregate carrying balance of $13,726,000, deemed impaired that have been placed in nonaccrual status. Specific allocations totaling $2,561,000 have been included within the loan loss reserve for these loans. This pool of impaired loan relationships is comprised of $8,275,000 in real estate secured commercial relationships and $5,451,000 in business relationships. The Bank has specific allocations against the real estate secured pool totaling $837,000, of which $483,000 is with one large relationship. The remaining $354,000 is spread among nine relationships composed primarily of customers engaged in real estate investment activities. The group of impaired business relationships with specific allocations is made up of six relationships primarily engaged in various forms of manufacturing and a specific allocation of $1,724,000 has been set aside against these credits. One large commercial participation loan in this pool has shown exceptional collateral devaluation and is responsible for a specific allocation of $1,000,000 of the total pool attributable to this segment. Two other manufacturing relationships account for an additional $589,000 of the specific allocations due to the negative effects of the economy on their businesses and the subsequent collateral devaluation. Management currently believes that the specific reserve is adequate to cover potential future losses related to these relationships. $4,278,000 of the 2009 non-accrual loans are also troubled debt restructured loans.
The allowance for loan losses is a reserve established in the form of a provision expense for loan and lease losses and is reduced by loan charge-offs net of recoveries. When loans are deemed to be uncollectible, they are charged off. Management has established a reserve that it believes is adequate for probable losses in the loan and lease portfolio. In conjunction with an internal loan review function that operates independently of the lending function, management monitors the loan portfolio to identify risk on a monthly basis so that an appropriate allowance is maintained. Based on an evaluation of the loan portfolio, management presents a monthly review of the allowance for loan and lease losses to the Board of Directors, indicating any changes in the allowance since the last review. In making the evaluation, management considers the results of recent regulatory examinations, which typically include a review of the allowance for loan and lease losses an integral part of the examination process.
In establishing the allowance, management evaluates on a quantitative basis individual classified loans and nonaccrual loans, and determines an aggregate reserve for those loans based on that review. In addition, an allowance for the remainder of the loan and lease portfolio is determined based on historical loss experience within certain components of the portfolio. These allocations may be modified if current conditions indicate that loan and lease losses may differ from historical experience.
27
Table of Contents
| MID PENN BANCORP, INC. | Management’s Discussion and Analysis |
In addition, a portion of the allowance is established for losses inherent in the loan and lease portfolio which have not been identified by the quantitative processes described above. This determination inherently involves a higher degree of subjectivity, and considers risk factors that may not have yet manifested themselves in historical loss experience. These factors include:
| • | Changes in local, regional, and national economic and business conditions affecting the collectability of the portfolio, the values of underlying collateral, and the condition of various market segments. |
| • | Changes in the volume and severity of past due loans, the volume of nonaccrual loans, and the volume and severity of adversely classified loans. |
| • | Changes in the experience, ability, and depth of lending management and other relevant staff as well as the quality of the institution’s loan review system. |
| • | Changes in the nature and volume of the portfolio and the terms of loans generally offered. |
| • | The existence and effect of any concentrations of credit and changes in the level of such concentrations. |
While the allowance for loan and lease losses is maintained at a level believed to be adequate by management for covering estimated losses in the loan and lease portfolio, determination of the allowance is inherently subjective, as it requires estimates, all of which may be susceptible to significant change. Changes in these estimates may impact the provisions charged to expense in future periods.
Management believes, based on information currently available, that the allowance for loan and lease losses of $7,686,000 is adequate as of December 31, 2009.
Deposits and Other Funding Sources
Mid Penn’s primary source of funds is deposits. Total deposits at December 31, 2009, increased by $63,191,000 or 14.5% over December 31, 2008, which increased by $64,007,000 or 17.2% over December 31, 2007. Average balances and average interest rates applicable to the major classifications of deposits for the years ended December 31, 2009, 2008, and 2007 are presented in Table 12.
Average short-term borrowings for 2009 were $19,715,000 as compared to $29,144,000 in 2008. These borrowings included customer repurchase agreements, treasury tax and loan note option borrowings and federal funds purchased. Three $5,000,000 and two $1,000,000 long-term borrowings matured in 2009, while no new long-term borrowing arrangements were entered into during the year.
At December 31, 2009, the Bank had $27,889,000 in brokered deposits. With additional success in the local deposit environment, the Bank reduced its brokered deposit funding by $18,219,000 in 2009, after having reduced such funding by $3,649,000 in 2008.
TABLE 12: DEPOSITS BY MAJOR CLASSIFICATION
| (Dollars in thousands) | December 31, | |||||||||||||||||
| 2009 | 2008 | 2007 | ||||||||||||||||
| Average Balance |
Average Rate |
Average Balance |
Average Rate |
Average Balance |
Average Rate |
|||||||||||||
| Noninterest-bearing demand deposits |
$ | 51,464 | 0.00 | % | $ | 47,274 | 0.00 | % | $ | 44,021 | 0.00 | % | ||||||
| Interest-bearing demand deposits |
38,198 | 0.09 | % | 36,551 | 0.30 | % | 35,048 | 0.41 | % | |||||||||
| Money market |
87,427 | 1.58 | % | 69,251 | 2.10 | % | 63,927 | 3.45 | % | |||||||||
| Savings |
26,241 | 0.06 | % | 25,607 | 0.25 | % | 25,513 | 0.28 | % | |||||||||
| Time |
255,123 | 3.64 | % | 230,773 | 4.29 | % | 203,671 | 4.42 | % | |||||||||
| $ | 458,453 | 2.34 | % | $ | 409,456 | 2.82 | % | $ | 372,180 | 3.07 | % | |||||||
28
Table of Contents
| MID PENN BANCORP, INC. | Management’s Discussion and Analysis |
The maturity distribution of time deposits of $100,000 or more is reflected in Table 13.
TABLE 13: MATURITY OF TIME DEPOSITS $100,000 OR MORE
| (Dollars in thousands) | December 31, | ||||||||
| 2009 | 2008 | 2007 | |||||||
| Three months or less |
$ | 22,712 | $ | 12,446 | $ | 8,536 | |||
| Over three months to twelve months |
37,443 | 38,264 | 19,952 | ||||||
| Over twelve months |
25,682 | 22,682 | 15,453 | ||||||
| $ | 85,837 | $ | 73,392 | $ | 43,941 | ||||
Capital Resources
Shareholders’ equity, or capital, is evaluated in relation to total assets and the risk associated with those assets. The detailed computation of the Bank’s regulatory capital ratios can be found in Note 18 of Item 8, Notes to Consolidated Financial Statements. The greater a corporation’s capital resources, the more likely it is to meet its cash obligations and absorb unforeseen losses. Too much capital, however, indicates that not enough of the corporation’s earnings have been paid to shareholders and the buildup makes it difficult for a corporation to offer a competitive return on the shareholders’ capital going forward. For these reasons capital adequacy has been, and will continue to be, of paramount importance.
Capital growth is achieved primarily by retaining more earnings than are paid out to shareholders. Shareholders’ equity decreased in 2009 by $4,186,000 or 8.2%, following an increase in 2008 by $10,466,000 or 25.8%, and an increase of $1,359,000 or 3.5% in 2007. Capital was negatively impacted in 2009 by the net loss of $2,809,000 and the payment of cash dividends to common shareholders of $1,809,000. Capital was positively impacted in 2008 by the addition of $10,000,000 from the U.S. Treasury’s Capital Purchase Program. The program was designed to provide well-capitalized, secure financial institutions with additional capital in order to increase the flow of credit into the economy. The program details are discussed in the following section.
Mid Penn’s normal intent for dividend payout is to provide quarterly cash returns to shareholders and earnings retention at a level sufficient to finance future growth. The dividend payout ratio, which represents the percentage of annual net income returned to shareholders in the form of cash dividends was 77% for 2008 and 60% for 2007. During the fourth quarter of 2009, Mid Penn suspended the quarterly cash dividend consistent with Federal Reserve Board policy that dividend payouts should not exceed net income for the previous four quarters, net of dividends paid during that period. Mid Penn presently plans to resume a quarterly cash dividend payment to common shareholders when it is prudent to do so consistent with this Federal Reserve policy.
In December of 2008, Mid Penn retired its treasury stock.
Capital Purchase Program Participation
On December 19, 2008, Mid Penn Bancorp, Inc., Inc. (the “Corporation”) entered into an agreement (including the Securities Purchase Agreement – Standard Terms) (the “Purchase Agreement”) with the United States Department of the Treasury (the “Treasury”) pursuant to which the Treasury invested $10,000,000 in the Corporation under the Treasury’s Capital Purchase Program (the “CPP”).
Under the Purchase Agreement, the Treasury received (1) 10,000 shares of Series A Fixed Rate Cumulative Perpetual Preferred Stock, $1,000 liquidation preference, and (2) Warrants to purchase up to 73,099 shares of the Corporation’s common stock at an exercise price of $20.52 per share.
The preferred shares pay cumulative dividends at a rate of 5% per annum for the first five years and 9% per annum thereafter. The preferred shares are non-voting, other than class voting rights on certain matters that could adversely affect the preferred shares. If dividends on the preferred shares have not been paid for an aggregate of six quarterly dividend periods or more, whether consecutive or not, the Corporation’s authorized number of directors will automatically be increased by two, and holders of the preferred stock, voting together with holders of any then outstanding parity stock, will have the right to elect those directors at the Corporation’s next annual meeting of shareholders or special meeting of shareholders called for that purpose. These preferred share directors would be elected annually and serve until all accrued and unpaid dividends on the preferred shares have been paid.
Pursuant to the American Recovery and Reinvestment Act of 2009 (“ARRA”), the Secretary of the Treasury shall permit, subject to consultation with the appropriate Federal banking agency, the Corporation to redeem the Series A Preferred Stock. The Corporation may do so without regard to the source of the funds to be used to redeem the Series A Preferred Stock or any minimum waiting period. If the Corporation elects to redeem the Series A Preferred Stock prior to February 15, 2012, and receives approval from the Treasury and the Board of Governors of the Federal Reserve System, it must redeem at least $2,500,000 of the Series A Preferred Stock. Upon redemption of the Series A Preferred Stock, the Secretary of the Treasury is required to liquidate the warrants associated with the Corporation’s participation in the CPP at the current market price. Any redemption is subject to the consent of the Board of Governors of the Federal Reserve System. Until December 19, 2011, or
29
Table of Contents
| MID PENN BANCORP, INC. | Management’s Discussion and Analysis |
such earlier time as all preferred shares have been redeemed by the Corporation or transferred by Treasury to third parties that are not affiliated with Treasury, the Corporation may not, without Treasury’s consent, increase its dividend rate per share of common stock above the per share quarterly amount in effect immediately prior to October 14, 2008 ($0.20 per share) or, with certain limited exceptions, repurchase its common stock.
The warrants are immediately exercisable and have a 10-year term. The exercise price and number of shares subject to the warrants are both subject to anti-dilution adjustments. Treasury has agreed not to exercise voting power with respect to any shares of common stock issued upon exercise of the warrants; however, this agreement not to vote the shares does not apply to any person who may acquire such shares.
The preferred shares and the warrants were issued in a private placement exempt from registration pursuant to Section 4(2) of the Securities Act of 1933. The Corporation has filed a shelf registration statement covering the preferred shares, the warrants, and the common stock underlying the warrants. Treasury and other future holders of the preferred shares, the warrants, or the common stock issued pursuant to the warrants also have piggyback and demand registration rights with respect to these securities. None of the preferred shares, the warrants, or the shares issuable upon exercise of the warrants are subject to any contractual restrictions on transfer.
In the Purchase Agreement, the Corporation agreed that, until such time as the Treasury ceases to own any securities acquired from Mid Penn pursuant to the Purchase Agreement, the Corporation will take all necessary action to ensure that benefit plans with respect to our senior executive officers comply with Section 111(b) of the Emergency Economic Stability Act of 2008 (the “EESA”) and applicable guidance or regulations issued by the Secretary of the Treasury. The applicable executive compensation requirements apply to the compensation of the Corporation’s Chief Executive Officer, Chief Financial Officer, and certain other highly compensated executive officers.
These requirements, the compliance of which must be annually certified by Mid Penn’s chief executive officer and chief financial officer, include:
| 1. | limits on compensation that exclude incentives for senior executive officers of Mid Penn to take unnecessary and excessive risks that threaten the value of Mid Penn during the period in which any obligation arising from financial assistance provided under the TARP remains outstanding; |
| 2. | a provision for the recovery by Mid Penn of any bonus, retention award, or incentive compensation paid to a senior executive officer and any of the next 20 most highly-compensated employees of Mid Penn based on statements of earnings, revenues, gains, or other criteria that are later found to be materially inaccurate; |
| 3. | a prohibition on Mid Penn making any golden parachute payment to a senior executive officer or any of the next five most highly-compensated employees of Mid Penn during the period in which any obligation arising from financial assistance provided under the TARP remains outstanding; |
| 4. | a prohibition on Mid Penn paying or accruing any bonus, retention award, or incentive compensation to the most highly compensated employees of Mid Penn during the period in which any obligation arising from financial assistance provided under the TARP remains outstanding, except that any prohibition shall not apply to the payment of long-term restricted stock by Mid Penn, provided that such long-term restricted stock – |
| i. | Does not fully vest during the period in which any obligation arising from financial assistance provided to Mid Penn remains outstanding; |
| ii. | Has a value in an amount that is not greater than one-third of the total amount of annual compensation of the employee receiving the stock; and |
| iii. | Is subject to such other terms and conditions as the Secretary of the Treasury may determine is in the public interest; |
| 5. | a prohibition on any compensation plan that would encourage manipulation of the reported earnings of Mid Penn to enhance the compensation of any of its employees; and |
| 6. | a requirement that Mid Penn’s compensation committee remains entirely independent and meets at least semiannually to discuss and evaluate employee compensation plans in light of an assessment of any risk posed to Mid Penn from such plans. |
In compliance with the EESA and ARRA, on February 27, 2009, Rory G. Ritrievi entered into a Capital Purchase Plan Executive Compensation Restriction Agreement with Mid Penn Bancorp, Inc., Inc. and Mid Penn Bank (the “Agreement”). The Agreement prohibits, during the period which any obligation to the Federal Government remains outstanding, any payment to Mr. Ritrievi (including bonus payments and payments upon a termination) which would violate the EESA and ARRA, despite Mr. Ritrievi having an employment agreement requiring payments upon certain terminations.
In addition to these requirements, Mid Penn must have in place a company-wide policy regarding excessive or luxury expenditures and must permit a separate nonbinding shareholder vote to approve the compensation of executives as disclosed pursuant to the compensation disclosure rules of the Securities and Exchange Commission. Mid Penn has adopted such a luxury and expense policy and it appears on the Corporation’s website at www.midpennbank.com.
30
Table of Contents
| MID PENN BANCORP, INC. | Management’s Discussion and Analysis |
Federal Income Taxes
Federal income tax benefit for 2009 was $2,208,000 compared to the federal income tax expenses of $1,104,000 and $1,394,000 in 2008 and 2007, respectively. The effective tax rate was 49% for 2009, 24% for 2008 and 23% for 2007.
The tax benefit was related to a loss stemming from the increased provision for loan losses and increased noninterest expenses during 2009 versus 2008. Generally, our effective tax rate is below the statutory rate due to earnings on tax-exempt loans, investments, and bank-owned life insurance, and the impact of tax credits. The realization of deferred tax assets is dependent on future earnings. As a result of Mid Penn’s adoption of ASC Topic 740, Income Taxes, no significant income tax uncertainties were identified; therefore, Mid Penn recognized no adjustment for unrealized income tax benefits for the periods ended December 31, 2009 and December 31, 2008. We currently anticipate that future earnings will be adequate to fully utilize deferred tax assets.
Liquidity
Mid Penn’s asset-liability management policy addresses the management of Mid Penn’s liquidity position and its ability to raise sufficient funds to meet deposit withdrawals, fund loan growth and meet other operational needs. Mid Penn utilizes its investments as a source of liquidity, along with deposit growth and increases in repurchase agreements and borrowings. (See Deposits and Other Funding Sources which appears earlier in this discussion.) Liquidity from investments is provided primarily through investments and interest-bearing balances with maturities of one year or less. Funds are available to Mid Penn through loans from the Federal Home Loan Bank and established federal funds (overnight) lines of credit. Mid Penn’s major source of funds is its core deposit base.
Major sources of cash in 2009 came from the net increase in deposits of $63,191,000, as well as the proceeds from investment securities and interest-bearing balances of $15,360,000 and $11,472,000, respectively.
The major use of cash in 2009 was the net increase in loans and leases of $53,528,000. Another major use of cash in 2009 was the repayment of $17,166,000 in long-term debt. Other significant uses of cash included the purchase of investment securities of $9,354,000, the purchase of premises and equipment of $2,647,000, and the payment of $1,809,000 in common stock cash dividends.
Major sources of cash in 2008 came from the net increase in deposits of $64,007,000, as well as the proceeds from investment securities and long-term borrowings of $18,420,000 and $15,795,000, respectively. Another major source of funds was the proceeds from the U.S. Treasury’s Capital Purchase Program of $10,000,000.
The major use of cash in 2008 was a net increase in loans and leases of $59,586,000. Other major uses of cash included the purchase of investment securities of $16,897,000, the increase in interest-bearing balances of $3,263,000, the payment of $2,787,000 in cash dividends, and the purchase of bank premises and equipment of $1,587,000.
Aggregate Contractual Obligations
Table 14 represents Mid Penn’s on-and-off balance sheet aggregate contractual obligations to make future payments as of December 31, 2009:
TABLE 14: AGGREGATE CONTRACTUAL OBLIGATIONS
| (Dollars in thousands) | Payments Due by Period | ||||||||||||||||
| Note Reference |
Total | One Year or Less |
One to Three Years |
Three to Five Years |
More than Five Years | ||||||||||||
| Certificates of deposit |
10 | $ | 268,460 | $ | 170,957 | $ | 79,407 | $ | 15,503 | $ | 2,593 | ||||||
| Short-term borrowings |
11 | 16,044 | 16,044 | — | — | — | |||||||||||
| Long-term debt |
12 | 38,057 | 10,000 | 19,258 | 5,000 | 3,799 | |||||||||||
| Operating lease obligations |
20 | 427 | 79 | 163 | 158 | 27 | |||||||||||
| Payments under benefit plans |
14 | 1,334 | 94 | 208 | 244 | 788 | |||||||||||
| $ | 324,322 | $ | 197,174 | $ | 99,036 | $ | 20,905 | $ | 7,207 | ||||||||
We are not aware of any other commitments or contingent liabilities which may have a material adverse impact on Mid Penn’s liquidity or capital resources.
31
Table of Contents
| MID PENN BANCORP, INC. | Management’s Discussion and Analysis |
Effects of Inflation
A bank’s asset and liability structure is substantially different from that of an industrial company in that virtually all assets and liabilities of a bank are monetary in nature. Management believes the impact of inflation on its financial results depends principally upon Mid Penn’s ability to manage the balance sheet sensitivity to changes in interest rates and, by such reaction, mitigate the inflationary impact on performance. Interest rates do not necessarily move in the same direction or at the same magnitude as the prices of other goods and services. As discussed previously, Management seeks to manage the relationship between interest sensitive assets and liabilities in order to protect against wide interest rate fluctuations, including those resulting from inflation.
Information shown elsewhere in this Annual Report will assist in the understanding of how Mid Penn is positioned to react to changing interest rates and inflationary trends. In particular, the summary of net liabilities, as well as the composition of loans, investments and deposits should be considered.
Off-Balance Sheet Items
Mid Penn makes contractual commitments to extend credit and extends lines of credit, which are subject to Mid Penn’s credit approval and monitoring procedures.
As of December 31, 2009, commitments to extend credit amounted to $116,486,000 as compared to $98,034,000 as of December 31, 2008.
Mid Penn also issues financial standby letters of credit to its customers. The risk associated with financial standby letters of credit is essentially the same as the credit risk involved in loan extensions to customers. Financial standby letters of credit increased to $10,697,000 at December 31, 2009, from $10,517,000 at December 31, 2008.
Comprehensive (Loss) Income
Comprehensive (Loss) Income is a measure of all changes in equity of a corporation, excluding transactions with owners in their capacity as owners (such as proceeds from issuances of stock and dividends). The difference between Net (Loss) Income and Comprehensive (Loss) Income is termed “Other Comprehensive (Loss) Income.” For Mid Penn, Other Comprehensive (Loss) Income consists primarily of unrealized gains and losses on available for sale securities, net of deferred income tax. Other Comprehensive (Loss) Income also includes a pension component in accordance with ASC Topic 715. Comprehensive (Loss) Income should not be construed to be a measure of Net (Loss) Income. The amount of unrealized gains or losses reflected in Comprehensive (Loss) Income may vary widely at statement dates depending on the markets as a whole and how interest rate movements affect the market value of the portfolio of available for sale securities. Other Comprehensive (Loss) Income for the years ended December 31, 2009, 2008 and 2007 was $369,000, $120,000, and ($33,000), respectively.
ITEM 7A. QUANTITATIVE AND QUALITATIVE DISCLOSURES ABOUT MARKET RISK
As a financial institution, Mid Penn’s primary source of market risk is interest rate risk. Interest rate risk is the exposure to fluctuations in Mid Penn’s future earnings (earnings at risk) resulting from changes in interest rates. This exposure or sensitivity is a function of the repricing characteristics of Mid Penn’s portfolio of assets and liabilities. Each asset and liability reprices either at maturity or during the life of the instrument. Interest rate sensitivity is measured as the difference between the volume of assets and liabilities that are subject to repricing in a future period of time.
The principal purpose of asset-liability management is to maximize current and future net interest income within acceptable levels of interest rate risk while satisfying liquidity and capital requirements. Net interest income is increased by increasing the net interest margin and by volume growth. Thus the goal of interest rate risk management is to maintain a balance between risk and reward such that net interest income is maximized while risk is maintained at an acceptable level.
Mid Penn utilizes an asset-liability management model to measure the impact of interest rate movements on its interest rate sensitivity position. Mid Penn’s management also reviews the traditional maturity gap analysis regularly. Mid Penn does not always attempt to achieve an exact match between interest sensitive assets and liabilities because it believes that an actively managed amount of interest rate risk is inherent and appropriate in the management of the Corporation’s profitability.
Modeling techniques and simulation analysis involve assumptions and estimates that inherently cannot be measured with complete precision. Key assumptions in the analyses include maturity and repricing characteristics of assets and liabilities, prepayments on amortizing assets, non-maturing deposit sensitivity, and loan and deposit pricing. These assumptions are inherently uncertain due to the timing, magnitude and frequency of rate changes and changes in market conditions and management strategies, among other factors. However, the analyses are useful in quantifying risk and provide a relative gauge of Mid Penn’s interest rate risk position over time.
Management reviews interest rate risk on a quarterly basis. This analysis includes earnings scenarios whereby interest rates are increased and decreased by 100, 200, and 300 basis points. These scenarios, detailed in Table 15, indicate that there would not be a significant variance in net
32
Table of Contents
| MID PENN BANCORP, INC. | Management’s Discussion and Analysis |
interest income over a one-year time frame due to interest rate changes; however, actual results could vary significantly from the calculations prepared by Management. At December 31, 2009, all interest rate risk levels according to the model were within the tolerance limits of Board approved policy. In addition, the table does not take into consideration changes, which Management would make to realign its portfolio in the event of a changing rate environment.
TABLE 15: EFFECT OF HYPOTHETICAL CHANGES IN INTEREST RATES
| December 31, 2009 |
December 31, 2008 | |||||||||||
| Change in Basis Points |
% Change in Net Interest Income |
Risk Limit |
Change in Basis Points |
% Change in Net Interest Income |
Risk Limit | |||||||
| 300 |
12.59% | +/- 25% | 300 | -11.97% | +/- 25% | |||||||
| 200 |
8.42% | +/- 15% | 200 | -7.89% | +/- 15% | |||||||
| 100 |
4.17% | +/- 10% | 100 | -4.02% | +/- 10% | |||||||
| 0 |
0 | |||||||||||
| (100) |
-4.17% | +/- 10% | (100) | 3.99% | +/- 10% | |||||||
| (200) |
-8.41% | +/- 15% | (200) | 7.76% | +/- 15% | |||||||
| (300) |
-12.59% | +/- 25% | (300) | 11.69% | +/- 25% | |||||||
33
Table of Contents
MID PENN BANCORP, INC.
ITEM 8. FINANCIAL STATEMENTS AND SUPPLEMENTARY DATA
The following audited financial statements are set forth in this Annual Report of Form 10-K on the following pages:
Index to Financial Statements and Supplementary Data
| 35 | ||
| 36 | ||
| 37 | ||
| 38 | ||
| 39 | ||
| 41 | ||
34
Table of Contents
Report of Independent Registered Public Accounting Firm
To the Board of Directors and Shareholders
Mid Penn Bancorp, Inc., Inc.
We have audited the accompanying consolidated balance sheets of Mid Penn Bancorp, Inc., Inc. and subsidiaries (the “Corporation”) as of December 31, 2009 and 2008, and the related consolidated statements of operations, changes in shareholders’ equity, and cash flows for each of the years in the three-year period ended December 31, 2009. The Corporation’s management is responsible for these consolidated financial statements. Our responsibility is to express an opinion on these consolidated financial statements based on our audits.
We conducted our audits in accordance with the standards of the Public Company Accounting Oversight Board (United States). Those standards require that we plan and perform the audit to obtain reasonable assurance about whether the financial statements are free of material misstatement. An audit includes examining, on a test basis, evidence supporting the amounts and disclosures in the financial statements. An audit also includes assessing the accounting principles used and significant estimates made by management, as well as evaluating the overall financial statement presentation. We believe that our audits provide a reasonable basis for our opinion.
In our opinion, the consolidated financial statements referred to above present fairly, in all material respects, the financial position of the Corporation as of December 31, 2009 and 2008, and the results of their operations and their cash flows for each of the years in the three-year period ended December 31, 2009 in conformity with accounting principles generally accepted in the United States of America.
We also have audited, in accordance with the standards of the Public Company Accounting Oversight Board (United States), the effectiveness of the Corporation’s internal control over financial reporting as of December 31, 2009, based on criteria established in Internal Control – Integrated Framework issued by the Committee of Sponsoring Organizations of the Treadway Commission (“COSO”), and our report dated March 16, 2010 expressed an unqualified opinion.

ParenteBeard LLC
Harrisburg, Pennsylvania
March 16, 2010
35
Table of Contents
| MID PENN BANCORP, INC. | Consolidated Balance Sheet |
| (Dollars in thousands, except share data) | December 31, | |||||||
| 2009 | 2008 | |||||||
| ASSETS |
||||||||
| Cash and due from banks |
$ | 7,526 | $ | 7,478 | ||||
| Interest-bearing balances with other financial institutions |
1,434 | 970 | ||||||
| Total cash and cash equivalents |
8,960 | 8,448 | ||||||
| Interest-bearing time deposits with other financial institutions |
38,604 | 50,076 | ||||||
| Available for sale investment securities |
47,345 | 52,739 | ||||||
| Loans and leases, net of unearned interest |
480,385 | 434,643 | ||||||
| Less: Allowance for loan and lease losses |
(7,686 | ) | (5,505 | ) | ||||
| Net loans and leases |
472,699 | 429,138 | ||||||
| Bank premises and equipment, net |
12,904 | 11,377 | ||||||
| Restricted investment in bank stocks |
4,029 | 3,618 | ||||||
| Foreclosed assets held for sale |
663 | 1,516 | ||||||
| Accrued interest receivable |
2,781 | 2,747 | ||||||
| Deferred income taxes |
2,257 | 2,150 | ||||||
| Goodwill |
1,016 | 1,016 | ||||||
| Core deposit and other intangibles, net |
369 | 406 | ||||||
| Cash surrender value of life insurance |
7,368 | 7,437 | ||||||
| Other assets |
7,015 | 2,331 | ||||||
| Total Assets |
$ | 606,010 | $ | 572,999 | ||||
| LIABILITIES & SHAREHOLDERS’ EQUITY |
||||||||
| Deposits: |
||||||||
| Noninterest bearing demand |
$ | 55,943 | $ | 48,602 | ||||
| Interest bearing demand |
42,148 | 39,048 | ||||||
| Money Market |
107,295 | 75,750 | ||||||
| Savings |
26,169 | 25,364 | ||||||
| Time |
268,460 | 248,060 | ||||||
| Total Deposits |
500,015 | 436,824 | ||||||
| Short-term borrowings |
16,044 | 23,977 | ||||||
| Long-term debt |
38,057 | 55,223 | ||||||
| Accrued interest payable |
1,750 | 2,411 | ||||||
| Other liabilities |
3,440 | 3,674 | ||||||
| Total Liabilities |
559,306 | 522,109 | ||||||
| Shareholders’ Equity: |
||||||||
| Preferred stock, par value $1,000; authorized 10,000,000 shares; 5% cumulative dividend; 10,000 shares issued and outstanding at December 31, 2009 and December 31, 2008 |
10,000 | 10,000 | ||||||
| Common stock, par value $1 per share; 10,000,000 shares authorized; 3,479,780 shares issued and outstanding at December 31, 2009 and December 31, 2008 |
3,480 | 3,480 | ||||||
| Additional paid-in capital |
29,824 | 29,838 | ||||||
| Retained earnings |
2,627 | 7,168 | ||||||
| Accumulated other comprehensive income |
773 | 404 | ||||||
| Total Shareholders’ Equity |
46,704 | 50,890 | ||||||
| Total Liabilities and Shareholders’ Equity |
$ | 606,010 | $ | 572,999 | ||||
The accompanying notes are an integral part of these consolidated financial statements.
36
Table of Contents
| MID PENN BANCORP, INC. | Consolidated Statements of Operations |
| (Dollars in thousands, except per share data) | Years Ended December 31, | |||||||||
| 2009 | 2008 | 2007 | ||||||||
| INTEREST INCOME |
||||||||||
| Interest & fees on loans and leases |
$ | 28,039 | $ | 27,141 | $ | 26,357 | ||||
| Interest on interest-bearing balances |
1,460 | 2,499 | 2,546 | |||||||
| Interest and dividends on investment securities: |
||||||||||
| U.S. Treasury and government agencies |
652 | 819 | 944 | |||||||
| State and political subdivision obligations, tax-exempt |
1,171 | 1,251 | 1,361 | |||||||
| Other securities |
13 | 146 | 203 | |||||||
| Interest on federal funds sold and securities purchased under agreements to resell |
1 | — | 33 | |||||||
| Total Interest Income |
31,336 | 31,856 | 31,444 | |||||||
| INTEREST EXPENSE |
||||||||||
| Interest on deposits |
10,726 | 11,532 | 11,430 | |||||||
| Interest on short-term borrowings |
112 | 608 | 1,049 | |||||||
| Interest on long-term debt |
2,466 | 2,750 | 2,860 | |||||||
| Total Interest Expense |
13,304 | 14,890 | 15,339 | |||||||
| Net Interest Income |
18,032 | 16,966 | 16,105 | |||||||
| PROVISION FOR LOAN AND LEASE LOSSES |
9,520 | 1,230 | 925 | |||||||
| Net Interest Income After Provision for Loan and Lease Losses |
8,512 | 15,736 | 15,180 | |||||||
| NONINTEREST INCOME |
||||||||||
| Trust department income |
243 | 313 | 319 | |||||||
| Service charges on deposits |
1,479 | 1,654 | 1,499 | |||||||
| Earnings from cash surrender value of life insurance |
280 | 267 | 271 | |||||||
| Gain on life insurance proceeds |
158 | — | — | |||||||
| Mortgage banking income |
124 | 78 | 77 | |||||||
| Other income |
1,372 | 1,370 | 1,315 | |||||||
| Total Noninterest Income |
3,656 | 3,682 | 3,481 | |||||||
| NONINTEREST EXPENSE |
||||||||||
| Salaries and employee benefits |
8,173 | 7,197 | 6,554 | |||||||
| Severance expense |
— | 478 | — | |||||||
| Occupancy expense, net |
844 | 967 | 868 | |||||||
| Equipment expense |
1,170 | 870 | 828 | |||||||
| Pennsylvania Bank Shares tax expense |
366 | 315 | 329 | |||||||
| FDIC Assessment |
1,163 | 116 | 43 | |||||||
| Legal and professional fees |
814 | 769 | 562 | |||||||
| Director fees and benefits expense |
293 | 354 | 322 | |||||||
| Marketing and advertising expense |
679 | 525 | 403 | |||||||
| Computer expense |
435 | 319 | 350 | |||||||
| Telephone expense |
302 | 193 | 115 | |||||||
| Loss on sale/write-down of foreclosed assets |
110 | 281 | — | |||||||
| Intangible amortization |
65 | 66 | 66 | |||||||
| Other expenses |
2,257 | 2,276 | 2,156 | |||||||
| Total Noninterest Expense |
16,671 | 14,726 | 12,596 | |||||||
| (LOSS) INCOME BEFORE (BENEFIT FROM) PROVISION FOR |
||||||||||
| INCOME TAXES |
(4,503 | ) | 4,692 | 6,065 | ||||||
| (Benefit from) provision for income taxes |
(2,208 | ) | 1,104 | 1,394 | ||||||
| NET (LOSS) INCOME |
(2,295 | ) | 3,588 | 4,671 | ||||||
| Preferred stock dividends and discount accretion |
514 | 16 | — | |||||||
| NET (LOSS) INCOME AVAILABLE TO COMMON SHAREHOLDERS |
$ | (2,809 | ) | $ | 3,572 | $ | 4,671 | |||
| PER COMMON SHARE DATA: |
||||||||||
| Basic (Loss) Earnings Per Common Share |
$ | (0.81 | ) | $ | 1.03 | $ | 1.34 | |||
| Diluted (Loss) Earnings Per Common Share |
(0.81 | ) | 1.03 | 1.34 | ||||||
| Cash Dividends |
0.52 | 0.80 | 0.80 | |||||||
The accompanying notes are an integral part of these consolidated financial statements.
37
Table of Contents
| MID PENN BANCORP, INC. | Consolidated Statements of Changes in Shareholder’s Equity |
FOR YEARS ENDED DECEMBER 31, 2009, 2008 AND 2007
| (Dollars in thousands, except share data) | Preferred Stock |
Common Stock |
Additional Paid-in Capital |
Retained Earnings |
Accumulated Other Comprehensive Income |
Treasury Stock |
Total Shareholder’s Equity |
||||||||||||||||||||
| Balance, December 31, 2006 |
$ | 0 | $ | 3,367 | $ | 27,452 | $ | 8,583 | $ | 317 | ($ | 634 | ) | $ | 39,085 | ||||||||||||
| Comprehensive income: |
|||||||||||||||||||||||||||
| Net income |
— | — | — | 4,671 | — | — | 4,671 | ||||||||||||||||||||
| Change in net unrealized gain (loss) on securities available for sale, net of reclassification adjustment and tax effects |
— | — | — | — | 143 | — | 143 | ||||||||||||||||||||
| Defined benefit plans, net of tax effects |
— | — | — | — | (176 | ) | — | (176 | ) | ||||||||||||||||||
| Total comprehensive income |
4,638 | ||||||||||||||||||||||||||
| Cash dividends ($0.80 per share) |
— | — | — | (2,773 | ) | — | — | (2,773 | ) | ||||||||||||||||||
| Stock dividend 5% issued February 2007 |
— | 166 | 3,655 | (3,821 | ) | — | — | — | |||||||||||||||||||
| Purchase of treasury stock (20,668 shares) |
— | — | — | — | — | (506 | ) | (506 | ) | ||||||||||||||||||
| Balance, December 31, 2007 |
— | 3,533 | 31,107 | 6,660 | 284 | (1,140 | ) | 40,444 | |||||||||||||||||||
| Cumulative effect adjustment of accounting principle adoption of ASC Topic 715 |
— | — | — | (277 | ) | — | — | (277 | ) | ||||||||||||||||||
| Balance, January 1, 2008 |
— | 3,533 | 31,107 | 6,383 | 284 | (1,140 | ) | 40,167 | |||||||||||||||||||
| Comprehensive income: |
|||||||||||||||||||||||||||
| Net income |
— | — | — | 3,588 | — | — | 3,588 | ||||||||||||||||||||
| Change in net unrealized gain (loss) on securities available for sale, net of reclassification adjustment and tax effects |
— | — | — | — | 120 | — | 120 | ||||||||||||||||||||
| Total comprehensive income |
3,708 | ||||||||||||||||||||||||||
| Cash dividends ($0.80 per share) |
(2,787 | ) | (2,787 | ) | |||||||||||||||||||||||
| Issuance of preferred stock and warrants |
10,000 | — | 70 | — | — | — | 10,070 | ||||||||||||||||||||
| Accrued preferred dividends |
— | — | — | (16 | ) | — | — | (16 | ) | ||||||||||||||||||
| Purchase of treasury stock (9,854 shares) |
— | — | — | — | — | (252 | ) | (252 | ) | ||||||||||||||||||
| Cancellation of treasury stock |
— | (53 | ) | (1,339 | ) | — | — | 1,392 | — | ||||||||||||||||||
| Balance, December 31, 2008 |
10,000 | 3,480 | 29,838 | 7,168 | 404 | — | 50,890 | ||||||||||||||||||||
| Comprehensive loss: |
|||||||||||||||||||||||||||
| Net loss |
— | — | — | (2,295 | ) | — | — | (2,295 | ) | ||||||||||||||||||
| Change in net unrealized gain (loss) on securities available for sale, net of reclassification adjustment and tax effects |
— | — | — | — | 263 | — | 263 | ||||||||||||||||||||
| Defined benefit plans, net of tax effects |
— | — | — | — | 106 | — | 106 | ||||||||||||||||||||
| Total comprehensive loss |
(1,926 | ) | |||||||||||||||||||||||||
| Cash dividends ($0.52 per share) |
(1,809 | ) | (1,809 | ) | |||||||||||||||||||||||
| Preferred dividends |
— | — | — | (437 | ) | — | — | (437 | ) | ||||||||||||||||||
| Amortization of warrant cost |
— | — | (14 | ) | — | — | — | (14 | ) | ||||||||||||||||||
| Balance, December 31, 2009 |
$ | 10,000 | $ | 3,480 | $ | 29,824 | $ | 2,627 | $ | 773 | $ | 0 | $ | 46,704 | |||||||||||||
The accompanying notes are an integral part of these consolidated financial statements.
38
Table of Contents
| MID PENN BANCORP, INC. | Consolidated Statements of Cash Flows |
| (Dollars in thousands) | Years Ended December 31, | |||||||||||
| 2009 | 2008 | 2007 | ||||||||||
| Operating Activities: |
||||||||||||
| Net (Loss) Income |
$ | (2,295 | ) | $ | 3,588 | $ | 4,671 | |||||
| Adjustments to reconcile net (loss) income to net cash provided by operating activities: |
||||||||||||
| Provision for loan and lease losses |
9,520 | 1,230 | 925 | |||||||||
| Depreciation |
1,115 | 848 | 809 | |||||||||
| Amortization of core deposit intangible |
37 | 66 | 56 | |||||||||
| Net accretion of security discounts |
(212 | ) | (9 | ) | (25 | ) | ||||||
| Earnings on cash surrender value of life insurance |
(280 | ) | (476 | ) | 193 | |||||||
| Gain from life insurance proceeds |
(158 | ) | — | — | ||||||||
| Loss on disposal of property, plant, and equipment |
5 | — | — | |||||||||
| Loss on sale / write-down of foreclosed assets |
110 | 281 | 9 | |||||||||
| Deferred income tax benefit |
(243 | ) | (160 | ) | (427 | ) | ||||||
| (Increase) decrease in accrued interest receivable |
(34 | ) | 71 | 4 | ||||||||
| Increase in other assets |
(4,593 | ) | (828 | ) | (661 | ) | ||||||
| (Decrease) increase in accrued interest payable |
(661 | ) | 421 | 78 | ||||||||
| (Decrease) increase in other liabilities |
(218 | ) | 805 | (172 | ) | |||||||
| Net Cash Provided By Operating Activities |
2,093 | 5,837 | 5,460 | |||||||||
| Investing Activities: |
||||||||||||
| Net decrease (increase) in interest-bearing balances |
11,472 | (3,263 | ) | 108 | ||||||||
| Proceeds from the maturity of investment securities |
15,360 | 18,420 | 10,074 | |||||||||
| Purchases of investment securities |
(9,354 | ) | (16,897 | ) | (6,645 | ) | ||||||
| Purchases of restricted investment in bank stock |
(411 | ) | (3,618 | ) | — | |||||||
| Net increase in loans and leases |
(53,528 | ) | (59,546 | ) | (19,385 | ) | ||||||
| Purchases of bank premises and equipment |
(2,647 | ) | (1,587 | ) | (1,885 | ) | ||||||
| Proceeds from sale of foreclosed assets |
1,190 | 248 | 137 | |||||||||
| Proceeds from cash surrender value of life insurance |
507 | — | — | |||||||||
| Net Cash Used In Investing Activities |
(37,411 | ) | (66,243 | ) | (17,596 | ) | ||||||
| Financing Activities: |
||||||||||||
| Net increase in demand deposits and savings accounts |
42,791 | 17,962 | 8,433 | |||||||||
| Net increase in time deposits |
20,400 | 46,045 | 158 | |||||||||
| Net (decrease) increase in short-term borrowings |
(7,933 | ) | (13,372 | ) | 13,074 | |||||||
| Issued senior preferred stock |
— | 10,000 | — | |||||||||
| Preferred stock dividend paid |
(453 | ) | — | — | ||||||||
| Common stock dividend paid |
(1,809 | ) | (2,787 | ) | (2,773 | ) | ||||||
| Long-term debt repayment |
(17,166 | ) | (15,153 | ) | (5,132 | ) | ||||||
| Purchase of treasury stock |
— | (252 | ) | (506 | ) | |||||||
| Proceeds from long-term debt |
— | 15,795 | — | |||||||||
| Net Cash Provided By Financing Activities |
35,830 | 58,238 | 13,254 | |||||||||
| Net increase (decrease) in cash and cash equivalents |
512 | (2,168 | ) | 1,118 | ||||||||
| Cash and cash equivalents, beginning of period |
8,448 | 10,616 | 9,498 | |||||||||
| Cash and cash equivalents, end of period |
$ | 8,960 | $ | 8,448 | $ | 10,616 | ||||||
39
Table of Contents
| MID PENN BANCORP, INC. | Consolidated Statements of Cash Flows |
| (Dollars in thousands) | Years Ended December 31, | ||||||||
| 2009 | 2008 | 2007 | |||||||
| Supplemental Disclosures of Cash Flow Information: |
|||||||||
| Interest paid |
$ | 13,965 | $ | 14,469 | $ | 15,261 | |||
| Income taxes paid |
$ | 50 | $ | 1,720 | $ | 1,930 | |||
| Supplemental Noncash Disclosures: |
|||||||||
| Transfers to foreclosed assets held for sale |
$ | 447 | $ | 1,556 | $ | 529 | |||
| Warrants issued |
$ | — | $ | 70 | $ | — | |||
| Cancelled treasury stock |
$ | — | $ | 1,392 | $ | — | |||
| Preferred dividend accrued |
$ | — | $ | 16 | $ | — | |||
The accompanying notes are an integral part of these consolidated financial statements.
40
Table of Contents
| MID PENN BANCORP, INC. | Notes to Consolidated Financial Statements |
| (1) | Basis of Presentation |
The accompanying consolidated financial statements include the accounts of Mid Penn Bancorp, Inc., Inc. and its wholly-owned subsidiaries Mid Penn Bank (“Bank”), Mid Penn Investment Corporation and Mid Penn Insurance Services, LLC, (collectively, “Mid Penn”). All material intercompany accounts and transactions have been eliminated in consolidation.
For comparative purposes, the December 31, 2008 and December 31, 2007 balances have been reclassified to conform to the 2009 presentation. Such reclassifications had no impact on net income.
Mid Penn has evaluated events and transactions occurring subsequent to the balance sheet date of December 31, 2009, for items that should potentially be recognized or disclosed in these consolidated financial statements. The evaluation was conducted through the date these consolidated financial statements were issued.
| (2) | Nature of Business |
The Bank engages in a full-service commercial banking and trust business, making available to the community a wide range of financial services, including, but not limited to, installment loans, mortgage and home equity loans, secured and unsecured commercial and consumer loans, lines of credit, construction financing, farm loans, community development loans, loans to non-profit entities and local government loans and various types of time and demand deposits, including but not limited to, checking accounts, savings accounts, clubs, money market deposit accounts, certificates of deposit and IRAs. In addition, the Bank provides a full range of trust services through its Trust Department. Deposits are insured by the Federal Deposit Insurance Corporation (“FDIC”) to the extent provided by law.
The financial services are provided to individuals, partnerships, non-profit organizations, and corporations through its fourteen offices located in Dauphin County, the southern portion of Northumberland County, the western portion of Schuylkill County and the eastern portion of Cumberland County.
Mid Penn Insurance Services, LLC provides title insurance. Due to the lack of activity within this subsidiary, the decision was made to exit this line of business effective December 31, 2009.
Mid Penn Investment Corporation is currently inactive.
| (3) | Summary of Significant Accounting Policies |
The accounting and reporting policies of Mid Penn conform with accounting principles generally accepted in the United States of America (“GAAP”) and to general practice within the financial industry. The following is a description of the more significant accounting policies.
| (a) | Use of Estimates |
The preparation of financial statements requires management to make estimates and assumptions that affect the reported amounts of assets and liabilities and disclosure of contingent assets and liabilities at the date of the financial statements and the reported amounts of revenues and expenses during the reporting periods. Actual results could differ from those estimates.
Material estimates that are particularly susceptible to significant change relate to the determination of the allowance for loan and lease losses, the valuation of deferred tax assets, the assessment of other-than-temporary impairment of investment securities, core deposit intangible and goodwill valuation, and the potential impairment of restricted stock.
| (b) | Investment Securities |
Available for Sale Securities - includes debt and equity securities. Debt and equity securities are reported at fair value, with unrealized holding gains and losses excluded from earnings and reported, net of deferred income taxes, as a component of accumulated other comprehensive income (loss) within shareholders’ equity. Realized gains and losses on sales of investment securities are computed on the basis of specific identification of the cost of each security. Mid Penn had no trading securities or held to maturity securities in 2009 or 2008.
| (c) | Loans |
Interest on loans is recognized on a method that approximates a level yield basis over the life of the loans. The accrual of interest on loans, including impaired loans, is generally discontinued when principal or interest has consistently been in default for a period of 90 days or more, or because of deterioration in the financial condition of the borrower, payment in full of principal or interest is not expected. Interest income is subsequently recognized only to the extent cash payments are
41
Table of Contents
| MID PENN BANCORP, INC. | Notes to Consolidated Financial Statements |
received. The placement of a loan on the nonaccrual basis for revenue recognition does not necessarily imply a potential charge-off of loan principal. Loan origination fees and certain direct origination costs are capitalized and recognized as an adjustment of the yield on the related loan.
| (d) | Allowance for Loan and Lease Losses |
The Bank’s methodology for determining the allowance for loan and lease losses employs both a quantitative and qualitative component. The quantitative portion of the allowance represents the results of the evaluation on individual classified and nonaccrual loans. Potential credit problems are monitored to determine whether specific loans are impaired, with impairment normally measured by reference to borrowers’ collateral values and estimated cash flows. An allowance for the remainder of the loan and lease portfolio is determined based on historical loss experience within certain components of the portfolio. These loss factors may be modified if current conditions indicate that loan losses may differ from historical experience.
The qualitative portion of the allowance for loan and lease losses represents the results of measuring potential losses inherent in the portfolio that are not identified in the quantitative allowance analysis. This qualitative portion is determined using risk factors that may not have yet manifested themselves in historical loan and lease loss experience. These risk factors include changes in economic conditions, fluctuations in loan quality measures, changes in the experience of the lending staff and loan review systems, growth or changes in the mix of loans originated, and shifting industry or portfolio concentrations.
Management believes the allowance for loan and lease losses is adequate. Identification of specific losses is an ongoing process using currently available information. Specifically, monthly management meetings to review “problem” loans and leases are utilized to determine a plan for collection and, if necessary, a recommendation to the Board of Directors for charge-off. Future additions to the allowance for loan and lease losses through a provision for loan and lease losses will be made based on identified changes in the above factors coupled with loss experience.
Various regulatory agencies, as an integral part of their examination process, periodically review the Bank’s allowance for loan and lease losses. These agencies may require the Bank to recognize changes to the allowance based on their judgment about information available to them at the time of their examinations.
| (e) | Bank Premises and Equipment |
Land is carried at cost. Buildings, furniture, fixtures, equipment, land improvements, and leasehold improvements are stated at cost less accumulated depreciation. Depreciation is computed by the straight-line method over the estimated useful lives of the assets. Building assets are depreciated using an estimated useful life of five to fifty years. Furniture, fixtures, and equipment are depreciated using an estimated useful life of three to ten years. Land improvements are depreciated over an estimated useful life of ten to twenty years. Leasehold improvements are depreciated using an estimated useful life that is the lesser of the remaining life of the lease or ten to thirty years. Maintenance and normal repairs are charged to expense when incurred, while major additions and improvements are capitalized. Gains and losses on disposals are reflected in current operations.
| (f) | Restricted Investment in Federal Home Loan Bank Stock |
The Bank owns restricted stock investments in the Federal Home Loan Bank (“FHLB”). Federal law requires a member institution of the FHLB to hold stock according to a predetermined formula. The stock is carried at cost. In December 2008, the FHLB of Pittsburgh notified member banks that it was suspending dividend payments and the repurchase of capital stock and as of December 31, 2009 has not changed its position.
Management evaluates the restricted stock for impairment on an annual basis. Management’s determination of whether these investments are impaired is based on their assessment of the ultimate recoverability of their cost rather than by recognizing temporary declines in value. The determination of whether a decline affects the ultimate recoverability of their cost is influenced by criteria such as (1) the significance of the decline in net assets of the FHLB as compared to the capital stock amount for the FHLB and the length of time this situation has persisted, (2) commitments by the FHLB to make payments required by law or regulation and the level of such payments in relation to the operating performance of the FHLB, and (3) the impact of legislative and regulatory changes on institutions and, accordingly, on the customer base of the FHLB.
Management believes no impairment charge is necessary related to the FHLB restricted stock as of December 31, 2009.
42
Table of Contents
| MID PENN BANCORP, INC. | Notes to Consolidated Financial Statements |
| (g) | Foreclosed Assets Held for Sale |
Foreclosed assets held for sale consist primarily of real estate acquired through, or in lieu of, foreclosure in settlement of debt and are recorded at fair value less cost to sell at the date of transfer, establishing a new cost basis. Any valuation adjustments required at the date of transfer are charged to the allowance for loan losses. Subsequent to acquisition, foreclosed assets are carried at fair value less costs of disposal, based upon periodic evaluations that consider changes in market conditions and development and disposal costs. Operating results from assets acquired in satisfaction of debt, including rental income less operating costs and gains or losses on the sale of, or the periodic evaluation of foreclosed assets, are recorded in noninterest expense.
| (h) | Investment in Limited Partnership |
Mid Penn invested as a limited partner in a partnership in September 2008 that provides low-income housing in Enola, Pennsylvania. The carrying value of Mid Penn’s investment in the limited partnership was $656,000 at December 31, 2009 using the equity method. Mid Penn’s maximum exposure to loss is limited to the carrying value of its investment at year-end. The project was not completed at year-end; therefore, there were no low income housing tax credits available as of December 31, 2009. The partnership anticipates receiving $76,000 annually in low-income housing tax credits once the project is complete.
| (i) | Income Taxes |
Certain items of income and expense are recognized in different accounting periods for financial reporting purposes than for income tax purposes. Deferred income tax assets and liabilities are provided in recognition of these temporary differences at currently enacted income tax rates. As changes in tax laws or rates are enacted, deferred income tax assets and liabilities are adjusted through the provision for income taxes. Mid Penn recognizes interest and/or penalties related to income tax matters in income tax expense.
| (j) | Core Deposit Intangible |
Core deposit intangible is a measure of the value of consumer demand and savings deposits acquired in business combinations accounted for as purchases. The core deposit intangible is being amortized over an 8-year life on a straight-line basis. The core deposit intangible is subject to impairment testing whenever events or changes in circumstances indicate its carrying amount may not reflect benefit.
| (k) | Goodwill |
Goodwill is the excess of the purchase price over the fair value of assets acquired in connection with 2004 and 2006 business acquisitions accounted for as purchases. Accounting Standards codification (“ASC”) Topic 350, Intangibles, Goodwill and Other requires a two-step process for testing the impairment of goodwill on at least an annual basis. No impairment of goodwill was recognized in 2009, 2008 or 2007.
| (l) | Bank Owned Life Insurance |
Mid Penn is the owner and beneficiary of bank owned life insurance (“BOLI”) policies on current and former directors. The earnings from the BOLI policies are an asset that can be liquidated, if necessary, with associated tax costs. However, Mid Penn intends to hold these policies and, accordingly, Mid Penn has not provided deferred income taxes on the earnings from the increase in cash surrender value.
GAAP requires Split-Dollar Life Insurance Arrangements to have a liability recognized related to the postretirement benefits covered by an endorsement split-dollar life insurance arrangement, and a liability for the future death benefit. Mid Penn recorded a cumulative effect adjustment to the balance of retained earnings of $277,000, as of January 1, 2008.
| (m) | Marketing and Advertising Costs |
Marketing and advertising costs are expensed as incurred and were $679,000 in 2009, $525,000 in 2008, and $403,000 in 2007.
| (n) | Postretirement Benefit Plans |
Mid Penn follows the guidance in ASC Topic 715, Compensation-Retirement Benefits related to postretirement benefit plans. This guidance requires additional disclosures about defined benefit pension plans and other postretirement defined benefit plans.
43
Table of Contents
| MID PENN BANCORP, INC. | Notes to Consolidated Financial Statements |
| (o) | Other Benefit Plan |
A funded contributory defined-contribution plan is maintained for substantially all employees. The cost of the Mid Penn defined contribution plan is charged to current operating expenses and is funded annually.
| (p) | Trust Assets and Income |
Assets held by the Bank in a fiduciary or agency capacity for customers of the Trust Department are not included in the consolidated financial statements since such items are not assets of the Bank. Trust income is recognized on the cash basis, which is not materially different than if it were reported on the accrual basis.
| (q) | (Loss) Earnings Per Share |
(Loss) Earnings per share is computed by dividing net (loss) income by the weighted average number of common shares outstanding during each of the years presented. The following data show the amounts used in computing basic and diluted (loss) earnings per share. As shown in the table that follows, diluted (loss) earnings per share is computed using weighted average common shares outstanding, plus weighted average common shares available from the exercise of all dilutive stock warrants issued to the U.S. Treasury under the provisions of the Capital Purchase Program, based on the average share price of Mid Penn’s common stock during the period.
The computations of basic (loss) earnings per common share follow:
| (Dollars in thousands, except per share data) | |||||||||||
| 2009 | 2008 | 2007 | |||||||||
| Net (Loss) Income |
$ | (2,295 | ) | $ | 3,588 | $ | 4,671 | ||||
| Less: Dividends on preferred stock |
(500 | ) | (16 | ) | — | ||||||
| Accretion of preferred stock discount |
(14 | ) | — | — | |||||||
| Net (loss) income available to common stockholders |
$ | (2,809 | ) | $ | 3,572 | $ | 4,671 | ||||
| Weighted average common shares outstanding |
3,479,780 | 3,483,097 | 3,497,806 | ||||||||
| Basic (loss) earnings per common share |
$ | (0.81 | ) | $ | 1.03 | $ | 1.34 | ||||
The computations of diluted (loss) earnings per common share follow:
| (Dollars in thousands, except per share data) | ||||||||||
| 2009 | 2008 | 2007 | ||||||||
| Net (loss) income available to common stockholders |
$ | (2,809 | ) | $ | 3,572 | $ | 4,671 | |||
| Weighted average number of common shares outstanding |
3,479,780 | 3,483,097 | 3,497,806 | |||||||
| Dilutive effect of potential common stock arising from stock warrants: |
||||||||||
| Exercise of outstanding stock warrants issued to U.S. Treasury under the Capital Repurchase Program |
— | 56 | — | |||||||
| Adjusted weighted-average common shares outstanding |
3,479,780 | 3,483,153 | 3,497,806 | |||||||
| Diluted (loss) earnings per common share |
$ | (0.81 | ) | $ | 1.03 | $ | 1.34 | |||
As of December 31, 2009, Mid Penn had 73,099 warrants that were anti-dilutive because the fair value of the common stock was below the $20.52 exercise price of these warrants.
44
Table of Contents
| MID PENN BANCORP, INC. | Notes to Consolidated Financial Statements |
| (4) | Comprehensive Income (Loss) |
GAAP requires that recognized revenue, expenses, gains, and losses be included in net (loss) income. Changes in certain assets and liabilities such as unrealized gains on securities available for sale and the liability associated with defined benefit plans, are reported as a separate component of the shareholders’ equity section of the balance sheet. Such items, along with net (loss) income, are components of comprehensive income (loss). The components of other comprehensive income (loss), and the related tax effects, are as follows:
| (Dollars in thousands) | Years Ended December 31, | |||||||||||
| 2009 | 2008 | 2007 | ||||||||||
| Change in unrealized holding gains on available for sale securities |
$ | 400 | $ | 191 | $ | 217 | ||||||
| Less reclassification adjustment for gains realized in income |
— | (9 | ) | — | ||||||||
| Net unrealized gains |
400 | 182 | 217 | |||||||||
| Change in defined benefit plans |
161 | — | (266 | ) | ||||||||
| Other comprehensive income (loss) |
561 | 182 | (49 | ) | ||||||||
| Income tax benefit (expense) |
(192 | ) | (62 | ) | 16 | |||||||
| Net of tax amount |
$ | 369 | $ | 120 | $ | (33 | ) | |||||
The components of accumulated other comprehensive income, net of taxes, are as follows:
| (Dollars in thousands) | Unrealized Gain on Securities |
Defined Benefit Plan Liability |
Accumulated Other Comprehensive Income | |||||||
| Balance - December 31, 2007 |
$ | 434 | $ | (150 | ) | $ | 284 | |||
| Balance - December 31, 2008 |
$ | 554 | $ | (150 | ) | $ | 404 | |||
| Balance - December 31, 2009 |
$ | 817 | $ | (44 | ) | $ | 773 | |||
| (5) | Restrictions on Cash and Due from Bank Accounts |
The Bank is required to maintain reserve balances with the Federal Reserve Bank of Philadelphia. The amounts of those required reserve balances were $163,000 at December 31, 2009, and $182,000 at December 31, 2008.
| (6) | Investment Securities |
Securities to be held for indefinite periods, but not intended to be held to maturity, are classified as available for sale and carried at fair value. Securities held for indefinite periods include securities that management intends to use as part of its asset and liability management strategy and that may be sold in response to liquidity needs, changes in interest rates, resultant prepayment risk, and other factors related to interest rate and resultant prepayment risk changes.
Realized gains and losses on dispositions are based on the net proceeds and the adjusted book value of the securities sold, using the specific identification method. Unrealized gains and losses on investment securities available for sale are based on the difference between book value and fair value of each security. These gains and losses are credited or charged to other comprehensive income, whereas realized gains and losses flow through the Corporation’s results of operations.
ASC Topic 320, “Investments – Debt and Equity Securities”, clarifies the interaction of the factors that should be considered when determining whether a debt security is other-than-temporarily impaired. For debt securities, management must assess whether (a) it has the intent to sell the security and (b) it is more likely than not that it will be required to sell the security prior to its anticipated recovery. These steps are done before assessing whether the entity will recover the cost basis of the investment. Previously, this assessment required management to assert it has both the intent and the ability to hold a security for a period of time sufficient to allow for an anticipated recovery in fair value to avoid recognizing other-than-temporary impairment. This change does not affect the need to forecast recovery of the value of the security through either cash flows or market price.
45
Table of Contents
| MID PENN BANCORP, INC. | Notes to Consolidated Financial Statements |
In instances when a determination is made that other-than-temporary impairment exists but the investor does not intend to sell the debt security and it is not more likely than not that it will be required to sell the debt security prior to its anticipated recovery, this guidance changes the presentation and amount of the other-than-temporary impairment recognized in the income statement. The other-than-temporary impairment is separated into (a) the amount of the total other-than-temporary impairment related to a decrease in cash flows expected to be collected from the debt security (the credit loss) and (b) the amount of the total other-than-temporary impairment related to all other factors. The amount of the total other-than-temporary impairment related to the credit loss is recognized in earnings. The amount of the total other-than-temporary impairment related to all other factors is recognized in other comprehensive income.
At December 31, 2009 and 2008, amortized cost, fair value, and unrealized gains and losses on investment securities are as follows:
| (Dollars in thousands) | ||||||||||||
| Amortized Cost |
Unrealized Gains |
Unrealized Losses |
Fair Value | |||||||||
| December 31, 2009 |
||||||||||||
| Available for sale securities: |
||||||||||||
| U.S. Treasury and U.S. government agencies |
$ | 15,291 | $ | 409 | $ | — | $ | 15,700 | ||||
| Mortgage-backed U.S. government agencies |
4,522 | 97 | — | 4,619 | ||||||||
| State and political subdivision obligations |
26,044 | 828 | 91 | 26,781 | ||||||||
| Equity securities |
250 | — | 5 | 245 | ||||||||
| $ | 46,107 | $ | 1,334 | $ | 96 | $ | 47,345 | |||||
| (Dollars in thousands) | ||||||||||||
| Amortized Cost |
Unrealized Gains |
Unrealized Losses |
Fair Value | |||||||||
| December 31, 2008 |
||||||||||||
| Available for sale securities: |
||||||||||||
| U.S. Treasury and U.S. government agencies |
$ | 22,347 | $ | 739 | $ | — | $ | 23,086 | ||||
| Mortgage-backed U.S. government agencies |
4,153 | 26 | 6 | 4,173 | ||||||||
| State and political subdivision obligations |
25,150 | 567 | 473 | 25,244 | ||||||||
| Equity securities |
250 | — | 14 | 236 | ||||||||
| $ | 51,900 | $ | 1,332 | $ | 493 | $ | 52,739 | |||||
Estimated fair values of debt securities are based on quoted market prices, where applicable. If quoted market prices are not available, fair values are based on quoted market prices of comparable instruments, adjusted for differences between the quoted instruments and the instruments being valued.
Included in equity securities is an investment in Access Capital Strategies, an equity fund that invests in low to moderate income financing projects. This investment was purchased in 2004 to help fulfill the Bank’s regulatory requirement of the Community Reinvestment Act and at December 31, 2008, and December 31, 2009, is reported at fair value.
Investment securities having a fair value of $37,434,000 at December 31, 2009, and $41,847,000 at December 31, 2008, were pledged to secure public deposits and other borrowings.
46
Table of Contents
| MID PENN BANCORP, INC. | Notes to Consolidated Financial Statements |
The following table presents gross unrealized losses and fair value of investments aggregated by investment category and length of time that individual securities have been in a continuous unrealized loss position at December 31, 2009 and 2008.
| (Dollars in thousands) | Less Than 12 Months | 12 Months or More | Total | |||||||||||||||
| December 31, 2009 | Fair | Unrealized | Fair | Unrealized | Fair | Unrealized | ||||||||||||
| Value | Losses | Value | Losses | Value | Losses | |||||||||||||
| Available for sale securities: |
||||||||||||||||||
| U.S. Treasury and U.S. government agencies |
$ | — | $ | — | $ | — | $ | — | $ | — | $ | — | ||||||
| Mortgage-backed U.S. government agencies |
— | — | — | — | — | — | ||||||||||||
| State and political subdivision obligations |
4,321 | 91 | — | — | 4,321 | 91 | ||||||||||||
| Equity securities |
— | — | 245 | 5 | 245 | 5 | ||||||||||||
| Total temporarily impaired available for sale securities |
$ | 4,321 | $ | 91 | $ | 245 | $ | 5 | $ | 4,566 | $ | 96 | ||||||
| (Dollars in thousands) | Less Than 12 Months | 12 Months or More | Total | |||||||||||||||
| December 31, 2008 | Fair | Unrealized | Fair | Unrealized | Fair | Unrealized | ||||||||||||
| Value | Losses | Value | Losses | Value | Losses | |||||||||||||
| Available for sale securities: |
||||||||||||||||||
| U.S. Treasury and U.S. government agencies |
$ | — | $ | — | $ | — | $ | — | $ | — | $ | — | ||||||
| Mortgage-backed U.S. government agencies |
1,400 | 6 | — | — | 1,400 | 6 | ||||||||||||
| State and political subdivision obligations |
5,520 | 293 | 2,098 | 180 | 7,618 | 473 | ||||||||||||
| Equity securities |
— | — | 236 | 14 | 236 | 14 | ||||||||||||
| Total temporarily impaired available for sale securities |
$ | 6,920 | $ | 299 | $ | 2,334 | $ | 194 | $ | 9,254 | $ | 493 | ||||||
Management evaluates securities for other-than-temporary impairment at least on a quarterly basis; and more frequently when economic or market concerns warrant such evaluation. Consideration is given to the length of time and the extent to which the fair value has been less than cost, and the financial condition and near term prospects of the issuer. In addition, for debt securities, the Corporation considers (a) whether management has the intent to sell the security, (b) it is more likely than not that management will be required to sell the security prior to its anticipated recovery, and (c) whether management expects to recover the entire amortized cost basis. For equity securities, management considers the intent and ability to hold securities until recovery of unrealized losses.
At December 31, 2009, Mid Penn had 8 debt securities with unrealized losses. These securities have depreciated 2.07% from their amortized cost basis. At December 31, 2008, 21 debt securities with unrealized losses had depreciated 5.05% from the amortized cost basis. These securities are issued by either the U.S. Government or other governmental agencies. These unrealized losses were determined principally by reference to current interest rates for similar types of securities. In analyzing an issuer’s financial condition, management considers whether the U.S. Government or its agencies issued the securities, whether downgrades by bond rating agencies have occurred, and the results of reviews of the issuer’s financial condition. Based on the above conditions management has determined that no declines are deemed to be other-than-temporary.
The table below is the maturity distribution of investment securities at amortized cost and fair value at December 31, 2009 and 2008:
| (Dollars in thousands) |
December 31, 2009 | December 31, 2008 | ||||||||||
| Amortized Cost |
Fair Value |
Amortized Cost |
Fair Value | |||||||||
| Due in 1 year or less |
$ | 1,022 | $ | 1,026 | $ | 11,643 | $ | 11,671 | ||||
| Due after 1 year but within 5 years |
11,878 | 12,121 | 9,053 | 9,378 | ||||||||
| Due after 5 years but within 10 years |
17,662 | 18,417 | 18,106 | 18,929 | ||||||||
| Due after 10 years |
10,773 | 10,917 | 8,696 | 8,352 | ||||||||
| 41,335 | 42,481 | 47,498 | 48,330 | |||||||||
| Mortgage-backed securities (avg. life 2.6 years) |
4,522 | 4,619 | 4,154 | 4,173 | ||||||||
| Equity securities |
250 | 245 | 250 | 236 | ||||||||
| $ | 46,107 | $ | 47,345 | $ | 51,902 | $ | 52,739 | |||||
47
Table of Contents
| MID PENN BANCORP, INC. | Notes to Consolidated Financial Statements |
| (7) | Loans |
A summary of loans at December 31, 2009 and 2008 is as follows:
| (Dollars in thousands) | 2009 | 2008 | ||||
| Commercial real estate, construction and land development |
$ | 253,878 | $ | 234,762 | ||
| Commercial, industrial and agricultural |
85,795 | 71,385 | ||||
| Real estate - residential |
128,522 | 118,547 | ||||
| Consumer |
12,190 | 9,949 | ||||
| $ | 480,385 | $ | 434,643 | |||
Net unamortized loan fees and costs of $504,000 in 2009 and $303,000 in 2008 were deducted from loans.
The Bank has granted loans to certain of its executive officers, directors, and their related interests. These loans were made on substantially the same basis, including interest rates and collateral as those prevailing for comparable transactions with other borrowers at the same time. The aggregate amount of these loans was $6,244,000 and $1,449,000 at December 31, 2009 and 2008, respectively. During 2009, $12,713,000 of new loans and advances were extended and repayments totaled $7,918,000. None of these loans were past due, in non-accrual status, or restructured at December 31, 2009.
| (8) | Allowance for Loan and Lease Losses |
Changes in the allowance for loan and lease losses for the years 2009, 2008 and 2007 are summarized as follows:
| (Dollars in thousands) | 2009 | 2008 | 2007 | |||||||||
| Balance, January 1 |
$ | 5,505 | $ | 4,790 | $ | 4,187 | ||||||
| Provision for loan and lease losses |
9,520 | 1,230 | 925 | |||||||||
| Loans and leases charged off |
(7,431 | ) | (647 | ) | (460 | ) | ||||||
| Recoveries on loans and leases charged off |
92 | 132 | 138 | |||||||||
| Balance, December 31 |
$ | 7,686 | $ | 5,505 | $ | 4,790 | ||||||
The recorded investment in loans and leases that are considered impaired amounted to $13,726,000 on December 31, 2009, and $6,858,000 on December 31, 2008. By definition, impairment of a loan or lease is considered when, based on current information and events, it is probable that all amounts due will not be collected according to the contractual terms of the loan or lease agreement. The allowance for loan and lease losses related to loans and leases classified as impaired amounted to $2,561,000 at December 31, 2009 and $856,000 at December 31, 2008. At December 31, 2009, impaired loans with a valuation allowance were $4,597,000 and those without a valuation allowance were $9,129,000. At December 31, 2008, impaired loans with a valuation allowance were $4,663,000 and those without a valuation allowance were $2,195,000. The average balances of total impaired loans and leases amounted to $13,293,000, $5,376,000 and $2,504,000 for the years 2009, 2008 and 2007, respectively. The Bank applies payments on impaired loans on a principal first basis. Interest income is recognized on impaired loans and leases on a cash basis. The cash receipts recognized as interest income were $982,000, $51,000, and $66,000 for the years ended December 31, 2009, 2008, and 2007.
Loans and leases which were past due 90 days or more for which interest continued to be accrued amounted to $661,000 at December 31, 2009 and $1,860,000 at December 31, 2008. Total nonaccrual loans and leases amounted to $14,933,000 at December 31, 2009 and $4,113,000 at December 31, 2008. $4,278,000 of the 2009 non-accrual loans are also troubled debt restructured loans. If these nonaccrual loans and leases had been current in accordance with their original terms and had been outstanding throughout the period or since origination, if held for part of the period, Mid Penn would have recorded interest income of $608,000, $335,000, and $390,000 in the years ended December 31, 2009, 2008, and 2007 respectively. Mid Penn has no commitments to lend additional funds to borrowers with impaired or nonaccrual loans.
48
Table of Contents
| MID PENN BANCORP, INC. | Notes to Consolidated Financial Statements |
| (9) | Bank Premises and Equipment |
At December 31, 2009 and 2008, bank premises and equipment are as follows:
| (Dollars in thousands) | 2009 | 2008 | ||||||
| Land |
$ | 2,791 | $ | 2,791 | ||||
| Buildings |
9,239 | 9,060 | ||||||
| Furniture, fixtures, and equipment |
9,879 | 8,001 | ||||||
| Land and Leasehold improvements |
376 | 326 | ||||||
| Construction in progress |
692 | 168 | ||||||
| 22,977 | 20,346 | |||||||
| Less accumulated depreciation |
(10,073 | ) | (8,969 | ) | ||||
| $ | 12,904 | $ | 11,377 | |||||
Depreciation expense was $1,115,000 in 2009, $848,000 in 2008 and $809,000 in 2007.
| (10) | Deposits |
At December 31, 2009 and 2008, time deposits amounted to $268,460,000 and $248,060,000, respectively. Interest expense on such certificates of deposit amounted to $9,293,000, $9,903,000 and $9,006,000 for the years ended December 31, 2009, 2008 and 2007, respectively. These time deposits at December 31, 2009, mature as follows:
| (Dollars in thousands) | Time Deposits | |||||
| $100,000 or more | Less than $100,000 | |||||
| Maturing in 2010 |
$ | 60,155 | $ | 110,802 | ||
| Maturing in 2011 |
12,911 | 26,385 | ||||
| Maturing in 2012 |
7,835 | 32,276 | ||||
| Maturing in 2013 |
796 | 3,243 | ||||
| Maturing in 2014 |
3,480 | 7,984 | ||||
| Maturing thereafter |
660 | 1,933 | ||||
| $ | 85,837 | $ | 182,623 | |||
Brokered deposits included in the deposit totals equaled $27,889,000 at December 31, 2009 and $46,108,000 at December 31, 2008. Deposits and other funds from related parties held by Mid Penn at December 31, 2009 and 2008 amounted to $8,717,000 and $5,765,000, respectively.
| (11) | Short-term Borrowings |
Short-term borrowings as of December 31, 2009 and 2008 consisted of:
| (Dollars in thousands) | 2009 | 2008 | ||||
| Federal funds purchased |
$ | 12,886 | $ | 17,928 | ||
| Repurchase agreements |
2,839 | 5,041 | ||||
| Treasury, tax and loan notes |
319 | 1,008 | ||||
| $ | 16,044 | $ | 23,977 | |||
The weighted average interest rate on total short-term borrowings outstanding was 0.57% at December 31, 2009, and 2.09% at December 31, 2008.
Federal funds purchased represent overnight funds. The Bank has a line of credit commitment from the Federal Home Loan Bank (“FHLB”) for overnight borrowings up to $40,000,000 of which $12,886,000 was outstanding at December 31, 2009. This line is collateralized by certain qualifying loans and investment securities of the Bank. Securities sold under repurchase agreements generally mature between one day and one year. Treasury, tax and loan notes are open-ended interest bearing notes payable to the U.S. Treasury upon call. All tax deposits accepted by the Bank are placed in the Treasury note account. The Bank also has unused lines of credit with a correspondent bank amounting to $7,500,000 at December 31, 2009.
49
Table of Contents
| MID PENN BANCORP, INC. | Notes to Consolidated Financial Statements |
| (12) | Long-term Debt |
The Bank is a member of the Federal Home Loan Bank of Pittsburgh (“FHLB”) and through its membership, the Bank can access a number of credit products, which are utilized to provide liquidity. The maximum borrowing capacity available to the Bank at the FHLB at December 31, 2009 was $218,483,000. As of December 31, 2009 and 2008, the Bank had long-term debt in the amount of $38,057,000 and $55,223,000, respectively, consisting of:
| (Dollars in thousands) | At December 31, | |||||
| 2009 | 2008 | |||||
| Loans maturing in 2009 with rates ranging from 4.22% to 7.24% |
$ | — | $ | 17,000 | ||
| Loans maturing in 2010 with rates ranging from 6.28% to 6.71% |
10,000 | 10,000 | ||||
| Loans maturing in 2011 at a rate of 5.13% |
5,000 | 5,000 | ||||
| Loans maturing in 2013 with rates ranging from 3.24% to 4.75% |
14,258 | 14,279 | ||||
| Loans maturing in 2015 at a rate of 4.18% |
5,000 | 5,000 | ||||
| Loans maturing in 2026 at a rate of 4.80% |
3,715 | 3,857 | ||||
| Loans maturing in 2027 at a rate of 6.71% |
84 | 87 | ||||
| $ | 38,057 | $ | 55,223 | |||
The aggregate amounts due on long-term debt subsequent to December 31, 2009 are $10,174,000 (2010), $5,182,000 (2011), $191,000 (2012), $14,365,000 (2013), $184,000 (2014), and $7,961,000 thereafter. All of Mid Penn’s long-term debt, $778,000 of the Bank’s investments and the Bank’s entire mortgage loan portfolio are pledged to secure FHLB borrowings.
| (13) | Fair Value Measurement |
Mid Penn adopted Accounting Standards Codification (“ASC”) Topic 820, Fair Value Measurements and Disclosures effective January 1, 2008 for financial assets and financial liabilities and on January 1, 2009, for non-financial assets and non-financial liabilities. This guidance defines fair value, establishes a framework for measuring fair value in accordance with generally accepted accounting principles, and expands disclosures about fair value measurements.
Fair value measurement and disclosure guidance defines fair value as the price that would be received to sell the asset or transfer the liability in an orderly transaction (that is, not a forced liquidation or distressed sale) between market participants at the measurement date under current market conditions. This guidance provides additional information on determining when the volume and level of activity for the asset or liability has significantly decreased. The guidance also includes information on identifying circumstances when a transaction may not be considered orderly.
Fair value measurement and disclosure guidance provides a list of factors that a reporting entity should evaluate to determine whether there has been a significant decrease in the volume and level of activity for the asset or liability in relation to normal market activity for the asset or liability. When the reporting entity concludes there has been a significant decrease in the volume and level of activity for the asset or liability, further analysis of the information from that market is needed and significant adjustments to the related prices may be necessary to estimate fair value in accordance with the fair value measurement and disclosure guidance.
This guidance clarifies that when there has been a significant decrease in the volume and level of activity for the asset or liability, some transactions may not be orderly. In those situations, the entity must evaluate the weight of the evidence to determine whether the transaction is orderly. The guidance provides a list of circumstances that may indicate that a transaction is not orderly. A transaction price that is not associated with an orderly transaction is given little, if any, weight when estimating fair value.
Fair value is the price that would be received to sell an asset or paid to transfer a liability in an orderly transaction between market participants at the measurement date. Inputs to valuation techniques refer to the assumptions that market participants would use in pricing the asset or liability. Inputs may be observable, meaning those that reflect the assumptions market participants would use in pricing the asset or liability developed based on market data obtained from independent sources, or unobservable, meaning those that reflect the reporting entity’s own belief about the assumptions market participants would use in pricing the asset or liability based upon the best information available in the circumstances. Fair value measurement and disclosure guidance establishes a fair value hierarchy for valuation inputs that gives the highest priority to quoted prices in active markets for identical assets or liabilities and the lowest priority to unobservable inputs. The fair value hierarchy is as follows:
| Level 1 Inputs - | Unadjusted quoted prices in active markets that are accessible at the measurement date for identical, unrestricted assets or liabilities; |
50
Table of Contents
| MID PENN BANCORP, INC. | Notes to Consolidated Financial Statements |
| Level 2 Inputs - | Quoted prices in markets that are not active, or inputs that are observable either directly or indirectly, for substantially the full term of the asset or liability; | |
| Level 3 Inputs - | Prices or valuation techniques that require inputs that are both significant to the fair value measurement and unobservable (i.e., supported by little or no market activity). | |
A description of the valuation methodologies used for instruments measured at fair value, as well as the general classification of such instruments pursuant to the valuation hierarchy, is set forth below. These valuation methodologies were applied to all of Mid Penn’s financial assets and financial liabilities carried at fair value effective January 1, 2008.
The following table illustrates the financial instruments measured at fair value on a recurring basis segregated by hierarchy fair value levels:
| (Dollars in thousands) | Fair value measurements at December 31, 2009 using: | |||||||||||
| Assets: |
Total carrying value at December 31, 2009 |
Quoted prices in active markets (Level 1) |
Significant other observable inputs (Level 2) |
Significant unobservable inputs (Level 3) | ||||||||
| Securities available for sale |
$ | 47,345 | $ | 245 | $ | 47,100 | $ | — | ||||
| (Dollars in thousands) | Fair value measurements at December 31, 2008 using: | |||||||||||
| Assets: |
Total carrying value at December 31, 2008 |
Quoted prices in active markets (Level 1) |
Significant other observable inputs (Level 2) |
Significant unobservable inputs (Level 3) | ||||||||
| Securities available for sale |
$ | 52,739 | $ | 236 | $ | 52,503 | $ | — | ||||
Certain financial assets and financial liabilities are measured at fair value on a nonrecurring basis; that is, the instruments are not measured at fair value on an ongoing basis, but are subject to fair value adjustments in certain circumstances (for example, when there is evidence of impairment).
The following table illustrates the financial instruments measured at fair value on a nonrecurring basis segregated by hierarchy fair value levels:
| (Dollars in thousands) | Fair value measurements at December 31, 2009 using: | |||||||||
| Assets: |
Total carrying value at December 31, 2009 |
Quoted prices in active markets (Level 1) |
Significant other observable inputs (Level 2) |
Significant unobservable inputs (Level 3) | ||||||
| Impaired Loans |
$ | 2,036 | $ | 2,036 | ||||||
| Foreclosed Assets |
663 | 663 | ||||||||
| (Dollars in thousands) | Fair value measurements at December 31, 2008 using: | |||||||||
| Assets: |
Total carrying value at December 31, 2008 |
Quoted prices in active markets (Level 1) |
Significant other observable inputs (Level 2) |
Significant unobservable inputs (Level 3) | ||||||
| Impaired Loans |
$ | 3,807 | $ | 3,807 | ||||||
| Foreclosed Assets |
1,516 | 1,516 | ||||||||
Certain non-financial assets and non-financial liabilities measured at fair value on a recurring basis include reporting units measured at fair value in the first step of a goodwill impairment test. Certain non-financial assets and non-financial liabilities measured at fair value on a non-recurring basis include non-financial assets and non-financial liabilities measured at fair value in the second step of a goodwill impairment test, as well as intangible assets and other non-financial long-lived assets measured at fair value for impairment assessment. As stated above, this guidance was applicable to these fair value measurements beginning January 1, 2009 and were not significant at December 31, 2009.
51
Table of Contents
| MID PENN BANCORP, INC. | Notes to Consolidated Financial Statements |
The following methodologies and assumptions were used to estimate the fair value of Mid Penn’s financial instruments:
Cash and Cash Equivalents:
The carrying value of cash and cash equivalents is considered to be a reasonable estimate of fair value.
Interest-bearing Balances with other Financial Institutions:
The estimate of fair value was determined by comparing the present value of quoted interest rates on like deposits with the weighted average yield and weighted average maturity of the balances.
Securities Available for Sale:
The fair value of securities classified as available for sale is determined by obtaining quoted market prices on nationally recognized securities exchanges (Level 1), or matrix pricing (level 2), which is a mathematical technique used widely in the industry to value debt securities without relying exclusively on quoted market prices for the specific securities but rather relying on the securities’ relationship to other benchmark quoted prices.
Impaired Loans:
Certain loans are evaluated for impairment using the practical expedients including impaired loans measured at an observable market price (if available), or at the fair value of the loan’s collateral (if the loan is collateral dependent). The value of the collateral is determined through appraisals performed by independent licensed appraisers. When the value of the collateral, less estimated costs to sell, is less than the principal balance of the loan, a specific allowance is established. Mid Penn considers the appraisals used in its impairment analysis to be Level 3 inputs. Impaired loans are reviewed and evaluated as needed for additional impairment, and allowances are adjusted accordingly.
Loans:
For variable-rate loans that reprice frequently and which entail no significant changes in credit risk, carrying values approximated fair value. The fair value of other loans are estimated by calculating the present value of the cash flow difference between the current rate and the market rate, for the average maturity, discounted quarterly at the market rate.
Foreclosed Assets:
Assets included in foreclosed assets held for sale are carried at fair value and accordingly is presented as measured on a non-recurring basis. Values are estimated using Level 3 inputs, based on appraisals that consider the sales prices of property in the proximate vicinity.
Accrued Interest Receivable and Payable:
The carrying amount of accrued interest receivable and payable approximates their fair values.
Restricted Investment in Bank Stocks:
The carrying amount of required and restricted investment in correspondent bank stock approximates fair value, and considers the limited marketability of such securities.
Deposits:
The fair value for demand deposits (e.g., interest and noninterest checking, savings, and money market deposit accounts) is by definition, equal to the amount payable on demand at the reporting date (i.e. their carrying amounts). Fair value for fixed-rate certificates of deposit was estimated using a discounted cash flow calculation by combining all fixed-rate certificates into a pool with a weighted average yield and a weighted average maturity for the pool and comparing the pool with interest rates currently being offered on a similar maturity.
Short-term Borrowings:
Because of time to maturity, the estimated fair value of short-term borrowings approximates the book value.
Long-term Debt:
The estimated fair values of long-term debt were determined using discounted cash flow analysis, based on currently available borrowing rates for similar types of borrowing arrangements.
Commitments to Extend Credit and Letters of Credit:
The fair value of commitments to extend credit is estimated using the fees currently charged to enter into similar agreements, taking into account market interest rates, the remaining terms and present credit worthiness of the counterparties. The fair value of guarantees and letters of credit is based on fees currently charged for similar agreements.
52
Table of Contents
| MID PENN BANCORP, INC. | Notes to Consolidated Financial Statements |
The following table summarizes the carrying value and fair value of financial instruments at December 31, 2009 and 2008.
| (Dollars in thousands) | December 31, 2009 | December 31, 2008 | ||||||||||
| Book Value |
Fair Value |
Book Value |
Fair Value | |||||||||
| Financial assets: |
||||||||||||
| Cash and cash equivalents |
$ | 8,960 | $ | 8,960 | $ | 8,448 | $ | 8,448 | ||||
| Interest-bearing balances with other financial institutions |
38,604 | 38,604 | 50,076 | 50,076 | ||||||||
| Investment securities |
47,345 | 47,345 | 52,739 | 52,739 | ||||||||
| Net loans and leases |
472,699 | 487,476 | 429,138 | 456,323 | ||||||||
| Restricted investment in bank stocks |
4,029 | 4,029 | 3,618 | 3,618 | ||||||||
| Accrued interest receivable |
2,781 | 2,781 | 2,747 | 2,747 | ||||||||
| Financial liabilities: |
||||||||||||
| Deposits |
$ | 500,015 | $ | 506,616 | $ | 436,824 | $ | 447,482 | ||||
| Short-term borrowing |
16,044 | 16,044 | 23,977 | 23,977 | ||||||||
| Long-term debt |
38,057 | 39,578 | 55,223 | 58,721 | ||||||||
| Accrued interest |
1,750 | 1,750 | 2,411 | 2,411 | ||||||||
| Off-balance sheet financial instruments: |
||||||||||||
| Commitments to extend credit |
$ | — | $ | — | $ | — | $ | — | ||||
| Financial standby letters of credit |
— | — | — | — | ||||||||
| (14) | Postretirement Benefit Plans |
Mid Penn has an unfunded noncontributory defined benefit plan for directors. The plan provides defined benefits based on years of service.
Mid Penn also has other postretirement benefit plans covering full-time employees. These health care and life insurance plans are noncontributory.
The significant aspects of each plan are as follows:
| (a) | Health Insurance |
For full-time employees who retire after at least 20 years of service, Mid Penn will pay premiums for major medical insurance (as provided to active employees) for a period ending on the earlier of the date the participant obtains other employment where major medical coverage is available or the date of the participant’s death; however, in all cases payment of medical premiums by Mid Penn will not exceed five years. If the retiree becomes eligible for Medicare within the five-year period beginning on his/her retirement date, the Bank may pay, at its discretion, premiums for 65 Special coverage or a similar supplemental coverage. After the five-year period has expired, all Mid Penn paid benefits cease; however, the retiree may continue coverage through the Bank at his/her own expense. This plan was amended in 2008 to encompass only those employees that had achieved ten years of full-time continuous service to Mid Penn as of January 1, 2008. Employees hired after that date and those that had not achieved the service requirements are not eligible for the plan.
| (b) | Life Insurance |
For full-time employees who retire after at least 20 years of service, Mid Penn will provide term life insurance. The amount of coverage prior to age 65 will be three times the participant’s annual salary at retirement or $50,000, whichever is less. After age 65, the life insurance coverage amount will decrease by 10% per year, subject to a minimum amount of $2,000.
| (c) | Directors’ Retirement Plan |
Mid Penn has an unfunded defined benefit retirement plan for directors with benefits based on years of service. The adoption of this plan generated unrecognized prior service cost of $274,000, which is being amortized over the expected future years of service of active directors. The unamortized balance at December 31, 2009, was $197,000.
53
Table of Contents
| MID PENN BANCORP, INC. | Notes to Consolidated Financial Statements |
Health and Life
The following tables provide a reconciliation of the changes in the plan’s health and life insurance benefit obligations and fair value of plan assets for the years ended December 31, 2009 and 2008, and a statement of the funded status at December 31, 2009 and 2008:
| (Dollars in thousands) | December 31, | |||||||
| 2009 | 2008 | |||||||
| Change in benefit obligations: |
||||||||
| Benefit obligations, January 1 |
$ | 607 | $ | 625 | ||||
| Service cost |
16 | 26 | ||||||
| Interest cost |
32 | 34 | ||||||
| Actuarial loss (gain) |
(35 | ) | 9 | |||||
| Plan amendment |
— | (77 | ) | |||||
| Change in assumptions |
34 | 12 | ||||||
| Benefit payments |
(21 | ) | (22 | ) | ||||
| Benefit obligations, December 31 |
$ | 633 | $ | 607 | ||||
| Change in fair value of plan assets: |
||||||||
| Fair value of plan assets, January 1 |
$ | — | $ | — | ||||
| Employer contributions |
21 | 22 | ||||||
| Benefit payments |
(21 | ) | (22 | ) | ||||
| Fair value of plan assets, December 31 |
$ | — | $ | — | ||||
| Funded status at year end |
$ | (633 | ) | $ | (607 | ) | ||
The amount recognized in the consolidated balance sheet at December 31, 2009 and 2008, is as follows:
| (Dollars in thousands) | 2009 | 2008 | ||||
| Accrued benefit liability |
$ | 633 | $ | 607 | ||
The amounts recognized in accumulated other comprehensive income consist of:
| (Dollars in thousands) | December 31, | |||||||
| 2009 | 2008 | |||||||
| Net gain, net of tax effects |
$ | (126 | ) | $ | (89 | ) | ||
| Prior service cost, net of tax effects |
(5 | ) | (4 | ) | ||||
The accumulated benefit obligation for health and life insurance plans was $633,000 and $607,000 at December 31, 2009 and 2008, respectively.
The estimated net actuarial gain that will be amortized from accumulated other comprehensive income (loss) into net periodic benefit cost during 2010 are $5,718 and ($1,053).
54
Table of Contents
| MID PENN BANCORP, INC. | Notes to Consolidated Financial Statements |
The components of net periodic postretirement benefit cost for 2009, 2008 and 2007 are as follows:
| (Dollars in thousands) | 2009 | 2008 | 2007 | |||||||||
| Service cost |
$ | 16 | $ | 26 | $ | 41 | ||||||
| Interest cost |
32 | 34 | 31 | |||||||||
| Amortization of transition obligation |
— | 4 | 15 | |||||||||
| Amortization of prior service cost |
(1 | ) | (1 | ) | — | |||||||
| Amortization of net gain |
(10 | ) | (7 | ) | (7 | ) | ||||||
| Net periodic postretirement benefit cost |
$ | 37 | $ | 56 | $ | 80 | ||||||
Assumptions used in the measurement of Mid Penn’s benefit obligations at December 31, 2009 and 2008 are as follows:
| 2009 | 2008 | |||||
| Weighted-average assumptions: |
||||||
| Discount rate |
5.75 | % | 5.75 | % | ||
| Rate of compensation increase |
4.75 | % | 4.75 | % |
Assumptions used in the measurement of Mid Penn’s net periodic benefit cost for the years ended December 31, 2009, 2008 and 2007 are as follows:
| 2009 | 2008 | 2007 | |||||||
| Weighted-average assumptions: |
|||||||||
| Discount rate |
5.75 | % | 5.75 | % | 6.00 | % | |||
| Rate of compensation increase |
4.75 | % | 4.75 | % | 5.00 | % |
Assumed health care cost trend rates at December 31, 2009, 2008 and 2007 are as follows:
| 2009 | 2008 | 2007 | |||||||
| Health care cost trend rate assumed for next year |
8.00 | % | 8.50 | % | 9.00 | % | |||
| Rate to which the cost trend rate is assumed to decline (the ultimate trend rate) |
5.50 | % | 5.50 | % | 5.00 | % | |||
| Year that the rate reaches the ultimate trend rate |
2014 | 2014 | 2011 |
Assumed health care cost trend rates have a significant effect on the amounts reported for the health care plans. A one-percentage-point change in assumed health care cost trend rates would have the following effects:
| (Dollars in thousands) | One-Percentage Point | |||||
| Increase | Decrease | |||||
| Effect on total of service and interest cost |
$ | 5 | $ | 5 | ||
| Effect on accumulated postretirement benefit obligation |
57 | 51 | ||||
Mid Penn expects to contribute $23,000 to its life and health benefit plans in 2010. The following table shows the estimated benefit payments for future periods:
| (Dollars in thousands) | |||
| 1/1/2010 to 12/31/2010 |
$ | 23 | |
| 1/1/2011 to 12/31/2011 |
29 | ||
| 1/1/2012 to 12/31/2012 |
31 | ||
| 1/1/2013 to 12/31/2013 |
30 | ||
| 1/1/2014 to 12/31/2014 |
40 | ||
| 1/1/2015 to 12/31/2019 |
342 | ||
Benefit obligations were measured as of December 31, 2009, for the postretirement benefit plan.
55
Table of Contents
| MID PENN BANCORP, INC. | Notes to Consolidated Financial Statements |
Retirement Plan
The following tables provide a reconciliation of the changes in the directors’ defined benefit plan’s benefit obligations and fair value of plan assets for the years ended December 31, 2009 and 2008 and a statement of the status at December 31, 2009 and 2008. This plan is unfunded.
| (Dollars in thousands) | December 31, | |||||||
| 2009 | 2008 | |||||||
| Change in benefit obligations: |
||||||||
| Benefit obligations, January 1 |
$ | 1,056 | $ | 1,098 | ||||
| Service cost |
20 | 24 | ||||||
| Interest cost |
56 | 60 | ||||||
| Actuarial gain |
(33 | ) | (15 | ) | ||||
| Plan amendment |
— | (60 | ) | |||||
| Change in assumptions |
— | 1 | ||||||
| Benefit payments |
(124 | ) | (52 | ) | ||||
| Benefit obligations, December 31 |
$ | 975 | $ | 1,056 | ||||
| Change in fair value of plan assets: |
||||||||
| Fair value of plan assets, January 1 |
$ | — | $ | — | ||||
| Employer contributions |
124 | 52 | ||||||
| Benefit payments |
(124 | ) | (52 | ) | ||||
| Fair value of plan assets, December 31 |
$ | — | $ | — | ||||
| Funded status at year end |
$ | (975 | ) | $ | (1,056 | ) | ||
Amounts recognized in the consolidated balance sheet at December 31, 2009 and 2008 are as follows:
| (Dollars in thousands) | 2009 | 2008 | ||||
| Accrued benefit liability |
$ | 975 | $ | 1,056 | ||
Amounts recognized in accumulated other comprehensive income consist of:
| (Dollars in thousands) | December 31, | ||||||
| 2009 | 2008 | ||||||
| Net prior service cost, net of tax effect |
$ | 194 | $ | 142 | |||
| Net loss (gain), net of tax effect |
(31 | ) | 2 | ||||
The accumulated benefit obligation for the retirement plan was $975,000 at December 31, 2009 and $1,056,000 at December 31, 2008.
The estimated net actuarial gain and prior service costs that will be amortized from accumulated other comprehensive income (loss) into net periodic benefit cost during 2010 are $0 and $21,525.
The components of net periodic retirement cost for 2009, 2008 and 2007 are as follows:
| (Dollars in thousands) | 2009 | 2008 | 2007 | ||||||
| Service cost |
$ | 20 | $ | 24 | $ | 26 | |||
| Interest cost |
56 | 60 | 59 | ||||||
| Amortization of prior-service cost |
22 | 21 | 27 | ||||||
| Net periodic retirement cost |
$ | 98 | $ | 105 | $ | 112 | |||
56
Table of Contents
| MID PENN BANCORP, INC. | Notes to Consolidated Financial Statements |
Assumptions used in the measurement of Mid Penn’s benefit obligations at December 31, 2009 and 2008 are as follows:
| 2009 | 2008 | |||||
| Weighted-average assumptions: |
||||||
| Discount rate |
5.75 | % | 6.00 | % | ||
| Change in consumer price index |
3.25 | % | 3.50 | % |
Assumptions used in the measurement of Mid Penn’s net periodic benefit cost for the years ended December 31, 2009, 2008 and 2007 are as follows:
| 2009 | 2008 | 2007 | |||||||
| Weighted-average assumptions: |
|||||||||
| Discount rate |
5.75 | % | 6.00 | % | 5.75 | % | |||
| Change in consumer price index |
3.25 | % | 3.50 | % | 3.25 | % |
Mid Penn expects to contribute $71,000 to its retirement plan in 2010. The following table shows the estimated benefit payments for future periods:
| (Dollars in thousands) | |||
| 1/1/2010 to 12/31/2010 |
$ | 71 | |
| 1/1/2011 to 12/31/2011 |
73 | ||
| 1/1/2012 to 12/31/2012 |
85 | ||
| 1/1/2013 to 12/31/2013 |
86 | ||
| 1/1/2014 to 12/31/2014 |
88 | ||
| 1/1/2015 to 12/31/2019 |
446 | ||
Plan benefit obligations were measured as of December 31, 2009 for the directors’ defined benefit plan.
The Bank is the owner and beneficiary of insurance policies on the lives of certain officers and directors, which informally fund the retirement plan obligation. The aggregate cash surrender value of these policies was $3,178,000 and $3,204,000 at December 31, 2009 and 2008, respectively.
| (15) | Other Benefit Plans |
| (a) | Defined-Contribution Plan |
The Bank has a funded contributory defined-contribution plan covering substantially all employees. The Bank’s contribution to the plan was $0 for 2009, $186,000 for 2008 and $238,000 for 2007.
| (b) | Deferred Compensation Plans |
The Bank has an executive deferred compensation plan, which allows an executive officer to defer bonus compensation for a specified period in order to provide future retirement income. At December 31, 2009 and 2008, the Bank had accrued a liability of approximately $166,000 and $164,000, respectively, for this plan.
The Bank also has a directors’ deferred compensation plan, which allows directors to defer receipt of fees for a specified period in order to provide future retirement income. At December 31, 2009 and 2008, the Bank had accrued a liability of approximately $377,000 and $365,000, respectively, for this plan.
| (c) | Salary Continuation Agreement |
The Bank maintains a Salary Continuation Agreement (“Agreement”) for a former executive officer. The Agreement provides the former executive officer with a fixed annual benefit. The benefit is payable beginning at age 65 for a period of 15 years. At December 31, 2009 and 2008, the Bank has accrued a liability of approximately $156,000 and $145,000, respectively, for the Agreement. The expense (income) related to the Agreement was $11,000 for 2009, ($116,000) for 2008 and $29,000 for 2007. The income figure reflected for 2008 was the result of the resignation of the former executive officer and the resulting change in the vesting period related to the agreement.
57
Table of Contents
| MID PENN BANCORP, INC. | Notes to Consolidated Financial Statements |
The Bank is the owner and beneficiary of an insurance policy on the life of the participating former executive officer, which informally funds the benefit obligation. The aggregate cash surrender value of this policy was approximately $1,036,000 and $1,000,000 at December 31, 2009 and 2008, respectively.
| (d) | Employee Stock Ownership Plan |
Mid Penn has an Employee Stock Ownership Plan (“ESOP”) covering substantially all employees. Contributions to the ESOP are made at the discretion of the Board of Directors. Total expense related to Mid Penn’s contribution to the ESOP for 2009, 2008 and 2007 was $0, $91,000 and $76,000, respectively. The ESOP held 46,271 and 47,995 common shares of Mid Penn stock as of December 31, 2009, and December 31, 2008, respectively, all of which were allocated to plan participants. The ESOP shares are valued using Level 1 inputs as there is an active market for identical assets at the measurement date. At December 31, 2009, the fair value of Mid Penn stock on the NASDAQ Stock Market was $10.29 per common share, resulting in a total fair value of the ESOP of $476,129. Shares held by the ESOP are considered outstanding for purposes of calculating earnings per share. Dividends paid on shares held by the ESOP are charged to retained earnings.
| (e) | Split Dollar Life Insurance Arrangements |
At December 31, 2009 and 2008, the Bank had Split Dollar Life Insurance arrangements with two former executives for which the aggregate collateral assignment and cash surrender values are approximately $1,588,000 and $1,552,000, respectively.
| (f) | 401(k) Plan |
The Bank has a 401(k) plan that covers substantially all full-time employees. The plan allows employees to contribute a portion of their salaries and wages to the plan. The plan provides for the Bank to match a portion of employee-elected salary deferrals, subject to certain percentage maximums of their salaries and wages. The Bank’s contribution to the plan was $96,000, $87,000, and $80,000 for the years ending December 31, 2009, 2008, and 2007 respectively.
58
Table of Contents
| MID PENN BANCORP, INC. | Notes to Consolidated Financial Statements |
| (16) | Federal Income Taxes |
The following temporary differences gave rise to the net deferred tax asset at December 31, 2009 and 2008:
| (Dollars in thousands) | 2009 | 2008 | ||||||
| Deferred tax assets: |
||||||||
| Allowance for loan and lease losses |
$ | 2,500 | $ | 1,758 | ||||
| Loan fees |
48 | — | ||||||
| Benefit plans |
864 | 996 | ||||||
| Nonaccrual interest |
207 | 114 | ||||||
| Legal fees |
12 | — | ||||||
| Disallowed charitable contributions |
26 | — | ||||||
| Core deposit intangible |
— | 4 | ||||||
| Severance |
68 | 150 | ||||||
| 3,725 | 3,022 | |||||||
| Deferred tax liabilities: |
||||||||
| Depreciation |
(651 | ) | (263 | ) | ||||
| Loan fees |
— | (82 | ) | |||||
| Core deposit intangible |
(7 | ) | — | |||||
| Bond accretion |
(96 | ) | (69 | ) | ||||
| Prepaid expenses |
(160 | ) | (73 | ) | ||||
| Goodwill and intangibles |
(133 | ) | (100 | ) | ||||
| Unrealized gain on securities |
(421 | ) | (285 | ) | ||||
| (1,468 | ) | (872 | ) | |||||
| Deferred tax asset, net |
$ | 2,257 | $ | 2,150 | ||||
The (benefit from) provision for income taxes consists of the following:
| (Dollars in thousands) | 2009 | 2008 | 2007 | |||||||||
| Current |
$ | (1,965 | ) | $ | 1,264 | $ | 1,821 | |||||
| Deferred |
(243 | ) | (160 | ) | (427 | ) | ||||||
| Total (benefit from) provision for income taxes |
$ | (2,208 | ) | $ | 1,104 | $ | 1,394 | |||||
A reconciliation of income tax at the statutory rate to Mid Penn’s effective rate is as follows:
| (Dollars in thousands) | 2009 | 2008 | 2007 | |||||||||
| (Benefit) provision at the expected statutory rate |
$ | (1,531 | ) | $ | 1,596 | $ | 2,001 | |||||
| Effect of tax-exempt income |
(609 | ) | (571 | ) | (601 | ) | ||||||
| Effect of investment in life insurance |
(149 | ) | (91 | ) | (92 | ) | ||||||
| Nondeductible interest |
62 | 68 | 81 | |||||||||
| Other items |
19 | 102 | 5 | |||||||||
| (Benefit from) provision for income taxes |
$ | (2,208 | ) | $ | 1,104 | $ | 1,394 | |||||
Mid Penn has no unrecognized tax benefits that, if recognized, would favorably affect the effective income tax rate in future periods. Mid Penn does not expect the total amount of unrecognized tax benefits to significantly increase or decrease in the next twelve months.
No amounts for interest and penalties were recorded in income tax (benefit) expense in the consolidated statement of operations for the years ended December 31, 2009 or 2008. There were no amounts accrued for interest and penalties at December 31, 2009 or 2008.
Mid Penn and its subsidiaries are subject to U.S. federal income tax and income tax for the state of Pennsylvania. Mid Penn is no longer subject to examination by taxing authorities for years before 2006. Tax years 2006 through the present remain open to examination.
59
Table of Contents
| MID PENN BANCORP, INC. | Notes to Consolidated Financial Statements |
| (17) | Core Deposit Intangible |
A summary of core deposit intangible is as follows at December 31, 2009.
| (Dollars in thousands) | 2004 | 2006 | Total | |||||||||
| Acquisition | Acquisition | |||||||||||
| Gross carrying amount |
$ | 291 | $ | 232 | $ | 523 | ||||||
| Less accumulated amortization |
(202 | ) | (89 | ) | (291 | ) | ||||||
| Net carrying amount |
$ | 89 | $ | 143 | $ | 232 | ||||||
The core deposit intangibles for the acquisitions are being amortized over the weighted average useful life of 8 years, with no estimated residual value.
Amortization expense amounted to $65,000 in 2009, $66,000 in 2008, and $66,000 in 2007.
The estimated amortization expenses of intangible assets for each of the five succeeding fiscal years are as follows:
| (Dollars in thousands) | |||
| 2010 |
$ | 65 | |
| 2011 |
65 | ||
| 2012 |
45 | ||
| 2013 |
29 | ||
| 2014 |
28 | ||
| $ | 232 | ||
| (18) | Regulatory Matters |
Mid Penn Bancorp, Inc., Inc. is a financial holding company and, as such, chooses to maintain a well-capitalized status in its bank subsidiary. Quantitative measures established by regulation to ensure capital adequacy require Mid Penn to maintain minimum amounts and ratios (set forth below) of Tier 1 capital to average assets and of total capital (as defined in the regulations) to risk-weighted assets. As of December 31, 2009 and December 31, 2008, Mid Penn met all capital adequacy requirements to which the Bank is subject, and the Bank is considered “well-capitalized”. However, future changes in regulations could increase capital requirements and may have an adverse effect on capital resources.
The FDIC Board has adopted a restoration plan that raised assessment rates for deposit insurance premiums for 2009, and enacted a special emergency assessment that has significantly affected operating results for the Corporation. The assessment was .05% of total Bank Assets, less Tier 1 Capital as of June 30, 2009, and was paid on September 30, 2009. The special assessment for Mid Penn’s banking subsidiary was $265,000.
The FDIC has also adopted a prepayment of projected deposit insurance premiums for a three-year period that would be paid on December 30, 2009. The prepayment was approximately $2,719,000 for the Corporation. The prepayment will be carried as a prepaid expense in other assets on the balance sheet and amortized into expense in the operating period to which it applies.
Certain restrictions exist regarding the ability of the Bank to transfer funds to the Corporation in the form of cash dividends, loans or advances. At December 31, 2009, $0 of undistributed earnings of the Bank included in the consolidated shareholders’ equity, was available for distribution to the Corporation as dividends without prior regulatory approval, subject to regulatory capital requirements below.
60
Table of Contents
| MID PENN BANCORP, INC. | Notes to Consolidated Financial Statements |
Mid Penn maintained the following regulatory capital levels, leverage ratios, and risk-based capital ratios as of December 31, 2009, and December 31, 2008, as follows:
| (Dollars in thousands) | Capital Adequacy | |||||||||||||||||
| Actual: | Minimum Capital Required: |
To Be Well-Capitalized Under Prompt Corrective Action Provisions: |
||||||||||||||||
| Amount | Ratio | Amount | Ratio | Amount | Ratio | |||||||||||||
| Corporation |
||||||||||||||||||
| As of December 31, 2009: |
||||||||||||||||||
| Tier 1 Capital (to Average Assets) |
$ | 44,665 | 7.4 | % | $ | 24,033 | 4.0 | % | N/A | N/A | ||||||||
| Tier 1 Capital (to Risk Weighted Assets) |
44,665 | 9.2 | % | 19,329 | 4.0 | % | N/A | N/A | ||||||||||
| Total Capital (to Risk Weighted Assets) |
50,727 | 10.5 | % | 38,658 | 8.0 | % | N/A | N/A | ||||||||||
| Bank |
||||||||||||||||||
| As of December 31, 2009: |
||||||||||||||||||
| Tier 1 Capital (to Average Assets) |
$ | 44,434 | 7.4 | % | $ | 23,913 | 4.0 | % | $ | 29,892 | 5.0 | % | ||||||
| Tier 1 Capital (to Risk Weighted Assets) |
44,434 | 9.2 | % | 19,329 | 4.0 | % | 28,993 | 6.0 | % | |||||||||
| Total Capital (to Risk Weighted Assets) |
50,496 | 10.4 | % | 38,658 | 8.0 | % | 48,322 | 10.0 | % | |||||||||
| Corporation |
||||||||||||||||||
| As of December 31, 2008: |
||||||||||||||||||
| Tier 1 Capital (to Average Assets) |
$ | 48,998 | 8.7 | % | $ | 23,641 | 4.0 | % | N/A | N/A | ||||||||
| Tier 1 Capital (to Risk Weighted Assets) |
48,998 | 11.3 | % | 17,284 | 4.0 | % | N/A | N/A | ||||||||||
| Total Capital (to Risk Weighted Assets) |
54,399 | 12.6 | % | 34,568 | 8.0 | % | N/A | N/A | ||||||||||
| Bank |
||||||||||||||||||
| As of December 31, 2008: |
||||||||||||||||||
| Tier 1 Capital (to Average Assets) |
$ | 39,975 | 7.2 | % | $ | 22,146 | 4.0 | % | $ | 27,683 | 5.0 | % | ||||||
| Tier 1 Capital (to Risk Weighted Assets) |
39,975 | 9.3 | % | 17,278 | 4.0 | % | 25,917 | 6.0 | % | |||||||||
| Total Capital (to Risk Weighted Assets) |
45,376 | 10.5 | % | 34,556 | 8.0 | % | 43,195 | 10.0 | % | |||||||||
| (19) | Concentration of Risk and Off-Balance Sheet Risk |
The Bank is a party to financial instruments with off-balance sheet risk in the normal course of business to meet the financing needs of its customers. These financial instruments include commitments to extend credit and financial standby letters of credit. Those instruments involve, to varying degrees, elements of credit and interest rate risk in excess of the amount recognized in the consolidated balance sheets.
The Bank evaluates each customer’s creditworthiness on a case-by-case basis. The amount of collateral obtained, if deemed necessary by the Bank upon extension of credit, is based on management’s credit evaluation of the borrower. Collateral held varies but may include accounts receivable, inventory, property, plant, and equipment, and income-producing commercial properties. The Bank’s exposure to credit loss in the event of nonperformance by the other party to the financial instrument for commitments to extend credit and financial standby letters of credit written is represented by the contractual amount of those instruments. The Bank uses the same credit policies in making commitments and conditional obligations as it does for direct, funded loans.
Commitments to extend credit are agreements to lend to a customer as long as there is no violation of any condition established in the contract. Commitments generally have fixed expiration dates or other termination clauses and may require payment of a fee. Since many of the commitments are expected to expire without being drawn upon, the total commitment amounts do not necessarily represent future cash requirements.
Financial standby letters of credit are conditional commitments issued by the Bank to guarantee the performance of a customer to a third party. The credit risk involved in issuing letters of credit is essentially the same as that involved in extending loan facilities to customers. The term of these financial standby letters of credit is generally one year or less.
As of December 31, 2009, commitments to extend credit amounted to $116,486,000 and financial standby letters of credit amounted to $10,697,000.
61
Table of Contents
| MID PENN BANCORP, INC. | Notes to Consolidated Financial Statements |
Significant concentration of credit risk may occur when obligations of parties engaged in similar activities occur and accumulate in significant amounts.
In analyzing the Bank’s exposure to significant concentration of credit risk, management set a parameter of 10% or more of the Bank’s total net loans outstanding as the threshold in determining whether the obligations of the same or affiliated parties would be classified as significant concentration of credit risk. Concentrations by industry, product line, type of collateral, etc., are also considered. U.S. Treasury securities, obligations of U.S. government agencies and corporations, and any assets collateralized by the same were excluded.
As of December 31, 2009, commercial real estate financing was the only similar activity that met the requirements to be classified as a significant concentration of credit risk. However, there is a geographical concentration in that most of the Bank’s business activity is with customers located in Central Pennsylvania, specifically within the Bank’s trading area made up of Dauphin County, lower Northumberland County, western Schuylkill County and eastern Cumberland County.
The Bank’s highest concentrations of credit within the loan portfolio are in the areas of Commercial Real Estate financing (25.4%), Hotel/Motel financing (7.0%), Commercial Construction and Land Development (5.6%), and Restaurant financings (2.5%) as of December 31, 2009.
| (20) | Commitments and Contingencies |
Operating Leases:
In April 2005, Mid Penn entered into a non-cancelable operating lease agreement to lease approximately 2,500 square feet of office space in the downtown Harrisburg area, with the initial term extending through April 2010. Mid Penn has the option to renew this lease for two additional five-year periods and has exercised the first of these options, extending the term of the lease through April of 2015. Mid Penn also has entered into a non-cancelable lease on a drive-up ATM site in Halifax, PA. This lease runs through October of 2012.
Minimum future rental payments under these operating leases as of December 31, 2009 are as follows:
| (Dollars in thousands) | |||
| 2010 |
$ | 79 | |
| 2011 |
81 | ||
| 2012 |
82 | ||
| 2013 |
78 | ||
| 2014 |
80 | ||
| Thereafter |
27 | ||
| $ | 427 | ||
Mid Penn paid rent payments in 2009, 2008, and 2007 of $97,000, $92,000, and $98,000 respectively.
Litigation:
Mid Penn is subject to lawsuits and claims arising out of its business. In the opinion of management, after consultation with legal counsel, the ultimate disposition of these matters is not expected to have a material adverse effect on the consolidated financial condition of Mid Penn.
| (21) | Common Stock |
Mid Penn has reserved 50,000 of authorized, but unissued shares of its common stock for issuance under a Stock Bonus Plan (the “Plan”). Shares issued under the Plan are at the discretion of the board of directors.
Under Mid Penn’s amended and restated dividend reinvestment plan, (DRIP), 200,000 of Mid Penn’s authorized but unissued common stock are reserved for issuance. The DRIP also allows for voluntary cash payments within specified limits, for the purchase of additional shares.
In September of 2005, Mid Penn’s Board of Directors approved a Stock Repurchase Program under which the Corporation could buy back up to 250,000 shares of Mid Penn Bancorp, Inc., Inc. Common Stock. Through December 31, 2008, 53,560 shares had been repurchased at an average price of $24.75 per share. Mid Penn retired all treasury stock in December of 2008 and the Stock Repurchase Program was terminated on December 10, 2008.
62
Table of Contents
| MID PENN BANCORP, INC. | Notes to Consolidated Financial Statements |
| (22) | Preferred Stock |
On December 19, 2008, Mid Penn entered into and closed a Letter Agreement with the United States Department of the Treasury (the “Treasury”) pursuant to which the Treasury invested $10,000,000 in the Corporation under the Treasury’s Capital Purchase Program (the “CPP”).
Under the CPP, the Treasury received (1) 10,000 shares of Series A Fixed Rate Cumulative Perpetual Preferred Stock, $1,000 liquidation preference, and (2) Warrants to purchase up to 73,099 shares of the Corporation’s common stock at an exercise price of $20.52 per share. The $10,000,000 in new capital is treated as Tier 1 Capital.
The Series A Preferred Stock pays cumulative dividends at a rate of 5% per annum for the first five years and 9% per annum thereafter. Pursuant to the American Recovery and Reinvestment Act of 2009, the Secretary of the Treasury shall permit, subject to consultation with the appropriate Federal banking agency, the Corporation to redeem the Series A Preferred Stock. The Corporation may do so without regard to the source of the funds to be used to redeem the Series A Preferred Stock or any minimum waiting period. If the Corporation elects to redeem the Series A Preferred Stock prior to February 15, 2012, and receives approval from the Treasury and the Board of Governors of the Federal Reserve System, it must redeem at least $2,500,000 of the Series A Preferred Stock. Upon redemption of the Series A Preferred Stock, the Secretary of the Treasury shall liquidate the warrants associated with the Corporation’s participation in the CPP at the current market price. Upon the appropriate approval, the Corporation may redeem the Series A Preferred Stock at the original purchase price plus accrued but unpaid dividends, if any. The related Warrants expire in ten years and are immediately exercisable upon their issuance.
To participate in the program, the Corporation is required to meet certain standards, including; (1) ensuring that incentive compensation for senior executives does not encourage unnecessary and excessive risk that threaten the value of the Corporation; (2) requiring a clawback of any bonus or incentive compensation paid to a senior executive based on statements of earnings, gains or other criteria that are later proven to be materially inaccurate; (3) prohibiting the Corporation from making any golden parachute payment to a senior executive based on applicable Internal Revenue Code provisions; and (4) agreeing not to deduct for tax purposes executive compensation in excess of $500,000 for each senior executive.
Based on the Program term sheet provided by the Treasury, the following are the effects on holders of common stock from the issuance of Senior Preferred stock to the Treasury under the Program:
Restrictions on Dividends
For as long as any Senior Preferred shares are outstanding, no dividends could be declared or paid on common shares, nor could the Corporation repurchase or redeem any common shares, unless all accrued and unpaid dividends for all past dividend periods on the Senior Preferred shares had been fully paid. In addition, the consent of the Treasury would be required for any increase in the per share dividends on common shares until the third anniversary of the date of the Senior Preferred investment unless prior to such third anniversary, the Senior Preferred shares were redeemed in whole or the Treasury had transferred all of the Senior Preferred shares to third parties.
Repurchases
The Treasury’s consent would be required for any share repurchases (other than (1) repurchases of the Senior Preferred shares and (2) repurchases of common shares in connection with any benefit plan in the ordinary course of business consistent with past practice) until the third anniversary of the date of this investment unless prior to such third anniversary the Senior Preferred shares had been redeemed in whole or the Treasury had transferred all of the Senior Preferred shares to third parties. In addition, there could be no share repurchases of common shares if prohibited as described under “Restrictions on Dividends” above.
Voting Rights
The Senior Preferred shares would be non-voting, other than class voting rights on (1) any authorization or issuance of shares ranking senior to the Senior Preferred shares, (2) any amendment to the rights of senior Preferred, or (3) any merger, exchange or similar transaction which would adversely affect the rights of the Senior Preferred. If dividends on the Senior Preferred shares were not paid in full for six dividend periods, whether or not consecutive, the Senior Preferred shareholder(s) would have the right to elect two directors. The right to elect directors would end when full dividends had been paid for four consecutive dividend periods.
63
Table of Contents
| MID PENN BANCORP, INC. | Notes to Consolidated Financial Statements |
| (23) | Parent Company Statements |
CONDENSED BALANCE SHEETS
| (Dollars in thousands) | December 31, | |||||
| 2009 | 2008 | |||||
| ASSETS |
||||||
| Cash and cash equivalents |
$ | 173 | $ | 57 | ||
| U.S. Treasury investments |
— | 9,000 | ||||
| Investment in subsidiaries |
46,475 | 41,779 | ||||
| Other assets |
56 | 70 | ||||
| Total assets |
$ | 46,704 | $ | 50,906 | ||
| LIABILITIES AND SHAREHOLDERS’ EQUITY |
||||||
| Other liabilities |
$ | — | $ | 16 | ||
| Shareholders’ equity |
46,704 | 50,890 | ||||
| Total liabilities and shareholders’ equity |
$ | 46,704 | $ | 50,906 | ||
CONDENSED STATEMENTS OF OPERATIONS
| (Dollars in thousands) | For Years Ended December 31, | |||||||||||
| 2009 | 2008 | 2007 | ||||||||||
| Dividends from subsidiaries |
$ | 2,498 | $ | 3,077 | $ | 3,224 | ||||||
| Undistributed (loss) earnings of subsidiaries |
(4,673 | ) | 628 | 1,517 | ||||||||
| Other expenses |
(182 | ) | (201 | ) | (107 | ) | ||||||
| Income tax benefit |
62 | 84 | 37 | |||||||||
| Net (loss) income |
$ | (2,295 | ) | $ | 3,588 | $ | 4,671 | |||||
CONDENSED STATEMENTS OF CASH FLOWS
| (Dollars in thousands) | For Years Ended December 31, | |||||||||||
| 2009 | 2008 | 2007 | ||||||||||
| CASH FLOWS FROM OPERATING ACTIVITIES |
||||||||||||
| Net (loss) income |
$ | (2,295 | ) | $ | 3,588 | $ | 4,671 | |||||
| Loss (income) from subsidiaries |
4,673 | (628 | ) | (1,517 | ) | |||||||
| Decrease in other liabilities |
— | (16 | ) | — | ||||||||
| Net cash provided by operating activities |
2,378 | 2,944 | 3,154 | |||||||||
| CASH FLOWS FROM INVESTING ACTIVITIES |
||||||||||||
| Proceeds from the maturity of investment securities |
9,000 | — | — | |||||||||
| Purchase of investment securities |
— | (9,000 | ) | — | ||||||||
| Net cash provided by (used in) investing activities |
9,000 | (9,000 | ) | — | ||||||||
| CASH FLOWS FROM FINANCING ACTIVITIES |
||||||||||||
| Issued senior preferred stock |
— | 10,000 | — | |||||||||
| Investment in subsidiaries |
(9,000 | ) | (1,000 | ) | — | |||||||
| Dividends paid |
(2,262 | ) | (2,787 | ) | (2,773 | ) | ||||||
| Purchase of treasury stock |
— | (252 | ) | (506 | ) | |||||||
| Net cash (used in) provided by financing activities |
(11,262 | ) | 5,961 | (3,279 | ) | |||||||
| Net increase (decrease) in cash and cash equivalents |
116 | (95 | ) | (125 | ) | |||||||
| Cash and cash equivalents at beginning of period |
57 | 152 | 277 | |||||||||
| Cash and cash equivalents at end of period |
$ | 173 | $ | 57 | $ | 152 | ||||||
64
Table of Contents
| MID PENN BANCORP, INC. | Notes to Consolidated Financial Statements |
| (24) | Recent Accounting Pronouncements |
ASU 2009-16: In October 2009, the FASB issued Accounting Standards Update (“ASU”) 2009-16, Transfers and Servicing (Topic 860) - Accounting for Transfers of Financial Assets. This Update amends the Codification for the issuance of FASB Statement No. 166, Accounting for Transfers of Financial Assets-an amendment of FASB Statement No. 140.
The amendments in this Update improve financial reporting by eliminating the exceptions for qualifying special-purpose entities from the consolidation guidance and the exception that permitted sale accounting for certain mortgage securitizations when a transferor has not surrendered control over the transferred financial assets. In addition, the amendments require enhanced disclosures about the risks that a transferor continues to be exposed to because of its continuing involvement in transferred financial assets. Comparability and consistency in accounting for transferred financial assets will also be improved through clarifications of the requirements for isolation and limitations on portions of financial assets that are eligible for sale accounting.
This Update is effective at the start of a reporting entity’s first fiscal year beginning after November 15, 2009. Early application is not permitted. The Corporation does not expect the adoption of this standard will have a significant impact on its financial condition or results of operations.
ASU 2010-01: In January 2010, the FASB issued ASU 2010-01, Equity (Topic 505) - Accounting for Distributions to Shareholders with Components of Stock and Cash. The amendments in this Update clarify that the stock portion of a distribution to shareholders that allows them to elect to receive cash or stock with a potential limitation on the total amount of cash that all shareholders can elect to receive in the aggregate is considered a share issuance that is reflected in earnings per share prospectively and is not a stock dividend. This Update codifies the consensus reached in EITF Issue No. 09-E, “Accounting for Stock Dividends, Including Distributions to Shareholders with Components of Stock and Cash.”
This Update is effective for interim and annual periods ending on or after December 15, 2009, and should be applied on a retrospective basis. The adoption of this standard did not have a significant impact on the Corporation’s financial condition or results of operations.
ASU 2010-06: The FASB has issued ASU 2010-06, Fair Value Measurements and Disclosures (Topic 820): Improving Disclosures about Fair Value Measurements. This ASU requires some new disclosures and clarifies some existing disclosure requirements about fair value measurement as set forth in Codification Subtopic 820-10. The FASB’s objective is to improve these disclosures and, thus, increase the transparency in financial reporting. Specifically, ASU 2010-06 amends Codification Subtopic 820-10 to now require:
| • | A reporting entity to disclose separately the amounts of significant transfers in and out of Level 1 and Level 2 fair value measurements and describe the reasons for the transfers; and |
| • | In the reconciliation for fair value measurements using significant unobservable inputs, a reporting entity should present separately information about purchases, sales, issuances, and settlements. |
In addition, ASU 2010-06 clarifies the requirements of the following existing disclosures:
| • | For purposes of reporting fair value measurement for each class of assets and liabilities, a reporting entity needs to use judgment in determining the appropriate classes of assets and liabilities; and |
| • | A reporting entity should provide disclosures about the valuation techniques and inputs used to measure fair value for both recurring and nonrecurring fair value measurements. |
ASU 2010-06 is effective for interim and annual reporting periods beginning after December 15, 2009, except for the disclosures about purchases, sales, issuances, and settlements in the roll forward of activity in Level 3 fair value measurements. Those disclosures are effective for fiscal years beginning after December 15, 2010, and for interim periods within those fiscal years. Early adoption is permitted. The Corporation does not expect the adoption of this standard will have a significant impact on its financial condition or results of operations.
65
Table of Contents
| MID PENN BANCORP, INC. | Notes to Consolidated Financial Statements |
| (25) | Summary of Quarterly Consolidated Financial Data (Unaudited) |
The following table presents summarized quarterly financial data for 2009 and 2008.
| (Dollars in thousands, except per share data) | 2009 Quarter Ended | ||||||||||||||
| March 31 | June 30 | September 30 | December 31 | ||||||||||||
| Interest Income |
$ | 7,565 | $ | 7,993 | $ | 7,886 | $ | 7,892 | |||||||
| Interest Expense |
3,609 | 3,262 | 3,216 | 3,217 | |||||||||||
| Net Interest Income |
3,956 | 4,731 | 4,670 | 4,675 | |||||||||||
| Provision for Loan and Lease Losses |
933 | 479 | 1,108 | 7,000 | |||||||||||
| Net Interest Income (Loss) After Provision for Loan Losses |
3,023 | 4,252 | 3,562 | (2,325 | ) | ||||||||||
| Noninterest Income |
941 | 861 | 909 | 945 | |||||||||||
| Noninterest Expense |
3,868 | 4,341 | 4,230 | 4,232 | |||||||||||
| Income (Loss) Before (Benefit from) Provision for Income Taxes |
96 | 772 | 241 | (5,612 | ) | ||||||||||
| (Benefit from) Provision for Income Taxes |
(117 | ) | 59 | (93 | ) | (2,057 | ) | ||||||||
| Net Income (Loss) |
213 | 713 | 334 | (3,555 | ) | ||||||||||
| Preferred Stock Dividends and Discount Accretion |
128 | 129 | 128 | 129 | |||||||||||
| Net Income (Loss) Available to Common Shareholders |
$ | 85 | $ | 584 | $ | 206 | $ | (3,684 | ) | ||||||
| Per Share Data: |
|||||||||||||||
| Basic (Loss) Earnings Per Share |
$ | 0.02 | $ | 0.17 | $ | 0.06 | $ | (1.06 | ) | ||||||
| Diluted (Loss) Earnings Per Share |
0.02 | 0.17 | 0.06 | (1.06 | ) | ||||||||||
| Cash Dividends |
0.20 | 0.16 | 0.16 | — | |||||||||||
| (Dollars in thousands, except per share data) | 2008 Quarter Ended | ||||||||||||||
| March 31 | June 30 | September 30 | December 31 | ||||||||||||
| Interest Income |
$ | 8,077 | $ | 7,786 | $ | 7,986 | $ | 8,007 | |||||||
| Interest Expense |
3,877 | 3,639 | 3,694 | 3,680 | |||||||||||
| Net Interest Income |
4,200 | 4,147 | 4,292 | 4,327 | |||||||||||
| Provision for Loan and Lease Losses |
100 | 155 | 275 | 700 | |||||||||||
| Net Interest Income After Provision for Loan Losses |
4,100 | 3,992 | 4,017 | 3,627 | |||||||||||
| Noninterest Income |
896 | 906 | 998 | 882 | |||||||||||
| Noninterest Expense |
3,446 | 3,478 | 3,525 | 4,277 | |||||||||||
| Income Before Provision for (Benefit from) Income Taxes |
1,550 | 1,420 | 1,490 | 232 | |||||||||||
| Provision for (Benefit from) Income Taxes |
377 | 360 | 368 | (1 | ) | ||||||||||
| Net Income |
1,173 | 1,060 | 1,122 | 233 | |||||||||||
| Preferred Stock Dividends and Discount Accretion |
— | — | — | 16 | |||||||||||
| Net Income Available to Common Shareholders |
$ | 1,173 | $ | 1,060 | $ | 1,122 | $ | 217 | |||||||
| Per Share Data: |
|||||||||||||||
| Basic Earnings Per Share |
$ | 0.34 | $ | 0.30 | $ | 0.32 | $ | 0.07 | |||||||
| Diluted Earnings Per Share |
0.34 | 0.30 | 0.32 | 0.07 | |||||||||||
| Cash Dividends |
0.20 | 0.20 | 0.20 | 0.20 | |||||||||||
66
Table of Contents
MID PENN BANCORP, INC.
ITEM 9. CHANGES IN AND DISAGREEMENTS WITH ACCOUNTANTS ON ACCOUNTING AND FINANCIAL DISCLOSURE
None
ITEM 9A. CONTROLS AND PROCEDURES
Evaluation of Disclosure Controls and Procedures
Mid Penn carried out an evaluation, under the supervision and with the participation of its management, including the Chief Executive Officer and Treasurer, of the effectiveness of the design and operation of our disclosure controls and procedures pursuant to Exchange Act Rule 13a-15 as of December 31, 2009. Based upon that evaluation, the Chief Executive Officer and Treasurer concluded, as of December 31, 2009, that, Mid Penn’s disclosure controls and procedures were effective in recording, processing, summarizing, and reporting information required to be disclosed by Mid Penn, within the time periods specified in the SEC’s rules and forms, and such information is accumulated and communicated to management to allow timely decisions regarding required disclosures.
Changes in Internal Controls over Financial Reporting
There have been no changes in Mid Penn’s internal control over financial reporting during the fourth quarter of 2009 that have materially affected, or are reasonably likely to materially affect, Mid Penn’s internal control over financial reporting.
Mid Penn Bancorp, Inc., Inc. Management Report on Internal Controls over Financial Reporting
Management is responsible for establishing and maintaining adequate internal control over financial reporting as defined in Rule 13a and 15(d) – 15(f) under the Exchange Act of 1934 (“1934 Act”). The corporation’s internal control over financial reporting includes those policies and procedures that pertain to the corporation’s ability to record, process, summarize, and report reliable financial data. All internal control systems have inherent limitations in the effectiveness of any internal control over financial reporting, including the possibility of human error and the circumvention or overriding of internal control. Accordingly, even effective internal control over financial reporting can provide only reasonable assurance with respect to financial statement preparation and presentation. Further, because of changes in conditions, the effectiveness of internal control over financial reporting may vary over time.
In order to ensure that the corporation’s internal control over financial reporting is effective, management regularly assesses such controls and did so most recently for its financial reporting as of December 31, 2009. This assessment was based on criteria for effective internal control over financial reporting described in Internal Control-Integrated Framework issued by the Committee of Sponsoring Organizations of the Treadway Commission (“COSO”). Management has concluded that Mid Penn’s internal control over financial reporting, as of December 31, 2009, is effective based on those criteria.
The independent registered public accounting firm that audited Mid Penn’s consolidated financial statements has issued an audit report on the effectiveness of the corporation’s internal control over financial reporting as of December 31, 2009.
| Rory G. Ritrievi |
Kevin W. Laudenslager | |
| President and |
Vice President and | |
| Chief Executive Officer |
Treasurer |
None
67
Table of Contents
REPORT OF INDEPENDENT REGISTERED
PUBLIC ACCOUNTING FIRM
To the Board of Directors and Shareholders
Mid Penn Bancorp, Inc., Inc.:
We have audited Mid Penn Bancorp, Inc., Inc. and Subsidiaries’ (the “Corporation”) internal control over financial reporting as of December 31, 2009, based on criteria established in Internal Control-Integrated Framework issued by the Committee of Sponsoring Organizations of the Treadway Commission (“COSO”). The Corporation’s management is responsible for maintaining effective internal control over financial reporting and for its assessment of the effectiveness of internal control over financial reporting included in the accompanying Mid Penn Bancorp, Inc., Inc. Management Report on Internal Controls Over Financial Reporting. Our responsibility is to express an opinion on the Corporation’s internal control over financial reporting based on our audit.
We conducted our audit in accordance with the standards of the Public Company Accounting Oversight Board (United States). Those standards require that we plan and perform the audit to obtain reasonable assurance about whether effective internal control over financial reporting was maintained in all material respects. Our audit of internal control over financial reporting included obtaining an understanding of internal control over financial reporting, assessing the risk that a material weakness exists, and testing and evaluating the design and operating effectiveness of internal control based on the assessed risk. Our audit also included performing such other procedures as we considered necessary in the circumstances. We believe that our audit provides a reasonable basis for our opinion.
A company’s internal control over financial reporting is a process designed to provide reasonable assurance regarding the reliability of financial reporting and the preparation of financial statements for external purposes in accordance with generally accepted accounting principles. A company’s internal control over financial reporting includes those policies and procedures that (1) pertain to the maintenance of records that, in reasonable detail, accurately and fairly reflect the transactions and dispositions of the assets of the company; (2) provide reasonable assurance that transactions are recorded as necessary to permit preparation of financial statements in accordance with generally accepted accounting principles, and that receipts and expenditures of the company are being made only in accordance with authorizations of management and directors of the company; and (3) provide reasonable assurance regarding prevention or timely detection of unauthorized acquisition, use, or disposition of the company’s assets that could have a material effect on the financial statements.
Because of its inherent limitations, internal control over financial reporting may not prevent or detect misstatements. Also, projections of any evaluation of effectiveness to future periods are subject to the risk that controls may become inadequate because of changes in conditions, or that the degree of compliance with the policies or procedures may deteriorate.
In our opinion, the Corporation maintained, in all material respects, effective internal control over financial reporting as of December 31, 2009, based on criteria established in Internal Control-Integrated Framework issued by the Committee of Sponsoring Organizations of the Treadway Commission (“COSO”).
We have also audited, in accordance with the standards of the Public Company Accounting Oversight Board (United States), the consolidated balance sheets and related consolidated statements of operations, changes in shareholders’ equity, and cash flows of the Corporation and our report dated March 16, 2010 expressed an unqualified opinion.

ParenteBeard LLC
Harrisburg, Pennsylvania
March 16, 2010
68
Table of Contents
MID PENN BANCORP, INC.
PART III
ITEM 10. DIRECTORS, EXECUTIVE OFFICERS AND CORPORATE GOVERNANCE
The information required by this Item, relating to directors, executive officers, and control persons is set forth under the captions “Executive Officers”, “Information Regarding Director Nominees and Continuing Directors”, “Compliance with Section 16(a) Reporting”, “Audit Committee Report”, and “Governance of the Corporation” in Mid Penn’s definitive proxy statement to be used in connection with the 2010 Annual Meeting of Shareholders, which pages are incorporated herein by reference.
The Corporation has adopted a Code of Ethics that applies to directors, officers and employees of the Corporation and the Bank. The Corporation amended the Code of Ethics twice in 2005 and a copy of the Code of Ethics is included as Exhibit 14 to the Form 8-K filed with the Securities and Exchange Commission on March 9, 2005. A request for the Corporation’s Code of Ethics can be made in writing to Kevin W. Laudenslager, 349 Union Street, Millersburg, PA 17061, by telephone at 717-692-2133, or through the Mid Penn website at www.midpennbank.com.
ITEM 11. EXECUTIVE COMPENSATION
The information required by this Item, relating to executive compensation, is set forth under the captions “Compensation Discussion and Analysis”, “Executive Compensation”, “Potential Payments Upon Termination or Change In Control”, “Election of Directors”, “Compensation Committee Report” and “Compensation Committee Interlocks and Insider Participation” of Mid Penn’s definitive proxy statement to be used in connection with the 2010 Annual Meeting of Shareholders, which pages are incorporated herein by reference.
ITEM 12. SECURITY OWNERSHIP OF CERTAIN BENEFICIAL OWNERS AND MANAGEMENT AND RELATED SHAREHOLDER MATTERS
The information required by this Item, relating to beneficial ownership of Mid Penn’s common stock, is set forth under the caption “Beneficial Ownership of Mid Penn Bancorp, Inc.’s Stock Held By Principal Shareholders and Management” of Mid Penn’s definitive proxy statement to be used in connection with the 2010 Annual Meeting of Shareholders, which pages are incorporated herein by reference. Mid Penn does not maintain any equity compensation plans.
ITEM 13. CERTAIN RELATIONSHIPS AND RELATED TRANSACTIONS, AND DIRECTOR INDEPENDENCE
The information required by this Item, relating to transactions with management and others, certain business relationships and indebtedness of management, is set forth under the captions “Certain Relationships and Related Transactions” and “Governance of the Corporation” of Mid Penn’s definitive proxy statement to be used in connection with the 2010 Annual Meeting of Shareholders, which page is incorporated herein by reference.
ITEM 14. PRINCIPAL ACCOUNTANT FEES AND SERVICES
The information required by this Item, relating to the fees and services provided by Mid Penn’s principal accountant, is set forth under the caption “Audit Committee Report” of Mid Penn’s definitive proxy statement to be used in connection with the 2010 Annual Meeting of Shareholders, which page is incorporated herein by reference.
69
Table of Contents
MID PENN BANCORP, INC.
PART IV
ITEM 15. EXHIBITS AND FINANCIAL STATEMENT SCHEDULES
| 1. | Financial statements are incorporated by reference in Part II, Item 8 hereof. |
Report of Independent Registered Public Accounting Firm
Consolidated Balance Sheets
Consolidated Statements of Operations
Consolidated Statements of Cash Flows
Consolidated Statements of Changes in Shareholders’ Equity
Notes to Consolidated Financial Statements
| 2. | The financial statement schedules, required by Regulation S-X, are omitted because the information is either not applicable or is included elsewhere in the consolidated financial statements. |
| 3. | The following Exhibits are filed as part of this filing on Form 10-K, or incorporated by reference hereto: |
| 3(i) |
The Registrant’s Articles of Incorporation. (Incorporated by reference to Exhibit 3.1 of Registrant’s Registration Statement on Form S-3 (Registration No. 333-156759.) | |
| 3(ii) |
Statement with Respect to Shares for Series A Preferred Stock. (Incorporated by reference to Exhibit 3.1 to Registrant’s Current Report on Form 8-K as filed with the Securities and Exchange Commission on December 22, 2008.) | |
| 3(iii) |
The Registrant’s By-laws. (Incorporated by reference to Exhibit 3(ii) of Registrant’s Annual Report on form 10-K filed with the Securities and Exchange Commission on March 10, 2008.) | |
| 4.1 |
Warrants for Purchase of Shares of Common Stock. (Incorporated by reference to Exhibit 4.1 to Registrant’s Current Report on Form 8-K as filed with the Securities and Exchange Commission on December 22, 2008.) | |
| 10.1 |
Mid Penn Bank’s Retirement Plan. (Incorporated by reference to Exhibit 10.1 of Registrant’s Annual Report on form 10-K filed with the Securities and Exchange Commission on March 10, 2008.) * | |
| 10.2 |
Mid Penn Bank’s Employee Stock Ownership Plan. (Incorporated by reference to Exhibit 10.2 of Registrant’s Annual Report on form 10-K filed with the Securities and Exchange Commission on March 10, 2008.) * | |
| 10.3 |
The Registrant’s Dividend Reinvestment Plan, as amended and restated. (Incorporated by reference to Registrant’s Registration Statement on Form S-3, filed with the SEC on October 12, 2005.) | |
| 10.4 |
Split Dollar Agreement between Mid Penn Bank and Eugene F. Shaffer. (Incorporated by reference to Registrant’s Annual Report on Form 10-K filed with the SEC on March 14, 2005.) * | |
| 10.5 |
Death Benefit Plan and Agreement between Mid Penn Bank and the Trustee of the Eugene F. Shaffer Irrevocable Trust. (Incorporated by reference to Registrant’s Annual Report on Form 10-K filed with the SEC on March 14, 2005.) * | |
| 10.6 |
Severance Agreement dated as of November 26, 2008 between Mid Penn Bank and Alan W. Dakey. (Incorporated by reference to Exhibit 10.1 to Registrant’s Current Report on Form 8-K as filed with the Securities and Exchange Commission on December 1, 2008.) * | |
| 10.7 |
Letter Agreement, dated as of December 19, 2008, Between Mid Penn Bancorp, Inc., Inc. and the United States Department of the Treasury, which includes the Securities Purchase Agreement – Standard Terms attached thereto, with respect to the issuance and sale of the Series A Preferred Stock and the Warrants. (Incorporated by reference to Exhibit 10.1 to Registrant’s Current Report on Form 8-K as filed with the Securities and Exchange Commission on December 22, 2008.) | |
| 11 |
Statement re: Computation of Per Share Earnings. (Incorporated by reference to Part II, Item 8 of this Annual Report on Form 10-K.) | |
| 12 |
Statements re: Computation of Ratios. (Incorporated by reference to Part II, Item 8 of this Annual Report on Form 10-K.) | |
| 14 |
The Registrant’s Code of Ethics. (Incorporated by reference to Registrant’s Form 8-K filed with the Securities and Exchange Commission on March 9, 2005.) | |
70
Table of Contents
MID PENN BANCORP, INC.
| 21 |
Subsidiaries of Registrant. | |
| 23 |
Consent of ParenteBeard LLC. | |
| 31.1 |
Rule 13a-14(a)/15d-14(a) Certification of the Principal Executive Officer. | |
| 31.2 |
Rule 13a-14(a)/15d-14(a) Certification of the Principal Financial Officer. | |
| 32 |
Principal Executive and Financial Officer’s §1350 Certifications. | |
| 99.1 |
Listing of Mid-Atlantic Custom Peer Group Banks. | |
| 99.2 |
Certification of Principal Executive Officer pursuant to the Economic Stabilization Act of 2008. | |
| 99.3 |
Certification of Principal Financial Officer pursuant to the Economic Stabilization Act of 2008. | |
| * | Denotes a management contract or compensatory plan or arrangement. |
71
Table of Contents
MID PENN BANCORP, INC.
Pursuant to the requirements of Section 12 of the Securities Exchange Act of 1934, the Registrant has duly caused this report to be signed on its behalf by the undersigned, thereunto duly authorized.
| By: |
/s/ Rory G. Ritrievi | |
| Rory G. Ritrievi | ||
| President and | ||
| Chief Executive Officer | ||
| (Principal Executive Officer) | ||
| Date: |
March 16, 2010 | |
Pursuant to the requirements of the Securities Exchange Act of 1934, this report has been signed below by the following persons on behalf of the Registrant and in the capacities and on the dates indicated.
| By: |
/s/ Rory G. Ritrievi |
March 16, 2010 | ||||||
| Rory G. Ritrievi | ||||||||
| President, Chief Executive Officer and | ||||||||
| Director (Principal Executive Officer) | ||||||||
| By: |
/s/ Kevin W. Laudenslager |
March 16, 2010 | ||||||
| Kevin W. Laudenslager | ||||||||
| Vice President, Treasurer (Principal Financial Officer) | ||||||||
| By: |
/s/ Jere M. Coxon |
March 16, 2010 | ||||||
| Jere M. Coxon, Director | ||||||||
| By: |
/s/ Matthew G. DeSoto |
March 16, 2010 | ||||||
| Matthew G. DeSoto, Director | ||||||||
| By: |
/s/ A. James Durica |
March 16, 2010 | ||||||
| A. James Durica, Director | ||||||||
| By: |
/s/ Robert C. Grubic |
March 16, 2010 | ||||||
| Robert C. Grubic, Director | ||||||||
| By: |
/s/ Gregory M. Kerwin |
March 16, 2010 | ||||||
| Gregory M. Kerwin, Director | ||||||||
| By: |
/s/ Theodore W. Mowery |
March 16, 2010 | ||||||
| Theodore W. Mowery, Director | ||||||||
| By: |
/s/ Donald E. Sauve |
March 16, 2010 | ||||||
| Donald E. Sauve, Director | ||||||||
| By: |
/s/ Edwin D. Schlegel |
March 16, 2010 | ||||||
| Edwin D. Schlegel, Director | ||||||||
| By: |
/s/ William A. Specht, III |
March 16, 2010 | ||||||
| William A. Specht, Director | ||||||||
72