Attached files
| file | filename |
|---|---|
| EX-99.1 - EXHIBIT 99.1 - FIRST BANCSHARES INC /MS/ | a52420838ex99_1.htm |
| 8-K - THE FIRST BANCSHARES, INC. 8-K - FIRST BANCSHARES INC /MS/ | a52420838.htm |
Exhibit 99.2

April 2021 NASDAQ: FBMS

This IP and certain of our other filings with the Securities and Exchange Commission contain statements
that constitute “forward-looking statements” within the meaning of, and subject to the protections of, Section 27A of the Securities Act of 1933, as amended, and Section 21E of the Securities Exchange Act of 1934, as amended. All statements
other than statements of historical fact are forward-looking statements. Such statements can generally be identified by such words as “believes,” “anticipates,” “expects,” “may,” “will,” “assumes,” “should,” “predicts,” “could,” “would,”
“intends,” “targets,” “estimates,” “projects,” “plans,” “potential” and other similar words and expressions of the future or otherwise regarding the outlook for the Company’s future business and financial performance and/or the performance of
the banking industry and economy in general. Prospective investors are cautioned that any such forward-looking statements are not guarantees of future performance and involve known and unknown risks and uncertainties which may cause the actual
results, performance or achievements of the Company to be materially different from the future results, performance or achievements expressed or implied by such forward-looking statements. Forward-looking statements are based on the information
known to, and current beliefs and expectations of, the Company’s management and are subject to significant risks and uncertainties. Actual results may differ materially from those contemplated by such forward-looking statements. Factors that
might cause such differences include, but are not limited to: (1) competitive pressures among financial institutions increasing significantly; (2) changes in economic or political conditions, either nationally or locally, particularly in areas
in which the Company conducts operations; (3) interest rate risk; (4) changes in applicable laws, rules, or regulations, including changes to statutes, regulations or regulatory policies or practices as a result of, or in response to COVID-19;
(5) risks related to the Company’s recently completed acquisitions, including that the anticipated benefits from the recently completed acquisitions are not realized in the time frame anticipated or at all as a result of changes in general
economic and market conditions or other unexpected factors or events; (6) changes in management’s plans for the future; (7) credit risk associated with our lending activities; (8) changes in interest rates, loan demand, real estate values, or
competition; (9) changes in accounting principles, policies, or guidelines; (10) adverse results from current or future litigation, regulatory examinations or other legal and/or regulatory actions, including as a result of the Company’s
participation in and execution of government programs related to the COVID-19 pandemic; (11) the impact of the COVID-19 pandemic on the Company’s assets, business, cash flows, financial condition, liquidity, prospects and results of operations;
(12) potential increases in the provision for loan losses resulting from the COVID-19 pandemic; and (13) other general competitive, economic, political, and market factors, including those affecting our business, operations, pricing, products,
or services. These and other factors that could cause results to differ materially from those described in the forward-looking statements, as well as a discussion of the risks and uncertainties that may affect our business, can be found in our
Annual Report on Form 10-K and in other filings we make with the Securities and Exchange Commission, which are available on the SEC’s website, http://www.sec.gov. Undue reliance should not be placed on forward-looking statements. The Company
disclaims any obligation to update such factors or to publicly announce the results of any revisions to any of the forward-looking statements included herein to reflect future events or developments, except as required by law. Statements about
the potential effects of the COVID-19 pandemic on the Company’s assets, business, liquidity, financial condition, prospects, and results of operations may constitute forward-looking statements and are subject to the risks that the actual
effects may differ, possibly materially, from what is reflected in these forward-looking statements due to factors and future developments that are uncertain, unpredictable and in many cases beyond our control, including the depth, dispersion
and duration of the pandemic, actions taken by governmental authorities in response to the pandemic, and the direct and indirect impact of the pandemic on customers, employees, third parties and the Company. 2 Forward Looking Statement

3 The First Bancshares: Building Shareholder Value

55.2%Q1 ‘21 Efficiency Ratio, Operating (1) 19.0%Total Capital Ratio as of March 31, 2021 5thLargest
Bank Headquartered in MS $5.4bnAssets as of March 31, 2021 12# of Closed Transactions since 2010 (2) 4 Our Company Company Overview 84Locations in Gulf South: MS, LA, AL, FL & GA 1996Bank Established in Hattiesburg, MS FBMS
Location (84) PENSACOLA DESTIN GULFPORT HATTIESBURG VALDOSTA BATON ROUGE Source: S&P Global Market Intelligence, Company documents(1) Refer to appendix for “Non-GAAP Reconciliation”(2) Includes 10 whole bank acquisitions, 1 branch
acquisition and 1 mortgage company acquisition 1.61% Q1 ’21PTPP ROAA, Operating (1) MOBILE JACKSON TALLAHASSEE

Continuity of Leadership through Multiple Business Cycles 5 Jerome BrownExecutive VPCommunity
Development18 years experience Carol DanielExecutive VPCredit Administrator40 years experience Hayden MitchellExecutive VPLoan Ops & Mortgage 48 years experience Ion MixonExecutive VPRisk Manager22 years experience Jarrett
NicholsonExecutive VPChief Administrative Officer28 years experience Chris RyalsExecutive VPCOO28 years experience M. Ray “Hoppy” Cole, Jr.President/CEO36 Years of Experience Dee Dee LoweryExecutive VP, CFO32 Years of
Experience Responsible for devising and executing a disciplined and successful strategy of organic growth and strategic acquisitions Eric WaldronPresidentMississippi Region26 years experience George NoonanPresidentAlabama Region23 years
experience Wade NethPresidentFlorida Region35 years experience Ronnie FugarinoPresidentLouisiana Region40 years experience Mit ColeExecutive VP Private Banking13 years experience

Evolution of Our Franchise December 31, 2009 March 31, 2021 Total Assets ($mm) – Organic and
Acquisitive Growth Source: S&P Global Market IntelligenceData as of 12/31 of each year, respectively; Q1 ‘21 data as of 3/31/21 2010 – Q1 ‘21 CAGR: 26% FBMS Branch (9) FBMS Branch (82) FBMS LPO
(2) 6 Hattiesburg Hattiesburg Destin Valdosta Gulfport Pensacola

Improving Geographic Diversification of our Balance Sheet 7 2015 Deposits by State March 31, 2021
Deposits by State Source: S&P Global Market Intelligence, Company documents2009 and 2015 data as of 6/30 2015 Loans by State March 31, 2021 Loans by State 2009 Loans by State 2009 Deposits by State

Our Market Demographics 8 Source: S&P Global Market Intelligence Note: Demographic information
may not be indicative of the characteristics of the particular markets in which we operate(1) Demographic data deposit weighted by county; deposit data as of 3/31/21 ‘21 – ‘26 Projected Population Growth (%) ‘21 – ‘26 Projected Median HHI
Growth (%) 2026 Projected Median HHI ($) June 2020 Unemployment Rate (%) (1) (1) (1) (1)

9 2012 2013 2014 2015 2016 2017 2018 2019 2020 Q1 ‘21 Average Stock Price
($) $9.21 $12.99 $14.54 $16.40 $18.88 $29.06 $35.08 $31.79 $24.54 $33.57 Average Market Capitalization ($)In Millions $28.5 $57.3 $75.8 $88.1 $101.4 $277.4 $455.0 $542.9 $505.7 $707.5 Average Daily Volume
(shares) 1,679 3,841 4,453 7,387 3,819 24,078 34,841 48,983 77,982 55,710 Price/LTM EPS (x) 8.1x 14.6x 12.2x 11.8x 16.8x 29.7x 18.7x 15.1x 12.8x 12.8x Price/Tangible Book
(%) 78.8% 130.6% 120.0% 140.0% 177.9% 230.0% 179.2% 188.2% 147.6% 168.2% Market Information and Historical Pricing Source: S&P Global Market Intelligence, Company documentsCompany financial data and market data as of 3/31/21

Montgomery Columbus Birmingham Jacksonville Tallahassee Atlanta Jackson New Orleans Baton
Rouge Shreveport Mobile Huntsville LA MS AL FL GA 10 Overview of
Potential Whole Bank Opportunities Source: S&P Global Market IntelligenceData as of most recent quarter availableNote: Excludes banks and thrifts in north Georgia, greater Atlanta region and only includes banks and thrifts in north
Florida; excludes merger targets and MHCs Opportunities by State Opportunities by Asset Size Includes all banks and thrifts headquartered in Alabama, Louisiana, Mississippi and select Florida and Georgia markets with total assets between
$450 million and $2.0 billion

Ten Years of Record Earnings Superior Performance and Execution Strategically Focused on Acquisitive
and Organic Growth Strong Capital Structure Situated in Growing Markets Shareholder Value and Return Demonstrated Successful Leadership Team 11 Seven ReasonsTo Invest in The First
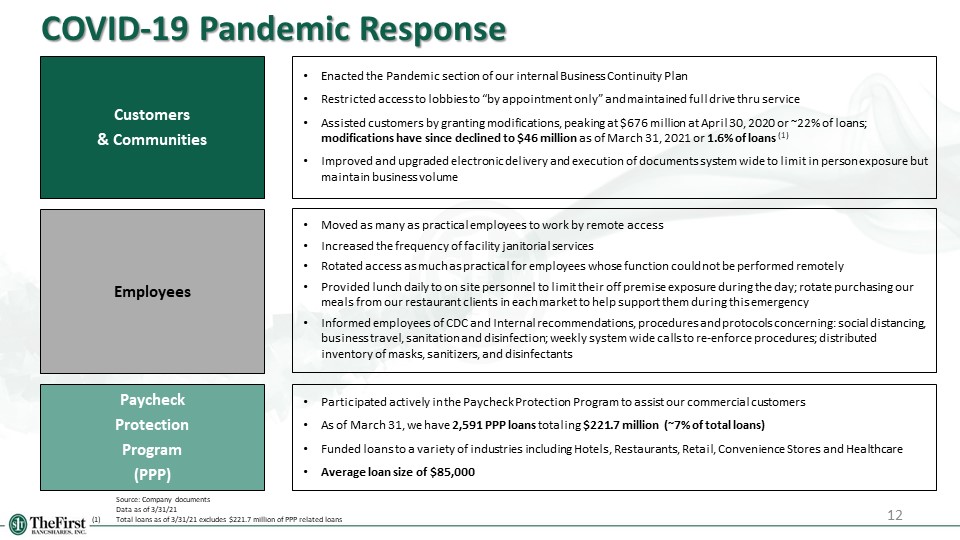
Moved as many as practical employees to work by remote accessIncreased the frequency of facility
janitorial servicesRotated access as much as practical for employees whose function could not be performed remotelyProvided lunch daily to on site personnel to limit their off premise exposure during the day; rotate purchasing our meals from
our restaurant clients in each market to help support them during this emergencyInformed employees of CDC and Internal recommendations, procedures and protocols concerning: social distancing, business travel, sanitation and disinfection; weekly
system wide calls to re-enforce procedures; distributed inventory of masks, sanitizers, and disinfectants 12 COVID-19 Pandemic Response Source: Company documents Data as of 3/31/21(1) Total loans as of 3/31/21 excludes $221.7 million of
PPP related loans Customers & Communities Paycheck Protection Program (PPP) Employees Enacted the Pandemic section of our internal Business Continuity PlanRestricted access to lobbies to “by appointment only” and maintained full drive
thru serviceAssisted customers by granting modifications, peaking at $676 million at April 30, 2020 or ~22% of loans; modifications have since declined to $46 million as of March 31, 2021 or 1.6% of loans (1)Improved and upgraded electronic
delivery and execution of documents system wide to limit in person exposure but maintain business volume Participated actively in the Paycheck Protection Program to assist our commercial customersAs of March 31, we have 2,591 PPP loans
totaling $221.7 million (~7% of total loans)Funded loans to a variety of industries including Hotels, Restaurants, Retail, Convenience Stores and HealthcareAverage loan size of $85,000

13 Highlights Franchise and Management Strength Gulf South markets remain resilient through the
COVID pandemic; unemployment well below national average84 locations across 5 states; ranked in the top 10 by deposit market share by county / parish in ~74% of our franchiseGeographically diversified loan portfolioExperienced, performance
driven management team with local market knowledge Granular Loan and Deposit Portfolio 66% loan-to-deposit ratioCore funded franchise with 97% core deposits and 0.37% cost of depositsIncreased monitoring of hotel, restaurant and retail
portfolioPrudent credit culture and pristine asset quality in light of deferrals Strong Profitability and Capital Position Consistent historic improvement in profitability metrics and differentiated sources of revenueSolid PTPP ROAA (1.61%
in Q1 ‘21) to support capital generation and potentially absorb any loan lossesCapital ratios far in excess of well capitalized minimums (Q1 ’21 CET1 Ratio of 13.5% and Total Capital Ratio of 19.0%)Q1 ‘21 55.2% efficiency ratio, operating
Source: S&P Global Market IntelligenceData as of or for the three months ended 3/31/21

14 Geography Mobile, AL MSA Tallahassee, FL MSA Tallahassee, FL MSA Hammond, LAMSA Destin,
FLMSA Valdosta, GA MSA Date Closed March ‘18 April ‘18 November ‘18 March ‘19 November ‘19 April ‘20 Branches 9 5 6 7 6 8 41 Purchase Price Cash & Stock: $60.0M Cash & Stock: $30.5M Cash & Stock: $80.0M All
Stock: $86.1M Cash & Stock: $84.3M All Stock:
$47.9M -- Assets $398.5M $213.1M $477.1M $375.7M $428.5M $535.7M $2.4B Loans $269.9M $173.1M $331.6M $247.8M $248.9M $394.6M $1.7B Deposits $357.3M $154.2M $428.1M $313.4M $372.3M $475.9M $2.1B Detailed Internal &
3rd Party Loan Review Target Assets / FBMS Assets ~22% ~10% ~19% ~13% ~12% ~13% TotalGained: Building Franchise ValueSix Acquisitions | Closed 2018 – ‘21

15 Financial results
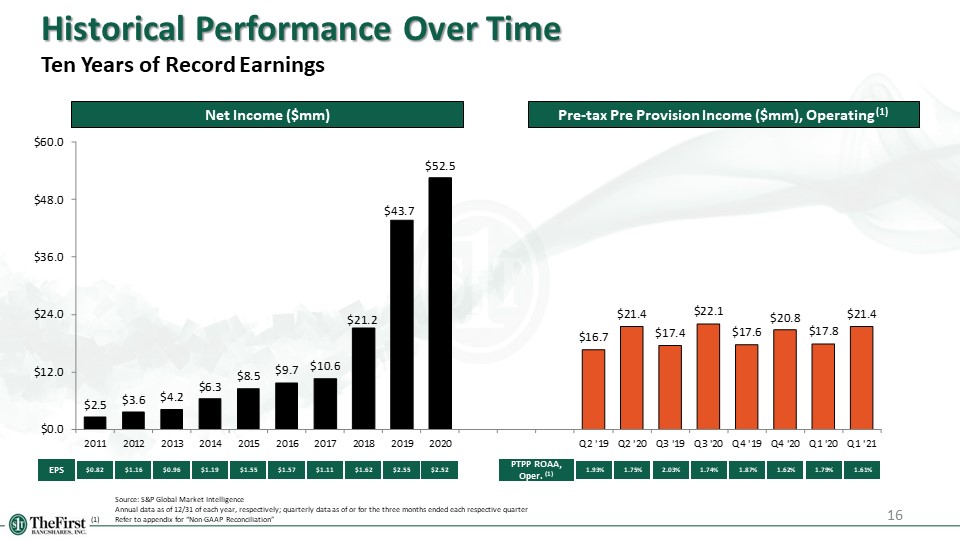
EPS Net Income ($mm) 16 Pre-tax Pre Provision Income ($mm), Operating (1) PTPP ROAA, Oper. (1)
Source: S&P Global Market Intelligence Annual data as of 12/31 of each year, respectively; quarterly data as of or for the three months ended each respective quarter(1) Refer to appendix for “Non-GAAP Reconciliation” Historical Performance
Over TimeTen Years of Record Earnings $0.82 $1.16 $0.96 $1.19 $1.55 $1.57 $1.11 $1.62 $2.55 $2.52 1.61% 1.79% 1.62% 1.87% 1.74% 2.03% 1.75% 1.93%

Net Interest Income Over Time 17 3.74% 3.99% 3.59% 3.44% 3.70% 3.72% 3.71% 4.07% 4.05% Net
Interest Income ($mm) NIM 3.63% 3.83% 3.93% 3.58% 4.06% 3.51% 3.93% 3.34% 4.00% Source: S&P Global Market IntelligenceAnnual data as of 12/31 of each year, respectively; quarterly data as of or for the three months ended each
respective quarter 4.00%

Execution of Strategic Vision 18 Source: S&P Global Market Intelligence, Company documentsPricing
data as of 4/16/21 Price Performance since 12/31/08 In 2009, FBMS formulated a strategic vision focused on branch expansion and acquisition of banks with assets less than $500 million in MS, AL, LA, FL and GA $9.04 $37.58 3/22/13$20.0M
Preferred Stock Offering 4/30/13Acquired First National Bank of Baldwin County 7/1/14Acquired BCB Holding Company, Inc. 12/14/15Acquired Mortgage Connection, LLC 10/24/16$63.3M Preferred Stock Offering 1/1/17Acquired Gulf Coast Community
Bank 1/1/17Acquired Iberville Bank 10/26/17$58.4M Common Stock Offering` 3/1/18Acquired South West Banc Shares, Inc. 4/1/18Acquired Sunshine Financial, Inc. 5/1/18$66.0M Subordinated Debt Offering 10/31/18Acquired FMB Banking
Corp. 3/1/19Acquired FPB Financial Corp. 10/31/19 Acquired First Florida Bancorp, Inc. 4/3/20 Acquired Southwest Georgia Financial Corporation 9/25/20$65.0M Subordinated Debt Offering

Historical Profitability Trends 19 Source: S&P Global Market Intelligence, Company Documents
Data as of or for the three months ended each respective quarter(1) Refer to appendix for “Non-GAAP Reconciliation” * Inclusive of $7.0 million bargain purchase gain Reported ROAA (%) ROAA, Operating (%) (1) Reported ROATCE (%) (1) ROATCE,
Operating (%) (1) 1.75% 1.79% 1.74% 1.62% 1.61% PTPP ROAA, Oper. (1)

20 Historical Profitability Trends Non-interest Income, Oper. / Adj. Operating Revenue (%)
(1) Non-interest Income YTD (%) Efficiency Ratio, Operating (%) (1) Adjusted Operating Expense / Average Assets (%) (1) Source: S&P Global Market Intelligence, Company Documents Data as of or for the three months ended each respective
quarter, YTD data for the three months ended 3/31/21(1) Refer to appendix for “Non-GAAP Reconciliation”

Historical Balance Sheet Growth 21 Assets ($mm) Source: S&P Global Market IntelligenceData as of
12/31 of each year, respectively; Q1 ’21 data as of 3/31/21 Loans ($mm) Deposits ($mm) 2011 – Q1 ‘21 CAGR: 25% 2011 – Q1 ‘21 CAGR: 25% 2011 – Q1 ‘21 CAGR: 25%

Source: S&P Global Market Intelligence Note: Assets shown as of next quarter after close; dates
are as of transaction close, unless otherwise specified 3/22/2013$22.0M Equity OfferingAssets: $789 million 4/23/2013Acquired First Baldwin Bancshares, Inc. Assets: $965 million 7/1/2014Acquired BCB Holding Company, Inc. Assets: $989
million 1/1/2017Acquired Gulf Coast Community BankAssets: $1.8 billion 12/14/2015Acquired Mortgage Connection, LLCAssets: $1.1 billion 10/24/2016$63.3M Equity OfferingAssets: $1.3 billion 1/1/2017Acquired Iberville BankAssets: $1.8
billion 10/26/2017$58.4M Common Stock OfferingAssets: $1.8 billion 3/1/2018Acquired South West Banc Shares, Inc.Assets: $2.3 billion 4/1/2018Acquired Sunshine Financial, Inc. Assets: $2.5 billion 5/1/2018$66.0M Subordinated Debt
OfferingAssets: $2.5 billion 10/31/2018Acquired FMB Banking CorporationAssets: $3.0 billion 3/2/2019Acquired FPB Financial Corp.Assets: $3.5 billion 10/31/2019Acquired First Florida BancorpAssets: $3.9 billion 4/3/2020Acquired
SGBAssets: $5.1 billion Executing Upon Growth Strategy Tangible Book Value Per Share Growth 22 Building Upon a Proven Track Record 12/31/20 12/31/19 12/31/18 12/31/17 12/31/16 12/31/15 12/31/14 3/31/21 9/25/2020$65.0M
Subordinated Debt OfferingAssets: $5.2 billion

23 Strong Balance Sheet & Earnings Power TCE+ALL / Loans (%) Core Deposits (%) PTPP ROAA,
Operating (1) (%) Loans / Deposits (%) 150 bps higher than peers 30 bps higher than peers 11 percentage points lower than peers 7 percentage points higher than peers Source: S&P Global Market Intelligence Note: Peers include all
major exchange traded banks headquartered in AL, AR, FL, GA, KY, LA, MS, NC, SC, TN, VA and WV with total assets between $1 bn and $10 bn Data as or for the twelve months ended 12/31/20; FBMS dashed-data as of or for the three months ended
3/31/21(1) Refer to appendix for “Non-GAAP Reconciliation” FBMS Q1 ’21: 16.0% FBMS Q1 ’21: 1.6% FBMS Q1 ’21: 66.5% FBMS Q1 ’21: 97.2%

24 Loan & deposit information

25 Loan Portfolio Overview Q1 ‘21 Loan Composition Historical Loan Composition Dollars in millions,
unless otherwise notedSource: S&P Global Market IntelligenceData as of 12/31 each respective year, respectively; Q1 ‘21 data as of 3/31/21 Granular loan portfolio, average loan size excluding PPP is ~$152 thousandTop 25 loans represent
~7% of total portfolioDe Minimis consumer credit card loans ($1.7 million or 0.1% of total loans)Limited energy exposure ($26.8 million or 0.9% of total loans)No Shared National Credits (“SNCs”)

26 COVID-19 Loan Modifications Loan Modifications Resulting from COVID-19 as of 3/31/21 Loan
Modification Trends Dollars in millions Source: Company documents(1) Total loans as of 3/31/21 excludes $221.7 million of PPP-related loans Aggregate Loan Modification Trends (1) Loan Modification Changes in Escalated Monitoring Portfolio
Segments

27 Escalated Monitoring Dollars in millionsSource: Company DocumentsData as of 3/31/21

28 Loan Concentrations Over Time C&D Loan Concentration Over Time CRE Loan Concentration Over
Time Source: S&P Global Market IntelligenceNote: 100% and 300% are the interagency guidance figures for C&D Concentration and CRE Concentration of a banking institution’s total risk-based capital, respectively

29 Overview of PPP Activity As of March 31, 2021, we have 2,591 PPP loans totaling $221.7 million
with average loan size of $85,000Net fees total $7.3 million at March 31, 2021 Dollars in millionsSource: Company documents

30 Loan Reserves Detail & Nonperforming AssetsMarch 31, 2021 Dollars in millionsSource: Company
documents RESERVES TOTAL LOANS $3.055 BILLION $32.7 MILLION 1.07% LOAN BALANCES ALLL/CREDIT MARK ALLL/MARK TO LOANS NON PERFORMING ASSETS BALANCES % OF LOANS + OREO LEGACY $18.5 MILLION 0.6% TOTAL NON PERFORMING ASSETS $36.8 MILLION
1.2% ACQUIRED $18.3 MILLION 0.6%

31 Asset Quality Over Time NPAs / Loans + OREO (%) NCOs / Average Loans (%) Reserves / NPLs
(%) Reserves / Loans (%) Source: S&P Global Market IntelligenceYearly data as of or for the twelve months ended each respective year; quarterly data as of or for the three months ended each respective quarter
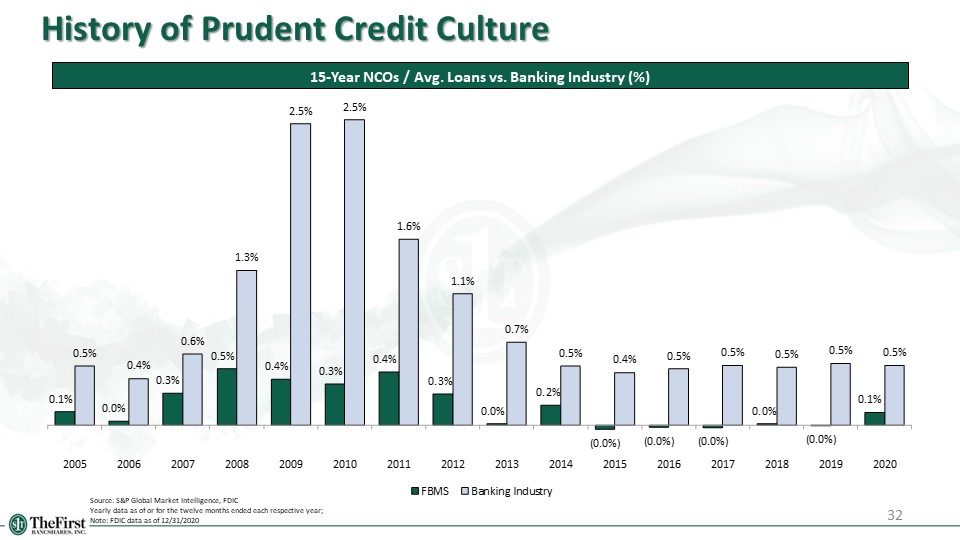
32 History of Prudent Credit Culture 15-Year NCOs / Avg. Loans vs. Banking Industry (%) Source:
S&P Global Market Intelligence, FDICYearly data as of or for the twelve months ended each respective year; Note: FDIC data as of 12/31/2020

33 Attractive Deposit Portfolio Q1 ‘21 Deposit Composition (1) Historical Deposit Composition
($bn) Cost of Total Deposits Over Time (%) Dollars in millions unless otherwise noted Source: S&P Global Market Intelligence Annual data as of or for the twelve months ended each respective year; Quarterly data as of or for the three
months ended each respective quarter; deposit mix as of 3/31/21(1) Without reclassification 97% core deposits28.7% non-interest bearing demand deposits

34 Capital & Liquidity

35 Capital & Liquidity Position TCE / TA (%) (1) Leverage Ratio (%) Total Risk Based Capital
Ratio (%) CET1 Ratio (%) Source: S&P Global Market Intelligence Data as of 12/31 of each year, respectively; Q1 ‘21 data as of 3/31/21(1) Non-GAAP measure, see reconciliation to closest GAAP measure in appendix
36 Appendix

37 Deposit Market Share by State Mississippi Florida Alabama Louisiana Georgia Source: S&P
Global Market IntelligenceData as of 6/30/20Note: Deposits capped at $1.0 bn per branch

38 Deposit Market Share by Select MSAs Tallahassee, FL MSA Gulfport-Biloxi, MS MSA Fort Walton
Beach-Destin, FL MSA Mobile, AL MSA Baton Rouge, LA MSA Hattiesburg, MS MSA Source: S&P Global Market IntelligenceData as of 6/30/20Note: Deposits capped at $1.0 bn per branch

Historical Financials 39 Source: S&P Global Market Intelligence Data as of 12/31 of each year,
respectively; quarterly data as of the three months ended each respective quarter(1) Non-GAAP measure, see reconciliation to closest GAAP measure

40 Non-GAAP Reconciliation

41 Non-GAAP Reconciliation (cont.)

42 Non-GAAP Reconciliation (cont.)

43 Non-GAAP Reconciliation (cont.)

44 Non-GAAP Reconciliation (cont.)