Attached files
| file | filename |
|---|---|
| 8-K - 8-K - Altra Industrial Motion Corp. | aimc-8k_20210429.htm |
| EX-99.1 - EX-99.1 - Altra Industrial Motion Corp. | aimc-ex991_6.htm |
First Quarter 2021 Results April 29, 2021 1 Exhibit 99.2
2 Q1 2021 Conference Call Details Live Webcast April 29, 2021 10:00 AM ET Dial-In Number (866) 209-9085 Domestic (647) 689-5687 International Webcast at www.altramotion.com Replay (800) 585-8367 Domestic* (416) 621-4642 International* Conference ID: 3079528 *Phone replay through May 13, 2021 Webcast replay also available at www.altramotion.com
Safe Harbor Statement Forward-Looking Statements All statements other than statements of historical fact included in this release are forward-looking statements, as that term is defined in the Private Securities Litigation Reform Act of 1995. These statements include, but are not limited to, any statement that may predict, forecast, indicate or imply future results, performance, achievements or events. Forward-looking statements can generally be identified by phrases such as “believes,” “expects,” “potential,” “continues,” “may,” “should,” “seeks,” “predicts,” “anticipates,” “intends,” “projects,” “estimates,” “plans,” “could,” “designed”, “should be,” and other similar expressions that denote expectations of future or conditional events rather than statements of fact. Forward-looking statements also may relate to strategies, plans and objectives for, and potential results of, future operations, financial results, financial condition, business prospects, growth strategy and liquidity, and are based upon financial data, market assumptions and management's current business plans and beliefs or current estimates of future results or trends available only as of the time the statements are made, which may become out of date or incomplete. Forward looking statements are inherently uncertain, and investors must recognize that events could differ significantly from our expectations. These statements include, but may not be limited to, the statements under “Business Outlook,” and statements regarding (a) the Company’s belief that its operating performance is a competitive differentiator that can support share gains for the Company, (b) the Company’s strategic priorities continuing to be managing costs, debt pay down and solidifying the Company as a premier industrial company for the long term, (c) the Company’s expectations regarding the timing to achieve its debt goals and leverage goals, (d) the Company’s expectation that there will be a very strong run in the industrials world in 2022 and beyond (e) economic and industrial recovery and industrial trends driving such recovery and (f) assumptions underlying the Company’s guidance. In addition to the risks and uncertainties noted in this release, there are certain factors that could cause actual results to differ materially from those anticipated by some of the statements made. These include: (1) competitive pressures, (2) changes in political and economic conditions in the United States and abroad and the cyclical nature of our markets, (3) loss of distributors, (4) the ability to develop new products and respond to customer needs, (5) risks associated with international operations, including currency risks, and the effects of tariffs and other trade actions taken by the United States and other countries, (6) accuracy of estimated forecasts of OEM customers and the impact of the current global economic environment on our customers, (7) risks associated with a disruption to our supply chain, (8) fluctuations in the costs of raw materials used in our products, (9) product liability claims, (10) work stoppages and other labor issues involving the Company’s facilities or the Company’s customers, (11) changes in employment, environmental, tax and other laws and changes in the enforcement of laws, (12) loss of key management and other personnel, (13) risks associated with compliance with environmental laws, (14) the ability to successfully execute, manage and integrate key acquisitions and mergers, (15) failure to obtain or protect intellectual property rights, (16) impairment or reduction of goodwill or intangible assets, (17) failure of operating equipment or information technology infrastructure, including cyber-attacks or other security breaches, and failure to comply with data privacy laws or regulations, (18) risks associated with our debt leverage, (19) risks associated with restrictions contained in the agreements governing Altra’s $400 million aggregate principal amount of 6.125% senior notes due 2026 and Altra’s revolving credit facility and term loan facility, (20) risks associated with compliance with tax laws, (21) risks associated with the global recession and volatility and disruption in the global financial markets, (22) risks associated with implementation of our enterprise resource planning system, (23) risks associated with the Svendborg, Stromag, and A&S acquisitions and integration and other acquisitions, (24) risks associated with certain minimum purchase agreements we have with suppliers, (25) risks related to our relationships with strategic partners, (26) our ability to offset increased commodity and labor costs with increased prices, (27) risks associated with our exposure to variable interest rates and foreign currency exchange rates, (28) swap counterparty credit risk, including interest rate swap contracts, cross-currency swap contracts and hedging arrangements, (29) risks associated with our exposure to renewable energy markets, (30) risks related to regulations regarding conflict minerals, (31) risks related to restructuring and plant consolidations, (32) risks related to our acquisition of A&S, including (a) the possibility that we may be unable to achieve expected synergies and operating efficiencies in connection with the transaction within the expected time-frames or at all and to successfully integrate A&S, (b) expected or targeted future financial and operating performance and results, (c) operating costs, customer loss and business disruption (including, without limitation, difficulties in maintaining relationships with employees, customers, clients or suppliers) being greater than expected following the transaction, (d) our ability to retain key executives and employees, (e) slowdowns or downturns in economic conditions generally and in the markets in which the A&S businesses participate specifically, (f) lower than expected investments and capital expenditures in equipment that utilizes components produced by us or A&S, (g) lower than expected demand for our or A&S’s repair and replacement businesses, (h) our ability to successfully integrate the merged assets and the associated technology and achieve operational efficiencies, (i) the integration of A&S being more difficult, time-consuming or costly than expected, (j) the inability to undertake certain corporate actions that otherwise could be advantageous to comply with certain tax covenants, (k) potential unknown liabilities and unforeseen expenses related to the acquisition and (l) the impact on our internal controls and compliance with the regulatory requirements under the Sarbanes-Oxley Act of 2002, (33) exposure to United Kingdom political developments, including the effect of its withdrawal from the European Union, and the uncertainty surrounding the implementation and effect of Brexit and related negative developments in the European Union and elsewhere, (34) Altra’s ability to achieve the efficiencies, savings and other benefits anticipated from its cost reduction, margin improvement, restructuring, plant consolidation and other business optimization initiatives, (35) the risks associated with transitioning from LIBOR to a replacement alternative reference rate, (36) the scope and duration of the COVID-19 global pandemic and its impact on global economic systems and our employees, sites, operations, customers and supply chain, including the impact of the pandemic on manufacturing and supply capabilities throughout the world, (37) adverse conditions in the credit and capital markets limiting or preventing the Company’s and its customers’ and suppliers’ ability to borrow or raise capital, (38) the Company’s ability to invest in new technologies and manufacturing techniques and to develop or adapt to changing technology and manufacturing techniques, (39) defects, quality issues, inadequate disclosure or misuse with respect to our products and capabilities, (40) changes in labor or employment laws, (41) the Company’s ability to recruit, retain and motivate key sales, marketing or engineering personnel, (42) unplanned repairs or equipment outages, (43) changes in the Company’s tax rates, including enactment of the Tax Cuts and Jobs Act of 2017, or exposure to additional income tax liabilities or assessments, as well as audits by tax authorities, (44) the risks associated with the Company’s ability to successfully divest or otherwise dispose of businesses that that are deemed not to fit with our strategic plan or are not achieving the desired return on investment and (45) other risks, uncertainties and other factors described in the Company's quarterly reports on Form 10-Q and annual reports on Form 10-K and in the Company's other filings with the U.S. Securities and Exchange Commission (SEC) or in materials incorporated therein by reference. Except as required by applicable law, Altra does not intend to update or alter its forward-looking statements, whether as a result of new information, future events or otherwise. 3

Agenda and Speakers Executive Overview Market Review Q1 2021 Financial Review, 2021 Guidance Concluding Remarks Q&A Carl Christenson Chairman & Chief Executive Officer Christian Storch Executive Vice President & Chief Financial Officer 4
Q1 2021 CEO EXECUTIVE SUMMARY An Economic Recovery is Starting to Take Hold Economic recovery spreading across more business segments Altra well-positioned to capitalize on strong secular tailwinds Bookings momentum continuing to build across early-cycle markets Emerging ramp-up in orders for later cycle markets Raising 2021 guidance Growing confidence in 2022 & beyond 5
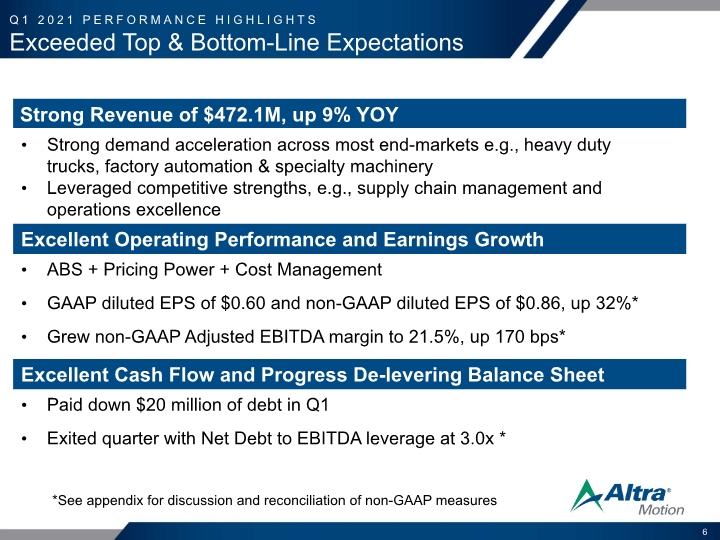
Q1 2021 PERFORMANCE HIGHLIGHTS Exceeded Top & Bottom-Line Expectations *See appendix for discussion and reconciliation of non-GAAP measures 6 Strong Revenue of $472.1M, up 9% YOY Strong demand acceleration across most end-markets e.g., heavy duty trucks, factory automation & specialty machinery Leveraged competitive strengths, e.g., supply chain management and operations excellence Excellent Operating Performance and Earnings Growth ABS + Pricing Power + Cost Management GAAP diluted EPS of $0.60 and non-GAAP diluted EPS of $0.86, up 32%* Grew non-GAAP Adjusted EBITDA margin to 21.5%, up 170 bps* Excellent Cash Flow and Progress De-levering Balance Sheet Paid down $20 million of debt in Q1 Exited quarter with Net Debt to EBITDA leverage at 3.0x *
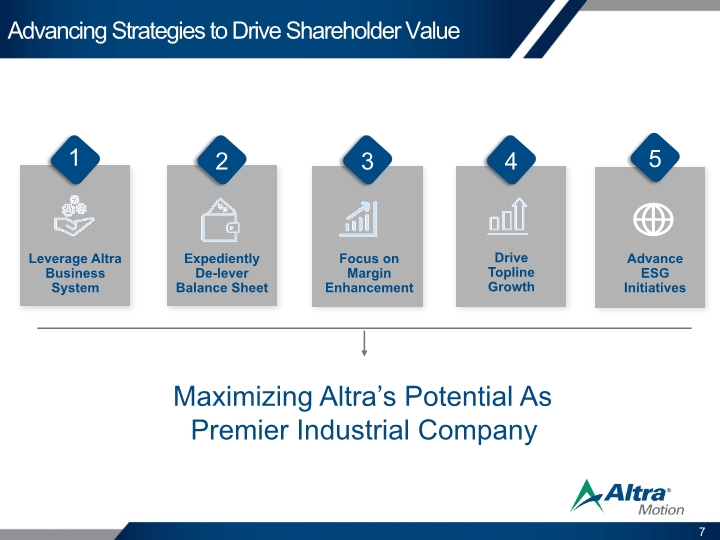
7 Advancing Strategies to Drive Shareholder Value Focus on Margin Enhancement 3 Leverage Altra Business System 1 Expediently De-lever Balance Sheet 2 Drive Topline Growth 4 Maximizing Altra’s Potential As Premier Industrial Company Advance ESG Initiatives 5
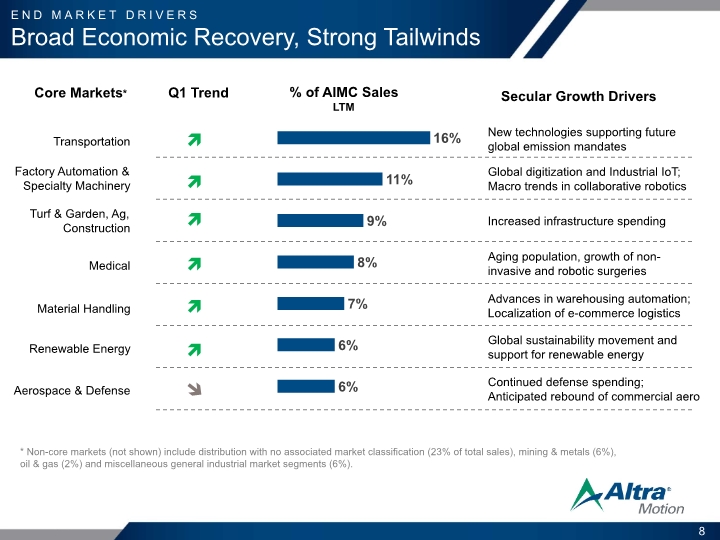
8 * Non-core markets (not shown) include distribution with no associated market classification (23% of total sales), mining & metals (6%), oil & gas (2%) and miscellaneous general industrial market segments (6%). Global digitization and Industrial IoT; Macro trends in collaborative robotics Increased infrastructure spending Aging population, growth of non-invasive and robotic surgeries Secular Growth Drivers END MARKET DRIVERS Broad Economic Recovery, Strong Tailwinds New technologies supporting future global emission mandates Advances in warehousing automation; Localization of e-commerce logistics Continued defense spending; Anticipated rebound of commercial aero Global sustainability movement and support for renewable energy Transportation % of AIMC Sales LTM Factory Automation & Specialty Machinery Turf & Garden, Ag, Construction Medical Renewable Energy Material Handling Aerospace & Defense Q1 Trend Core Markets* 16% 11% 9% 8% 7% 6% 6%
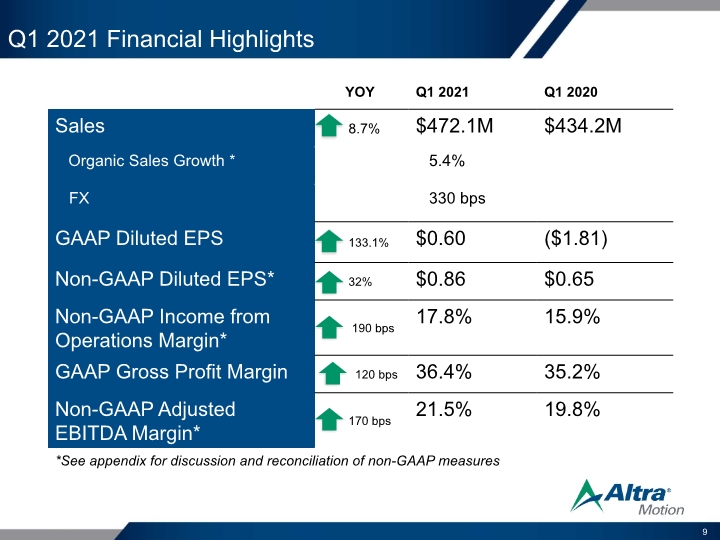
Q1 2021 Financial Highlights *See appendix for discussion and reconciliation of non-GAAP measures 9 YOY Q1 2021 Q1 2020 Sales 8.7% $472.1M $434.2M Organic Sales Growth * 5.4% FX 330 bps GAAP Diluted EPS 133.1% $0.60 ($1.81) Non-GAAP Diluted EPS* 32% $0.86 $0.65 Non-GAAP Income from Operations Margin* 190 bps 17.8% 15.9% GAAP Gross Profit Margin 120 bps 36.4% 35.2% Non-GAAP Adjusted EBITDA Margin* 170 bps 21.5% 19.8%
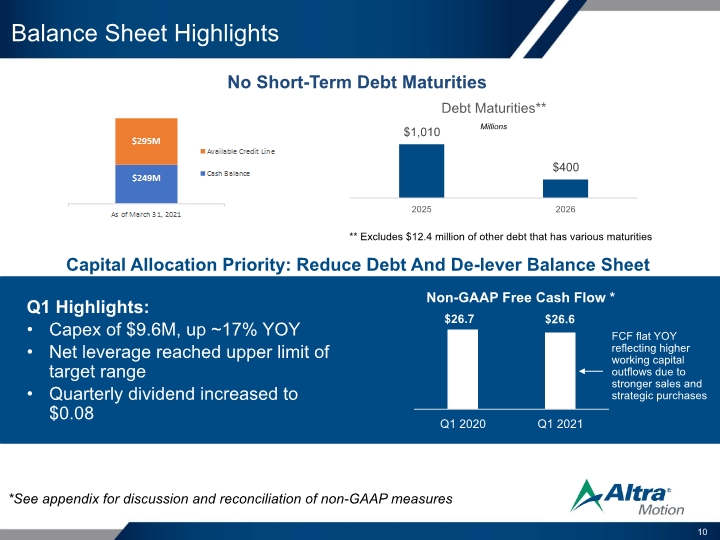
Balance Sheet Highlights 10 Capital Allocation Priority: Reduce Debt And De-lever Balance Sheet No Short-Term Debt Maturities ** Excludes $12.4 million of other debt that has various maturities Millions Q1 Highlights: Capex of $9.6M, up ~17% YOY Net leverage reached upper limit of target range Quarterly dividend increased to $0.08 Non-GAAP Free Cash Flow * *See appendix for discussion and reconciliation of non-GAAP measures 10 FCF flat YOY reflecting higher working capital outflows due to stronger sales and strategic purchases $26.7 $26.6 Q1 2020 Q1 2021 Debt Maturities** $1,010 2025 $400 2026 Available Credit Line Cash Balance As of March 31,2021 $295M $249M
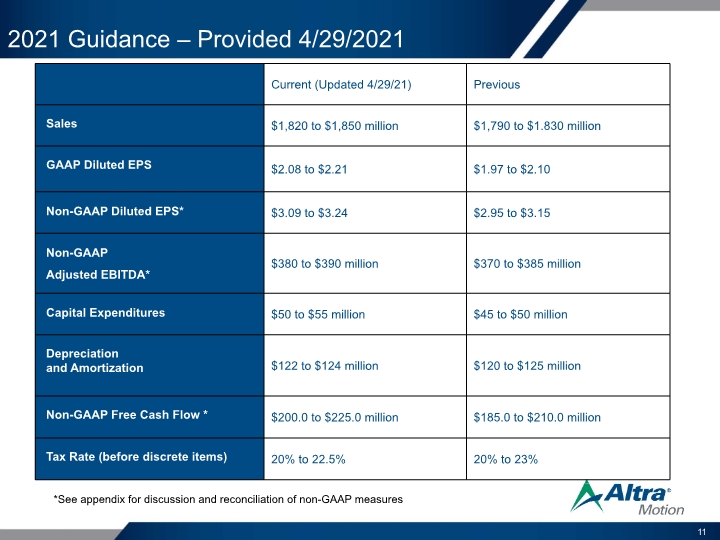
2021 Guidance – Provided 4/29/2021 *See appendix for discussion and reconciliation of non-GAAP measures 11 Current (Updated 4/29/21) Previous Sales $1,820 to $1,850 million $1,790 to $1.830 million GAAP Diluted EPS $2.08 to $2.21 $1.97 to $2.10 Non-GAAP Diluted EPS* $3.09 to $3.24 $2.95 to $3.15 Non-GAAP Adjusted EBITDA* $380 to $390 million $370 to $385 million Capital Expenditures $50 to $55 million $45 to $50 million Depreciation and Amortization $122 to $124 million $120 to $125 million Non-GAAP Free Cash Flow * $200.0 to $225.0 million $185.0 to $210.0 million Tax Rate (before discrete items) 20% to 22.5% 20% to 23%
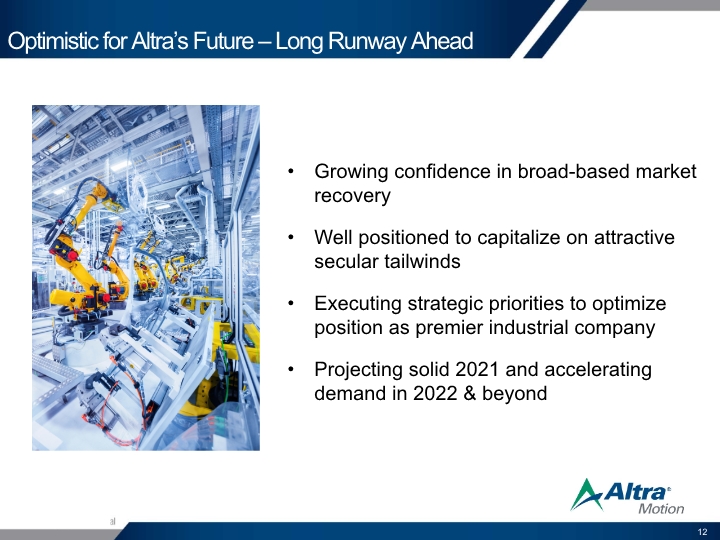
Optimistic for Altra’s Future – Long Runway Ahead Growing confidence in broad-based market recovery Well positioned to capitalize on attractive secular tailwinds Executing strategic priorities to optimize position as premier industrial company Projecting solid 2021 and accelerating demand in 2022 & beyond 12
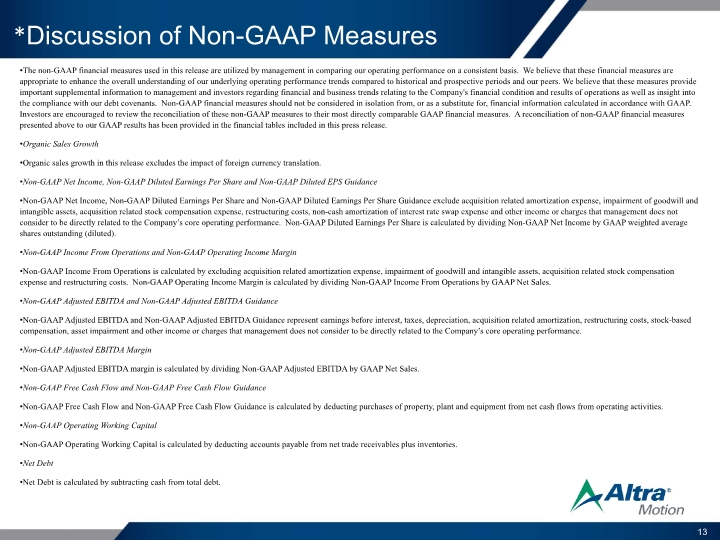
*Discussion of Non-GAAP Measures The non-GAAP financial measures used in this release are utilized by management in comparing our operating performance on a consistent basis. We believe that these financial measures are appropriate to enhance the overall understanding of our underlying operating performance trends compared to historical and prospective periods and our peers. We believe that these measures provide important supplemental information to management and investors regarding financial and business trends relating to the Company's financial condition and results of operations as well as insight into the compliance with our debt covenants. Non-GAAP financial measures should not be considered in isolation from, or as a substitute for, financial information calculated in accordance with GAAP. Investors are encouraged to review the reconciliation of these non-GAAP measures to their most directly comparable GAAP financial measures. A reconciliation of non-GAAP financial measures presented above to our GAAP results has been provided in the financial tables included in this press release. Organic Sales Growth Organic sales growth in this release excludes the impact of foreign currency translation. Non-GAAP Net Income, Non-GAAP Diluted Earnings Per Share and Non-GAAP Diluted EPS Guidance Non-GAAP Net Income, Non-GAAP Diluted Earnings Per Share and Non-GAAP Diluted Earnings Per Share Guidance exclude acquisition related amortization expense, impairment of goodwill and intangible assets, acquisition related stock compensation expense, restructuring costs, non-cash amortization of interest rate swap expense and other income or charges that management does not consider to be directly related to the Company’s core operating performance. Non-GAAP Diluted Earnings Per Share is calculated by dividing Non-GAAP Net Income by GAAP weighted average shares outstanding (diluted). Non-GAAP Income From Operations and Non-GAAP Operating Income Margin Non-GAAP Income From Operations is calculated by excluding acquisition related amortization expense, impairment of goodwill and intangible assets, acquisition related stock compensation expense and restructuring costs. Non-GAAP Operating Income Margin is calculated by dividing Non-GAAP Income From Operations by GAAP Net Sales. Non-GAAP Adjusted EBITDA and Non-GAAP Adjusted EBITDA Guidance Non-GAAP Adjusted EBITDA and Non-GAAP Adjusted EBITDA Guidance represent earnings before interest, taxes, depreciation, acquisition related amortization, restructuring costs, stock-based compensation, asset impairment and other income or charges that management does not consider to be directly related to the Company’s core operating performance. Non-GAAP Adjusted EBITDA Margin Non-GAAP Adjusted EBITDA margin is calculated by dividing Non-GAAP Adjusted EBITDA by GAAP Net Sales. Non-GAAP Free Cash Flow and Non-GAAP Free Cash Flow Guidance Non-GAAP Free Cash Flow and Non-GAAP Free Cash Flow Guidance is calculated by deducting purchases of property, plant and equipment from net cash flows from operating activities. Non-GAAP Operating Working Capital Non-GAAP Operating Working Capital is calculated by deducting accounts payable from net trade receivables plus inventories. Net Debt Net Debt is calculated by subtracting cash from total debt. 13
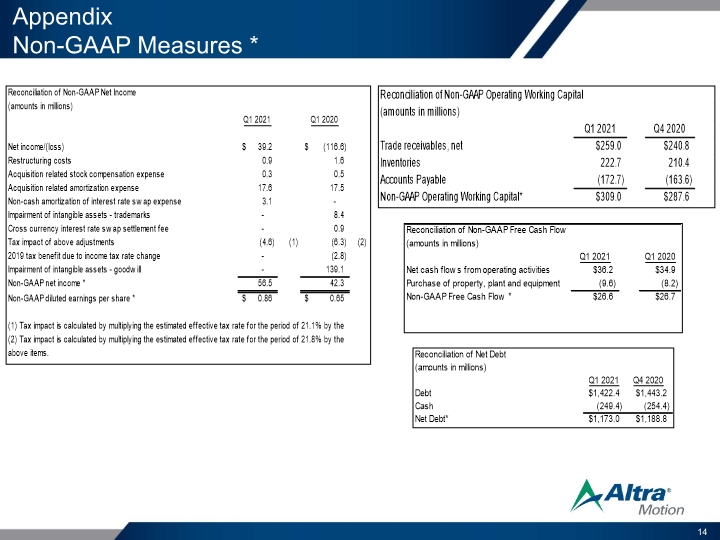
Appendix Non-GAAP Measures * 14 Reconciliation of Non-GAAP Net Income (amounts in millions) Q1 2021 Q1 2020 Net income/(loss) $ 39.2 $ (116.6) Restructuring costs 0.9 1.6 Acquisition related stock compensation expense 0.3 0.5 Acquisition related amortization expense 17.6 17.5 Non-cash amortization of interest rate swap expense 3.1 Impairment of intangible assets - trademarks 8.4 Cross currency interest rate swap settlement fee 0.9 Tax impact of above adjustments (4.6) (1) (6.3) (2) 2019 tax benefit due to income tax rate change - (2.8) Impairment of intangible assets - goodwill - 139.1 Non-GAAP net income * 56.5 42.3 Non-GAAP diluted earnings per share * $ 0.86 $ 0.65 (1) Tax impact is calculated by multiplying the estimated effective tax rate for the period of 21.1% by the above items. (2) Tax impact is calculated by multiplying the estimated effective tax rate for the period of 21.8% by the above items. Reconciliation of Non-GAAP Operating Working Capital (amounts in millions) Q1 2021 Q4 2020 Trade receivables, net $259.0 $240.8 Inventories 222.7 210.4 Accounts Payable (172.7) (163.6) Non-GAAP Operating Working Capital* $309.0 $287.6 Reconciliation of Non-GAAP Free Cash Flow (amounts in millions) Q1 2021 Q1 2020 Net cash flows from operating activities $36.2 $34.9 Purchase of property, plant and equipment (9.6) (8.2) Non-GAAP Free Cash Flow * $26.6 $26.7 Reconciliation of Net Debt (amounts in millions) Q1 2021 Q4 2020 Debt $1,422.4 $1,443.2 Cash (249.4) (254.4) Net Debt* $1,173.0 $1,188.8
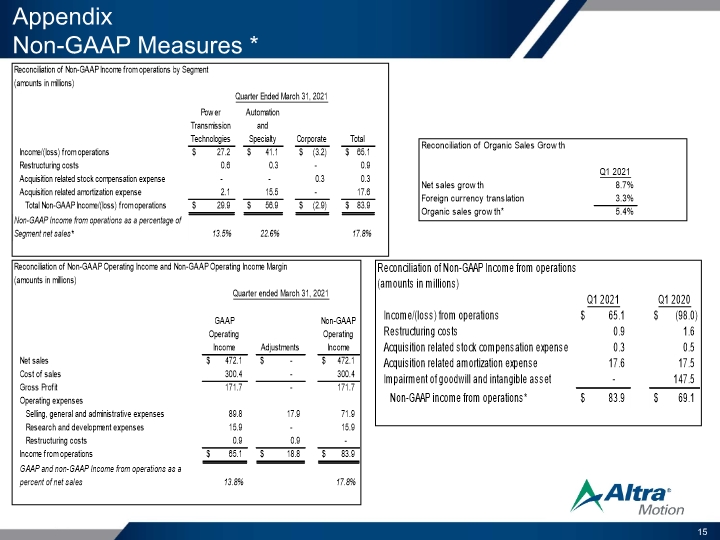
Appendix Non-GAAP Measures * 15 Reconciliation of Non-GAAP Income from operations by Segment (amounts in millions) Quarter Ended March 31, 2021 Power Transmission Technologies Automation and Specialty Corporate Total Income/(loss) from operations $ 27.2 $ 41.1 $ (3.2) $ 65.1 Restructuring costs 0.6 0.3 - 0.9 Acquisition related stock compensation expense - - 0.3 0.3 Acquisition related amortization expense 2.1 15.5 - 17.6 Total Non-GAAP Income/(loss) from operations $ 29.9 $ 56.9 $ (2.9) $ 83.9 Non-GAAP Income from operations as a percentage of Segment net sales* 13.5% 22.6% 17.8% Reconciliation of Non-GAAP Operating Income and Non-GAAP Operating Income Margin (amounts in millions) Quarter ended March 31, 2021GAAP Operating Income Adjustments Non-GAAP Operating Income Net sales $ 472.1 $ - $ 472.1 Cost of sales 300.4 - 300.4 Gross Profit 171.7 - 171.7 Operating expenses Selling, general and administrative expenses 89.8 17.9 71.9 Research and development expenses 15.9 - 15.9 Restructuring costs 0.9 0.9 - Income from operations $ 65.1 18.8 $ 83.9 GAAP and non-GAAP Income from operations as a percent of net sales 13.8% 17.8% Reconciliation of Organic Sales Growth (amounts in millions) Q1 2021 Net sales growth 8.7% Foreign currency translation 3.3% Organic sales growth* 5.4% Reconciliation of Non-GAAP Income from operations (amounts in millions) Q1 2021 Q1 2020 Income/(loss) from operations $ 65.1 $ (98.0) Restructuring costs 0.9 1.6 Acquisition related stock compensation expense 0.3 0.5 Acquisition related amortization expense 17.6 17.5 Impairment of goodwill and intangible asset - 147.5 Non-GAAP income from operations* $ 83.9 $ 69.1
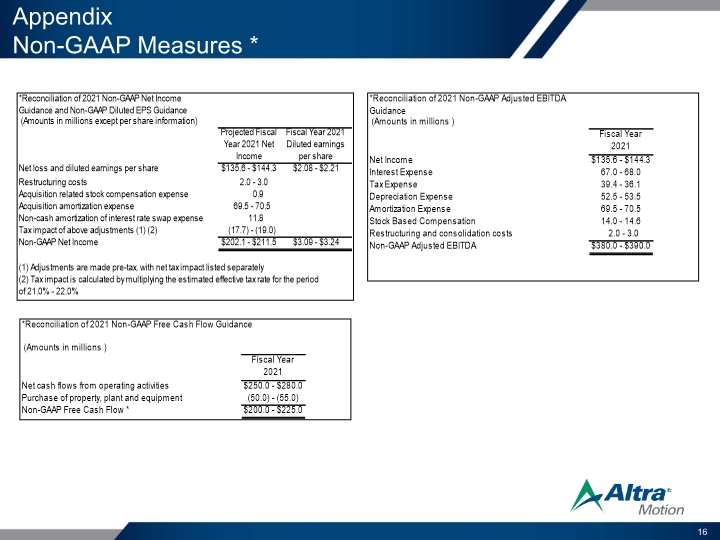
Appendix Non-GAAP Measures * 16 *Reconciliation of 2021 Non-GAAP Net Income Guidance and Non-GAAP Diluted EPS Guidance (Amounts in millions except per share information) Projected Fiscal Year 2021 Net Income Fiscal Year 2021 Diluted earnings per share Net loss and diluted earnings per share $135.6 - $144.3 $2.08 - $2.21 Restructuring costs 2.0 - 3.0 Acquisition related stock compensation expense 0.9 Acquisition amortization expense 69.5 - 70.5 Non-cash amortization of interest rate swap expense 11.8 Tax impact of above adjustments (1) (2) (17.7) - (19.0) Non-GAAP Net Income $202.1 - $211.5 $3.09 - $3.24 (1) Adjustments are made pre-tax, with net tax impact listed separately (2) Tax impact is calculated by multiplying the estimated effective tax rate for the period of 21.0% - 22.0% *Reconciliation of 2021 Non-GAAP Free Cash Flow Guidance (Amounts in millions) Fiscal Year 2021 Net cash flows from operating activities $250.0 - $280.0 Purchase of property, plant and equipment (50.0) - (55.0) Non-GAAP Free Cash Flow * $200.0 - $225.0 *Reconciliation of 2021 Non-GAAP Adjusted EBITDA Guidance (Amounts in millions) Fiscal Year 2021 Net Income $135.6 - $144.3 Interest Expense 67.0 - 68.0 Tax Expense 39.4 - 36.1 Depreciation Expense 52.5 - 53.5 Amortization Expense 69.5 - 70.5 Stock Based Compensation 14.0 - 14.6 Restructuring and consolidation costs 2.0 - 3.0 Non-GAAP Adjusted EBITDA $380.0 - $390.0
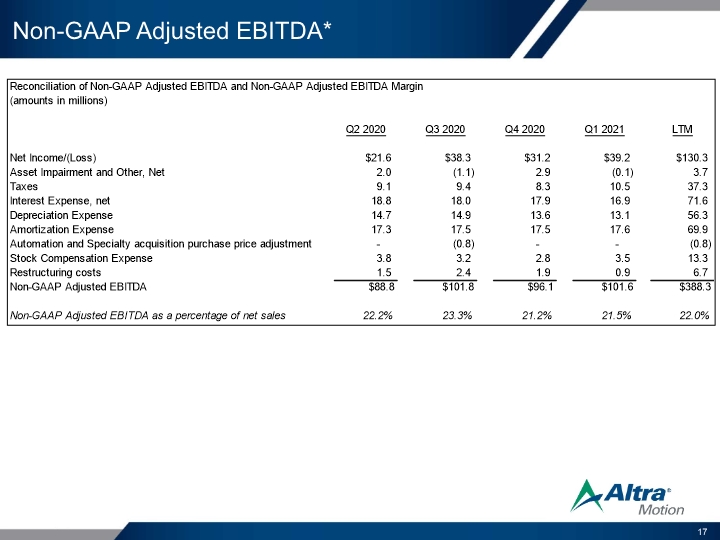
Non-GAAP Adjusted EBITDA* 17 Reconciliation of Non-GAAP Adjusted EBITDA and Non-GAAP Adjusted EBITDA Margin (amounts in millions) Q2 2020 Q3 2020 Q4 2020 Q1 2021 LTM Net Income/(Loss) $21.6 $38.3 $31.2 $39.2 $130.3 Asset Impairment and Other, Net 2.0 (1.1) 2.9 (0.1) 3.7 Taxes 9.1 9.4 8.3 10.5 37.3 Interest Expense, net 18.8 18.0 17.9 16.9 71.6 Depreciation Expense 14.7 14.9 13.6 13.1 56.3 Amortization Expense 17.3 17.5 17.5 17.6 69.9 Automation and Specialty acquisition purchase price adjustment - (0.8) - - (0.8) Stock Compensation Expense 3.8 3.2 2.8 3.5 13.3 Restructuring costs 1.5 2.4 1.9 0.9 6.7 Non-GAAP Adjusted EBITDA $88.8 $101.8 $96.1 $101.6 $388.3 Non-GAAP Adjusted EBITDA as a percentage of net sales 22.2% 23.3% 21.2% 21.5% 22.0%
