Attached files
| file | filename |
|---|---|
| EX-99.1 - EX-99.1 - REDWOOD TRUST INC | q12021earningsrelease.htm |
| 8-K - 8-K - REDWOOD TRUST INC | rwt-20210428.htm |
Exhibit 99.2

| T A B L E O F C O N T E N T S | ||
| Introduction | |||||
| Shareholder Letter | |||||
| Quarterly Results | |||||
Ñ First Quarter Financial Overview | |||||
Ñ Quarterly Earnings and Analysis | |||||
Ñ Book Value | |||||
Ñ Analysis of Operating Results | |||||
Ñ Technology Updates | |||||
| Quarterly Positions | |||||
Ñ Capital Allocations | |||||
Ñ Financing Overview | |||||
Ñ Credit Overview | |||||
| Financial Tables | |||||
| Appendix | |||||
Ñ Segment Overview | |||||
Ñ Dividends and Taxable Income | |||||
Ñ Non-GAAP Measurements | |||||
Ñ Forward-Looking Statements | |||||
| Endnotes | |||||
| THE REDWOOD REVIEW I 1ST QUARTER 2021 | ||
1 | ||
| I N T R O D U C T I O N | ||
Note to Readers:
We file annual reports (on Form 10-K) and quarterly reports (on Form 10-Q) with the Securities and Exchange Commission. These filings and our earnings press releases provide information about Redwood and our financial results in accordance with generally accepted accounting principles (GAAP). These documents, as well as information about our business and a glossary of terms we use in this and other publications, are available through our website, www.redwoodtrust.com. We encourage you to review these documents.
Within this document, in addition to our GAAP results, we also present certain non-GAAP measures. When we present a non-GAAP measure, we accompany it with a description of that measure and a reconciliation to the comparable GAAP measure.
References herein to “Redwood,” the “company,” “we,” “us,” and “our” include Redwood Trust, Inc. and its consolidated subsidiaries. Note that because we generally round numbers in the tables to millions, except per share amounts, some numbers may not foot due to rounding. References to the “first quarter” refer to the quarter ended March 31, 2021, and references to the “fourth quarter” refer to the quarter ended December 31, 2020, unless otherwise specified.
Forward-looking statements:
This Redwood Review contains forward-looking statements within the meaning of the safe harbor provisions of the Private Securities Litigation Reform Act of 1995. Forward-looking statements involve numerous risks and uncertainties. Our actual results may differ from our expectations, estimates, and projections and, consequently, you should not rely on these forward-looking statements as predictions of future events. Forward-looking statements are not historical in nature and can be identified by words such as “anticipate,” “estimate,” “will,” “should,” “expect,” “believe,” “intend,” “seek,” “plan,” "could" and similar expressions or their negative forms, or by references to strategy, plans, goals, or intentions. These forward-looking statements are subject to risks and uncertainties, including, among other things, those described in our Annual Report on Form 10-K under the caption “Risk Factors.” Other risks, uncertainties, and factors that could cause actual results to differ materially from those projected are described below and may be described from time to time in reports we file with the Securities and Exchange Commission, including reports on Forms 10-K, 10-Q, and 8-K. We undertake no obligation to update or revise forward-looking statements, whether as a result of new information, future events, or otherwise.
Statements regarding the following subjects, among others, are forward-looking by their nature: statements we make regarding Redwood’s business strategy and strategic focus, statements related to our financial outlook and expectations for 2021 and future years, statements regarding our available capital and sourcing additional capital both internally and from the capital markets, and other statements regarding pending business activities and expectations and estimates relating to our business and financial results. Additional detail regarding the forward-looking statements in this Redwood Review and the important factors that may affect our actual results in 2021 are described in the Appendix of this Redwood Review under the heading “Forward-Looking Statements.”
| Detailed endnotes are included at the end of this Redwood Review. | ||
| THE REDWOOD REVIEW I 1ST QUARTER 2021 | ||
2 | ||
| S H A R E H O L D E R L E T T E R | ||
Dear Fellow Shareholders:
Aside from the annual lap around the sun, the calendar year can be an arbitrary thing. In many ways, our new year at Redwood is just beginning after emerging from the Covid-19 pandemic last spring. And we're pleased with our trajectory thus far in 2021. Morale within our ranks is strong as we are euphorically awaiting that elusive return to normality that mass vaccinations can deliver. We're not there yet as a country, but it’s nice to see the sun shining on our people and our businesses.
Highlighted by strong operational progress and continued improvement in portfolio valuations, Redwood’s GAAP earnings were $0.72 per diluted share for the first quarter, as compared to $0.42 per diluted share in the fourth quarter. Our GAAP book value per share increased almost 9% to $10.76 at March 31, 2021, as compared to $9.91 at December 31, 2020, with GAAP earnings finishing well in excess of our $0.16 per share first quarter dividend.
While the first quarter of 2021 introduced the latest chapter of our strategic evolution through the launch of RWT Horizons, the focus of our business hasn’t changed. Our mission is to make quality housing accessible to all American households, whether rented or owned. We target borrowers whose needs are not well served by government loan programs, as well as borrowers who are simply not eligible for them. Our role in housing finance has never been more important, as the second half of 2020 ushered in a dramatic uptick in home price appreciation and even greater affordability challenges. Simply put, addressing access to housing entails a combination of consumer loan and rental solutions.
Through our leadership role as a prolific securitization issuer outside of the government sponsored enterprises (GSEs), we’ve turned much of our focus to innovating in the private sector to expedite the migration of more GSE eligible mortgages to our part of the market. This doesn’t just require low-cost capital, which our industry seems to be awash in these days – indeed, 30-year jumbo mortgages are pricing at or better than their equivalent agency loans. It requires the speed, automation, and ease of execution necessary to facilitate sustainably high volumes. These traits have not been commonplace in the less commoditized non-agency mortgage sector, which continues to not only be unsupported in Washington, but viewed as a threat to many established market participants.
Recent regulatory changes in Washington, however, highlight the need for a new way of thinking, and present a big opportunity for the private sector. For example, changes to the CFPB Qualified Mortgage (QM) rules – while still somewhat fluid – are likely to simplify many underwriting processes and meaningfully reduce the number of loans that require additional capital to securitize. Additionally, changes to the Preferred Stock Purchase Agreement (PSPA) between the U.S. Department of Treasury and the GSEs now limit the acquisition of certain types of mortgages by the GSEs, including loans on non-owner-occupied homes and those with certain combinations of credit features, including higher LTVs and debt-to-income ratios, and lower credit scores.
| Detailed endnotes are included at the end of this Redwood Review. | ||
| THE REDWOOD REVIEW I 1ST QUARTER 2021 | ||
3 | ||
| S H A R E H O L D E R L E T T E R | ||
For the GSEs to effectively manage compliance with the new limitations, the practical amount of these types of loans that the GSEs acquire will likely be well below the prescribed caps. This should result in a big opportunity for the private sector, particularly for those who can acclimate to largely automated underwriting regimes that will facilitate larger volumes of these loans moving outside the reach of the GSEs. Our work is squarely focused on addressing this need, and we’re working towards this goal in a number of innovative ways:
Residential Lending
For our residential lending business, strong operating progress in the first quarter was complemented meaningfully by continued progress on technology initiatives. We announced a new mobile app called “Redwood Live” in the first quarter for use by our network of loan sellers. Now available on Apple’s App Store, Redwood Live allows authorized sellers to log in and access dashboards that contain various tracking metrics and reports for the loan pipelines they have locked with Redwood. We also launched our “Rapid Funding+” purchase program in the first quarter, with several enhancements to the original program rolled out last year, including more customized funding schedules and other solutions for qualifying loan sellers. Finally, we successfully onboarded the majority of our active Sequoia securitizations onto “dv01”, a third-party solution for accessing, reporting and analyzing standardized loan-level data for non-agency transactions.
Business Purpose Lending
Within CoreVest, origination volumes normalized after a seasonally strong fourth quarter, but a 33% uptick in bridge fundings reflected strong demand for our core products as we work to expand our BPL footprint. In April, we announced a strategic investment in Churchill Finance, which we expect will help us grow and diversify CoreVest’s sourcing channels, with a particular emphasis on smaller-balance single-family rental (SFR) and bridge loans that complement our core product suite. CoreVest’s primary business remains focused on larger SFR loans, cross-collateralized bridge lines of credit, build-for-rent, and workforce housing products specifically targeted towards boosting the size and quality of housing stock. Partnerships like Churchill will deepen our market penetration in products we believe will remain in high demand by housing investors. We also made significant progress on several key technology initiatives, including a revamped client portal (expected to roll out later in 2021); enhancements to our data warehouse; and more automation into certain capital markets processes that will enhance our speed-to-market.
RWT Horizons
The first quarter also marked the formal arrival of RWT Horizons, our homegrown venture investing platform focused on early-stage technology companies with business plans squarely focused on innovations that enable Redwood to disrupt the mortgage finance landscape. The RWT Horizons fund has been initially seeded with a $25 million capital allocation and we’ve now completed three “venture capital” style investments that you can read more about in the "News" section of our investor relations website. Our most recent investment was in a startup that provides infrastructure to digitize loans, track documentation, facilitate payments, and record
| Detailed endnotes are included at the end of this Redwood Review. | ||
| THE REDWOOD REVIEW I 1ST QUARTER 2021 | ||
4 | ||
| S H A R E H O L D E R L E T T E R | ||
additional information on blockchain over the life of a loan. As an initial use case, we are working with various industry partners to explore the feasibility of leveraging blockchain to facilitate more timely loan remittance data for RMBS investors, an improvement that we believe can significantly enhance market liquidity. We recently co-authored a white paper titled “Building a Mortgage Blockchain Ecosystem” which is available on our website and outlines our long-term vision for the mortgage ecosystem.
Investment Portfolio
Redwood’s $2.1 billion total investment portfolio continued to perform well in the first quarter as broad credit performance strengthened, spreads tightened, and total book value grew. Delinquencies in our portfolio have fallen continuously since last summer, and new forbearance requests have remained minimal the last several quarters. And while we are keeping a close eye on announcements around foreclosure and eviction moratoria, we continue to find that consumers have become more focused on smartly managing their household balance sheets and credit scores. As a result, our loan quality has improved even while our credit guidelines have begun to expand to more closely resemble where they were pre-pandemic.
Higher prepayment speeds led us to exercise our first series of Sequoia call options in several years. We have completed calls on three Sequoia transactions through the first four months of 2021, and plan to call several others in the coming quarters. Inclusive of CoreVest-sponsored securitizations, callable transactions could exceed $600 million in total for 2021. For shareholders, this matters because through the call process we’re able to reacquire the loans at a stated par value that is typically less than their current market value. The potential realized gains from called securities represent potential earnings upside we have not been in a position to realize in recent years.
With significant momentum on technology, an engaged and talented workforce, regulatory shifts, and strong competitive positioning, it’s exciting to envision the role Redwood can play in the evolution of housing finance. We believe in the long-term durability of our earnings and our ability to deliver unique value to shareholders. As always, we balance this optimism against the economic forces that affect our quarterly production volumes, including a recent dose of interest rate volatility. In so doing, we will continue to equip our businesses with the tools to lead Redwood through the next waves of growth and change.
Thanks for your continued support.
 |  | |||||||
| Christopher J. Abate | Dashiell I. Robinson | |||||||
| Chief Executive Officer | President | |||||||
| Detailed endnotes are included at the end of this Redwood Review. | ||
| THE REDWOOD REVIEW I 1ST QUARTER 2021 | ||
5 | ||
| Q U A R T E R L Y R E S U L T S | ||
First Quarter Financial Overview
Key Financial Results and Metrics | ||||||||||||||
| Three Months Ended | ||||||||||||||
| 3/31/2021 | 12/31/2020 | |||||||||||||
| Earnings per Share | $ | 0.72 | $ | 0.42 | ||||||||||
| Return on Equity (annualized) | 34 | % | 20 | % | ||||||||||
| Book Value per Share | $ | 10.76 | $ | 9.91 | ||||||||||
| Dividend per Share | $ | 0.16 | $ | 0.14 | ||||||||||
Economic Return on Book Value (1) | 10.2 | % | 6.8 | % | ||||||||||
| Available Capital (in millions) | $ | 225 | $ | 200 | ||||||||||
Recourse Leverage Ratio (2) | 1.9x | 1.3x | ||||||||||||
Ñ Our first quarter 2021 results benefited from continued strength in our operating platforms, most notably increased residential mortgage banking revenues on higher volume and strong margins. Additionally, the value of our securities portfolio increased 5%, supported by further spread tightening and strengthened credit performance. These results contributed to a 10% economic return on book value during the first quarter.
Ñ In March, we announced a 14% increase in our quarterly dividend to $0.16 per share.
Ñ During the first quarter, we securitized $1.0 billion of loans through three transactions across Residential and Business Purpose Lending.
Ñ During the first quarter, we locked $4.6 billion of jumbo loans (up 22% from the fourth quarter of 2020) with over 110 discrete sellers and purchased $3.1 billion of jumbo loans. At March 31, 2021, our pipeline of jumbo residential loans identified for purchase was $3.3 billion (up 7% from the fourth quarter of 2020).
Ñ We originated $386 million of business purpose loans in the first quarter (a 14% decrease versus seasonally strong fourth quarter results), including $253 million of single-family rental (SFR) loans and $133 million of bridge loans. Bridge loan volume increased 33% from the fourth quarter of 2020.
Ñ During the first quarter, we exercised call options on three Sequoia securitizations, acquiring $19 million of jumbo loans in March and $56 million in April.
Ñ Our unrestricted cash was $426 million at March 31, 2021, and our available capital increased to $225 million during the first quarter, as we allocated a portion of our retained earnings to support increased volumes in our residential mortgage banking operations.
| Detailed endnotes are included at the end of this Redwood Review. | ||
| THE REDWOOD REVIEW I 1ST QUARTER 2021 | ||
6 | ||
| Q U A R T E R L Y R E S U L T S | ||
Quarterly Earnings
Below we present GAAP net income for the first quarter of 2021 and fourth quarter of 2020.
GAAP Net Income | ||||||||||||||
($ in millions, except per share data) | ||||||||||||||
| Three Months Ended | ||||||||||||||
| 3/31/2021 | 12/31/2020 | |||||||||||||
| Net interest income | ||||||||||||||
| Investment portfolio | $ | 31 | $ | 29 | ||||||||||
| Mortgage banking | 4 | 4 | ||||||||||||
| Corporate | (9) | (9) | ||||||||||||
| Total net interest income | 26 | 24 | ||||||||||||
| Non-interest income | ||||||||||||||
| Residential mortgage banking activities, net | 61 | 23 | ||||||||||||
| Business purpose mortgage banking activities, net | 21 | 31 | ||||||||||||
| Investment fair value changes, net | 45 | 23 | ||||||||||||
| Other income, net | 4 | — | ||||||||||||
| Realized gains, net | 3 | — | ||||||||||||
| Total non-interest income, net | 134 | 77 | ||||||||||||
| General and administrative expenses | (44) | (30) | ||||||||||||
| Loan acquisition costs | (4) | (3) | ||||||||||||
| Other expenses | (4) | (4) | ||||||||||||
| Provision for income taxes | (12) | (8) | ||||||||||||
| Net income | $ | 97 | $ | 54 | ||||||||||
| Earnings per diluted common share | $ | 0.72 | $ | 0.42 | ||||||||||
GAAP Net Income by Segment | ||||||||||||||
($ in millions) | ||||||||||||||
| Three Months Ended | ||||||||||||||
| 3/31/2021 | 12/31/2020 | |||||||||||||
| Residential Lending | $ | 53 | $ | 23 | ||||||||||
| Business Purpose Lending | 21 | 29 | ||||||||||||
| Third-Party Investments | 50 | 27 | ||||||||||||
| Corporate | (27) | (24) | ||||||||||||
| Net income | $ | 97 | $ | 54 | ||||||||||
| Detailed endnotes are included at the end of this Redwood Review. | ||
| THE REDWOOD REVIEW I 1ST QUARTER 2021 | ||
7 | ||
| Q U A R T E R L Y R E S U L T S | ||
Analysis of Earnings
Ñ Net interest income increased from the fourth quarter of 2020, primarily due to higher yield maintenance income on SFR securities and reduced leverage on our bridge loan portfolio relative to the fourth quarter.
Ñ Income from residential mortgage banking activities increased significantly, as loan purchase commitments of $3.5 billion in the first quarter were up 41% from the fourth quarter and margins increased.
Ñ Income from business purpose mortgage banking activities normalized in the first quarter of 2021 from a seasonally high fourth quarter, as spreads on securitization execution tightened modestly and inventory levels normalized versus the fourth quarter.
Ñ Positive investment fair value changes in the first quarter reflected continuing improvement in credit performance and spread tightening across our investment portfolio during the quarter.
Ñ General and administrative expenses and loan acquisition costs increased from the fourth quarter, as higher loan production volumes and revenues during the first quarter drove increases in variable costs, including accruals for variable compensation.
Ñ Other expenses were primarily comprised of acquisition-related intangible amortization expense.
Ñ Our income tax provision increased during the first quarter, consistent with the increased income from our mortgage banking operations, which are conducted within our taxable REIT subsidiary.
| Detailed endnotes are included at the end of this Redwood Review. | ||
| THE REDWOOD REVIEW I 1ST QUARTER 2021 | ||
8 | ||
| Q U A R T E R L Y R E S U L T S | ||
Book Value
Changes in Book Value per Share | ||||||||||||||
($ in per share) | ||||||||||||||
| Three Months Ended | ||||||||||||||
| 3/31/2021 | 12/31/2020 | |||||||||||||
| Beginning book value per share | $ | 9.91 | $ | 9.41 | ||||||||||
| Basic earnings per share | 0.84 | 0.47 | ||||||||||||
Investment fair value changes in comprehensive income (1) | 0.07 | 0.14 | ||||||||||||
| Dividends | (0.16) | (0.14) | ||||||||||||
| Equity compensation, net | 0.02 | 0.01 | ||||||||||||
| Other, net | 0.08 | 0.02 | ||||||||||||
| Ending book value per share | $ | 10.76 | $ | 9.91 | ||||||||||
Ñ Our GAAP book value increased $0.85 per share during the first quarter of 2021, as basic earnings per share and comprehensive income from investments significantly exceeded our first quarter dividend of $0.16 per share.
| Detailed endnotes are included at the end of this Redwood Review. | ||
| THE REDWOOD REVIEW I 1ST QUARTER 2021 | ||
9 | ||
| Q U A R T E R L Y R E S U L T S | ||
Analysis of Operating Results
This section provides additional information on quarterly activity within each of our business segments. A full description of our segments is included in the Appendix of this Redwood Review, and detailed segment income statements are presented in Table 2 within the Financial Tables section of this Redwood Review.
Mortgage Banking Operations
Below we present a summary of the key operating metrics of each of our mortgage banking operations, by segment.
Mortgage Banking Key Operating Metrics | ||||||||||||||||||||
| ($ in millions) | ||||||||||||||||||||
| Q1 2021 | ||||||||||||||||||||
| Residential Mortgage Banking | Business Purpose Mortgage Banking | Total | ||||||||||||||||||
Mortgage banking income (1) | $ | 64 | $ | 23 | $ | 87 | ||||||||||||||
| Net contributions (GAAP) | $ | 41 | $ | 6 | $ | 46 | ||||||||||||||
Less: acquisition amortization items (2) | — | 5 | 5 | |||||||||||||||||
| After-tax net operating contribution (non-GAAP) | $ | 41 | $ | 11 | $ | 51 | ||||||||||||||
| Capital utilized (average for quarter) | $ | 255 | $ | 154 | $ | 409 | ||||||||||||||
Operating return on capital (non-GAAP) (3) | 64 | % | 28 | % | 50 | % | ||||||||||||||
| Production Volumes | ||||||||||||||||||||
| Residential loan locks | $ | 4,626 | ||||||||||||||||||
| Residential loan purchase commitments (fallout adjusted) | $ | 3,510 | ||||||||||||||||||
| SFR loan originations | $ | 253 | ||||||||||||||||||
| Bridge loan originations | $ | 133 | ||||||||||||||||||
Residential Mortgage Banking
Ñ During the first quarter, we locked $4.6 billion of loans ($3.5 billion adjusted for expected pipeline fallout – i.e., loan purchase commitments), including $4.4 billion of Select loans and $0.2 billion of Choice loans, and purchased $3.1 billion of loans. During the fourth quarter of 2020, we locked $3.8 billion of loans ($2.5 billion adjusted for fallout).
Ñ Approximately 38% of loans locked in the first quarter were purchase-money loans and 62% were refinancings.
Ñ During the first quarter, we distributed $1.4 billion of loans through whole loan sales, and completed two securitizations for a total of $876 million.
| See Appendix for details on non-GAAP measures. Detailed endnotes are included at the end of this Redwood Review. | ||
| THE REDWOOD REVIEW I 1ST QUARTER 2021 | ||
10 | ||
| Q U A R T E R L Y R E S U L T S | ||
Ñ At March 31, 2021, we had $997 million of loans in inventory on our balance sheet and our loan pipeline included $3.3 billion of loans identified for purchase (locked loans, unadjusted for expected fallout). Additionally, at quarter-end we had entered into forward sale agreements for $735 million of loans.
Ñ Our gross margin(1) for the first quarter was 183 basis points, up from 98 basis points in the fourth quarter of 2020. Gross margin in the first quarter was driven by favorable securitization execution and a pipeline position that benefited from the relative move in mortgage rates versus benchmark interest rates during the quarter.
Business Purpose Mortgage Banking
Ñ During the first quarter, we originated $253 million of SFR loans and $133 million of bridge loans. Bridge loan originations increased 33% relative to the fourth quarter of 2020, while SFR loan originations declined 28% from seasonally high fourth quarter volumes, which also included refinances of certain underlying loans from a CoreVest sponsored securitization called in October 2020.
Ñ Approximately 33% of SFR origination volume in the first quarter was generated from borrowers that previously had a bridge loan with CoreVest and 71% of total origination volumes were from repeat borrowers.
Ñ Additionally, during the first quarter we completed the ramp-up of our $200 million SFR single-investor securitization, transferring $158 million of SFR loans in the quarter.
Ñ At March 31, 2021, we had $333 million of SFR loans in inventory on our balance sheet.
Ñ Business purpose mortgage banking income normalized in the first quarter of 2021, as more modest spread tightening on securitization execution had a reduced impact to the valuation of our $245 million of SFR loans held in inventory at the beginning of the quarter. Results for the fourth quarter of 2020 benefited from more significant spread tightening on a higher loan balance held in inventory at the beginning of that quarter.
| See Appendix for details on non-GAAP measures. Detailed endnotes are included at the end of this Redwood Review. | ||
| THE REDWOOD REVIEW I 1ST QUARTER 2021 | ||
11 | ||
| Q U A R T E R L Y R E S U L T S | ||
Investment Portfolio
Below we present key financial results for our investment portfolio organized by segment for the first quarter of 2021.
| Investment Portfolio Key Financial Results | ||||||||||||||||||||||||||
| ($ in millions) | ||||||||||||||||||||||||||
| Q1 2021 | ||||||||||||||||||||||||||
| Residential Lending | Business Purpose Lending | Third-Party Investments | Total(1) | |||||||||||||||||||||||
| Net interest income | $ | 6 | $ | 13 | $ | 12 | $ | 31 | ||||||||||||||||||
| Net contribution (GAAP) | $ | 12 | $ | 16 | $ | 50 | $ | 78 | ||||||||||||||||||
Less: realized gains (2) | (2) | — | — | (3) | ||||||||||||||||||||||
Less: investment fair value changes (2) | (3) | (3) | (40) | (46) | ||||||||||||||||||||||
| Adjusted net contribution (non-GAAP) | $ | 7 | $ | 12 | $ | 10 | $ | 29 | ||||||||||||||||||
| Capital utilized (average for quarter) | $ | 1,084 | ||||||||||||||||||||||||
Adjusted return on capital (non-GAAP) (3) | 11 | % | ||||||||||||||||||||||||
| At period end | ||||||||||||||||||||||||||
| Carrying values of assets | $ | 2,125 | ||||||||||||||||||||||||
Secured debt balances (4) | (985) | |||||||||||||||||||||||||
| Capital invested | $ | 1,140 | ||||||||||||||||||||||||
Leverage ratio (5) | 0.9x | |||||||||||||||||||||||||
Ñ Portfolio net interest income increased to $31 million in the first quarter from $29 million in the fourth quarter of 2020, driven by our business-purpose lending investments, which benefited from a combination of increased yield maintenance income on our SFR securities resulting from faster prepayments, and reduced debt costs on our bridge loan portfolio resulting from a decrease in leverage on these assets from the prior quarter.
Ñ Adjusted return on capital (which excludes realized gains and investment fair value changes, and is presented annualized in the table above) increased to 11% in the first quarter from 9% in the fourth quarter of 2020. The increase was primarily driven by higher net interest income (as described above), as well as higher other income from our residential servicing investments, which generally benefited from a stabilization in prepayment speeds during the quarter.
Ñ Positive investment fair value changes in the first quarter reflected continuing improvement in credit performance and spread tightening within our investment portfolio during the quarter – particularly for our re-performing loan ("RPL") and multifamily securities (see Table 5 in the Financial Tables section for additional detail).
| See Appendix for details on non-GAAP measures. Detailed endnotes are included at the end of this Redwood Review. | ||
| THE REDWOOD REVIEW I 1ST QUARTER 2021 | ||
12 | ||
| Q U A R T E R L Y R E S U L T S | ||
Technology Updates
Technology and innovation are central to our strategy for growth. The non-agency mortgage industry continues to heavily rely on outdated manual processes that have been in place for decades due to an accepted, and in some cases desired, status quo. As a leader in housing finance, we are focused on disrupting the market with innovative solutions that help all stakeholders, most importantly borrowers.
Our technology roadmap includes both organic product development and strategic investments that support continued best-in-class customer service, revenue growth, and increased market share.
RWT Horizons
In December 2020, we launched RWT Horizons, a venture investment strategy focused on early and mid-stage companies driving innovation in financial and real estate technology, and digital infrastructure. Investments made through RWT Horizons are designed to support companies whose technologies are accretive to our businesses, including our residential and business-purpose lending platforms. New partnerships forged through RWT Horizons will enhance our technology roadmap and drive innovation that focuses on how we can make the lending process less redundant, more seamless and more transparent to our originators, borrowers and investors.
RWT Horizons was launched with an initial capital allocation of $25 million, which we believe gives us ample room to make meaningful investments during the first phase of deployment. We will continuously evaluate our progress and expect to increase this allocation over time.
We recently made our first investments in three technology companies, two focused on the residential rental market (both sourced from our CoreVest borrower network) and one focused on the digitization of the mortgage ecosystem:
Ñ Rent Butter – a Chicago-based firm developing a proprietary tenant screening tool that allows landlords to efficiently evaluate prospective tenants and meaningfully reduce defaults and evictions.
Ñ Rentroom – a New York-based software-as-a-service company that offers an easy-to-use, turnkey property management platform designed for small and mid-sized landlords and their tenants.
Ñ Liquid Mortgage – a patent-pending startup that provides life-of-loan infrastructure to digitize, track documentation, facilitate payments, and record additional information on a blockchain. With Liquid Mortgage we are focused on how blockchain can improve certain processes in the non-agency mortgage sector, specifically post-close purchase activities, servicing, securitization, and secondary trading.
| See Appendix for details on non-GAAP measures. Detailed endnotes are included at the end of this Redwood Review. | ||
| THE REDWOOD REVIEW I 1ST QUARTER 2021 | ||
13 | ||
| Q U A R T E R L Y R E S U L T S | ||
Organic Technology Initiatives & Other Partnerships
Ñ dv01 – In the first quarter of 2021, we onboarded approximately 40 historical Sequoia securitizations (aggregate notional value at issuance of $17.3 billion) onto the dv01 capital markets technology platform to provide investors secure, real-time data and transparency on underlying loan performance. Our partnership with dv01 marks a strategic milestone on our path to implementing innovative technologies that provide secure, automated workflows to Redwood and our stakeholders. Partnering with dv01 enables us to offer unparalleled market transparency into underlying loan performance within our existing Sequoia securitizations. We believe providing this level of visibility into our loan data will further advance Redwood's reputation as a trusted leader in the RMBS market.
Ñ Redwood Rapid Funding – Initially launched in the third quarter of 2020, Rapid Funding is a proprietary technology-enabled program that reduces funding time to jumbo loan sellers by up to 80%(1) for qualified originators. We recently rolled out Rapid Funding+, which includes additional workflow enhancements that enable us to offer more customized funding schedules to an expanded group of loan sellers. As of March 31, 2021, we had used Rapid Funding for $274 million of jumbo loan purchases from qualified sellers since program inception.
Ñ Redwood Live – In the first quarter of 2021, we launched the pilot of Redwood Live, an app-based tool designed to give our sellers visibility into the underwriting process with live status updates for each of their loans. This app allows verified users to log in and access dashboards that contain various metrics for the loan pipeline they have locked with Redwood.
| See Appendix for details on non-GAAP measures. Detailed endnotes are included at the end of this Redwood Review. | ||
| THE REDWOOD REVIEW I 1ST QUARTER 2021 | ||
14 | ||
| Q U A R T E R L Y P O S I T I O N S | ||
Capital Allocations
The following table presents our allocations of capital by segment and by investment type as of March 31, 2021.
| Capital Allocation Detail | ||||||||||||||||||||||||||
| By Investment Type | ||||||||||||||||||||||||||
| March 31, 2021 | ||||||||||||||||||||||||||
| ($ in millions) | ||||||||||||||||||||||||||
Fair Value of Assets (1) | Recourse Debt | Non-Recourse Debt (2) | Total Capital | |||||||||||||||||||||||
| Residential Lending | ||||||||||||||||||||||||||
| Sequoia securities | $ | 383 | $ | (226) | $ | — | $ | 157 | ||||||||||||||||||
| Other investments | 45 | — | — | 45 | ||||||||||||||||||||||
Capital allocated to mortgage banking operations(3) | 1,154 | (839) | — | 315 | ||||||||||||||||||||||
| Total Residential Lending | 1,582 | (1,065) | — | 517 | ||||||||||||||||||||||
| Business Purpose Lending | ||||||||||||||||||||||||||
| SFR securities | 261 | (102) | — | 159 | ||||||||||||||||||||||
| Bridge loans | 646 | (102) | (326) | 218 | ||||||||||||||||||||||
Capital allocated to mortgage banking operations(3) | 329 | (229) | — | 100 | ||||||||||||||||||||||
| Platform premium | 53 | — | — | 53 | ||||||||||||||||||||||
| Total Business Purpose Lending | 1,289 | (433) | (326) | 530 | ||||||||||||||||||||||
| Third-Party Investments | ||||||||||||||||||||||||||
| RPL securities | 497 | — | (200) | 297 | ||||||||||||||||||||||
| Other third-party securities | 83 | — | — | 83 | ||||||||||||||||||||||
| Multifamily securities | 77 | (29) | — | 48 | ||||||||||||||||||||||
| Other investments | 133 | — | — | 133 | ||||||||||||||||||||||
| Total Third-Party Investments | 790 | (29) | (200) | 561 | ||||||||||||||||||||||
| Corporate capital | 279 | 279 | ||||||||||||||||||||||||
| Other assets/(liabilities), net | (10) | (10) | ||||||||||||||||||||||||
| Corporate debt | — | (661) | — | (661) | ||||||||||||||||||||||
| Totals | $ | 3,930 | $ | (2,188) | $ | (526) | $ | 1,216 | ||||||||||||||||||
Ñ During the first quarter, we allocated additional capital to support activities at our mortgage banking operations. Additionally, we retained $22 million of securities from CoreVest securitizations and $8 million of securities from Sequoia securitizations, purchased $16 million of other third-party securities, and sold $34 million of securities.
Ñ At March 31, 2021, we estimate we had approximately $225 million of capital available for investment.
| Detailed endnotes are included at the end of this Redwood Review. | ||
| THE REDWOOD REVIEW I 1ST QUARTER 2021 | ||
15 | ||
| Q U A R T E R L Y P O S I T I O N S | ||
Financing Overview
We finance our business with a diversified mix of secured recourse and non-recourse debt, as well as unsecured corporate debt. Following is an overview of our current financing structure.
Recourse Debt
The following summaries present the composition of our recourse debt and its characteristics as of March 31, 2021.
Recourse Debt Balances at March 31, 2021 | ||||||||||||||||||||||||||||||||||||||
($ in millions) | ||||||||||||||||||||||||||||||||||||||
| Secured Debt | ||||||||||||||||||||||||||||||||||||||
| Fair Value of Secured Assets | Non-Marginable Debt (1) | Marginable Debt (1) | Unsecured Debt | Total Debt | Average Borrowing Cost (2) | |||||||||||||||||||||||||||||||||
| Corporate debt | N/A | $ | 1 | $ | — | $ | 660 | $ | 661 | 4.7 | % | |||||||||||||||||||||||||||
| Securities portfolio | 478 | 275 | 82 | — | 357 | 3.6 | % | |||||||||||||||||||||||||||||||
| SFR loans | 303 | 229 | — | — | 229 | 3.4 | % | |||||||||||||||||||||||||||||||
| Bridge loans | 115 | 102 | — | — | 102 | 3.2 | % | |||||||||||||||||||||||||||||||
| Residential loans | 926 | 489 | 350 | — | 839 | 2.1 | % | |||||||||||||||||||||||||||||||
| Total | $ | 1,821 | $ | 1,096 | $ | 432 | $ | 660 | $ | 2,188 | 3.3 | % | ||||||||||||||||||||||||||
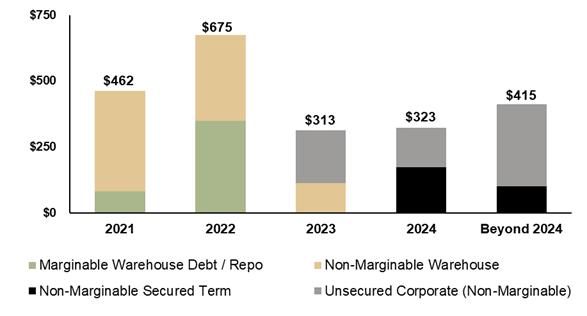
Recourse Debt Scheduled Maturities
($ in millions)
| Detailed endnotes are included at the end of this Redwood Review. | ||
| THE REDWOOD REVIEW I 1ST QUARTER 2021 | ||
16 | ||
| Q U A R T E R L Y P O S I T I O N S | ||
Leverage
Ñ Our recourse leverage ratio(1) was 1.9x at March 31, 2021 and 1.3x at December 31, 2020. The increase in leverage was primarily driven by additional warehouse borrowings incurred to finance increased loan inventories at March 31, 2021. Leverage on our investment portfolio remained consistent from the prior quarter.
Warehouse Capacity
Ñ At March 31, 2021, we had residential warehouse facilities outstanding with five different counterparties, with $1.6 billion of total capacity and $0.8 billion of available capacity. These included non-marginable facilities with $800 million of total capacity and marginable facilities with $800 million of total capacity.
Ñ At March 31, 2021, we had business purpose warehouse facilities outstanding with four different counterparties, with $1.0 billion of total capacity and $0.7 billion of available capacity. All of these facilities are non-marginable.
Non-Recourse Debt
In addition to our secured recourse debt, we also utilize secured term, non-recourse debt to finance the substantial majority of our business purpose bridge loans and RPL investments. Unlike the non-recourse securitization debt we consolidate on our balance sheet that is associated with subordinate securities that we own in those securitizations, the non-recourse financings for bridge loans have two-year terms (one of the facilities is prepayable in June 2021), and the RPL re-securitization financing becomes prepayable in July 2022 and has a rate step-up beginning in July 2023.
As this debt is non-recourse, our net economic exposure represents the difference between the fair value of the investment collateral, and the associated non-recourse debt. At March 31, 2021, we had $517 million of bridge loans(2) financed with $326 million of non-recourse debt, for a net economic exposure of approximately $191 million to these assets. Additionally, at March 31, 2021, we had $431 million of RPL securities financed with $200 million of non-recourse debt, for a net economic exposure of approximately $231 million to these assets.
| Detailed endnotes are included at the end of this Redwood Review. | ||
| THE REDWOOD REVIEW I 1ST QUARTER 2021 | ||
17 | ||
| Q U A R T E R L Y P O S I T I O N S | ||
Credit Overview
This section presents select credit characteristics for our major investment types, with current information as of March 31, 2021.
Residential Investments Credit Characteristics (1) | ||||||||||||||||||||
March 31, 2021 | ||||||||||||||||||||
($ in millions, except where noted) | ||||||||||||||||||||
Sequoia Select Securities(2) | Sequoia Choice Securities(2) | Re-Performing Loan Securities | ||||||||||||||||||
| Market value | $ | 142 | $ | 218 | $ | 497 | ||||||||||||||
| Average FICO (at origination) | 768 | 740 | 609 | |||||||||||||||||
HPI updated LTV (3) | 43 | % | 60 | % | 68 | % | ||||||||||||||
| Average loan size (in thousands) | $ | 643 | $ | 707 | $ | 166 | ||||||||||||||
| Gross weighted average coupon | 4.0 | % | 4.9 | % | 4.5 | % | ||||||||||||||
| Current 3-month prepayment rate | 53 | % | 54 | % | 10 | % | ||||||||||||||
90+ days delinquency (as a % of UPB)(4) | 0.8 | % | 4.4 | % | 16.1 | % | ||||||||||||||
Investment thickness (5) | 6 | % | 20 | % | 24 | % | ||||||||||||||
Ñ Sequoia Select Securities — As of March 31, 2021, we had securitized $22.9 billion of Sequoia Select loans since 2010. Our securitized Select portfolio includes fully documented loans to prime borrowers with an average FICO score (at loan origination) of 768, maximum loan-to-value (at origination) of 80%, and a maximum debt-to-income ratio (at origination) of 43%. We retain all first-loss securities from our Sequoia Select securitizations, and on average we currently have exposure up to 6% of credit losses resulting from loans underlying the securities.
Ñ Sequoia Choice Securities — As of March 31, 2021, we had securitized $3.7 billion of Sequoia Choice loans since 2017. Our securitized Choice portfolio includes fully documented loans to prime borrowers with an average FICO score (at loan origination) of 740, maximum loan-to-value (at origination) of 90%, and a maximum debt-to-income ratio (at origination) of 49.9%. We retain all of the first-loss securities issued as part of our Sequoia Choice program, and on average we currently have exposure up to the first 20% of credit losses resulting from loans underlying the securities.
Ñ Re-Performing Loan Securities — As of March 31, 2021, we held $497 million of securities collateralized by re-performing loans, and on average we currently have exposure to up to 24% of the credit losses resulting from loans underlying the securities. The collateral underlying these securities are seasoned re-performing, and to a lesser extent non-performing, loans. In most cases, these loans experienced a credit event leading up to the securitization and were modified in order to keep the borrower in their home and current in their payments under recast loan terms.
| Detailed endnotes are included at the end of this Redwood Review. | ||
| THE REDWOOD REVIEW I 1ST QUARTER 2021 | ||
18 | ||
| Q U A R T E R L Y P O S I T I O N S | ||
Business Purpose and Multifamily Investments Credit Characteristics | ||||||||||||||||||||
March 31, 2021 | ||||||||||||||||||||
($ in millions, except where noted) | ||||||||||||||||||||
| SFR Securities | BPL Bridge Loans(1) | Multifamily B-Pieces | ||||||||||||||||||
| Market value | $ | 261 | $ | 646 | $ | 72 | ||||||||||||||
Average current DSCR (2) | 1.4x | N/A | 1.5x | |||||||||||||||||
LTV (at origination) (3) | 68 | % | 70 | % | 73 | % | ||||||||||||||
| Average loan size (in thousands) | $ | 2,759 | $ | 301 | $ | 25,986 | ||||||||||||||
| Gross weighted average coupon | 5.5 | % | 7.9 | % | 3.3 | % | ||||||||||||||
90+ days delinquency (as a % of UPB) (4) | 1.9 | % | 3.3 | % | — | % | ||||||||||||||
Investment thickness (5) | 10 | % | N/A | 10 | % | |||||||||||||||
Ñ SFR Securities — As of March 31, 2021, CoreVest had securitized $3.9 billion of SFR loans across 15 CAFL securitizations since 2015. We own and retain the first-loss securities from CAFL securitizations, and on average have exposure to the first 10% of credit losses.
Ñ BPL Bridge Loans — Our business purpose bridge loans and investments are collateralized by residential and multifamily properties, many of which are being rehabilitated or constructed for either re-sale or rental purposes. The average loan term at origination ranges between 12 to 24 months.
Ñ Multifamily B-Pieces — As of March 31, 2021, we owned $72 million of multifamily b-pieces, which represent first-loss risk on $1.2 billion of underlying multifamily loan collateral across three separate Freddie Mac sponsored securitizations. On average, we have exposure to the first 10% of credit losses resulting from loans underlying the securities.
| Detailed endnotes are included at the end of this Redwood Review. | ||
| THE REDWOOD REVIEW I 1ST QUARTER 2021 | ||
19 | ||

| Table 1: GAAP Earnings (in thousands, except per share data) | |||||||||||||||||||||||||||||||||||||||||
| 2021 Q1 | 2020 Q4 | 2020 Q3 | 2020 Q2 | 2020 Q1 | Twelve Months 2020 | ||||||||||||||||||||||||||||||||||||
| Net interest income | |||||||||||||||||||||||||||||||||||||||||
| From investments | $ | 30,564 | $ | 29,156 | $ | 29,651 | $ | 34,556 | $ | 57,116 | $ | 150,479 | |||||||||||||||||||||||||||||
| From mortgage banking activities | 4,088 | 3,502 | 729 | 2,330 | 5,355 | 11,916 | |||||||||||||||||||||||||||||||||||
| Corporate debt expense | (8,899) | (9,008) | (8,809) | (9,606) | (11,061) | (38,484) | |||||||||||||||||||||||||||||||||||
| Net interest income | 25,753 | 23,650 | 21,571 | 27,280 | 51,410 | 123,911 | |||||||||||||||||||||||||||||||||||
| Non-interest income (loss) | |||||||||||||||||||||||||||||||||||||||||
| Residential mortgage banking activities, net | 61,435 | 22,943 | 11,864 | (8,005) | (23,081) | 3,721 | |||||||||||||||||||||||||||||||||||
| Business purpose mortgage banking activities, net | 21,172 | 31,018 | 47,531 | 2,023 | (5,821) | 74,751 | |||||||||||||||||||||||||||||||||||
| Investment fair value changes, net | 45,087 | 23,119 | 107,047 | 152,228 | (870,832) | (588,438) | |||||||||||||||||||||||||||||||||||
| Realized gains, net | 2,716 | 5 | 602 | 25,965 | 3,852 | 30,424 | |||||||||||||||||||||||||||||||||||
| Other income (loss), net | 3,843 | 209 | (114) | 1,165 | 2,928 | 4,188 | |||||||||||||||||||||||||||||||||||
| Total non-interest income (loss), net | 134,253 | 77,294 | 166,930 | 173,376 | (892,954) | (475,354) | |||||||||||||||||||||||||||||||||||
| Compensation expense | (34,643) | (19,572) | (18,624) | (18,358) | (16,690) | (73,244) | |||||||||||||||||||||||||||||||||||
Acquisition-related equity compensation expense (1) | (1,212) | (1,212) | (1,212) | (1,212) | (1,212) | (4,848) | |||||||||||||||||||||||||||||||||||
| Other general and administrative expense | (7,696) | (9,588) | (7,794) | (8,950) | (10,780) | (37,112) | |||||||||||||||||||||||||||||||||||
| Total general and administrative expenses | (43,551) | (30,372) | (27,630) | (28,520) | (28,682) | (115,204) | |||||||||||||||||||||||||||||||||||
| Loan acquisition costs (including commissions) | (3,559) | (3,307) | (2,158) | (1,572) | (3,986) | (11,023) | |||||||||||||||||||||||||||||||||||
| Other expenses | (4,096) | (4,499) | (7,788) | (5,083) | (91,415) | (108,785) | |||||||||||||||||||||||||||||||||||
| (Provision for) benefit from income taxes | (11,543) | (8,471) | (9,113) | (37) | 22,229 | 4,608 | |||||||||||||||||||||||||||||||||||
| Net income (loss) | $ | 97,257 | $ | 54,295 | $ | 141,812 | $ | 165,444 | $ | (943,398) | $ | (581,847) | |||||||||||||||||||||||||||||
Diluted average shares (2) | 141,039 | 140,641 | 141,970 | 147,099 | 114,077 | 113,936 | |||||||||||||||||||||||||||||||||||
| Diluted earnings (loss) per common share | $ | 0.72 | $ | 0.42 | $ | 1.02 | $ | 1.00 | $ | (8.28) | $ | (5.12) | |||||||||||||||||||||||||||||
(1)Acquisition-related equity compensation expense relates to shares of restricted stock that were issued to members of CoreVest management as a component of the consideration paid to them for our purchase of their interests in CoreVest.
(2)Diluted average shares includes shares from the assumed conversion of our convertible and/or exchangeable debt in certain periods, in accordance with GAAP diluted EPS provisions. See Table 3 that follows for details of this calculation for the current and prior quarter and our respective Quarterly Reports on Form 10-Q and Annual Report on Form 10-K.
| THE REDWOOD REVIEW I 1ST QUARTER 2021 | Table 1: GAAP Earnings 21 | |||||||
| Table 2: Segment Results ($ in thousands) | ||||||||||||||||||||||||||||||||||||||||||||||||||||||||||||||
| Three Months Ended March 31, 2021 | ||||||||||||||||||||||||||||||||||||||||||||||||||||||||||||||
| Residential Mortgage Banking | Residential Investments | Total Residential Lending | Business Purpose Mortgage Banking | Business Purpose Investments | Total Business Purpose Lending | Third-Party Investments | Corporate / Other | Total | ||||||||||||||||||||||||||||||||||||||||||||||||||||||
| Net interest income (expense) | $ | 2,832 | $ | 5,679 | $ | 8,511 | $ | 1,256 | $ | 13,074 | $ | 14,330 | $ | 11,811 | $ | (8,899) | $ | 25,753 | ||||||||||||||||||||||||||||||||||||||||||||
| Non-interest income | ||||||||||||||||||||||||||||||||||||||||||||||||||||||||||||||
| Mortgage banking activities, net | 61,435 | — | 61,435 | 21,172 | — | 21,172 | — | — | 82,607 | |||||||||||||||||||||||||||||||||||||||||||||||||||||
| Investment fair value changes, net | — | 2,746 | 2,746 | — | 3,299 | 3,299 | 39,716 | (674) | 45,087 | |||||||||||||||||||||||||||||||||||||||||||||||||||||
| Other income, net | — | 2,853 | 2,853 | 122 | 721 | 843 | — | 147 | 3,843 | |||||||||||||||||||||||||||||||||||||||||||||||||||||
| Realized gains, net | — | 2,408 | 2,408 | — | 108 | 108 | 200 | — | 2,716 | |||||||||||||||||||||||||||||||||||||||||||||||||||||
| Total non-interest income (loss), net | 61,435 | 8,007 | 69,442 | 21,294 | 4,128 | 25,422 | 39,916 | (527) | 134,253 | |||||||||||||||||||||||||||||||||||||||||||||||||||||
| General and administrative expenses | (12,689) | (1,068) | (13,757) | (10,194) | (965) | (11,159) | (1,131) | (17,504) | (43,551) | |||||||||||||||||||||||||||||||||||||||||||||||||||||
| Loan acquisition costs | (1,404) | (12) | (1,416) | (1,492) | (560) | (2,052) | (87) | (4) | (3,559) | |||||||||||||||||||||||||||||||||||||||||||||||||||||
| Other expenses, net | (6) | — | (6) | (3,777) | — | (3,777) | (330) | 17 | (4,096) | |||||||||||||||||||||||||||||||||||||||||||||||||||||
| (Provision for) benefit from income taxes | (9,486) | (493) | (9,979) | (1,321) | — | (1,321) | (243) | — | (11,543) | |||||||||||||||||||||||||||||||||||||||||||||||||||||
| Net income (loss) | $ | 40,682 | $ | 12,113 | $ | 52,795 | $ | 5,766 | $ | 15,677 | $ | 21,443 | $ | 49,936 | $ | (26,917) | $ | 97,257 | ||||||||||||||||||||||||||||||||||||||||||||
| Three Months Ended December 31, 2020 | ||||||||||||||||||||||||||||||||||||||||||||||||||||||||||||||
| Residential Mortgage Banking | Residential Investments | Total Residential Lending | Business Purpose Mortgage Banking | Business Purpose Investments | Total Business Purpose Lending | Third-Party Investments | Corporate / Other | Total | ||||||||||||||||||||||||||||||||||||||||||||||||||||||
| Net interest income (expense) | $ | 1,471 | $ | 5,833 | $ | 7,304 | $ | 2,031 | $ | 9,978 | $ | 12,009 | $ | 13,345 | $ | (9,008) | $ | 23,650 | ||||||||||||||||||||||||||||||||||||||||||||
| Non-interest income | ||||||||||||||||||||||||||||||||||||||||||||||||||||||||||||||
| Mortgage banking activities, net | 22,943 | — | 22,943 | 31,018 | — | 31,018 | — | — | 53,961 | |||||||||||||||||||||||||||||||||||||||||||||||||||||
| Investment fair value changes, net | — | 5,719 | 5,719 | — | 3,795 | 3,795 | 14,692 | (1,087) | 23,119 | |||||||||||||||||||||||||||||||||||||||||||||||||||||
| Other income, net | — | (2,364) | (2,364) | 1,175 | (17) | 1,158 | 422 | 993 | 209 | |||||||||||||||||||||||||||||||||||||||||||||||||||||
| Realized gains, net | — | — | — | — | — | — | 5 | — | 5 | |||||||||||||||||||||||||||||||||||||||||||||||||||||
| Total non-interest income (loss), net | 22,943 | 3,355 | 26,298 | 32,193 | 3,778 | 35,971 | 15,119 | (94) | 77,294 | |||||||||||||||||||||||||||||||||||||||||||||||||||||
| General and administrative expenses | (4,631) | (407) | (5,038) | (8,740) | (602) | (9,342) | (816) | (15,176) | (30,372) | |||||||||||||||||||||||||||||||||||||||||||||||||||||
| Loan acquisition costs | (1,261) | (12) | (1,273) | (1,556) | (358) | (1,914) | (117) | (3) | (3,307) | |||||||||||||||||||||||||||||||||||||||||||||||||||||
| Other expenses | (805) | — | (805) | (3,404) | — | (3,404) | (153) | (137) | (4,499) | |||||||||||||||||||||||||||||||||||||||||||||||||||||
| (Provision for) benefit from income taxes | (3,260) | — | (3,260) | (4,540) | — | (4,540) | (671) | — | (8,471) | |||||||||||||||||||||||||||||||||||||||||||||||||||||
| Net income (loss) | $ | 14,457 | $ | 8,769 | $ | 23,226 | $ | 15,984 | $ | 12,796 | $ | 28,780 | $ | 26,707 | $ | (24,418) | $ | 54,295 | ||||||||||||||||||||||||||||||||||||||||||||
| THE REDWOOD REVIEW I 1ST QUARTER 2021 | Table 2: Segment Results 22 | |||||||
| Table 3: GAAP Basic and Diluted Earnings per Common Share (in thousands, except per share data) | |||||||||||||||||||||||||||||||||||||||||
| 2021 Q1 | 2020 Q4 | 2020 Q3 | 2020 Q2 | 2020 Q1 | Twelve Months 2020 | ||||||||||||||||||||||||||||||||||||
| GAAP Earnings per Common Share ("EPS"): | |||||||||||||||||||||||||||||||||||||||||
| Net income (loss) attributable to Redwood | $ | 97,257 | $ | 54,295 | $ | 141,812 | $ | 165,444 | $ | (943,398) | $ | (581,847) | |||||||||||||||||||||||||||||
| Adjust for dividends and undistributed earnings allocated to participating securities | (3,294) | (1,705) | (4,067) | (4,528) | (1,209) | (1,990) | |||||||||||||||||||||||||||||||||||
| Net income (loss) allocated to common shareholders for GAAP basic EPS | 93,963 | 52,590 | 137,745 | 160,916 | (944,607) | (583,837) | |||||||||||||||||||||||||||||||||||
| Incremental adjustment to dividends and undistributed earnings allocated to participating securities | 343 | 58 | 555 | 1,412 | — | — | |||||||||||||||||||||||||||||||||||
Adjust for interest expense and gain on extinguishment on convertible notes for the period, net of tax (1) | 7,007 | 6,999 | 6,990 | (15,835) | — | — | |||||||||||||||||||||||||||||||||||
| Net income (loss) allocated to common shareholders for GAAP diluted EPS | $ | 101,313 | $ | 59,647 | $ | 145,290 | $ | 146,493 | $ | (944,607) | $ | (583,837) | |||||||||||||||||||||||||||||
| Basic weighted average common shares outstanding | 112,277 | 112,074 | 113,403 | 114,383 | 114,077 | 113,936 | |||||||||||||||||||||||||||||||||||
| Net effect of dilutive equity awards | 196 | — | — | — | — | — | |||||||||||||||||||||||||||||||||||
Net effect of assumed convertible notes conversion to common shares (1) | 28,567 | 28,567 | 28,567 | 32,716 | — | — | |||||||||||||||||||||||||||||||||||
| Diluted weighted average common shares outstanding | 141,040 | 140,641 | 141,970 | 147,099 | 114,077 | 113,936 | |||||||||||||||||||||||||||||||||||
| GAAP Basic Earnings (Loss) per Common Share | $ | 0.84 | $ | 0.47 | $ | 1.21 | $ | 1.41 | $ | (8.28) | $ | (5.12) | |||||||||||||||||||||||||||||
| GAAP Diluted Earnings (Loss) per Common Share | $ | 0.72 | $ | 0.42 | $ | 1.02 | $ | 1.00 | $ | (8.28) | $ | (5.12) | |||||||||||||||||||||||||||||
(1)Certain convertible notes were determined to be dilutive during the first quarter of 2021 and the second through fourth quarters of 2020 and were included in the calculation of diluted EPS under the "if-converted" method. Under this method, the periodic interest expense and gains on extinguishment of debt (net of applicable taxes) for dilutive notes is added back to the numerator and the number of shares that the notes are entitled to (if converted, regardless of whether they are in or out of the money) are included in the denominator.
| THE REDWOOD REVIEW I 1ST QUARTER 2021 | Table 3: GAAP Earnings per Basic and Diluted Common Share 23 | |||||||
| Table 4: Financial Ratios and Book Value ($ in thousands, except per share data) | |||||||||||||||||||||||||||||||||||||||||
| 2021 Q1 | 2020 Q4 | 2020 Q3 | 2020 Q2 | 2020 Q1 | Twelve Months 2020 | ||||||||||||||||||||||||||||||||||||
| Financial performance ratios | |||||||||||||||||||||||||||||||||||||||||
| GAAP net income (loss) | $ | 97,257 | $ | 54,295 | $ | 141,812 | $ | 165,444 | $ | (943,398) | $ | (581,847) | |||||||||||||||||||||||||||||
| Corporate general and administrative expenses | $ | (17,504) | $ | (15,176) | $ | (12,998) | $ | (13,818) | $ | (10,908) | $ | (52,900) | |||||||||||||||||||||||||||||
| Average total assets | $ | 10,703,876 | $ | 10,362,681 | $ | 10,098,372 | $ | 10,410,067 | $ | 17,838,481 | $ | 12,166,762 | |||||||||||||||||||||||||||||
| Average total equity | $ | 1,142,855 | $ | 1,079,952 | $ | 999,381 | $ | 808,896 | $ | 1,613,920 | $ | 1,125,068 | |||||||||||||||||||||||||||||
| Corporate general and administrative expenses / average total equity | 6.13 | % | 5.62 | % | 5.20 | % | 6.83 | % | 2.70 | % | 4.70 | % | |||||||||||||||||||||||||||||
| GAAP net income / average equity (GAAP ROE) | 34.04 | % | 20.11 | % | 56.76 | % | 81.81 | % | N/A | N/A | |||||||||||||||||||||||||||||||
| Leverage ratios and book value per share | |||||||||||||||||||||||||||||||||||||||||
| Short-term recourse debt | $ | 1,061,811 | $ | 314,234 | $ | 253,763 | $ | 418,370 | $ | 2,082,717 | |||||||||||||||||||||||||||||||
| Long-term recourse debt | 1,126,147 | 1,074,529 | 1,094,950 | 1,402,688 | 2,470,928 | ||||||||||||||||||||||||||||||||||||
| Total recourse debt | $ | 2,187,958 | $ | 1,388,763 | $ | 1,348,713 | $ | 1,821,058 | $ | 4,553,645 | |||||||||||||||||||||||||||||||
| At consolidated securitization and non-recourse entities | |||||||||||||||||||||||||||||||||||||||||
| ABS issued | 6,671,678 | 7,100,662 | 7,172,398 | 6,856,086 | 6,461,864 | ||||||||||||||||||||||||||||||||||||
| Other non-recourse debt | 518,365 | 576,176 | 688,656 | 600,356 | 259,876 | ||||||||||||||||||||||||||||||||||||
| Total ABS issued and non-recourse debt | $ | 7,190,043 | $ | 7,676,838 | $ | 7,861,054 | $ | 7,456,442 | $ | 6,721,740 | |||||||||||||||||||||||||||||||
Consolidated debt (1) | $ | 9,378,001 | $ | 9,065,601 | $ | 9,209,767 | $ | 9,277,500 | $ | 11,275,385 | |||||||||||||||||||||||||||||||
Tangible stockholders' equity (non-GAAP (2)) | $ | 1,162,583 | $ | 1,054,035 | $ | 992,727 | $ | 871,966 | $ | 656,719 | |||||||||||||||||||||||||||||||
| Total stockholders' equity | $ | 1,215,575 | $ | 1,110,899 | $ | 1,053,464 | $ | 936,576 | $ | 725,202 | |||||||||||||||||||||||||||||||
Total capital (3) | $ | 1,865,968 | $ | 1,760,658 | $ | 1,702,599 | $ | 1,585,096 | $ | 1,495,700 | |||||||||||||||||||||||||||||||
Recourse leverage ratio (recourse debt at Redwood to tangible stockholders' equity)(4) | 1.9x | 1.3x | 1.4x | 2.1x | 6.9x | ||||||||||||||||||||||||||||||||||||
| Consolidated debt to tangible stockholders' equity | 8.1x | 8.6x | 9.3x | 10.6x | 17.2x | ||||||||||||||||||||||||||||||||||||
| Shares outstanding at period end (in thousands) | 112,999 | 112,090 | 111,904 | 114,940 | 114,838 | ||||||||||||||||||||||||||||||||||||
| Book value per share | $ | 10.76 | $ | 9.91 | $ | 9.41 | $ | 8.15 | $ | 6.32 | |||||||||||||||||||||||||||||||
(1)Amounts presented in Consolidated debt above do not include deferred issuance costs or debt discounts.
(2)At March 31, 2021, December 31, 2020, September 30, 2020, June 30, 2020, and March 31, 2020, tangible stockholders' equity excluded $53 million, $57 million, $61 million, $65 million, and $68 million, respectively, of intangible assets.
(3)Our total capital of $1.9 billion at March 31, 2021 included $1.2 billion of equity capital and $0.7 billion of unsecured corporate debt.
(4)Excludes ABS issued and non-recourse debt at consolidated entities. See Table 6 for additional detail on our ABS issued and short-term debt at consolidated entities.
| THE REDWOOD REVIEW I 1ST QUARTER 2021 | Table 4: Financial Ratios and Book Value 24 | |||||||
| Table 5A: Combined Investment Portfolio Detail ($ in thousands) | Table 5B: Combined Investment Portfolio Rollforward ($ in thousands) | |||||||||||||||||||||||||||||||||||||||||||||||||||||||||||||||||||||||||||||||
| 3/31/21 | 12/31/20 | 9/30/20 | Asset Rollforward | Sequoia Securities | MSRs / Other | SFR Securities | Bridge Loans | RPL Securities | Other Third-Party | Multifamily Securities | Other Investments | Total | ||||||||||||||||||||||||||||||||||||||||||||||||||||||||||||||||||||
| Investment Portfolio Assets | Balance at 9/30/20 | $ | 356 | $ | 50 | $ | 229 | $ | 725 | $ | 477 | $ | 89 | $ | 82 | $ | 131 | $ | 2,139 | |||||||||||||||||||||||||||||||||||||||||||||||||||||||||||||
| Sequoia securities | $ | 383 | $ | 373 | $ | 356 | New investments | 4 | — | 26 | 99 | — | 7 | — | 3 | 139 | ||||||||||||||||||||||||||||||||||||||||||||||||||||||||||||||||
| MSRs/Other | 45 | 45 | 50 | Sales/Paydowns | — | — | (19) | (160) | — | (29) | (5) | (1) | (214) | |||||||||||||||||||||||||||||||||||||||||||||||||||||||||||||||||||
| SFR securities | 261 | 239 | 229 | MTM | 16 | (6) | 2 | (1) | 7 | 12 | 1 | — | 31 | |||||||||||||||||||||||||||||||||||||||||||||||||||||||||||||||||||
| Bridge loans | 646 | 663 | 725 | Other, net | (3) | 1 | — | (1) | — | — | — | — | (3) | |||||||||||||||||||||||||||||||||||||||||||||||||||||||||||||||||||
| RPL securities | 497 | 483 | 477 | Balance at 12/31/20 | $ | 373 | $ | 45 | $ | 239 | $ | 663 | $ | 483 | $ | 79 | $ | 78 | $ | 133 | $ | 2,093 | ||||||||||||||||||||||||||||||||||||||||||||||||||||||||||
| Other third-party securities | 83 | 79 | 89 | New investments | 8 | — | 22 | 133 | — | 11 | 5 | — | 179 | |||||||||||||||||||||||||||||||||||||||||||||||||||||||||||||||||||
| Multifamily securities | 77 | 78 | 82 | Sales/Paydowns | (7) | — | — | (149) | (12) | (10) | (14) | (3) | (195) | |||||||||||||||||||||||||||||||||||||||||||||||||||||||||||||||||||
| Other investments | 133 | 133 | 131 | MTM | 12 | — | — | 3 | 27 | 4 | 9 | 3 | 58 | |||||||||||||||||||||||||||||||||||||||||||||||||||||||||||||||||||
| Total investments | $ | 2,125 | $ | 2,093 | $ | 2,139 | Other, net | (2) | — | — | (4) | (1) | (1) | (1) | — | (9) | ||||||||||||||||||||||||||||||||||||||||||||||||||||||||||||||||
| Balance at 3/31/21 | $ | 383 | $ | 45 | $ | 261 | $ | 646 | $ | 497 | $ | 83 | $ | 77 | $ | 133 | $ | 2,125 | ||||||||||||||||||||||||||||||||||||||||||||||||||||||||||||||
| Debt Secured by Portfolio Assets | ||||||||||||||||||||||||||||||||||||||||||||||||||||||||||||||||||||||||||||||||
| Sequoia securities | $ | (226) | $ | (226) | $ | (225) | ||||||||||||||||||||||||||||||||||||||||||||||||||||||||||||||||||||||||||
| MSRs/Other | — | — | — | |||||||||||||||||||||||||||||||||||||||||||||||||||||||||||||||||||||||||||||
| SFR securities | (102) | (103) | (103) | |||||||||||||||||||||||||||||||||||||||||||||||||||||||||||||||||||||||||||||
| Bridge loans | (428) | (456) | (524) | |||||||||||||||||||||||||||||||||||||||||||||||||||||||||||||||||||||||||||||
| RPL securities | (200) | (205) | (208) | |||||||||||||||||||||||||||||||||||||||||||||||||||||||||||||||||||||||||||||
| Other third-party securities | — | — | — | |||||||||||||||||||||||||||||||||||||||||||||||||||||||||||||||||||||||||||||
| Multifamily securities | (29) | (30) | (31) | |||||||||||||||||||||||||||||||||||||||||||||||||||||||||||||||||||||||||||||
| Other investments | — | — | — | |||||||||||||||||||||||||||||||||||||||||||||||||||||||||||||||||||||||||||||
| Total debt secured by investments | $ | (985) | $ | (1,019) | $ | (1,091) | ||||||||||||||||||||||||||||||||||||||||||||||||||||||||||||||||||||||||||
| Net Capital Invested in Portfolio Assets | ||||||||||||||||||||||||||||||||||||||||||||||||||||||||||||||||||||||||||||||||
| Sequoia securities | $ | 157 | $ | 147 | $ | 131 | ||||||||||||||||||||||||||||||||||||||||||||||||||||||||||||||||||||||||||
| MSRs/Other | 45 | 45 | 50 | |||||||||||||||||||||||||||||||||||||||||||||||||||||||||||||||||||||||||||||
| SFR securities | 159 | 136 | 126 | |||||||||||||||||||||||||||||||||||||||||||||||||||||||||||||||||||||||||||||
| Bridge loans | 218 | 207 | 201 | |||||||||||||||||||||||||||||||||||||||||||||||||||||||||||||||||||||||||||||
| RPL securities | 297 | 278 | 269 | |||||||||||||||||||||||||||||||||||||||||||||||||||||||||||||||||||||||||||||
| Other third-party securities | 83 | 79 | 89 | |||||||||||||||||||||||||||||||||||||||||||||||||||||||||||||||||||||||||||||
| Multifamily securities | 48 | 48 | 51 | |||||||||||||||||||||||||||||||||||||||||||||||||||||||||||||||||||||||||||||
| Other investments | 133 | 133 | 131 | |||||||||||||||||||||||||||||||||||||||||||||||||||||||||||||||||||||||||||||
| Total capital invested | $ | 1,140 | $ | 1,073 | $ | 1,048 | Notes | |||||||||||||||||||||||||||||||||||||||||||||||||||||||||||||||||||||||||
| (1) Total leverage is calculated by dividing the total debt secured by portfolio assets (both secured recourse and secured pre-payable non-recourse debt), by the total capital invested in portfolio assets. | ||||||||||||||||||||||||||||||||||||||||||||||||||||||||||||||||||||||||||||||||
Total leverage (1) | 0.86 | x | 0.95 | x | 1.04 | x | ||||||||||||||||||||||||||||||||||||||||||||||||||||||||||||||||||||||||||
| THE REDWOOD REVIEW I 1ST QUARTER 2021 | Table 5: Combined Investment Portfolio 25 | |||||||
| Table 6: Consolidated Balance Sheet ($ in thousands) | ||||||||||||||||||||||||||||||||||||||||||||||||||||||||||||||||||||
| March 31, 2021 | ||||||||||||||||||||||||||||||||||||||||||||||||||||||||||||||||||||
Consolidated VIEs (1) | ||||||||||||||||||||||||||||||||||||||||||||||||||||||||||||||||||||
| Mar 31, 2021 | Dec 31, 2020 | At Redwood (1) | Sequoia Choice | CAFL | Freddie Mac SLST | Freddie Mac K-Series | Other VIEs (2) | Other (3) | Redwood Consolidated | |||||||||||||||||||||||||||||||||||||||||||||||||||||||||||
| Residential loans | $ | 4,701,836 | $ | 4,249,051 | $ | 996,512 | $ | 1,276,112 | $ | — | $ | 2,154,351 | $ | — | $ | 274,861 | $ | — | $ | 4,701,836 | ||||||||||||||||||||||||||||||||||||||||||||||||
| Business purpose loans | 4,172,120 | 4,136,353 | 461,994 | — | 3,212,526 | — | — | — | 497,600 | 4,172,120 | ||||||||||||||||||||||||||||||||||||||||||||||||||||||||||
| Multifamily loans | 489,545 | 492,221 | — | — | — | — | 489,545 | — | — | 489,545 | ||||||||||||||||||||||||||||||||||||||||||||||||||||||||||
| Real estate securities | 364,320 | 344,125 | 364,320 | — | — | — | — | — | — | 364,320 | ||||||||||||||||||||||||||||||||||||||||||||||||||||||||||
| Other investments | 322,579 | 348,175 | 77,497 | — | — | — | 225,723 | 19,359 | 322,579 | |||||||||||||||||||||||||||||||||||||||||||||||||||||||||||
| Cash and cash equivalents | 426,019 | 461,260 | 415,321 | — | — | — | — | 10,698 | — | 426,019 | ||||||||||||||||||||||||||||||||||||||||||||||||||||||||||
Other assets (4) | 420,429 | 323,881 | 340,042 | 5,904 | 25,869 | 8,420 | 1,338 | 38,856 | — | 420,429 | ||||||||||||||||||||||||||||||||||||||||||||||||||||||||||
| Total assets | $ | 10,896,848 | $ | 10,355,066 | $ | 2,655,686 | $ | 1,282,016 | $ | 3,238,395 | $ | 2,162,771 | $ | 490,883 | $ | 550,138 | $ | 516,959 | $ | 10,896,848 | ||||||||||||||||||||||||||||||||||||||||||||||||
| Short-term debt | $ | 1,253,882 | $ | 522,609 | $ | 1,061,810 | $ | — | $ | — | $ | — | $ | — | $ | 192,072 | $ | — | $ | 1,253,882 | ||||||||||||||||||||||||||||||||||||||||||||||||
| Other liabilities | 317,452 | 195,412 | 280,053 | 3,686 | 10,412 | 4,669 | 1,208 | 17,424 | — | 317,452 | ||||||||||||||||||||||||||||||||||||||||||||||||||||||||||
| ABS issued | 6,671,677 | 7,100,661 | — | 1,054,005 | 2,963,752 | 1,921,440 | 460,565 | 271,915 | — | 6,671,677 | ||||||||||||||||||||||||||||||||||||||||||||||||||||||||||
| Long-term debt, net | 1,438,262 | 1,425,485 | 1,112,696 | — | — | — | — | — | 325,566 | 1,438,262 | ||||||||||||||||||||||||||||||||||||||||||||||||||||||||||
| Total liabilities | 9,681,273 | 9,244,167 | 2,454,559 | 1,057,691 | 2,974,164 | 1,926,109 | 461,773 | 481,411 | 325,566 | 9,681,273 | ||||||||||||||||||||||||||||||||||||||||||||||||||||||||||
| Equity | 1,215,575 | 1,110,899 | 201,127 | 224,325 | 264,231 | 236,662 | 29,110 | 68,727 | 191,393 | 1,215,575 | ||||||||||||||||||||||||||||||||||||||||||||||||||||||||||
| Total liabilities and equity | $ | 10,896,848 | $ | 10,355,066 | $ | 2,655,686 | $ | 1,282,016 | $ | 3,238,395 | $ | 2,162,771 | $ | 490,883 | $ | 550,138 | $ | 516,959 | $ | 10,896,848 | ||||||||||||||||||||||||||||||||||||||||||||||||
(1)The format of this consolidating balance sheet is provided to more clearly delineate between the assets and liabilities belonging to securitization entities (Consolidated VIEs) that we are required to consolidate on our balance sheet in accordance with GAAP, and the assets that are legally ours and the liabilities of ours for which there is recourse to us. Each of these entities is independent of Redwood and of each other and the assets and liabilities of these entities are not owned by and are not legal obligations of ours. Our exposure to these entities is primarily through the financial interests we have retained or acquired in these entities (generally subordinate and interest-only securities), the fair value of which is represented by our equity in each entity, as presented in this table.
(2)Includes our consolidated Legacy Sequoia and Servicing Investment entities. At March 31, 2021, our equity in the Legacy Sequoia and Servicing Investment entities was $4 million and $65 million, respectively. At December 31, 2020, our equity in the Legacy Sequoia and Servicing Investment entities was $5 million and $68 million, respectively.
(3)Includes business purpose bridge loans and associated non-recourse secured financing.
(4)At both March 31, 2021 and December 31, 2020, restricted cash and other assets at Redwood included a total of $46 million of assets held by third-party custodians and pledged as collateral to the GSEs in connection with credit risk-sharing arrangements. These pledged assets can only be used to settle obligations to the GSEs under these risk-sharing arrangements.
| THE REDWOOD REVIEW I 1ST QUARTER 2021 | Table 6: Consolidated Balance Sheet 26 | |||||||

| S E G M E N T O V E R V I E W | ||
Segment Overview
In the fourth quarter of 2019, we reorganized our operations into four business segments, representing the areas of the housing market in which we operate. Given changes in the composition of our portfolio in early 2020 resulting from COVID-19 and liquidity-related impacts, in the second quarter of 2020, we combined our Third-Party Residential Investments and Multifamily Investments segments into a new segment called Third-Party Investments. Our two lending segments represent vertically integrated platforms and our third segment now captures all of our third-party investments.
Each segment includes all revenue and direct expense associated with the origination, acquisition and management of its associated financial assets. Our three business segments currently include:
Residential Lending – Comprised of our residential mortgage banking operations and investments created from these activities, including primarily securities retained from our residential loan securitization activities.
Business Purpose Lending – Comprised of our business purpose mortgage banking operations and investments created from these activities, including: SFR securities retained from CoreVest-sponsored securitizations and investments in residential and small-balance multifamily bridge loans.
Third-Party Investments – Comprised of other investments not sourced through our residential or business purpose lending operations, including: re-performing loan securities, third-party RMBS (including CRT securities and legacy securities), multifamily securities and loans we have acquired, and other housing-related investments.
| Detailed endnotes are included at the end of this Redwood Review. | ||
| THE REDWOOD REVIEW I 1ST QUARTER 2021 | ||
28 | ||
| D I V I D E N D S A N D T A X A B L E I N C O M E | ||
Dividends and Taxable Income
Summary
As a REIT, Redwood is required to distribute to shareholders at least 90% of its annual REIT taxable income, excluding net capital gains. To the extent Redwood retains REIT taxable income, including net capital gains, it is taxed at corporate tax rates. Redwood also earns taxable income at its taxable REIT subsidiaries (TRS), which it is not required to distribute.
Dividends Overview
In recent years, our Board of Directors has maintained a practice of paying regular quarterly dividends, including when in excess of the amount required to comply with the provisions of the Internal Revenue Code applicable to REITs. In March 2021, the Board of Directors declared a regular dividend of $0.16 per share for the first quarter of 2021, which was paid on March 31, 2021 to shareholders of record on March 24, 2021.
REIT Taxable Income and Dividend Distribution Requirement
Our estimated REIT taxable income was $10 million, or $0.09 per share, for the first quarter of 2021 and $6 million, or $0.05 per share, for the fourth quarter of 2020. Under normal circumstances, our minimum REIT dividend requirement would be 90% of our annual REIT taxable income. However, we carried a $36 million federal net operating loss carry forward (NOL) into 2021 at the REIT that affords us the option of retaining REIT taxable income up to the NOL amount, tax free, rather than distributing it as dividends. Federal income tax rules require the dividends paid deduction to be applied to reduce REIT taxable income before the applicability of NOLs is considered; therefore, REIT taxable income must exceed our dividend distribution for us to utilize a portion of our NOL and any remaining NOL amount will carry forward into future years.
Income Tax Characterization of Dividend for Shareholders
While the exact amount is uncertain at this time, we currently expect a significant portion of our 2021 dividend distributions to be taxable as ordinary income for federal income tax purposes. Any remaining amount is currently expected to be characterized as a return of capital, which in general is non-taxable (provided it does not exceed a shareholder's tax basis in Redwood shares) and reduces a shareholder's basis in Redwood shares (but not below zero). To the extent such distributions exceed a shareholder's basis in Redwood shares, such excess amount would be taxable as capital gain. Under the federal income tax rules applicable to REITs, none of Redwood’s 2021 dividend distributions are expected to be characterized as long-term capital gain dividends.
| Detailed endnotes are included at the end of this Redwood Review. | ||
| THE REDWOOD REVIEW I 1ST QUARTER 2021 | ||
29 | ||
| D I V I D E N D S A N D T A X A B L E I N C O M E | ||
Individual taxpayers may generally deduct 20% of their ordinary REIT dividends from taxable income. This results in a maximum federal effective tax rate of 29.6% on an individual taxpayer's ordinary REIT dividends, compared to the highest marginal rate of 37%. This deduction does not apply to REIT dividends classified as qualified dividend income or long-term capital gain dividends, as those dividends are taxed at a maximum rate of 20% for individuals.
Taxable Income
Below we present details of our estimated taxable income for the quarter ended March 31, 2021 and the year ended December 31, 2020.
Taxable Income (1) | |||||||||||||||||
| (In millions, except for per share data) | |||||||||||||||||
Estimated Three Months 2021 (2) | Estimated Twelve Months 2020 (2) | ||||||||||||||||
| REIT taxable income (loss) | $ | 10 | $ | (7) | |||||||||||||
| Taxable income at taxable subsidiaries | 53 | 68 | |||||||||||||||
| Taxable income | $ | 63 | $ | 61 | |||||||||||||
Shares used for taxable EPS calculation(3) | 113 | 112 | |||||||||||||||
| REIT taxable income (loss) per share | $ | 0.09 | $ | (0.05) | |||||||||||||
| Taxable income per share at taxable subsidiaries | $ | 0.47 | $ | 0.61 | |||||||||||||
Taxable income per share (3) | $ | 0.56 | $ | 0.56 | |||||||||||||
| Detailed endnotes are included at the end of this Redwood Review. | ||
| THE REDWOOD REVIEW I 1ST QUARTER 2021 | ||
30 | ||
| N O N - G A A P M E A S U R E M E N T S | ||
Non-GAAP Measurements
Information about our non-GAAP financial measures is provided in this Appendix, which supplements the descriptions and information about these non-GAAP financial measures that is set forth in previous sections of this Redwood Review.
After-Tax Net Operating Contribution and Operating Return on Capital
What is After-Tax Net Operating Contribution and Operating Return on Capital for our Mortgage Banking Operations?
After-Tax Net Operating Contribution and Operating Return on Capital are non-GAAP measures derived from GAAP Net Contribution and Return on Capital, respectively, for our mortgage banking operations.
After-Tax Net Operating Contribution presents a measure of the profitability of these business operations, exclusive of non-cash amortization for amounts related to historical business acquisitions (adjusted for tax effects).
Operating Return on Capital presents an alternative measure of profitability relative to the amount of capital utilized in the operations of the business during a period, and is calculated by dividing annualized non-GAAP After-Tax Net Operating Contribution by the average capital utilized by the business during the period.
Why does management believe that After-Tax Net Operating Contribution and Operating Return on Capital provide useful information to investors in Redwood? How does management use these metrics to analyze Redwood’s performance?
Management utilizes these measures internally as an alternative way of analyzing the performance of Redwood’s mortgage banking operations, as management believes it provides useful comparative results of profitability, exclusive of non-cash amortization for amounts related to historical business acquisitions.
What factors should be considered when comparing non-GAAP After-Tax Net Operating Contribution and Operating Return on Capital to GAAP Net Contribution and Return on Capital?
We caution that After-Tax Net Operating Contribution and Operating Return on Capital for our mortgage banking operations should not be utilized in isolation, nor should they be considered as alternatives to GAAP Net Contribution, GAAP Return on Capital or other measurements of results of operations computed in accordance with GAAP.
| THE REDWOOD REVIEW I 1ST QUARTER 2021 | ||
31 | ||
| N O N - G A A P M E A S U R E M E N T S | ||
Adjusted Net Contribution and Adjusted Return on Capital
What is Adjusted Net Contribution and Adjusted Return on Capital for our Investment Portfolio?
Adjusted Net Contribution and Adjusted Return on Capital are non-GAAP measures derived from GAAP Net Contribution and Return on Capital, respectively, for our investment portfolio.
Adjusted Net Contribution presents a measure of the profitability of the investment portfolio assets of each business segment, exclusive of realized gains and investment fair value changes (each adjusted for tax effects).
Adjusted Return on Capital presents an alternative measure of profitability relative to the amount of capital utilized within our investment portfolio during a period, and is calculated by dividing annualized non-GAAP Adjusted Net Contribution by the average capital utilized by our investment portfolio during the period.
Why does management believe that Adjusted Net Contribution and Adjusted Return on Capital provide useful information to investors in Redwood? How does management use these metrics to analyze Redwood’s performance?
Management utilizes these measures internally as an alternative way of analyzing the performance of Redwood’s portfolio investments, as management believes it provides useful comparative results, by excluding amounts that may experience variability period-to-period and may not be reflective of the expected recurring earnings over the life of those investments.
What factors should be considered when comparing non-GAAP Adjusted Net Contribution and Adjusted Return on Capital to GAAP Net Contribution and Return on Capital?
We caution that Adjusted Net Contribution and Adjusted Return on Capital for our investment portfolio should not be utilized in isolation, nor should they be considered as alternatives to GAAP Net Contribution, GAAP Return on Capital or other measurements of results of operations computed in accordance with GAAP.
| THE REDWOOD REVIEW I 1ST QUARTER 2021 | ||
32 | ||
| F O R W A R D - L O O K I N G S T A T E M E N T S | ||
Forward-Looking Statements
As noted above under the heading “Forward-Looking Statements,” this Redwood Review contains forward-looking statements within the meaning of the safe harbor provisions of the Private Securities Litigation Reform Act of 1995. Forward-looking statements involve numerous risks and uncertainties. Our actual results may differ from our expectations, estimates, and projections and, consequently, you should not rely on these forward-looking statements as predictions of future events. Forward-looking statements are not historical in nature and can be identified by words such as “anticipate,” “estimate,” “will,” “should,” “expect,” “believe,” “intend,” “seek,” “plan,” and similar expressions or their negative forms, or by references to strategy, plans, goals, or intentions. These forward-looking statements are subject to risks and uncertainties, including, among other things, those described in our Annual Report on Form 10-K under the caption “Risk Factors” and in our Current Report on Form 8-K filed on April 2, 2020. Other risks, uncertainties, and factors that could cause actual results to differ materially from those projected are described below and may be described from time to time in reports we file with the Securities and Exchange Commission, including reports on Forms 10-K, 10-Q, and 8-K. We undertake no obligation to update or revise forward-looking statements, whether as a result of new information, future events, or otherwise.
Statements regarding the following subjects, among others, are forward-looking by their nature: (i) statements we make regarding Redwood's business strategy and strategic focus, including statements relating to our overall market position, strategy and long-term prospects (including trends driving the flow of capital in the housing finance market, our strategic initiatives designed to capitalize on those trends, our ability to attract capital to finance those initiatives, our approach to raising capital, our ability to pay dividends in the future, and the prospects for federal housing finance reform); (ii) statements related to our financial outlook and expectations for 2021; (iii) statements related to regulatory changes in Washington, D.C., including expediting the migration of GSE eligible mortgages to the private sector of the market, and expectations that such regulatory changes will result in an opportunity for the private sector; (iv) statements related to our residential and business purpose lending platforms, including that we expect to grow and diversify CoreVest's sourcing channels and deepen our market penetration in products we believe will remain in high demand; (v) statements related to our venture investing platform, RWT Horizons, including that we expect to increase its capital allocation over time; (vi) statements related to our investment portfolio, including that we expect up to $600 million of loans backing Sequoia and CoreVest securitization transactions to become callable in 2021, at prices below their current market values, and the potential earnings upside from realized gains associated with such called securities; (vii) statements relating to our estimate of our available capital (including that we estimate our available capital at March 31, 2021 was approximately $225 million); (viii) statements relating to acquiring residential mortgage loans in the future that we have identified for purchase or plan to purchase, including the amount of such loans that we identified for purchase during the first quarter of 2021 and at March 31, 2021, and expected fallout and the corresponding volume of residential mortgage loans expected to be available for
| Detailed endnotes are included at the end of this Redwood Review. | ||
| THE REDWOOD REVIEW I 1ST QUARTER 2021 | ||
33 | ||
| F O R W A R D - L O O K I N G S T A T E M E N T S | ||
purchase; (ix) statements we make regarding future dividends, including with respect to our regular quarterly dividends in 2021; and (x) statements regarding our expectations and estimates relating to the characterization for income tax purposes of our dividend distributions, our expectations and estimates relating to tax accounting, tax liabilities and tax savings, and GAAP tax provisions, and our estimates of REIT taxable income and TRS taxable income.
Important factors, among others, that may affect our actual results include:
•the impact of the COVID-19 pandemic;
•general economic trends and the performance of the housing, real estate, mortgage finance, and broader financial markets;
•federal and state legislative and regulatory developments and the actions of governmental authorities and entities;
•changing benchmark interest rates, and the Federal Reserve’s actions and statements regarding monetary policy;
•our ability to compete successfully;
•our ability to adapt our business model and strategies to changing circumstances;
•strategic business and capital deployment decisions we make;
•our use of financial leverage;
•our exposure to a breach of our cybersecurity or data security;
•our exposure to credit risk and the timing of credit losses within our portfolio;
•the concentration of the credit risks we are exposed to, including due to the structure of assets we hold, the geographical concentration of real estate underlying assets we own, and our exposure to environmental and climate-related risks;
•the efficacy and expense of our efforts to manage or hedge credit risk, interest rate risk, and other financial and operational risks;
•changes in credit ratings on assets we own and changes in the rating agencies’ credit rating methodologies;
•changes in mortgage prepayment rates;
•changes in interest rates;
•our ability to redeploy our available capital into new investments;
•interest rate volatility, changes in credit spreads, and changes in liquidity in the market for real estate securities and loans;
•our ability to finance the acquisition of real estate-related assets with short-term debt;
•changes in the values of assets we own;
•the ability of counterparties to satisfy their obligations to us;
•our exposure to the discontinuation of LIBOR;
•our exposure to liquidity risk, risks associated with the use of leverage, and market risks;
•changes in the demand from investors for residential and business purpose mortgages and investments, and our ability to distribute residential and business purpose mortgages through our whole-loan distribution channel;
| Detailed endnotes are included at the end of this Redwood Review. | ||
| THE REDWOOD REVIEW I 1ST QUARTER 2021 | ||
34 | ||
| F O R W A R D - L O O K I N G S T A T E M E N T S | ||
•our involvement in securitization transactions, the profitability of those transactions, and the risks we are exposed to in engaging in securitization transactions;
•exposure to claims and litigation, including litigation arising from our involvement in loan origination and securitization transactions;
•whether we have sufficient liquid assets to meet short-term needs;
•our ability to successfully retain or attract key personnel;
•changes in our investment, financing, and hedging strategies and new risks we may be exposed to if we expand our business activities;
•our exposure to a disruption of our technology infrastructure and systems;
•the impact on our reputation that could result from our actions or omissions or from those of others;
•our failure to maintain appropriate internal controls over financial reporting and disclosure controls and procedures;
•the termination of our captive insurance subsidiary’s membership in the Federal Home Loan Bank and the implications for our income generating abilities;
•the impact of changes to U.S. federal income tax laws on the U.S. housing market, mortgage finance markets, and our business;
•our failure to comply with applicable laws and regulation, including our ability to obtain or maintain the governmental licenses;
•our ability to maintain our status as a REIT for tax purposes;
•limitations imposed on our business due to our REIT status and our status as exempt from registration under the Investment Company Act of 1940;
•our common stock may experience price declines, volatility, and poor liquidity, and we may reduce our dividends in a variety of circumstances;
•decisions about raising, managing, and distributing capital;
•our exposure to broad market fluctuations; and
•other factors not presently identified.
| Detailed endnotes are included at the end of this Redwood Review. | ||
| THE REDWOOD REVIEW I 1ST QUARTER 2021 | ||
35 | ||
| E N D N O T E S | ||
Recourse Debt Note
Redwood's recourse debt excludes $7.2 billion and $7.7 billion of consolidated securitization debt (ABS issued and servicer advance financing) and other debt that is non-recourse to Redwood at March 31, 2021 and December 31, 2020, respectively.
Non-GAAP Tangible Book Value Note
Non-GAAP tangible shareholders' equity (or book value) is a measurement of stockholders’ equity excluding the value of acquisition-related intangible assets associated with historical acquisitions. Management believes tangible shareholders’ equity provides useful information to investors and management because it eliminates the impact of these acquisition-related items that may not be reflective of the underlying performance of Redwood’s ongoing operations, and which may not be reflective of their impact over the longer term. At March 31, 2021 and December 31, 2020, tangible stockholders' equity excluded $53 million and $57 million of intangible assets, respectively.
Page 6 (First Quarter Overview)
(1)Economic return on book value is based on the periodic change in GAAP book value per common share plus dividends declared per common share during the period.
(2)Recourse leverage ratio is defined as recourse debt (see Recourse Debt Note above) at Redwood divided by tangible stockholders' equity (see Non-GAAP Tangible Book Value Note above).
Page 9 (Book Value)
(1)"Investment fair value changes in comprehensive income" presented within this table represent market valuation adjustments on our available-for-sale securities recorded through accumulated other comprehensive income on our balance sheet.
Page 10 (Analysis of Operating Results)
(1)"Mortgage banking income" presented in this table represents the sum of net interest income earned on loan inventory, income from mortgage banking activities, and other income within each of our mortgage banking operations.
(2)"Acquisition amortization items" within this table represent purchase-related stock-based consideration amortization expense (a component of General and administrative expenses) and amortization of purchase intangibles (a component of Other expenses), each on a tax-adjusted basis.
(3)Operating return on capital (non-GAAP) presented in this table represents the quotient of annualized After-tax net operating contribution (non-GAAP), divided by Capital utilized during the period. See the Non-GAAP Measurements section of the
Appendix of this Redwood Review for a full description of Operating return on capital (non-GAAP). GAAP Return on capital (calculated by dividing annualized Net contribution by Capital Utilized) for the three months ended March 31, 2021 was 45% for our combined mortgage banking operations, 15% for our business purpose mortgage banking operations, and 64% for our residential mortgage banking operations.
Page 11 (Analysis of Operating Results, Ctd.)
(1)Our gross margin represents mortgage banking income earned in the quarter (net interest income on loan inventory plus mortgage banking activities) divided by loan purchase commitments entered into during the quarter.
Page 12 (Analysis of Operating Results, Ctd.)
(1)Amounts in the "Total" column within this table may not agree to amounts on our consolidated income statement, as certain investments in consolidated legacy Sequoia securitizations are not included in our investment portfolio.
(2)Realized gains and investment fair value changes presented in this table to calculate Adjusted net contribution (non-GAAP), are presented on a tax-adjusted basis.
(3)Adjusted return on capital (non-GAAP) represents the quotient of annualized Adjusted net contribution (non-GAAP), divided by Capital utilized during the period. See the Non-GAAP Measurements section of the Appendix of this Redwood Review for a full description of Adjusted return on capital (non-GAAP). GAAP Return on capital (calculated by dividing annualized Net contribution by Capital Utilized) for the three months ended March 31, 2021 was 29%.
(4)Secured debt includes both recourse debt and certain non-recourse debt (including for bridge loans and resecuritized RPL securities), secured by our investment assets.
(5)Leverage ratio is calculated by dividing Capital invested by Secured debt balances, each as presented within this table.
Page 14 (Technology Updates, Ctd.)
(1)For qualified sellers. Based on industry average of 30 - 45 days to fund loans.
Page 15 (Capital Allocations)
(1)Other assets and liabilities are presented on a net basis within this column.
(2)Non-recourse debt presented within this table excludes ABS issued from whole loan securitizations consolidated on our balance sheet, including Sequoia, CoreVest, Freddie Mac and Servicing Investment securitization entities.
| THE REDWOOD REVIEW I 1ST QUARTER 2021 | ||
36 | ||
| E N D N O T E S | ||
(3)Capital allocated to mortgage banking activities represents the working capital we have allocated to manage our loan inventory at each of our operating businesses. This amount generally includes our net capital in loans held on balance (net of financing), capital to acquire loans in our pipeline, net capital utilized for hedges, and risk capital.
Page 16 (Financing Overview)
(1)Non-marginable debt and marginable debt refers to whether such debt is subject to market value-based margin calls on underlying collateral that is non-delinquent.
(2)Average borrowing cost represents the weighted average contractual cost on non-recourse debt outstanding at March 31, 2021 and does not include deferred issuance costs or debt discounts.
Page 17 (Financing Overview, Ctd.)
(1)Recourse leverage ratio is defined as recourse debt (see Recourse Debt Note above) at Redwood divided by tangible stockholders' equity (see Non-GAAP Tangible Book Value Note above).
(2)Includes $498 million of business purpose bridge loans and $19 million of other related assets.
Page 18 (Credit Overview)
(1)Underlying loan performance information provided in this table is generally reported on a one-month lag. As such, the data reported in this table is from March 2021 reports, which reflect a loan performance date of February 28, 2021.
(2)Sequoia Select and Sequoia Choice securities presented in this table include subordinate securities and do not include interest only or certificated servicing securities.
(3)HPI updated LTV is calculated based on the current loan balance and an updated property value amount that is formulaically adjusted from value at origination based on the FHFA home price index (HPI).
(4)Delinquency percentages at underlying securitizations are calculated using UPB. Aggregate delinquency amounts by security type are weighted using the market value of our investments in each securitization.
(5)"Investment thickness" represents the average size of the subordinate securities we own as investments in securitizations, relative to the average overall size of the securitizations. For example, if our investment thickness (of first-loss securities) with respect to a particular securitization is 14%, we have exposure to the first 14% of credit losses resulting from loans underlying that securitization.
Page 19 (Credit Overview, Ctd.)
(1)Bridge loans as presented in this table, include $626 million of business purpose bridge loans and $19 million of other related assets.
(2)Average current debt service coverage ratio (or DSCR) is the ratio by which net operating income of a property exceeds it fixed debt costs.
(3)Average loan to value (or LTV) (at origination) is calculated based on the original loan amount and the property value at the time the loan was originated.
(4)Includes loans over 90 days delinquent and all loans in foreclosure (regardless of delinquency status).
(5)"Investment thickness" represents the average size of the securities we own as investments in securitizations, relative to the average overall size of the securitizations. For example, if our investment thickness (of first-loss securities) with respect to a particular securitization is 14%, we have exposure to the first 14% of credit losses resulting from loans underlying that securitization.
Page 30 (Dividends and Taxable Income, Ctd.)
(1)Taxable income for 2020 and for the first quarter of 2021 are estimates until we file our tax returns for such years. To the extent we expect to pay tax at the corporate level (generally as a result of activity at our TRS), we are required to record a tax provision for GAAP reporting purposes. Any tax provision (or benefit) is not necessarily the actual amount of tax currently due (or receivable as a refund) as a portion of our provision (or benefit) is deferred in nature. It is our intention to retain any excess inclusion income generated in 2020 or 2021 at our TRS and not pass it through to our shareholders.
(2)In accordance with Internal Revenue Code rules applicable to disaster losses, TRS taxable income for the twelve-month period ended December 31, 2020, was adjusted to recognize $59 million of losses incurred in the first quarter of 2020 into the fourth quarter of 2019.
(3)Taxable income per share is based on the number of shares outstanding at the end of each quarter. The annual taxable income per share is the sum of the quarterly per share estimates.
| THE REDWOOD REVIEW I 1ST QUARTER 2021 | ||
37 | ||