Attached files
| file | filename |
|---|---|
| EX-99.4 - EX-99.4 - Veritex Holdings, Inc. | ex994thrivemortgage.htm |
| EX-99.3 - EX-99.3 - Veritex Holdings, Inc. | a2021-q1xex993xdividendann.htm |
| EX-99.1 - EX-99.1 - Veritex Holdings, Inc. | a2021q1-exhibit991.htm |
| 8-K - 8-K - Veritex Holdings, Inc. | vbtx-20210427.htm |
1st Quarter Earnings Conference Call April 28, 2021 Veritex Holdings, Inc.
2 Safe Harbor Statement Forward-looking statements This presentation contains certain “forward-looking statements” within the meaning of the Private Securities Litigation Reform Act of 1995. Forward-looking statements are based on various facts and derived utilizing assumptions, current expectations, estimates and projections and are subject to known and unknown risks, uncertainties and other factors that may cause actual results, performance or achievements to be materially different from any future results, performance or achievements expressed or implied by such forward-looking statements. Forward- looking statements include, without limitation, statements relating to Veritex Holdings, Inc. (“Veritex”) investment in Thrive Mortgage, the expected payment date of Veritex’s quarterly cash dividend, impact of certain changes in Veritex’s accounting policies, standards and interpretations, the effects of the COVID-19 pandemic and actions taken in response thereto, Veritex’s future financial performance, business and growth strategy, projected plans and objectives, as well as other projections based on macroeconomic and industry trends, which are inherently unreliable due to the multiple factors that impact broader economic and industry trends, and any such variations may be material. Statements preceded by, followed by or that otherwise include the words “believes,” “expects,” “anticipates,” “intends,” “projects,” “estimates,” “plans” and similar expressions or future or conditional verbs such as “will,” “should,” “would,” “may” and “could” are generally forward-looking in nature and not historical facts, although not all forward-looking statements include the foregoing words. We refer you to the “Risk Factors” and “Management’s Discussion and Analysis of Financial Condition and Results of Operations” sections of Veritex’s Annual Report on Form 10-K for the year ended December 31, 2020 and any updates to those risk factors set forth in Veritex’s Quarterly Reports on Form 10-Q, Current Reports on Form 8-K and other filings with the Securities and Exchange Commission (“SEC”), which are available on the SEC’s website at www.sec.gov. If one or more events related to these or other risks or uncertainties materialize, or if Veritex’s underlying assumptions prove to be incorrect, actual results may differ materially from what Veritex anticipates. Accordingly, you should not place undue reliance on any such forward-looking statements. Any forward-looking statement speaks only as of the date on which it is made. Veritex does not undertake any obligation, and specifically declines any obligation, to update or revise any forward-looking statements, whether as a result of new information, future developments or otherwise, except as required by law. All forward-looking statements, expressed or implied, included in this presentation are expressly qualified in their entirety by this cautionary statement. This cautionary statement should also be considered in connection with any subsequent written or oral forward-looking statements that Veritex or persons acting on Veritex’s behalf may issue. This presentation also includes industry and trade association data, forecasts and information that Veritex has prepared based, in part, upon data, forecasts and information obtained from independent trade associations, industry publications and surveys, government agencies and other information publicly available to Veritex, which information may be specific to particular markets or geographic locations. Some data is also based on Veritex's good faith estimates, which are derived from management's knowledge of the industry and independent sources. Industry publications, surveys and forecasts generally state that the information contained therein has been obtained from sources believed to be reliable. Although Veritex believes these sources are reliable, Veritex has not independently verified the information contained therein. While Veritex is not aware of any misstatements regarding the industry data presented in this presentation, Veritex's estimates involve risks and uncertainties and are subject to change based on various factors. Similarly, Veritex believes that its internal research is reliable, even though such research has not been verified by independent sources.
3 Non-GAAP Financial Measures Veritex reports its results in accordance with United States generally accepted accounting principles (“GAAP”). However, management believes that certain supplemental non-GAAP financial measures used in managing its business provide meaningful information to investors about underlying trends in its business. Management uses these non-GAAP measures to assess the Company’s operating performance and believes that these non-GAAP measures provide information that is important to investors and that is useful in understanding Veritex’s results of operations. However, non-GAAP financial measures are supplemental and should be viewed in addition to, and not as an alternative for, Veritex’s reported results prepared in accordance with GAAP. The following are the non-GAAP measures used in this presentation: • Tangible book value per common share; • Tangible common equity to tangible assets; • Return on average tangible common equity (“ROTCE”); • Operating net income; • Pre-tax, pre-provision (“PTPP”) operating earnings; • Diluted operating earnings per share (“EPS”); • Operating return on average assets (“ROAA”); • PTPP operating ROAA; • Operating ROTCE; • Operating efficiency ratio; • Operating noninterest income; • Operating noninterest expense; and • Adjusted net interest margin (“NIM”). Please see “Reconciliation of Non-GAAP Financial Measures” at the end of this presentation for reconciliations of non-GAAP measures to the most directly comparable financial measures calculated in accordance with GAAP.
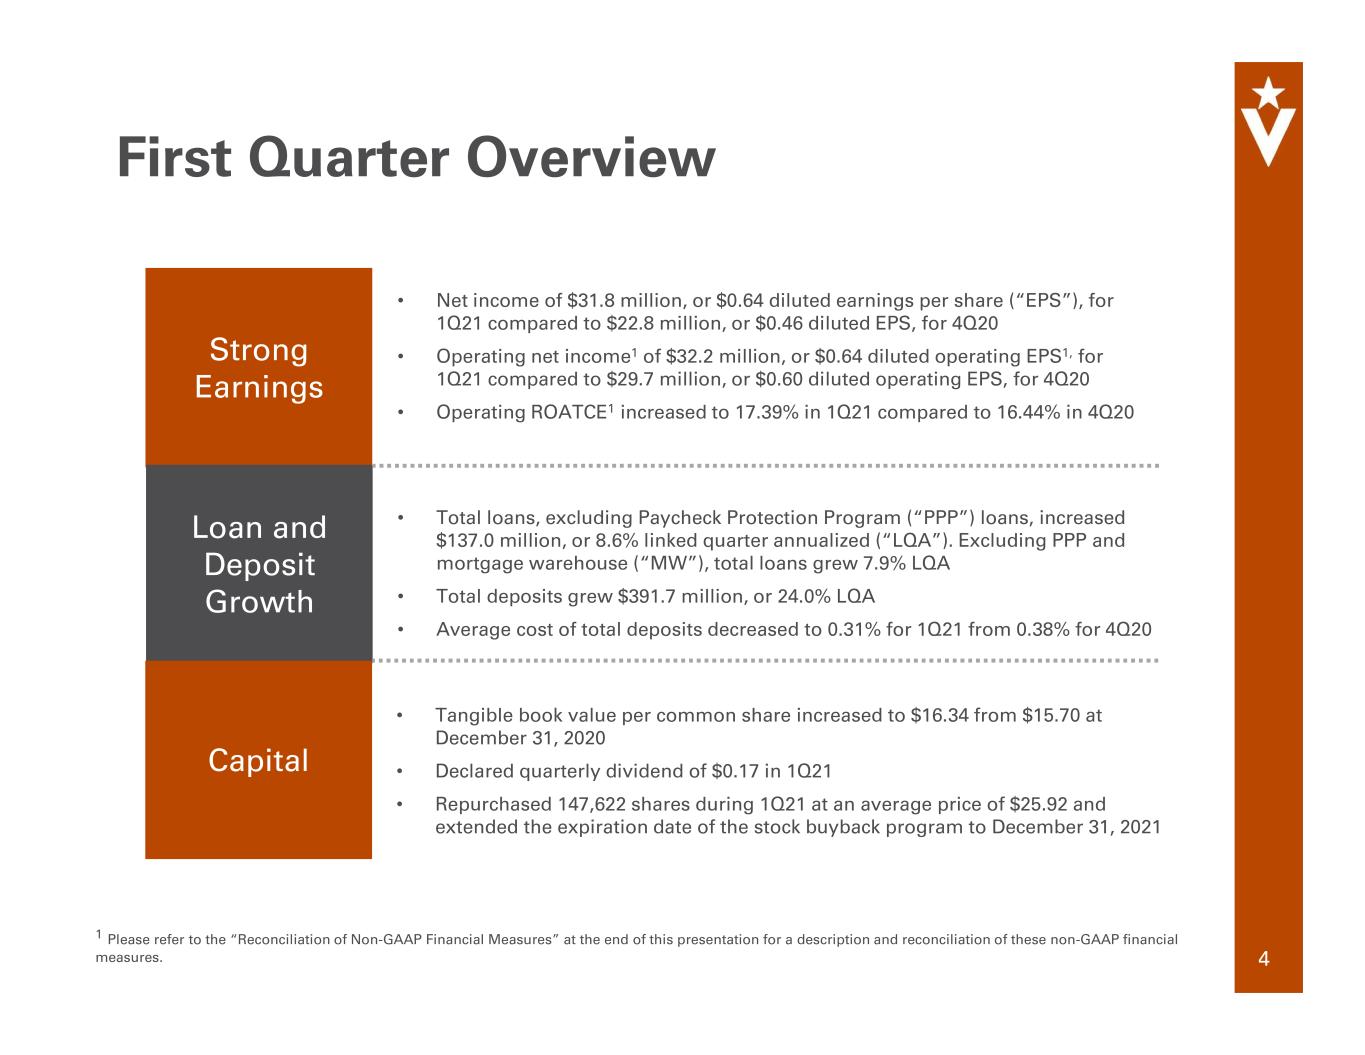
Strong Earnings Loan and Deposit Growth Capital • Net income of $31.8 million, or $0.64 diluted earnings per share (“EPS”), for 1Q21 compared to $22.8 million, or $0.46 diluted EPS, for 4Q20 • Operating net income1 of $32.2 million, or $0.64 diluted operating EPS1, for 1Q21 compared to $29.7 million, or $0.60 diluted operating EPS, for 4Q20 • Operating ROATCE1 increased to 17.39% in 1Q21 compared to 16.44% in 4Q20 • Total loans, excluding Paycheck Protection Program (“PPP”) loans, increased $137.0 million, or 8.6% linked quarter annualized (“LQA”). Excluding PPP and mortgage warehouse (“MW”), total loans grew 7.9% LQA • Total deposits grew $391.7 million, or 24.0% LQA • Average cost of total deposits decreased to 0.31% for 1Q21 from 0.38% for 4Q20 • Tangible book value per common share increased to $16.34 from $15.70 at December 31, 2020 • Declared quarterly dividend of $0.17 in 1Q21 • Repurchased 147,622 shares during 1Q21 at an average price of $25.92 and extended the expiration date of the stock buyback program to December 31, 2021 1 Please refer to the “Reconciliation of Non-GAAP Financial Measures” at the end of this presentation for a description and reconciliation of these non-GAAP financial measures. 4 First Quarter Overview
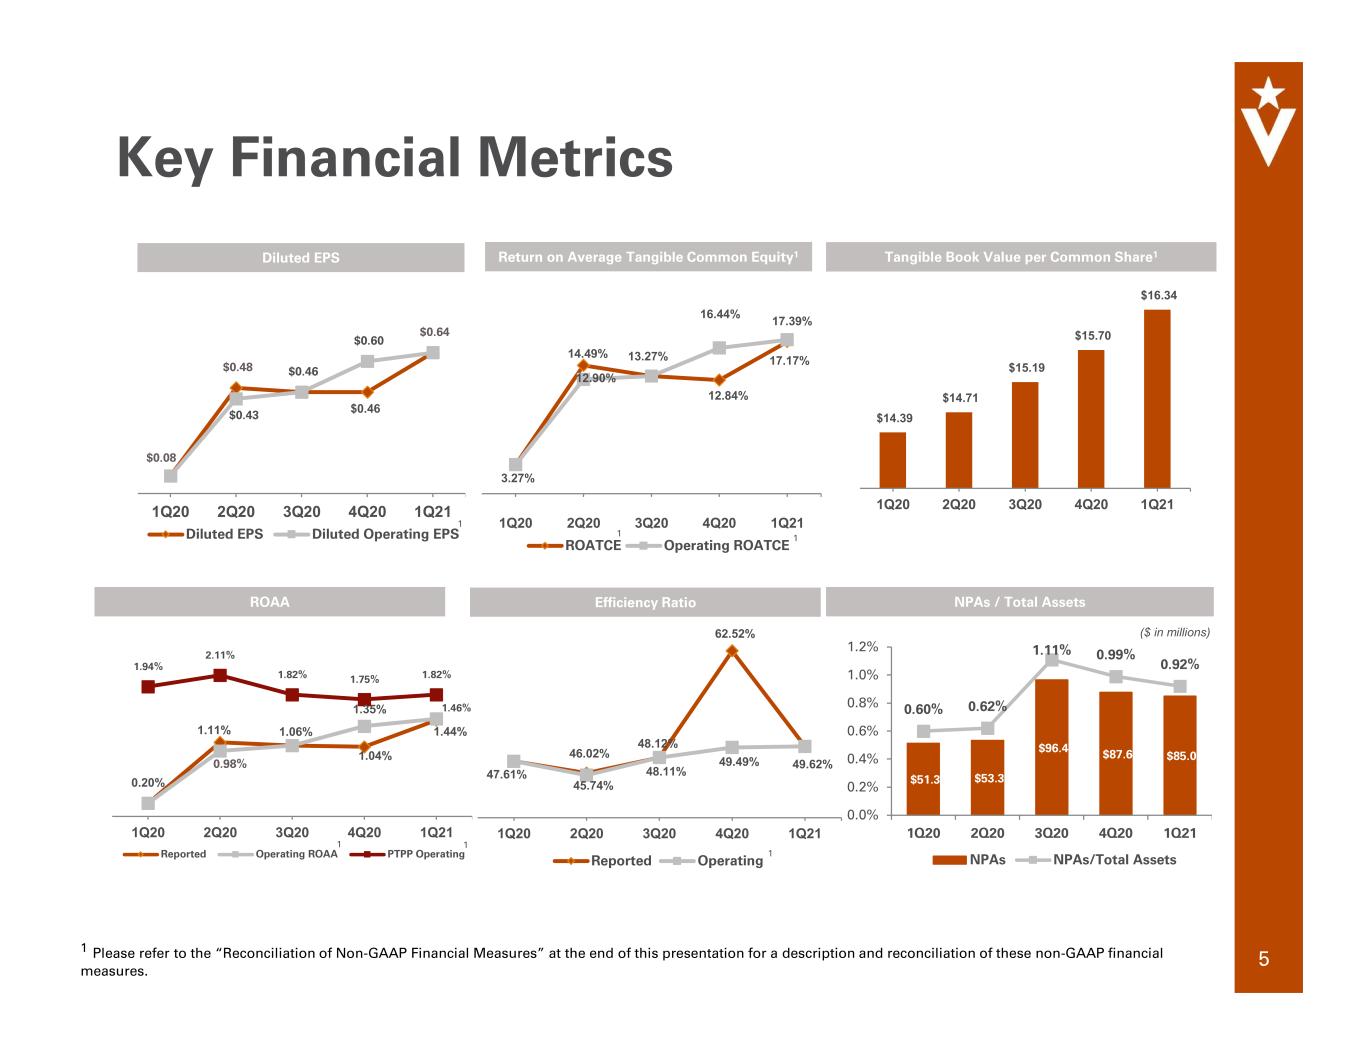
Key Financial Metrics 46.02% 48.12% 62.52% 47.61% 45.74% 48.11% 49.49% 49.62% 1Q20 2Q20 3Q20 4Q20 1Q21 Reported Operating Efficiency Ratio 1.11% 1.06% 1.04% 1.44% 0.20% 1.35% 1.94% 2.11% 1.82% 1.75% 1.82% 1Q20 2Q20 3Q20 4Q20 1Q21 Reported Operating ROAA PTPP Operating 0.98% $14.39 $14.71 $15.19 $15.70 $16.34 1Q20 2Q20 3Q20 4Q20 1Q21 NPAs / Total Assets Return on Average Tangible Common Equity1 $0.08 $0.48 $0.64 $0.43 $0.46 $0.60 1Q20 2Q20 3Q20 4Q20 1Q21 Diluted EPS Diluted Operating EPS $0.46 3.27% 14.49% 13.27% 12.84% 17.17% 1Q20 2Q20 3Q20 4Q20 1Q21 ROATCE Operating ROATCE Diluted EPS Tangible Book Value per Common Share1 5 16.44% ($ in millions) $51.3 $53.3 $96.4 $87.6 $85.0 0.60% 0.62% 1.11% 0.99% 0.92% 0.0% 0.2% 0.4% 0.6% 0.8% 1.0% 1.2% 1Q20 2Q20 3Q20 4Q20 1Q21 NPAs NPAs/Total Assets 1 Please refer to the “Reconciliation of Non-GAAP Financial Measures” at the end of this presentation for a description and reconciliation of these non-GAAP financial measures. 1 11 1 1 12.90% 17.39% 1.46% ROAA 1
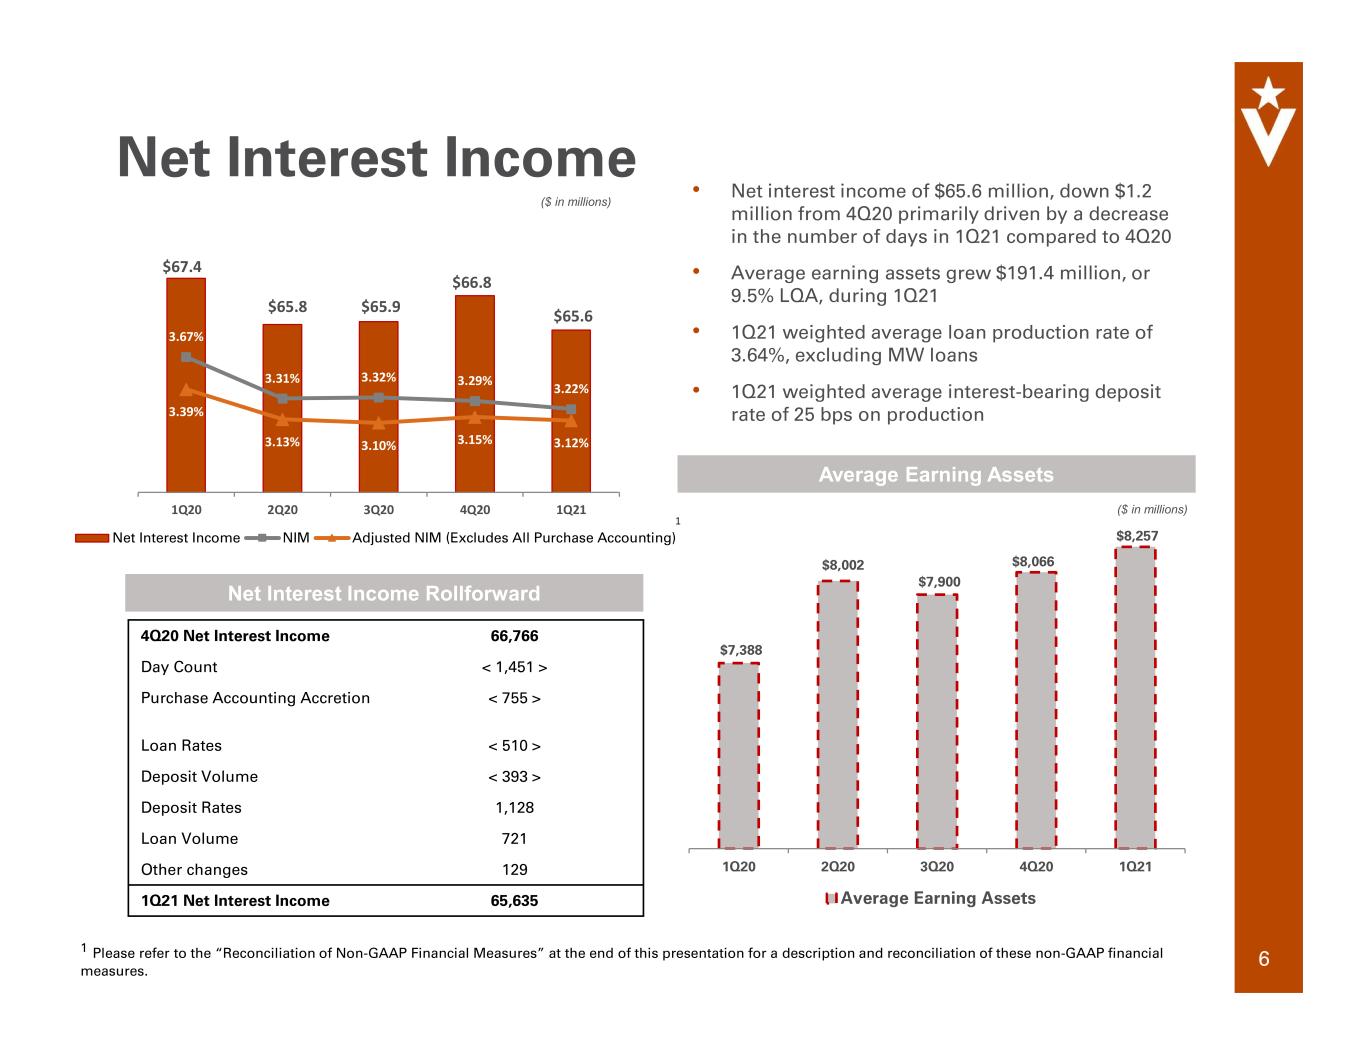
• Net interest income of $65.6 million, down $1.2 million from 4Q20 primarily driven by a decrease in the number of days in 1Q21 compared to 4Q20 • Average earning assets grew $191.4 million, or 9.5% LQA, during 1Q21 • 1Q21 weighted average loan production rate of 3.64%, excluding MW loans • 1Q21 weighted average interest-bearing deposit rate of 25 bps on production Net Interest Income 6 $65.8 $65.9 $66.8 $65.6 3.67% 3.31% 3.32% 3.29% 3.22% 3.39% 3.13% 3.10% 3.15% 3.12% 1Q20 2Q20 3Q20 4Q20 1Q21 Net Interest Income NIM Adjusted NIM (Excludes All Purchase Accounting) 1 $67.4 $8,002 $7,900 $8,066 $8,257 1Q20 2Q20 3Q20 4Q20 1Q21 Average Earning Assets $7,388 Average Earning Assets Net Interest Income Rollforward ($ in millions) ($ in millions) 1 1 Please refer to the “Reconciliation of Non-GAAP Financial Measures” at the end of this presentation for a description and reconciliation of these non-GAAP financial measures. 4Q20 Net Interest Income 66,766 Day Count < 1,451 > Purchase Accounting Accretion < 755 > Loan Rates < 510 > Deposit Volume < 393 > Deposit Rates 1,128 Loan Volume 721 Other changes 129 1Q21 Net Interest Income 65,635
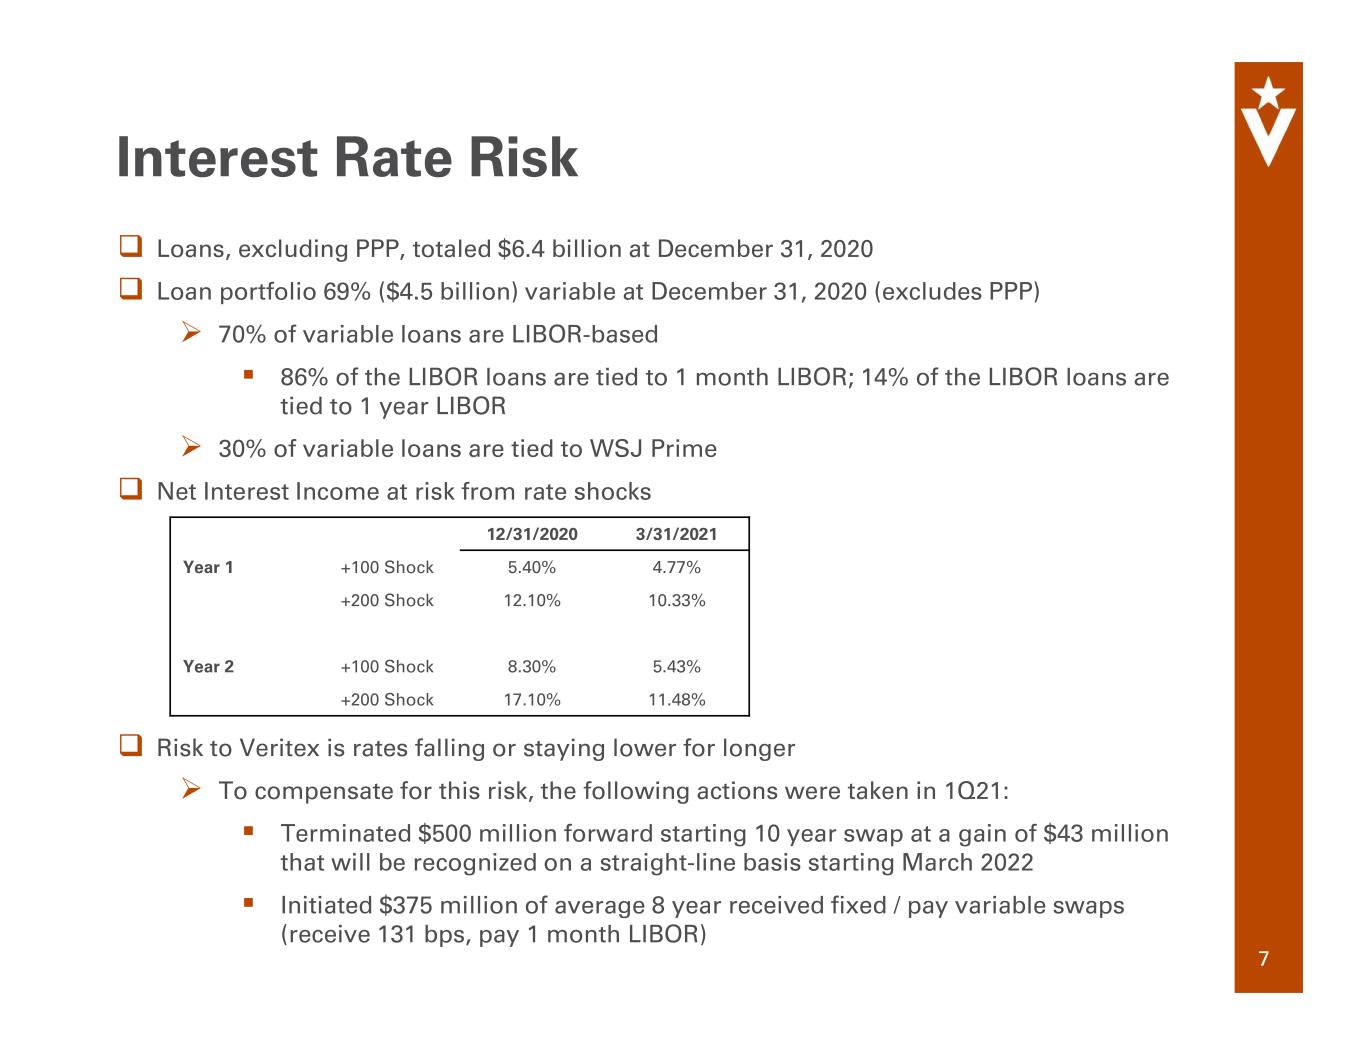
Loans, excluding PPP, totaled $6.4 billion at December 31, 2020 Loan portfolio 69% ($4.5 billion) variable at December 31, 2020 (excludes PPP) 70% of variable loans are LIBOR-based 86% of the LIBOR loans are tied to 1 month LIBOR; 14% of the LIBOR loans are tied to 1 year LIBOR 30% of variable loans are tied to WSJ Prime Net Interest Income at risk from rate shocks Risk to Veritex is rates falling or staying lower for longer To compensate for this risk, the following actions were taken in 1Q21: Terminated $500 million forward starting 10 year swap at a gain of $43 million that will be recognized on a straight-line basis starting March 2022 Initiated $375 million of average 8 year received fixed / pay variable swaps (receive 131 bps, pay 1 month LIBOR) Interest Rate Risk 7 12/31/2020 3/31/2021 Year 1 +100 Shock 5.40% 4.77% +200 Shock 12.10% 10.33% Year 2 +100 Shock 8.30% 5.43% +200 Shock 17.10% 11.48%
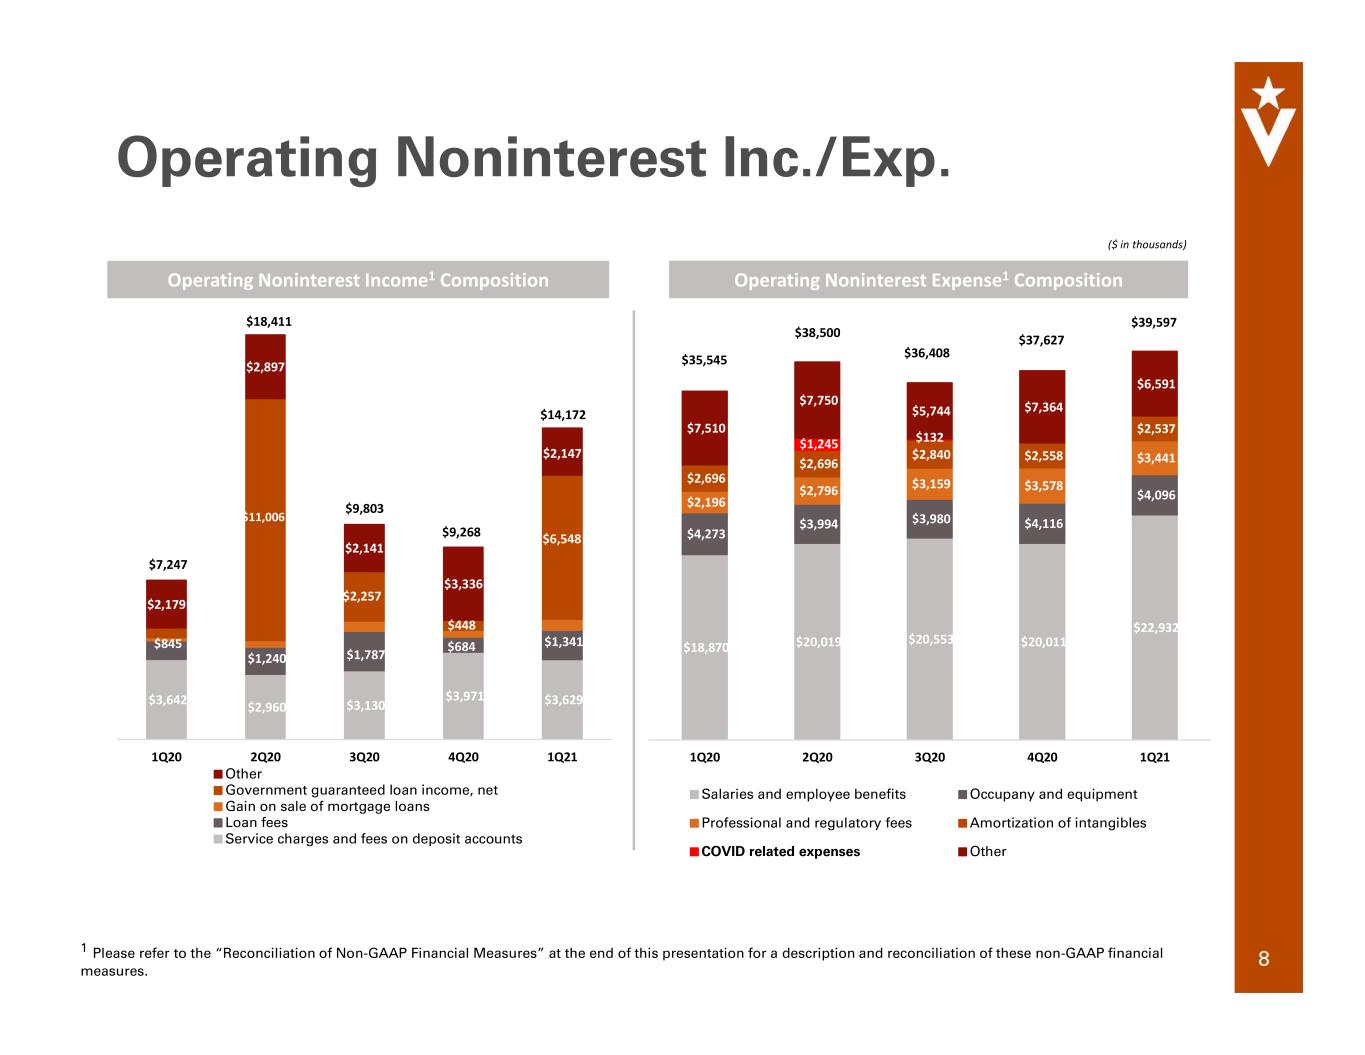
Operating Noninterest Inc./Exp. 8 Operating Noninterest Income1 Composition $3,642 $2,960 $3,130 $3,971 $3,629 $845 $1,240 $1,787 $684 $1,341 $2,179 $2,897 $2,141 $3,336 $2,147 1Q20 2Q20 3Q20 4Q20 1Q21 Other Government guaranteed loan income, net Gain on sale of mortgage loans Loan fees Service charges and fees on deposit accounts 1 Please refer to the “Reconciliation of Non-GAAP Financial Measures” at the end of this presentation for a description and reconciliation of these non-GAAP financial measures. Operating Noninterest Expense1 Composition $18,870 $20,019 $20,553 $20,011 $22,932 $4,273 $3,994 $3,980 $4,116 $4,096 $2,196 $2,796 $3,159 $3,578 $3,441 $2,696 $2,696 $2,840 $2,558 $2,537 $7,510 $7,750 $5,744 $7,364 $6,591 1Q20 2Q20 3Q20 4Q20 1Q21 Salaries and employee benefits Occupany and equipment Professional and regulatory fees Amortization of intangibles COVID related expenses Other ($ in thousands) $7,247 $35,545 $18,411 $11,006 $38,500 $9,803 $36,408 $2,257 $9,268 $448 $37,627 $14,172 $39,597 $6,548 $1,245 $132
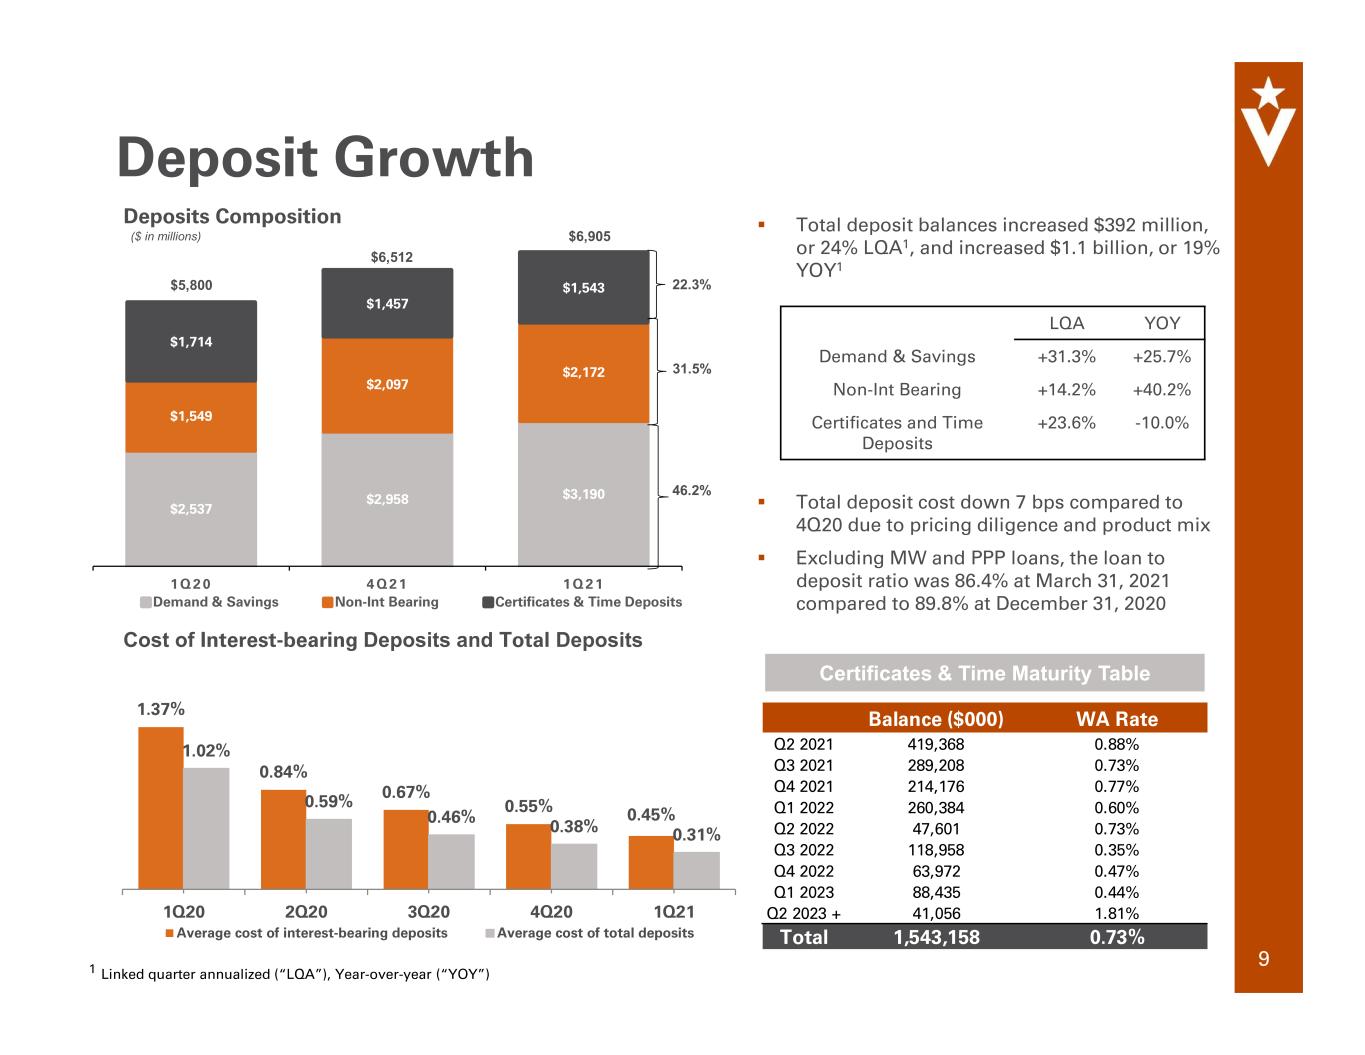
1.37% 0.84% 0.67% 0.55% 0.45% 1.02% 0.59% 0.46% 0.38% 0.31% 1Q20 2Q20 3Q20 4Q20 1Q21 Average cost of interest-bearing deposits Average cost of total deposits Cost of Interest-bearing Deposits and Total Deposits Total deposit balances increased $392 million, or 24% LQA1, and increased $1.1 billion, or 19% YOY1 Total deposit cost down 7 bps compared to 4Q20 due to pricing diligence and product mix Excluding MW and PPP loans, the loan to deposit ratio was 86.4% at March 31, 2021 compared to 89.8% at December 31, 2020 Certificates & Time Maturity Table $2,537 $2,958 $3,190 $1,549 $2,097 $2,172 $1,714 $1,457 $1,543 1 Q 2 0 4 Q 2 1 1 Q 2 1 Demand & Savings Non-Int Bearing Certificates & Time Deposits Deposits Composition 46.2% 31.5% 22.3%$5,800 $6,512 $6,905 Deposit Growth LQA YOY Demand & Savings +31.3% +25.7% Non-Int Bearing +14.2% +40.2% Certificates and Time Deposits +23.6% -10.0% 1 Linked quarter annualized (“LQA”), Year-over-year (“YOY”) 9 ($ in millions) Balance ($000) WA Rate Q2 2021 419,368 0.88% Q3 2021 289,208 0.73% Q4 2021 214,176 0.77% Q1 2022 260,384 0.60% Q2 2022 47,601 0.73% Q3 2022 118,958 0.35% Q4 2022 63,972 0.47% Q1 2023 88,435 0.44% Q2 2023 + 41,056 1.81% Total 1,543,158 0.73%
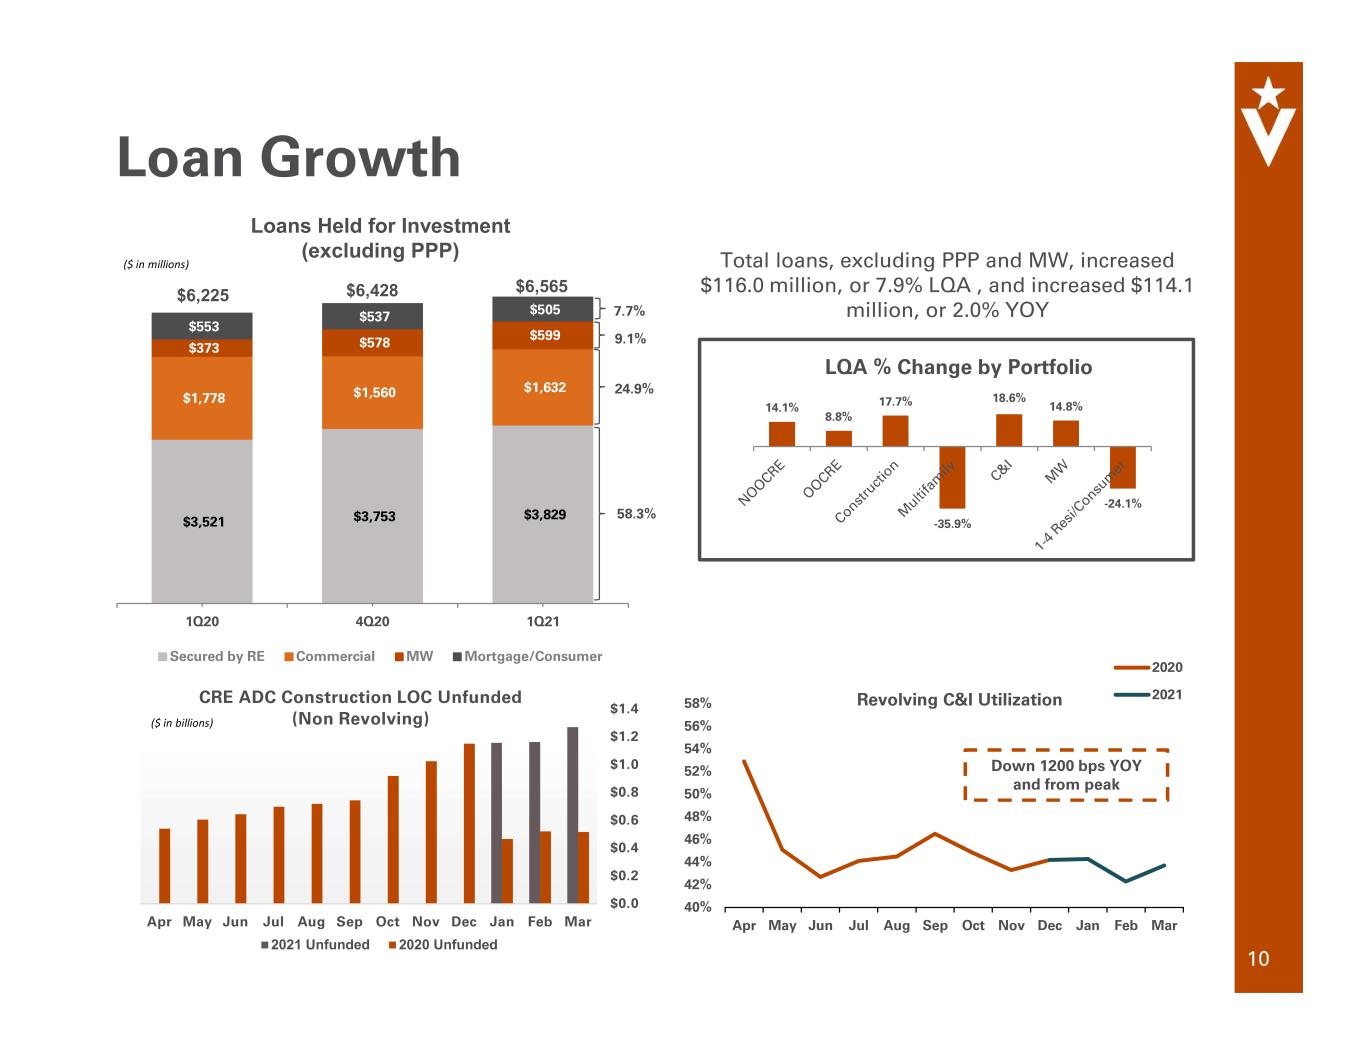
Total loans, excluding PPP and MW, increased $116.0 million, or 7.9% LQA , and increased $114.1 million, or 2.0% YOY Loan Growth 10 $1.2 Billion ($ in millions) $3,521 $3,753 $3,829 $1,778 $1,560 $1,632 $373 $578 $599 $553 $537 $505 1Q20 4Q20 1Q21 Secured by RE Commercial MW Mortgage/Consumer Loans Held for Investment (excluding PPP) $6,225 $6,428 $6,565 9.1% 24.9% 58.3% 14.1% 8.8% 17.7% -35.9% 18.6% 14.8% -24.1% LQA % Change by Portfolio 7.7% $0.0 $0.2 $0.4 $0.6 $0.8 $1.0 $1.2 $1.4 Apr May Jun Jul Aug Sep Oct Nov Dec Jan Feb Mar CRE ADC Construction LOC Unfunded (Non Revolving) 2021 Unfunded 2020 Unfunded ($ in billions) 40% 42% 44% 46% 48% 50% 52% 54% 56% 58% Apr May Jun Jul Aug Sep Oct Nov Dec Jan Feb Mar Revolving C&I Utilization 2020 2021 Down 1200 bps YOY and from peak
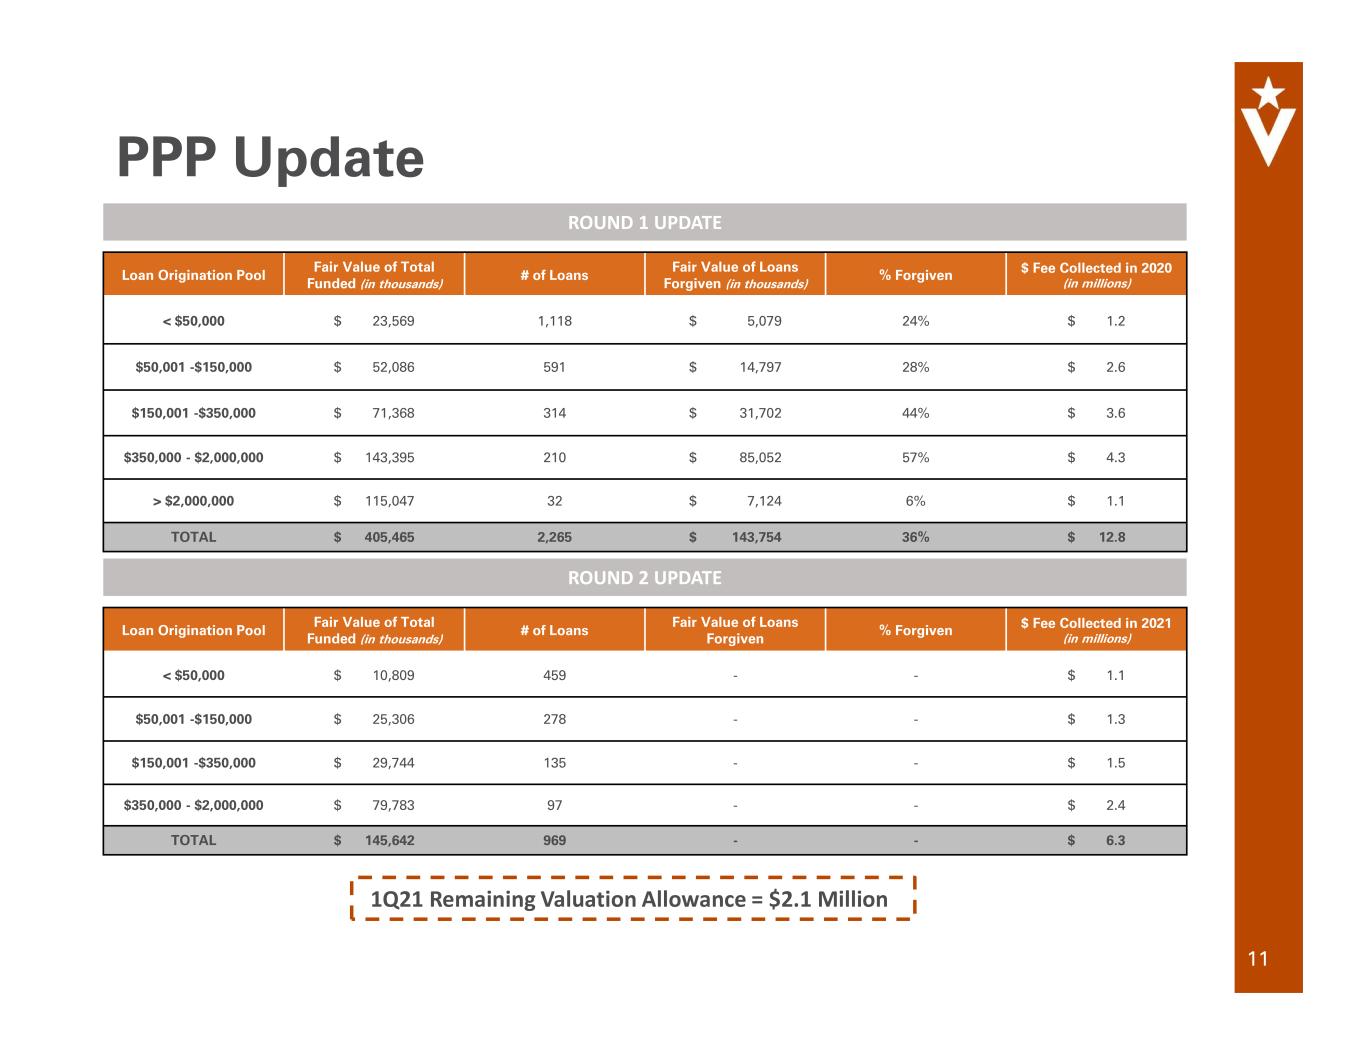
PPP Update 11 Loan Origination Pool Fair Value of Total Funded (in thousands) # of Loans Fair Value of Loans Forgiven (in thousands) % Forgiven $ Fee Collected in 2020 (in millions) < $50,000 $ 23,569 1,118 $ 5,079 24% $ 1.2 $50,001 -$150,000 $ 52,086 591 $ 14,797 28% $ 2.6 $150,001 -$350,000 $ 71,368 314 $ 31,702 44% $ 3.6 $350,000 - $2,000,000 $ 143,395 210 $ 85,052 57% $ 4.3 > $2,000,000 $ 115,047 32 $ 7,124 6% $ 1.1 TOTAL $ 405,465 2,265 $ 143,754 36% $ 12.8 ROUND 1 UPDATE ROUND 2 UPDATE Loan Origination Pool Fair Value of Total Funded (in thousands) # of Loans Fair Value of Loans Forgiven % Forgiven $ Fee Collected in 2021 (in millions) < $50,000 $ 10,809 459 - - $ 1.1 $50,001 -$150,000 $ 25,306 278 - - $ 1.3 $150,001 -$350,000 $ 29,744 135 - - $ 1.5 $350,000 - $2,000,000 $ 79,783 97 - - $ 2.4 TOTAL $ 145,642 969 - - $ 6.3 1Q21 Remaining Valuation Allowance = $2.1 Million
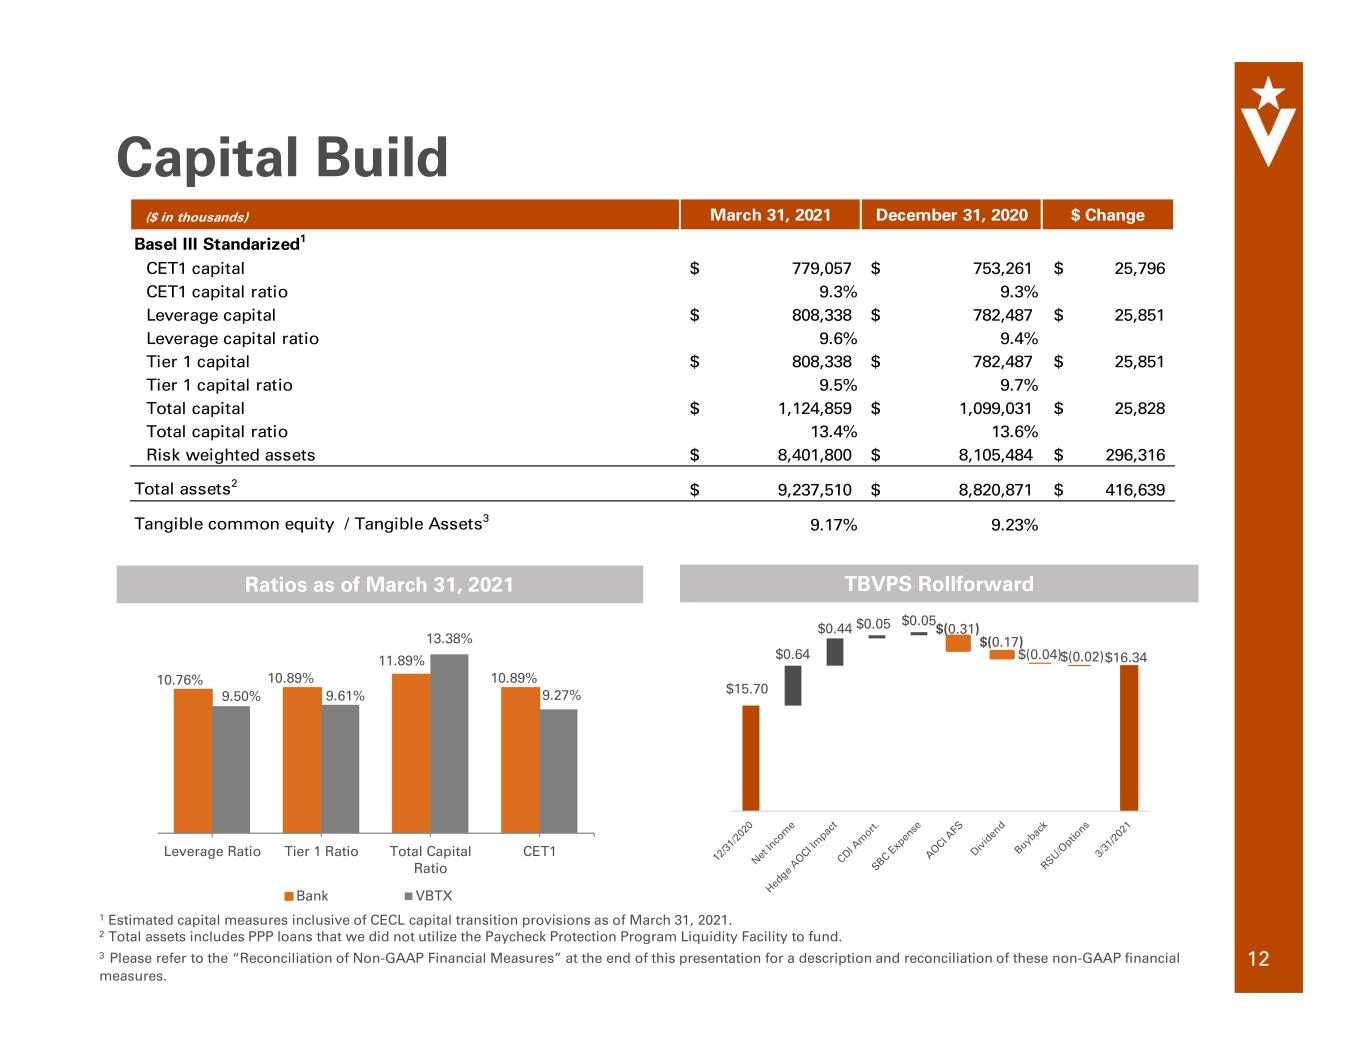
Capital Build 12 10.76% 10.89% 11.89% 10.89% 9.50% 9.61% 13.38% 9.27% Leverage Ratio Tier 1 Ratio Total Capital Ratio CET1 Bank VBTX 1 Estimated capital measures inclusive of CECL capital transition provisions as of March 31, 2021. 2 Total assets includes PPP loans that we did not utilize the Paycheck Protection Program Liquidity Facility to fund. 3 Please refer to the “Reconciliation of Non-GAAP Financial Measures” at the end of this presentation for a description and reconciliation of these non-GAAP financial measures. Ratios as of March 31, 2021 $0.64 $0.44 $0.05 $0.05 $15.70 $16.34 $(0.17) $(0.04)$(0.02) TBVPS Rollforward ($ in thousands) March 31, 2021 December 31, 2020 $ Change Basel III Standarized1 CET1 capital 779,057$ 753,261$ 25,796$ CET1 capital ratio 9.3% 9.3% Leverage capital 808,338$ 782,487$ 25,851$ Leverage capital ratio 9.6% 9.4% Tier 1 capital 808,338$ 782,487$ 25,851$ Tier 1 capital ratio 9.5% 9.7% Total capital 1,124,859$ 1,099,031$ 25,828$ Total capital ratio 13.4% 13.6% Risk weighted assets 8,401,800$ 8,105,484$ 296,316$ Total assets2 9,237,510$ 8,820,871$ 416,639$ Tangible common equity / Tangible Assets3 9.17% 9.23% $(0.31)
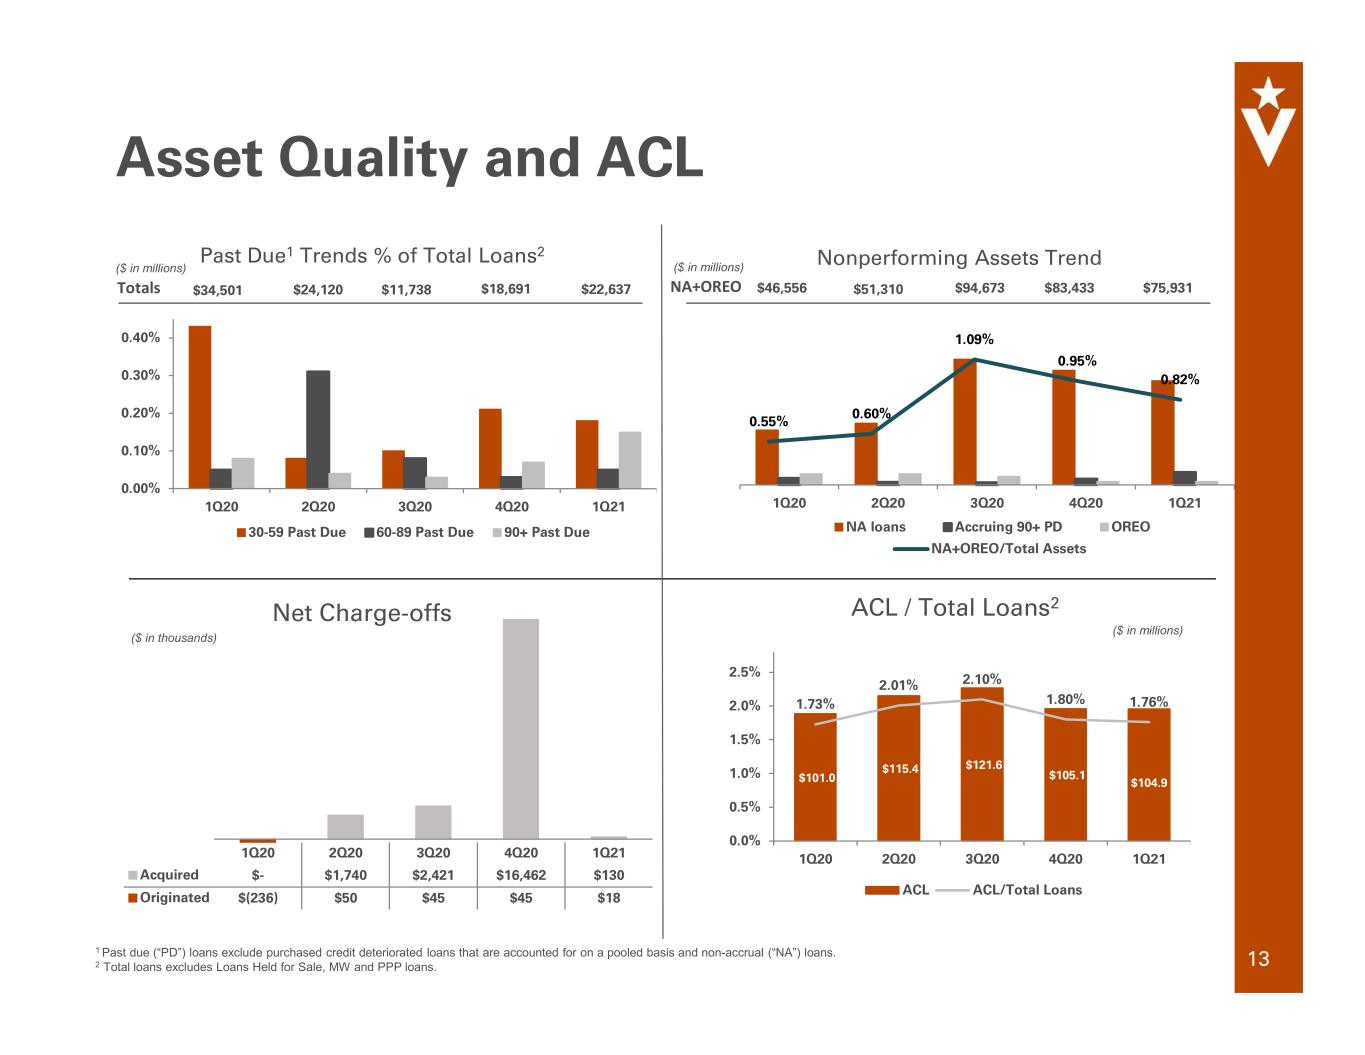
1 Past due (“PD”) loans exclude purchased credit deteriorated loans that are accounted for on a pooled basis and non-accrual (“NA”) loans. 2 Total loans excludes Loans Held for Sale, MW and PPP loans. 1Q20 2Q20 3Q20 4Q20 1Q21 0.00% 0.10% 0.20% 0.30% 0.40% 30-59 Past Due 60-89 Past Due 90+ Past Due Past Due1 Trends % of Total Loans2 Asset Quality and ACL 13 ($ in millions) 1Q20 2Q20 3Q20 4Q20 1Q21 Acquired $- $1,740 $2,421 $16,462 $130 Originated $(236) $50 $45 $45 $18 Net Charge-offs ($ in thousands) Totals $34,501 $24,120 $11,738 $18,691 $101.0 $115.4 $121.6 $105.1 $104.9 1.73% 2.01% 2.10% 1.80% 1.76% 0.0% 0.5% 1.0% 1.5% 2.0% 2.5% 1Q20 2Q20 3Q20 4Q20 1Q21 ACL ACL/Total Loans ACL / Total Loans2 ($ in millions) 1Q20 2Q20 3Q20 4Q20 1Q21 NA loans Accruing 90+ PD OREO Nonperforming Assets Trend $46,556 ($ in millions) NA+OREO $51,310 $94,673 $83,433 $75,931 0.55% 0.60% 1.09% 0.95% 0.82% NA+OREO/Total Assets $22,637
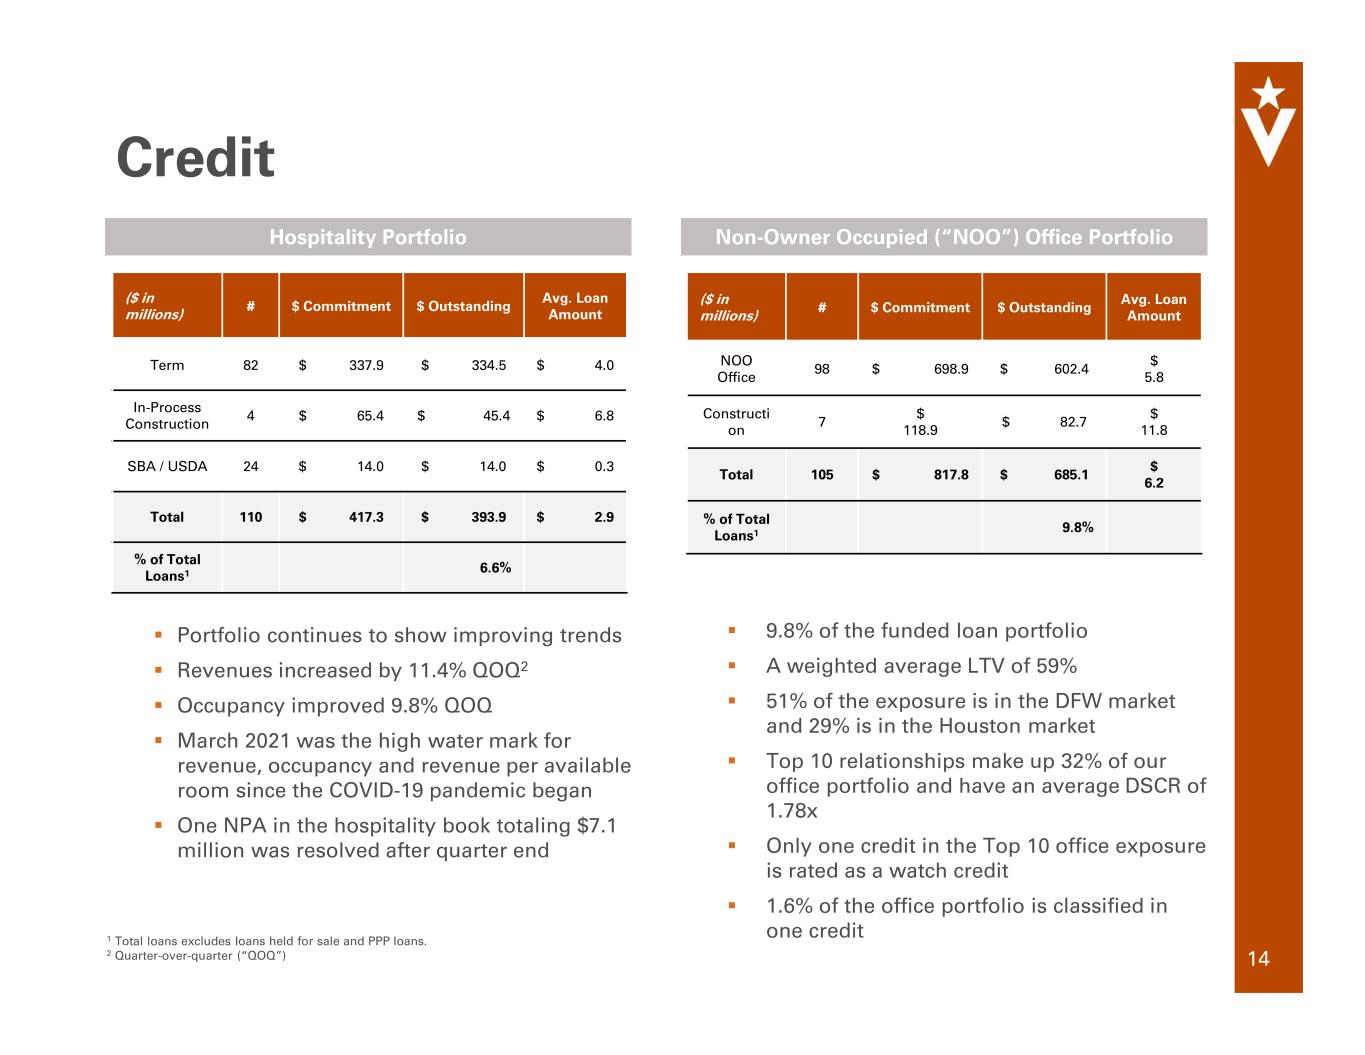
Credit 14 Portfolio continues to show improving trends Revenues increased by 11.4% QOQ2 Occupancy improved 9.8% QOQ March 2021 was the high water mark for revenue, occupancy and revenue per available room since the COVID-19 pandemic began One NPA in the hospitality book totaling $7.1 million was resolved after quarter end Hospitality Portfolio Non-Owner Occupied (“NOO”) Office Portfolio ($ in millions) # $ Commitment $ Outstanding Avg. Loan Amount Term 82 $ 337.9 $ 334.5 $ 4.0 In-Process Construction 4 $ 65.4 $ 45.4 $ 6.8 SBA / USDA 24 $ 14.0 $ 14.0 $ 0.3 Total 110 $ 417.3 $ 393.9 $ 2.9 % of Total Loans1 6.6% ($ in millions) # $ Commitment $ Outstanding Avg. Loan Amount NOO Office 98 $ 698.9 $ 602.4 $ 5.8 Constructi on 7 $ 118.9 $ 82.7 $ 11.8 Total 105 $ 817.8 $ 685.1 $ 6.2 % of Total Loans1 9.8% 9.8% of the funded loan portfolio A weighted average LTV of 59% 51% of the exposure is in the DFW market and 29% is in the Houston market Top 10 relationships make up 32% of our office portfolio and have an average DSCR of 1.78x Only one credit in the Top 10 office exposure is rated as a watch credit 1.6% of the office portfolio is classified in one credit1 Total loans excludes loans held for sale and PPP loans. 2 Quarter-over-quarter (“QOQ”)
Thrive Mortgage Investment
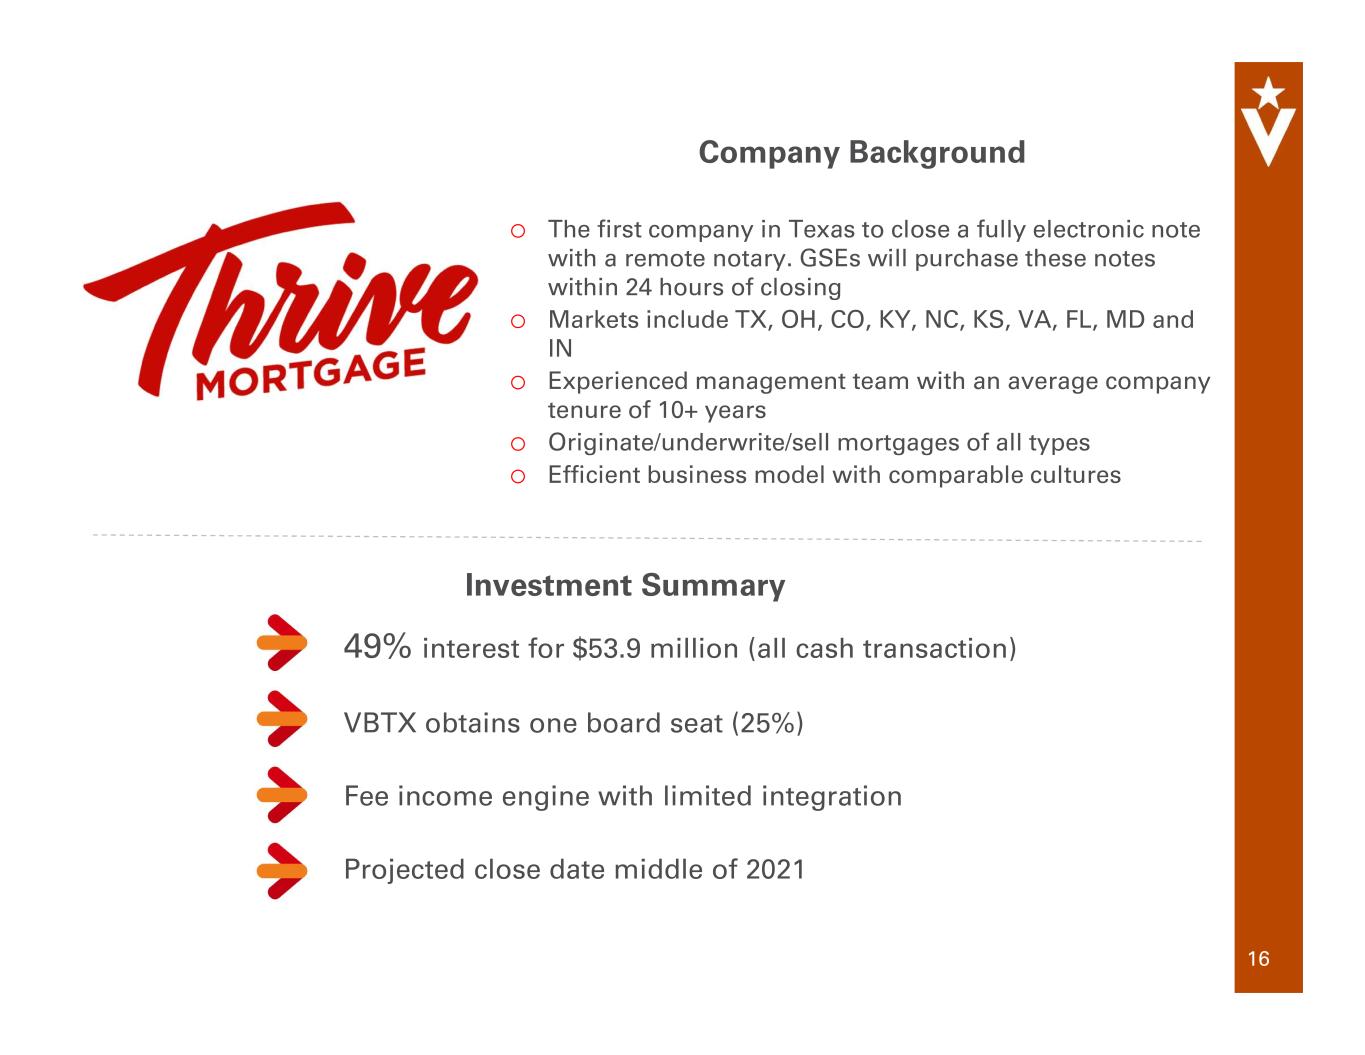
16 Company Background o The first company in Texas to close a fully electronic note with a remote notary. GSEs will purchase these notes within 24 hours of closing o Markets include TX, OH, CO, KY, NC, KS, VA, FL, MD and IN o Experienced management team with an average company tenure of 10+ years o Originate/underwrite/sell mortgages of all types o Efficient business model with comparable cultures Investment Summary 49% interest for $53.9 million (all cash transaction) VBTX obtains one board seat (25%) Fee income engine with limited integration Projected close date middle of 2021
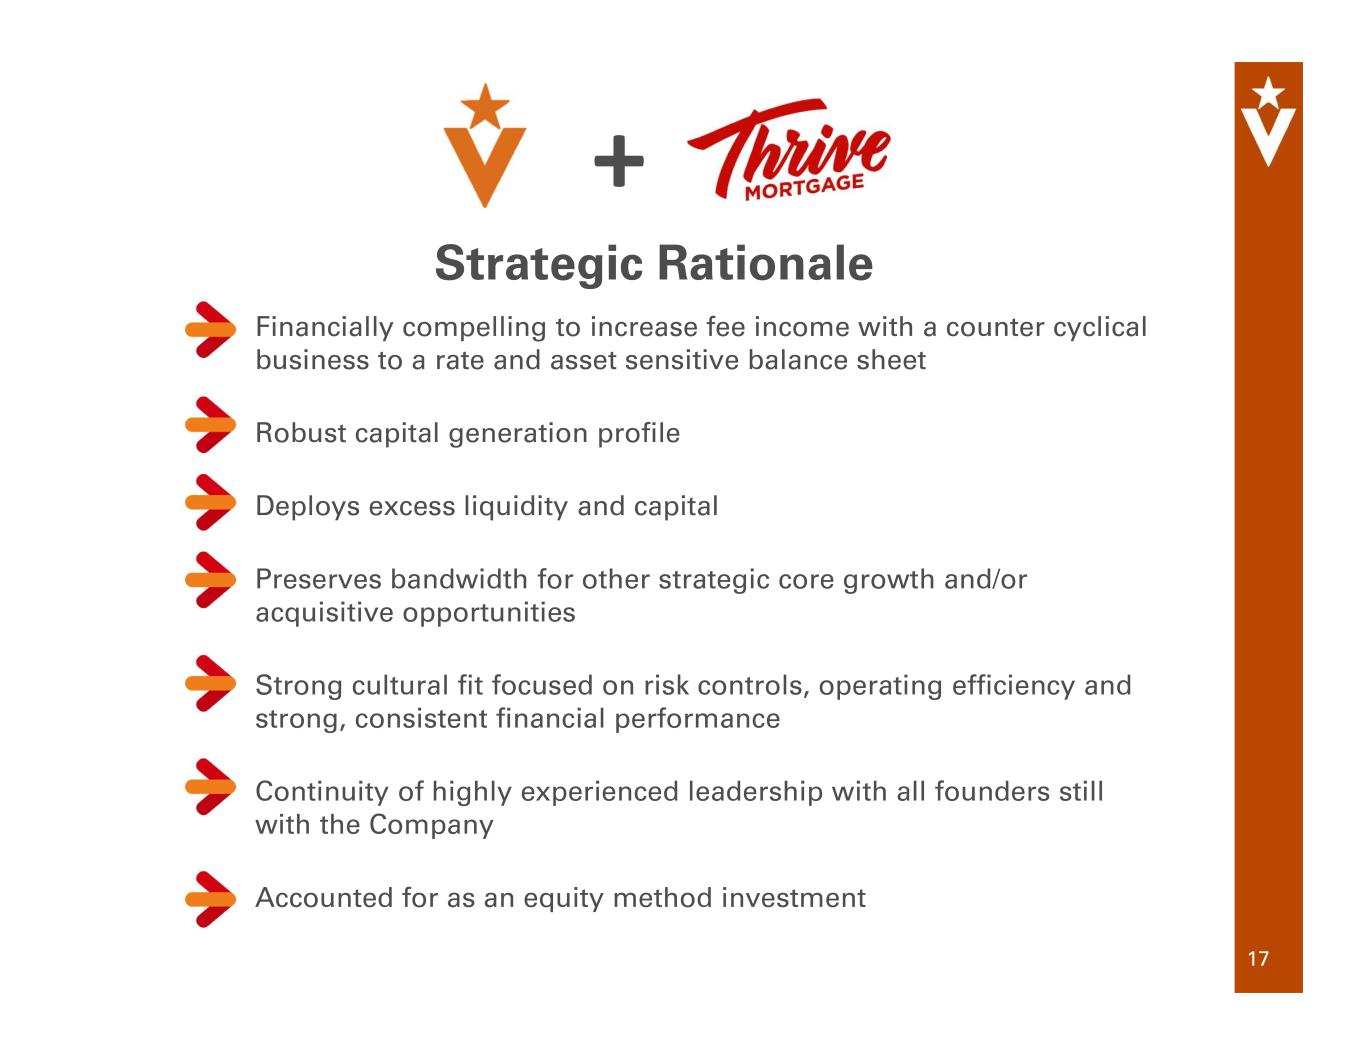
17 Strategic Rationale + Financially compelling to increase fee income with a counter cyclical business to a rate and asset sensitive balance sheet Robust capital generation profile Deploys excess liquidity and capital Preserves bandwidth for other strategic core growth and/or acquisitive opportunities Strong cultural fit focused on risk controls, operating efficiency and strong, consistent financial performance Continuity of highly experienced leadership with all founders still with the Company Accounted for as an equity method investment
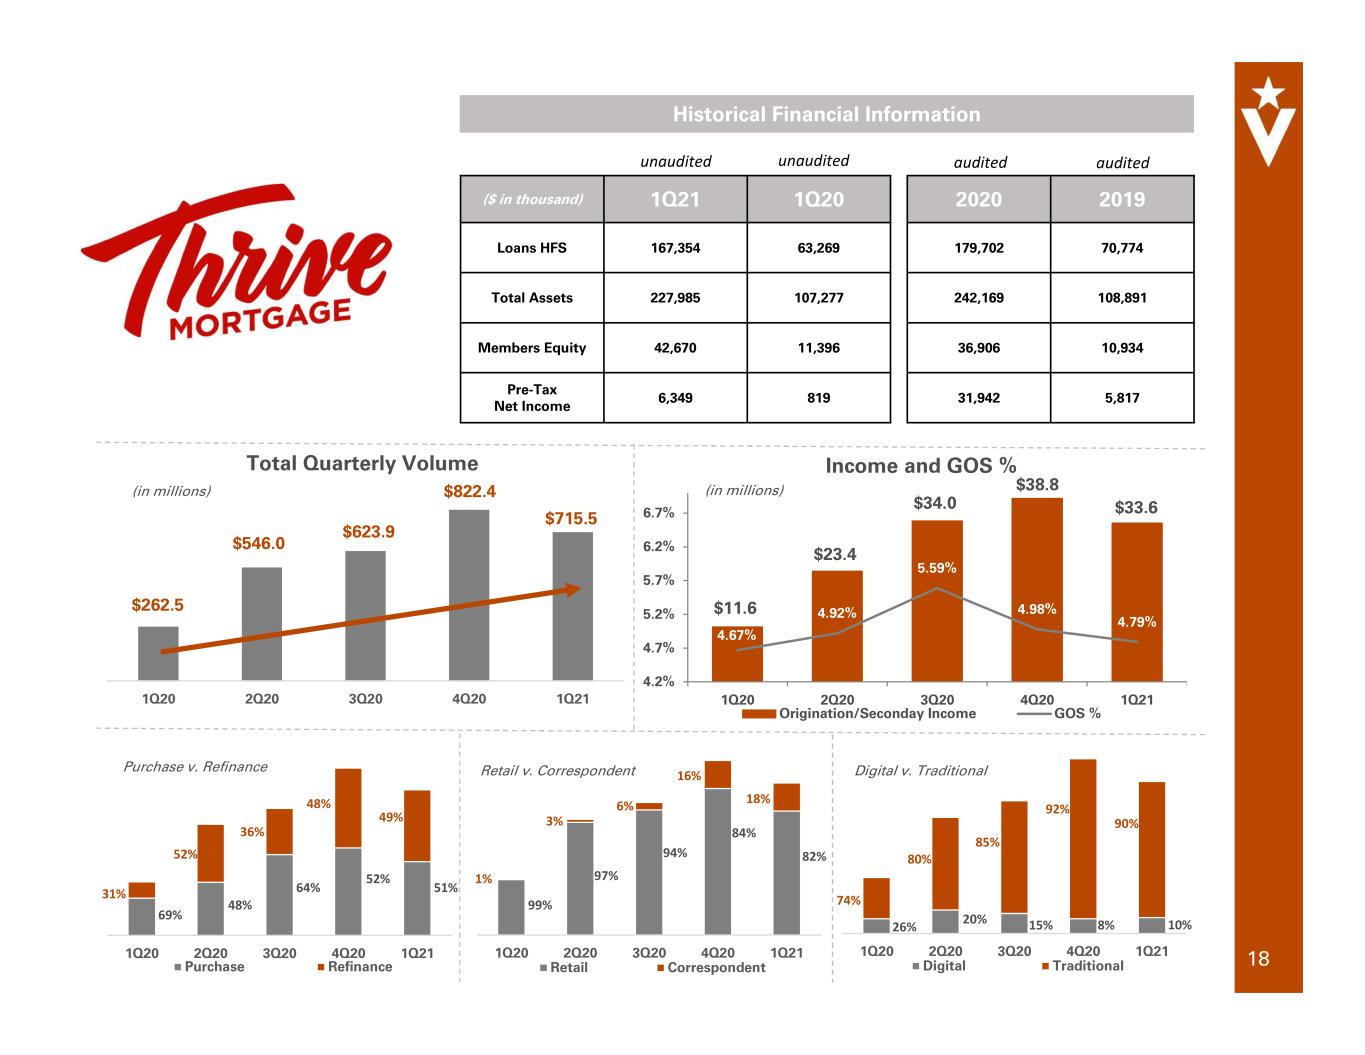
18 Historical Financial Information ($ in thousand) 1Q21 1Q20 Loans HFS 167,354 63,269 Total Assets 227,985 107,277 Members Equity 42,670 11,396 Pre-Tax Net Income 6,349 819 audited 1Q20 2Q20 3Q20 4Q20 1Q21 Purchase Refinance audited 2020 2019 179,702 70,774 242,169 108,891 36,906 10,934 31,942 5,817 unaudited unaudited 1Q20 2Q20 3Q20 4Q20 1Q21 Retail Correspondent 1Q20 2Q20 3Q20 4Q20 1Q21 Digital Traditional 69% 31% 52% 36% 48% 49% 51%64% 48% 52% 1% 3% 6% 16% 18% 74% 80% 85% 92% 90% 99% 97% 94% 84% 82% 26% 20% 15% 8% 10% 1Q20 2Q20 3Q20 4Q20 1Q21 $262.5 $546.0 $623.9 $822.4 $715.5 Total Quarterly Volume (in millions) Purchase v. Refinance Retail v. Correspondent Digital v. Traditional 4.67% 4.92% 5.59% 4.98% 4.79% 4.2% 4.7% 5.2% 5.7% 6.2% 6.7% 1Q20 2Q20 3Q20 4Q20 1Q21 Origination/Seconday Income GOS % Income and GOS % $11.6 $38.8 $34.0 $33.6 $23.4 (in millions)
Veritex Holdings, Inc. Supplemental Information
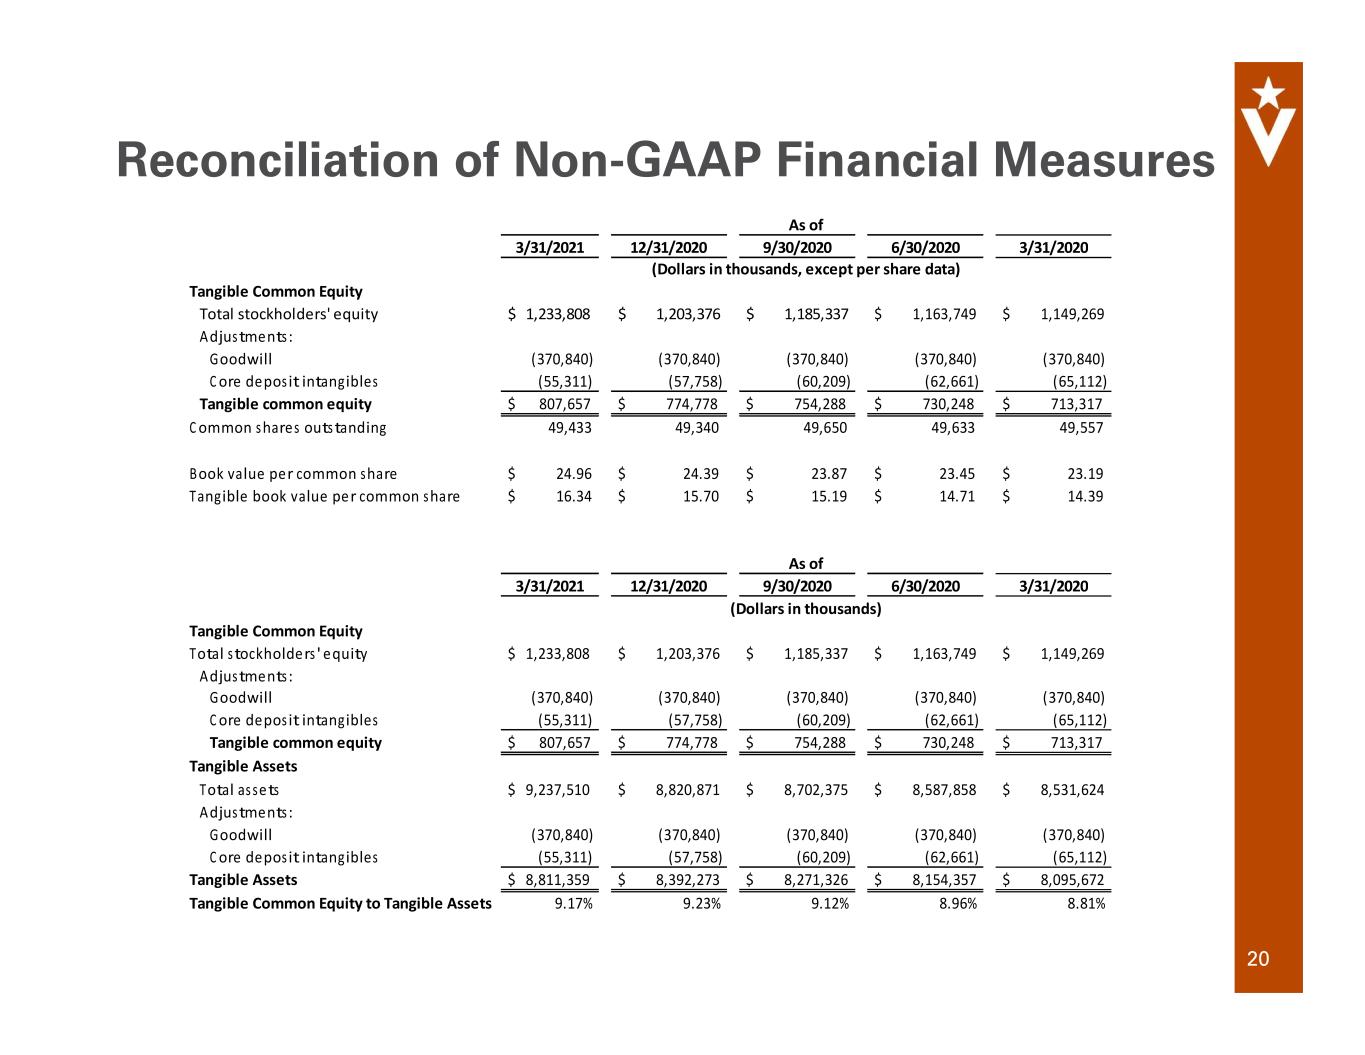
20 Reconciliation of Non-GAAP Financial Measures 3/31/2021 12/31/2020 9/30/2020 6/30/2020 3/31/2020 Tangible Common Equity Total stockholders' equity $ 1,233,808 $ 1,203,376 $ 1,185,337 $ 1,163,749 $ 1,149,269 Adjustments: Goodwill (370,840) (370,840) (370,840) (370,840) (370,840) Core deposit intangibles (55,311) (57,758) (60,209) (62,661) (65,112) Tangible common equity $ 807,657 $ 774,778 $ 754,288 $ 730,248 $ 713,317 Common shares outstanding 49,433 49,340 49,650 49,633 49,557 Book value per common share $ 24.96 $ 24.39 $ 23.87 $ 23.45 $ 23.19 Tangible book value per common share $ 16.34 $ 15.70 $ 15.19 $ 14.71 $ 14.39 3/31/2021 12/31/2020 9/30/2020 6/30/2020 3/31/2020 Tangible Common Equity Total stockholders' equity $ 1,233,808 $ 1,203,376 $ 1,185,337 $ 1,163,749 $ 1,149,269 Adjustments: Goodwill (370,840) (370,840) (370,840) (370,840) (370,840) Core deposit intangibles (55,311) (57,758) (60,209) (62,661) (65,112) Tangible common equity $ 807,657 $ 774,778 $ 754,288 $ 730,248 $ 713,317 Tangible Assets Total assets $ 9,237,510 $ 8,820,871 $ 8,702,375 $ 8,587,858 $ 8,531,624 Adjustments: Goodwill (370,840) (370,840) (370,840) (370,840) (370,840) Core deposit intangibles (55,311) (57,758) (60,209) (62,661) (65,112) Tangible Assets $ 8,811,359 $ 8,392,273 $ 8,271,326 $ 8,154,357 $ 8,095,672 Tangible Common Equity to Tangible Assets 9.17% 9.23% 9.12% 8.96% 8.81% As of (Dollars in thousands, except per share data) (Dollars in thousands) As of
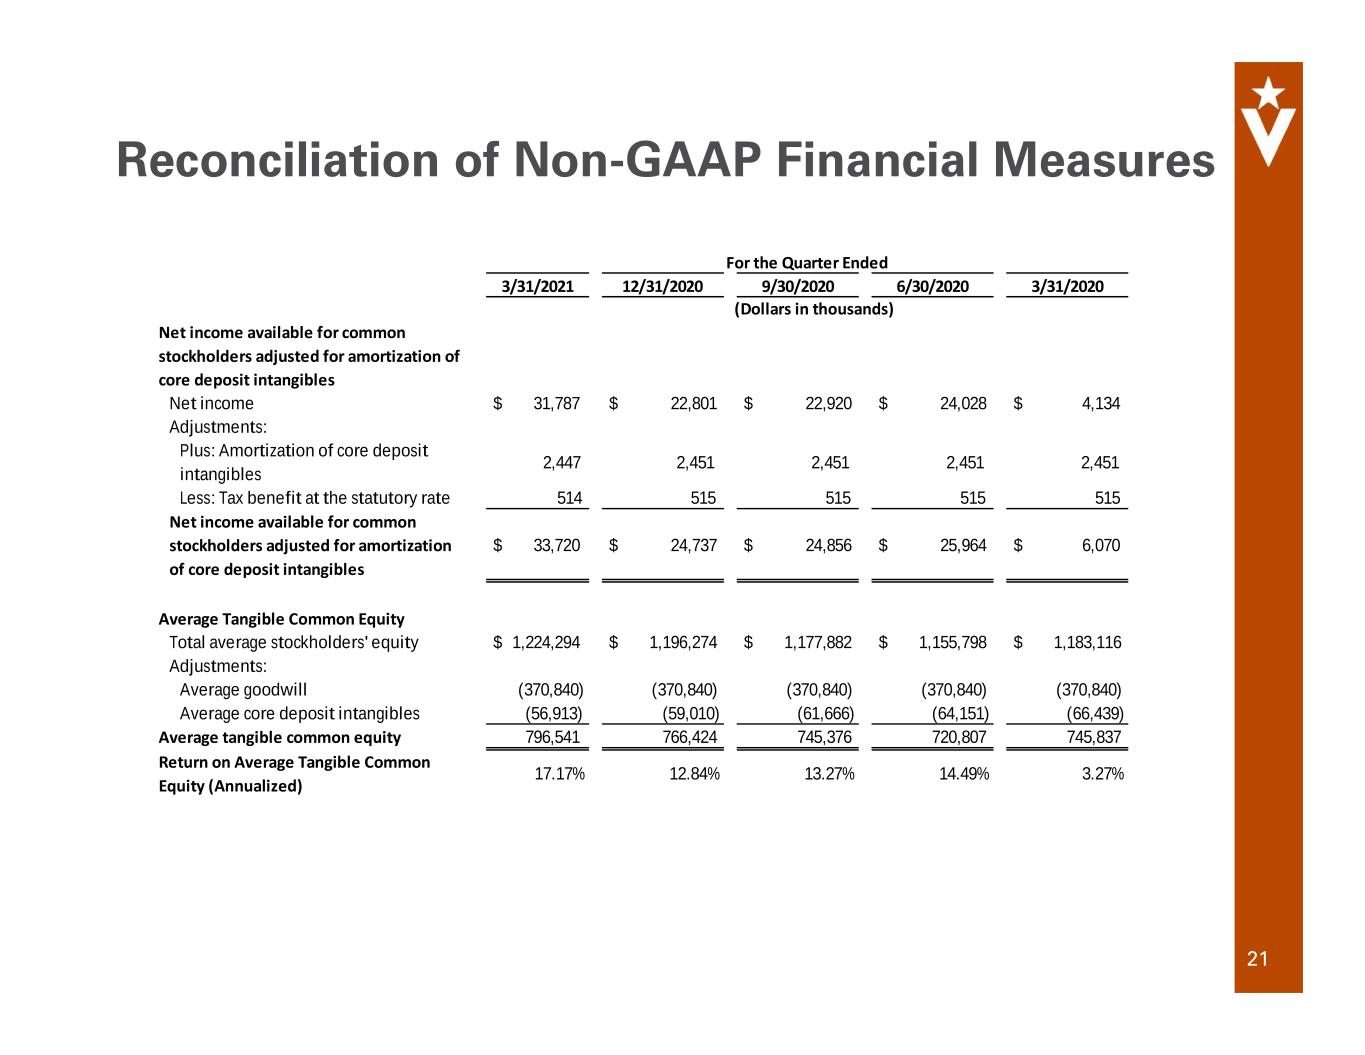
21 Reconciliation of Non-GAAP Financial Measures 3/31/2021 12/31/2020 9/30/2020 6/30/2020 3/31/2020 Net income available for common stockholders adjusted for amortization of core deposit intangibles Net income $ 31,787 $ 22,801 $ 22,920 $ 24,028 $ 4,134 Adjustments: Plus: Amortization of core deposit intangibles 2,447 2,451 2,451 2,451 2,451 Less: Tax benefit at the statutory rate 514 515 515 515 515 Net income available for common stockholders adjusted for amortization of core deposit intangibles $ 33,720 $ 24,737 $ 24,856 $ 25,964 $ 6,070 Average Tangible Common Equity Total average stockholders' equity $ 1,224,294 $ 1,196,274 $ 1,177,882 $ 1,155,798 $ 1,183,116 Adjustments: Average goodwill (370,840) (370,840) (370,840) (370,840) (370,840) Average core deposit intangibles (56,913) (59,010) (61,666) (64,151) (66,439) Average tangible common equity 796,541 766,424 745,376 720,807 745,837 Return on Average Tangible Common Equity (Annualized) 17.17% 12.84% 13.27% 14.49% 3.27% For the Quarter Ended (Dollars in thousands)
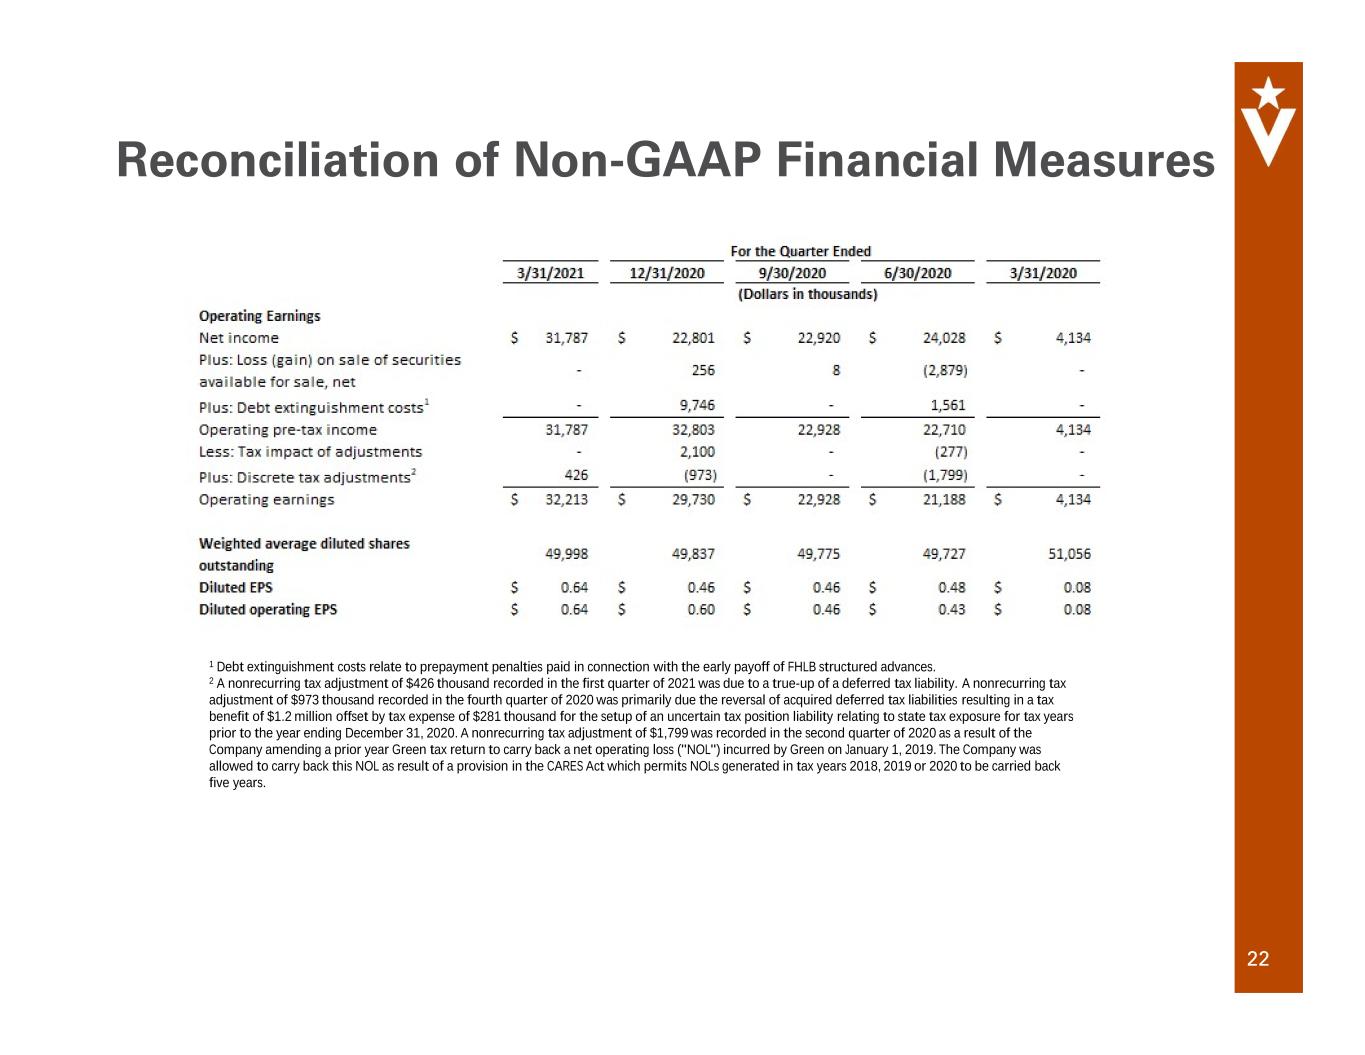
22 Reconciliation of Non-GAAP Financial Measures 1 Debt extinguishment costs relate to prepayment penalties paid in connection with the early payoff of FHLB structured advances. 2 A nonrecurring tax adjustment of $426 thousand recorded in the first quarter of 2021 was due to a true-up of a deferred tax liability. A nonrecurring tax adjustment of $973 thousand recorded in the fourth quarter of 2020 was primarily due the reversal of acquired deferred tax liabilities resulting in a tax benefit of $1.2 million offset by tax expense of $281 thousand for the setup of an uncertain tax position liability relating to state tax exposure for tax years prior to the year ending December 31, 2020. A nonrecurring tax adjustment of $1,799 was recorded in the second quarter of 2020 as a result of the Company amending a prior year Green tax return to carry back a net operating loss ("NOL") incurred by Green on January 1, 2019. The Company was allowed to carry back this NOL as result of a provision in the CARES Act which permits NOLs generated in tax years 2018, 2019 or 2020 to be carried back five years.
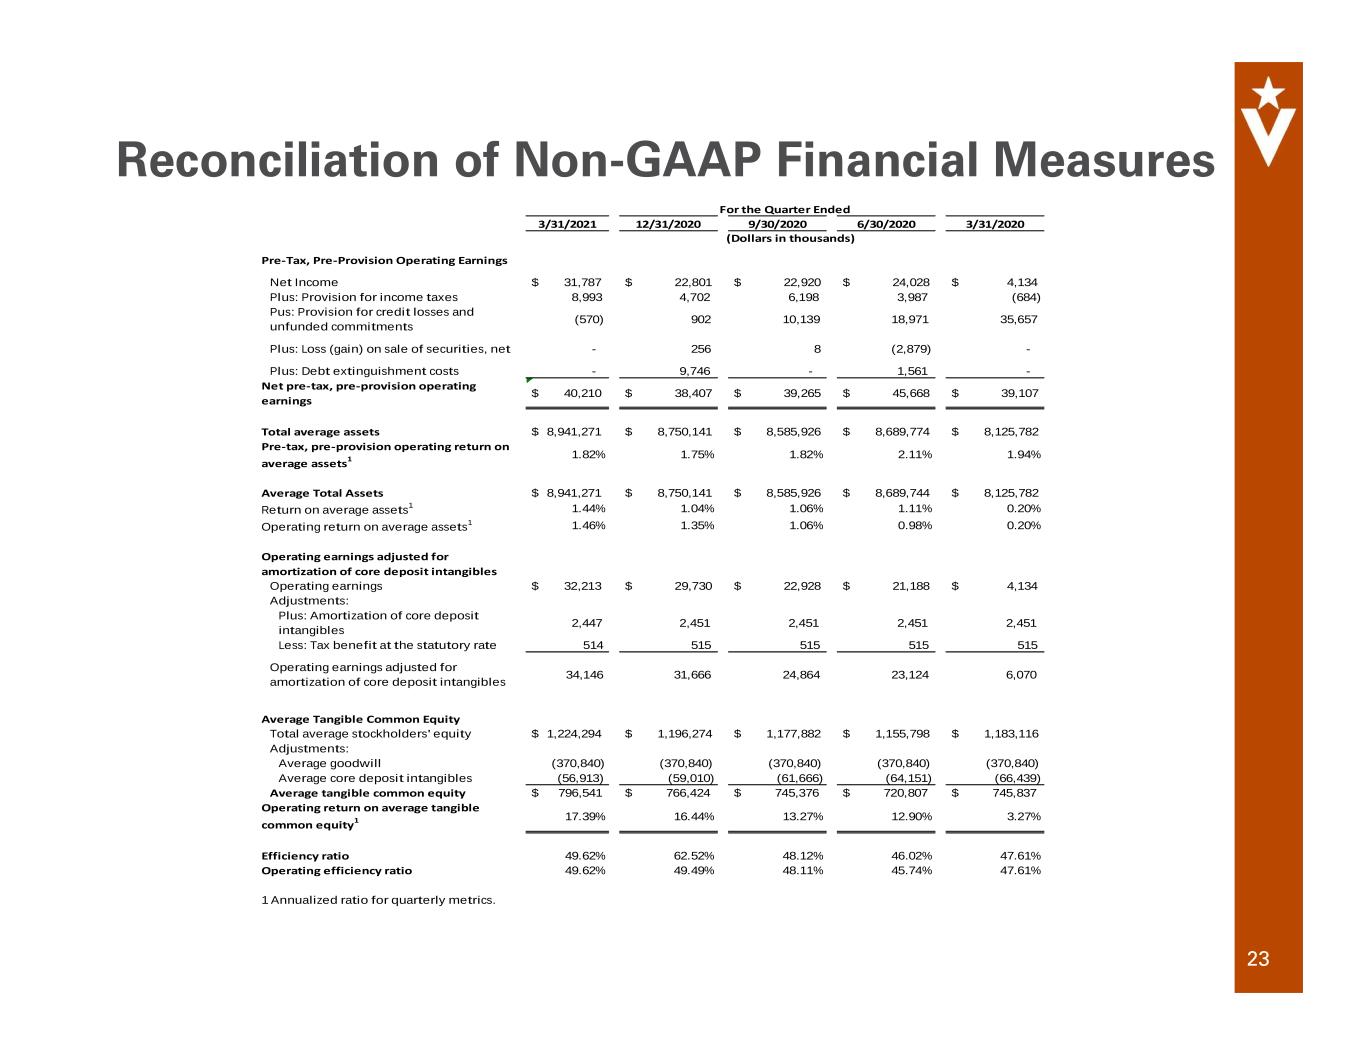
23 Reconciliation of Non-GAAP Financial Measures 3/31/2021 12/31/2020 9/30/2020 6/30/2020 3/31/2020 Pre-Tax, Pre-Provision Operating Earnings Net Income $ 31,787 $ 22,801 $ 22,920 $ 24,028 $ 4,134 Plus: Provision for income taxes 8,993 4,702 6,198 3,987 (684) Pus: Provision for credit losses and unfunded commitments (570) 902 10,139 18,971 35,657 Plus: Loss (gain) on sale of securities, net - 256 8 (2,879) - Plus: Debt extinguishment costs - 9,746 - 1,561 - Net pre-tax, pre-provision operating earnings $ 40,210 $ 38,407 $ 39,265 $ 45,668 $ 39,107 Total average assets $ 8,941,271 $ 8,750,141 $ 8,585,926 $ 8,689,774 $ 8,125,782 Pre-tax, pre-provision operating return on average assets1 1.82% 1.75% 1.82% 2.11% 1.94% Average Total Assets $ 8,941,271 $ 8,750,141 $ 8,585,926 $ 8,689,744 $ 8,125,782 Return on average assets1 1.44% 1.04% 1.06% 1.11% 0.20% Operating return on average assets1 1.46% 1.35% 1.06% 0.98% 0.20% Operating earnings adjusted for amortization of core deposit intangibles Operating earnings $ 32,213 $ 29,730 $ 22,928 $ 21,188 $ 4,134 Adjustments: Plus: Amortization of core deposit intangibles 2,447 2,451 2,451 2,451 2,451 Less: Tax benefit at the statutory rate 514 515 515 515 515 Operating earnings adjusted for amortization of core deposit intangibles 34,146 31,666 24,864 23,124 6,070 Average Tangible Common Equity Total average stockholders' equity $ 1,224,294 $ 1,196,274 $ 1,177,882 $ 1,155,798 $ 1,183,116 Adjustments: Average goodwill (370,840) (370,840) (370,840) (370,840) (370,840) Average core deposit intangibles (56,913) (59,010) (61,666) (64,151) (66,439) Average tangible common equity $ 796,541 $ 766,424 $ 745,376 $ 720,807 $ 745,837 Operating return on average tangible common equity1 17.39% 16.44% 13.27% 12.90% 3.27% Efficiency ratio 49.62% 62.52% 48.12% 46.02% 47.61% Operating efficiency ratio 49.62% 49.49% 48.11% 45.74% 47.61% 1 Annualized ratio for quarterly metrics. For the Quarter Ended (Dollars in thousands)
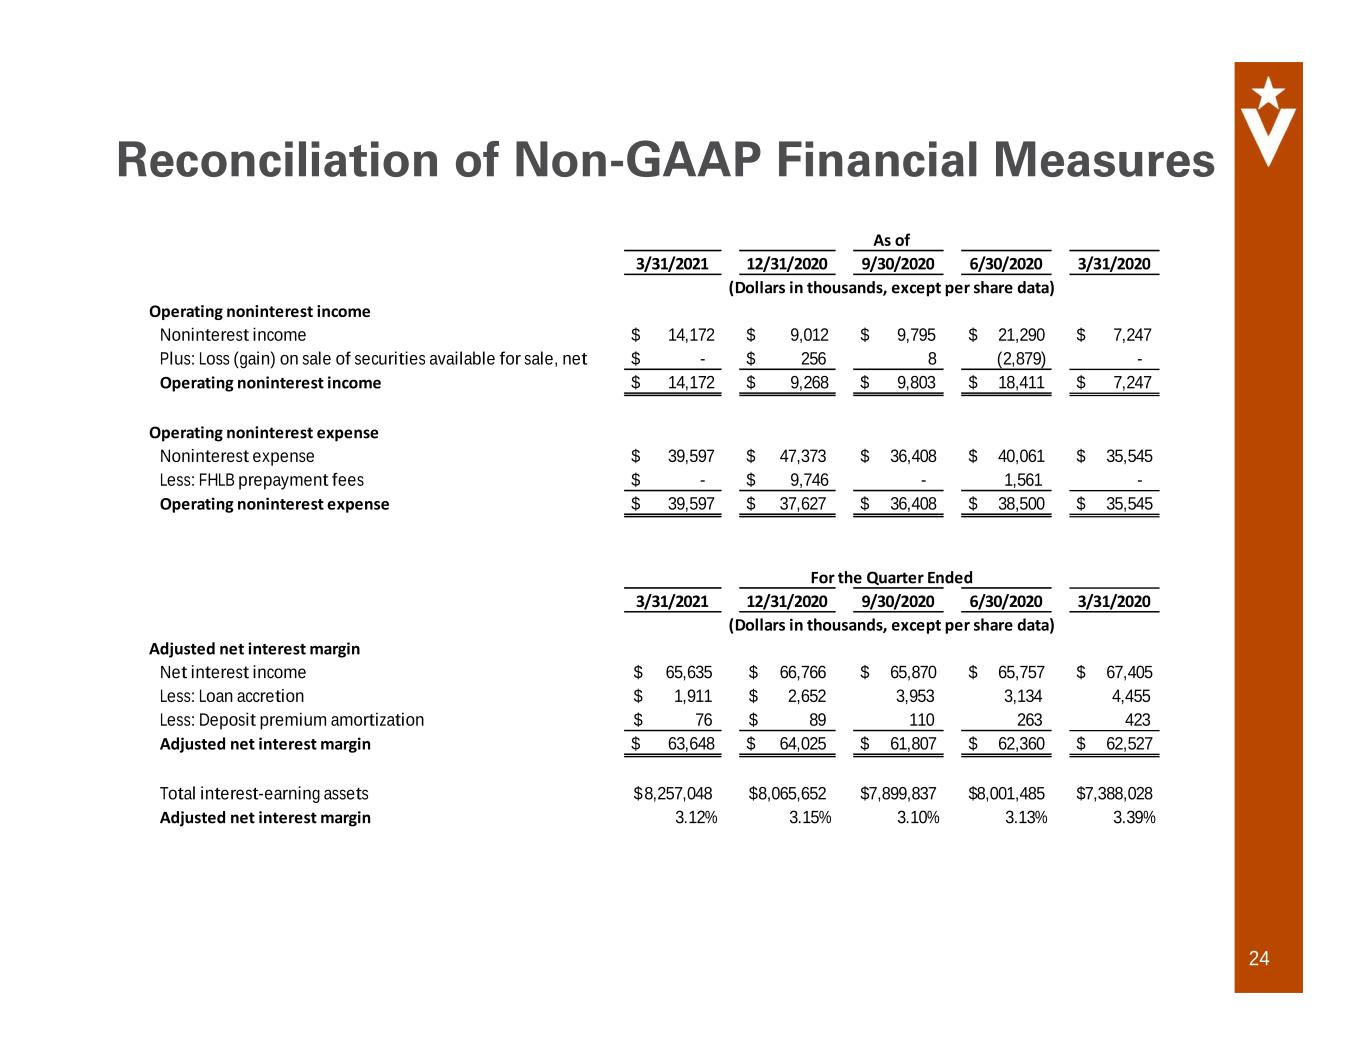
24 Reconciliation of Non-GAAP Financial Measures 3/31/2021 12/31/2020 9/30/2020 6/30/2020 3/31/2020 Operating noninterest income Noninterest income $ 14,172 $ 9,012 $ 9,795 $ 21,290 $ 7,247 Plus: Loss (gain) on sale of securities available for sale, net $ - $ 256 8 (2,879) - Operating noninterest income $ 14,172 $ 9,268 $ 9,803 $ 18,411 $ 7,247 Operating noninterest expense Noninterest expense $ 39,597 $ 47,373 $ 36,408 $ 40,061 $ 35,545 Less: FHLB prepayment fees $ - $ 9,746 - 1,561 - Operating noninterest expense $ 39,597 $ 37,627 $ 36,408 $ 38,500 $ 35,545 3/31/2021 12/31/2020 9/30/2020 6/30/2020 3/31/2020 Adjusted net interest margin Net interest income 65,635$ 66,766$ $ 65,870 $ 65,757 $ 67,405 Less: Loan accretion 1,911$ 2,652$ 3,953 3,134 4,455 Less: Deposit premium amortization 76$ 89$ 110 263 423 Adjusted net interest margin $ 63,648 $ 64,025 $ 61,807 $ 62,360 $ 62,527 Total interest-earning assets 8,257,048$ 8,065,652$ $7,899,837 $8,001,485 $7,388,028 Adjusted net interest margin 3.12% 3.15% 3.10% 3.13% 3.39% As of (Dollars in thousands, except per share data) For the Quarter Ended (Dollars in thousands, except per share data)
1st Quarter Earnings Conference Call April 28, 2021 Veritex Holdings, Inc.
