Attached files
| file | filename |
|---|---|
| EX-31.1 - EXHIBIT 31.1 - Veritex Holdings, Inc. | ex311-certificationofceose.htm |
| EX-32.2 - EXHIBIT 32.2 - Veritex Holdings, Inc. | ex322-certificationofcfose.htm |
| EX-32.1 - EXHIBIT 32.1 - Veritex Holdings, Inc. | ex321-certificationofceose.htm |
| EX-31.2 - EXHIBIT 31.2 - Veritex Holdings, Inc. | ex312-certificationofcfose.htm |
| EX-23.1 - EXHIBIT 23.1 - Veritex Holdings, Inc. | ex231-grantthorntonconsent.htm |
| EX-21.1 - EXHIBIT 21.1 - Veritex Holdings, Inc. | ex211-listofsubsidiaries.htm |
UNITED STATES
SECURITIES AND EXCHANGE COMMISSION
Washington, D.C. 20549
FORM 10-K
☒ | Annual Report to Section 13 OR 15(d) of the Securities Exchange Act of 1934 |
For the fiscal year ended December 31, 2017
OR
¨ | Transition Report Pursuant to Section 13 or 15(d) of the Securities Exchange Act of 1934 |
For the transition period from to
Commission File No. 001-36682
Veritex Holdings, Inc.
(Exact name of registrant as specified in its charter)
Texas | 27-0973566 | |
(State or other jurisdiction of incorporation or organization) | (I.R.S. Employer Identification No.) | |
8214 Westchester Drive, Suite 400 | ||
Dallas, Texas | 75225 | |
(Address of principal executive offices) | Zip Code | |
(972) 349 6200 | ||
(Registrant’s telephone number, including area code) | ||
Securities registered pursuant to Section 12(b) of the Act: | ||
Title of Each Class | Name of Each Exchange on Which Registered | |
Common Stock, par value $0.01 | Nasdaq Global Market | |
Securities registered pursuant to Section 12(g) of the Act: None | ||
Indicate by check mark if the registrant is a well-known seasoned issuer, as defined in Rule 405 of the Securities Act. Yes ¨ No x
Indicate by check mark if the registrant is not required to file reports pursuant to Section 13 or Section 15(d) of the Act. Yes ¨ No x
Indicate by check mark whether the registrant (1) has filed all reports required to be filed by Section 13 or 15(d) of the Securities Exchange Act of 1934 during the preceding 12 months (or for such shorter period that the registrant was required to file such reports), and (2) has been subject to such filing requirements for the past 90 days. Yes x No ¨
Indicate by check mark whether the registrant has submitted electronically and posted on its corporate Web site, if any, every Interactive Data File required to be submitted and posted pursuant to Rule 405 of Regulation S-T (§ 232.405 of this chapter) during the preceding 12 months (or for such shorter period that the registrant was required to submit and post such files). Yes x No ¨
Indicate by check mark if disclosure of delinquent filers pursuant to Item 405 of Regulation S-K (229.405 of this chapter) is not contained herein, and will not be contained to the best of registrant’s knowledge, in definitive proxy or information statements incorporated by reference in Part III of this Form 10-K or any amendment to this Form 10-K. ¨
Indicate by check mark whether the registrant is a large accelerated filer, an accelerated filer, a non-accelerated filer, or a smaller reporting company. See the definitions of “large accelerated filer,” “accelerated filer” and “smaller reporting company” in Rule 12b-2 of the Exchange Act. (Check one):
Large accelerated filer ¨ | Accelerated filer x |
Non-accelerated filer ¨ (Do not check if a smaller reporting company) | Smaller reporting company ☐ |
Emerging growth company ☒ | |
If an emerging growth company, indicate by check mark if the registrant has elected not to use the extended transition period for complying with any new or revised financial accounting standards provided pursuant to Section 13(a) of the Exchange Act. ☒ | |
Indicate by check mark whether the registrant is a shell company (as defined in Rule 12b-2 of the Act). Yes ¨ No x
The aggregate market value of the shares of common stock held by non-affiliates based on the closing price of the common stock on the Nasdaq Global Market on June 30, 2017 was approximately $350,195,000.
At March 13, 2018, the Company had outstanding 24,134,748 shares of common stock, par value $0.01 per share.
Documents Incorporated By Reference:
Portions of the registrant’s Definitive Proxy Statement relating to the 2018 Annual Meeting of Shareholders are incorporated by reference into Part III of this Annual Report on Form 10-K to the extent stated herein. Such Definitive Proxy Statement will be filed with the Securities and Exchange Commission within 120 days after the end of the registrant’s fiscal year ended December 31, 2017.
VERITEX HOLDINGS, INC.
Annual Report on Form 10‑K
December 31, 2017
S-1 | ||
1
PART I
ITEM 1. BUSINESS
Our Company
Except where the context otherwise requires or where otherwise indicated, references in this Annual Report on Form 10-K to “we,” “us,” “our,” “our company,” the “Company” or “Veritex” refer to Veritex Holdings, Inc. and our wholly-owned banking subsidiary, Veritex Community Bank, and the term “Bank” refers to Veritex Community Bank.
Veritex Holdings, Inc. is a Texas corporation and bank holding company headquartered in Dallas, Texas. Through our wholly-owned subsidiary, Veritex Community Bank, a Texas state chartered bank, we provide relationship-driven commercial banking products and services tailored to meet the needs of small to medium-sized businesses and professionals. Beginning at our inception in 2010, we initially targeted customers and focused our acquisitions primarily in the Dallas metropolitan area, which we consider to be Dallas and the adjacent communities in North Dallas. As a result of our recent acquisitions of Sovereign Bancshares, Inc. (“Sovereign”) and Liberty Bancshares, Inc. (“Liberty”), our current primary market now includes the broader Dallas-Fort Worth metroplex, which also encompasses Arlington, as well as the Houston metropolitan area. We currently operate twenty branches and one mortgage office located in the Dallas-Fort Worth metroplex and one branch in the Houston metropolitan area.
Our business is conducted through one reportable segment, community banking, where we generate the majority of our revenues from interest income on loans, customer service and loan fees, gains on sale of Small Business Administration (“SBA”) guaranteed loans and mortgage loans and interest income from securities. We incur interest expense on deposits and other borrowed funds and noninterest expense, such as salaries and employee benefits and occupancy expenses. We analyze our ability to maximize income generated from interest earning assets and expense of our liabilities through our net interest margin. Net interest margin is a ratio calculated as net interest income divided by average interest-earning assets. Net interest income is the difference between interest income on interest-earning assets, such as loans and securities, and interest expense on interest-bearing liabilities, such as deposits and borrowings, which are used to fund those assets.
Our primary customers are small and medium-sized businesses, generally with annual revenues of under $30 million, and professionals. We believe that these businesses and professionals highly value the local decision-making and relationship-driven, quality service we provide and our deep, long-term understanding of Texas community banking. As a result of consolidation, we believe that few locally-based banks are dedicated to providing this level of service to small and medium-sized businesses. Our management team’s long-standing presence and experience in Texas gives us unique insight into local market opportunities and the needs of our customers. This enables us to respond quickly to customers, provide high quality personal service and develop comprehensive, long-term banking relationships by providing products and services tailored to meet the individual needs of our customers. This focus and approach enhances our ability to continue to grow organically, successfully recruit talented bankers and strategically source potential acquisitions in our target markets.
We completed an initial public offering of our common stock in October 2014, as an Emerging Growth Company under the JOBS act. Our common stock is listed on the Nasdaq Global Market under the symbol “VBTX.”
Our History and Growth
We have experienced significant growth since commencing banking operations in 2010 through our strategy of pursuing organic growth and strategic acquisitions. Since inception, we have completed six whole-bank acquisitions that increased our market presence within the Dallas-Fort Worth metroplex, including an acquisition that resulted in us entering the Houston metropolitan market in 2017. On August 1, 2017, we acquired Sovereign Bancshares, Inc. (“Sovereign”), a Texas corporation and parent company of Sovereign Bank. We issued 5,117,642 shares of common stock and paid out $56.2 million in cash to Sovereign in consideration for the acquisition. Additionally, under the terms of the merger agreement, each of Sovereign’s 24,500 shares of Senior Non-Cumulative Perpetual Preferred Stock, Series C was converted into one share of our Senior Non-Cumulative Perpetual, Series D Preferred Stock at the consummation of the acquisition. For further information, see Note 22 - Preferred Stock in the accompanying Notes to the Consolidated Financial Statements included in Item 8 of this report. On December 1, 2017, we acquired Liberty Bancshares Inc. (“Liberty”), a Texas corporation and parent company of Liberty Bank. We issued approximately 1,449,944 shares of common stock and paid out $25.0 million in cash to Liberty in consideration for the acquisition.
2
As of December 31, 2017, we had total assets of $2.9 billion, total loans of $2.2 billion, total deposits of $2.3 billion and total stockholders’ equity of $488.9 million, which includes the fair value estimates from the Sovereign and Liberty acquisitions. In order to focus our growth efforts in the Dallas-Fort Worth and Houston markets and upon the completion of the Sovereign acquisition, we made the strategic decision to exit the Austin market. As of December 31, 2017, two branches in the Austin area, which are classified as held for sale on our consolidated balance sheets as of December 31, 2017, were sold on January 1, 2018.
Our management team is led by our Chairman and Chief Executive Officer, C. Malcolm Holland, III, who has overseen and managed our organic growth and acquisition activity since we commenced banking operations.
The following table summarizes our six completed acquisitions since inception:
Date | Acquired | Acquired | Number of | |||||||||||
Completed | Assets(1) | Loans(1) | Branches | Locations | ||||||||||
Bank Acquired | (Dollars in millions) | |||||||||||||
Professional Bank, N.A. through Professional Capital, Inc. | September 2010 | $ | 181.8 | $ | 91.7 | 3 | Park Cities, Lakewood and Garland | |||||||
Fidelity Bank through Fidelity Resources Company | March 2011 | 166.3 | 108.1 | 3 | Preston Center, SMU and Plano | |||||||||
Bank of Las Colinas | October 2011 | 53.8 | 40.4 | 1 | Las Colinas | |||||||||
Independent Bank of Texas through IBT Bancorp, Inc. | July 2015 | 124.4 | 88.5 | 2 | Irving and Frisco | |||||||||
Sovereign Bank through Sovereign Bancshares, Inc. | August 2017 | 1,122.2 | 752.5 | 9 | Dallas, Fort Worth, Houston and Austin | |||||||||
Liberty Bank through Liberty Bancshares, Inc. | December 2017 | 467.3 | 312.6 | 5 | Fort Worth | |||||||||
(1) Acquired assets and acquired loans amounts for Sovereign and Liberty represent provisional estimates as the independent valuations for certain assets acquired and liabilities assumed have not been finalized. For more information about these provisional estimates, please see Note 24 of the Notes to Consolidated Financial Statements contained in Item 15 of this report.
We have established a record of steady growth and profitable operations since our inception while preserving our strong credit culture. As indicated by the graphs below, for the year ended December 31, 2017, we continued this trend by focusing on growing our total loans and deposits organically by increasing our commercial lending relationships through further expansion in the Dallas-Fort Worth metroplex and Houston metropolitan area. On January 1, 2018, we completed the sale of two Austin branches acquired as part of the Sovereign acquisition. The completion of this branch sale resulted in us fully exiting the Austin market.
3
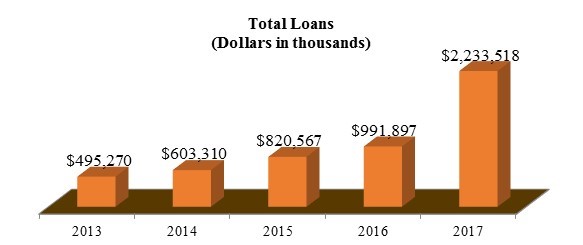 | 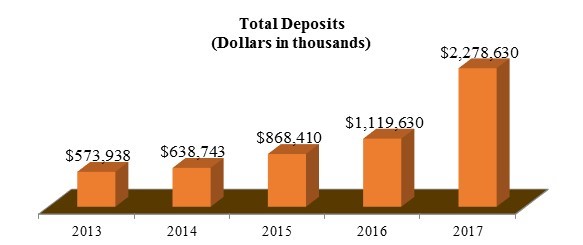 |
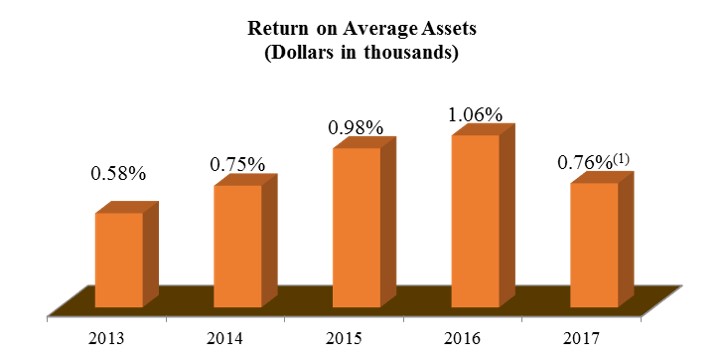 | 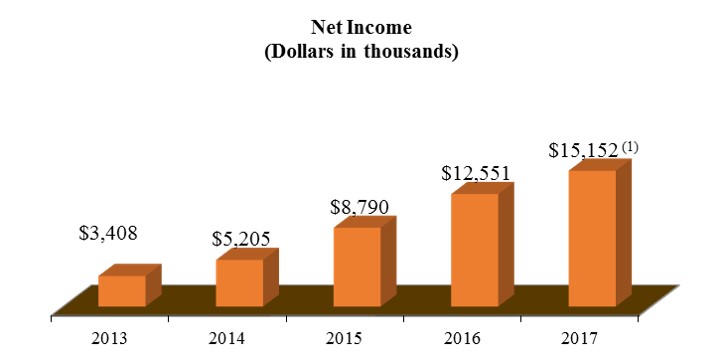 |
(1) Impact of the Tax Cuts and Jobs Act resulted in a $3.1 million one-time reduction to net income in 2017.
Our Strategy
Our business strategy consists of the following components:
• | Organic Growth. Our organic growth strategy focuses on more deeply penetrating our markets through our community-focused, relationship-driven approach to banking. We believe that our current market area provides abundant opportunities to continue to grow our customer base, increase loans and deposits and expand our overall market share. Our team of seasoned bankers are an important driver of our organic growth by further developing banking relationships with current and potential customers, many of which span more than 20 years. Our market presidents and relationship managers are incentivized to increase the size of their loan and deposit portfolios and generate fee income while maintaining strong credit quality. We expect continued success adding to our team of experienced bankers in order to grow our market presence. Preserving sound credit underwriting standards as we grow our loan portfolio will continue to be the foundation of our organic growth strategy. |
• | Acquisitions. We intend to continue to grow through acquisitions. We believe that there are banking organizations in our market area that face significant scale and operational challenges, regulatory pressure, management succession issues and shareholder liquidity needs, which we believe will present attractive acquisition opportunities for us in the future. We believe we have developed an experienced and disciplined acquisition and integration approach capable of identifying candidates, conducting thorough due diligence, determining financial attractiveness and integrating the acquired institution. Utilizing the prior experience of our management team at financial institutions, we believe that we have built a corporate infrastructure capable of supporting additional acquisitions and continued organic growth. We believe our acquisition experience and our reputation as a successful acquirer position us to capitalize on additional opportunities in the future. |
• | Improve Operational Efficiency and Increase Profitability. We are committed to maintaining and enhancing profitability. We employ a systematic and calculated approach to improving our operational efficiency, which in turn we believe increases our profitability. We believe that our scalable infrastructure and efficient operating platform will allow us to achieve continued growth without incurring significant incremental noninterest expenses and will enhance our returns. |
4
• | Continue to Build Our Community Ties. Our officers and employees are heavily involved in civic and community organizations, and we sponsor numerous activities that benefit our community. Our business development strategy, which focuses on building market share through personal relationships, as opposed to formal advertising, is consistent with our customer-centric culture and is a cost-effective approach to developing new relationships and enhancing existing ones. |
Our Banking Services
We focus on delivering a wide variety of relationship-driven commercial banking products and services tailored to meet the needs of small to medium-sized businesses and professionals. A general discussion of the range of commercial banking products and other services we offer follows.
Lending Activities. As of December 31, 2017, loans totaled $2.2 billion, representing 75.8% of our total assets. Our loan portfolio consists of commercial real estate and general commercial loans, residential real estate loans, construction and land loans, farmland loans and consumer loans.
Our underwriting philosophy seeks to balance our desire to make sound, high quality loans while recognizing that lending money involves a degree of business risk. Managing credit risk is a company-wide process. Our strategy for credit risk management includes well-defined, centralized credit policies, uniform underwriting criteria by loan type and ongoing risk monitoring and review processes for all types of credit exposures. Our processes emphasize early-stage review of loans, regular credit evaluations and management reviews of loans, which supplement the ongoing and proactive credit monitoring and loan servicing provided by our loan officers and lending support staff. Our Loan Committee and Executive Loan Committee provides company-wide credit oversight and periodically reviews all credit risk portfolios to ensure that the risk identification processes are functioning properly and that our credit standards are followed. In addition, a third-party loan review is performed at least annually to identify problem assets and confirm our internal risk rating of loans. We attempt to identify potential problem loans early in an effort to aggressively seek resolution of these situations before the loans become a loss, record any necessary charge-offs promptly and maintain adequate allowance levels for probable loan losses inherent in the loan portfolio.
Deposits. Deposits are our principal source of funds for our interest earning assets. We believe that a critical component of our success is the importance we place on our deposit services. Our services include the usual deposit functions of commercial banks, safe deposit facilities and commercial and personal banking services, in addition to our loan offerings. We offer a variety of deposit products and services consistent with the goal of attracting a wide variety of customers, including high net worth individuals and small to medium-sized businesses. The types of deposit accounts we offer consist of demand, savings, money market and time deposit accounts. We actively pursue business checking accounts by offering competitive rates, telephone banking, online banking and other convenient services to our customers. We also pursue commercial deposit and financial institution money market accounts that will benefit from the utilization of our treasury management services.
Other Products and Services. We offer banking products and services that are attractively priced and we believe easily understood by the customer, with a focus on convenience and accessibility. We offer a full suite of online banking solutions including access to account balances, online transfers, online bill payment and electronic delivery of customer statements, as well as ATMs, and banking by telephone, mail and personal appointment. We also offer debit cards, night depository, direct deposit, cashier’s checks, and letters of credit.
We offer a full array of commercial treasury management services designed to be competitive with banks of all sizes. Treasury management services include balance reporting (including current day and previous day activity), transfers between accounts, wire transfer initiation, automated clearinghouse origination and stop payments. Cash management deposit products consist of lockbox, remote deposit capture, positive pay, reverse positive pay, account reconciliation services, zero balance accounts and sweep accounts, including loan sweep.
Investments
The primary objectives of our investment policy are to provide a source of liquidity, to provide an appropriate return on funds invested, to manage interest rate risk, to meet pledging requirements and to meet regulatory capital requirements. As of December 31, 2017, the book value of our investment portfolio totaled $228.1 million, with an average yield of 2.03% and an estimated effective duration of approximately 2.69 years.
5
Our Market Area
We currently operate in the Dallas-Fort Worth metroplex area, which is part of the broader Dallas-Fort Worth-Arlington metroplex statistical area, and the Houston metropolitan area. The economy in these areas is fueled by the real estate, technology, financial services, insurance, transportation, manufacturing, health care and energy sectors. These market areas are among the most vibrant in the United States with rapidly growing populations, a high level of job growth, an affordable cost of living and a pro-growth business climate. On January 1, 2018, we completed the sale of the Austin branches acquired as part of the Sovereign acquisition and as a result have exited the Austin metropolitan area.
Competition
The banking business is highly competitive, and our profitability will depend principally upon our ability to compete with other banks and non-bank financial institutions located in our market for lending opportunities, deposit funds, bankers and acquisition candidates. Our banking competitors in our target markets include Chase Bank, Wells Fargo, Bank of America, BBVA Compass, Amegy Bank, Comerica Bank, Regions Bank, Prosperity Bank, Independent Bank, Texas Capital Bank and various community banks.
We are subject to vigorous competition in all aspects of our business from banks, savings banks, savings and loan associations, finance companies, credit unions and other providers of financial services, such as money market mutual funds, brokerage firms, consumer finance companies, asset-based non-bank lenders, insurance companies and certain other non-financial entities.
Employees
As of December 31, 2017, we had 315 full-time employees and 9 part-time employees. None of our employees are represented by a union. In August 2017, the Bank was named one of the “Best Banks to Work For 2017” by the American Banker Magazine, and in November 2017 the Bank was named in the list of “Top 100 Places to Work 2017” by The Dallas Morning News. We strive to maintain a culture where people are rewarded for hard work and share in the benefits of the success of the Company.
Our Corporate Information
Our principal executive offices are located at 8214 Westchester Drive, Suite 400, Dallas, Texas, 75225, and our telephone number is (972) 349-6200. Our website is www.veritexbank.com. We make available at this address, free of charge, our annual report on Form 10-K, our annual reports to shareholders, quarterly reports on Form 10-Q, current reports on Form 8-K and amendments to those reports filed or furnished pursuant to Section 13(a) or 15(d) of the Securities Exchange Act of 1934 (the “Exchange Act”) as soon as reasonably practicable after such material is electronically filed with, or furnished to, the Securities and Exchange Commission (the “SEC”). These documents are also available on the SEC’s website at www.sec.gov. The information contained on or accessible from our website does not constitute a part of this Annual Report on Form 10-K and is not incorporated by reference herein.
Regulation and Supervision
The U.S. banking industry is highly regulated under federal and state law. These laws and regulations affect the operations and performance of the Company and its subsidiaries.
Statutes, regulations and policies limit the activities in which the Company may engage and how it conducts certain permitted activities. Further, the bank regulatory system imposes reporting and information collection obligations. The Company incurs significant costs relating to compliance with these laws and regulations. Banking statutes, regulations and policies are continually under review by federal and state legislatures and regulatory agencies, and a change in them, including changes in how they are interpreted or implemented, could have a material adverse effect on the Company’s business.
The material statutory and regulatory requirements that are applicable to the Company and its subsidiaries are summarized below. The description below is not intended to summarize all laws and regulations applicable to the Company and its subsidiaries, and is based upon the statutes, regulations, policies, interpretive letters and other written guidance that are in effect as of the date of this Annual Report on Form 10-K.
6
Bank and Bank Holding Company Regulation
The Bank is a Texas-chartered banking association, the deposits of which are insured by the Deposit Insurance Fund of the Federal Deposit Insurance Corporation (the “FDIC”) up to applicable legal limits. The Bank is a member of the Federal Reserve System; therefore, the Bank is subject to ongoing and comprehensive supervision, regulation, examination and enforcement by the Texas Department of Banking (the “TDB”) and the Board of Governors of the Federal Reserve System (the “Federal Reserve”).
A company that acquires ownership or control of 25% or more of any class of voting securities of a bank or bank holding company, that controls the election of a majority of the board of directors of such an institution, or that exercises a controlling influence over the affairs of such an institution is a bank holding company and must obtain the prior approval of and later register with the Federal Reserve under the Bank Holding Company Act of 1956 as amended (the “BHC Act”). A company that acquires less than 25% but more than 5% of a class of voting securities may be required to enter into passivity commitments with the Federal Reserve. Bank holding companies are subject to regulation, examination, supervision and enforcement by the Federal Reserve under the BHC Act. The Federal Reserve’s jurisdiction also extends to any company that is directly or indirectly controlled by a bank holding company.
As a bank holding company, the Company is subject to ongoing and comprehensive supervision, regulation, examination and enforcement by the Federal Reserve. As a bank holding company of a Texas state chartered bank, the Company is also subject to supervision, regulation, examination and enforcement by the TDB.
Broad Supervision, Examination and Enforcement Powers
A principal objective of the U.S. bank regulatory system is to protect depositors by ensuring the financial safety and soundness of banking organizations. To that end, the banking regulators have broad regulatory, examination and enforcement authority. The regulators regularly examine the operations of banking organizations. In addition, banking organizations are subject to periodic reporting requirements. Insured depository institutions with total assets of $500 million or more must submit annual audit reports prepared by independent auditors to federal and state regulators. In some instances, the audit report of the insured depository institution’s bank holding company can be used to satisfy this requirement. Auditors must receive examination reports, supervisory agreements and reports of enforcement actions.
The regulators have various remedies available if they determine that the financial condition, capital resources, asset quality, earnings prospects, management, liquidity or other aspects of a banking organization’s operations are unsatisfactory. The regulators may also take action if they determine that the banking organization or its management is violating or has violated any law or regulation. The regulators have the power to, among other things:
• | require affirmative actions to correct any violation or practice; |
• | issue administrative orders that can be judicially enforced; |
• | direct increases in capital; |
• | direct the sale of subsidiaries or other assets; |
• | limit dividends and distributions; |
• | restrict growth; |
• | assess civil monetary penalties; |
• | remove officers and directors; and |
• | terminate deposit insurance |
Engaging in unsafe or unsound practices or failing to comply with applicable laws, regulations and supervisory agreements could subject us and our subsidiaries or their officers, directors and institution-affiliated parties to the remedies described above and other sanctions. See “Item 1A. Risk Factors—Risks Related to Veritex’s Industry and Regulation”.
7
The Dodd-Frank Act
On July 21, 2010, the Dodd-Frank Wall Street Reform and Consumer Protection Act (the “Dodd-Frank Act”) was signed into law. The Dodd-Frank Act imposed significant regulatory and compliance requirements, including the designation of certain financial companies as systemically important financial companies, enhanced oversight of credit rating agencies, the imposition of increased capital, leverage and liquidity requirements, and numerous other provisions designed to improve supervision and oversight of, and strengthen safety and soundness within, the financial services sector.
Additionally, the Dodd-Frank Act established a new framework of authority to conduct systemic risk oversight within the financial system to be distributed among federal regulatory agencies, including the Financial Stability Oversight Council, the Federal Reserve, the Office of the Comptroller of the Currency (the “OCC”) and the FDIC.
Various provisions of the Dodd-Frank Act may affect our business and include, but may not be limited to the following:
• | Source of strength. Under Federal Reserve policy, bank holding companies have historically been required to act as a source of financial and managerial strength to each of their banking subsidiaries, and the Dodd-Frank Act codified this policy as a statutory requirement. As a result of this requirement, in the future we could be required to provide financial assistance to the Bank should it experience financial distress and in circumstances in which we might not otherwise do so. |
• | Mortgage loan origination. The Dodd-Frank Act authorized the Consumer Financial Protection Bureau (the “CFPB”) to establish certain minimum standards for the origination of residential mortgages, including a determination of the borrower’s ability to repay a residential mortgage loan. Under the Dodd-Frank Act, financial institutions may not make a residential mortgage loan unless they make a “reasonable and good faith determination” that the consumer has a “reasonable ability” to repay the loan. The Dodd-Frank Act allows borrowers to raise certain defenses to foreclosure but provides a full or partial safe harbor from such defenses for loans that are “qualified mortgages.” The CFPB has promulgated final rules to, among other things, specify the types of income and assets that may be considered in the ability to repay determination, the permissible sources for verification and the required methods of calculating the loan’s monthly payments. The rules extend the requirement that creditors verify and document a borrower’s income and assets to include all information that creditors rely on in determining repayment ability. The rules also provide further examples of third party documents that may be relied on for such verification, such as government records and check cashing or funds transfer service receipts. The rules set conditions for “qualified mortgages,” including underwriting standards-for example, a borrower’s debt to income ratio may not exceed 43%-and limits on the terms of their loans. Points and fees are subject to a relatively stringent cap, and are defined to include a wide array of payments that may be made in the course of closing a loan. Certain loans, including interest only loans and negative amortization loans, cannot be qualified mortgages. |
• | Risk retention. The Federal Reserve, together with the FDIC, the SEC, the Federal Housing Finance Agency and the Department of Housing and Urban Development issued a final rule in 2014 to implement the risk retention requirement mandated by Section 941 of the Dodd-Frank Act. The risk retention requirement generally requires a securitizer to retain no less than 5% of the credit risk in assets it sells into a securitization and prohibits a securitizer from directly or indirectly hedging or otherwise transferring the credit risk that the securitizer is required to retain, subject to limited exemptions. One significant exemption is for securities entirely collateralized by “qualified residential mortgages” (“QRMs”), which are loans deemed to have a lower risk of default. The rule defines QRMs to have the same meaning as the term “qualified mortgage,” as defined by the CFPB. In addition, the rule provides for reduced risk retention requirements for qualifying securitizations of commercial loans, commercial real estate loans and auto loans. |
• | Imposition of restrictions on swaps activities. The Dodd-Frank Act imposes a new regulatory structure on the over-the-counter derivatives market, including requirements for clearing, exchange trading, capital, margin, reporting and record keeping. This framework covers any person required to register as a “major swap participant,” “swap dealer,” “major security-based swap participant” or a “security-based swap dealer.” We are treated as an end user and are not subject directly to many of these requirements, but the requirements may affect the nature of the business we conduct with persons required to register. |
8
• | Consumer Financial Protection Bureau. The Dodd-Frank Act created the CFPB, which is tasked with establishing and implementing rules and regulations under certain federal consumer protection laws with respect to the conduct of providers of certain consumer financial products and services. The CFPB has rulemaking authority over many of the statutes governing products and services offered to bank and thrift consumers. For banking organizations with assets of $10 billion or more, the CFPB has exclusive rule-making, examination, and primary enforcement authority under federal consumer financial laws. In addition, the Dodd-Frank Act permits states to adopt consumer protection laws and regulations that are stricter than those regulations promulgated by the CFPB. Compliance with any such new regulations would increase our cost of operations. With the recent change in leadership at the CFPB, the agency has released a new strategic plan and published formal requests for information on possible changes to its general supervisory program and its enforcement program. Taken together, these developments suggest that the CFPB may be taking a different approach to its implementation of consumer financial protection laws, but the agency has not proposed specific changes to its regulations. |
• | Deposit insurance. The Dodd-Frank Act made permanent the general $250,000 deposit insurance limit for insured deposits. Amendments to the FDIA also revised the assessment base against which an insured depository institution’s deposit insurance premiums paid to the FDIC’s Deposit Insurance Fund will be calculated. Under the amendments, the assessment base is no longer the institution’s deposit base, but rather its average consolidated total assets less its average tangible equity. Additionally, the Dodd-Frank Act made changes to the minimum designated reserve ratio of the Deposit Insurance Fund, increasing the minimum from 1.15% to 1.35% of the estimated amount of total insured deposits, and eliminating the requirement that the FDIC pay dividends to depository institutions when the reserve ratio exceeds certain thresholds. For a discussion of the assessments the Bank pays to the FDIC, see “Deposit Insurance and Deposit Insurance Assessments” below. |
• | Transactions with affiliates and insiders. The Dodd-Frank Act generally enhanced the restrictions on transactions with affiliates under Section 23A and 23B of the Federal Reserve Act, including an expansion of the definition of “covered transactions” and clarification regarding the amount of time for which collateral requirements regarding covered credit transactions must be satisfied. Insider transaction limitations were expanded through the strengthening of loan restrictions to insiders and the expansion of the types of transactions subject to the various limits, including derivatives transactions, repurchase agreements, reverse repurchase agreements and securities lending or borrowing transactions. |
• | Corporate governance. The Dodd-Frank Act addresses many investor protections, corporate governance and executive compensation matters that will affect most U.S. publicly traded companies, including the Company. The Dodd-Frank Act: (i) grants shareholders of U.S. publicly traded companies an advisory vote on executive compensation, (ii) enhances independence requirements for compensation committee members, (iii) requires companies listed on national securities exchanges to adopt incentive-based compensation clawback policies for executive officers and (iv) provides the Securities and Exchange Commission (the “SEC”) with authority to adopt proxy access rules that would allow shareholders of publicly traded companies to nominate candidates for election as a director and have those nominees included in a company’s proxy materials. For so long as we are an emerging growth company, we may take advantage of the provisions of the Jumpstart Our Business Startups Act, (the “JOBS Act”), allowing us to not seek a non-binding advisory vote on executive compensation or golden parachute arrangements. |
The Volcker Rule
Section 619 of the Dodd-Frank Act, popularly known as the “Volcker Rule,” generally prohibits “banking entities” from engaging in “proprietary trading” and making investments and conducting certain other activities with private equity funds and hedge funds. These prohibitions apply to banking entities of any size, including us and the Bank. In 2013, the Federal Reserve, together with the FDIC, the OCC, the SEC and the CFTC, issued regulations to implement the Volcker Rule, but full compliance was not required until July 21, 2017. We have reviewed the scope of the Volcker Rule and have determined that we do not have any activities or investments that are subject to the requirements of the rule at this time.
9
Notice and Approval Requirements Related to Control
Federal and state banking laws impose notice, application, approval or non-objection and ongoing regulatory requirements on any shareholder or other person that controls or seeks to acquire direct or indirect “control” of an FDIC-insured depository institution. In addition to requirements that may apply under the BHC Act, described above under “Bank and Bank Holding Company Regulation,” the Change in Bank Control Act and the Texas Banking Act require regulatory filings by a shareholder or other person that seeks to acquire direct or indirect “control” of an FDIC-insured depository institution. The determination whether a person “controls” a depository institution or its holding company is based on all of the facts and circumstances surrounding the investment. As a general matter, a person is deemed to control a depository institution or other company if the person owns or controls 25% or more of any class of voting stock. Subject to rebuttal, a person is presumed to control a depository institution or other company if the person owns or controls 10% or more of any class of voting stock and other regulatory criteria are met. The holdings of certain affiliated persons, or persons acting in concert, are typically aggregated for the purpose of applying the 10% and 25% thresholds.
In addition, except under limited circumstances, bank holding companies are prohibited from acquiring, without prior approval, control of any other bank or bank holding company or all or substantially all the assets thereof; or more than 5% of the voting shares of a bank or bank holding company which is not already a subsidiary.
Permissible Activities and Investments
Banking laws generally restrict our ability to engage in, or acquire more than 5% of the voting shares of a company engaged in, activities other than those determined by the Federal Reserve to be so closely related to banking as to be a proper incident thereto. The Gramm-Leach-Bliley Financial Modernization Act of 1999 (the “GLB Act”) expanded the scope of permissible activities to include those that are financial in nature or incidental or complementary to a financial activity for a bank holding company that elects to be a financial holding company, which requires the satisfaction of certain conditions. We have not elected financial holding company status.
In addition, as a general matter, we must receive prior regulatory approval before establishing or acquiring a depository institution or, in certain cases, a non-bank entity.
The Texas Constitution, as amended in 1986, provides that a Texas-chartered bank has the same rights and privileges that are or may be granted to national banks domiciled in Texas. To the extent that the Texas laws and regulations may have allowed state-chartered banks to engage in a broader range of activities than national banks, the Federal Deposit Insurance Corporation Improvement Act of 1991 (the “FDICIA”), has operated to limit such activities. FDICIA provides that no state bank or subsidiary thereof may engage as a principal in any activity not permitted for national banks, unless the institution complies with applicable capital requirements and the FDIC determines that the activity poses no significant risk to the Deposit Insurance Fund of the FDIC. In general, statutory restrictions on the activities of banks are aimed at protecting the safety and soundness of depository institutions.
Branching
Texas law provides that a Texas-chartered bank can establish a branch anywhere in Texas provided that the branch is approved in advance by the TDB. The branch must also be approved by the Federal Reserve. The regulators consider a number of factors, including financial history, capital adequacy, earnings prospects, character of management, needs of the community and consistency with corporate powers. The Dodd-Frank Act permits insured state banks to engage in de novo interstate branching if the laws of the state where the new branch is to be established would permit the establishment of the branch if it were chartered by such state.
Regulatory Capital Requirements and Capital Adequacy
The bank regulators view capital levels as important indicators of an institution’s financial soundness. As a general matter, FDIC-insured depository institutions and their holding companies are required to maintain minimum capital relative to the amount and types of assets they hold. The final supervisory determination on an institution’s capital adequacy is based on the regulator’s assessment of numerous factors. As a bank holding company and a state-chartered member bank, we and the Bank are subject to several regulatory capital requirements.
Capital requirements have evolved over the last thirty years. The current requirement took effect on January 1, 2015, with phase-in periods for certain requirements. The requirements are based on a set of international standards popularly known as Basel III. By virtue of the Dodd-Frank Act, the Company is broadly subject to the same requirements that apply to the Bank.
10
Under the current capital rules, the Bank must maintain “tangible” capital equal to 1.5% of average total assets, common equity Tier 1 equal to 4.5% of risk-weighted assets, Tier 1 capital equal to 6% of risk-weighted assets, total capital (a combination of Tier 1 and Tier 2 capital) equal to 8% of risk-weighted assets, and a leverage ratio of Tier 1 capital to average total consolidated assets equal to 4%. The regulations also modified the thresholds necessary for a savings association to be deemed well or adequately capitalized; these adjustments are discussed below under “Prompt Corrective Action.”
Under the rules, the components of common equity Tier 1 capital include common stock instruments (including related surplus), retained earnings, and certain minority interests in the equity accounts of fully consolidated subsidiaries (subject to certain limitations). A bank must make certain deductions from and adjustments to the sum of these components to determine common equity Tier 1 capital. The required deductions for banks include, among other items, goodwill (net of associated deferred tax liabilities), certain other intangible assets (net of deferred tax liabilities), certain deferred tax assets, gains on sale in connection with securitization exposures and investments in and extensions of credit to certain subsidiaries engaged in activities not permissible for national banks. The adjustments require several complex calculations and include adjustments to the amounts of deferred tax assets, mortgage servicing assets, and certain investments in the capital of unconsolidated financial institutions that are includable in common equity Tier 1 capital. Additional Tier 1 capital includes noncumulative perpetual preferred stock and related surplus, and certain minority interests in the equity accounts of fully consolidated subsidiaries not included in common equity Tier 1 capital (subject to certain limitations). Tier 2 capital includes subordinated debt with a minimum original maturity of five years, related surplus, certain minority interests in in the equity accounts of fully consolidated subsidiaries not included in Tier 1 capital (subject to certain limitations), and limited amounts of a bank’s allowance for loan and lease losses (“ALLL”). Certain deductions and adjustments are necessary for both additional Tier 1 capital and Tier 2 capital. Tangible capital has the same definition as Tier 1 capital. Under the final rules, banking organizations were provided a one-time option in their initial regulatory financial report filed after January 1, 2015, to remove certain components of accumulated other comprehensive income from the computation of common equity regulatory capital.
The risk weights used for the risk-based capital calculations range from 0% for cash, U.S. government securities, and certain other assets, 50% for qualifying residential mortgage exposures, 100% for corporate exposures and non-qualifying mortgage loans and certain other assets, to 600% for certain equity exposures. Loans that are past due by 90 days or more and commercial real estate loans either with a loan-to-value ratio in excess of the supervisory ceilings or without a certain amount of contributed capital from the borrower must be risk-weighted at 150%. Mortgage servicing assets and deferred tax assets that are not deducted from common equity Tier 1 capital in accordance with the adjustment stated above are risk-weighted at 250%.
At December 31, 2017, the Bank was in compliance with the minimum common equity Tier 1 capital, Tier 1 capital, total capital, tangible capital and leverage capital requirements.
The Company is subject to similar minimum capital requirements as the Bank, except that the Company is not subject to a tangible capital ratio. As a bank holding company with less than $15 billion in total assets, we may include certain existing trust preferred securities and cumulative perpetual preferred stock in regulatory capital while other instruments are disallowed. As of December 31, 2017, the Company was in compliance with the minimum common equity Tier 1 capital, Tier 1 capital, total capital, and leverage capital requirements. For the Company to be “well capitalized,” the Bank must be well-capitalized and the Company must not be subject to any written agreement, order, capital directive, or prompt corrective action directive issued by the Federal Reserve to meet and maintain a specific capital level for any capital measure. As of December 31, 2017, the Company met all the requirements to be deemed well-capitalized.
In addition, the rules subject a banking organization to certain limitations on capital distributions and discretionary bonus payments to executive officers if the organization does not maintain a “capital conservation buffer” of common equity Tier 1 capital in an amount greater than 2.5% of its total risk-weighted assets. This requirement is still phasing in and will take full effect on January 1, 2019. In 2017, the necessary buffer was 1.25%; in 2018, it will be 1.875%. The effect of the capital conservation buffer , once fully phased in, will be to increase the minimum common equity Tier 1 capital ratio to 7.0%, the minimum tier 1 risk-based capital ratio to 8.5% and the minimum total risk-based capital ratio to 10.5%, for banking organizations seeking to avoid the limitations on capital distributions and discretionary bonus payments to executive officers.
The capital requirements are minimum supervisory ratios generally applicable to banking organizations. The Federal Reserve (and the other federal bank regulatory agencies) may set capital requirements for a particular banking organization that are higher than the minimum ratios when circumstances warrant. Federal Reserve guidelines also provide that banking organizations experiencing internal growth or making acquisitions will be expected to maintain strong capital positions substantially above the minimum supervisory levels, without significant reliance on intangible assets.
11
Prompt Corrective Action
In addition to the capital rules, the Bank is subject to the “prompt corrective action” regime. This regime subjects an insured depository institution to increasingly stringent restrictions and supervisory actions by its primary federal regulator, if the institution becomes undercapitalized and its financial condition continues to deteriorate. Each U.S. insured depository institution falls within one of five assigned capital categories: “well capitalized,” “adequately capitalized,” “undercapitalized,” “significantly undercapitalized,” and “critically undercapitalized.” An insured depository institution is deemed to be “well capitalized” if it has a total risk-based capital ratio of 10.0% or greater, a common equity Tier 1 capital ratio of 6.5% or greater, a Tier 1 risk-based capital ratio of 8.0% or greater, a leverage ratio of 5.0% or greater and the institution is not subject to an order, written agreement, capital directive or prompt corrective action directive to meet and maintain a specific level for any capital measure. A well-capitalized institution is not subject to any restrictions on its activities and enjoys certain regulatory advantages such as streamlined processing of many applications. A depository institution is deemed to be “adequately capitalized” if it has a total risk-based capital ratio of 8.0% or greater, a common equity Tier 1 capital ratio of 4.5% or greater; a Tier 1 risk-based capital ratio of 6.0% or greater; a leverage ratio of 4.0% or greater; and does not meet the criteria for a “well capitalized” bank. Adequately-capitalized status is necessary in order to undertake a variety of regulated activities. An institution that is adequately capitalized but not well capitalized may be restricted in its ability to rely on brokered deposits, discussed below under “Brokered Deposits.”
A depository institution is “under-capitalized” if it has a total risk-based capital ratio of less than 8.0%, a common equity Tier 1 capital ratio less than 4.5%, a Tier 1 risk-based capital ratio of less than 6.0% or a leverage ratio of less than 4.0%. A depository institution is “ significantly undercapitalized” if it has a total risk-based capital ratio of less than 6.0%, a common equity Tier 1 capital ratio less than 3.0%, a Tier 1 risk-based capital ratio of less than 4.0% or a leverage ratio of less than 3.0%. an institution is critically undercapitalized if its ratio of tangible equity to total assets is equal to or less than 2.0%. Significantly undercapitalized institutions are subject to a wider array of adverse agency actions than undercapitalized institutions. A critically undercapitalized institution is likely to be place in receivership if it does not find a merger partner. Under certain circumstances, an institution may be treated as if the institution were in the next lower capital category.
A banking institution that is undercapitalized is required to submit a capital restoration plan. The capital restoration plan will not be accepted by the regulators unless each company having control of the undercapitalized institution provides a performance guarantee of the subsidiary’s compliance with the capital restoration plan up to the lesser of 5% of the bank’s total assets or the amount necessary to bring the bank into compliance with capital requirements as of the time it fell out of compliance.
Failure to meet capital guidelines could subject the institution to a variety of enforcement remedies by federal bank regulatory agencies, including termination of deposit insurance upon notice and hearing, restrictions on certain business activities, and appointment of the FDIC as conservator or receiver. As of December 31, 2017, the Bank met the requirements to be “well capitalized” under the prompt corrective action regulations.
Regulatory Limits on Dividends and Distributions
As a bank holding company, we are subject to certain restrictions on paying dividends under applicable federal and Texas laws and regulations. The Federal Reserve has issued a policy statement that provides that a bank holding company should not pay dividends unless (i) its net income over the last four quarters (net of dividends paid) has been sufficient to fully fund the dividends, (ii) the prospective rate of earnings retention appears to be consistent with the capital needs, asset quality and overall financial condition of the bank holding company and its subsidiaries and (iii) the bank holding company will continue to meet minimum required capital adequacy ratios. Accordingly, a bank holding company should not pay cash dividends that exceeds its net income or that can only be funded in ways that weaken the bank holding company’s financial health, such as by borrowing. The Dodd-Frank Act imposes, and Basel III results in, additional restrictions on the ability of banking institutions to pay dividends.
Substantially all of our income, and a principal source of our liquidity, are dividends from the Bank. Bank dividend activity is governed by federal and state laws, regulations and policies.
Under Federal Reserve guidelines, the Bank may pay dividends to us only from net income and retained earnings and may not impair its permanent capital, subject to certain exceptions. Capital adequacy requirements serve to limit the amount of dividends that may be paid by the Bank. Under the FDIA, an insured depository institution such as the Bank is prohibited from making capital distributions, including the payment of dividends, if, after making such distribution, the institution would become “undercapitalized.” The Federal Reserve may further restrict the payment of dividends by requiring the Bank to maintain a higher level of capital than would otherwise be required to be adequately capitalized for regulatory purposes. Payment of dividends by the Bank also may be restricted at any time at the discretion of the appropriate regulator if it deems the payment to constitute an unsafe and unsound banking practice. As noted above, the capital conservation buffer created under the final capital rules, when fully implemented, may also have the effect of limiting the payment of capital distributions from the Bank.
12
Reserve Requirements
Pursuant to regulations of the Federal Reserve, all banking organizations are required to maintain average daily reserves at mandated ratios against their transaction accounts. In addition, reserves must be maintained on certain non-personal time deposits. These reserves must be maintained in the form of vault cash or in an account at a Federal Reserve Bank.
Limits on Transactions with Affiliates and Insiders
Insured depository institutions are subject to restrictions on their ability to conduct transactions with affiliates and other related parties. Section 23A of the Federal Reserve Act imposes quantitative limits, qualitative requirements, and collateral standards on certain transactions by an insured depository institution with, or for the benefit of, its affiliates. Transactions covered by Section 23A include loans, extensions of credit, investment in securities issued by an affiliate, and acquisitions of assets from an affiliate. Section 23B of the Federal Reserve Act requires that most types of transactions by an insured depository institution with, or for the benefit of, an affiliate be on terms substantially the same or at least as favorable to the insured depository institution as if the transaction were conducted with an unaffiliated third party.
As noted above, the Dodd-Frank Act generally enhances the restrictions on transactions with affiliates under Section 23A and 23B of the Federal Reserve Act, including an expansion of the definition of “covered transactions” and a clarification regarding the amount of time for which collateral requirements regarding covered credit transactions must be satisfied. The ability of the Federal Reserve to grant exemptions from these restrictions is also narrowed by the Dodd-Frank Act, including by requiring coordination with other bank regulators.
The Federal Reserve’s Regulation O regulations impose restrictions and procedural requirements in connection with the extension of credit by an insured depository institution to directors, executive officers, principal shareholders and their related interests. Section 18(z) of the FDIA limits purchases and sales of assets between an insured depository institution and its executivie officers, directors, and principal shareholders.
Brokered Deposits
The FDIA restricts the use of brokered deposits by certain depository institutions. Under the applicable regulations, a “well capitalized insured depository institution” may solicit and accept, renew or roll over any brokered deposit without restriction. An “adequately capitalized insured depository institution” may not accept, renew or roll over any brokered deposit unless it has applied for and been granted a waiver of this prohibition by the FDIC. The FDIC may grant a waiver upon a finding that the acceptance of brokered deposits does not constitute an unsafe or unsound practice with respect to such institution. The rates that an adequately capitalized institution with a waiver may pay on brokered deposits may not exceed certain ceilings. An “undercapitalized insured depository institution” may not accept, renew or roll over any brokered deposit.
Concentrated Commercial Real Estate Lending Guidance
The federal banking agencies, including the Federal Reserve, have promulgated guidance governing financial institutions with concentrations in commercial real estate lending. The guidance provides that a bank has a concentration in commercial real estate lending if (i) total reported loans for construction, land development and other land represent 100% or more of total risk-based capital or (ii) total reported loans secured by multifamily and non-farm residential properties and loans for construction, land development, and other land represent 300% or more of total risk-based capital and the bank’s commercial real estate loan portfolio has increased 50% or more during the prior 36 months. Owner-occupied commercial real estate loans are excluded from this second category. If a concentration is present, management must employ heightened risk management practices that address the following key elements: board and management oversight and strategic planning, portfolio management, development of underwriting standards, risk assessment and monitoring through market analysis and stress testing and maintenance of increased capital levels as needed to support the level of commercial real estate lending. At December 31, 2017, total reported loans for construction, land development and other land represented over 100% of total capital indicating a concentration in commercial real estate lending. At December 31, 2017, our management believes that it is in compliance with the requirements and guidance of federal banking agencies including the Federal Reserve for institutions with concentrations in commercial real estate lending.
13
Examination and Examination Fees
The Federal Reserve periodically examines and evaluates state member banks. Based on such an evaluation, the Bank, among other things, may be required to revalue its assets and establish specific reserves to compensate for the difference between the Bank’s assessment and that of the Federal Reserve. The TDB also conducts examinations of state banks but may accept the results of a federal examination in lieu of conducting an independent examination. In addition, the Federal Reserve and TDB may elect to conduct a joint examination. The TDB charges fees to recover the costs of examining Texas chartered banks, as well as filing fees for certain applications and other filings. The Dodd-Frank Act provides various agencies with the authority to assess additional supervision fees.
Deposit Insurance and Deposit Insurance Assessments
The Bank’s deposits are insured by the Deposit Insurance Fund, or DIF, to the maximum extent permitted by the FDIC. This amount is $250,000 per depositor per account. As insurer, the FDIC is authorized to conduct examinations of, and to require reporting by, insured institutions. The agency also may prohibit any insured institution from engaging in any activity determined by regulation or order to pose a serious threat to the FDIC. The FDIC has the authority to initiate enforcement actions against savings associations, after giving the OCC an opportunity to take such action.
Insured depository institutions fund the DIF through quarterly assessments. The FDIC has adopted a risk-based premium system to calculate the assessments. All institutions with deposits insured by the FDIC are required to pay assessments to fund interest payments on bonds issued by the Financing Corporation, a mixed-ownership government corporation established to recapitalize the predecessor to the DIF. These assessments will continue until the Financing Corporation bonds mature in 2019.
The FDIC has revised its methodology for determining assessments from time to time. The current methodology, which has been in place since the third quarter of 2016, has a range of assessment rates from 3 basis points to 30 basis points on insured deposits. All insured depository institutions with the exception of large and complex banking organizations are assigned to one of three risk categories based on their composite CAMELS ratings. Each of the three risk categories has a range of rates, and the rate for a particular institution is determined based on seven financial ratios and the weighted average of its component CAMELS ratings. The FDIC may adjust assessment rates downward as the reserve ratio of the Deposit Insurance Fund exceeds 2.0% and higher thresholds.
Future changes in insurance premiums could have an adverse effect on the operating expenses and results of operations and we cannot predict what insurance assessment rates will be in the future.
The FDIC may terminate the deposit insurance of any insured depository institution, including us, if it determines after a hearing that the institution has engaged or is engaging in unsafe or unsound practices, is in an unsafe or unsound condition to continue operations, or has violated any applicable law, regulation, order or any condition imposed by an agreement with the FDIC. It also may suspend deposit insurance temporarily during the hearing process for the permanent termination of insurance, if the institution has no tangible capital. Management is not aware of any existing circumstances that would result in termination of our deposit insurance.
Depositor Preference
The FDIA provides that, in the event of the “liquidation or other resolution” of an insured depository institution, the claims of depositors of the institution (including the claims of the FDIC as subrogee of insured depositors) and certain claims for administrative expenses of the FDIC as a receiver will have priority over other general unsecured claims against the institution. If the Company invests in or acquires an insured depository institution that fails, insured and uninsured depositors, along with the FDIC, will have priority in payment ahead of unsecured, non-deposit creditors, including the Company, with respect to any extensions of credit they have made to such insured depository institution.
14
Anti-Money Laundering and OFAC
Insured depository institutions and several other classes of financial institutions are subject to regulations under the Bank Secrecy Act and the USA PATRIOT Act of 2001 designed to prevent money laundering and the financing of terrorism. The principal requirements for an insured depository institution include (i) establishment of an anti-money laundering program that includes training and audit components; (ii) establishment of a "know your customer" program involving due diligence to confirm the identity of persons seeking to open accounts and to deny accounts to those persons unable to demonstrate their identities; (iii) the filing of currency transaction reports for deposits and withdrawals of large amounts of cash; (iv) additional precautions for accounts sought and managed for non-U.S. persons; and (v) verification and certification of money laundering risk with respect to private banking and foreign correspondent banking relationships. For many of these tasks a bank must keep records to be made available to its primary federal regulator. Anti- money laundering rules and policies are developed by a bureau within the U.S. Department of the Treasury, the Financial Crimes Enforcement Network, but compliance by individual institutions is overseen by its primary federal regulator, in the Bank's case, the OCC.
Bank regulators routinely examine institutions for compliance with these obligations, and they must consider an institution’s compliance with such obligations in connection with the regulatory review of applications, including applications for banking mergers and acquisitions. Compliance with these requirements has been a special focus of the Federal Reserve and the other Federal banking agencies in recent years. Any non-compliance is likely to result in an enforcement action, often with substantial monetary penalties and reputation damage. A savings association or bank that is required to strengthen its compliance program often must put on hold any initiatives that require banking agency approval.
The U.S. Department of the Treasury’s Office of Foreign Assets Control (“OFAC”) is responsible for helping to ensure that U.S. entities do not engage in transactions with certain prohibited parties, as defined by various Executive Orders and Acts of Congress. OFAC publishes lists of persons, organizations and countries suspected of aiding, harboring or engaging in terrorist acts, known as Specially Designated Nationals and Blocked Persons. If the Company or the Bank finds a name on any transaction, account or wire transfer that is on an OFAC list, the Company or the Bank must freeze or block such account or transaction, file a suspicious activity report and notify the appropriate authorities.
Consumer Laws and Regulations
Banking organizations are subject to numerous Federal laws and regulations intended to protect consumers. These laws include, among others:
• | Truth in Lending Act; |
• | Truth in Savings Act; |
• | Electronic Funds Transfer Act; |
• | Expedited Funds Availability Act; |
• | Equal Credit Opportunity Act; |
• | Fair and Accurate Credit Transactions Act; |
• | Fair Housing Act; |
• | Fair Credit Reporting Act; |
• | Fair Debt Collection Act; |
• | The GLB Act; |
• | Home Mortgage Disclosure Act; |
• | Right to Financial Privacy Act; |
• | Real Estate Settlement Procedures Act; |
15
• | Section 5 of the Federal Trade Commission Act and section 1031 of the Dodd-Frank Act protecting against unfair, deceptive or abusive acts and practices; and |
• | state usury laws. |
Many states and local jurisdictions have consumer protection laws analogous to, and in addition to, those listed above. These federal, state and local laws regulate the manner in which financial institutions deal with customers when taking deposits, making loans, or conducting other types of transactions. Failure to comply with these laws and regulations could give rise to regulatory sanctions, customer rescission rights, action by state and local attorneys general and civil or criminal liability. The creation of the CFPB by the Dodd-Frank Act has led to enhanced enforcement of consumer financial protection laws.
Privacy and Cybersecurity
Several Federal statutes and regulations require insured depository institutions to take several steps to protect nonpublic consumer financial information. The Bank has prepared a privacy policy, which it must disclose to consumers annually. In some cases, the Bank must obtain a consumer's consent before sharing information with an unaffiliated third party, and the Bank must allow a consumer to opt out of the Bank's sharing of information with its affiliates for marketing and certain other purposes. Additional conditions come into play in the Bank's information exchanges with credit reporting agencies. The Bank's privacy practices and the effectiveness of its systems to protect consumer privacy are one of the subjects covered in the OCC's periodic compliance examinations.
The Federal banking agencies pay close attention to the cybersecurity practices of savings associations, banks, and their holding companies and affiliates. The interagency council of the agencies, the Federal Financial Institutions Examination Council, has issued several policy statements and other guidance for banks as new cybersecurity threats arise. FFIEC has recently focused on such matters as compromised customer credentials and business continuity planning. Examinations by the banking agencies now include review of an institution’s information technology and its ability to thwart cyber attacks.
The Community Reinvestment Act
The Community Reinvestment Act (the “CRA”) and related regulations are intended to encourage insured depository institutions to help meet the credit needs of low to moderate-income communities and individuals within their institutions’ assessment areas. CRA does not impose specific lending requirements, and it does not contemplate that an insured depository institution would take any action inconsistent with safety and soundness.
The Federal banking agencies evaluate the performance of each of their regulated institutions periodically to determine whether an institution’s performance is “Outstanding,” “Satisfactory,” “Needs to Improve,” or “Substantial Noncompliance.” Each evaluation is made public, together with the underlying report. Outstanding or Satisfactory ratings often are a condition to qualify for certain regulatory benefits.
The CRA requires the federal bank regulators to take into account an insured depository institution’s record in meeting the convenience and needs of the communities that the institution serves when considering an application by a bank to establish or relocate a branch or to enter into certain mergers or acquisitions. The Federal Reserve is required to consider the CRA records of a bank holding company’s subsidiary bank (or banks) when considering an application by the bank holding company to acquire a banking organization or to merge with another bank holding company. When we or the Bank apply for regulatory approval to engage in certain transactions, the regulators will consider the CRA performance of the target institutions and our depository institution subsidiaries. An evaluation of “Needs to Improve” or “Substantial Noncompliance” may block or impede regulatory approvals of our applications. The Bank received an overall CRA rating of “Satisfactory” as an intermediate small bank on its most recent CRA examination as of January 23, 2017.
16
Changes in Laws, Regulations or Policies
Federal, state and local legislators and regulators regularly introduce measures or take actions that would modify the regulatory requirements applicable to banks, their holding companies and other financial institutions. Changes in laws, regulations or regulatory policies could adversely affect the operating environment for us in substantial and unpredictable ways, increase our cost of doing business, impose new restrictions on the way in which the Company conducts its operations or add significant operational constraints that might impair the Company’s profitability. Whether new legislation will be enacted and, if enacted, the effect that it, or any implementing regulations, would have on the Company and its subsidiaries’ business, financial condition or results of operations cannot be predicted. The majority of these changes will be implemented over time by various regulatory agencies. The full effect that these changes will have on us and our subsidiaries remains uncertain at this time and may have a material adverse effect on the Company’s business and results of operations.
Effect on Economic Environment
The policies of regulatory authorities, including the monetary policy of the Federal Reserve, have a significant effect on the operating results of bank holding companies and their subsidiaries. Among the means available to the Federal Reserve to affect the money supply are open market operations in U.S. government securities, changes in the discount rate on borrowings and changes in reserve requirements with respect to deposits. These means are used in varying combinations to influence overall growth and distribution of bank loans, investments and deposits, and their use may affect interest rates charged on loans or paid for deposits. Federal Reserve monetary policies have materially affected the operating results of commercial banks in the past and are expected to continue to do so in the future. The Company cannot predict the nature of future monetary policies and the effect of such policies on its business and earnings.
ITEM 1A. RISK FACTORS
Investing in our common stock involves a high degree of risk. Before you decide to invest in our common stock, you should carefully consider the risks described below, together with all other information included in this Annual Report on Form 10‑K, including the disclosures in “Item 7. Management’s Discussion and Analysis of Financial Condition and Results of Operations” and our consolidated financial statements and the related notes included in “Item 8. Financial Statements and Supplementary Data.” We believe the risks described below are the risks that are material to us as of the date of this Annual Report on Form 10‑K. If any of the following risks actually occur, our business, financial condition, results of operations and growth prospects could be materially and adversely affected. In that case, you could experience a partial or complete loss of your investment.
Risks Related to Veritex’s Business
Veritex’s business concentration in Texas, and specifically the Dallas-Fort Worth metroplex and the Houston metropolitan area, imposes risks and may magnify the consequences of any regional or local economic downturn affecting the Dallas-Fort Worth metroplex and the Houston metropolitan area, including any downturn in the real estate sector.
Veritex primarily conducts operations in the Dallas-Fort Worth metroplex and the Houston metropolitan area. As of December 31, 2017, the substantial majority of the loans in Veritex’s loan portfolio were made to borrowers who live and/or conduct business in the Dallas-Fort Worth metroplex and the Houston metropolitan area and the substantial majority of secured loans were secured by collateral located in the Dallas-Fort Worth metroplex and the Houston metropolitan area. Accordingly, Veritex is significantly exposed to risks associated with a lack of geographic diversification. The economic conditions in the Dallas-Fort Worth metroplex and the Houston metropolitan area are highly dependent on the real estate sector as well as the technology, financial services, insurance, transportation, manufacturing and energy sectors. Any downturn or adverse development in these sectors, particularly the real estate sector, or a decline in the value of single-family homes in the Dallas-Fort Worth metroplex and the Houston metropolitan area, could have a material adverse impact on Veritex’s business, financial condition and results of operations, and future prospects. Any adverse economic developments, among other things, could negatively affect the volume of loan originations, increase the level of nonperforming assets, increase the rate of foreclosure losses on loans and reduce the value of loans in Veritex’s portfolio. Volatility in oil prices may have an impact on the economic conditions in the markets in which we operate. Any regional or local economic downturn that affects (1) existing or prospective borrowers, (2) the Dallas-Fort Worth metroplex or Houston metropolitan area or (3) property values in its market areas, may affect Veritex and its profitability more significantly and more adversely than its competitors whose operations are less geographically focused.
17
Uncertain market conditions and economic trends could adversely affect Veritex’s business, financial condition and results of operations.
Veritex operates in an uncertain economic environment, including generally uncertain conditions nationally and locally in its industry and market. Financial institutions continue to be affected by volatility in the real estate market in some parts of the country and uncertain regulatory and interest rate conditions. Veritex retains direct exposure to the residential and commercial real estate market in Texas, particularly in the Dallas-Fort Worth metroplex and Houston metropolitan area, and is affected by these events.
Veritex’s ability to assess the creditworthiness of customers and to estimate the losses inherent in its loan portfolio is made more complex by uncertain market and economic conditions. Veritex’s risk management practices, such as monitoring the concentration of its loans within specific industries and its credit approval practices, may not adequately reduce credit risk, and its credit administration personnel, policies and procedures may not adequately adapt to changes in economic or any other conditions affecting customers and the quality of the loan portfolio. A national economic recession or deterioration of conditions in Veritex’s market could drive losses beyond that which is provided for in its allowance for loan losses and result in one or more of the following consequences:
• | increases in loan delinquencies; |
• | increases in nonperforming assets and foreclosures; |
• | decreases in demand for Veritex’s products and services, which could adversely affect its liquidity position; and |
• | decreases in the value of the collateral securing Veritex’s loans, especially real estate, which could reduce customers’ borrowing power and repayment ability |
Declines in real estate values, volume of home sales and financial stress on borrowers as a result of the uncertain economic environment, including job losses, could have an adverse effect on Veritex’s borrowers and/or their customers, which could adversely affect Veritex’s business, financial condition and results of operations.
Interest rate shifts could reduce net interest income and otherwise negatively impact Veritex’s financial condition and results of operations.
The majority of Veritex’s banking assets are monetary in nature and subject to risk from changes in interest rates. Like most financial institutions, Veritex’s earnings and cash flows depend to a great extent upon the level of net interest income, or the difference between the interest income earned on loans, investments and other interest-earning assets, and the interest paid on interest-bearing liabilities, such as deposits and borrowings. Changes in interest rates can increase or decrease net interest income because different types of assets and liabilities may react differently, and at different times, to market interest rate changes. When interest-bearing liabilities mature or reprice more quickly, or to a greater degree than interest-earning assets in a period, an increase in interest rates could reduce net interest income. Similarly, when interest-earning assets mature or reprice more quickly, or to a greater degree than interest-bearing liabilities, falling interest rates could reduce net interest income. Veritex’s interest sensitivity profile was asset sensitive as of December 31, 2017, meaning that it estimates net interest income would increase more from rising interest rates than from falling interest rates.
Additionally, an increase in interest rates may, among other things, reduce the demand for loans and Veritex’s ability to originate loans and decrease loan repayment rates. A decrease in the general level of interest rates may affect Veritex through, among other things, increased prepayments on its loan portfolio and increased competition for deposits. Accordingly, changes in the level of market interest rates affect Veritex’s net yield on interest-earning assets, loan origination volume, loan portfolio and overall results. Although Veritex’s asset-liability management strategy is designed to control and mitigate exposure to the risks related to changes in market interest rates, those rates are affected by many factors outside of Veritex’s control, including governmental monetary policies, inflation, deflation, recession, changes in unemployment, the money supply, international disorder and instability in domestic and foreign financial markets.
18
Additionally, interest rate increases often result in larger payment requirements for our borrowers, which increases the potential for default and could result in a decrease in the demand for loans. At the same time, the marketability of the property securing a loan may be adversely affected by any reduced demand resulting from higher interest rates. In a declining interest rate environment, there may be an increase in prepayments on loans as borrowers refinance their loans at lower rates. In addition, in a low interest rate environment, loan customers often pursue long-term fixed rate credits, which could adversely affect our earnings and net interest margin if rates increase. Changes in interest rates also can affect the value of loans, securities and other assets. An increase in interest rates that adversely affects the ability of borrowers to pay the principal or interest on loans may lead to an increase in nonperforming assets and a reduction of income recognized, which could have a material adverse effect on our results of operations and cash flows. Further, when Veritex places a loan on nonaccrual status, Veritex reverses any accrued but unpaid interest receivable, which decreases interest income. At the same time, Veritex continues to have a cost to fund the loan, which is reflected as interest expense, without any interest income to offset the associated funding expense. Thus, an increase in the amount of nonperforming assets would have an adverse impact on Veritex’s net interest income.
Significant increases of nonperforming assets from the current level, or greater than anticipated costs to resolve these credits, will have an adverse effect on Veritex’s earnings.
Veritex’s nonperforming assets, which consist of non-accrual loans, assets acquired through foreclosure and troubled debt restructurings (TDRs) adversely affect our net income in various ways. Veritex does not record interest income on nonaccrual loans and assets acquired through foreclosure. Veritex must establish an allowance for loan losses which reserves for losses inherent in the loan portfolio that are both probable and reasonably estimable. From time to time, Veritex also writes down the value of properties in our portfolio of assets acquired through foreclosure to reflect changing market values. Additionally, there are legal fees associated with the resolution of problem assets as well as carrying costs such as taxes, insurance and maintenance related to assets acquired through foreclosure. The resolution of nonperforming assets requires the active involvement of management, which can distract management from daily operations and other income producing activities. Finally, if Veritex’s estimate of the allowance for loan losses is inadequate, Veritex will have to increase the allowance for loan losses accordingly, which will have an adverse effect on Veritex’s earnings. Significant increases in the level of Veritex’s nonperforming assets from the current level, or greater than anticipated costs to resolve these credits, will have an adverse effect on Veritex’s earnings.
The small to medium-sized businesses that Veritex lends to may have fewer resources to weather adverse business developments, which may impair a borrower’s ability to repay a loan, and such impairment could adversely affect Veritex’s results of operations and financial condition.
Veritex focuses its business development and marketing strategy primarily on small to medium-sized businesses. Small to medium-sized businesses frequently have smaller market shares than their competition, may be more vulnerable to economic downturns, often need substantial additional capital to expand or compete and may experience substantial volatility in operating results, any of which characteristics may impair a borrower’s ability to repay a loan. In addition, the success of a small and medium-sized business often depends on the management skills, talents and efforts of one or two people or a small group of people, and the death, disability or resignation of one or more of these people could have a material adverse impact on the business and its ability to repay its loan. If general economic conditions negatively impact the Dallas-Fort Worth metroplex, Houston metropolitan area, or Texas generally and small to medium-sized businesses are adversely affected or Veritex’s borrowers are otherwise affected by adverse business developments, Veritex’s business, financial condition and results of operations could be adversely affected.
Veritex’s allowance for loan losses may prove to be insufficient to absorb potential losses in its loan portfolio, which could adversely affect Veritex’s business, financial condition and results of operations.
Veritex establishes an allowance for loan losses and maintains it at a level considered adequate by management to absorb probable loan losses based on its analysis of the loan portfolio and market environment. The allowance for loan losses represents Veritex’s estimate of probable losses in the portfolio at each balance sheet date and is based upon relevant information available to Veritex. Veritex’s allowance for loan losses consists of a general component based upon probable but unidentified losses inherent in the portfolio and a specific component based on individual loans that are considered impaired. The general component is based on various factors including historical loss experience, historical loss experience for peer banks, growth trends, loan concentrations, migration trends between internal loan risk ratings, current economic conditions and other qualitative factors. The specific component of the allowance for loan losses is calculated based on a review of individual loans considered impaired. The analysis of impaired losses may be based on the present value of expected future cash flows discounted at the effective loan rate, an observable market price or the fair value of the underlying collateral on collateral dependent loans. In determining the collectability of certain loans, management also considers the fair value of any underlying collateral. The amount ultimately realized may differ from the carrying value of these assets because of economic, operating or other conditions beyond Veritex’s control, and any such differences may be material.
19
As of December 31, 2017, Veritex’s allowance for loan losses was 0.57% of its total loans. Loans acquired are initially recorded at fair value, which includes an estimate of credit losses expected to be realized over the remaining lives of the loans, and therefore no corresponding allowance for loan losses is recorded for these loans at acquisition. Additional loan losses may occur in the future and may occur at a rate greater than Veritex has previously experienced. Veritex may be required to take additional provisions for loan losses in the future to further supplement the allowance for loan losses, either due to management’s decision to do so or requirements by its banking regulators. In addition, bank regulatory agencies will periodically review the allowance for loan losses and the value attributed to non-accrual loans or to real estate acquired through foreclosure. Such regulatory agencies may require Veritex to recognize future charge-offs. These adjustments could adversely affect Veritex’s business, financial condition and results of operations.
Veritex may be unable to implement aspects of its growth strategy, which may affect its ability to maintain historical earnings trends.
Veritex’s business has grown rapidly. Financial institutions that grow rapidly can experience significant difficulties as a result of rapid growth. Furthermore, Veritex’s strategy focuses on organic growth, supplemented by acquisitions. Veritex may be unable to execute on aspects of its growth strategy to sustain its historical rate of growth or may be unable to grow at all. More specifically, Veritex may be unable to generate sufficient new loans and deposits within acceptable risk and expense tolerances, obtain the personnel or funding necessary for additional growth or find suitable acquisition candidates. Various factors, such as economic conditions and competition, may impede or prohibit the growth of Veritex’s operations, the opening of new branches and the consummation of acquisitions. Further, Veritex may be unable to attract and retain experienced bankers, which could adversely affect its growth. The success of Veritex’s strategy also depends on its ability to effectively manage growth, which is dependent upon a number of factors, including the ability to adapt existing credit, operational, technology and governance infrastructure to accommodate expanded operations. If Veritex fails to build infrastructure sufficient to support rapid growth or fails to implement one or more aspects of its strategy, Veritex may be unable to maintain historical earnings trends, which could have an adverse effect on Veritex’s business, financial condition and results of operations.
Veritex’s strategy of pursuing acquisitions exposes it to financial, execution and operational risks that could have a material adverse effect on its business, financial condition, results of operations and growth prospects.
Veritex intends to continue pursuing a strategy that includes acquisitions. An acquisition strategy involves significant risks, including the following:
• | finding suitable candidates for acquisition; |
• | attracting funding to support additional growth within acceptable risk tolerances; |
• | maintaining asset quality; |
• | retaining customers and key personnel, including bankers; |
• | obtaining necessary regulatory approvals, which Veritex may have difficulty obtaining or be unable to obtain; |
• | conducting adequate due diligence and managing known and unknown risks and uncertainties; |
• | integrating acquired businesses; and |
• | maintaining adequate regulatory capital |
The market for acquisition targets is highly competitive, which may adversely affect Veritex’s ability to find acquisition candidates that fit its strategy and standards. Veritex faces significant competition in pursuing acquisition targets from other banks and financial institutions, many of which possess greater financial, human, technical and other resources than Veritex. Veritex’s ability to compete in acquiring target institutions will depend on the financial resources available to fund the acquisitions, including the amount of cash and cash equivalents and the liquidity and market price of Veritex common stock. In addition, increased competition may also drive up the acquisition consideration that Veritex will be required to pay in order to successfully capitalize on attractive acquisition opportunities. To the extent that Veritex is unable to find suitable acquisition targets, an important component of its growth strategy may not be realized.
20
Acquisitions of financial institutions also involve operational risks and uncertainties, such as unknown or contingent liabilities with no available manner of recourse, exposure to unexpected problems such as asset quality, the retention of key employees and customers and other issues that could negatively affect Veritex’s business. Veritex may not be able to complete future acquisitions or, if completed, may not be able to successfully integrate the operations, technology platforms, management, products and services of the entities acquired or realize a reduction of redundancies. The integration process may also require significant time and attention from Veritex’s management that would otherwise be directed toward servicing existing business and developing new business. Failure to successfully integrate the entities Veritex acquires into its existing operations in a timely manner may increase its operating costs significantly and adversely affect Veritex’s business, financial condition and results of operations. Further, acquisitions typically involve the payment of a premium over book and market values and, therefore, some dilution of Veritex’s tangible book value and net income per common share may occur in connection with any future acquisition, and the carrying amount of any goodwill that is currently maintained or that may be acquired may be subject to impairment in future periods.
Veritex’s ability to retain bankers and recruit additional successful bankers is critical to the success of its business strategy, and any failure to do so could adversely affect Veritex’s business, financial condition, results of operations and growth prospects.
Veritex’s ability to retain and grow loans, deposits and fee income depends upon the business generation capabilities, reputation and relationship management skills of its bankers. If Veritex were to lose the services of any of its bankers, including successful bankers employed by banks that Veritex may acquire, to a new or existing competitor or otherwise, Veritex may not be able to retain valuable relationships and some of its customers could choose to use the services of a competitor instead.
Veritex’s growth strategy also relies on its ability to attract and retain additional profitable bankers. Veritex may face difficulties in recruiting and retaining bankers of the desired caliber, including as a result of competition from other financial institutions. In particular, many of Veritex’s competitors are significantly larger with greater financial resources, and may be able to offer more attractive compensation packages and broader career opportunities. Additionally, Veritex may incur significant expenses and expend significant time and resources on training, integration and business development before it is able to determine whether a new banker will be profitable or effective. If Veritex is unable to attract and retain successful bankers, or if its bankers fail to meet expectations in terms of customer relationships and profitability, Veritex may be unable to execute its business strategy and its business, financial condition, results of operations and growth prospects may be adversely affected.
Loss of any of Veritex’s executive officers or other key employees could impair relationships with its customers and adversely affect its business.
Veritex’s success is dependent upon the continued service and skills of its executive management team. Veritex’s goals, strategies and marketing efforts are closely tied to the banking philosophy and strengths of its executive management team. Veritex’s success is also dependent in part on the continued service of its market presidents and relationship managers. The loss of any of these key personnel could adversely affect Veritex’s business because of their skills, years of industry experience, relationships with customers and the difficulty of promptly finding qualified replacement personnel. Veritex cannot guarantee that these executive officers or key employees will continue to be employed with them in the future.
The relatively unseasoned nature of a significant portion of Veritex’s loan portfolio may expose it to increased credit risks.
The business of lending is inherently risky, including risks that the principal of or interest on any loan will not be repaid timely or at all or that the value of any collateral supporting the loan will be insufficient to cover Veritex’s outstanding exposure. Veritex’s loan portfolio has grown to $2.2 billion as of December 31, 2017, from $100.9 million as of December 31, 2010.This growth is related to both organic growth and loans acquired in connection with acquisitions. The organic portion of this increase is due to increased loan production in the Texas markets in which we operate. It is difficult to assess the future performance of acquired or recently originated loans because Veritex’s relatively limited experience with such loans does not provide it with a significant payment history from which to judge future collectability. These loans may experience higher delinquency or charge-off levels than Veritex’s historical loan portfolio experience, which could adversely affect Veritex’s business, financial condition and results of operations.
21
A large portion of Veritex’s loan portfolio consists of commercial loans secured by receivables, promissory notes, inventory, equipment or other commercial collateral, the deterioration in value of which could increase the potential for future losses.
As of December 31, 2017, $684.6 million or 30.6% of Veritex’s total loans, consisted of commercial loans to businesses. In general, these loans are collateralized by general business assets including, among other things, accounts receivable, promissory notes, inventory and equipment and most are backed by a personal guaranty of the borrower or principal. These commercial loans are typically larger in amount than loans to individuals and, therefore, have the potential for larger losses on a single loan basis. Additionally, the repayment of commercial loans is subject to the ongoing business operations of the borrower. The collateral securing such loans generally includes moveable property such as equipment and inventory, which may decline in value more rapidly than Veritex anticipates exposing it to increased credit risk. A significant portion of Veritex’s commercial loans are secured by promissory notes that evidence loans made by Veritex to borrowers that in turn make loans to others that are secured by real estate. Accordingly, negative changes in the economy affecting real estate values and liquidity could impair the value of the collateral securing these loans. Significant adverse changes in the economy or local market conditions in which Veritex’s commercial lending customers operate could cause rapid declines in loan collectability and the values associated with general business assets resulting in inadequate collateral coverage that may expose Veritex to credit losses and could adversely affect its business, financial condition and results of operations.
Veritex’s commercial real estate and construction and land loan portfolios expose it to credit risks that could be greater than the risks related to other types of loans.
As of December 31, 2017, $909.3 million, or 40.7% of total loans, consisted of commercial real estate loans (including owner occupied commercial real estate loans) and $277.8 million, or 12.4% of total loans, consisted of construction and land loans. These loans typically involve repayment dependent upon income generated, or expected to be generated, by the property securing the loan in amounts sufficient to cover operating expenses and debt service. The availability of such income for repayment may be adversely affected by changes in the economy or local market conditions. These loans expose a lender to greater credit risk than loans secured by other types of collateral because the collateral securing these loans is typically more difficult to liquidate due to the fluctuation of real estate values. Additionally, non-owner occupied commercial real estate loans generally involve relatively large balances to single borrowers or related groups of borrowers. Unexpected deterioration in the credit quality of Veritex’s non-owner occupied commercial real estate loan portfolio could require it to increase the allowance for loan losses, which would reduce profitability and could have a material adverse effect on Veritex’s business, financial condition and results of operations.
Construction and land loans also involve risks attributable to the fact that loan funds are secured by a project under construction, and the project is of uncertain value prior to its completion. It can be difficult to accurately evaluate the total funds required to complete a project, and construction lending often involves the disbursement of substantial funds with repayment dependent, in part, on the success of the ultimate project rather than the ability of a borrower or guarantor to repay the loan. If Veritex is forced to foreclose on a project prior to completion, it may be unable to recover the entire unpaid portion of the loan. In addition, Veritex may be required to fund additional amounts to complete a project and may have to hold the property for an indeterminate period of time, any of which could adversely affect Veritex’s business, financial condition and results of operations.
Because a significant portion of its loan portfolio consists of real estate loans, negative changes in the economy affecting real estate values and liquidity could impair the value of collateral securing Veritex’s real estate loans and result in loan and other losses.
As of December 31, 2017, $1.5 billion, or 68.9% of total loans, consisted of loans with real estate as a primary or secondary component of collateral. As a result, adverse developments affecting real estate values in the Texas markets in which we operate could increase the credit risk associated with Veritex’s real estate loan portfolio. Real estate values in many Texas markets have experienced periods of fluctuation over the last five years. The market value of real estate can fluctuate significantly in a short period of time. Adverse changes affecting real estate values and the liquidity of real estate in one or more of Veritex’s markets could increase the credit risk associated with Veritex’s loan portfolio, and could result in losses that adversely affect credit quality, financial condition, and results of operation. Negative changes in the economy affecting real estate values and liquidity in Veritex’s market areas could significantly impair the value of property pledged as collateral on loans and affect its ability to sell the collateral upon foreclosure without a loss or additional losses. Collateral may have to be sold for less than the outstanding balance of the loan, which could result in losses on such loans. Such declines and losses could have a material adverse impact on Veritex’s business, results of operations and growth prospects. If real estate values decline, it is also more likely that Veritex would be required to increase the allowance for loan losses, which could adversely affect its business, financial condition and results of operations.
22
Veritex may be subject to environmental liabilities in connection with the foreclosure on real estate assets securing its loan portfolio.
Hazardous or toxic substances or other environmental hazards may be located on the properties that secure Veritex’s loans. If Veritex acquires such properties as a result of foreclosure or otherwise, it could become subject to various environmental liabilities. For example, Veritex could be held liable for the cost of cleaning up or otherwise addressing contamination at or from these properties. Veritex could also be held liable to a governmental entity or third party for property damage, personal injury or other claims relating to any environmental contamination at or from these properties. In addition, Veritex owns and operates certain properties that may be subject to similar environmental liability risks. Although Veritex has policies and procedures that are designed to mitigate against certain environmental risks, it may not detect all environmental hazards associated with these properties. If Veritex were to become subject to significant environmental liabilities, its business, financial condition and results of operations could be adversely affected.
Veritex has a concentration of loans outstanding to a limited number of borrowers, which may increase its risk of loss.
Veritex has extended significant amounts of credit to a limited number of borrowers, and as of December 31, 2017, the aggregate amount of loans to its 10 and 25 largest borrowers (including related entities) amounted to $212.5 million, or 9.5% of total loans, and $437.8 million, or 19.6% of total loans, respectively. As of such date, none of these loans were nonperforming loans. Concentration of a significant amount of credit extended to a limited number of borrowers increases the risk in Veritex’s loan portfolio. If one or more of these borrowers is unable to make payments of interest and principal in respect of such loans, the potential loss to Veritex is more likely to have a material adverse effect on its business, financial condition and results of operations.
A lack of liquidity could impair Veritex’s ability to fund operations and adversely affect its operations and jeopardize its business, financial condition, and results of operations.
Liquidity is essential to Veritex’s business. Veritex relies on its ability to generate deposits and effectively manage the repayment and maturity schedules of loans and investment securities, respectively, to ensure that it has adequate liquidity to fund operations. An inability to raise funds through deposits, borrowings, the sale of Veritex’s investment securities, the sale of loans and other sources could have a substantial negative effect on its liquidity.
Veritex’s most important source of funds is core deposits. Core deposit balances can decrease when customers perceive alternative investments as providing a better risk/return tradeoff. If customers move money out of bank deposits and into other investments such as money market funds, Veritex would lose a relatively low-cost source of funds, increasing funding costs and reducing net interest income and net income.
Other primary sources of funds consist of cash flows from operations, maturities and sales of investment securities, and proceeds from the issuance and sale of Veritex equity and debt securities to investors. Additional liquidity is provided by the ability to borrow from Veritex’s brokered deposit network, which includes the Federal Home Loan Bank of Dallas, or the FHLB, and the Federal Reserve Bank of Dallas, or the FRB. Veritex also may borrow funds from third-party lenders, such as other financial institutions. Access to funding sources in amounts adequate to finance or capitalize its activities, or on acceptable terms, could be impaired by factors that affect Veritex directly or the financial services industry or economy in general, such as disruptions in the financial markets or negative views and expectations about the prospects for the financial services industry. Veritex’s access to funding sources could also be affected by a decrease in the level of business activity as a result of a downturn in the Dallas-Fort Worth metroplex or by one or more adverse regulatory actions against it.
Any decline in available funding could adversely impact Veritex’s ability to originate loans, invest in securities, meet its expenses or fulfill obligations such as repaying borrowings or meeting deposit withdrawal demands, any of which could have a material adverse impact on liquidity and could, in turn, adversely affect Veritex’s business, financial condition and results of operations.
23
Veritex has a limited operating history and, accordingly, investors will have little basis on which to evaluate its ability to achieve its business objectives.
Veritex was formed as a bank holding company in 2009 and commenced banking operations in 2010. Accordingly, Veritex has a limited operating history upon which to evaluate its business and future prospects. As a result, it is difficult, if not impossible, to predict future operating results and to assess the likelihood of the success of Veritex’s business. As a relatively young financial institution, Veritex Bank is also subject to risks and levels of risk that are often greater than those encountered by financial institutions with longer established operations and relationships. New financial institutions often require significant capital from sources other than operations. Since Veritex is a relatively young financial institution, its management team and employees will shoulder the burdens of the business operations and a workload associated with business growth and capitalization that is disproportionately greater than a more mature, established financial institution.
Veritex may need to raise additional capital in the future, and if it fails to maintain sufficient capital, whether due to losses, an inability to raise additional capital or otherwise, Veritex’s financial condition, liquidity and results of operations, as well as the ability to maintain regulatory compliance, could be adversely affected.
Veritex faces significant capital and other regulatory requirements as a financial institution. Veritex may need to raise additional capital in the future to provide sufficient capital resources and liquidity to meet its commitments and business needs, which could include the possibility of financing acquisitions. In addition, Veritex, on a consolidated basis, and Veritex Bank, on a stand-alone basis, must meet certain regulatory capital requirements and maintain sufficient liquidity. Importantly, regulatory capital requirements could increase from current levels, which could require Veritex to raise additional capital or reduce its operations. Veritex’s ability to raise additional capital depends on conditions in the capital markets, economic conditions and a number of other factors, including investor perceptions regarding the banking industry, market conditions and governmental activities, and on Veritex’s financial condition and performance. Accordingly, Veritex may be unable to raise additional capital if needed or on acceptable terms. If Veritex fails to maintain capital to meet regulatory requirements, its liquidity, business, financial condition and results of operations could be adversely affected.
Veritex could recognize losses on investment securities held in its securities portfolio, particularly if interest rates increase or economic and market conditions deteriorate.
While Veritex attempts to invest a significant percentage of its assets in loans (its loan to deposit ratio was 98.0% as of December 31, 2017), it also invests a percentage of its total assets in investment securities (7.7% as of December 31, 2017) with the primary objectives of providing a source of liquidity, providing an appropriate return on funds invested, managing interest rate risk, meeting pledging requirements and meeting regulatory capital requirements. As of December 31, 2017, the fair value of Veritex’s securities portfolio was $228.1 million, which included a net unrealized loss of $1.6 million. Factors beyond Veritex’s control can significantly influence the fair value of securities in its portfolio and can cause potential adverse changes to the fair value of these securities. For example, fixed-rate securities are generally subject to decreases in market value when interest rates rise. Additional factors include, but are not limited to, rating agency downgrades of the securities, defaults by the issuer or individual borrowers with respect to the underlying securities, and continued instability in the credit markets. Any of the foregoing factors could cause other-than-temporary impairment in future periods and result in realized losses. The process for determining whether impairment is other-than-temporary usually requires difficult, subjective judgments about the future financial performance of the issuer and any collateral underlying the security in order to assess the probability of receiving all contractual principal and interest payments on the security. Because of changing economic and market conditions affecting interest rates, the financial condition of issuers of the securities and the performance of the underlying collateral, Veritex may recognize realized and/or unrealized losses in future periods, which could have an adverse effect on its business, financial condition and results of operations.
24
Veritex faces strong competition from financial services companies and other companies that offer banking services, which could adversely affect its business, financial condition, and results of operations.
Veritex conducts operations exclusively in Texas and particularly in the Dallas-Fort Worth metroplex and Houston metropolitan area. Many of Veritex’s competitors offer the same, or a wider variety of, banking services within the same market area. These competitors include banks with nationwide operations, regional banks and other community banks. Veritex also faces competition from many other types of financial institutions, including savings banks, credit unions, finance companies, mutual funds, insurance companies, brokerage and investment banking firms, asset-based non-bank lenders and certain other non-financial entities, such as retail stores which may maintain their own credit programs and certain governmental organizations which may offer more favorable financing or deposit terms than Veritex can. In addition, a number of out-of-state financial intermediaries have opened production offices, or otherwise solicit deposits, in its market area. Increased competition in Veritex’s market may result in reduced loans and deposits, as well as reduced net interest margin, fee income and profitability. Ultimately, Veritex may not be able to compete successfully against current and future competitors. If it is unable to attract and retain banking customers, Veritex may be unable to continue to grow loan and deposit portfolios, and its business, financial condition and results of operations could be adversely affected.
Veritex’s ability to compete successfully depends on a number of factors, including, among other things:
• | the ability to develop, maintain and build long‑term customer relationships based on top quality service, high ethical standards and safe, sound assets; |
• | the scope, relevance and pricing of products and services offered to meet customer needs and demands; |
• | the rate at which Veritex introduces new products and services relative to its competitors; |
• | customer satisfaction with Veritex’s level of service; |
• | the ability to expand Veritex’s market position; and |
• | industry and general economic trends. |
Failure to perform in any of these areas could significantly weaken Veritex’s competitive position, which could adversely affect its growth and profitability, which, in turn, could adversely effect its business, financial condition and results of operations.
Negative public opinion regarding Veritex or Veritex’s failure to maintain its reputation in the community could adversely affect its business and prevent Veritex from continuing to grow its business.
As a community bank, Veritex’s reputation within the community it serves is critical to its success. Veritex strives to enhance its reputation by recruiting, hiring and retaining employees who share its core values of being an integral part of the communities Veritex serves and delivering superior service to its customers. If Veritex’s reputation is negatively affected by the actions of its employees or otherwise, Veritex may be less successful in attracting new customers, and its business, financial condition, results of operations and prospects could be materially and adversely affected. Further, negative public opinion can expose Veritex to litigation and regulatory action as it seeks to implement its growth strategy.
25
If Veritex fails to maintain an effective system of disclosure controls and procedures and internal control over financial reporting, it may not be able to accurately report its financial results or prevent fraud.
Ensuring that Veritex has adequate disclosure controls and procedures, including internal control over financial reporting, in place so that it can produce accurate financial statements on a timely basis is costly and time-consuming and needs to be reevaluated frequently. Veritex is in the process of documenting, reviewing and, if appropriate, improving its internal controls and procedures since becoming a public company and being subject to the requirements of Section 404 of the Sarbanes-Oxley Act of 2002, or the Sarbanes-Oxley Act, which requires annual management assessments of the effectiveness of its internal control over financial reporting and, when Veritex ceases to be an emerging growth company under the JOBS Act, a report by its independent auditors addressing these assessments. Veritex’s management may conclude that its internal control over financial reporting is not effective due to its failure to cure any identified material weakness or otherwise. Moreover, even if Veritex’s management concludes that its internal control over financial reporting is effective, Veritex’s independent registered public accounting firm may not conclude that its internal control over financial reporting is effective. In the future, Veritex’s independent registered public accounting firm may not be satisfied with its internal control over financial reporting or the level at which its controls are documented, designed, operated or reviewed, or it may interpret the relevant requirements differently from Veritex. In addition, during the course of the evaluation, documentation and testing of Veritex’s internal control over financial reporting, Veritex may identify deficiencies that it may not be able to remediate in time to meet the deadline imposed by the SEC for compliance with the requirements of Section 404 of the Sarbanes-Oxley Act. Any such deficiencies may also subject Veritex to adverse regulatory consequences. If Veritex fails to achieve and maintain the adequacy of its internal control over financial reporting, as these standards are modified, supplemented or amended from time to time, Veritex may be unable to report its financial information on a timely basis, it may not be able to conclude on an ongoing basis that it has effective internal control over financial reporting in accordance with the Sarbanes-Oxley Act, and it may suffer adverse regulatory consequences or violations of listing standards. There could also be a negative reaction in the financial markets due to a loss of investor confidence in the reliability of Veritex’s financial statements.
Veritex is subject to certain operational risks, including, but not limited to, customer or employee fraud and data processing system failures and errors.
Employee errors and employee or customer misconduct could subject Veritex to financial losses or regulatory sanctions and seriously harm its reputation. Misconduct by Veritex’s employees could include hiding unauthorized activities, improper or unauthorized activities on behalf of customers or improper use of confidential information. It is not always possible to prevent employee errors and misconduct, and the precautions Veritex takes to prevent and detect this activity may not be effective in all cases. Employee errors could also subject Veritex to financial claims for negligence.
Veritex maintains a system of internal controls to mitigate against operational risks, including data processing system failures and errors and customer or employee fraud, as well as insurance coverage designed to protect it from material losses associated with these risks including losses resulting from any associated business interruption. If these internal controls fail to prevent or detect an occurrence, or if any resulting loss is not insured or exceeds applicable insurance limits, it could adversely affect Veritex’s business, financial condition and results of operations.
In addition, Veritex relies heavily upon information supplied by third parties, including the information contained in credit applications, property appraisals, title information, equipment pricing and valuation and employment and income documentation, in deciding which loans to originate, as well as the terms of those loans. If any of the information upon which Veritex relies is misrepresented, either fraudulently or inadvertently, and the misrepresentation is not detected prior to loan funding, the value of the loan may be significantly lower than expected, or Veritex may fund a loan that it would not have funded or on terms it would not have extended. Whether a misrepresentation is made by the applicant or another third party, Veritex will generally bear the risk of loss associated with the misrepresentation. A loan subject to a material misrepresentation is typically unsellable or subject to repurchase if it is sold prior to detection of the misrepresentation. The sources of the misrepresentations are often difficult to locate, and recovery of any of the resulting monetary losses Veritex may suffer could be difficult.
26
Veritex has a continuing need for technological change and may not have the resources to effectively implement new technology, or may experience operational challenges when implementing new technology.
The financial services industry is undergoing rapid technological changes with frequent introductions of new technology-driven products and services. In addition to better serving customers, the effective use of technology increases efficiency and enables financial institutions to reduce costs. Veritex’s future success will depend, at least in part, upon its ability to address the needs of customers by using technology to provide products and services that will satisfy customer demands for convenience as well as to create additional efficiencies in operations as it continues to grow and expand the products and services offered. Veritex may experience operational challenges as it implements these new technology enhancements or products, which could result in an inability to fully realize the anticipated benefits from such new technology or significant costs to remedy any such challenges in a timely manner.
Many of Veritex’s larger competitors have substantially greater resources to invest in technological improvements. As a result, they may be able to offer additional or superior products compared to those that Veritex will be able to provide, which would put it at a competitive disadvantage. Accordingly, Veritex may lose customers seeking new technology-driven products and services to the extent it is unable to provide such products and services.
Veritex’s operations could be interrupted if third-party service providers experience difficulty, terminate their services or fail to comply with banking regulations.
Veritex depends on a number of relationships with third-party service providers. Specifically, Veritex receives certain third-party services including, but not limited to, core systems processing, essential web hosting and other Internet systems, online banking services, deposit processing and other processing services. Veritex’s operations could be interrupted if any of these third-party service providers experience difficulties, or terminate their services, and Veritex is unable to replace them with other service providers, particularly on a timely basis. If an interruption were to continue for a significant period of time, Veritex’s business, financial condition and results of operations could be adversely affected, perhaps materially. Even if Veritex is able to replace third-party service providers, it may be at a higher cost to it, which could adversely affect its business, financial condition and results of operations.
System failure or breaches of Veritex’s network security could subject it to increased operating costs as well as litigation and other liabilities.
The computer systems and network infrastructure Veritex uses, including the systems and infrastructure of third-party service providers, could be vulnerable to unforeseen problems. Veritex’s operations are dependent upon its ability to protect its computer equipment, and the information stored therein, against damage from physical theft, fire, power loss, telecommunications failure or a similar catastrophic event, as well as from security breaches, denial of service attacks, viruses, worms and other disruptive problems caused by hackers. Any damage or failure that causes breakdowns or disruptions in Veritex’s general ledger, deposit, loan and other systems could damage its reputation, result in a loss of customer business, subject it to additional regulatory scrutiny, including enforcement action that could restrict its operations, or expose Veritex to civil litigation and possible financial liability, any of which could have a material adverse effect on it. Computer break-ins, phishing and other disruptions could also jeopardize the security of information stored in and transmitted through Veritex’s computer systems and network infrastructure, which may result in significant liability to Veritex and may cause existing and potential customers to refrain from doing business with Veritex. In addition, advances in computer capabilities could result in a compromise or breach of the systems Veritex and its third-party service providers use to encrypt and protect customer transaction data. A failure of such security measures could adversely affect Veritex’s business, financial condition and results of operations.
Consumers may decide not to use banks to complete their financial transactions.
Technology and other changes are allowing consumers to complete financial transactions through alternative methods that historically have involved banks. For example, consumers can now maintain funds that would have historically been held as bank deposits in brokerage accounts, mutual funds or general-purpose reloadable prepaid cards. Consumers can also complete transactions such as paying bills and transferring funds directly without the assistance of banks. The process of eliminating banks as intermediaries, which may increase as consumers become more comfortable with these new technologies and offerings, could result in the loss of fee income, as well as the loss of customer deposits and the related income generated from those deposits. The loss of these revenue streams and the lower cost of deposits as a source of funds could have a material adverse effect on our financial condition and results of operations.
27
If the goodwill that Veritex has recorded or may record in connection with a business acquisition becomes impaired, it could require charges to earnings, which would adversely effect its business, financial condition and results of operations.
Goodwill represents the amount by which the cost of an acquisition exceeded the fair value of net assets acquired in connection with the purchase of another financial institution. Veritex reviews goodwill for impairment at least annually, or more frequently if a triggering event occurs which indicates that the carrying value of the asset might be impaired. Veritex utilizes a two-step process to test for impairment of goodwill. Under the first step, the estimation of fair value of Veritex’s one reporting unit is compared to its carrying value including goodwill. If step one indicates a potential impairment, the second step is performed to measure the amount of impairment, if any. If the carrying amount of the reporting unit goodwill exceeds the implied fair value of that goodwill, an impairment loss is recognized in an amount equal to that excess. Any such adjustments are reflected in Veritex’s results of operations in the periods in which they become known. As of December 31, 2017, goodwill totaled $159.5 million. Although Veritex has not recorded any impairment charges since the goodwill was initially recorded, future evaluations of existing goodwill or goodwill acquired in the future may result in findings of impairment and related write-downs, which could adversely affect Veritex’s business, financial condition and results of operations.
Risks Related to Veritex’s Industry and Regulation
The ongoing implementation of the Dodd-Frank Act could adversely affect Veritex’s business, financial condition, and results of operations.
In July 2010, the Dodd-Frank Act was signed into law, and the process of implementation is ongoing. The Dodd-Frank Act imposed significant regulatory and compliance changes on many industries, including Veritex’s. Significant uncertainty continues to surround the manner in which the various regulatory agencies ultimately will implement the provisions of the Dodd-Frank Act, and the full extent of the impact of the requirements on Veritex’s operations is unclear. The changes resulting from the Dodd-Frank Act may impact the profitability of Veritex’s business activities, require changes to certain of its business practices, require the development of new compliance infrastructure, impose upon Veritex more stringent capital, liquidity and leverage requirements or otherwise adversely affect its business. These changes may also require Veritex to invest significant management attention and resources to evaluate and make any changes necessary to comply with new statutory and regulatory requirements. Failure to comply with the new requirements or with any future changes in laws or regulations could adversely affect Veritex’s business, financial condition and results of operations.
Veritex operates in a highly regulated environment and the laws and regulations that govern its operations, corporate governance, executive compensation and accounting principles, or changes in them, or failure to comply with them, could adversely affect Veritex’s business, financial condition and results of operations.
Veritex is subject to extensive regulation, supervision and legal requirements that govern almost all aspects of its operations. These laws and regulations are not intended to protect Veritex shareholders. Rather, these laws and regulations are intended to protect customers, depositors, the Deposit Insurance Fund, and the overall financial stability of the United States. These laws and regulations, among other matters, prescribe minimum capital requirements, impose limitations on the business activities in which Veritex can engage, limit the dividend or distributions that the Bank can pay to Veritex, restrict the ability of institutions to guarantee Veritex’s debt, and impose certain specific accounting requirements on Veritex that may be more restrictive and may result in greater or earlier charges to earnings or reductions in its capital than generally accepted accounting principles would require. Compliance with laws and regulations can be difficult and costly, and changes to laws and regulations often impose additional compliance costs. Veritex’s failure to comply with these laws and regulations, even if the failure follows good faith effort or reflects a difference in interpretation, could subject it to restrictions on its business activities, fines and other penalties, any of which could adversely affect its results of operations, capital base and the price of its securities. Further, any new laws, rules and regulations could make compliance more difficult or expensive or otherwise adversely affect Veritex’s business, financial condition and results of operations.
28
State and federal banking agencies periodically conduct examinations of Veritex’s business, including compliance with laws and regulations, and failure to comply with any supervisory actions to which Veritex is or may become subject as a result of such examinations could adversely affect Veritex’s business, financial condition and results of operations.
Texas and federal banking agencies, including the TDB and the Federal Reserve, periodically conduct examinations of Veritex’s business, including compliance with laws and regulations. If, as a result of an examination, a Texas or federal banking agency were to determine that the financial condition, capital resources, asset quality, earnings prospects, management, liquidity or other aspects of any of Veritex’s operations had become unsatisfactory, or that Veritex, the Bank or their respective management were in violation of any law or regulation, it may take a number of different remedial actions as it deems appropriate. These actions include the power to prohibit “unsafe or unsound” practices, to require affirmative actions to correct any conditions resulting from any violation or practice, to issue an administrative order that can be judicially enforced, to direct an increase in Veritex’s capital levels, to restrict its growth, to assess civil monetary penalties against Veritex, the Bank or their respective officers or directors, to remove officers and directors and to terminate the Bank’s deposit insurance upon notice and hearing. If Veritex becomes subject to such regulatory actions, its business, financial condition, results of operations and reputation could be adversely affected.
Many of Veritex’s new activities and expansion plans require regulatory approvals, and failure to obtain them may restrict future growth.
Veritex intends to complement and expand its business by pursuing strategic acquisitions of financial institutions and other complementary businesses. Generally, Veritex must receive state and federal regulatory approval before it can acquire a depository institution insured by the FDIC or related business. In determining whether to approve a proposed acquisition, federal banking regulators will consider, among other factors, the effect of the acquisition on competition, Veritex’s financial condition, its future prospects and the impact of the proposal on U.S. financial stability. The regulators also review current and projected capital ratios and levels, the competence, experience and integrity of management and its record of compliance with laws and regulations, the convenience and needs of the communities to be served (including the acquiring institution’s record of compliance under the CRA) and the effectiveness of the acquiring institution in combating money laundering activities. Such regulatory approvals may not be granted on terms that are acceptable to it, or at all. Veritex may also be required to sell branches as a condition to receiving regulatory approval, which condition may not be acceptable to it or, if acceptable to it, may reduce the benefit of any acquisition.
In addition to the acquisition of existing financial institutions, as opportunities arise, Veritex plans to continue de novo branching as a part of its organic growth strategy. De novo branching and any acquisitions carry with them numerous risks, including the inability to obtain all required regulatory approvals. The failure to obtain these regulatory approvals for potential future strategic acquisitions and de novo branches could impact Veritex’s business plans and restrict its growth.
Financial institutions, such as the Bank, face a risk of noncompliance and enforcement action with the Bank Secrecy Act and other anti-money laundering statutes and regulations.
The Bank Secrecy Act, the Uniting and Strengthening America by Providing Appropriate Tools Required to Intercept and Obstruct Terrorism Act of 2001, or the USA PATRIOT Act, and other laws and regulations require financial institutions, among other duties, to institute and maintain an effective anti-money laundering program and file suspicious activity and currency transaction reports as appropriate. The Financial Crimes Enforcement Network, established by the U.S. Department of the Treasury, or the Treasury Department, to administer the Bank Secrecy Act, is authorized to impose significant civil money penalties for violations of those requirements, and has recently engaged in coordinated enforcement efforts with the individual federal banking regulators, as well as the U.S. Department of Justice, Drug Enforcement Administration, and Internal Revenue Service. There is also increased scrutiny of compliance with the sanctions programs and rules administered and enforced by the Treasury Department’s Office of Foreign Assets Control.
In order to comply with regulations, guidelines and examination procedures in this area, Veritex has dedicated significant resources to its Bank Secrecy Act anti-money laundering programs. If its policies, procedures and systems are deemed deficient, Veritex could be subject to liability, including fines and regulatory actions such as restrictions on its ability to pay dividends and the necessity to obtain regulatory approvals to proceed with certain aspects of its business plans, including acquisitions and de novo branching.
29
Veritex is subject to the CRA and fair lending laws, and failure to comply with these laws could lead to material penalties.
The CRA, the Equal Credit Opportunity Act, the Fair Housing Act and other fair lending laws and regulations impose nondiscriminatory lending requirements on financial institutions. The CFPB, the Justice Department and other federal agencies are responsible for enforcing these laws and regulations. A successful challenge to an institution’s performance under the CRA or fair lending laws and regulations could result in a wide variety of sanctions, including the required payment of damages and civil money penalties, injunctive relief, imposition of restrictions on mergers and acquisitions activity, and restrictions on expansion activity. Private parties may also have the ability to challenge an institution’s performance under fair lending laws in private class action litigation.
The FDIC’s restoration plan and the related increased assessment rate could adversely affect Veritex’s earnings and results of operations.
As a result of economic conditions and the enactment of the Dodd-Frank Act, the FDIC has increased deposit insurance assessment rates, which in turn raised deposit premiums for many insured depository institutions. If these increases are insufficient for the Deposit Insurance Fund to meet its funding requirements, special assessments or increases in deposit insurance premiums may be required. Veritex is generally unable to control the amount of premiums that it is required to pay for FDIC insurance. If there are additional financial institution failures that affect the Deposit Insurance Fund, Veritex may be required to pay FDIC premiums higher than current levels. Veritex’s FDIC insurance related costs were $1.2 million for the year ended December 31, 2017, compared to $661 thousand for the year ended December 31, 2016 and $448 thousand for the year ended December 31, 2015. Any future additional assessments, increases or required prepayments in FDIC insurance premiums could adversely affect Veritex’s earnings and results of operations.
Veritex is subject to increased capital requirements, which may adversely impact return on equity or prevent Veritex from paying dividends or repurchasing shares.
The Dodd-Frank Act requires the federal banking agencies to establish stricter risk-based and leverage capital requirements to apply to banks and bank and savings and loan holding companies. The federal banking agencies have adopted revised risk-based and leverage capital requirements as well as a revised method for calculating risk-weighted assets. The capital rules apply to all bank holding companies with $1 billion or more in consolidated assets and all banks regardless of size.
As a result of the adoption of enhanced capital rules, Veritex became subject to increased required capital levels on January 1, 2015, with a phase-in period for certain provisions over four years that began in 2016. The application of more stringent capital requirements on Veritex could, among other things, result in lower returns on equity, require the raising of additional capital, and result in regulatory actions such as the inability to pay dividends or repurchase shares if Veritex were to be unable to comply with such requirements.
The Federal Reserve may require Veritex to commit capital resources to support the Bank.
A bank holding company is required to act as a source of financial and managerial strength to its subsidiary banks and to commit resources to support its subsidiary banks. The Federal Reserve may require a bank holding company to make capital injections into a troubled subsidiary bank at times when the bank holding company may not be inclined to do so and may charge the bank holding company with engaging in unsafe and unsound practices for failure to commit resources to such a subsidiary bank. Accordingly, Veritex could be required to provide financial assistance to the Bank if it experiences financial distress.
Such a capital injection may be required at a time when Veritex’s resources are limited and it may be required to borrow the funds to make the required capital injection. In the event of a bank holding company’s bankruptcy, the bankruptcy trustee will assume any commitment by the holding company to a federal bank regulatory agency to maintain the capital of a subsidiary bank. Moreover, bankruptcy law provides that claims based on any such commitment will be entitled to a priority of payment over the claims of the holding company’s general unsecured creditors, including the holders of any note obligations.
30
Veritex could be adversely affected by the soundness of other financial institutions.
Financial services institutions are interrelated as a result of trading, clearing, counterparty or other relationships. Veritex has exposure to many different industries and counterparties, and routinely executes transactions with counterparties in the financial services industry, including commercial banks, brokers and dealers, investment banks and other institutional clients. Many of these transactions expose Veritex to credit risk in the event of a default by a counterparty or client. In addition, Veritex’s credit risk may be exacerbated when its collateral cannot be foreclosed upon or is liquidated at prices not sufficient to recover the full amount of the credit or derivative exposure due. Any such losses could adversely affect Veritex’s business, financial condition and results of operations.
Monetary policies and regulations of the Federal Reserve could adversely affect Veritex’s business, financial condition and results of operations.
In addition to being affected by general economic conditions, Veritex’s earnings and growth are affected by the policies of the Federal Reserve. An important function of the Federal Reserve is to regulate the U.S. money supply and credit conditions. Among the instruments used by the Federal Reserve to implement these objectives are open market operations in U.S. government securities, adjustments of both the discount rate and the federal funds rate and changes in reserve requirements against bank deposits. These instruments are used in varying combinations to influence overall economic growth and the distribution of credit, bank loans, investments and deposits. Their use also affects interest rates charged on loans or paid on deposits.
The monetary policies and regulations of the Federal Reserve have had a significant effect on the operating results of commercial banks in the past and are expected to continue to do so in the future. Although Veritex cannot determine the effects of such policies on it at this time, such policies could adversely affect its business, financial condition and results of operations.
Risks Related to Veritex’s Common Stock
The market price of Veritex’s common stock may fluctuate significantly.
The market price of Veritex’s common stock could fluctuate significantly due to a number of factors, including, but not limited to:
• | Veritex’s quarterly or annual earnings, or those of other companies in its industry; |
• | actual or anticipated fluctuations in Veritex’s operating results; |
• | changes in accounting standards, policies, guidance, interpretations or principles; |
• | the public reaction to Veritex’s press releases, its other public announcements and its filings with the SEC; |
• | announcements by Veritex or its competitors of significant acquisitions, dispositions, innovations or new programs and services; |
• | changes in financial estimates and recommendations by securities analysts that cover Veritex’s common stock or the failure of securities analysts to cover Veritex’s common stock; |
• | changes in earnings estimates by securities analysts or Veritex’s ability to meet those estimates; |
• | the operating and stock price performance of other comparable companies; |
• | general economic conditions and overall market fluctuations; |
• | the trading volume of Veritex’s common stock; |
• | changes in business, legal or regulatory conditions, or other developments affecting participants in Veritex’s industry, and publicity regarding its business or any of its significant customers or competitors; |
• | changes in governmental monetary policies, including the policies of the Federal Reserve; |
• | future sales of Veritex’s common stock by Veritex or its directors, executive officers or significant shareholders; and |
• | changes in economic conditions in and political conditions affecting Veritex’s target markets. |
In particular, the realization of any of the risks described in this “Item 1A. Risk Factors” section could have a material adverse effect on the market price of Veritex’s common stock and cause the value of your investment to decline. In addition, the stock market in general has experienced extreme volatility that has often been unrelated to the operating performance of particular companies. These broad market fluctuations may adversely affect the trading price of Veritex’s common stock over the short, medium or long-term, regardless of Veritex’s actual performance. If the market price of Veritex’s common stock reaches an elevated level, it may materially and rapidly decline. In the past, following periods of volatility in the market price of a company’s securities, shareholders have often instituted securities class action litigation. If Veritex were to be involved in a class action lawsuit, it could divert the attention of senior management and could adversely affect Veritex’s business, financial condition and results of operations.
31
If securities or industry analysts change their recommendations regarding Veritex’s common stock or if Veritex’s operating results do not meet their expectations, Veritex’s stock price could decline.
The trading market for Veritex’s common stock could be influenced by the research and reports that industry or securities analysts may publish about Veritex or its business. If one or more of these analysts cease coverage of Veritex or fail to publish reports on it regularly, Veritex could lose visibility in the financial markets, which in turn could cause its stock price or trading volume to decline. Moreover, if one or more of the analysts who cover Veritex downgrade its stock or if Veritex’s operating results do not meet their expectations, either absolutely or relative to Veritex’s competitors, Veritex’s stock price could decline significantly.
Future sales or the possibility of future sales of a substantial amount of Veritex common stock may depress the price of shares of Veritex’s common stock.
Future sales or the availability for sale of substantial amounts of Veritex’s common stock in the public market, or the perception that these sales could occur, could adversely affect the prevailing market price of Veritex’s common stock and could impair its ability to raise capital through future sales of equity securities.
Veritex may issue shares of its common stock or other securities from time to time as consideration for future acquisitions and investments and pursuant to compensation and incentive plans. If any such acquisition or investment is significant, the number of shares of Veritex’s common stock, or the number or aggregate principal amount, as the case may be, of other securities that Veritex may issue may in turn be substantial. Veritex may also grant registration rights covering those shares of its common stock or other securities in connection with any such acquisitions and investments.
Veritex cannot predict the size of future issuances of its common stock or the effect, if any, that future issuances and sales of its common stock will have on the market price of its common stock. Sales of substantial amounts of Veritex’s common stock (including shares of its common stock issued in connection with an acquisition or under a compensation or incentive plan), or the perception that such sales could occur, may adversely affect prevailing market prices for its common stock and could impair Veritex’s ability to raise capital through future sales of its securities.
The holders of Veritex’s debt obligations will have priority over Veritex’s common stock with respect to payment in the event of liquidation, dissolution or winding up of Veritex and with respect to the payment of interest and preferred dividends.
As of December 31, 2017, Veritex had approximately $4.9 million outstanding in aggregate principal amount of subordinated promissory notes held by investors, and, in the aggregate, $11.7 million of junior subordinated debentures issued to two statutory trusts that, in turn issued $11.4 million in the aggregate of trust preferred securities. In the future, Veritex may incur additional indebtedness. Upon Veritex’s liquidation, dissolution or winding up, holders of its common stock will not be entitled to receive any payment or other distribution of assets until after all of Veritex’s obligations to its debt holders have been satisfied and holders of trust preferred securities have received any payment or distribution due to them. In addition, Veritex is required to pay interest on its outstanding indebtedness before it pays any dividends on its common stock. Since any decision to issue debt securities or incur other borrowings in the future will depend on market conditions and other factors beyond Veritex’s control, the amount, timing, nature or success of Veritex’s future capital raising efforts is uncertain. Thus, holders of Veritex’s common stock bear the risk that Veritex’s future issuances of debt securities or its incurrence of other borrowings will negatively affect the market price of its common stock.
Veritex is dependent upon the Bank for cash flow, and the Bank’s ability to make cash distributions is restricted, which could impact Veritex’s ability to satisfy its obligations.
Veritex’s primary asset is the Bank. As such, Veritex depends upon the Bank for cash distributions through dividends on the Bank’s stock to pay Veritex’s operating expenses and satisfy its obligations, including debt obligations. There are numerous laws and banking regulations that limit the Bank’s ability to pay dividends to Veritex. If the Bank is unable to pay dividends to Veritex, Veritex will not be able to satisfy its obligations. Federal and state statutes and regulations restrict the Bank’s ability to make cash distributions to Veritex. These statutes and regulations require, among other things, that the Bank maintain certain levels of capital in order to pay a dividend. Further, federal and state banking authorities have the ability to restrict the Bank’s payment of dividends through supervisory action.
32
For as long as Veritex is an emerging growth company, Veritex will not be required to comply with certain reporting requirements, including disclosure about its executive compensation, that apply to other public companies.
Veritex is classified as an “emerging growth company” under the JOBS Act. For as long as Veritex is an emerging growth company, unlike other public companies, it will not be required to, among other things, (1) provide an auditor’s attestation report on management’s assessment of the effectiveness of its system of internal control over financial reporting pursuant to Section 404(b) of the Sarbanes-Oxley Act of 2002, (2) comply with any new requirements proposed by the Public Company Accounting Oversight Board requiring mandatory audit firm rotation or a supplement to the auditor’s report in which the auditor would be required to provide additional information about the audit and the financial statements of the issuer, (3) provide certain disclosure regarding executive compensation required of larger public companies, (4) hold nonbinding advisory votes on executive compensation, or (5) obtain shareholder approval of any golden parachute payments not previously approved. Veritex will remain an emerging growth company until the last day of the fiscal year following the fifth anniversary of its initial public offering, which was completed in October 2014, although Veritex will lose that status sooner if it has more than $1.07 billion of revenues in a fiscal year, has more than $700.0 million in market value of its common stock held by non-affiliates, or issues more than $1.0 billion of non-convertible debt over a 3-year period.
The requirements of being a public company, including compliance with the reporting requirements of the Exchange Act and the requirements of the Sarbanes-Oxley Act of 2002, may strain Veritex’s resources, increase its costs and distract management.
Veritex completed its initial public offering in October 2014. As a public company, Veritex incurs significant legal, accounting and other expenses that it did not incur as a private company. Veritex also incur costs associated with its public company reporting requirements and with corporate governance requirements, including requirements under the Sarbanes-Oxley Act of 2002, Nasdaq rules and the rules implemented by the SEC. These rules and regulations have increased Veritex’s legal and financial compliance costs and make some activities more time-consuming and costly. These rules and regulations also make it more difficult and more expensive for Veritex to obtain director and officer liability insurance. As a result, it may be more difficult for Veritex to attract and retain qualified individuals to serve on its board of directors or as executive officers.
Shareholders may be deemed to be acting in concert or otherwise in control of Veritex, which could impose notice, approval and ongoing regulatory requirements upon them and result in adverse regulatory consequences for such holders.
Veritex is a bank holding company regulated by the Federal Reserve. Banking laws impose notice, approval and ongoing regulatory requirements on any shareholder or other party that seeks to acquire direct or indirect “control” of an FDIC-insured depository institution or a company that controls an FDIC-insured depository institution, such as a bank holding company. These laws include the BHC Act and the Change in Bank Control Act. The determination as to whether an investor “controls” a depository institution or holding company is based on all of the facts and circumstances surrounding the investment.
As a general matter, a party is deemed to control a depository institution or other company if the party (1) owns or controls 25.0% or more of any class of voting stock of the bank or other company, (2) controls the election of a majority of the directors of the bank or other company, or (3) has the power to exercise a controlling influence over the management or policies of the bank or other company. In addition, subject to rebuttal, a party may be presumed to control a depository institution or other company if the investor owns or controls 10.0% or more of any class of voting stock. Ownership by affiliated parties, or parties acting in concert, is typically aggregated for these purposes. “Acting in concert” generally means knowing participation in a joint activity or parallel action towards the common goal of acquiring control of a bank or a parent company, whether or not pursuant to an express agreement. The manner in which this definition is applied in individual circumstances can vary and cannot always be predicted with certainty.
Any shareholder that is deemed to “control” Veritex for regulatory purposes would become subject to notice, approval and ongoing regulatory requirements and may be subject to adverse regulatory consequences. Potential investors are advised to consult with their legal counsel regarding the applicable regulations and requirements.
An investment in Veritex’s common stock is not an insured deposit and is not guaranteed by the FDIC, so you could lose some or all of your investment.
An investment in Veritex’s common stock is not a bank deposit and, therefore, is not insured against loss or guaranteed by the FDIC, any other deposit insurance fund or by any other public or private entity. An investment in Veritex’s common stock is inherently risky for the reasons described herein. As a result, if you acquire Veritex’s common stock, you could lose some or all of your investment.
33
ITEM 1B. UNRESOLVED STAFF COMMENTS
None.
ITEM 2. PROPERTIES
At December 31, 2017, our executive offices were located at 8214 Westchester Drive, Suite 400, Dallas, Texas 75225. In addition to our executive offices, at December 31, 2017, we had twenty full-service branches and one mortgage office located in the Dallas-Fort Worth metroplex, two full-service branches in the Austin metropolitan area and one full-service branch in the Houston metropolitan area. On January 1, 2018, the Company sold the two full-service branches in the Austin metropolitan area. We own the building in which our executive offices are located and lease the majority of the space in which our other administrative offices are located. As of December 31, 2017, we owned thirteen of our branch locations and leased the mortgage office and remaining ten branch locations. The remaining terms of our leases on our full-services branches range from one to five years and give us the option to renew for subsequent terms of equal duration or otherwise extend the lease term subject to price adjustment based on market conditions at the time of renewal. The net book value of our investment in premises, equipment and leaseholds, excluding computer equipment, was approximately $77.0 million, which includes $5.1 million of premises and equipment classified as held for sale, at December 31, 2017. We believe that our current facilities are adequate to meet the present and immediately foreseeable needs of the Bank and the Company.
For more information about our bank premises and equipment and operating leases, please see Note 6 and Note 15 of the Notes to Consolidated Financial Statements contained in Item 15 of this report.
ITEM 3. LEGAL PROCEEDINGS
We are from time to time subject to claims and litigation arising in the ordinary course of business. These claims and litigation may include, among other things, allegations of violation of banking and other applicable regulations, competition law, labor laws and consumer protection laws, as well as claims or litigation relating to intellectual property, securities, breach of contract and tort. We intend to defend ourselves vigorously against any pending or future claims and litigation.
At this time, in the opinion of management, the likelihood is remote that the impact of such proceedings, either individually or in the aggregate, would have a material adverse effect on our consolidated results of operations, financial condition or cash flows. However, one or more unfavorable outcomes in any claim or litigation against us could have a material adverse effect for the period in which they are resolved. In addition, regardless of their merits or their ultimate outcomes, such matters are costly, divert management’s attention and may materially adversely affect our reputation, even if resolved in our favor.
ITEM 4. MINE AND SAFETY DISCLOSURES
Not applicable.
PART II
ITEM 5. MARKET FOR REGISTRANT’S COMMON EQUITY, RELATED STOCKHOLDER MATTERS AND ISSUER PURCHASES OF EQUITY SECURITIES
Market Information for Common Stock
Shares of our common stock are traded on the Nasdaq Global Market under the symbol “VBTX”. Our shares have been traded on the Nasdaq Global Market since October 9, 2014. Prior to that date, there was no public trading market for our common stock.
34
The following table presents the range of high and low sales price per share reported on The Nasdaq Global Market for the period indicated.
2017 | 2016 | ||||||||||||||
High | Low | High | Low | ||||||||||||
First Quarter | $ | 29.25 | $ | 25.64 | $ | 17.00 | $ | 12.35 | |||||||
Second Quarter | 28.47 | 25.39 | 16.25 | 14.35 | |||||||||||
Third Quarter | 27.54 | 24.22 | 17.48 | 13.91 | |||||||||||
Fourth Quarter | 28.60 | 25.75 | 27.76 | 15.46 | |||||||||||
Holders of Record
As of March 13, 2018, there were 333 holders of record of our common stock.
Dividend Policy
We have not declared or paid any dividends on our common stock. We currently intend to retain all of our future earnings, if any, for use in our business and do not anticipate paying any cash dividends on our common stock in the foreseeable future.
There are regulatory requirements related to our ability and the ability of the Bank to pay dividends. See “Item 1. Business—Regulation and Supervision—Regulatory Limits on Dividends and Distributions”.
Unregistered Sales of Equity Securities
None.
Equity Compensation Plan Information
See “Item 12. Security Ownership of Certain Beneficial Owners and Management and Related Stockholder Matters”.
35
Stock Performance Graph
The following table and graph compares the cumulative total shareholder return on our common stock to the cumulative total return of the S&P 500 Total Return Index and the Nasdaq Bank Index for the period beginning on October 9, 2014, the first day of trading of our common stock on the Nasdaq Global Market through December 31, 2017. The following reflects index values as of close of trading, assumes $100 invested on October 9, 2014 in our common stock, the S&P 500 Total Return Index and the Nasdaq Bank Index, and assumes the reinvestment of dividends, if any. The historical stock price performance for our common stock shown on the graph below is not necessarily indicative of future stock performance.
October 9, 2014 | December 31, 2014 | June 30, 2015 | December 31, 2015 | June 30, 2016 | December 31, 2016 | June 30, 2017 | December 31, 2017 | ||||||||||||||||||||||||
Veritex Holdings, Inc. | $ | 100.00 | $ | 101.58 | $ | 107.06 | $ | 116.20 | $ | 114.84 | $ | 191.47 | $ | 188.75 | $ | 197.78 | |||||||||||||||
S&P 500 | 100.00 | 106.78 | 107.00 | 106.00 | 108.85 | 116.11 | 125.68 | 138.66 | |||||||||||||||||||||||
Nasdaq Bank | 100.00 | 110.05 | 118.56 | 117.34 | 112.44 | 158.44 | 154.46 | 164.00 | |||||||||||||||||||||||
Comparison of Cumulative Total Return
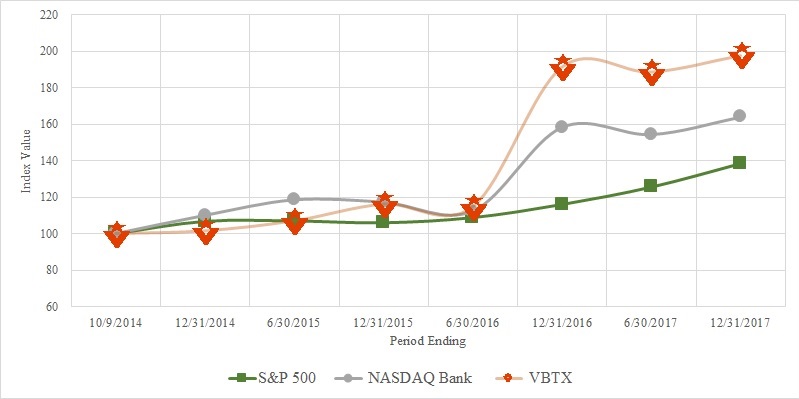
Stock Repurchases
No purchases of our common stock were made by or on behalf of us or any “affiliated purchaser” as defined in Rule 10b-18(a)(3) under the Exchange Act during the year ended December 31, 2017. There is currently no authorization to repurchase shares of outstanding common stock.
36
ITEM 6. SELECTED FINANCIAL DATA
As of and For the Years Ended December 31, | |||||||||||||||||||
2017 | 2016 | 2015 | 2014 | 2013 | |||||||||||||||
(Dollars in thousands, except per share data) | |||||||||||||||||||
Selected Period-end Balance Sheet Data: | |||||||||||||||||||
Total assets | $ | 2,945,583 | $ | 1,408,507 | $ | 1,039,551 | $ | 802,231 | $ | 664,946 | |||||||||
Cash and cash equivalents | 149,044 | 234,791 | 71,551 | 93,251 | 76,646 | ||||||||||||||
Investment securities | 228,117 | 102,559 | 75,813 | 45,127 | 45,604 | ||||||||||||||
Total loans(1) | 2,233,518 | 991,897 | 820,567 | 603,310 | 495,270 | ||||||||||||||
Allowance for loan losses | 12,808 | 8,524 | 6,772 | 5,981 | 5,018 | ||||||||||||||
Goodwill | 159,452 | 26,865 | 26,865 | 19,148 | 19,148 | ||||||||||||||
Intangibles | 20,441 | 2,181 | 2,410 | 1,261 | 1,567 | ||||||||||||||
Noninterest-bearing deposits | 612,830 | 327,614 | 301,367 | 251,124 | 218,990 | ||||||||||||||
Interest-bearing deposits | 1,665,800 | 792,016 | 567,043 | 387,619 | 354,948 | ||||||||||||||
Total deposits | 2,278,630 | 1,119,630 | 868,410 | 638,743 | 573,938 | ||||||||||||||
Advances from FHLB | 71,164 | 38,306 | 28,444 | 40,000 | 15,000 | ||||||||||||||
Other borrowings | 31,689 | 8,035 | 8,027 | 8,019 | 8,047 | ||||||||||||||
Total stockholders’ equity | 488,929 | 239,088 | 132,046 | 113,312 | 66,239 | ||||||||||||||
Selected Income Statement Data: | |||||||||||||||||||
Net interest income | $ | 68,508 | $ | 40,955 | $ | 31,459 | $ | 25,340 | $ | 21,041 | |||||||||
Provision for loan losses | 5,114 | 2,050 | 868 | 1,423 | 1,883 | ||||||||||||||
Net interest income after provision for loan losses | 63,394 | 38,905 | 30,591 | 23,917 | 19,158 | ||||||||||||||
Noninterest income | 7,576 | 6,503 | 3,704 | 2,496 | 2,391 | ||||||||||||||
Noninterest expense | 42,789 | 26,390 | 21,388 | 18,503 | 16,364 | ||||||||||||||
Income before income tax | 28,181 | 19,018 | 12,907 | 7,910 | 5,185 | ||||||||||||||
Income tax expense | 13,029 | 6,467 | 4,117 | 2,705 | 1,777 | ||||||||||||||
Net income | 15,152 | 12,551 | 8,790 | 5,205 | 3,408 | ||||||||||||||
Preferred dividends | 42 | — | 98 | 80 | 60 | ||||||||||||||
Net income available to common stockholders | $ | 15,110 | $ | 12,551 | $ | 8,692 | $ | 5,125 | $ | 3,348 | |||||||||
Share Data: | |||||||||||||||||||
Basic earnings per common share | $ | 0.82 | $ | 1.16 | $ | 0.86 | $ | 0.73 | $ | 0.58 | |||||||||
Diluted earnings per common share | 0.80 | 1.13 | 0.84 | 0.72 | 0.57 | ||||||||||||||
Book value per common share(2) | 20.28 | 15.73 | 12.33 | 11.12 | 10.03 | ||||||||||||||
Tangible book value per common share(3) | 12.82 | 13.82 | 9.59 | 8.96 | 6.46 | ||||||||||||||
Basic weighted average common shares outstanding | 18,403,894 | 10,849,331 | 10,061,015 | 6,991,585 | 5,787,810 | ||||||||||||||
Diluted weighted average common shares outstanding | 18,809,894 | 11,058,118 | 10,332,158 | 7,152,328 | 5,848,810 | ||||||||||||||
Performance Ratios: | |||||||||||||||||||
Return on average assets(4) | 0.76 | % | 1.06 | % | 0.98 | % | 0.75 | % | 0.58 | % | |||||||||
Return on average equity(4) | 4.55 | 8.80 | 6.94 | 6.28 | 5.27 | ||||||||||||||
Net interest margin(5) | 3.77 | 3.72 | 3.80 | 3.78 | 4.0 | ||||||||||||||
Efficiency ratio(6) | 56.24 | 55.61 | 60.83 | 66.47 | 69.84 | ||||||||||||||
Loans to deposits ratio | 98.02 | 88.59 | 94.50 | 94.45 | 86.3 | ||||||||||||||
Noninterest expense to average assets(4) | 2.16 | 2.22 | 2.38 | 2.71 | 2.80 | ||||||||||||||
Summary Credit Quality Ratios: | |||||||||||||||||||
Nonperforming assets to total assets | 0.03 | % | 0.17 | % | 0.11 | % | 0.07 | % | 0.44 | % | |||||||||
Nonperforming loans to total loans | 0.02 | 0.18 | 0.08 | 0.07 | 0.23 | ||||||||||||||
Allowance for loan losses to nonperforming loans | 2,651.76 | 479.95 | 1,003.26 | 1,371.79 | 445.65 | ||||||||||||||
Allowance for loan losses to total loans | 0.57 | 0.86 | 0.83 | 0.99 | 1.01 | ||||||||||||||
Net charge-offs to average loans outstanding | 0.06 | 0.03 | 0.01 | 0.08 | 0.02 | ||||||||||||||
Capital Ratios: | |||||||||||||||||||
Total stockholders’ equity to total assets | 16.60 | % | 16.97 | % | 12.70 | % | 14.12 | % | 10.0 | % | |||||||||
Tangible common equity to tangible assets(7) | 11.12 | 15.23 | 10.17 | 10.86 | 5.82 | ||||||||||||||
Tier 1 capital to average assets(4) | 12.92 | 16.82 | 10.75 | 12.66 | 8.06 | ||||||||||||||
Tier 1 capital to risk-weighted assets | 12.48 | 20.72 | 12.85 | 15.45 | 9.75 | ||||||||||||||
Common equity tier 1 (to risk-weighted assets) | 11.41 | 20.42 | 12.48 | n/a | n/a | ||||||||||||||
Total capital to risk-weighted assets | 13.16 | 22.02 | 14.25 | 17.21 | 11.74 | ||||||||||||||
37
(1) | Total loans does not include loans held for sale and deferred fees. Loans held for sale were $0.8 million as of December 31, 2017, $5.2 million as of December 31, 2016, $2.8 million as of December 31, 2015, $8.9 million as of December 31, 2014 and $2.1 million as of December 31, 2013. Deferred fees were $28 thousand as of December 31, 2017, $55 thousand of December 31, 2016, $62 thousand as of December 31, 2015, $51 thousand as of December 31, 2014 and $94 thousand as of December 31, 2013. |
(2) | We calculate book value per common share as stockholders’ equity less preferred stock at the end of the relevant period divided by the outstanding number of shares of our common stock at the end of the relevant period. |
(3) | We calculate tangible book value per common share as total stockholders’ equity less preferred stock, goodwill, and intangible assets, net of accumulated amortization at the end of the relevant period, divided by the outstanding number of shares of our common stock at the end of the relevant period. Tangible book value per common share is a non-GAAP financial measure, and, as we calculate tangible book value per common share, the most directly comparable GAAP financial measure is total stockholders’ equity per common share. See our reconciliation of non-GAAP financial measures to their most directly comparable GAAP financial measures in “Item 7. Management’s Discussion and Analysis of Financial Condition and Results of Operations-Non-GAAP Financial Measures.” |
(4) | Except as otherwise indicated in this footnote, we calculate our average assets and average equity for a period by dividing the sum of our total assets or total stockholders’ equity, as the case may be, as of the close of business on each day in the relevant period, by the number of days in the period. We have calculated our return on average assets and return on average equity for a period by dividing net income for that period by our average assets and average equity, as the case may be, for that period. |
(5) | Net interest margin represents net interest income, annualized on a fully tax equivalent basis, divided by average interest-earning assets. |
(6) | Efficiency ratio represents noninterest expense divided by the sum of net interest income and noninterest income. |
(7) | We calculate tangible common equity as total stockholders’ equity less preferred stock, goodwill, and intangible assets, net of accumulated amortization, and we calculate tangible assets as total assets less goodwill and intangible assets, net of accumulated amortization. Tangible common equity to tangible assets is a non-GAAP financial measure, and, as we calculate tangible common equity to tangible assets, the most directly comparable GAAP financial measure is total stockholders’ equity to total assets. See our reconciliation of non-GAAP financial measures to their most directly comparable GAAP financial measures in “Item 7. Management’s Discussion and Analysis of Financial Condition and Results of Operations-Non-GAAP Financial Measures.” |
ITEM 7. MANAGEMENT’S DISCUSSION AND ANALYSIS OF FINANCIAL CONDITION AND RESULTS OF OPERATIONS.
Management’s Discussion and Analysis of Financial Condition and Results of Operations
The following discussion and analysis of our financial condition and results of operations should be read in conjunction with “Item 6. Selected Financial Data” and our consolidated financial statements and the accompanying notes included elsewhere in this Annual Report on Form 10-K. This discussion and analysis contains forward-looking statements that are subject to certain risks and uncertainties and are based on certain assumptions that we believe are reasonable but may prove to be inaccurate. Certain risks, uncertainties and other factors, including those set forth in “Item 1A. Risk Factors” and elsewhere in this Annual Report on Form 10-K, may cause actual results to differ materially from those projected results discussed in the forward-looking statements appearing in this discussion and analysis. We assume no obligation to update any of these forward-looking statements.
Overview
We are a bank holding company headquartered in Dallas, Texas. Through our wholly owned subsidiary, Veritex Community Bank, a Texas state chartered bank, we provide relationship-driven commercial banking products and services tailored to meet the needs of small to medium-sized businesses and professionals. Beginning at our inception in 2010, we initially targeted customers and focused our acquisitions primarily in the Dallas metropolitan area, which we consider to be Dallas and the adjacent communities in North Dallas. As a result of our recent acquisitions of Sovereign and Liberty, our current primary market now includes the broader Dallas-Fort Worth metroplex, which also encompasses Arlington, as well as the Houston metropolitan area. As we continue to grow, we may expand to other metropolitan markets within the State of Texas.
Our business is conducted through one reportable segment, community banking, where we generate the majority of our revenues from interest income on loans, customer service and loan fees, gains on sale of Small Business Administration (“SBA”) guaranteed loans and mortgage loans and interest income from securities. We incur interest expense on deposits and other borrowed funds and noninterest expense, such as salaries and employee benefits and occupancy expenses. We analyze our ability to maximize income generated from interest earning assets and expense of our liabilities through our net interest margin. Net interest margin is a ratio calculated as net interest income divided by average interest-earning assets. Net interest income is the difference between interest income on interest-earning assets, such as loans and securities, and interest expense on interest-bearing liabilities, such as deposits and borrowings, which are used to fund those assets.
Changes in the market interest rates and interest rates we earn on interest-earning assets or pay on interest-bearing liabilities, as well as the volume and types of interest-earning assets, interest-bearing and noninterest-bearing liabilities and stockholders’ equity, are usually the largest drivers of periodic changes in net interest spread, net interest margin and net interest income. Fluctuations in market interest rates are driven by many factors, including governmental monetary policies, inflation, deflation, macroeconomic developments, changes in unemployment, the money supply, political and international conditions and conditions in domestic and foreign financial markets. Periodic changes in the volume and types of loans in our loan portfolio are affected by, among other factors, economic and competitive conditions in Texas and specifically in the Dallas-Fort Worth metroplex, as well as developments affecting the real estate, technology, financial services, insurance, transportation, manufacturing and energy sectors within our target market and throughout the State of Texas.
2017 Highlights
Sovereign Bancshares, Inc.
On August 1, 2017, we acquired Sovereign, a Texas corporation and parent company of Sovereign Bank. We issued 5,117,642 shares of its common stock and paid out $56.2 million in cash to Sovereign in consideration for the acquisition. Additionally, under the terms of the merger agreement, each of Sovereign’s 24,500 shares of Senior Non-Cumulative Perpetual Preferred Stock, Series C was converted into one share of our Senior Non-Cumulative Perpetual, Series D Preferred Stock at the consummation of the acquisition. For further information, see Note 22 - Preferred Stock in the accompanying Notes to the Consolidated Financial Statements included in Item 8 of this report. We acquired an estimated $1.1 billion in assets and assumed $905.1 million of liabilities as a result of this acquisition as of the closing date.
On August 8, 2017, we redeemed all 24,500 shares of the Series D Preferred Stock at its liquidation value of $1,000 per share plus accrued dividends for a total redemption amount of $24.7 million. For further information, see Note 24 – Business Combinations in the accompanying Notes to the Consolidated Financial Statements included in Item 8 of this report.
Common Stock Offering
On August 1, 2017, the Company completed an underwritten common stock offering issuing 2,285,050 shares of the Company’s common stock with $56.7 million in net proceeds after underwriting discounts and offering expenses. The Company used a portion of the net proceeds of the offering to fund a portion of the consideration paid for the acquisition of Liberty Bancshares, Inc. and for general corporate purposes.
Liberty Bancshares, Inc.
On December 1, 2017, we acquired Liberty, a Texas corporation and parent company of Liberty Bank. We issued approximately 1,450,000 shares of its common stock and paid out $25.0 million in cash to Liberty in consideration for the acquisition. We acquired an estimated $467.3 million in assets and assumed $401.9 million of liabilities as a result of this acquisition as of the closing date. For further information, see Note 24 – Business Combinations in the accompanying Notes to the Consolidated Financial Statements included in Item 8 of this report.
38
Anticipated Trends
This discussion of trends expected to impact our business in 2018 is based on information presently available and reflects certain assumptions, including assuming a continuation of the current economic and low rate environment. Differences in actual economic conditions compared with our assumptions could have a material impact on our results. See “Special Cautionary Notice Regarding Forward-Looking Statements” and Part I, Item 1A, “Risk Factors” of this Annual Report on Form 10-K for additional factors that could cause results to differ materially from those contemplated by the following forward-looking statements. We anticipate the following trends or events related to our business in fiscal year 2018:
• | Continued emphasis on credit quality and relationship banking. |
• | Continue to leverage our strong capital through accretive organic growth and merger and acquisition opportunities. |
• | Continued meaningful costs savings from the recent acquisitions of Sovereign and Liberty, the consolidation of our back office functions into one operations center and the sale of our two non-core Austin branches on January 1, 2018. |
• | Net interest income higher, reflecting full-year benefits from the 2017 rate increases and loan growth. |
• | Net charge-offs to remain low, with continued solid performance of the overall loan portfolio. |
• | Income tax expense to approximate 21% of pre-tax income reflecting the enactment of the Tax Cuts and Jobs Act (the “Tax Act”) excluding discrete tax impact from the re-measurement of deferred taxes upon finalization of the provisional estimates for certain assets acquired and liabilities assumed in the Sovereign and Liberty acquisitions as well as discrete tax impact from deferred employee stock transactions. |
Results of operations for the Fiscal Years Ended December 31, 2017 and December 31, 2016
General
Net income available to common stockholders for the year ended December 31, 2017 was $15.1 million, an increase of $2.5 million, or 20.4%, from net income available to common stockholders of $12.6 million for the year ended December 31, 2016. Net income available to common stockholders for the 2017 period was negatively impacted by a $3.1 million re-measurement of our deferred tax assets and deferred tax liabilities due to our new effective tax rate under the Tax Act.
Basic earnings per share (“EPS”) for the year ended December 31, 2017 was $0.82, a decrease of $0.34 from $1.16 for the year ended December 31, 2016. Diluted earnings per share for the year ended December 31, 2017 was $0.80, a decrease of $0.33 from $1.13 for the year ended December 31, 2016.
Net Interest Income
Our operating results depend primarily on our net interest income, calculated as the difference between interest income on interest-earning assets, such as loans and securities, and interest expense on interest-bearing liabilities, such as deposits and borrowings. Fluctuations in market interest rates impact the yield and rates paid on interest sensitive assets and liabilities. Changes in the amount and type of interest-earning assets and interest-bearing liabilities also impact net interest income. The variance driven by the changes in the amount and mix of interest-earning assets and interest-bearing liabilities is referred to as a “volume change.” Changes in yields earned on interest-earning assets and rates paid on interest-bearing deposits and other borrowed funds are referred to as a “rate change.”
To evaluate net interest income, we measure and monitor (1) yields on our loans and other interest-earning assets, (2) the costs of our deposits and other funding sources, (3) our net interest spread and (4) our net interest margin. Net interest spread is the difference between rates earned on interest-earning assets and rates paid on interest-bearing liabilities. Net interest margin is a ratio calculated as net interest income divided by average interest-earning assets. Because noninterest-bearing sources of funds, such as noninterest-bearing deposits and stockholders’ equity also fund interest-earning assets, net interest margin includes the benefit of these noninterest-bearing sources.
For the year ended December 31, 2017, net interest income totaled $68.5 million compared with net interest income of $41.0 million for the year ended December 31, 2016, an increase of $27.5 million, or 67.3%. This increase was primarily due to a $32.9 million, or 70.7%, increase in interest income resulting from growth in the Company’s average interest-earning assets which was partially offset by an increase in interest expense of $5.4 million, or 95.7%, for the year ended December 31, 2017. Interest income was $79.5 million compared to $46.6 million for the years ended December 31, 2017 and 2016, respectively. The primary driver of increased interest income was the growth on interest earned on average loans. Interest earned on average loans outstanding for the year ended December 31, 2017 compared to average loans outstanding for the year ended December 31, 2016 increased $29.1 million, or 65.2%. The growth in average loans was the result of the acquisitions of Sovereign and Liberty, new loan originations and growth of existing customer loan balances. Average loan balances grew from $924.5 million for the year ended December 31, 2016 to $1.4 billion for the year ended December 31, 2017, an increase of $516.8 million, or 55.9%.
39
Interest expense for the year ended December 31, 2017 was $11.0 million compared to $5.6 million for the year ended December 31, 2016, an increase of $5.4 million, or 95.8%. The year-over-year increase was due to growth of average interest bearing-liabilities of $475.4 million, or 64.2%, primarily due to the increase in interest bearing liabilities assumed from Sovereign and Liberty and organic growth in average interest bearing deposits, advances from FHLB, and other borrowings.
Net interest margin and net interest spread were 3.77% and 3.48%, respectively, for the year ended December 31, 2017 compared to 3.72% and 3.47%, respectively, for the year ended December 31, 2016. The increase in net interest margin by 5 basis points and increase in net interest spread by 1 basis point was due to an increase in the average yield earned on interest-bearing assets by 16 basis points which was offset by an increase in the average yield paid on interest-bearing liabilities by 15 basis points. The average interest earned on interest-bearing assets increased to 4.39% during the year ended December 31, 2017 from 4.23% for the year ended December 31, 2016. The average interest paid on interest-bearing liabilities increased to 0.91% during the year ended December 31, 2017 from 0.76% for the year ended December 31, 2016.
The following table presents, for the periods indicated, an analysis of net interest income by each major category of interest-earning assets and interest-bearing liabilities, the average amounts outstanding and the interest earned or paid on such amounts. The table also sets forth the average rate earned on interest-earning assets, the average rate paid on interest-bearing liabilities, and the net interest margin on average total interest-earning assets for the same periods. Interest earned on loans that are classified as non-accrual is not recognized in income; however, the balances are reflected in average outstanding balances for the period. For the years ended December 31, 2017 and 2016, interest income not recognized on non-accrual loans was minimal. Any non-accrual loans have been included in the table as loans carrying a zero yield.
40
For the Year Ended December 31, | |||||||||||||||||||||
2017 | 2016 | ||||||||||||||||||||
Average Outstanding Balance | Interest Earned/ Interest Paid | Average Yield/ Rate | Average Outstanding Balance | Interest Earned/ Interest Paid | Average Yield/ Rate | ||||||||||||||||
(Dollars in thousands) | |||||||||||||||||||||
Assets | |||||||||||||||||||||
Interest-earning assets: | |||||||||||||||||||||
Total loans(1)(4) | $ | 1,441,295 | $ | 73,795 | 5.12 | % | $ | 924,465 | $ | 44,681 | 4.83 | % | |||||||||
Securities available for sale | 170,253 | 3,462 | 2.03 | 84,558 | 1,409 | 1.67 | |||||||||||||||
Investment in subsidiary | 202 | 8 | 3.96 | 93 | 2 | 2.15 | |||||||||||||||
Interest-earning deposits in financial institutions | 202,314 | 2,287 | 1.13 | 93,199 | 503 | 0.54 | |||||||||||||||
Total interest-earning assets | 1,814,064 | 79,552 | 4.39 | 1,102,315 | 46,595 | 4.23 | |||||||||||||||
Allowance for loan losses | (9,567 | ) | (7,743 | ) | |||||||||||||||||
Noninterest-earning assets(4) | 176,471 | 94,200 | |||||||||||||||||||
Total assets | $ | 1,980,968 | $ | 1,188,772 | |||||||||||||||||
Liabilities and Stockholders’ Equity | |||||||||||||||||||||
Interest-bearing liabilities: | |||||||||||||||||||||
Interest-bearing deposits(4) | $ | 1,151,033 | $ | 9,878 | 0.86 | % | $ | 688,978 | $ | 4,988 | 0.72 | % | |||||||||
Advances from FHLB | 51,196 | 531 | 1.04 | 43,649 | 260 | 0.60 | |||||||||||||||
Other borrowings | 13,878 | 635 | 4.58 | 8,077 | 392 | 4.85 | |||||||||||||||
Total interest-bearing liabilities | 1,216,107 | 11,044 | 0.91 | 740,704 | 5,640 | 0.76 | |||||||||||||||
Noninterest-bearing liabilities: | |||||||||||||||||||||
Noninterest-bearing deposits(4) | 425,124 | 302,548 | |||||||||||||||||||
Other liabilities(4) | 6,802 | 2,937 | |||||||||||||||||||
Total noninterest-bearing liabilities | 431,926 | 305,485 | |||||||||||||||||||
Stockholders’ equity | 332,935 | 142,583 | |||||||||||||||||||
Total liabilities and stockholders’ equity | $ | 1,980,968 | $ | 1,188,772 | |||||||||||||||||
Net interest rate spread(2) | 3.48 | % | 3.47 | % | |||||||||||||||||
Net interest income | $ | 68,508 | $ | 40,955 | |||||||||||||||||
Net interest margin(3) | 3.77 | % | 3.72 | % | |||||||||||||||||
__________________
(1) | Includes average outstanding balances of loans held for sale of $2,493, and $5,078 and deferred loan fees of $19 and $54 for the years ended December 31, 2017 and 2016, respectively. |
(2) | Net interest rate spread is the average yield on interest-earning assets minus the average rate on interest-bearing liabilities. |
(3) | Net interest margin is equal to net interest income divided by average interest-earning assets. |
(4) | Includes average outstanding balances of branch assets and liabilities held for sale in total loans, noninterest-bearing assets, interest-bearing deposits, noninterest-bearing deposits and other liabilities. |
41
The following table presents the changes in interest income and interest expense for the periods indicated for each major component of interest-earning assets and interest-bearing liabilities and distinguishes between the changes attributable to changes in volume and changes attributable to changes in interest rates. For purposes of this table, changes attributable to both rate and volume that cannot be segregated have been allocated to rate.
For the Year Ended December 31, 2017 | |||||||||||
Compared to 2016 | |||||||||||
Increase (Decrease) Due To | |||||||||||
Volume | Rate | Total | |||||||||
(Dollars in thousands) | |||||||||||
Interest-earning assets: | |||||||||||
Total loans | $ | 26,462 | $ | 2,652 | $ | 29,114 | |||||
Securities available for sale | 1,740 | 313 | 2,053 | ||||||||
Other investments | 4 | 2 | 6 | ||||||||
Interest-earning deposits in other banks | 1,233 | 551 | 1,784 | ||||||||
Total increase in interest income | 29,439 | 3,518 | 32,957 | ||||||||
Interest-bearing liabilities: | |||||||||||
Interest-bearing deposits | 3,974 | 916 | 4,890 | ||||||||
Advances from FHLB | 78 | 193 | 271 | ||||||||
Other borrowings | 266 | (23 | ) | 243 | |||||||
Total increase in interest expense | 4,318 | 1,086 | 5,404 | ||||||||
Increase (decrease) in net interest income | $ | 25,121 | $ | 2,432 | $ | 27,553 | |||||
Provision for Loan Losses
Our provision for loan losses is a charge to income in order to bring our allowance for loan losses to a level deemed appropriate by management. For a description of the factors taken into account by management in determining the allowance for loan losses see “—Financial Condition—Allowance for Loan Losses.” The provision for loan losses was $5.1 million for the year ended December 31, 2017, compared to $2.1 million for the same period in 2016, an increase of $3.0 million or 149.5%. The increase in provision expense was primarily due to the general provision required for purchased Sovereign loans that were refinanced and re-underwritten at maturity as well as an increase in organic loan growth. Once an acquired loan undergoes new underwriting and meets the criteria for a new loan, any remaining fair value adjustments are taken into interest income and the loan becomes fully subject to our allowance for loan loss methodology. In addition, net charge-offs increased $532 thousand for the year ended December 31, 2017 compared to the same period in 2016.
Noninterest Income
Our primary sources of recurring noninterest income are service charges and fees on deposit accounts, gains on the sale of investment securities, gains on the sale of loans and income from bank-owned life insurance. Noninterest income does not include loan origination fees to the extent they exceed the direct loan origination costs, which are generally recognized over the life of the related loan as an adjustment to yield using the interest method.
42
The following table presents, for the periods indicated, the major categories of noninterest income:
For the Year Ended | |||||||||||
December 31, | |||||||||||
Increase | |||||||||||
2017 | 2016 | (Decrease) | |||||||||
(Dollars in thousands) | |||||||||||
Noninterest income: | |||||||||||
Service charges and fees on deposit accounts | $ | 2,502 | $ | 1,846 | $ | 656 | |||||
Gain on sales of investment securities | 222 | 15 | 207 | ||||||||
Gain on sales of loans | 3,141 | 3,288 | (147 | ) | |||||||
Bank-owned life insurance | 753 | 771 | (18 | ) | |||||||
Other | 958 | 583 | 375 | ||||||||
Total noninterest income | $ | 7,576 | $ | 6,503 | $ | 1,073 | |||||
Noninterest income for the year ended December 31, 2017 increased $1.1 million, or 16.5%, to $7.6 million compared to noninterest income of $6.5 million for the same period in 2016. The primary components of the increase were as follows:
Service charges and fees on deposit accounts. We earn service charges and fees from our customers for deposit-related activities. The income from these deposit activities constitutes a significant and predictable component of our noninterest income. Service charges and fees on deposit accounts were $2.5 million for the year ended December 31, 2017, an increase of $656 thousand, or 35.5%, over the same period in 2016. This increase was primarily attributable to organic growth in the number of deposit accounts and accounts assumed from the Sovereign and Liberty acquisitions.
Gain on sales of investment securities. Gain on sales of investment securities were $222 thousand for the year ended December 31, 2017 compared to $15 thousand for the same period in 2016. The increase of $207 thousand primarily resulted from the sale of $190 thousand Sovereign investment securities during the third quarter of 2017 that did not fit our investment strategy.
Gain on sales of loans. We originate SBA guaranteed loans and long-term fixed-rate mortgage loans for resale into the secondary market. Income from sale on loans was $3.1 million for the year ended December 31, 2017 compared to $3.3 million for the same period in 2016. The decrease of $147 thousand, or 4.5%, was primarily due to a decrease in gain on sale of mortgage loans by $463 thousand offset by an increase in sales of SBA-guaranteed loans resulting in incremental gains of $250 thousand.
Other. Other noninterest income was $958 thousand for the year ended December 31, 2017, an increase of $375 thousand, or 64.3%, compared to the same period in 2016. The increase was primarily due to a $271 thousand increase in SBA service fee income resulting from an increase in SBA loans of $20.6 million, the introduction of rental revenue derived from the purchase of our corporate office of $139 thousand, and a $90 thousand increase in dividend income as a result of bi-annual Federal Reserve Bank stock dividends attributable to additional purchases of Federal Reserve Bank stock during the year ended December 31, 2017. These increases were partially offset by a reduction in income on late charges of $99 thousand for the year ended December 31, 2017.
43
Noninterest Expense
Noninterest expense is composed of all employee expenses and costs associated with operating our facilities, acquiring and retaining customer relationships and providing bank services. The major component of noninterest expense is salaries and employee benefits. Noninterest expense also includes operational expenses such as occupancy expenses, depreciation and amortization of office equipment, professional fees and regulatory fees, including Federal Deposit Insurance Corporation (“FDIC”) assessments, data processing expenses, and advertising and promotion expenses.
The following table presents, for the periods indicated, the major categories of noninterest expense:
For the Year Ended | |||||||||||
December 31, | |||||||||||
Increase | |||||||||||
2017 | 2016 | (Decrease) | |||||||||
(Dollars in thousands) | |||||||||||
Salaries and employee benefits | $ | 20,828 | $ | 14,332 | $ | 6,496 | |||||
Non-staff expenses: | |||||||||||
Occupancy and equipment | 5,618 | 3,667 | 1,951 | ||||||||
Professional fees | 5,672 | 2,804 | 2,868 | ||||||||
Data processing and software expense | 2,217 | 1,158 | 1,059 | ||||||||
FDIC assessment fees | 1,177 | 661 | 516 | ||||||||
Marketing | 1,293 | 983 | 310 | ||||||||
Other assets owned expenses and write-downs | 182 | 163 | 19 | ||||||||
Amortization of intangibles | 964 | 380 | 584 | ||||||||
Telephone and communications | 720 | 402 | 318 | ||||||||
Other | 4,118 | 1,840 | 2,278 | ||||||||
Total noninterest expense | $ | 42,789 | $ | 26,390 | $ | 16,399 | |||||
Noninterest expense for the year ended December 31, 2017 increased $16.4 million, or 62.1%, to $42.8 million compared to noninterest expense of $26.4 million for the same period in 2016. The most significant components of the increase were as follows:
Salaries and employee benefits. Salaries and employee benefits include payroll expenses, the cost of incentive compensation, benefit plans, health insurance and payroll taxes. The level of employee expense is impacted by the amount of direct loan origination costs which are required to be deferred in accordance with ASC 310-20. Salaries and employee benefits were $20.8 million for the year ended December 31, 2017, an increase of $6.5 million, or 45.3%, compared to the same period in 2016. The increase was primarily attributable to increased employee compensation of $5.9 million resulting from higher headcount including the addition of full-time equivalent employees related to the Sovereign and Liberty acquisitions and merit increases given to employees during the year ended December 31, 2017. Incentive costs also increased $1.9 million which primarily included lender incentive increases of $573 thousand as a result of organic loan growth during the period and employee stock compensation increases of $711 thousand. Employee benefits and payroll taxes also increased $391 thousand and $522 thousand, respectively, compared to the same period in 2016. These increases in salaries and employee benefits were partially offset by direct origination costs previously mentioned which increased $2.2 million as a result of the growth in loans during the year ended December 31, 2017 compared to the same period in 2016.
Occupancy and equipment. Occupancy and equipment expense includes lease expense, building depreciation and related facilities costs as well as furniture, fixture and equipment depreciation, small equipment purchases and maintenance expense. Our expense associated with occupancy and equipment was $5.6 million for the year ended December 31, 2017 compared to $3.7 million for the same period in 2016. The increase of $1.9 million, or 53.2%, was primarily due to the leasing of additional office space beginning June 1, 2016 at the corporate headquarters location, additional lease expense associated with the opening of the Turtle Creek branch beginning in January 2017, the addition of eight owned buildings and eight property leases from our acquisitions of Sovereign and Liberty in 2017 and one month of depreciation associated with the purchase of our corporate headquarters building in December 2017.
44
Professional fees. This category includes legal, investment bank, director, stock transfer agent fees and other public company services, information technology support, audit services and regulatory assessment expense. Professional fees were $5.7 million for the year ended December 31, 2017, an increase of $2.9 million, or 102.3%, compared to the same period in 2016. This increase was primarily the result of legal and other professional services associated with the Sovereign and Liberty acquisitions.
FDIC assessment fees. FDIC assessment fees were $1.2 million for the year ended December 31, 2017 compared to $661 thousand for the same period during 2016. The increase in FDIC assessment fees is a result of the Sovereign and Liberty acquisitions and the resulting increase in average assets for the year ended December 31, 2017.
Other. This category includes operating and administrative expenses including loan operations and collections, supplies and printing, online and card interchange expense, ATM/debit card processing, postage and delivery, bank-owned life insurance (“BOLI”) mortality expense, insurance and security expenses. Other noninterest expense increased $2.3 million, or 123.8%, to $4.1 million for the year ended December 31, 2017, compared to $1.8 million for the same period in 2016 primarily related to an increase in loan and collection expense of $652 thousand resulting from an increase in loan originations and renewals during 2017. Additionally, ATM and interchange expenses increased $247 thousand, insurance expenses increased $293 thousand and dues and memberships increased $225 thousand primarily as result of the Sovereign and Liberty acquisitions.
Income Tax Expense. The amount of income tax expense is a function of our pre-tax income, tax-exempt income and other nondeductible expenses. Deferred tax assets and liabilities reflect current statutory income tax rates in effect for the period in which the deferred tax assets and liabilities are expected to be realized or settled. As changes in tax laws or rates are enacted, deferred tax assets and liabilities are adjusted through the provision for income taxes. Valuation allowances are established when necessary to reduce deferred tax assets to the amount expected to be realized. As of December 31, 2017, the Company did not believe a valuation allowance was necessary.
For the year ended December 31, 2017, income tax expense totaled $13.0 million, an increase of $6.6 million, or 101.5%, compared to $6.5 million for the same period in 2016. The increase was primarily attributable to the $9.2 million increase in net operating income from $19.0 million for the year ended December 31, 2016 to $28.2 million for the same period in 2017 as well as a $3.1 million income tax expense adjustment to the Company's deferred tax asset related to the December 22, 2017 enactment of the Tax Act. The SEC issued Staff Accounting Bulletin No. 118(“SAB 118”), which provides guidance on accounting for tax effects of the Tax Act. SAB 118 provides a measurement period for up to one year from the enactment date to complete the accounting. Based on the information available and current interpretation of the rules, the Company has made reasonable estimates of the impact of the reduction in the corporate tax rate and re-measurement of certain deferred tax assets and liabilities based on the rate at which they were expected to reverse in the future. The Company is still analyzing certain provisional estimates for the Liberty and Sovereign acquisitions with respect to loans, bank premises, furniture and equipment, goodwill, intangible assets, deposits and deferred taxes. Any changes to these provisional estimates and re-measurement of deferred taxes could potentially have an impact on our future earnings and our effective tax rate.
Results of Operations for the Fiscal Years Ended December 31, 2016 and December 31, 2015
General
Net income available to common stockholders for the year ended December 31, 2016 was $12.6 million, an increase of $3.9 million, or 44.4%, from net income available to common stockholders of $8.7 million for the year ended December 31, 2015. Basic earnings per share for the year ended December 31, 2016 was $1.16, an increase of $0.30 from $0.86 for the year ended December 31, 2015. Diluted earnings per share for the year ended December 31, 2016 was $1.13, an increase of $0.29 from $0.84 for the year ended December 31, 2015.
45
Net Interest Income
For the year ended December 31, 2016, net interest income totaled $41.0 million compared with net interest income of $31.5 million for the year ended December 31, 2015, an increase of $9.5 million, or 30.2%. This increase was primarily due to a $11.7 million, or 33.4%, increase in interest income resulting from growth in the Company’s average interest-earning assets which was partially offset by an increase in interest expense of $2.2 million, or 63.0%, for the year ended December 31, 2016. Interest income was $46.6 million compared to $34.9 million for the years ended December 31, 2016 and 2015, respectively. The primary driver of increased interest income was the growth on interest earned on average loans. Interest earned on average loans outstanding for the year ended December 31, 2016 compared to average loans outstanding for the year ended December 31, 2015 increased $11.0 million, or 32.7%. The growth in average loans was the result of the acquisition of IBT Bancorp, Inc. (“IBT”), which closed on July 1, 2015, new loan originations, and growth of existing customer loan balances. Average loan balances grew from $697.4 million for the year ended December 31, 2015 to $924.5 million for the year ended December 31, 2016, an increase of $227.0 million, or 32.6%.
Interest expense for the year ended December 31, 2016 was $5.6 million compared to $3.5 million for the year ended December 31, 2015, an increase of $2.2 million, or 63.0%. The year-over-year increase was due to growth of average interest bearing-liabilities of $238.4 million, or 47.5%, primarily due to the increase in interest bearing liabilities acquired in the IBT acquisition and organic growth in average interest bearing deposits, advances from FHLB and other borrowings.
Net interest margin and net interest spread were 3.72% and 3.47%, respectively, for the year ended December 31, 2016 compared to 3.80% and 3.53%, respectively, for the year ended December 31, 2015. The decrease in net interest margin by 8 basis points and decrease in net interest spread by 6 basis points was primarily due to an increase in the average yield paid on interest-bearing liabilities by 7 basis points. The average interest paid on interest-bearing liabilities increased to 0.76% during the year ended December 31, 2016 from 0.69% for the year ended December 31, 2015. Competition for new deposits in our market reduced our ability to grow noninterest-bearing deposits consistent with prior year’s growth rate. The average balance of noninterest-bearing deposits grew to $302.5 million from $267.6 million for the year ended December 31, 2015, an increase of $35.0 million, or 13.1%. The ratio of average noninterest-bearing deposits to average noninterest-bearing deposits plus average interest-bearing deposits declined to 30.5% for the year-ended December 31, 2016 from 36.0% for the year ended December 31, 2015. Average interest-bearing deposits grew to $689.0 million for the year ended December 31, 2016 from $475.0 million for the year ended December 31, 2015, an increase of $213.9 million, or 45.0%, which was primarily due to increases in average outstanding money market balances. This was the result of new relationships originated from our new correspondent banking group that successfully grew our financial institution money market deposit product. This product was offered at an introductory rate above the average rate paid on our traditional money market accounts and, as a result, interest-bearing deposit rates increased to 0.72% from 0.61%. Partially offsetting this increase was a decrease in the average rate paid on advances from FHLB as average balances outstanding grew to $43.6 million with an average yield of 0.60% for the year ended December 31, 2016 from $18.1 million with an average yield of 0.88% for the year ended December 31, 2015.
The following table presents, for the periods indicated, an analysis of net interest income by each major category of interest-earning assets and interest-bearing liabilities, the average amounts outstanding and the interest earned or paid on such amounts. The table also sets forth the average rate earned on interest-earning assets, the average rate paid on interest-bearing liabilities, and the net interest margin on average total interest-earning assets for the same periods. Interest earned on loans that are classified as non-accrual is not recognized in income; however, the balances are reflected in average outstanding balances for the period. For the years ended December 31, 2016 and 2015, interest income not recognized on non-accrual loans was minimal. Any non-accrual loans have been included in the table as loans carrying a zero yield.
46
For the Year Ended December 31, | |||||||||||||||||||||
2016 | 2015 | ||||||||||||||||||||
Average Outstanding Balance | Interest Earned/ Interest Paid | Average Yield/ Rate | Average Outstanding Balance | Interest Earned/ Interest Paid | Average Yield/ Rate | ||||||||||||||||
(Dollars in thousands) | |||||||||||||||||||||
Assets | |||||||||||||||||||||
Interest-earning assets: | |||||||||||||||||||||
Total loans(1) | $ | 924,465 | $ | 44,681 | 4.83 | % | $ | 697,439 | $ | 33,680 | 4.83 | % | |||||||||
Securities available for sale | 84,558 | 1,409 | 1.67 | 59,088 | 997 | 1.69 | |||||||||||||||
Investment in subsidiary | 93 | 2 | 2.15 | 93 | 2 | 2.15 | |||||||||||||||
Interest-earning deposits in financial institutions | 93,199 | 503 | 0.54 | 70,630 | 241 | 0.34 | |||||||||||||||
Total interest-earning assets | 1,102,315 | 46,595 | 4.23 | 827,250 | 34,920 | 4.22 | |||||||||||||||
Allowance for loan losses | (7,743 | ) | (6,419 | ) | |||||||||||||||||
Noninterest-earning assets | 94,199 | 78,006 | |||||||||||||||||||
Total assets | $ | 1,188,771 | $ | 898,837 | |||||||||||||||||
Liabilities and Stockholders’ Equity | |||||||||||||||||||||
Interest-bearing liabilities: | |||||||||||||||||||||
Interest-bearing deposits | $ | 688,978 | $ | 4,988 | 0.72 | % | $ | 475,034 | $ | 2,918 | 0.61 | % | |||||||||
Advances from FHLB | 43,649 | 260 | 0.60 | % | 18,055 | 159 | 0.88 | ||||||||||||||
Other borrowings | 8,077 | 392 | 4.85 | % | 9,212 | 384 | 4.17 | ||||||||||||||
Total interest-bearing liabilities | 740,704 | 5,640 | 0.76 | 502,301 | 3,461 | 0.69 | |||||||||||||||
Noninterest-bearing liabilities: | |||||||||||||||||||||
Noninterest-bearing deposits | 302,548 | 267,550 | |||||||||||||||||||
Other liabilities | 2,937 | 2,408 | |||||||||||||||||||
Total noninterest-bearing liabilities | 305,485 | 269,958 | |||||||||||||||||||
Stockholders’ equity | 142,582 | 126,578 | |||||||||||||||||||
Total liabilities and stockholders’ equity | $ | 1,188,771 | $ | 898,837 | |||||||||||||||||
Net interest rate spread(2) | 3.47 | % | 3.53 | % | |||||||||||||||||
Net interest income | $ | 40,955 | $ | 31,459 | |||||||||||||||||
Net interest margin(3) | 3.72 | % | 3.80 | % | |||||||||||||||||
__________________
(1) | Includes average outstanding balances of loans held for sale of $5,078, and $3,134 for the years ended December 31, 2016 and 2015, respectively. |
(2) | Net interest rate spread is the average yield on interest-earning assets minus the average rate on interest-bearing liabilities. |
(3) | Net interest margin is equal to net interest income divided by average interest-earning assets. |
47
The following table presents information regarding the dollar amount of changes in interest income and interest expense for the periods indicated for each major component of interest-earning assets and interest-bearing liabilities and distinguishes between the changes attributable to changes in volume and changes attributable to changes in interest rates. For purposes of this table, changes attributable to both rate and volume that cannot be segregated have been allocated to rate.
For the Year Ended | |||||||||||
December 31, 2016 vs. 2015 | |||||||||||
Increase | |||||||||||
(Decrease) | |||||||||||
Due to Change in | |||||||||||
Volume | Rate | Total | |||||||||
(Dollars in thousands) | |||||||||||
Interest-earning assets: | |||||||||||
Total loans | $ | 7,552 | $ | (1,108 | ) | $ | 6,444 | ||||
Securities available for sale | 172 | (14 | ) | 158 | |||||||
Other investments | — | (1 | ) | (1 | ) | ||||||
Interest-earning deposits in other banks | 22 | 37 | 59 | ||||||||
Total increase (decrease) in interest income | 7,746 | (1,086 | ) | 6,660 | |||||||
Interest-bearing liabilities: | |||||||||||
Interest-bearing deposits | 654 | (158 | ) | 496 | |||||||
Advances from FHLB | 16 | 25 | 41 | ||||||||
Other borrowings | 53 | (48 | ) | 5 | |||||||
Total increase (decrease) in interest expense | 723 | (181 | ) | 542 | |||||||
Increase (decrease) in net interest income | $ | 7,023 | $ | (905 | ) | $ | 6,118 | ||||
Provision for Loan Losses
Our provision for loan losses is a charge to income in order to bring our allowance for loan losses to a level deemed appropriate by management. For a description of the factors taken into account by management in determining the allowance for loan losses see “-Financial Condition-Allowance for Loan Losses.” The provision for loan losses was $2.1 million for the year ended December 31, 2016, compared to $868 thousand for the same period in 2015, an increase of $1.2 million or 136.2%. The increase in provision expense was due mainly to loan growth as well an increase in general reserves due to changes in qualitative factors around the nature, volume and mix of the loan portfolio for the year ended December 31, 2016 as compared to the same period in 2015. In addition, loans totaling approximately $88.5 million were acquired as part of the IBT acquisition in July of 2015. No provision was recorded for these loans as they were recorded at the purchase date fair value and there has been no significant credit deterioration since the acquisition date, requiring additional credit loss provision. In addition, net charge-offs increased $221 thousand for the year ended December 31, 2016 compared to the same period in 2015.
Noninterest Income
Our primary sources of recurring noninterest income are service charges on deposit accounts, gains on the sale of loans and other real estate owned and income from bank-owned life insurance. Noninterest income does not include loan origination fees to the extent they exceed the direct loan origination costs, which are generally recognized over the life of the related loan as an adjustment to yield using the interest method.
48
The following table presents, for the periods indicated, the major categories of noninterest income:
For the | |||||||||||
Year Ended | |||||||||||
December 31, | |||||||||||
Increase | |||||||||||
2016 | 2015 | (Decrease) | |||||||||
(Dollars in thousands) | |||||||||||
Noninterest income: | |||||||||||
Service charges and fees on deposit accounts | $ | 1,846 | $ | 1,326 | $ | 520 | |||||
Gain on sales of investment securities | 15 | 7 | 8 | ||||||||
Gain on sales of loans | 3,288 | 1,273 | 2,015 | ||||||||
Gain on sales of other assets owned | — | — | — | ||||||||
Bank-owned life insurance | 771 | 747 | 24 | ||||||||
Other | 583 | 351 | 232 | ||||||||
Total noninterest income | $ | 6,503 | $ | 3,704 | $ | 2,799 | |||||
Noninterest income for the year ended December 31, 2016 increased $2.8 million, or 75.6%, to $6.5 million compared to noninterest income of $3.7 million for the same period in 2015. The primary components of the increase were as follows:
Service charges and fees on deposit accounts. We earn service charges and fees from our customers for deposit-related activities. The income from these deposit activities constitutes a significant and predictable component of our noninterest income. Service charges and fees on deposit accounts were $1.8 million for the year ended December 31, 2016, an increase of $520 thousand, or 39.2%, over the same period in 2015. This increase was attributable to growth in the number of deposit accounts, transaction fees and service charges from new and existing customers and from a full year of fees in 2016 from accounts acquired in the acquisition of IBT on July 1, 2015.
Gain on sales of loans. We originate SBA guaranteed loans and long-term fixed-rate mortgage loans for resale into the secondary market. Income from sale on loans was $3.3 million for the year ended December 31, 2016 compared to $1.3 million for the year ended December 31, 2015. The increase of $2.0 million, or 162.2%, was primarily due to increased sales of SBA-guaranteed loans resulting in incremental gains of $1.1 million, increased number of mortgage loans sold resulting in increased gains of $702 thousand, and a non-recurring gain on the sale of a loan acquired in the IBT acquisition of $193 thousand.
Bank-owned life insurance. We invest in BOLI due to its attractive nontaxable return and protection against the loss of our key employees. We record income based on the growth of the cash surrender value of these policies as well as the annual yield. Income from BOLI increased $24 thousand, or 3.2%, for the year ended December 31, 2016 compared to the same period in 2015. The increase of $24 thousand in income was primarily attributable to $1.0 million additional BOLI from the acquisition of IBT.
Other. Other noninterest income was $583 thousand for the year ended December 31, 2016, an increase of $232 thousand, or 66.1%, compared to the same period in 2015. The increase was in part related to a $151 thousand increase in late charges on loans of which $107 thousand was received from a single customer on the pay off of their past due loan during the year ended December 31, 2016. Additionally, $43 thousand of the increase in other income was as a result of the collection of a loan that was fully charged off by IBT prior to our acquisition of IBT in July of 2015. Finally, dividends on FHLB and FRB stock increased $56 thousand from $163 thousand during the year ended December 31, 2015 to $219 thousand during the year ended December 31, 2016. This increase is attributable to the purchase of an additional $2.6 million and $624 thousand of FHLB and FRB stock, respectively, during the year ended December 31, 2016.
Noninterest Expense
Noninterest expense is composed of all employee expenses and costs associated with operating our facilities, acquiring and retaining customer relationships and providing bank services. The major component of noninterest expense is salaries and employee benefits. Noninterest expense also includes operational expenses such as occupancy expenses, depreciation and amortization of office equipment, professional fees and regulatory fees, including FDIC assessments, data processing expenses, and advertising and promotion expenses.
49
The following table presents, for the periods indicated, the major categories of noninterest expense:
For the Year Ended | |||||||||||
December 31, | |||||||||||
Increase | |||||||||||
2016 | 2015 | (Decrease) | |||||||||
(Dollars in thousands) | |||||||||||
Salaries and employee benefits | $ | 14,332 | $ | 11,265 | $ | 3,067 | |||||
Non-staff expenses: | |||||||||||
Occupancy and equipment | 3,667 | 3,477 | 190 | ||||||||
Professional fees | 2,804 | 2,023 | 781 | ||||||||
Data processing and software expense | 1,158 | 1,216 | (58 | ) | |||||||
FDIC assessment fees | 661 | 448 | 213 | ||||||||
Marketing | 983 | 799 | 184 | ||||||||
Other assets owned expenses and write-downs | 163 | 53 | 110 | ||||||||
Amortization of intangibles | 380 | 338 | 42 | ||||||||
Telephone and communications | 402 | 263 | 139 | ||||||||
Other | 1,840 | 1,506 | 334 | ||||||||
Total noninterest expense | $ | 26,390 | $ | 21,388 | $ | 5,002 | |||||
Noninterest expense for the year ended December 31, 2016 increased $5.0 million, or 23.4%, to $26.4 million compared to noninterest expense of $21.4 million for the same period in 2015. The most significant components of the increase were as follows:
Salaries and employee benefits. Salaries and employee benefits include payroll expenses, the cost of incentive compensation, benefit plans, health insurance and payroll taxes. The level of employee expense is impacted by the amount of direct loan origination costs which are required to be deferred in accordance with ASC 310-20 (formerly FAS91). Salaries and employee benefits were $14.3 million for the year ended December 31, 2016, an increase of $3.1 million, or 27.2%, compared to the same period in 2015. The increase was primarily attributable to the addition of 15 full-time equivalent employees during 2016 and higher incentive and benefit costs as a result of a full twelve months expense in 2016 associated with the employees acquired with the acquisition of IBT on July 1, 2015. As of December 31, 2016, we had 162 full-time equivalent employees. Salaries and employee benefits included $983 thousand and $633 thousand in stock-based compensation expense for the years ended December 31, 2016 and 2015, respectively.
Occupancy and equipment. Occupancy and equipment expense includes lease expense, building depreciation and related facilities costs as well as furniture, fixture and equipment depreciation, small equipment purchases and maintenance expense. Our expense associated with occupancy and equipment was $3.7 million for the year ended December 31, 2016 compared to $3.5 million for the same period in 2015. The increase of $190 thousand, or 5.5%, was primarily the result of increased lease expense, building depreciation, utilities and maintenance as a result of a full twelve months of expense associated with facilities acquired with the acquisition of IBT on July 1, 2015 and increased hardware and software costs.
Professional fees. This category includes legal, investment bank, director, stock transfer agent fees and other public company services, information technology support, audit services and regulatory assessment expense. Professional fees were $2.8 million for the year ended December 31, 2016, an increase of $781 thousand, or 38.6%, compared to the same period in 2015. The increase was due to increases in directors’ fees of $240 thousand, SEC filing and reporting expenses of $66 thousand and audit and regulatory expenses of $312 thousand. In addition, acquisition related expense included within professional services and legal fees increased $58 thousand during 2016 compared to the same period in 2015.
FDIC assessment fees. FDIC assessment fees were $661 thousand for the year ended December 31, 2016 and $448 thousand for the same period during 2015. The increase was primarily attributable to a higher assessment associated with both a higher assessment base due to an increase in average assets from organic growth and growth through the IBT acquisition on July 1, 2015 and a higher assessment rate implemented in the third quarter of 2016.
50
Other. This category includes operating and administrative expenses including loan operations and collections, supplies and printing, online and card interchange expense, ATM/debit card processing, postage and delivery, BOLI mortality expense, insurance and security expenses. Other noninterest expense increased $334 thousand, or 22.2%, to $1.8 million for the year ended December 31, 2016, compared to $1.5 million for the same period in 2015 primarily related to operating expenses associated with the addition of IBT, organic growth in deposit and loan volume, and additional staffing levels. Operating expense increases include increases in loan and collection expense of $174 thousand, security expense of $66 thousand, education and training of $43 thousand, and dues and memberships and subscriptions of $42 thousand.
Income Tax Expense
The amount of income tax expense is a function of our pre-tax income, tax-exempt income and other nondeductible expenses. Deferred tax assets and liabilities reflect current statutory income tax rates in effect for the period in which the deferred tax assets and liabilities are expected to be realized or settled. As changes in tax laws or rates are enacted, deferred tax assets and liabilities are adjusted through the provision for income taxes. Valuation allowances are established when necessary to reduce deferred tax assets to the amount expected to be realized. As of December 31, 2016, the Company did not believe a valuation allowance was necessary.
For the year ended December 31, 2016, income tax expense totaled $6.5 million, an increase of $2.4 million, or 57.1%, compared to $4.1 million for the same period in 2015. The increase was primarily attributable to the $6.1 million increase in net operating income from $12.9 million for the year ended December 31, 2015 to $19.0 million for the same period in 2016.
The Company’s estimated annual effective tax rate, before reporting the net impact of discrete items, was approximately 34.1% and 33.3% for the years ended December 31, 2016 and 2015, respectively. The increase in effective tax rates for the year ended December 31, 2016 was affected primarily by increases in our federal statutory rate from 34% to 35%. The effective tax rate is below our statutory rate primarily due to tax exempt income generated from BOLI and municipal securities.
Financial Condition
Our total assets were $2.9 billion and $1.4 billion as of December 31, 2017 and 2016 , respectively. Assets increased $1.5 billion, or 109.1%, from December 31, 2016 to December 31, 2017. Our asset growth was due to the successful execution of our strategy to establish deep relationships in the Dallas-Fort Worth metroplex as well as successfully closing the Sovereign and Liberty acquisitions with fair value acquired assets of $1.1 billion and $401.9 million, respectively. We believe these relationships and acquisitions will bring in new customer accounts and grow balances from existing loan and deposit customers.
Loan Portfolio
Our primary source of income is interest on loans to individuals, professionals, small to medium-sized businesses and commercial companies located in the Dallas-Fort Worth metroplex and Houston metropolitan area. Our loan portfolio consists primarily of commercial loans and real estate loans secured by commercial real estate properties located in our primary market areas. Our loan portfolio represents the highest yielding component of our earning asset base.
As of December 31, 2017, total loans were $2.2 billion, an increase of $1.2 billion, or 125.2%, compared to $991.9 million as of December 31, 2016. These increases were primarily due the acquired loans from Sovereign and Liberty with an acquisition date fair value of $752.5 million and $312.6 million, respectively, as well as organic growth in new originations from the addition of experienced commercial bankers and our continued penetration in our primary market areas. In addition to these amounts, $841 thousand and $5.2 million were loans classified as held for sale as of December 31, 2017 and 2016, respectively.
Total loans as a percentage of deposits were 98.0% and 94.5% as of December 31, 2017 and December 31, 2016, respectively. Total loans as a percentage of assets were 75.8% and 78.9% as of December 31, 2017 and December 31, 2016, respectively.
51
The following table summarizes our loan portfolio by type of loan as of the dates indicated:
As of December 31, | ||||||||||||||||||||||||||||||||||
2017 | 2016 | 2015 | 2014 | 2013 | ||||||||||||||||||||||||||||||
Amount | Percent | Amount | Percent | Amount | Percent | Amount | Percent | Amount | Percent | |||||||||||||||||||||||||
(Dollars in thousands) | ||||||||||||||||||||||||||||||||||
Commercial | $ | 684,551 | 30.6 | % | $ | 291,416 | 29.4 | % | $ | 246,124 | 30.0 | % | $ | 207,101 | 34.3 | % | $ | 160,823 | 32.5 | % | ||||||||||||||
Real estate: | ||||||||||||||||||||||||||||||||||
Construction and land | 277,825 | 12.4 | 162,614 | 16.4 | 126,422 | 15.4 | 69,966 | 11.6 | 47,643 | 9.6 | ||||||||||||||||||||||||
Farmland | 9,385 | 0.4 | 8,262 | 0.8 | 11,696 | 1.4 | 10,528 | 1.7 | 11,656 | 2.4 | ||||||||||||||||||||||||
1 - 4 family residential | 251,665 | 11.3 | 140,137 | 14.1 | 137,704 | 16.8 | 105,788 | 17.5 | 86,908 | 17.5 | ||||||||||||||||||||||||
Multi-family residential | 91,152 | 4.1 | 14,683 | 1.5 | 8,695 | 1.1 | 9,964 | 1.7 | 11,862 | 2.4 | ||||||||||||||||||||||||
Commercial Real Estate | 909,292 | 40.7 | 370,696 | 37.4 | 284,622 | 34.7 | 195,839 | 32.5 | 171,451 | 34.6 | ||||||||||||||||||||||||
Consumer | 9,648 | 0.4 | 4,089 | 0.4 | 5,304 | 0.6 | 4,124 | 0.7 | 4,927 | 1.0 | ||||||||||||||||||||||||
Total loans held for investment | $ | 2,233,518 | 100 | % | $ | 991,897 | 100 | % | $ | 820,567 | 100 | % | $ | 603,310 | 100 | % | $ | 495,270 | 100 | % | ||||||||||||||
Total loans held for sale | $ | 841 | $ | 5,208 | $ | 2,831 | $ | 8,858 | $ | 2,051 | ||||||||||||||||||||||||
Commercial. Our commercial loans are underwritten after evaluating and understanding the borrower’s ability to operate profitably and effectively. These loans are primarily made based on the identified cash flows of the borrower, and secondarily, on the underlying collateral provided by the borrower. Most commercial loans are secured by the assets being financed or other business assets, such as accounts receivable or inventory, and generally include personal guarantees.
Commercial loans increased $393.1 million, or 134.9%, to $684.6 million as of December 31, 2017 from $291.4 million as of December 31, 2016. The increase was due to the acquisition of commercial loans in our acquisitions with Sovereign and Liberty as well as growth in origination volumes in the Dallas-Fort Worth metroplex.
Construction and land. Our construction and land development loans consist of loans to fund construction, land acquisition and land development construction. The properties securing the portfolio are primarily located throughout north Texas and are generally diverse in terms of type.
Construction and land loans increased $115.2 million, or 70.8%, to $277.8 million as of December 31, 2017 from $162.6 million as of December 31, 2016. This increase was due to the acquisition of construction and land loans in our acquisitions with Sovereign and Liberty as well as a robust business environment in the Dallas-Fort Worth metroplex.
1-4 family residential. Our 1-4 family residential loans consist of loans secured by single family homes, which are both owner-occupied and investor owned. Our 1-4 family residential loans have a relatively small balance spread between many individual borrowers.
1-4 family residential loans increased $111.5 million, or 79.6%, to $251.7 million as of December 31, 2017 from $140.1 million as of December 31, 2016. This increase is a result of the acquisition of 1-4 family residential loans in our acquisitions with Sovereign and Liberty as well as strong housing demand in our primary market areas.
Commercial Real Estate. Our commercial real estate loans are underwritten primarily based on projected cash flows and, secondarily, as loans secured by real estate. These loans may be more adversely affected by conditions in the real estate markets or in the general economy. The properties securing the portfolio are located throughout north Texas and are generally diverse in terms of type. This diversity helps reduce the exposure to adverse economic events that affect any single industry.
Commercial real estate loans increased $538.6 million, or 145.3%, to $909.3 million as of December 31, 2017 from $370.7 million as of December 31, 2016. The increase is due to the acquisition of commercial loans in our acquisitions with Sovereign and Liberty as well as continued demand within our primary market areas.
Other loan categories. Other categories of loans included in our loan portfolio include farmland and agricultural loans made to farmers and ranchers relating to their operations, multi-family residential loans and consumer loans. None of these categories of loans represents a significant portion of our total loan portfolio.
52
The contractual maturity ranges of loans in our loan portfolio and the amount of such loans with fixed and floating interest rates in each maturity range as of date indicated are summarized in the following tables:
As of December 31, 2017 | |||||||||||||||
One Year | One Through | After | |||||||||||||
or Less | Five Years | Five Years | Total | ||||||||||||
(Dollars in thousands) | |||||||||||||||
Commercial | $ | 309,400 | $ | 296,078 | $ | 79,073 | $ | 684,551 | |||||||
Real estate: | |||||||||||||||
Construction and land | 156,681 | 105,943 | 15,201 | 277,825 | |||||||||||
Farmland | 1,596 | 7,695 | 94 | 9,385 | |||||||||||
1 - 4 family residential | 23,327 | 65,562 | 162,776 | 251,665 | |||||||||||
Multi-family residential | 59,289 | 27,155 | 4,708 | 91,152 | |||||||||||
Commercial Real Estate | 146,159 | 560,715 | 202,418 | 909,292 | |||||||||||
Consumer | 2,430 | 6,403 | 815 | 9,648 | |||||||||||
Total loans | $ | 698,882 | $ | 1,069,551 | $ | 465,085 | $ | 2,233,518 | |||||||
Amounts with fixed rates | $ | 196,492 | $ | 478,764 | $ | 126,149 | $ | 801,405 | |||||||
Amounts with floating rates | $ | 502,390 | $ | 590,787 | $ | 338,936 | $ | 1,432,113 | |||||||
December 31, 2016 | |||||||||||||||
One Year | One Through | After | |||||||||||||
or Less | Five Years | Five Years | Total | ||||||||||||
(Dollars in thousands) | |||||||||||||||
Commercial | $ | 192,357 | $ | 65,793 | $ | 33,266 | $ | 291,416 | |||||||
Real estate: | |||||||||||||||
Construction and land | 100,766 | 48,813 | 13,035 | 162,614 | |||||||||||
Farmland | 5,692 | 2,549 | 20 | 8,261 | |||||||||||
1 - 4 family residential | 16,211 | 98,945 | 24,981 | 140,137 | |||||||||||
Multi-family residential | 2,860 | 11,824 | — | 14,684 | |||||||||||
Commercial Real Estate | 90,547 | 210,628 | 69,521 | 370,696 | |||||||||||
Consumer | 1,094 | 2,583 | 412 | 4,089 | |||||||||||
Total loans | $ | 409,527 | $ | 441,135 | $ | 141,235 | $ | 991,897 | |||||||
Amounts with fixed rates | $ | 93,468 | $ | 223,068 | $ | 82,953 | $ | 399,489 | |||||||
Amounts with floating rates | $ | 316,059 | $ | 218,067 | $ | 58,282 | $ | 592,408 | |||||||
Nonperforming Assets
Loans are considered past due if the required principal and interest payments have not been received as of the date such payments were due. Loans are placed on non-accrual status when, in management’s opinion, the borrower may be unable to meet payment obligations as they become due, as well as when required by regulatory provisions. Loans may be placed on non-accrual status regardless of whether or not such loans are considered past due. When interest accrual is discontinued, all unpaid accrued interest is reversed. Interest income is subsequently recognized only to the extent cash payments are received in excess of principal due. Loans are returned to accrual status when all the principal and interest amounts contractually due are brought current and future payments are reasonably assured.
We have several procedures in place to assist us in maintaining the overall quality of our loan portfolio. We have established underwriting guidelines to be followed by our bankers, and we also monitor our delinquency levels for any negative or adverse trends. Nevertheless, our loan portfolio could become subject to increasing pressures from deteriorating borrower credit due to general economic conditions.
53
We believe our conservative lending approach and focused management of nonperforming assets has resulted in sound asset quality and timely resolution of problem assets. We had $0.9 million in nonperforming assets as of December 31, 2017 compared to $2.4 million in nonperforming assets as of December 31, 2016. We had $0.5 million in nonperforming loans as of December 31, 2017 compared to $1.8 million as of December 31, 2016.
After the year ended December 31, 2017 and within the measurement period to determine fair values of acquired identified assets and assumed liabilities from the Sovereign acquisition, we obtained new information on an acquired loan regarding conditions that existed as of the acquisition date and determined that the loan met the criteria to be classified as purchased credit impaired (“PCI”). PCI loans are generally reported as accrual loans unless significant concerns exist related to the predictability of the timing and amount of future cash flows. As a result of this change in loan classification, there was a $13.4 million decrease in non-accrual loans after the year-ended December 31, 2017 since there are not significant concerns that exist regarding the predictability of the timing and amount of future cash flows for this acquired loan.
The following table presents information regarding nonperforming loans at the dates indicated:
As of December 31, | |||||||||||||||||||
2017 | 2016 | 2015 | 2014 | 2013 | |||||||||||||||
(Dollars in thousands) | |||||||||||||||||||
Non-accrual loans(1) | $ | 465 | $ | 941 | $ | 591 | $ | 436 | $ | 1,117 | |||||||||
Accruing loans 90 or more days past due | 18 | 835 | 84 | — | 9 | ||||||||||||||
Total nonperforming loans | 483 | 1,776 | 675 | 436 | 1,126 | ||||||||||||||
Other real estate owned: | |||||||||||||||||||
Commercial real estate, construction, land and land development | 449 | 493 | 493 | 55 | 1,797 | ||||||||||||||
Residential real estate | — | 169 | — | 50 | — | ||||||||||||||
Total other assets owned | 449 | 662 | 493 | 105 | 1,797 | ||||||||||||||
Total nonperforming assets | $ | 932 | $ | 2,438 | $ | 1,168 | $ | 541 | $ | 2,923 | |||||||||
Restructured loans—non-accrual | $ | 15 | $ | 170 | $ | 288 | $ | 597 | $ | 1,611 | |||||||||
Restructured loans—accruing | $ | 603 | $ | 652 | $ | 1,439 | $ | 1,080 | $ | 2,465 | |||||||||
Ratio of nonperforming loans to total loans | 0.02 | % | 0.18 | % | 0.08 | % | 0.07 | % | 0.23 | % | |||||||||
Ratio of nonperforming assets to total assets | 0.03 | % | 0.17 | % | 0.11 | % | 0.07 | % | 0.44 | % | |||||||||
(1) Does not include PCI loans.
The following table presents non-accrual loans by category at the dates indicated:
As of December 31, | |||||||||||||||||||
2017 | 2016 | 2015 | 2014 | 2013 | |||||||||||||||
(Dollars in thousands) | |||||||||||||||||||
Real estate: | |||||||||||||||||||
Construction and land | $ | — | $ | — | $ | — | $ | — | $ | 76 | |||||||||
1 - 4 family residential | — | — | 187 | — | 1,041 | ||||||||||||||
Nonfarm residential | 61 | — | — | 375 | — | ||||||||||||||
Commercial | 398 | 930 | 383 | 34 | — | ||||||||||||||
Consumer | 6 | 11 | 21 | 27 | — | ||||||||||||||
Total | $ | 465 | $ | 941 | $ | 591 | $ | 436 | $ | 1,117 | |||||||||
54
Potential Problem Loans
From a credit risk standpoint, we classify loans in one of four categories: pass, special mention, substandard or doubtful. Loans classified as loss are charged-off. Loans not rated special mention, substandard, doubtful, or loss are classified as pass loans. The classifications of loans reflect a judgment about the risks of default and loss associated with the loan. We review the ratings on credits monthly. Ratings are adjusted to reflect the degree of risk and loss that is felt to be inherent in each credit as of each monthly reporting period. All classified credits are evaluated for impairments. If impairment is determined to exist, a specific reserve is established. Our methodology is structured so that specific allocations are increased in accordance with deterioration in credit quality (and a corresponding increase in risk and loss) or decreased in accordance with improvement in credit quality (and a corresponding decrease in risk and loss).
Credits rated special mention show clear signs of financial weaknesses or deterioration in credit worthiness, however, such concerns are not so pronounced that we generally expect to experience significant loss within the short-term. Such credits typically maintain the ability to perform within standard credit terms and credit exposure is not as prominent as credits with a lower rating.
Credits rated substandard are those in which the normal repayment of principal and interest may be, or has been, jeopardized by reason of adverse trends or developments of a financial, managerial, economic or political nature, or important weaknesses which exist in collateral. A protracted workout on these credits is a distinct possibility. Prompt corrective action is therefore required to strengthen our position, and/or to reduce exposure and to assure that adequate remedial measures are taken by the borrower. Credit exposure becomes more likely in such credits and a serious evaluation of the secondary support to the credit is performed.
Credits rated doubtful are those in which full collection of principal appears highly questionable, and in which some degree of loss is anticipated, even though the ultimate amount of loss may not yet be certain and/or other factors exist which could affect collection of debt. Based upon available information, positive action by the Company is required to avert or minimize loss. Credits rated doubtful are generally also placed on non-accrual.
Credits classified as purchased credit impaired are those that, at acquisition date, had the characteristics of substandard loans and it was probable, at acquisition, that all contractually required principal and interest payments would not be collected. The Company evaluates these loans on a projected cash flow basis with this evaluation performed quarterly.
The following table summarizes our internal loan ratings, including PCI loans, as of the dates indicated.
As of December 31, 2017 | |||||||||||||||||||||||
Special | |||||||||||||||||||||||
Pass | Mention | Substandard | Doubtful | PCI | Total | ||||||||||||||||||
(Dollars in thousands) | |||||||||||||||||||||||
Real estate: | |||||||||||||||||||||||
Construction and land | $ | 277,186 | $ | 639 | $ | — | $ | — | — | $ | 277,825 | ||||||||||||
Farmland | 9,336 | — | — | — | 49 | 9,385 | |||||||||||||||||
1 - 4 family residential | 250,904 | 462 | 200 | — | 99 | 251,665 | |||||||||||||||||
Multi-family residential | 91,152 | — | — | — | — | 91,152 | |||||||||||||||||
Commercial Real Estate | 882,523 | 8,771 | 681 | — | 17,317 | 909,292 | |||||||||||||||||
Commercial | 634,796 | 18,337 | 1,155 | 116 | 30,147 | 684,551 | |||||||||||||||||
Consumer | 9,540 | — | 108 | — | — | 9,648 | |||||||||||||||||
Total | $ | 2,155,437 | $ | 28,209 | $ | 2,144 | $ | 116 | $ | 47,612 | $ | 2,233,518 | |||||||||||
55
As of December 31, 2016 | |||||||||||||||||||
Special | |||||||||||||||||||
Pass | Mention | Substandard | Doubtful | Total | |||||||||||||||
(Dollars in thousands) | |||||||||||||||||||
Real estate: | |||||||||||||||||||
Construction and land | $ | 162,614 | $ | — | $ | — | $ | — | $ | 162,614 | |||||||||
Farmland | 8,262 | — | — | — | 8,262 | ||||||||||||||
1 - 4 family residential | 139,212 | 710 | 215 | — | 140,137 | ||||||||||||||
Multi-family residential | 14,683 | — | — | — | 14,683 | ||||||||||||||
Commercial Real Estate | 368,370 | 2,326 | — | — | 370,696 | ||||||||||||||
Commercial | 289,589 | 686 | 1,034 | 107 | 291,416 | ||||||||||||||
Consumer | 4,078 | — | 11 | — | 4,089 | ||||||||||||||
Total | $ | 986,808 | $ | 3,722 | $ | 1,260 | $ | 107 | $ | 991,897 | |||||||||
Allowance for Loan Losses
We maintain an allowance for loan losses that represents management’s best estimate of the loan losses and risks inherent in the loan portfolio. In determining the allowance for loan losses, we estimate losses on specific loans, or groups of loans, where the probable loss can be identified and reasonably determined. The balance of the allowance for loan losses is based on internally assigned risk classifications of loans, historical loan loss rates, changes in the nature of the loan portfolio, overall portfolio quality, industry concentrations, delinquency trends, current economic factors and the estimated impact of current economic conditions on certain historical loan loss rates. For additional discussion of our methodology, please refer to “—Critical Accounting Policies—Loans and Allowance for Loan Losses.”
In connection with our review of the loan portfolio, we consider risk elements attributable to particular loan types or categories in assessing the quality of individual loans. Some of the risk elements we consider include:
• | for commercial and industrial loans, the operating results of the commercial, industrial or professional enterprise, the borrower’s business, professional and financial ability and expertise, the specific risks and volatility of income and operating results typical for businesses in that category and the value, nature and marketability of collateral; |
• | for commercial mortgage loans and multifamily residential loans, the debt service coverage ratio (income from the property in excess of operating expenses compared to loan payment requirements), operating results of the owner in the case of owner occupied properties, the loan to value ratio, the age and condition of the collateral and the volatility of income, property value and future operating results typical of properties of that type; |
• | for 1-4 family residential mortgage loans, the borrower’s ability to repay the loan, including a consideration of the debt to income ratio and employment and income stability, the loan to value ratio, and the age, condition and marketability of the collateral; and |
• | for construction, land development and other land loans, the perceived feasibility of the project including the ability to sell developed lots or improvements constructed for resale or the ability to lease property constructed for lease, the quality and nature of contracts for presale or prelease, if any, experience and ability of the developer and loan to value ratio. |
As of December 31, 2017, the allowance for loan losses totaled $12.8 million, or 0.57%, of total loans. As of December 31, 2016, the allowance for loan losses totaled $8.5 million, or 0.86%, of total loans. The decrease in the percentage of allowance of loan losses to total loans compared to December 31, 2016 was primarily was attributable to the completion of the Sovereign acquisition on August 1, 2017 and the Liberty acquisition on December 1, 2017, as acquired loans are recorded at fair value. Ending balances for the purchase discount related to non-impaired acquired loans were $12.1 million, and $0.5 million as of December 31, 2017 and 2016, respectively. PCI loans are not considered nonperforming loans. PCI loans were $47.6 million as of December 31, 2017 and insignificant as of December 31, 2016. The increase in PCI loans during 2017 were the result of our acquisitions of Sovereign and Liberty.
56
The following table presents, as of and for the periods indicated, an analysis of the allowance for loan losses and other related data:
For the Years Ended December 31, | |||||||||||||||||||
2017 | 2016 | 2015 | 2014 | 2013 | |||||||||||||||
Average loans outstanding(1) | $ | 1,441,295 | $ | 919,387 | $ | 694,305 | $ | 546,041 | $ | 433,612 | |||||||||
Gross loans outstanding at end of period(1) | $ | 2,233,518 | $ | 991,897 | $ | 820,567 | $ | 603,310 | $ | 495,270 | |||||||||
Allowance for loan losses at beginning of period | $ | 8,524 | $ | 6,772 | $ | 5,981 | $ | 5,018 | $ | 3,238 | |||||||||
Provision for loan losses | 5,114 | 2,050 | 868 | 1,423 | 1,883 | ||||||||||||||
Charge-offs: | |||||||||||||||||||
Real estate: | |||||||||||||||||||
Construction, land and farmland | — | — | (48 | ) | (28 | ) | — | ||||||||||||
Residential | (11 | ) | — | — | (30 | ) | (85 | ) | |||||||||||
Nonfarm non-residential | — | — | — | — | — | ||||||||||||||
Commercial | (828 | ) | (314 | ) | (87 | ) | (448 | ) | (110 | ) | |||||||||
Consumer | — | (19 | ) | (5 | ) | (4 | ) | (45 | ) | ||||||||||
Total charge-offs | (839 | ) | (333 | ) | (140 | ) | (510 | ) | (240 | ) | |||||||||
Recoveries: | |||||||||||||||||||
Real estate: | |||||||||||||||||||
Construction, land and farmland | — | — | — | — | — | ||||||||||||||
Residential | — | — | — | — | 60 | ||||||||||||||
Nonfarm non-residential | — | — | 5 | 2 | — | ||||||||||||||
Commercial | 9 | 32 | 57 | 46 | 32 | ||||||||||||||
Consumer | — | 3 | 1 | 2 | 45 | ||||||||||||||
Total recoveries | 9 | 35 | 63 | 50 | 137 | ||||||||||||||
Net charge-offs | (830 | ) | (298 | ) | (77 | ) | (460 | ) | (103 | ) | |||||||||
Allowance for loan losses at end of period | $ | 12,808 | $ | 8,524 | $ | 6,772 | $ | 5,981 | $ | 5,018 | |||||||||
Ratio of allowance to end of period loans | 0.57 | % | 0.86 | % | 0.83 | % | 0.99 | % | 1.01 | % | |||||||||
Ratio of net charge-offs to average loans | 0.06 | % | 0.03 | % | 0.01 | % | 0.08 | % | 0.02 | % | |||||||||
(1) | Excluding loans held for sale and deferred loan fees. |
We believe the successful execution of our growth strategy through key acquisitions and organic growth is demonstrated by the upward trend in loan balances from December 31, 2013 to December 31, 2017. Loan balances increased from $495.3 million as of December 31, 2013, to $2.2 billion as of December 31, 2017. Our allowance has increased consistently with the growth in our loan portfolio during the same period. Further, net charge-offs have been immaterial, representing less than 0.10% of average loan balances from December 31, 2013 to December 31, 2017.
Although we believe that we have established our allowance for loan losses in accordance with accounting principles generally accepted in the United States (“GAAP”) and that the allowance for loan losses was adequate to provide for known and inherent losses in the portfolio at all times shown above, future provisions will be subject to ongoing evaluations of the risks in our loan portfolio. If we experience economic declines or if asset quality deteriorates, material additional provisions could be required.
57
The following table shows the allocation of the allowance for loan losses among our loan categories and certain other information as of the dates indicated. The allocation of the allowance for loan losses as shown in the table should neither be interpreted as an indication of future charge-offs, nor as an indication that charge-offs in future periods will necessarily occur in these amounts or in the indicated proportions. The total allowance is available to absorb losses from any loan category.
As of December 31, | ||||||||||||||||||||||||||||||||||
2017 | 2016 | 2015 | 2014 | 2013 (1) | ||||||||||||||||||||||||||||||
Percent | Percent | Percent | Percent | Percent | ||||||||||||||||||||||||||||||
Amount | to Total | Amount | to Total | Amount | to Total | Amount | to Total | Amount | to Total | |||||||||||||||||||||||||
(Dollars in thousands) | ||||||||||||||||||||||||||||||||||
Real estate: | ||||||||||||||||||||||||||||||||||
Construction and land | $ | 1,269 | 9.9 | % | $ | 1,346 | 15.8 | % | $ | 1,007 | 14.9 | % | $ | 675 | 11.3 | % | 660 | 13.2 | ||||||||||||||||
Farmland | 46 | 0.4 | 69 | 0.8 | 97 | 1.4 | 94 | 1.6 | n/a | n/a | ||||||||||||||||||||||||
1 - 4 family residential | 1,192 | 9.3 | 999 | 11.7 | 1,058 | 16 | 1,077 | 18.0 | 861 | 17.1 | ||||||||||||||||||||||||
Multi-family residential | 281 | 2.2 | 117 | 1.4 | 66 | 1.0 | 89 | 1.5 | 109 | 2.2 | ||||||||||||||||||||||||
Commercial Real Estate | 4,410 | 34.4 | 3,003 | 35.2 | 2,189 | 32.3 | 1,890 | 31.6 | 1,726 | 34.4 | ||||||||||||||||||||||||
Total real estate | $ | 7,198 | 56.2 | % | $ | 5,534 | 64.9 | % | $ | 4,417 | 65.2 | % | $ | 3,825 | 64.0 | % | $ | 3,356 | 66.9 | % | ||||||||||||||
Commercial | 5,588 | 43.6 | 2,955 | 34.7 | 2,324 | 34.3 | 2,092 | 34.9 | 1,585 | 31.6 | ||||||||||||||||||||||||
Consumer | 22 | 0.2 | 35 | 0.4 | 31 | 0.5 | 64 | 1.1 | 77 | 1.5 | ||||||||||||||||||||||||
Total allowance for loan losses | $ | 12,808 | 100 | % | $ | 8,524 | 100 | % | $ | 6,772 | 100 | % | $ | 5,981 | 100 | % | $ | 5,018 | 100 | % | ||||||||||||||
(1) | In 2013, allowance for loan loss related to farmland was included in the construction and land category. |
Securities
We use our securities portfolio to provide a source of liquidity, provide an appropriate return on funds invested, manage interest rate risk, meet collateral requirements and meet regulatory capital requirements. As of December 31, 2017, the carrying amount of investment securities totaled $228.1 million, an increase of $125.5 million, or 122.4%, compared to $102.6 million as of December 31, 2016. The increases in our investment securities in 2017 primarily resulted from our acquisitions of Sovereign and Liberty during 2017. Securities represented 7.7% and 7.3% of total assets as of December 31, 2017 and 2016, respectively.
Our investment portfolio consists entirely of securities classified as available for sale. As a result, the carrying values of our investment securities are adjusted for unrealized gain or loss, and any gain or loss is reported on an after-tax basis as a component of other comprehensive income in stockholders’ equity. The following table summarizes the amortized cost and estimated fair value of our investment securities as of the dates shown:
As of December 31, 2017 | |||||||||||||||
Gross | Gross | ||||||||||||||
Amortized | Unrealized | Unrealized | |||||||||||||
Cost | Gains | Losses | Fair Value | ||||||||||||
(Dollars in thousands) | |||||||||||||||
U.S. government agencies | $ | 10,829 | $ | 9 | $ | 18 | $ | 10,820 | |||||||
Corporate bonds | 17,500 | 330 | — | 17,830 | |||||||||||
Municipal securities | 55,499 | 189 | 211 | 55,477 | |||||||||||
Mortgage-backed securities | 91,734 | 58 | 1,068 | 90,724 | |||||||||||
Collateralized mortgage obligations | 53,559 | 9 | 925 | 52,643 | |||||||||||
Asset-backed securities | 616 | 7 | — | 623 | |||||||||||
Total | $ | 229,737 | $ | 602 | $ | 2,222 | $ | 228,117 | |||||||
58
As of December 31, 2016 | |||||||||||||||
Gross | Gross | ||||||||||||||
Amortized | Unrealized | Unrealized | |||||||||||||
Cost | Gains | Losses | Fair Value | ||||||||||||
(Dollars in thousands) | |||||||||||||||
U.S. government agencies | $ | 732 | $ | — | $ | 36 | $ | 696 | |||||||
Municipal securities | 14,540 | 2 | 500 | 14,042 | |||||||||||
Mortgage-backed securities | 49,907 | 83 | 871 | 49,119 | |||||||||||
Collateralized mortgage obligations | 38,507 | 32 | 612 | 37,927 | |||||||||||
Asset-backed securities | 764 | 11 | — | 775 | |||||||||||
Total | $ | 104,450 | $ | 128 | $ | 2,019 | $ | 102,559 | |||||||
All of our mortgage-backed securities and collateralized mortgage obligations are issued and/or guaranteed by U.S. government agencies or U.S. government-sponsored entities. We do not hold any Fannie Mae or Freddie Mac preferred stock, corporate equity, collateralized debt obligations, collateralized loan obligations, structured investment vehicles, private label collateralized mortgage obligations, subprime, Alt-A or second lien elements in our investment portfolio. As of December 31, 2017, our investment portfolio did not contain any securities that are directly backed by subprime or Alt-A mortgages.
Certain investment securities have a fair value at less than their historical cost. Management evaluates securities for other-than-temporary impairment (OTTI) on at least a quarterly basis and more frequently when economic of market conditions warrant such an evaluation. Management does not (i) have the intent to sell any investment securities prior to recovery and/or maturity and, (ii) believe it is more likely than not that the Company will not have to sell these securities prior to recovery and/or maturity and (iii) believe that the length of time and extent that fair value has been less than cost is not indicative of recoverability. For those securities in an unrealized loss position, the unrealized losses are largely due to interest rate changes. Management believes any unrealized loss in the Company’s securities at December 31, 2017 is temporary and no credit impairment has been realized in the Company’s consolidated financial statements.
The following table sets forth the fair value, maturities and approximated weighted average yield based on estimated annual income divided by the average amortized cost of our securities portfolio as of the dates indicated. The contractual maturity of a mortgage-backed security is the date at which the last underlying mortgage matures.
As of December 31, 2017 | ||||||||||||||||||||||||||||||||||
After One Year | After Five Years | |||||||||||||||||||||||||||||||||
Within | but Within | but Within | ||||||||||||||||||||||||||||||||
One Year | Five Years | Ten Years | After Ten Years | Total | ||||||||||||||||||||||||||||||
Amount | Yield | Amount | Yield | Amount | Yield | Amount | Yield | Total | Yield | |||||||||||||||||||||||||
(Dollars in thousands) | ||||||||||||||||||||||||||||||||||
U.S. government agencies | $ | — | — | % | $ | 10,509 | 2.46 | % | $ | 311 | 2.05 | % | $ | — | — | % | $ | 10,820 | 2.45 | % | ||||||||||||||
Corporate bonds | — | — | 7,830 | 5.62 | 10,000 | 5.15 | — | — | 17,830 | 5.36 | ||||||||||||||||||||||||
Municipal securities | 2,330 | 2.27 | 11,652 | 1.98 | 24,163 | 2.32 | 17,332 | 2.72 | 55,477 | 2.37 | ||||||||||||||||||||||||
Mortgage-backed securities | — | — | 52,461 | 1.90 | 34,595 | 2.51 | 3,668 | 3.07 | 90,724 | 2.18 | ||||||||||||||||||||||||
Collateralized mortgage obligations | 208 | 2.25 | 39,408 | 2.05 | 13,027 | 2.34 | — | — | 52,643 | 2.12 | ||||||||||||||||||||||||
Asset-backed securities | — | — | 623 | 2.16 | — | — | — | — | 623 | 2.16 | ||||||||||||||||||||||||
Total | $ | 2,538 | 2.27 | % | $ | 122,483 | 1.88 | % | $ | 82,096 | 2.12 | % | $ | 21,000 | 2.78 | % | $ | 228,117 | 2.06 | % | ||||||||||||||
59
As of December 31, 2016 | ||||||||||||||||||||||||||||||||||
After One Year | After Five Years | |||||||||||||||||||||||||||||||||
Within | but Within | but Within | ||||||||||||||||||||||||||||||||
One Year | Five Years | Ten Years | After Ten Years | Total | ||||||||||||||||||||||||||||||
Amount | Yield | Amount | Yield | Amount | Yield | Amount | Yield | Total | Yield | |||||||||||||||||||||||||
(Dollars in thousands) | ||||||||||||||||||||||||||||||||||
U.S. government agencies | $ | — | — | % | $ | 345 | 1.62 | % | $ | 351 | 2.02 | % | $ | — | — | % | $ | 696 | 1.82 | % | ||||||||||||||
Municipal securities | — | — | 3,630 | 2.13 | 2,995 | 1.96 | 7,417 | 2.51 | $ | 14,042 | 2.29 | |||||||||||||||||||||||
Mortgage-backed securities | — | — | 37,307 | 1.63 | 11,731 | 2.22 | 81 | 2.10 | $ | 49,119 | 1.77 | |||||||||||||||||||||||
Collateralized mortgage obligations | 262 | 2.98 | 36,850 | 1.73 | 815 | 2.42 | — | — | $ | 37,927 | 1.75 | |||||||||||||||||||||||
Asset-backed securities | — | — | 775 | 1.40 | — | — | — | — | $ | 775 | 1.40 | |||||||||||||||||||||||
Total | $ | 262 | 2.98 | % | $ | 78,907 | 1.70 | % | $ | 15,892 | 2.18 | % | $ | 7,498 | 2.51 | % | $ | 102,559 | 1.83 | % | ||||||||||||||
The contractual maturity of mortgage-backed securities, collateralized mortgage obligations and asset-backed securities is not a reliable indicator of their expected life because borrowers have the right to prepay their obligations at any time. Mortgage-backed securities, collateralized mortgage obligations and asset-backed securities are typically issued with stated principal amounts and are backed by pools of mortgage loans and other loans with varying maturities. The term of the underlying mortgages and loans may vary significantly due to the ability of a borrower to pre-pay. Monthly pay downs on mortgage-backed securities tend to cause the average life of the securities to be much different than the stated contractual maturity. During a period of increasing interest rates, fixed-rate mortgage-backed securities do not tend to experience heavy prepayments of principal and consequently, the average life of this security will be lengthened. If interest rates begin to fall, prepayments may increase, thereby shortening the estimated life of these securities. The weighted average life of our investment portfolio was 4.35 years with an estimated effective duration of 2.69 years as of December 31, 2017. The average yield of the securities portfolio was 2.03% during 2017 compared to 1.67% during 2016.
As of December 31, 2017 and December 31, 2016, we did not own securities of any one issuer other than U.S. government agency securities for which aggregate adjusted cost exceeded 10.0% of the consolidated stockholders’ equity as of such respective dates.
Deposits
We offer a variety of deposit accounts having a wide range of interest rates and terms including demand, savings, money market and time accounts. We rely primarily on competitive pricing policies, convenient locations and personalized service to attract and retain these deposits.
Total deposits as of December 31, 2017 were $2.3 billion, an increase of $1.2 billion, or 103.5%, compared to $1.1 billion as of December 31, 2016, due primarily to increases of $380.2 million, $302.6 million, and $334.0 million in money market accounts, noninterest-bearing deposit accounts, and certificates of deposit, respectively. Our deposit growth was primarily due to the acquisitions of Sovereign and Liberty in 2017 as well as our continued penetration in our primary market areas, the increase in commercial lending relationships for which we also seek deposit balances and increases in our financial institution money market accounts.
Noninterest-bearing deposits as of December 31, 2017 were $612.8 million compared to $327.6 million as of December 31, 2016, an increase of $285.2 million, or 87.1%.
Money market accounts as of December 31, 2017 were $960.1 million compared to $580.0 million as of December 31, 2016, an increase of $380.2 million, or 65.6%.
Average deposits for the year ended December 31, 2017 were $1.6 billion, an increase of $584.6 million, or 59.0% over the year average for the year ended December 31, 2016 of $991.5 million. The average rate paid on total interest-bearing deposits increased this period from 0.72% for the year ended December 31, 2016 to 0.86% for the year ended December 31, 2017. The increase in the average rate paid on interest-bearing deposits was due to the overall market condition, the introduction of our correspondent banking division, an increase in the prime rate during 2017, as well as an increase in time deposits which typically pay a higher rate.
60
The following table presents the daily average balances and weighted average rates paid on deposits for the periods indicated:
For Year Ended December 31, | |||||||||||||
2017 | 2016 | ||||||||||||
Average | Average | Average | Average | ||||||||||
Balance | Rate | Balance | Rate | ||||||||||
(Dollars in thousands) | |||||||||||||
Interest-bearing demand accounts | $ | 98,177 | 0.20 | % | $ | 71,026 | 0.22 | % | |||||
Savings accounts | 87,565 | 0.10 | 10,309 | 0.10 | |||||||||
Money market accounts | 690,225 | 0.98 | 489,793 | 0.76 | |||||||||
Certificates and other time deposits > $100k | 230,143 | 1.08 | 101,170 | 0.91 | |||||||||
Certificates and other time deposits < $100k | 44,923 | 0.79 | 16,680 | 0.88 | |||||||||
Total interest-bearing deposits | 1,151,033 | 0.86 | 688,978 | 0.72 | |||||||||
Noninterest-bearing demand accounts | 425,124 | 302,548 | |||||||||||
Total deposits | $ | 1,576,157 | 0.63 | % | $ | 991,526 | 0.50 | % | |||||
Our ratio of average noninterest-bearing deposits to average total deposits was 27.0% and 30.5% for the years ended December 31, 2017 and December 31, 2016, respectively.
Factors affecting the cost of funding our interest-bearing assets include the volume of noninterest and interest-bearing deposits, changes in market interest rates and economic conditions in our target markets and their impact on interest paid on our deposits, as well as the ongoing execution of our balance sheet management strategy. Our cost of funds was 0.63% in 2017, 0.50% in 2016 and 0.39% in 2015. Average rates on interest-bearing deposits were 0.86% in 2017, 0.72% in 2016 and 0.61% in 2015.
Borrowings
We utilize short-term and long-term borrowings to supplement deposits to fund our lending and investment activities, each of which is discussed below.
Federal Home Loan Bank advances. The FHLB allows us to borrow on a blanket floating lien status collateralized by certain securities and loans. As of December 31, 2017, December 31, 2016 and December 31, 2015, total borrowing capacity of $721.6 million, $369.4 million and $300.5 million, respectively, was available under this arrangement and $71.2 million, $38.3 million and $28.4 million, respectively, was outstanding with an average interest rate of 1.04% as of December 31, 2017, 0.60% as of December 31, 2016 and 0.88% as of December 31, 2015. Our current FHLB advances mature within six years. We utilize these borrowings to meet liquidity needs and to fund certain fixed rate loans in our portfolio.
61
The following table presents our FHLB borrowings at the dates indicated. Other than FHLB borrowings, we had no other short-term borrowings at the dates indicated.
FHLB Advances | |||
(Dollars in thousands) | |||
December 31, 2017 | |||
Amount outstanding at period-end | $ | 71,164 | |
Weighted average interest rate at period-end | 1.36 | % | |
Maximum month-end balance during the period | 71,164 | ||
Average balance outstanding during the period | 51,196 | ||
Weighted average interest rate during the period | 1.04 | % | |
December 31, 2016 | |||
Amount outstanding at period-end | $ | 38,306 | |
Weighted average interest rate at period-end | 0.77 | % | |
Maximum month-end balance during the period | 88,398 | ||
Average balance outstanding during the period | 43,649 | ||
Weighted average interest rate during the period | 0.60 | % | |
Federal Reserve Bank of Dallas. The FRB has an available borrower in custody arrangement, which allows us to borrow on a collateralized basis. Certain commercial and consumer loans are pledged under this arrangement. We maintain this borrowing arrangement to meet liquidity needs pursuant to our contingency funding plan. As of December 31, 2017, 2016 and 2015, $338.6 million, $197.3 million, and $162.9 million, respectively, were available under this arrangement. As of December 31, 2017, approximately $423.1 million in commercial loans were pledged as collateral. As of December 31, 2017, 2016 and 2015, no borrowings were outstanding under this arrangement.
Junior subordinated debentures. The Company assumed in a previous acquisition $3.1 million in fixed/floating rate junior subordinated debentures underlying common securities and preferred capital securities, or the Parkway Trust Securities, issued by Parkway National Capital Trust I (“Parkway Trust”), a statutory business trust and acquired wholly-owned subsidiary of the Company. The Company assumed the guarantor position and as such, unconditionally guarantees payment of accrued and unpaid distributions required to be paid on the Parkway Trust Securities subject to certain exceptions, the redemption price when a capital security is called for redemption and amounts due if a trust is liquidated or terminated.
The Company owns all of the outstanding common securities of the Parkway Trust. The Parkway Trust used the proceeds from the issuance of its Parkway Trust Securities to buy the debentures originally issued by Fidelity Resource Company. These debentures are the Parkway Trust’s only assets and the interest payments from the debentures finance the distributions paid on the Parkway Trust Securities.
The Parkway Trust Securities pay cumulative cash distributions quarterly at a rate per annum equal to the 3-month LIBOR plus 1.85%. So long as no event of default leading to an acceleration event has occurred, the Company has the right at any time and from time to time during the term of the debenture to defer payments of interest by extending the interest distribution period for up to twenty consecutive quarterly periods. The effective rate as of December 31, 2017 and 2016 was 3.44% and 2.70%, respectively. The Parkway Trust Securities are subject to mandatory redemption in whole or in part, upon repayment of the debentures at the stated maturity in the year 2036 or their earlier redemption, in each case at a redemption price equal to the aggregate liquidation preference of the Parkway Trust Securities plus any accumulated and unpaid distributions thereon to the date of redemption. Prior redemption is permitted under certain circumstances.
In connection with the acquisition of Sovereign on August 1, 2017, the Company assumed $8.6 million in floating rate junior subordinated debentures underlying common securities and preferred capital securities, or the SovDallas Trust Securities, issued by SovDallas Capital Trust I (“SovDallas Trust”), a statutory business trust and acquired wholly-owned subsidiary of the Company. The Company assumed the guarantor position and as such, unconditionally guarantees payment of accrued and unpaid distributions required to be paid on the SovDallas Trust Securities subject to certain exceptions, the redemption price when a capital security is called for redemption and amounts due if a trust is liquidated or terminated. The Company also owns all of the outstanding common securities of the SovDallas Trust.
62
The SovDallas Trust invested the total proceeds from the sale of the SovDallas Trust Securities and the investment in common shares in floating rate junior subordinated debentures originally issued by Sovereign. Interest on the SovDallas Trust Securities is payable quarterly at a rate equal to 3-month LIBOR plus 4.0%. Principal payments are due at maturity in July 2038. The effective rate as of December 31, 2017 was 5.34%. The SovDallas Trust Securities are guaranteed by the Company and are subject to redemption. The Company may redeem the debt securities, in whole or in part, at any time at an amount equal to the principal amount of the debt securities being redeemed plus any accrued and unpaid interest.
The Parkway Trust Securities and SovDallas Trust Securities qualify as Tier 1 capital, subject to regulatory limitations, under guidelines established by the Federal Reserve.
Subordinated notes. During 2013, the Company issued, in the aggregate principal amount of $5.0 million, subordinated promissory notes (“Notes”) via a private offering. The Notes were issued to certain entities controlled by an affiliate of the Company for the purpose of using the proceeds to support the growth of the Company. The Notes are unsecured, with interest payable quarterly at a fixed rate of 6.0% per annum, and unpaid principal and interest on the notes is due at the stated maturity on December 31, 2023. The Notes qualify as Tier 2 Capital, subject to regulatory limitations, under guidelines established by the Federal Reserve. In addition, we may redeem the Notes in whole or in part on any interest payment date that occurs on or after December 23, 2018 subject to approval of the Federal Reserve in compliance with applicable statutes and regulations.
Under the terms of the Notes, if we have not paid interest on the Notes within 30 days of any interest payment date, or if our classified assets to total tangible capital ratio exceeds 40.0%, then the Note holder that holds the greatest aggregate principal amount of the Notes may appoint one representative to attend meetings of our board of directors as an observer. The board observation rights terminate when such overdue interest is paid or our classified assets to total tangible capital ratio no longer exceeds 40.0%. In addition, the terms of the Notes provide that the Note holders will have the same rights to inspect our books and records provided to holders our common stock under Texas law.
In connection with the issuance of the Notes, we also issued warrants to purchase 25,000 shares of our common stock, at an exercise price of $11.00 per share, exercisable at any time, in whole or in part, on or prior to December 31, 2023.
As of December 31, | |||||||||||
2017 | 2016 | 2015 | |||||||||
Junior subordinated debentures | $ | 11,702 | $ | 3,093 | $ | 3,093 | |||||
Subordinated notes (1) | 4,987 | 4,942 | 4,934 | ||||||||
Total | $ | 16,689 | $ | 8,035 | $ | 8,027 | |||||
(1) Excludes discount of $13, $15, and $19 and issuance costs of $36, $43, and $55 as of December 31, 2017, 2016, and 2015 respectively.
Branch assets and liabilities held for sale
On October 23, 2017, the Company entered into a Purchase and Assumption Agreement to sell certain assets and liabilities associated with two branch locations in the Austin metropolitan market. On January 1, 2018, the Company completed the sale of these assets and liabilities to Horizon Bank, SSB. The Company determined that this transaction met the criteria for held for sale as of December 31, 2017 with branch assets held for sale primarily comprised of $26.3 million in loans held for sale and branch liabilities primarily comprised of $64.3 million in deposits held for sale. The completion of this sale resulted in the Company exiting the Austin market. For further information, see Note 1 – Summary of Significant Accounting Policies and Note 25 – Branch Assets and Liabilities Held for Sale in the accompanying Notes to the Consolidated Financial Statements included in Item 8 of this report.
63
Liquidity and Capital Resources
Liquidity
Liquidity involves our ability to raise funds to support asset growth and acquisitions or reduce assets to meet deposit withdrawals and other payment obligations, to maintain reserve requirements and otherwise to operate on an ongoing basis and manage unexpected events. For the years ended December 31, 2017, 2016 and 2015, our liquidity needs were primarily met by core deposits, wholesale borrowings, proceeds from the sale of common stock in an underwritten public offering during 2017, security and loan maturities and amortizing investment and loan portfolios. Use of brokered deposits, purchased funds from correspondent banks and overnight advances from the FHLB and the FRB are available and have been utilized to take advantage of the cost of these funding sources. We maintained two lines of credit with commercial banks that provide for extensions of credit with an availability to borrow up to an aggregate $55 million as of December 31, 2017 and $14.6 million as of December 31, 2016 and 2015. There were no advances under these lines of credit outstanding as of December 31, 2017, 2016 and 2015.
The following table illustrates, during the periods presented, the mix of our funding sources and the average assets in which those funds are invested as a percentage of our average total assets for the period indicated. Average assets totaled $2.0 billion for the year ended December 31, 2017, $1.2 billion for the year ended December 31, 2016 and $898.8 million for the year ended December 31, 2015.
For the Years Ended | ||||||||
December 31, | ||||||||
2017 | 2016 | 2015 | ||||||
Sources of Funds: | ||||||||
Deposits: | ||||||||
Noninterest-bearing | 21.5 | % | 25.5 | % | 29.8 | % | ||
Interest-bearing | 58.0 | 57.9 | 52.8 | |||||
Advances from FHLB | 2.6 | 3.7 | 2.0 | |||||
Other borrowings | 0.7 | 0.7 | 1.0 | |||||
Other liabilities | 0.3 | 0.2 | 0.3 | |||||
Stockholders’ equity | 16.9 | 12.0 | 14.1 | |||||
Total | 100 | % | 100 | % | 100 | % | ||
Uses of Funds: | ||||||||
Loans | 72.3 | % | 77.2 | % | 77.6 | % | ||
Securities available for sale | 8.6 | 7.1 | 6.6 | |||||
Interest-bearing deposits in other banks | 10.2 | 7.8 | 7.9 | |||||
Other noninterest-earning assets | 8.9 | 7.9 | 7.9 | |||||
Total | 100 | % | 100 | % | 100 | % | ||
Average noninterest-bearing deposits to average deposits | 27.0 | % | 30.5 | % | 36.0 | % | ||
Average loans to average deposits | 90.8 | % | 92.5 | % | 93.9 | % | ||
Our primary source of funds is deposits, and our primary use of funds is loans. We do not expect a change in the primary source or use of our funds in the foreseeable future. Our average loans net of allowance for loan loss increased 56.2% for the year ended December 31, 2017 compared to the same period in 2016 and 32.7% for the year ended December 31, 2016 compared to the year ended December 31, 2015. We invest excess deposits in interest-bearing deposits at other banks, the Federal Reserve or liquid investments securities until these monies are needed to fund loan growth.
As of December 31, 2017, we had outstanding $606.5 million in commitments to extend credit and $9.3 million in commitments associated with outstanding standby and commercial letters of credit. As of December 31, 2016, we had outstanding $236.9 million in commitments to extend credit and $6.9 million in commitments associated with outstanding standby and commercial letters of credit. Since commitments associated with letters of credit and commitments to extend credit may expire unused, the total outstanding may not necessarily reflect the actual future cash funding requirements.
64
As of December 31, 2017, we had cash and cash equivalents of $149.0 million compared to $234.8 million at December 31, 2016. We had net cash provided by operating activities of $26.7 million and $10.9 million, net cash used in investing activities of $124.9 million and $203.3 million and net cash provided by financing activities of $12.4 million and $355.7 million for the years ended December 31, 2017 and December 31, 2016, respectively. Items impacting net cash provided by operating activities year-over-year was primarily related to a $2.6 million increase in net income and a $22.2 million decrease in loan originations held for sale partially offset by an increase in proceeds from the sale of loans held for sale of $15.9 million. Items impacting net cash used by investing activities year-over-year was primarily attributable to a $151.5 million increase in sales of securities available for sale and $20.9 million in net cash received in excess of cash paid for 2017 acquisitions. Items impacting net cash provided by financing activities year-over-year was primarily related to a $233.2 million decrease in fundings from deposits. As of December 31, 2017, we had no exposure to future cash requirements associated with known uncertainties or capital expenditures of a material nature.
As of December 31, 2016, we had cash and cash equivalents of $234.8 million compared to $71.6 million at December 31, 2015. We had net cash provided by operating activities of $10.9 million and $16.2 million, net cash used in investing activities of $203.3 million and $146.0 million and net cash provided by financing activities of $355.7 million and $108.1 million for the years ended December 31, 2016 and December 31, 2015, respectively. Items impacting net cash provided by operating activities year-over-year was primarily related to a $31.2 million increase in loan originations held for sale offset by a $23.5 million increase in proceeds from sales of loans held for sale. Items impacting net cash used by investing activities year-over-year was primarily attributable to a $54.2 million increase in net loans originated. Items impacting net cash provided by financing activities year-over-year was primarily related to a $119.0 million increase in fundings from deposits and $94.5 million of net proceeds from the sale of common stock in public offering. As of December 31, 2016, we had no exposure to future cash requirements associated with known uncertainties or capital expenditures of a material nature.
Capital Resources
Total stockholders’ equity increased to $488.9 million as of December 31, 2017, compared to $239.1 million as of December 31, 2016, an increase of $249.8 million, or 104.5%. The increase from December 31, 2016 was primarily the result of $135.9 million in common stock related to the acquisition of Sovereign, $56.7 million net proceeds from the sale of common stock in an underwritten public offering that closed in August 2017, $40.3 million in common stock related to the acquisition of Liberty and $15.2 million in net income.
For the year ended December 31, 2017, we paid cash dividends on preferred stock of $227 thousand which included $185 thousand of accrued dividends in connection with acquisition of Sovereign. For the year ended December 31, 2016, we did not declare or pay cash dividends as we redeemed all 8,000 shares of SBLF Series C preferred stock on December 22, 2015. For the year ended December 31, 2015, we declared and paid cash dividends on our SBLF Series C preferred stock of $98 thousand. See Note 22 “Preferred Stock” to our consolidated financial statements in this report. We did not purchase any of our common stock during the years ended December 31, 2017, 2016 and 2015.
Capital management consists of providing equity to support our current and future operations. The bank regulators view capital levels as important indicators of an institution’s financial soundness. As a general matter, FDIC-insured depository institutions and their holding companies are required to maintain minimum capital relative to the amount and types of assets they hold. We are subject to regulatory capital requirements at the bank holding company and bank levels. See “Item 1. Business—Regulation and Supervision—Prompt Corrective Action” for additional discussion regarding the regulatory capital requirements applicable to us and the Bank. As of December 31, 2017 and 2016, we and the Bank were in compliance with all applicable regulatory capital requirements, and the Bank was classified as “well capitalized,” for purposes of the prompt corrective action regulations. As we employ our capital and continue to grow our operations, our regulatory capital levels may decrease depending on our level of earnings. However, we expect to monitor and control our growth in order to remain in compliance with all regulatory capital standards applicable to us.
65
The following table presents the actual capital amounts and regulatory capital ratios for us and the Bank as of the dates indicated.
As of December 31, | As of December 31, | ||||||||||||
2017 | 2016 | ||||||||||||
Amount | Ratio | Amount | Ratio | ||||||||||
(Dollars in thousands) | |||||||||||||
Veritex Holdings, Inc. | |||||||||||||
Total capital (to risk-weighted assets) | $ | 342,521 | 13.16 | % | $ | 228,566 | 22.02 | % | |||||
Tier 1 capital (to risk-weighted assets) | 324,726 | 12.48 | 215,057 | 20.72 | |||||||||
Common equity tier 1 (to risk-weighted assets) | 313,024 | 12.03 | 211,964 | 20.42 | |||||||||
Tier 1 capital (to average assets) | 324,726 | 12.92 | 215,057 | 16.82 | |||||||||
Veritex Community Bank | |||||||||||||
Total capital (to risk-weighted assets) | $ | 296,207 | 11.37 | % | $ | 130,237 | 12.55 | % | |||||
Tier 1 capital (to risk-weighted assets) | 283,399 | 10.88 | 121,713 | 11.73 | |||||||||
Common equity tier 1 (to risk-weighted assets) | 283,399 | 10.88 | 121,713 | 11.73 | |||||||||
Tier 1 capital (to average assets) | 283,399 | 11.28 | 121,713 | 9.52 | |||||||||
Contractual Obligations
The following tables summarizes our contractual obligations and other commitments to make future payments as of December 31, 2017 and 2016, which consist of our future cash payments associated with our contractual obligations pursuant to our FHLB advances, non-cancelable future operating leases and qualified affordable housing investment. Future payments for FHLB advances will include interest in addition to the principal amount of the advances in the table below that will be paid over future periods. Payments related to leases are based on actual payments specified in underlying contracts. Advances from the FHLB totaled approximately $71.2 million and $38.3 million as of December 31, 2017 and 2016, respectively. As of December 31, 2017, the advances are collateralized by a blanket floating lien on certain securities and loans, had a weighted average rate of 1.36% and mature on various dates during 2018 and 2022.
On July 26, 2017, the Company began investing in a qualified housing project. At December 31, 2017, the balance of the investment for qualified affordable housing projects was $2.0 million. This balance is reflected in non-marketable equity securities on the consolidated balance sheets. The total unfunded commitment related to the investment in a qualified housing project totaled $1.8 million at December 31, 2017. The Company expects to fulfill this commitment during the year ending 2031.
As of December 31, 2017 | |||||||||||||||||||
More than | 3 years or | ||||||||||||||||||
1 year | 1 year but less | more but less | 5 years | ||||||||||||||||
or less | than 3 years | than 5 years | or more | Total | |||||||||||||||
(Dollars in thousands) | |||||||||||||||||||
Non-cancelable future operating leases | $ | 2,349 | $ | 3,918 | $ | 1,580 | $ | 2,134 | $ | 9,981 | |||||||||
Time deposits | 413,269 | 48,296 | 3,748 | — | 465,313 | ||||||||||||||
Advances from FHLB | 68,000 | — | — | 3,164 | 71,164 | ||||||||||||||
Junior subordinated debentures | — | — | — | 11,702 | 11,702 | ||||||||||||||
Subordinated debt | — | — | — | 4,987 | 4,987 | ||||||||||||||
Other borrowings | 15,000 | — | — | — | 15,000 | ||||||||||||||
Qualified affordable housing agreement | $ | 794 | $ | 897 | $ | 22 | $ | 52 | $ | 1,765 | |||||||||
Total | $ | 499,412 | $ | 53,111 | $ | 5,350 | $ | 22,039 | $ | 579,912 | |||||||||
66
Off-Balance Sheet Items
In the normal course of business, we enter into various transactions, which, in accordance with GAAP, are not included in our consolidated balance sheets. However, the Company has only limited off-balance sheet arrangements that have, or are reasonably likely to have, a current or future material effect on the Company’s financial condition, revenues, expenses, results of operations, liquidity, capital expenditures or capital resources. The Company enters into these transactions to meet the financing needs of our customers. These transactions include commitments to extend credit and standby and commercial letters of credit, which involve, to varying degrees, elements of credit risk and interest rate risk in excess of the amounts recognized in the consolidated balance sheets.
Our commitments associated with outstanding standby and commercial letters of credit and commitments to extend credit expiring by the period as of the date indicated are summarized below. Since commitments associated with letters of credit and commitments to extend credit may expire unused, the amounts shown do not necessarily reflect the actual future cash funding requirements.
As of December 31, 2017 | |||||||||||||||||||
More than | 3 years or | ||||||||||||||||||
1 year | 1 year but less | more but less | 5 years | ||||||||||||||||
or less | than 3 years | than 5 years | or more | Total | |||||||||||||||
(Dollars in thousands) | |||||||||||||||||||
Standby and commercial letters of credit | $ | 8,345 | $ | 668 | $ | — | $ | 286 | $ | 9,299 | |||||||||
Commitments to extend credit | 298,137 | 154,594 | 83,840 | 69,880 | 606,451 | ||||||||||||||
Total | $ | 306,482 | $ | 155,262 | $ | 83,840 | $ | 70,166 | $ | 615,750 | |||||||||
Standby and commercial letters of credit are written conditional commitments that the Company issues to guarantee the performance of a customer to a third party. In the event the customer does not perform in accordance with the terms of the agreement with the third party, the Company would be required to fund the commitment. The maximum potential amount of future payments the Company could be required to make is represented by the contractual amount of the commitment. If the commitment is funded, the customer is obligated to reimburse the Company for the amount paid under this standby letter of credit.
Commitments to extend credit are agreements to lend to a customer as long as there is no violation of any condition established in the contract. Commitments generally have fixed expiration dates or other termination clauses and may require payment of a fee. Since many of the commitments are expected to expire without being fully drawn upon, the total commitment amounts disclosed above do not necessarily represent future cash requirements. Management evaluates each customer’s creditworthiness on a case-by-case basis. The amount of collateral obtained, if considered necessary by us, upon extension of credit, is based on management’s credit evaluation of the borrower.
Impact of Inflation
Our consolidated financial statements and related notes included elsewhere in this Annual Report on Form 10-K have been prepared in accordance with GAAP. These require the measurement of financial position and operating results in terms of historical dollars, without considering changes in the relative value of money over time due to inflation or recession.
Unlike many industrial companies, substantially all of our assets and liabilities are monetary in nature. As a result, interest rates have a more significant impact on our performance than the effects of general levels of inflation. Interest rates may not necessarily move in the same direction or in the same magnitude as the prices of goods and services. However, other operating expenses do reflect general levels of inflation.
67
Non-GAAP Financial Measures
Our accounting and reporting policies conform to GAAP, and the prevailing practices in the banking industry. However, we also evaluate our performance based on certain additional financial measures discussed herein as being non-GAAP financial measures. We classify a financial measure as being a non-GAAP financial measure if that financial measure excludes or includes amounts, or is subject to adjustments that have the effect of excluding or including amounts, that are included or excluded, as the case may be, in the most directly comparable measure calculated and presented in accordance with GAAP as in effect from time to time in the United States in our statements of income, balance sheets or statements of cash flows.
The non-GAAP financial measures that we discuss herein should not be considered in isolation or as a substitute for the most directly comparable or other financial measures calculated in accordance with GAAP. Moreover, the manner in which we calculate the non-GAAP financial measures may differ from that of other companies reporting measures with similar names. You should understand how such other banking organizations calculate their financial measures similar or with names similar to the non-GAAP financial measures we have discussed herein when comparing such non-GAAP financial measures. The non-GAAP measures used by the Company include the following:
• | Tangible common equity is defined as total stockholders’ equity less goodwill and other intangible assets |
• | Tangible assets is defined as total assets less goodwill and other intangible assets |
• | Tangible common equity to tangible assets is a ratio that is determined by dividing tangible common equity by tangible assets |
• | Tangible book value per common share is determined by dividing tangible common equity by common shares outstanding |
• | Core net interest income adjusts net interest income as determined in accordance with GAAP to exclude income recognized on acquired loans |
• | Core noninterest expense adjusts noninterest expense as determined in accordance with GAAP to exclude merger and acquisition costs |
• | Core income tax expense adjusts income tax expense as determined in accordance with GAAP to exclude the tax impact of the adjustments to core net interest income and core noninterest expense, the re-measurement of our deferred tax asset as a result of the Tax Act and the tax impact of other M&A discrete items |
• | Core net income adjusts net income as determined in accordance with GAAP to exclude the impact of income recognized on acquired loans, merger and acquisition costs and the tax impact of the adjustments to core net interest income and core noninterest expense, exclude the re-measurement of our deferred tax asset as a result of the Tax Act and exclude the tax impact of other M&A discrete items |
• | Core diluted earnings per share (EPS) divides (i) core net income by (ii) weighted average diluted shares of common stock outstanding for the applicable period |
• | Core efficiency ratio is determined by dividing core noninterest expense by the sum of core net interest income and noninterest income |
• | Core net interest margin is determined by dividing core net interest income by average interest bearing assets |
The following reconciliation tables provides a more detailed analysis of the non-GAAP financial measure
As of December 31, | |||||||
2017 | 2016 | ||||||
(Dollars in thousands, except per share data) | |||||||
Tangible Common Equity | |||||||
Total stockholders’ equity | $ | 488,929 | $ | 239,088 | |||
Adjustments: | |||||||
Goodwill | (159,452 | ) | (26,865 | ) | |||
Intangible assets(1) | (22,165 | ) | (2,181 | ) | |||
Total tangible common equity | $ | 307,312 | $ | 210,042 | |||
Tangible Assets | |||||||
Total assets | $ | 2,945,583 | $ | 1,408,507 | |||
Adjustments: | (159,452 | ) | (26,865 | ) | |||
Goodwill | (22,165 | ) | (2,181 | ) | |||
Intangible assets(1) | $ | 2,763,966 | $ | 1,379,461 | |||
Tangible Common Equity to Tangible Assets | 11.12 | % | 15.23 | % | |||
Common shares outstanding(2) | 24,109,515 | 15,195,328 | |||||
Book value per common share | $ | 20.28 | $ | 15.73 | |||
Tangible book value per common share | $ | 12.75 | $ | 13.82 | |||
(1) | Intangible assets as of December 31, 2017 include branch intangible assets held for sale of $1.7 million. |
(2) | Excludes the dilutive effect, if any, of 514,000 and 454,000 shares of common stock issuable upon exercise of outstanding stock options as of December 31, 2017and 2016, respectively, and 152,000 and 147,000 shares of common stock issuable upon vesting of outstanding restricted stock units as of December 31, 2017 and 2016, respectively. |
68
For the Year Ended | |||||||||||
December 31, 2017 | December 31, 2016 | December 31, 2015 | |||||||||
Net interest income (as reported) | $ | 68,508 | $ | 40,955 | $ | 31,459 | |||||
Adjustment: | |||||||||||
Income recognized on acquired loans | 3,782 | 425 | 194 | ||||||||
Core net interest income | 64,726 | 40,530 | 31,265 | ||||||||
Provision for loan losses (as reported) | 5,114 | 2,050 | 868 | ||||||||
Noninterest income (as reported) | 7,576 | 6,503 | 3,704 | ||||||||
Noninterest expense (as reported) | 42,789 | 26,390 | 21,388 | ||||||||
Adjustment: | |||||||||||
Merger and acquisition ("M&A") costs | (2,691 | ) | (472 | ) | (416 | ) | |||||
Core noninterest expense | 40,098 | 25,918 | 20,972 | ||||||||
Core net income from operations | 27,090 | 19,065 | 13,129 | ||||||||
Income tax expense (as reported) | 13,029 | 6,467 | 4,117 | ||||||||
Adjustments: | |||||||||||
Tax impact of adjustments | (382 | ) | 16 | 78 | |||||||
Tax Act re-measurement | (3,051 | ) | — | — | |||||||
Other M&A discrete tax items | (398 | ) | — | — | |||||||
Core income tax expense | 9,198 | 6,483 | 4,195 | ||||||||
Core net income | $ | 17,892 | $ | 12,582 | $ | 8,934 | |||||
Preferred stock dividends (as reported) | 42 | — | 98 | ||||||||
Core net income available to common stockholders | $ | 17,850 | $ | 12,582 | $ | 8,836 | |||||
Weighted average diluted shares outstanding | 18,810 | 11,058 | 10,332 | ||||||||
Diluted earnings per share (as reported) | 0.80 | 1.13 | 0.84 | ||||||||
Core diluted earnings per share | 0.95 | 1.14 | 0.86 | ||||||||
Efficiency Ratio | |||||||||||
Efficiency ratio (as reported) | 56.24 | % | 55.61 | % | 60.83 | % | |||||
Core efficiency ratio | 55.46 | % | 55.11 | % | 59.97 | % | |||||
Net Interest Margin | |||||||||||
Net interest margin (as reported) | 3.77 | % | 3.72 | % | 3.80 | % | |||||
Core net interest margin | 3.56 | % | 3.68 | % | 3.78 | % | |||||
Critical Accounting Policies
Our consolidated financial statements are prepared in accordance with GAAP and with general practices within the financial services industry. Application of these principles requires management to make estimates and assumptions that affect the amounts reported in the financial statements and accompanying notes. We base our estimates on historical experience and on various other assumptions that we believe to be reasonable under current circumstances. These assumptions form the basis for our judgments about the carrying values of assets and liabilities that are not readily available from independent, objective sources. We evaluate our estimates on an ongoing basis. Use of alternative assumptions may have resulted in significantly different estimates. Actual results may differ from these estimates.
We have identified the following accounting policies and estimates that, due to the difficult, subjective or complex judgments and assumptions inherent in those policies and estimates and the potential sensitivity of our financial statements to those judgments and assumptions, are critical to an understanding of our financial condition and results of operations. We believe that the judgments, estimates and assumptions used in the preparation of our financial statements are appropriate.
69
Loans and Allowance for Loan Losses
Management considers the policies related to the allowance for loan losses as the most critical to the financial statement presentation. The total allowance for loan losses includes activity related to allowances calculated in accordance with Accounting Standards Codification (“ASC”) 310, Receivables, and ASC 450, Contingencies. The allowance for loan losses is established through a provision for loan losses charged to current earnings. The amount maintained in the allowance reflects management’s estimate of incurred losses in the loan portfolio at the report date. The allowance for loan losses is comprised of specific reserves assigned to certain impaired loans and general reserves. Factors contributing to the determination of specific reserves include the creditworthiness of the borrower, and more specifically, changes in the expected future receipt of principal and interest payments and/or in the value of pledged collateral. A reserve is recorded when the carrying amount of the loan exceeds the discounted estimated cash flows using the loan’s initial effective interest rate or the fair value of the collateral for certain collateral dependent loans. For purposes of establishing the general reserve, we stratify the loan portfolio into homogeneous groups of loans that possess similar loss potential characteristics and apply a loss ratio to these groups of loans to estimate the credit losses in the loan portfolio. We use both historical loss ratios and qualitative loss factors assigned to major loan collateral types to establish general component loss allocations. Refer to “Loans and Allowance for Loan Losses” in Note 1 of the Notes to the Consolidated Financial Statements contained in Item 8 of this report for further discussion of the factors considered by management in establishing the allowance for loan loss.
Business Combinations
We apply the acquisition method of accounting for business combinations. Under the acquisition method, the acquiring entity in a business combination recognizes 100% of the assets acquired and liabilities assumed at their acquisition date fair values. We use valuation techniques appropriate for the asset or liability being measured in determining these fair values. Any excess of the purchase price over amounts allocated to assets acquired, including identifiable intangible assets and liabilities assumed is recorded as goodwill. Where amounts allocated to assets acquired and liabilities assumed is greater than the purchase price, a bargain purchase gain is recognized. Acquisition-related costs are expensed as incurred.
Investment Securities
Securities are classified as held to maturity and carried at amortized cost when we have the positive intent and ability to hold them until maturity. Securities to be held for indefinite periods of time are classified as available for sale and carried at fair value, with the unrealized holding gains and losses reported in other comprehensive income, net of tax. We determined the appropriate classification of securities at the time of purchase.
Interest income includes amortization of purchase premiums and discounts. Realized gains and losses are derived from the amortized cost of the security sold. Credit related declines in the fair value of held to maturity and available for sale securities below their cost that are deemed to be other than temporary are reflected in earnings as realized losses, with the remaining unrealized loss recognized as a component of other comprehensive income. In estimating other-than-temporary impairment losses, we consider, among other things, (1) the length of time and the extent to which the fair value has been less than cost, (2) the financial condition and near-term prospects of the issuer, and (3) the intent and our ability to retain the investment in the issuer for a period of time sufficient to allow for any anticipated recovery in fair value.
Loans Held for Sale
Loans held for sale consist of certain mortgage loans originated and intended for sale in the secondary market and are carried at the lower of cost or estimated fair value on an individual loan basis. Net unrealized losses, if any, are recognized through a valuation allowance by charges to income. We obtain purchase commitments from secondary market investors prior to closing the loans and do not retain the servicing obligations related to any such loans upon their sale. Gains and losses on sales of loans held for sale are based on the difference between the selling price and the carrying value of the related loan sold.
Emerging Growth Company
The JOBS Act permits an “emerging growth company” to take advantage of an extended transition period to comply with new or revised accounting standards applicable to public companies. However, we have “opted out” of this provision. As a result, we will comply with new or revised accounting standards to the same extent that compliance is required for non-emerging growth companies. This decision to opt out of the extended transition period under the JOBS Act is irrevocable.
70
Special Cautionary Notice Regarding Forward-Looking Statements
This Annual Report on Form 10-K includes “forward-looking statements” within the meaning of Section 27A of the Securities Act of 1933, as amended, and Section 21E of the Securities Exchange Act of 1934, as amended. Forward-looking statements are based on various facts and derived utilizing numerous important assumptions and are subject to known and unknown risks, uncertainties and other factors that may cause our actual results, performance or achievements to be materially different from any future results, performance or achievements expressed or implied by such forward-looking statements. Forward-looking statements include the information concerning our future financial performance, business and growth strategy, projected plans and objectives, as well as projections of macroeconomic and industry trends, which are inherently unreliable due to the multiple factors that impact economic trends, and any such variations may be material. Statements preceded by, followed by or that otherwise include the words “believes,” “expects,” “anticipates,” “intends,” “projects,” “estimates,” “plans” and similar expressions or future or conditional verbs such as “will,” “should,” “would,” “may” and “could” are generally forward-looking in nature and not historical facts, although not all forward-looking statements include the foregoing. You should understand that the following important factors could affect our future results and cause actual results to differ materially from those expressed in the forward-looking statements:
• | risks related to the concentration of our business in Texas, and specifically within the Dallas-Fort Worth metroplex and the Houston metropolitan area, including risks associated with any downturn in the real estate sector and risks associated with a decline in the values of single family homes in the Dallas-Fort Worth metroplex and the Houston metropolitan area; |
• | uncertain market conditions and economic trends nationally, regionally and particularly in the Dallas-Fort Worth metroplex and Texas; |
• | changes in market interest rates that affect the pricing of our loans and deposits and our net interest income; |
• | risks related to our strategic focus on lending to small to medium-sized businesses; |
• | the sufficiency of the assumptions and estimates we make in establishing reserves for potential loan losses; |
• | our ability to implement our growth strategy, including identifying and consummating suitable acquisitions; |
• | risks related to the integration of any acquired businesses, including exposure to potential asset quality and credit quality risks and unknown or contingent liabilities, the time and costs associated with integrating systems, technology platforms, procedures and personnel, the need for additional capital to finance such transactions, and possible failures in realizing the anticipated benefits from acquisitions; |
• | our ability to recruit and retain successful bankers that meet our expectations in terms of customer relationships and profitability; |
• | our ability to retain executive officers and key employees and their customer and community relationships; |
• | risks associated with our limited operating history and the relatively unseasoned nature of a significant portion of our loan portfolio; |
• | risks associated with our commercial real estate and construction loan portfolios, including the risks inherent in the valuation of the collateral securing such loans; |
• | risks associated with our commercial loan portfolio, including the risk for deterioration in value of the general business assets that generally secure such loans; |
• | potential changes in the prices, values and sales volumes of commercial and residential real estate securing our real estate loans; |
• | risks related to the significant amount of credit that we have extended to a limited number of borrowers and in a limited geographic area; |
• | our ability to maintain adequate liquidity and to raise necessary capital to fund our acquisition strategy and operations or to meet increased minimum regulatory capital levels; |
• | potential fluctuations in the market value and liquidity of our investment securities; |
• | the effects of competition from a wide variety of local, regional, national and other providers of financial, investment and insurance services; |
• | our ability to maintain an effective system of disclosure controls and procedures and internal controls over financial reporting; |
• | risks associated with fraudulent and negligent acts by our customers, employees or vendors; |
• | our ability to keep pace with technological change or difficulties when implementing new technologies; |
• | risks associated with difficulties and/or terminations with third-party service providers and the services they provide; |
• | risks associated with system failures or failures to prevent breaches of our network security; |
• | potential impairment on the goodwill we have recorded or may record in connection with business acquisitions; |
• | our ability to comply with various governmental and regulatory requirements applicable to financial institutions; |
• | the impact of recent and future legislative and regulatory changes, including changes in banking, securities and tax laws and regulations and their application by our regulators, such as the Dodd-Frank Act; |
71
• | governmental monetary and fiscal policies, including the policies of the Federal Reserve; |
• | our ability to comply with supervisory actions by federal and state banking agencies; |
• | changes in the scope and cost of FDIC, insurance and other coverage; and |
• | systemic risks associated with the soundness of other financial institutions |
ITEM 7A. QUANTITATIVE AND QUALITATIVE DISCLOSURES ABOUT MARKET RISK
Interest Rate Sensitivity and Market Risk
As a financial institution, our primary component of market risk is interest rate volatility. Our asset, liability and funds management policy provides management with the guidelines for effective funds management, and we have established a measurement system for monitoring our net interest rate sensitivity position. We manage our sensitivity position within our established guidelines.
Fluctuations in interest rates will ultimately impact both the level of income and expense recorded on most of our assets and liabilities, and the market value of all interest-earning assets and interest-bearing liabilities, other than those which have a short term to maturity. Interest rate risk is the potential of economic losses due to future interest rate changes. These economic losses can be reflected as a loss of future net interest income and/or a loss of current fair market values. The objective is to measure the effect on net interest income and to adjust the balance sheet to minimize the inherent risk while at the same time maximizing income.
We manage our exposure to interest rates by structuring our balance sheet in the ordinary course of business. We do not enter into instruments such as leveraged derivatives, interest rate swaps, financial options, financial future contracts or forward delivery contracts for the purpose of reducing interest rate risk. Based upon the nature of our operations, we are not subject to foreign exchange or commodity price risk. We do not own any trading assets.
Our exposure to interest rate risk is managed by the Asset-Liability Committee of the Bank, in accordance with policies approved by its board of directors. The committee formulates strategies based on appropriate levels of interest rate risk. In determining the appropriate level of interest rate risk, the committee considers the impact on earnings and capital of the current outlook on interest rates, potential changes in interest rates, regional economies, liquidity, business strategies and other factors. The committee meets regularly to review, among other things, the sensitivity of assets and liabilities to interest rate changes, the book and market values of assets and liabilities, unrealized gains and losses, purchase and sale activities, commitments to originate loans and the maturities of investments and borrowings. Additionally, the committee reviews liquidity, cash flow flexibility, maturities of deposits and consumer and commercial deposit activity. Management employs methodologies to manage interest rate risk which include an analysis of relationships between interest-earning assets and interest-bearing liabilities, and an interest rate shock simulation model.
We use interest rate risk simulation models and shock analysis to test the interest rate sensitivity of net interest income and fair value of equity, and the impact of changes in interest rates on other financial metrics. Contractual maturities and re-pricing opportunities of loans are incorporated in the model as are prepayment assumptions, maturity data and call options within the investment portfolio. Average life of our non-maturity deposit accounts are based on standard regulatory decay assumptions and are incorporated into the model. The assumptions used are inherently uncertain and, as a result, the model cannot precisely measure future net interest income or precisely predict the impact of fluctuations in market interest rates on net interest income. Actual results will differ from the model’s simulated results due to timing, magnitude and frequency of interest rate changes as well as changes in market conditions and the application and timing of various management strategies.
On a quarterly basis, we run two simulation models including a static balance sheet and dynamic growth balance sheet. These models test the impact on net interest income and fair value of equity from changes in market interest rates under various scenarios. Under the static and dynamic growth models, rates are shocked instantaneously and ramped rate changes over a 12-month horizon based upon parallel and non-parallel yield curve shifts. Parallel shock scenarios assume instantaneous parallel movements in the yield curve compared to a flat yield curve scenario. Non-parallel simulation involves analysis of interest income and expense under various changes in the shape of the yield curve. Internal policy regarding internal rate risk simulations currently specifies that for instantaneous parallel shifts of the yield curve, estimated net income at risk for the subsequent one-year period should not decline by more than 6.0% for a 100 basis point shift, 12.0% for a 200 basis point shift, and 18.0% for a 300 basis point shift.
72
The following table summarizes the simulated change in net interest income and fair value of equity over a 12-month horizon as of the dates indicated:
As of December 31, 2017 | As of December 31, 2016 | |||||||||||
Percent Change | Percent Change | Percent Change | Percent Change | |||||||||
Change in Interest | in Net Interest | in Fair Value | in Net Interest | in Fair Value | ||||||||
Rates (Basis Points) | Income | of Equity | Income | of Equity | ||||||||
+300 | 9.45 | % | 3.61 | % | 12.60 | % | 11.67 | % | ||||
+200 | 7.07 | % | 4.82 | % | 9.63 | % | 12.04 | % | ||||
+100 | 4.13 | % | 4.10 | % | 6.14 | % | 9.29 | % | ||||
Base | — | — | 0.99 | % | — | |||||||
−100 | (3.77 | )% | (5.69 | )% | (2.56 | )% | (11.22 | )% | ||||
The results are primarily due to behavior of demand, money market and savings deposits during such rate fluctuations. We have found that, historically, interest rates on these deposits change more slowly than changes in the discount and federal funds rates. This assumption is incorporated into the simulation model and is generally not fully reflected in a gap analysis. The assumptions incorporated into the model are inherently uncertain and, as a result, the model cannot precisely measure future net interest income or precisely predict the impact of fluctuations in market interest rates on net interest income. Actual results will differ from the model’s simulated results due to timing, magnitude and frequency of interest rate changes as well as changes in market conditions and the application and timing of various strategies.
ITEM 8. FINANCIAL STATEMENTS AND SUPPLEMENTARY DATA
The financial statements, the reports thereon, the notes thereto and supplementary data commence on page F-1 of this Annual Report on Form 10-K. See Item 15. Exhibits and Financial Statement Schedules.
ITEM 9. CHANGES IN AND DISAGREEMENTS WITH ACCOUNTANTS ON ACCOUNT AND FINANCIAL DISCLOSURE
None.
ITEM 9A. CONTROLS AND PROCEDURES
Evaluation of disclosure controls and procedures. As of the end of the period covered by this Annual Report on Form 10‑K, the Company carried out an evaluation, under the supervision and with the participation of its management, including its Chief Executive Officer and Chief Financial Officer, of the effectiveness of the design and operation of its disclosure controls and procedures. In designing and evaluating the disclosure controls and procedures, management recognizes that any controls and procedures, no matter how well designed and operated, can provide only reasonable assurance of achieving the desired control objectives, and management was required to apply judgment in evaluating its controls and procedures. Based on this evaluation, the Company’s Chief Executive Officer and Chief Financial Officer concluded that the Company’s disclosure controls and procedures (as defined in Rules 13a‑15(e) and 15d‑15(e) under the Exchange Act, were effective as of the end of the period covered by this report.
Changes in internal control over financial reporting. We acquired Liberty on December 1, 2017 and due to the timing of the acquisition, and as allowed under SEC guidance, management’s assessment of and conclusion regarding the design and effectiveness of internal control over financial reporting excluded the internal control over financial reporting of the acquired business, which is relevant to our 2017 consolidated financial statements as of and for the year ended December 31, 2017.
Except as disclosed above, there were no changes in the Company’s internal control over financial reporting (as defined in Rules 13a‑15(f) and 15d‑15(f) under the Exchange Act) that occurred during the quarter ended December 31, 2017, that have materially affected, or are reasonably likely to materially affect, the Company’s internal control over financial reporting.
73
Report on management’s assessment of internal control over financial reporting. Management of the Company is responsible for establishing and maintaining adequate internal control over financial reporting (as defined in Rules 13a-15(e) and 15d-15(e) under the Exchange Act). The Company’s internal control system is a process designed to provide reasonable assurance regarding the preparation and fair presentation of published financial statements in accordance with GAAP. All internal control systems, no matter how well designed, have inherent limitations and can only provide reasonable assurance with respect to financial reporting.
As of December 31, 2017, management assessed the effectiveness of the Company’s internal control over financial reporting based on the criteria for effective internal control over financial reporting established in “Internal Control—Integrated Framework,” issued by the Committee of Sponsoring Organizations (“COSO”) of the Treadway Commission in 2013. This assessment included controls over the preparation of the schedules equivalent to the basic financial statements in accordance with the instructions for the Consolidated Financial Statements for Bank Holding Companies (Form FR Y‑9C) to meet the reporting requirements of Section 112 of the Federal Deposit Insurance Corporation Improvement Act. As permitted, our management’s assessment of and conclusion on the effectiveness of our internal controls did not include the internal controls of Liberty because it was acquired by us in December 2017. Liberty had total assets of $438.6 million as of December 31, 2017, and generated $1.7 million of interest income since its acquisition date for the year ended December 31, 2017. Based on the assessment management determined that the Company maintained effective internal control over financial reporting as of December 31, 2017.
Grant Thornton LLP, an independent registered public accounting firm, audited the consolidated financial statements of the Company for the years ended December 31, 2017, 2016 and 2015 included in this Annual Report on Form 10‑K. Their report is included in “Item 15. Exhibits and Financial Statement Schedules” under the heading Report of Independent Registered Public Accounting Firm. This Annual Report on Form 10‑K does not include an attestation report of the Company’s registered public accounting firm on the Company’s internal control over financial reporting due to a transition period established by rules of the SEC for an Emerging Growth Company.
ITEM 9B. OTHER INFORMATION
None.
74
PART III
ITEM 10. DIRECTORS, EXECUTIVE OFFICERS AND CORPORATE GOVERNANCE.
The information called for by this item is set forth in our Definitive Proxy Statement relating to the 2018 Annual Meeting of Shareholders, or the 2018 Proxy Statement, to be filed with the SEC within 120 days of the end of the fiscal year ended December 31, 2017, and is incorporated herein by reference.
ITEM 11. EXECUTIVE COMPENSATION.
The information called for by this item is set forth in our 2018 Proxy Statement, and is incorporated herein by reference.
ITEM 12. SECURITY OWNERSHIP OF CERTAIN BENEFICIAL OWNERS AND MANAGEMENT AND RELATED STOCKHOLDER MATTERS.
The information called for by this item is set forth in our 2018 Proxy Statement, and is incorporated herein by reference.
ITEM 13. CERTAIN RELATIONSHIPS AND RELATED TRANSACTIONS, AND DIRECTOR INDEPENDENCE.
The information called for by this item is set forth in our 2018 Proxy Statement, and is incorporated herein by reference.
ITEM 14. PRINCIPAL ACCOUNTANT FEES AND SERVICES.
The information called for by this item is set forth in our 2018 Proxy Statement, and is incorporated herein by reference.
PART IV
ITEM 15. EXHIBITS AND FINANCIAL STATEMENT SCHEDULES
(a) | The following documents are filed as part of this report: |
1. | Financial Statements: |
Report of Independent Registered Public Accounting Firm
Consolidated Balance Sheets as of December 31, 2017 and 2016
Consolidated Statements of Income for the years ended December 31, 2017, 2016 and 2015
Consolidated Statements of Comprehensive Income for the years ended December 31, 2017, 2016 and 2015
Consolidated Statements of Changes in Stockholders’ Equity for the years ended December 31, 2017, 2016 and 2015
Consolidated Statements of Cash Flows for the years ended December 31, 2017, 2016 and 2015
Notes to the Consolidated Financial Statements
2. | Financial Statement Schedules: All supplemental schedules to the consolidated financial statements have been omitted as inapplicable or because the required information is included in our consolidated financial statements or the notes thereto included in this Annual Report on Form 10-K. |
3. | Exhibits. |
75
REPORT OF INDEPENDENT REGISTERED PUBLIC ACCOUNTING FIRM
Board of Directors and Stockholders
Veritex Holdings, Inc.
Opinion on the financial statements
We have audited the accompanying consolidated balance sheets of Veritex Holdings, Inc. (a Texas corporation) and subsidiary (collectively, the “Company”) as of December 31, 2017 and 2016, the related consolidated statements of income, comprehensive income, changes in stockholders’ equity, and cash flows for each of the three years in the period ended December 31, 2017, and the related notes (collectively referred to as the “financial statements”). In our opinion, the financial statements present fairly, in all material respects, the financial position of the Company as of December 31, 2017 and 2016, and the results of its operations and its cash flows for each of the three years in the period ended December 31, 2017, in conformity with accounting principles generally accepted in the United States of America.
Basis for opinion
These financial statements are the responsibility of the Company’s management. Our responsibility is to express an opinion on the Company’s financial statements based on our audits. We are a public accounting firm registered with the Public Company Accounting Oversight Board (United States) (“PCAOB”) and are required to be independent with respect to the Company in accordance with the U.S. federal securities laws and the applicable rules and regulations of the Securities and Exchange Commission and the PCAOB.
We conducted our audits in accordance with the standards of the PCAOB. Those standards require that we plan and perform the audit to obtain reasonable assurance about whether the financial statements are free of material misstatement, whether due to error or fraud. Our audits included performing procedures to assess the risks of material misstatement of the financial statements, whether due to error or fraud, and performing procedures that respond to those risks. Such procedures included examining, on a test basis, evidence supporting the amounts and disclosures in the financial statements. Our audits also included evaluating the accounting principles used and significant estimates made by management, as well as evaluating the overall presentation of the financial statements. We believe that our audits provide a reasonable basis for our opinion.
/s/ GRANT THORNTON LLP
We have served as the Company’s auditor since 2014.
Dallas, Texas
March 14, 2018
F-1
VERITEX HOLDINGS, INC. AND SUBSIDIARY
Consolidated Balance Sheets
December 31, 2017 and 2016
(Dollars in thousands, except par value information)
December 31, | December 31, | ||||||
2017 | 2016 | ||||||
ASSETS | |||||||
Cash and due from banks | $ | 38,243 | $ | 15,631 | |||
Interest bearing deposits in other banks | 110,801 | 219,160 | |||||
Total cash and cash equivalents | 149,044 | 234,791 | |||||
Investment securities | 228,117 | 102,559 | |||||
Loans held for sale | 841 | 5,208 | |||||
Loans, net of allowance for loan losses of $12,808 and $8,524, respectively | 2,220,682 | 983,318 | |||||
Accrued interest receivable | 7,676 | 2,907 | |||||
Bank-owned life insurance | 21,476 | 20,077 | |||||
Bank premises, furniture and equipment, net | 75,251 | 17,413 | |||||
Non-marketable equity securities | 13,732 | 7,366 | |||||
Investment in unconsolidated subsidiary | 352 | 93 | |||||
Other real estate owned | 449 | 662 | |||||
Intangible assets, net of accumulated amortization of $3,468 and $2,198, respectively | 20,441 | 2,181 | |||||
Goodwill | 159,452 | 26,865 | |||||
Other assets | 14,518 | 5,067 | |||||
Branch assets held for sale | 33,552 | — | |||||
Total assets | $ | 2,945,583 | $ | 1,408,507 | |||
LIABILITIES AND STOCKHOLDERS’ EQUITY | |||||||
Deposits: | |||||||
Noninterest-bearing | $ | 612,830 | $ | 327,614 | |||
Interest-bearing | 1,665,800 | 792,016 | |||||
Total deposits | 2,278,630 | 1,119,630 | |||||
Accounts payable and accrued expenses | 5,098 | 2,914 | |||||
Accrued interest payable and other liabilities | 5,446 | 534 | |||||
Advances from Federal Home Loan Bank | 71,164 | 38,306 | |||||
Junior subordinated debentures | 11,702 | 3,093 | |||||
Subordinated notes | 4,987 | 4,942 | |||||
Other borrowings | 15,000 | — | |||||
Branch liabilities held for sale | 64,627 | — | |||||
Total liabilities | 2,456,654 | 1,169,419 | |||||
Commitments and contingencies (Note 15) | |||||||
Stockholders’ equity: | |||||||
Preferred stock, $0.01 par value; 10,000,000 shares authorized at December 31, 2017 and December 31, 2016, no shares issued and outstanding | — | — | |||||
Common stock, $0.01 par value; 75,000,000 shares authorized at December 31, 2017 and December 31, 2016; 24,109,515 and 15,195,328 shares issued and outstanding at December 31, 2017 and December 31, 2016, (excluding 10,000 shares held in treasury) | 241 | 152 | |||||
Additional paid-in capital | 445,517 | 211,173 | |||||
Retained earnings | 44,627 | 29,290 | |||||
Unallocated Employee Stock Ownership Plan shares; 9,771 and 18,783 shares at December 31, 2017 and 2016, respectively | (106 | ) | (209 | ) | |||
Accumulated other comprehensive loss | (1,280 | ) | (1,248 | ) | |||
Treasury stock, 10,000 shares at cost | (70 | ) | (70 | ) | |||
Total stockholders’ equity | 488,929 | 239,088 | |||||
Total liabilities and stockholders’ equity | $ | 2,945,583 | $ | 1,408,507 | |||
See accompanying Notes to Consolidated Financial Statements
F-2
VERITEX HOLDINGS, INC. AND SUBSIDIARY
Consolidated Statements of Income
Years Ended December 31, 2017, 2016 and 2015
(Dollars in thousands, except per share amounts)
Year Ended December 31, | |||||||||||
2017 | 2016 | 2015 | |||||||||
Interest income: | |||||||||||
Interest and fees on loans | $ | 73,795 | $ | 44,681 | $ | 33,680 | |||||
Interest on investment securities | 3,462 | 1,409 | 997 | ||||||||
Interest on deposits in other banks | 2,287 | 503 | 241 | ||||||||
Interest on other | 8 | 2 | 2 | ||||||||
Total interest income | 79,552 | 46,595 | 34,920 | ||||||||
Interest expense: | |||||||||||
Interest on deposit accounts | 9,878 | 4,988 | 2,918 | ||||||||
Interest on borrowings | 1,166 | 652 | 543 | ||||||||
Total interest expense | 11,044 | 5,640 | 3,461 | ||||||||
Net interest income | 68,508 | 40,955 | 31,459 | ||||||||
Provision for loan losses | 5,114 | 2,050 | 868 | ||||||||
Net interest income after provision for loan losses | 63,394 | 38,905 | 30,591 | ||||||||
Noninterest income: | |||||||||||
Service charges and fees on deposit accounts | 2,502 | 1,846 | 1,326 | ||||||||
Gain on sales of investment securities | 222 | 15 | 7 | ||||||||
Gain on sales of loans and other assets owned | 3,141 | 3,288 | 1,273 | ||||||||
Bank-owned life insurance | 753 | 771 | 747 | ||||||||
Other | 958 | 583 | 351 | ||||||||
Total noninterest income | 7,576 | 6,503 | 3,704 | ||||||||
Noninterest expense: | |||||||||||
Salaries and employee benefits | 20,828 | 14,332 | 11,265 | ||||||||
Occupancy and equipment | 5,618 | 3,667 | 3,477 | ||||||||
Professional fees | 5,672 | 2,804 | 2,023 | ||||||||
Data processing and software expense | 2,217 | 1,158 | 1,216 | ||||||||
FDIC assessment fees | 1,177 | 661 | 448 | ||||||||
Marketing | 1,293 | 983 | 799 | ||||||||
Other assets owned expenses and write-downs | 182 | 163 | 53 | ||||||||
Amortization of intangibles | 964 | 380 | 338 | ||||||||
Telephone and communications | 720 | 402 | 263 | ||||||||
Other | 4,118 | 1,840 | 1,506 | ||||||||
Total noninterest expense | 42,789 | 26,390 | 21,388 | ||||||||
Net income from operations | 28,181 | 19,018 | 12,907 | ||||||||
Income tax expense | 13,029 | 6,467 | 4,117 | ||||||||
Net income | $ | 15,152 | $ | 12,551 | $ | 8,790 | |||||
Preferred stock dividends | $ | 42 | $ | — | $ | 98 | |||||
Net income available to common stockholders | $ | 15,110 | $ | 12,551 | $ | 8,692 | |||||
Basic earnings per share | $ | 0.82 | $ | 1.16 | $ | 0.86 | |||||
Diluted earnings per share | $ | 0.80 | $ | 1.13 | $ | 0.84 | |||||
See accompanying Notes to Consolidated Financial Statements
F-3
VERITEX HOLDINGS, INC. AND SUBSIDIARY
Consolidated Statements of Comprehensive Income
Years Ended December 31, 2017, 2016 and 2015
(Dollars in thousands)
Year Ended December 31, | |||||||||||
2017 | 2016 | 2015 | |||||||||
Net income | $ | 15,152 | $ | 12,551 | $ | 8,790 | |||||
Other comprehensive income (loss): | |||||||||||
Unrealized gains (losses) on securities available for sale arising during the period, net | 493 | (1,661 | ) | (469 | ) | ||||||
Reclassification adjustment for net gains included in net income | 222 | 15 | 7 | ||||||||
Other comprehensive income (losses) before tax | 271 | (1,676 | ) | (476 | ) | ||||||
Income tax expense (benefit) | 76 | (570 | ) | (162 | ) | ||||||
Other comprehensive income (loss), net of tax | 195 | (1,106 | ) | (314 | ) | ||||||
Comprehensive income | $ | 15,347 | $ | 11,445 | $ | 8,476 | |||||
See accompanying Notes to Consolidated Financial Statements
F-4
VERITEX HOLDINGS, INC. AND SUBSIDIARY
Consolidated Statements of Changes in Stockholders’ Equity
Years Ended December 31, 2017, 2016 and 2015
(Dollars in thousands)
Preferred Stock | Common Stock | Additional Paid-In Capital | Retained Earnings | Accumulated Other Comprehensive Income (Loss) | Unallocated Employee Stock Ownership Plan Shares | Treasury Stock | ||||||||||||||||||||||||||||
Shares | Amount | Total | ||||||||||||||||||||||||||||||||
Balance at January 1, 2015 | $ | 8,000 | 9,470,832 | $ | 95 | $ | 97,469 | $ | 8,047 | $ | 172 | $ | (401 | ) | (70 | ) | $ | 113,312 | ||||||||||||||||
Restricted stock units vested, net of 10,025 shares withheld to cover tax withholdings | — | 26,426 | — | (159 | ) | — | — | — | — | (159 | ) | |||||||||||||||||||||||
Exercise of employee stock options | — | 21,000 | — | 210 | — | — | — | — | 210 | |||||||||||||||||||||||||
Preferred stock dividend Series C | — | — | — | — | (98 | ) | — | — | — | (98 | ) | |||||||||||||||||||||||
Redemption of SBLF preferred stock Series C | (8,000 | ) | — | — | — | — | — | — | — | (8,000 | ) | |||||||||||||||||||||||
Issuance of shares to ESOP | — | 9,147 | — | 115 | — | — | (5 | ) | — | 110 | ||||||||||||||||||||||||
ESOP Shares Allocated | — | — | — | 12 | — | — | 97 | — | 109 | |||||||||||||||||||||||||
Common stock issued for acquisition of IBT Bancorp, Inc., net of offering costs of $252 | — | 1,185,067 | 12 | 17,441 | — | — | — | — | 17,453 | |||||||||||||||||||||||||
Stock based compensation | — | — | — | 633 | — | — | — | — | 633 | |||||||||||||||||||||||||
Net income | — | — | — | — | 8,790 | — | — | — | 8,790 | |||||||||||||||||||||||||
Other comprehensive loss | — | — | — | — | — | (314 | ) | — | — | (314 | ) | |||||||||||||||||||||||
Balance at December 31, 2015 | $ | — | 10,712,472 | $ | 107 | $ | 115,721 | $ | 16,739 | $ | (142 | ) | $ | (309 | ) | $ | (70 | ) | $ | 132,046 | ||||||||||||||
Restricted stock units vested, net of 10,384 shares withheld to cover tax withholdings | — | 38,106 | — | (175 | ) | — | — | — | — | (175 | ) | |||||||||||||||||||||||
Stock issued for acquisition of bank, net offering cost of $489 | — | 4,444,750 | 45 | 94,473 | — | — | — | — | 94,518 | |||||||||||||||||||||||||
Stock based compensation | — | — | — | 983 | — | — | — | — | 983 | |||||||||||||||||||||||||
Excess tax benefit from stock compensation | — | — | — | 162 | — | — | — | — | 162 | |||||||||||||||||||||||||
ESOP Shares Allocated | — | — | — | 9 | — | — | 100 | — | 109 | |||||||||||||||||||||||||
Net income | — | — | — | — | 12,551 | — | — | — | 12,551 | |||||||||||||||||||||||||
Other comprehensive loss | — | — | — | — | — | (1,106 | ) | — | — | (1,106 | ) | |||||||||||||||||||||||
Balance at December 31, 2016 | $ | — | 15,195,328 | $ | 152 | $ | 211,173 | $ | 29,290 | $ | (1,248 | ) | $ | (209 | ) | $ | (70 | ) | $ | 239,088 | ||||||||||||||
Restricted stock units vested, net of 11,601 shares withheld to cover tax withholdings | — | 43,602 | — | (312 | ) | — | — | — | — | (312 | ) | |||||||||||||||||||||||
Exercise of employee stock options, net of 1,095 shares withheld to cover taxes | — | 17,949 | — | 169 | — | — | — | — | 169 | |||||||||||||||||||||||||
Issuance of common shares in connection to Sovereign Bancshares, Inc. merger, net of offering costs of $438 | — | 5,117,642 | 51 | 135,896 | — | — | — | — | 135,947 | |||||||||||||||||||||||||
Issuance of common shares in connection to Liberty merger, net of offering costs of $334 | — | 1,449,944 | 14 | 39,989 | — | — | — | — | 40,003 | |||||||||||||||||||||||||
Sale of common stock in public offering, net of offering costs of $288 | — | 2,285,050 | 24 | 56,657 | — | — | — | — | 56,681 | |||||||||||||||||||||||||
Issuance of preferred stock, series D in connection with the acquisition of Sovereign Bancshares, Inc. | 24,500 | — | — | 24,500 | — | — | — | — | 49,000 | |||||||||||||||||||||||||
Redemption of preferred stock, series D | (24,500 | ) | — | — | (24,500 | ) | — | — | — | — | (49,000 | ) | ||||||||||||||||||||||
Stock based compensation | — | — | — | 1,939 | — | — | — | — | 1,939 | |||||||||||||||||||||||||
ESOP Shares Allocated | — | — | — | 6 | — | — | 103 | — | 109 | |||||||||||||||||||||||||
Net income | — | — | — | — | 15,152 | — | — | — | 15,152 | |||||||||||||||||||||||||
Preferred stock, series D dividend | — | — | — | — | (42 | ) | — | — | — | (42 | ) | |||||||||||||||||||||||
Reclassification of certain deferred tax effects | — | — | — | — | 227 | (227 | ) | — | — | — | ||||||||||||||||||||||||
Other comprehensive income | — | — | — | — | 195 | — | — | 195 | ||||||||||||||||||||||||||
Balance at December 31, 2017 | $ | — | 24,109,515 | $ | 241 | $ | 445,517 | $ | 44,627 | $ | (1,280 | ) | $ | (106 | ) | $ | (70 | ) | $ | 488,929 | ||||||||||||||
See accompanying Notes to Consolidated Financial Statements
F-5
VERITEX HOLDINGS, INC. AND SUBSIDIARY
Consolidated Statements of Cash Flows
Years Ended December 31, 2017, 2016 and 2015
(Dollars in thousands)
See accompanying Notes to Consolidated Financial Statements
Year Ended December 31, | |||||||||||
2017 | 2016 | 2015 | |||||||||
Cash flows from operating activities: | |||||||||||
Net income | $ | 15,152 | $ | 12,551 | $ | 8,790 | |||||
Adjustments to reconcile net income to net cash provided by operating activities: | |||||||||||
Depreciation and amortization | 2,836 | 1,704 | 1,418 | ||||||||
Provision for loan losses | 5,114 | 2,050 | 868 | ||||||||
Accretion of loan purchase discount | (3,783 | ) | (425 | ) | (194 | ) | |||||
Stock-based compensation expense | 1,939 | 983 | 633 | ||||||||
Excess tax benefit from stock compensation | (268 | ) | (162 | ) | — | ||||||
Deferred tax expense (benefit) | 5,143 | (1,366 | ) | (375 | ) | ||||||
Net amortization of premiums on investment securities | 1,771 | 1,025 | 498 | ||||||||
Change in cash surrender value of bank-owned life insurance | (589 | ) | (618 | ) | (613 | ) | |||||
Net gain on sales of investment securities | (222 | ) | (15 | ) | (7 | ) | |||||
Gain on sales of loans held for sale | (942 | ) | (3,288 | ) | (1,254 | ) | |||||
Gain on sales of SBA loans | (1,940 | ) | — | — | |||||||
Net gain on sales of other real estate owned | (259 | ) | — | (19 | ) | ||||||
Amortization of subordinated note discount and debt issuance costs | 45 | 8 | 2 | ||||||||
Net originations of loans held for sale | (48,567 | ) | (70,773 | ) | (39,614 | ) | |||||
Proceeds from sale of loans held for sale | 53,876 | 69,801 | 46,344 | ||||||||
Write down on real estate owned | 37 | 114 | — | ||||||||
Decrease (increase) in accrued interest receivable and other assets | (1,204 | ) | (1,728 | ) | (342 | ) | |||||
(Decrease) increase in accounts payable, accrued expenses, accrued interest payable and other liabilities | (1,477 | ) | 999 | 72 | |||||||
Net cash provided by operating activities | 26,662 | 10,860 | 16,207 | ||||||||
Cash flows from investing activities: | |||||||||||
Cash paid in excess of cash received for the acquisition of Sovereign Bancshares, Inc. | (11,440 | ) | — | — | |||||||
Cash received in excess of cash paid for the acquisition of Liberty Bancshares, Inc. | 32,375 | — | — | ||||||||
Cash received in excess of cash paid for the acquisition of IBT Bancorp, Inc. | — | — | 11,150 | ||||||||
Purchases of securities available for sale | (839,963 | ) | (357,187 | ) | (344,813 | ) | |||||
Sales of securities available for sale | 159,869 | 8,378 | 3,779 | ||||||||
Proceeds from maturities, calls and pay downs of investment securities | 773,702 | 319,377 | 314,029 | ||||||||
Sales (purchases) of non-marketable equity securities, net | 2,481 | (3,199 | ) | 762 | |||||||
Net loans originated | (229,402 | ) | (190,184 | ) | (135,977 | ) | |||||
Proceeds from sale of SBA loans | 30,355 | 20,574 | 7,365 | ||||||||
Net additions to bank premises and equipment | (40,571 | ) | (1,075 | ) | (2,392 | ) | |||||
Net intangible assets and lease obligations related to the purchase of our corporate building | (4,181 | ) | — | — | |||||||
Proceeds from sales of other real estate owned | 1,920 | — | 124 | ||||||||
Net cash used in investing activities | (124,855 | ) | (203,316 | ) | (145,973 | ) | |||||
Cash flows from financing activities: | |||||||||||
Net change in deposits | 18,065 | 251,220 | 132,241 | ||||||||
Net (decrease) increase in advances from Federal Home Loan Bank | (47,142 | ) | 9,862 | (15,059 | ) | ||||||
Net proceeds from sale of common stock in public offering | 56,681 | 94,518 | — | ||||||||
Net change in other borrowings | 10,375 | — | (926 | ) | |||||||
Redemption of preferred stock | (24,500 | ) | — | (8,000 | ) | ||||||
Dividends paid on preferred stock | (227 | ) | — | (98 | ) | ||||||
Proceeds from exercise of employee stock options | 175 | — | 210 | ||||||||
Payments to tax authorities for stock-based compensation | (318 | ) | (175 | ) | (159 | ) | |||||
Excess tax benefit from stock compensation | — | 162 | — | ||||||||
Proceeds from payments on ESOP Loan | 109 | 109 | 109 | ||||||||
Offering costs paid in connection with acquisitions | (772 | ) | — | (252 | ) | ||||||
Net cash provided by financing activities | 12,446 | 355,696 | 108,066 | ||||||||
Net (decrease) increase in cash and cash equivalents | (85,747 | ) | 163,240 | (21,700 | ) | ||||||
Cash and cash equivalents at beginning of year | 234,791 | 71,551 | 93,251 | ||||||||
Cash and cash equivalents at end of year | $ | 149,044 | $ | 234,791 | $ | 71,551 | |||||
F-6
VERITEX HOLDINGS, INC. AND SUBSIDIARY
Notes to Consolidated Financial Statements
(Dollars in thousands, except for per share amounts)
1. Summary of Significant Accounting Policies
Nature of Operations and Principles of Consolidated Financial Statements
The consolidated financial statements include Veritex Holdings, Inc. (“Veritex” or the “Company”), whose business at December 31, 2017 primarily consisted of the operations of its wholly owned subsidiary, Veritex Community Bank (the “Bank”).
The accounting principles followed by the Company and the methods of applying them are in conformity with U.S. generally accepted accounting principles (“GAAP”) and prevailing practices of the banking industry. Intercompany transactions and balances are eliminated in consolidation.
Veritex is a Texas state banking organization with corporate offices in Dallas, Texas, and currently operates twenty branches and one mortgage office located in the Dallas-Fort Worth metroplex and one branch in the Houston metropolitan area. The Bank provides a full range of banking services to individual and corporate customers, which include commercial and retail lending, and the acceptance of checking and savings deposits. The Texas Department of Banking and the Board of Governors of the Federal Reserve System are the primary regulators of the Company and the Bank, which perform periodic examinations to ensure regulatory compliance.
Accounting Standards Codification
The Financial Accounting Standards Board’s (“FASB”) Accounting Standards Codification (“ASC”) is the officially recognized source of authoritative GAAP applicable to all public and non-public non-governmental entities. Rules and interpretive releases of the SEC under the authority of federal securities laws are also sources of authoritative GAAP for SEC registrants. All other accounting literature is considered non-authoritative. Citing particular content in the ASC involves specifying the unique numeric path to the content through the Topic, Subtopic, Section and Paragraph structure.
Segment Reporting
The Company has one reportable segment. All of the Company’s activities are interrelated, and each activity is dependent and assessed based on how each of the activities of the Company supports the others. For example, lending is dependent upon the ability of the Company to fund itself with deposits and borrowings while managing the interest rate and credit risk. Accordingly, all significant operating decisions are based upon analysis of the Bank as one segment or unit. The Company’s chief operating decision-maker, the Chief Executive Officer, uses the consolidated results to make operating and strategic decisions.
Reclassifications
Effective January 1, 2017, the Company adopted ASU 2016-09. Per ASU 2016-09, cash paid by an employer when directly withholding shares for tax-withholding purposes should be classified as a financing activity and for presentation purposes be applied retrospectively. We have retrospectively reclassified $175 and $159 of shares withheld for tax-withholding purposes from an operating activity to a financing activity in our consolidated statements of cash flows for December 31, 2016 and December 31, 2015, respectively.
The Company also early adopted ASU No. 2018-02, “Income Statement - Reporting Comprehensive Income (Topic 220): Reclassification of Certain Tax Effects from Accumulated Other Comprehensive Income” (ASU 2018-02) in the fourth quarter 2017. ASU 2018-02, issued in February 2018, provides for the reclassification of the effect of remeasuring deferred tax balances related to items within accumulated other comprehensive income (“AOCI”) to retained earnings resulting from the Tax Cuts and Jobs Act (the “Tax Act”) of 2017. As a result, the Company reclassified $227 from AOCI to retained earnings.
Use of Estimates
The preparation of financial statements in conformity with U.S. GAAP requires management to make estimates and assumptions that affect the reported amounts of assets and liabilities and the disclosure of contingent assets and liabilities at the date of the consolidated financial statements. Actual results could differ from those estimates. The allowance for loan losses, the fair values of financial instruments, realization of deferred tax assets, and the status of contingencies are particularly subject to change.
F-7
Cash and Cash Equivalents
For the purposes of reporting cash flows, cash and cash equivalents include cash on hand, amounts due from banks and federal funds sold.
The Bank maintains deposits with other financial institutions in amounts that exceed federal deposit insurance coverage. Furthermore, federal funds sold are essentially uncollateralized loans to other financial institutions. Management regularly evaluates the credit risk associated with the counterparties to these transactions and believes that the Company is not exposed to any significant credit risks on cash and cash equivalents.
Restrictions on Cash
The Bank is required to maintain regulatory reserve balances with the Federal Reserve Bank. The reserve balances required as of December 31, 2017 and 2016 were approximately $64.3 million and $26.4 million, respectively.
Investment Securities
Securities that the Company has both the positive intent and ability to hold to maturity are classified as held to maturity and are carried at amortized cost. Securities that the Company intends to hold for an indefinite period of time, but not necessarily to maturity, are classified as available for sale and are carried at fair value. Unrealized gains and losses on securities classified as available for sale have been accounted for as accumulated other comprehensive income (loss), net of taxes. Management determines the appropriate classification of securities at the time of purchase.
Interest income includes amortization of purchase premiums and discounts. Realized gains and losses are derived from the amortized cost of the security sold. Credit related declines in the fair value of available for sale securities below their cost that are deemed to be other than temporary are reflected in earnings as realized losses, with the remaining unrealized loss recognized as a component of other comprehensive income. In estimating other-than-temporary impairment losses, management considers, among other things, (i) the length of time and the extent to which the fair value has been less than cost, (ii) the financial condition and near-term prospects of the issuer, and (iii) the intent and ability of the Company to retain its investment in the issuer for a period of time sufficient to allow for any anticipated recovery in fair value. For the years ended December 31, 2017, 2016 and 2015 there were no other-than-temporary impairment losses reflected in earnings as realized losses.
Loans Held for Sale
Loans held for sale consist of certain mortgage loans originated and intended for sale in the secondary market and are carried at the lower of cost or estimated fair value on an individual loan basis. Net unrealized losses, if any, are recognized through a valuation allowance by charges to income. The Company obtains commitments to purchase the loans from the secondary market investors prior to closing of the loans. Loans held for sale are sold with servicing released. Gains and losses on sales of loans held for sale are based on the difference between the selling price and the carrying value of the related loan sold.
Loans and Allowance for Loan Losses
Loans, excluding certain purchased loans that have shown evidence of deterioration since origination as of the date of the acquisition, that management has the intent and ability to hold for the foreseeable future or until maturity or pay-off are stated at the amount of unpaid principal, reduced by unearned income and an allowance for loan losses. Interest on loans is recognized using the effective-interest method on the daily balances of the principal amounts outstanding. Fees associated with the origination of loans and certain direct loan origination costs are netted and the net amount is deferred and recognized over the life of the loan as an adjustment of yield.
The accrual of interest on loans is discontinued when there is a clear indication that the borrower’s cash flow may not be sufficient to meet payments as they become due, which is generally no later than when a loan is 90 days past due. When a loan is placed on non-accrual status, all previously accrued and unpaid interest is reversed. Interest income is subsequently recognized on a cash basis as long as the remaining book balance of the asset is deemed to be collectible. If collectability is questionable, then cash payments are applied to principal. Loans are returned to accrual status when all the principal and interest amounts contractually due are brought current and future payments are reasonably assured in accordance with the terms of the loan agreement.
F-8
The allowance for loan losses is an estimated amount management believes is adequate to absorb inherent losses on existing loans that may be uncollectible based upon review and evaluation of the loan portfolio. Management’s periodic evaluation of the allowance is based on general economic conditions, the financial condition of borrowers, the value and liquidity of collateral, delinquency, prior loan loss experience, and the results of periodic reviews of the portfolio. The allowance for loan losses is comprised of two components: the general reserve and specific reserves. The general reserve is determined in accordance with current authoritative accounting guidance. The Company’s calculation of the general reserve considers historical loss rates for the last three years adjusted for qualitative factors based upon general economic conditions and other qualitative risk factors both internal and external to the Company. Such qualitative factors include current local economic conditions and trends including unemployment, changes in lending staff, policies and procedures, changes in credit concentrations, changes in the trends and severity of problem loans and changes in trends in volume and terms of loans. These qualitative factors serve to compensate for additional areas of uncertainty inherent in the portfolio that are not reflected in the Company’s historic loss factors. For purposes of determining the general reserve, the loan portfolio, less cash secured loans, government guaranteed loans and impaired loans, is multiplied by the Company’s adjusted historical loss rate. Specific reserves are determined in accordance with current authoritative accounting guidance based on probable losses on specific classified loans.
The allowance for loan losses is increased by charges to income and decreased by charge-offs (net of recoveries).
Due to the growth of the Bank over the past several years, a portion of the loans in its portfolio and its lending relationships are of relatively recent origin. The new loan portfolios have limited delinquency and credit loss history and have not yet exhibited an observable loss trend. The credit quality of loans in theses loan portfolios are impacted by delinquency status and debt service coverage generated by the borrowers’ business and fluctuations in the value of real estate collateral. Management considers delinquency status to be the most meaningful indicator of the credit quality of one-to-four single family residential, home equity loans and lines of credit and other consumer loans. In general, loans do not begin to show signs of credit deterioration or default until they have been outstanding for some period of time, a process the Company refers to as “seasoning.” As a result, a portfolio of older loans will usually behave more predictably than a portfolio of newer loans. Because the majority of the portfolio is relatively new, the current level of delinquencies and defaults may not be representative of the level that will prevail when the portfolio becomes more seasoned, which may be higher than current levels.
Delinquency statistics are updated at least monthly. Internal risk ratings are considered the most meaningful indicator of credit quality for new commercial, construction, and commercial real estate loans. Internal risk ratings are a key factor in identifying loans that are individually evaluated for impairment and impact management’s estimates of loss factors used in determining the amount of the allowance for loan losses. Internal risk ratings are updated on a continuous basis.
Loans are considered impaired when, based on current information and events, it is probable the Company will be unable to collect all amounts due in accordance with the original contractual terms of the loan agreement, including scheduled principal and interest payments. If a loan is impaired, a specific valuation allowance is recorded, if necessary. Interest payments on impaired loans are typically applied to principal unless collectability of the principal amount is reasonably assured, in which case interest is recognized on a cash basis. Impaired loans, or portions thereof, are charged off when deemed uncollectible.
The Company’s policy requires measurement of the allowance for an impaired collateral dependent loan based on the fair value of the collateral. Other loan impairments are measured based on the present value of expected future cash flows or the loan’s observable market price. At December 31, 2017 and 2016, all significant impaired loans have been determined to be collateral dependent and the allowance for loss has been measured utilizing the estimated fair value of the collateral.
From time to time, the Company modifies its loan agreement with a borrower. A modified loan is considered a troubled debt restructuring when two conditions are met: (i) the borrower is experiencing financial difficulty and (ii) concessions are made by the Company that would not otherwise be considered for a borrower with similar credit risk characteristics. Modifications to loan terms may include a lower interest rate, a reduction of principal, or a longer term to maturity. All troubled debt restructurings are considered impaired loans. The Company reviews each troubled debt restructured loan and determines on a case by case basis if a specific valuation allowance is required. A specific valuation allowance is based on either the present value of estimated future cash flows or the estimated fair value of the underlying collateral.
The Company has certain lending policies and procedures in place that are designed to maximize loan income with an acceptable level of risk. Management reviews and approves these policies and procedures on a regular basis and makes changes as appropriate. Management receives frequent reports related to loan originations, quality, concentrations, delinquencies, non-performing and potential problem loans. Diversification in the loan portfolio is a means of managing risk associated with fluctuations in economic conditions, both by type of loan and geography.
F-9
Commercial loans are underwritten after evaluating and understanding the borrower’s ability to operate profitably and effectively. Underwriting standards are designed to determine whether the borrower possesses sound business ethics and practices and to evaluate current and projected cash flows to determine the ability of the borrower to repay their obligations as agreed. Commercial loans are primarily made based on the identified cash flows of the borrower and, secondarily, on the underlying collateral provided by the borrower. Most commercial loans are secured by the assets being financed or other business assets, such as accounts receivable or inventory, and include personal guarantees.
Real estate loans are also subject to underwriting standards and processes similar to commercial loans. These loans are underwritten primarily based on projected cash flows and, secondarily, as loans secured by real estate. The repayment of real estate loans is generally largely dependent on the successful operation of the property securing the loans or the business conducted on the property securing the loan. Real estate loans may be more adversely affected by conditions in the real estate markets or in the general economy. The properties securing the Company’s real estate portfolio are generally diverse in terms of type and geographic location, throughout the Dallas-Fort Worth metroplex and Houston metropolitan area. This diversity helps reduce the exposure to adverse economic events that affect any single market or industry.
The Company utilizes methodical credit standards and analysis to supplement its policies and procedures in underwriting consumer loans. The Company’s loan policy addresses types of consumer loans that may be originated and the collateral, if secured, which must be perfected. The relatively smaller individual dollar amounts of consumer loans that are spread over numerous individual borrowers also minimizes the Company’s risk.
Certain Acquired Loans
As part of business acquisitions, the Company evaluated each of the acquired loans under ASC 310-30 to determine whether (i) there was evidence of credit deterioration since origination, and (ii) it was probable that the Company would not collect all contractually required payments receivable. The Company determined the best indicator of such evidence was an individual loan’s payment status and/or whether a loan was determined to be classified based on a review of each individual loan. Therefore, generally each individual loan that should have been or was on non-accrual at the acquisition date and each individual loan that was deemed impaired were included subject to ASC 310-30 accounting. These loans were recorded at the discounted expected cash flows of the individual loan.
Loans which were evaluated under ASC 310-30, and where the timing and amount of cash flows can be reasonably estimated, were accounted for in accordance with ASC 310-30-35. The Company applies the interest method for these loans under this subtopic and the loans are excluded from non-accrual. If, at acquisition, the Company identified loans that they could not reasonably estimate cash flows or, if subsequent to acquisition, such cash flows could not be estimated, such loans would be included in non-accrual and accounted for under the cost recovery method. These acquired loans are recorded at the allocated fair value, such that there is no carryover of the seller’s allowance for loan losses. Such acquired loans are accounted for individually. The Company estimates the amount and timing of expected cash flows for each purchased loan, and the expected cash flows in excess of the allocated fair value is recorded as interest income over the remaining life of the loan (accretable yield). The excess of the loan’s contractual principal and interest over expected cash flows is not recorded (non-accretable difference). Over the life of the loan, expected cash flows continue to be estimated. If the present value of expected cash flows is less than the carrying amount, a loss is recorded through the allowance for loan losses. If the present value of expected cash flows is greater than the carrying amount, any related allowance for loan loss is reversed, with the remaining yield being recognized prospectively through interest income. Accretion of purchase discounts on PCI loans is based on estimated future cash flows, regardless of contractual maturities, that include undiscounted expected principal and interest payments and use credit risk, interest rate and prepayment risk models to incorporate management’s best estimate of current key assumptions such as default rates, loss severity and payment speeds. Accretion of purchase discounts on acquired non-impaired loans is recognized on a level-yield basis based on contractual maturity of individual loans per ASC 310-20.
Loans to which ASC 310-30 accounting is applied are deemed purchased credit impaired (“PCI”) loans. Revolving loans, including lines of credit, are excluded from PCI loan accounting.
For acquired loans not deemed to be PCI loans at acquisition, the differences between the initial fair value and the unpaid principal balance are recognized as interest income on a level-yield basis over the lives of the related loans. Subsequent to the acquisition date, methods utilized to estimate the required allowance for loan losses for these loans is similar to originated loans; however, a provision for loan losses will be recorded only to the extent the required allowance exceeds any remaining purchase discounts.
F-10
Transfers of Financial Assets
Transfers of financial assets (generally consisting of sales of loans held for sale and loan participations with unaffiliated banks) are accounted for as sales, when control over the assets has been relinquished. Control over transferred assets is deemed to be surrendered when the assets have been isolated from the Company, the transferee obtains the right (free of conditions that constrain it from taking advantage of that right) to pledge or exchange the transferred assets, and the Company does not maintain effective control over the transferred assets through an agreement to repurchase them before their maturity.
Bank Premises and Equipment
Buildings and improvements, furniture and equipment are carried at cost less accumulated depreciation computed using the straight-line method over the estimated useful lives of the respective assets as follows:
Buildings and improvements | 10 - 40 years |
Site improvements | 15 years |
Tenant improvements | Lease term |
Leasehold improvements | Lease term |
Furniture and equipment | 3 - 10 years |
Major replacements and betterments are capitalized while maintenance and repairs are charged to expense when incurred. Gains or losses on dispositions are reflected in the consolidated statements of income as incurred.
Non-Marketable Equity Securities
The Bank is a member of its regional Federal Reserve Bank (“FRB”) and of the Federal Home Loan Bank system (“FHLB”). FHLB members are required to own a certain amount of stock based on the level of borrowings and other factors, and may invest in additional amounts. Both FRB and FHLB stock are carried at cost, restricted for sale, and periodically evaluated for impairment based on ultimate recovery of par value. Both cash and stock dividends are reported as income. Other non-marketable equity securities are carried at cost which approximates fair value.
Other Real Estate Owned
Other real estate owned represents properties acquired through or in lieu of loan foreclosure and are initially recorded at fair value less estimated costs to sell. At foreclosure, if the fair value, less estimated costs to sell, of the real estate acquired is less than the Bank’s recorded investment in the related loan, a write-down is recognized through a charge to the allowance for loan losses. If fair value declines subsequent to foreclosure, a valuation allowance is recorded through expense. Operating costs after acquisition are expensed.
Bank-Owned Life Insurance
The Company has purchased life insurance policies on certain employees. These bank-owned life insurance (“BOLI”) policies are recorded in the accompanying consolidated balance sheets at their cash surrender values. Income from these policies and changes in the cash surrender values are recorded in noninterest income in the accompanying consolidated statements of income.
Goodwill and Intangible Assets
Goodwill resulting from a business combination represents the excess of the fair value of the consideration transferred over the fair value of the net assets acquired and liabilities assumed as of the acquisition date. Goodwill is not amortized but is reviewed for potential impairment annually on December 31 or when a triggering event occurs. The Company’s goodwill test involves a two-step process. Under the first step, the estimation of fair value of the reporting unit is compared to its carrying value including goodwill. If step one indicates a potential impairment, the second step is performed to measure the amount of impairment, if any. If the carrying amount of the reporting goodwill exceeds the implied fair value of that goodwill, an impairment loss is recognized in an amount equal to that excess. Any such adjustments are reflected in the results of operations in the periods in which they become known. Intangible assets consist of core deposit intangibles, intangible assets related to operating leases with favorable market terms acquired in business combinations, and in-place lease intangibles associated with the purchase of our corporate office.
F-11
Intangible assets are initially recognized based on a valuation performed as of the acquisition date and are amortized on a straight-line basis over their estimated useful lives of the respective intangible asset as follows::
Core deposit intangible | 7 - 10 years |
Operating lease intangible | Lease term |
In-place lease intangible | Lease term |
All indefinite lived intangible assets are tested annually for potential impairment or when triggering events occur. Intangible assets with definite lives are tested for impairment when a triggering event occurs. No impairment charges related to goodwill and intangible assets were recorded during the years ended December 31, 2017, 2016 and 2015.
Servicing Assets
The Company accounts for its servicing assets at amortized cost in accordance with ASC 860, “Servicing Assets and Liabilities.” The codification requires that servicing rights acquired through the origination of loans, which are sold with servicing rights retained, are recognized as separate assets. Servicing assets are recorded as the difference between the contractual servicing fees and adequate compensation for performing the servicing, and are periodically reviewed and adjusted for any impairment. The amount of impairment recognized, if any, is the amount by which the servicing assets exceed their fair value. Fair value of the servicing assets is estimated using discounted cash flows based on current market interest rates. Servicing rights are amortized over their estimated lives.
Branch Assets and Liabilities Held for Sale
The Company reports long-lived assets including other assets and liabilities as part of a disposal group as held for sale when management has approved or received approval to sell the assets and liabilities, the Company is committed to a formal plan, the assets and liabilities are available for immediate sale, the assets and liabilities are being actively marketed, the sale is anticipated to occur during the next 12 months and certain other specific criteria are met. Assets and liabilities held for sale are recorded at the lower of its carrying amount or estimated fair value less costs to sell. If the carrying amount of the assets and liabilities exceeds its estimated fair value, a loss is recognized. Depreciation and amortization expense is not recorded on the assets held for sale after it is classified as held for sale.
Marketing Expense
The Company expenses all marketing costs as they are incurred. Marketing expenses were $1,293, $983 and $799 in 2017, 2016 and 2015, respectively.
Income Taxes
The Company files a consolidated income tax return with its subsidiary. Federal income tax expense or benefit is allocated on a separate return basis.
The Company accounts for income taxes using the asset and liability approach for financial accounting and reporting. Deferred tax assets and liabilities are reflected at currently enacted income tax rates applicable to the period in which the deferred tax assets and liabilities are expected to be realized or settled. As changes in tax laws or rates are enacted, deferred tax assets and liabilities are adjusted through the provision for income taxes. Valuation allowances are established when necessary to reduce deferred tax assets to the amount expected to be realized. Realization of deferred tax assets is dependent upon the generation of a sufficient level of future taxable income and recoverable taxes paid in prior years.
F-12
The Tax Cuts and Jobs Act (the "Tax Act"), enacted on December 22, 2017, reduced the U.S. federal corporate tax rate from 35% to 21%. On December 23, 2017, the Securities and Exchange Commission’s Office of the Chief Accountant ("SEC staff") issued SAB 118, which expresses the views of the SEC staff regarding the application of the FASB ASC Topic 740 (Income Taxes), in the reporting period that includes December 22, 2017, the date on which the Tax Act was signed into law. SAB 118 provides guidance for registrants under three scenarios: (1) When measurement of certain income tax effects is complete. Registrants must reflect the tax effects of the Tax Act for which the accounting is complete; (2) When measurement of certain income tax effects can be reasonably estimated. Registrants must report provisional amounts for those specific income tax effects of the Tax Act for which the accounting is incomplete but a reasonable estimate can be determined. Provisional amounts or adjustments to provisional amounts identified in the measurement period, as defined, should be included as an adjustment to tax expense or benefit from continuing operations in the period the amounts are determined; and (3) When measurement of certain income tax effects cannot be reasonably estimated. Registrants are not required to report provisional amounts for any specific income tax effects of the Tax Act for which a reasonable estimate cannot be determined, and would continue to apply ASC Topic 740 based on the provisions of the tax laws that were in effect immediately prior to the enactment of the Tax Act. Registrants would report the provisional amounts of the tax effects of the Tax Act in the first reporting period in which a reasonable estimate can be determined. SAB 118 further provides that the measurement period is complete when a company's accounting is complete and in no circumstances should the measurement period extend beyond one year from the enactment date. A registrant may be able to complete the accounting for some provisions earlier than others. As a result, it may need to apply all three scenarios in determining the accounting for the Tax Act based on the information that is available. The ultimate impact of the Tax Act on our consolidated financial statements and related disclosures for 2017 and beyond may differ from our current estimates, possibly materially, due to, among other things, changes in interpretations and assumptions we have made, guidance that may be issued, and other actions we may take as a result of the Tax Act that differ from those presently contemplated. Based on the information available and current interpretation of the rules, the Company has made reasonable estimates of the impact of the reduction in the corporate tax rate and re-measurement of certain deferred tax assets and liabilities based on the rate at which they are expected to reverse in the future, generally 21 percent. The Company is still analyzing certain provisional estimates for the Liberty and Sovereign acquisitions with respect to loans, bank premises, furniture and equipment, goodwill, intangible assets, deposits and deferred taxes. Any changes to these provisional estimates and re-measurement of deferred taxes could potentially have an impact on our future earnings and effective tax rate. The provisional amount recorded related to the re-measurement of the Corporation's deferred tax balance was $3,051 for the year ended December 31, 2017.
The Company may recognize the tax benefit of an uncertain tax position only if it is more likely than not that the tax position will be sustained upon examination by the taxing authorities based on the technical merits of the position. For tax positions meeting the more-likely-than-not threshold, the amount recognized in the financial statements would be the benefit that has a greater than 50% likelihood of being realized upon ultimate settlement with the relevant tax authority. For the years ended December 31, 2017 and 2016, management has determined there are no material uncertain tax positions.
When necessary, the Company would include interest assessed by taxing authorities in “Interest expense” and penalties related to income taxes in “Other expense” on its consolidated statements of income. The Company did not record any interest or penalties related to income tax for the years ended December 31, 2017, 2016, and 2015. With few exceptions, such as state examinations, the Company is no longer subject to U.S. federal income tax examinations by tax authorities for the years before 2014.
Fair Values of Financial Instruments
Fair values of financial instruments are estimated using relevant market information and other assumptions. Fair value estimates involve uncertainties and matters of significant judgment regarding interest rates, credit risk, prepayments and other factors, especially in the absence of broad markets for particular items. Changes in assumptions or in market conditions could significantly affect the estimates. The fair value estimates of existing on and off-balance sheet financial instruments do not include the value of anticipated future business or the value of assets and liabilities not considered financial instruments.
Stock Based Compensation
Compensation cost is recognized for stock options and stock awards (performance and non-performance based) issued to employees and directors, based on the fair value of these awards at the date of grant. A Black-Scholes model is utilized to estimate the fair value of stock options. The market price of the Company’s common stock at the date of grant is used to estimate fair value for stock awards. A Monte Carlo simulation is used to estimate the fair value of performance-based restricted stock units which include a market condition that determines the number of restricted stock units which will vest based on the Company’s total shareholder return relative to a market index.
F-13
Compensation cost is recognized over the required service period, generally defined as the vesting period. For awards with graded vesting, compensation cost is recognized on a straight-line basis over the requisite service period for the entire award.
Treasury Stock
Treasury stock is stated at cost, which is determined by the first-in, first-out method.
Comprehensive Income
Comprehensive income includes all changes in stockholders’ equity during a period, except those resulting from transactions with stockholders. In addition to net income, comprehensive income includes the net effect of changes in the fair value of securities available for sale, net of tax. Comprehensive income is reported in the accompanying consolidated statements of comprehensive income.
Employee Stock Ownership Plan
Effective January 1, 2012, the Company adopted the Veritex Community Bank Employee Stock Ownership Plan (“ESOP”) covering all employees that meet certain age and service requirements. Plan assets are held and managed by the Company. Shares of the Company’s common stock purchased by the ESOP are held in a suspense account until released for allocation to participants. Shares released are allocated to each eligible participant based on the participant’s 401(k) contribution made during that year. Compensation expense is measured based upon the expected amount of the Company’s discretionary contribution that is determined on an annual basis and is accrued ratably over the year. Shares are committed to be released to settle the liability upon formal declaration of the contribution at the end of the year. The number of shares released to settle the liability is based upon fair value of the shares and become outstanding shares for earnings per share computations. The cost of shares issued to the ESOP, but not yet committed to be released, is shown as a reduction of stockholders’ equity. To the extent that the fair value of the ESOP shares differs from the cost of such shares, the difference is charged or credited to stockholders’ equity as additional paid in capital.
Business Combinations
The Company applies the acquisition method of accounting for business combinations. Under the acquisition method, the acquiring entity in a business combination recognizes 100% of the assets acquired and liabilities assumed at their acquisition date fair values. Management utilizes valuation techniques appropriate for the asset or liability being measured in determining these fair values. Any excess of the purchase price over amounts allocated to assets acquired, including identifiable intangible assets, and liabilities assumed is recorded as goodwill. Where amounts allocated to assets acquired and liabilities assumed is greater than the purchase price, a bargain purchase gain is recognized. Acquisition-related costs are expensed as incurred.
Earnings Per Share
Earnings per share (“EPS”) are based upon the weighted-average shares outstanding. The table below sets forth the reconciliation between weighted average shares used for calculating basic and diluted EPS for the years ended December 31, 2017, 2016 and 2015.
Year Ended December 31, | |||||||||||
2017 | 2016 | 2015 | |||||||||
Earnings (numerator) | |||||||||||
Net income | $ | 15,152 | $ | 12,551 | $ | 8,790 | |||||
Less: preferred stock dividends | 42 | — | 98 | ||||||||
Net income allocated to common stockholders | $ | 15,110 | $ | 12,551 | $ | 8,692 | |||||
Shares (denominator) | |||||||||||
Weighted average shares outstanding for basic EPS (thousands) | 18,404 | 10,849 | 10,061 | ||||||||
Dilutive effect of employee stock-based awards | 406 | 209 | 271 | ||||||||
Adjusted weighted average shares outstanding | 18,810 | 11,058 | 10,332 | ||||||||
Earnings per share: | |||||||||||
Basic | $ | 0.82 | $ | 1.16 | $ | 0.86 | |||||
Diluted | $ | 0.80 | $ | 1.13 | $ | 0.84 | |||||
F-14
For the years ended December 31, 2017, 2016 and 2015, there were no antidilutive shares excluded from the diluted EPS weighted average shares.
2. Supplemental Statement of Cash Flows
Other supplemental cash flow information is presented below:
Year Ended December 31, | |||||||||||
2017 | 2016 | 2015 | |||||||||
Supplemental Disclosures of Cash Flow Information: | |||||||||||
Cash paid for interest | $ | 10,680 | $ | 5,607 | $ | 3,520 | |||||
Cash paid for income taxes | $ | 9,761 | $ | 8,250 | $ | 4,100 | |||||
Supplemental Disclosures of Non-Cash Flow Information: | |||||||||||
Issuance of stock to ESOP | $ | — | $ | — | $ | 110 | |||||
Net issuance of common stock for vesting of restricted stock units | $ | 312 | $ | 175 | $ | 159 | |||||
Net foreclosure of other real estate owned | $ | 1,037 | $ | 283 | $ | 493 | |||||
Transfers to assets held for sale | $ | 33,552 | $ | — | $ | — | |||||
Transfers to liabilities held for sale | $ | 64,627 | $ | — | $ | — | |||||
Year Ended December 31, | |||||||||||
2017 | 2016 | 2015 | |||||||||
Noncash assets acquired | |||||||||||
Investment securities | $ | 220,444 | $ | — | $ | 5,436 | |||||
Loans | 1,065,058 | — | 88,459 | ||||||||
Accrued interest receivable | 4,293 | — | 250 | ||||||||
Bank premises, furniture and equipment | 23,950 | — | 4,947 | ||||||||
Non-marketable equity securities | 8,847 | — | — | ||||||||
Other real estate owned | 448 | — | — | ||||||||
Intangible assets | 15,973 | — | 1,078 | ||||||||
Goodwill | 132,587 | — | 7,717 | ||||||||
Other assets | 15,657 | — | 1,347 | ||||||||
Total assets | $ | 1,487,257 | $ | — | $ | 109,234 | |||||
Noncash liabilities assumed: | |||||||||||
Deposits | $ | 1,205,217 | $ | — | $ | 97,426 | |||||
Accounts payable and accrued expenses(1) | 7,571 | — | |||||||||
Accrued interest payable and other liabilities | 948 | — | 824 | ||||||||
Advances from FHLB | 80,000 | 3,503 | |||||||||
Other borrowings | 13,234 | — | 926 | ||||||||
Total liabilities | $ | 1,306,970 | $ | — | $ | 102,679 | |||||
Non-cash equity assumed | |||||||||||
Preferred stock - series D | $ | 24,500 | $ | — | $ | — | |||||
Total equity assumed | $ | 24,500 | $ | — | $ | — | |||||
5,117,642 shares of common stock exchanged in connection with the Sovereign acquisition | $ | 136,385 | $ | — | $ | — | |||||
1,449,944 shares of common stock exchanged in connection with the Liberty acquisition | $ | 40,337 | $ | — | |||||||
1,185,067 shares of common stock exchanged in connection with the IBT acquisition | $ | — | $ | — | $ | 17,705 | |||||
(1) Accounts payable and accrued expenses includes accrued preferred stock dividends of $185.
3. Recent Accounting Pronouncements
ASU No. 2018-02, “Income Statement - Reporting Comprehensive Income (Topic 220): Reclassification of Certain Tax Effects from Accumulated Other Comprehensive Income” (“ASU 2018-02”), issued in February 2018, provides for the reclassification of the effect of remeasuring deferred tax balances related to items within AOCI to retained earnings resulting from the Tax Act. The Company early adopted ASU No. 2018-02 in the fourth quarter of 2017. As a result, the Company reclassified $227 from AOCI to retained earnings.
ASU 2017-04 “Intangibles - Goodwill and Other (Topic 350): Simplifying the Test for Goodwill Impairment” (“ASU 2017-04”) eliminates Step 2 from the goodwill impairment test. In addition, the amendment eliminates the requirements for any reporting unit with a zero or negative carrying amount to perform a qualitative assessment and, if it fails that qualitative test, to perform Step 2 of the goodwill impairment test. For public companies, ASU 2017-04 is effective for fiscal years beginning after December 15, 2019 with early adoption permitted for interim or annual goodwill impairment tests performed on testing dates after January 1, 2017. The Company is in process of evaluating the impact of this pronouncement, which is not expected to have a significant impact on the consolidated financial statements.
ASU 2017-01 “Business Combinations (Topic 805): Clarifying the Definition of a Business” (“ASU 2017-01”) changes the definition of a business to assist entities with evaluating when a set of transferred assets and activities is deemed to be a business. Determining whether a transferred set constitutes a business is important because the accounting for a business combination differs from that of an asset acquisition. The definition of a business also affects the accounting for dispositions. Under the new standard, when substantially all of the fair value of assets acquired is concentrated in a single asset, or a group of similar assets, the assets acquired would not represent a business and business combination accounting would not be required. The new standard may result in more transactions being accounted for as asset acquisitions rather than business combinations. For public companies, ASU 2017-01 is effective for interim and annual periods beginning after December 15, 2017 and shall be applied prospectively. The Company early adopted ASU 2017-01 as of July 1, 2017 and the new definition is used for accounting purposes.
ASU 2016-18 “Statement of Cash Flows (Topic 230): Restricted Cash” (“ASU 2016-18”) requires that the statement of cash flows explain the change during the period in the total of cash, cash equivalents, and amounts generally described as restricted cash or restricted cash equivalents. For public companies, ASU 2016-18 is effective for fiscal years beginning after December 15, 2017, and interim periods within those fiscal years. Early adoption is permitted. The Company determined the adoption of ASU 2016-18 will not have a significant impact on the consolidated financial statements.
ASU 2016-13 “Financial Instruments —Credit Losses (Topic 326): Measurement of Credit Losses on Financial Instruments” (“ASU 2016-13”) amends guidance on reporting credit losses for assets held at amortized cost basis and available for sale debt securities. For assets held at amortized cost basis, Topic 326 eliminates the probable initial recognition threshold in current GAAP and, instead, requires an entity to reflect its current estimate of all expected credit losses. The allowance for credit losses is a valuation account that is deducted from the amortized cost basis of the financial assets to present the net amount expected to be collected. For available for sale debt securities, credit losses should be measured in a manner similar to current GAAP, however Topic 326 will require that credit losses be presented as an allowance rather than as a write-down. ASU 2016-13 affects entities holding financial assets and net investment in leases that are not accounted for at fair value through net income. The amendments affect loans, debt securities, trade receivables, net investments in leases, off balance sheet credit exposures, reinsurance receivables, and any other financial assets not excluded from the scope that have the contractual right to receive cash. For public business entities, ASU 2016-13 is effective for financial statements issued for fiscal years beginning after December 15, 2019, and interim periods therein. The Company is continuing to evaluate the impact of the adoption of ASU 2016-13 and is uncertain of the impact on the consolidated financial statements at this point in time.
ASU 2016-09 “Compensation —Stock Compensation (Topic 718): Improvements to Employee Share-Based Payment Accounting” (“ASU 2016-09”) simplifies several aspects of the accounting for employee share-based payment transactions, including the income tax consequences, classification of awards as either equity or liabilities, and classification on the statement of cash flows. Per ASU 2016-09: (1) all excess tax benefits and tax deficiencies should be recognized as income tax expense or benefit in the income statement, rather than in additional paid-in capital under current guidance; (2) excess tax benefits should be classified along with other income tax cash flows as an operating activity on the statement of cash flows, rather than as a separate cash inflow from financing activities and cash outflow from operating activities under current guidance; (3) cash paid by an employer when directly withholding shares for tax-withholding purposes should be classified as a financing activity; and (4) an entity can make an entity-wide accounting policy election to either estimate the number of awards that are expected to vest, as under current guidance, or account for forfeitures when they occur. For public business entities, ASU 2016-09 is effective for financial statements issued for fiscal years beginning after December 15, 2016, and interim periods therein.
F-15
Effective January 1, 2017, the Company adopted ASU 2016-09. The Company prospectively applied the guidance for the presentation of excess tax benefits as an operating cash flow and included the $268 excess income tax benefit as an operating activity on the consolidated statement of cash flows for the year ended December 31, 2017. In addition, the Company retrospectively applied the guidance for the presentation of the cash paid by an employer when directly withholding shares for tax-withholding purposes be classified as a financing activity on the consolidated statement of cash flows for the years ended December 31, 2017, 2016 and 2015. Finally, the Company elected to account for forfeitures as they occur.
ASU 2016-02 “Leases (Topic 842)” (“ASU 2016-02”) is intended to improve the reporting of leasing transactions to provide users of financial statements with more decision-useful information. ASU 2016-02 will require organizations that lease assets to recognize on the balance sheet the assets and liabilities for the rights and obligations created by those leases. ASU 2016-02 is effective for fiscal years beginning after December 15, 2018, including interim periods within those fiscal years. Early adoption is permitted. The Company is in process of evaluating the impact of this pronouncement, which is not expected to have a significant impact on the consolidated financial statements.
ASU 2016-01 “Financial Instruments─Overall (Subtopic 825-10): Recognition and Measurement of Financial Assets and Financial Liabilities” (“ASU 2016-01”) amends certain aspects of recognition, measurement, presentation, and disclosure of financial instruments. ASU 2016-01, among other things, (i) requires equity investments, with certain exceptions, to be measured at fair value with changes in fair value recognized in net income, (ii) simplifies the impairment assessment of equity investments without readily determinable fair values by requiring a qualitative assessment to identify impairment, (iii) eliminates the requirement for public business entities to disclose the methods and significant assumptions used to estimate the fair value that is required to be disclosed for financial instruments measured at amortized cost on the balance sheet, (iv) requires public business entities to use the exit price notion when measuring the fair value of financial instruments for disclosure purposes, (v) requires an entity to present separately in other comprehensive income the portion of the total change in the fair value of a liability resulting from a change in the instrument-specific credit risk when the entity has elected to measure the liability at fair value in accordance with the fair value option for financial instruments, (vi) requires separate presentation of financial assets and financial liabilities by measurement category and form of financial asset on the balance sheet or the accompanying notes to the financial statements and (vii) clarifies that an entity should evaluate the need for a valuation allowance on a deferred tax asset related to available-for-sale. This update will be effective for the Company on January 1, 2018. The Company does not expect the adoption of ASU 2016-01 to have a significant impact on the consolidated financial statements.
ASU 2014-09 “Revenue from Contracts with Customers (Topic 606)” (“ASU 2014-09”) implements a common revenue standard that clarifies the principles for recognizing revenue. The core principle of ASU 2014-09 is that an entity should recognize revenue to depict the transfer of promised goods or services to customers in an amount that reflects the consideration to which the entity expects to be entitled in exchange for those goods or services. ASU 2014-09 establishes a five-step model which entities must follow to recognize revenue and removes inconsistencies and weaknesses in existing guidance. The original effective date for ASU 2014-09 was for annual and interim periods beginning after December 15, 2016. However, in August 2015, the FASB issued ASU 2015-14, which deferred the effective date by one year, therefore it is now effective for interim and annual reporting periods beginning after December 15, 2017. Our revenue is comprised of interest income on financial assets, which is explicitly excluded from the scope of ASU 2014-09, and non-interest income. We have completed our evaluation of the impact of ASU 2014-09 on components of our non-interest income and have not found any significant changes to our methodology of recognizing revenue. As required by ASU 2014-09, we will adopt the standard in the first quarter of 2018 and, at the time of this filing, there will be no cumulative effect adjustment to opening retained earnings. We will include newly applicable revenue disclosures in our Form 10-Q for the quarter ended March 31, 2018.
F-16
4. Investment Securities
Debt and equity securities have been classified in the consolidated balance sheets according to management’s intent. The amortized cost, related gross unrealized gains and losses recognized in accumulated other comprehensive income (loss), and fair value of securities are as follows:
December 31, 2017 | |||||||||||||||
Gross | Gross | ||||||||||||||
Amortized | Unrealized | Unrealized | |||||||||||||
Cost | Gains | Losses | Fair Value | ||||||||||||
Available for Sale | |||||||||||||||
U.S. government agencies | $ | 10,829 | $ | 9 | $ | 18 | $ | 10,820 | |||||||
Corporate bonds | 17,500 | 330 | — | 17,830 | |||||||||||
Municipal securities | 55,499 | 189 | 211 | 55,477 | |||||||||||
Mortgage-backed securities | 91,734 | 58 | 1,068 | 90,724 | |||||||||||
Collateralized mortgage obligations | 53,559 | 9 | 925 | 52,643 | |||||||||||
Asset-backed securities | 616 | 7 | — | 623 | |||||||||||
$ | 229,737 | $ | 602 | $ | 2,222 | $ | 228,117 | ||||||||
December 31, 2016 | |||||||||||||||
Gross | Gross | ||||||||||||||
Amortized | Unrealized | Unrealized | |||||||||||||
Cost | Gains | Losses | Fair Value | ||||||||||||
Available for Sale | |||||||||||||||
U.S. government agencies | $ | 732 | $ | — | $ | 36 | $ | 696 | |||||||
Municipal securities | 14,540 | 2 | 500 | 14,042 | |||||||||||
Mortgage-backed securities | 49,907 | 83 | 871 | 49,119 | |||||||||||
Collateralized mortgage obligations | 38,507 | 32 | 612 | 37,927 | |||||||||||
Asset-backed securities | 764 | 11 | — | 775 | |||||||||||
$ | 104,450 | $ | 128 | $ | 2,019 | $ | 102,559 | ||||||||
The following tables disclose the Company’s investment securities that have been in a continuous unrealized loss position for less than 12 months and those that have been in a continuous unrealized loss position for 12 or more months:
December 31, 2017 | |||||||||||||||||||||||
Less Than 12 Months | 12 Months or More | Totals | |||||||||||||||||||||
Fair | Unrealized | Fair | Unrealized | Fair | Unrealized | ||||||||||||||||||
Value | Loss | Value | Loss | Value | Loss | ||||||||||||||||||
Available for Sale | |||||||||||||||||||||||
U.S. government agencies | $ | 3,470 | $ | 4 | $ | 629 | $ | 14 | $ | 4,099 | $ | 18 | |||||||||||
Municipal securities | 14,593 | 79 | 7,092 | 132 | 21,685 | 211 | |||||||||||||||||
Mortgage-backed securities | 52,075 | 513 | 29,485 | 555 | 81,560 | 1,068 | |||||||||||||||||
Collateralized mortgage obligations | 31,581 | 395 | 20,305 | 530 | 51,886 | 925 | |||||||||||||||||
$ | 101,719 | $ | 991 | $ | 57,511 | $ | 1,231 | $ | 159,230 | $ | 2,222 | ||||||||||||
F-17
December 31, 2016 | |||||||||||||||||||||||
Less Than 12 Months | 12 Months or More | Totals | |||||||||||||||||||||
Fair | Unrealized | Fair | Unrealized | Fair | Unrealized | ||||||||||||||||||
Value | Loss | Value | Loss | Value | Loss | ||||||||||||||||||
Available for Sale | |||||||||||||||||||||||
U.S. government agencies | $ | — | $ | — | $ | 696 | $ | 36 | $ | 696 | $ | 36 | |||||||||||
Municipal securities | 12,060 | 478 | 518 | 22 | 12,578 | 500 | |||||||||||||||||
Mortgage-backed securities | 37,274 | 802 | 6,848 | 69 | 44,122 | 871 | |||||||||||||||||
Collateralized mortgage obligations | 29,618 | 584 | 1,618 | 28 | 31,236 | 612 | |||||||||||||||||
$ | 78,952 | $ | 1,864 | $ | 9,680 | $ | 155 | $ | 88,632 | $ | 2,019 | ||||||||||||
The number of investment positions in an unrealized loss position totaled 118 and 72 at December 31, 2017 and December 31, 2016, respectively. The Company does not believe these unrealized losses are “other than temporary.” In estimating other-than-temporary impairment losses, management considers, among other things, the length of time and the extent to which the fair value has been less than cost and the Company’s financial condition and near-term prospects. Additionally, management does not (i) have the intent to sell investment securities prior to recovery and/or maturity and, (ii) it is more likely than not that the Company will not have to sell these securities prior to recovery and/or maturity and (iii) that the length of time and extent that fair value has been less than cost is not indicative of recoverability. The unrealized losses noted are interest rate related due to the level of interest rates at December 31, 2017 compared to the time of purchase. The Company has reviewed the ratings of the issuers and has not identified any issues related to the ultimate repayment of principal as a result of credit concerns on these securities.
The amortized costs and estimated fair values of securities available for sale, by contractual maturity, are shown below. Expected maturities will differ from contractual maturities because borrowers may have the right to call or prepay obligations with or without call or prepayments penalties. Mortgage-backed securities, collateralized mortgage obligations, and asset-backed securities typically are issued with stated principal amounts, and the securities are backed by pools of mortgage loans and other loans that have varying maturities. The term of mortgage-backed, collateralized mortgage obligations and asset-backed securities thus approximates the term of the underlying mortgages and loans and can vary significantly due to prepayments. Therefore, these securities are not included in the maturity categories below.
December 31, 2017 | |||||||
Available For Sale | |||||||
Amortized | Fair | ||||||
Cost | Value | ||||||
Due in one year or less | $ | 2,328 | $ | 2,330 | |||
Due from one year to five years | 29,654 | 29,991 | |||||
Due from five years to ten years | 34,480 | 34,474 | |||||
Due after ten years | 17,366 | 17,332 | |||||
83,828 | 84,127 | ||||||
Mortgage-backed securities | 91,734 | 90,724 | |||||
Collateralized mortgage obligations | 53,559 | 52,643 | |||||
Asset-backed securities | 616 | 623 | |||||
$ | 229,737 | $ | 228,117 | ||||
F-18
December 31, 2016 | |||||||
Available For Sale | |||||||
Amortized | Fair | ||||||
Cost | Value | ||||||
Due in one year or less | $ | — | $ | — | |||
Due from one year to five years | 4,009 | 3,974 | |||||
Due from five years to ten years | 3,522 | 3,346 | |||||
Due after ten years | 7,741 | 7,418 | |||||
15,272 | 14,738 | ||||||
Mortgage-backed securities | 49,907 | 49,119 | |||||
Collateralized mortgage obligations | 38,507 | 37,927 | |||||
Asset-backed securities | 764 | 775 | |||||
$ | 104,450 | $ | 102,559 | ||||
Proceeds from sales of investment securities available for sale and gross gains and losses for the years ended December 31, 2017, 2016 and 2015 were as follows:
December 31, | |||||||||||
2017 | 2016 | 2015 | |||||||||
Proceeds from sales | $ | 159,869 | $ | 8,378 | $ | 3,779 | |||||
Gross realized gains | 398 | 43 | 42 | ||||||||
Gross realized losses | 176 | 40 | 35 | ||||||||
The increase in proceeds from sales for the year ended December 31, 2017 compared to December 31, 2016 and December 31, 2015 resulted from the sale of Sovereign investment securities that did not fit our investment strategy. There were no gross gains from calls of investment securities included in gain on sale of investment securities in the accompanying consolidated statements of income for the year ended December 31, 2017, $12 in gross gains from calls of investment securities included in the consolidated statements of income for the year ended December 31, 2016 and no gross gains from calls of investment securities included in the consolidated statements of income for the year ended December 31, 2015.
As further explained in Note 11, there was a blanket floating lien on all securities to secure FHLB advances as of December 31, 2017 and December 31, 2016.
F-19
5. Loans and Allowance for Loan Losses
Loans in the accompanying consolidated balance sheets are summarized as follows:
December 31, | December 31, | ||||||
2017 | 2016 | ||||||
Real estate: | |||||||
Construction and land | $ | 277,825 | $ | 162,614 | |||
Farmland | 9,385 | 8,262 | |||||
1 - 4 family residential | 251,665 | 140,137 | |||||
Multi-family residential | 91,152 | 14,683 | |||||
Commercial Real Estate | 909,292 | 370,696 | |||||
Commercial | 684,551 | 291,416 | |||||
Consumer | 9,648 | 4,089 | |||||
2,233,518 | 991,897 | ||||||
Deferred loan fees | (28 | ) | (55 | ) | |||
Allowance for loan losses | (12,808 | ) | (8,524 | ) | |||
$ | 2,220,682 | $ | 983,318 | ||||
Included in the net loan portfolio as of December 31, 2017 and 2016 is an accretable discount related to loans acquired within a business combination in the approximate amounts of $12,135 and $469, respectively. The discount is being accreted into income on a level-yield basis over the life of the loans. In addition, included in the net loan portfolio as of December 31, 2017 and 2016 is a discount on retained loans from sale of originated Small Business Administration (“SBA”) loans of $1,189 and $832, respectively.
An institution which has reported loans for construction, land development, and other land loans representing 100% or more of total risk-based capital, or total non-owner occupied commercial real estate loans representing 300% or more of the institution’s total risk-based capital and the outstanding balance of commercial real estate loan portfolio has increased by 50% or more during the prior 36 months, may be identified for further supervisory analysis by regulators to assess the nature and risk posed by the concentration. As of December 31, 2017, the Company had total commercial real estate loans (CRE) representing 328% of total risk-based capital. Included in these amounts, the Company had construction, land development, and other land loans representing 94% of total risk-based capital at December 31, 2017 indicating a concentration in commercial real estate lending. Sound risk management practices and appropriate levels of capital are essential elements of a sound commercial real estate lending program. Concentrations of CRE exposures add a dimension of risk that compounds the risk inherent in individual loans. Interagency guidance on CRE concentrations describes sound risk management practices, which include board and management oversight, portfolio management, management information systems, market analysis, portfolio stress testing and sensitivity analysis, credit underwriting standards, and credit risk review functions. At December 31, 2017, management believes that it has implemented these practices in order to monitor its CRE lending program and that it is in compliance with the requirements and guidance of federal banking agencies including the federal reserve for institutions with concentrations in commercial real estate lending.
The majority of the loan portfolio consists of loans to businesses and individuals in the Dallas-Fort Worth metroplex and the Houston metropolitan area. This geographic concentration subjects the loan portfolio to the general economic conditions within these areas. The risks created by this concentration have been considered by management in the determination of the adequacy of the allowance for loan losses. Management believes the allowance for loan losses was adequate to cover estimated losses on loans as of December 31, 2017 and 2016.
F-20
Non-Accrual and Past Due Loans
Loans are considered past due if the required principal and interest payments have not been received as of the date such payments were due. Loans are placed on non-accrual status when, in management’s opinion, the borrower may be unable to meet payment obligations as they become due, as well as when required by regulatory provisions. Loans may be placed on non-accrual status regardless of whether or not such loans are considered past due. When interest accrual is discontinued, all unpaid accrued interest is reversed. Interest income is subsequently recognized only to the extent cash payments are received in excess of principal due. Loans are returned to accrual status when all the principal and interest amounts contractually due are brought current and future payments are reasonably assured.
Non-accrual loans aggregated by class of loans, as of December 31, 2017 and 2016, are as follows:
December 31, | December 31, | ||||||
2017(1) | 2016 | ||||||
Real estate: | |||||||
Construction and land | $ | — | $ | — | |||
Farmland | — | — | |||||
1 - 4 family residential | — | — | |||||
Multi-family residential | — | — | |||||
Commercial Real Estate | 61 | — | |||||
Commercial | 398 | 930 | |||||
Consumer | 6 | 11 | |||||
$ | 465 | $ | 941 | ||||
(1) Excludes PCI loans. PCI loans are generally reported as accrual loans unless significant concerns exist related to the predictability of the timing and amount of future cash flows.
During the years ended December 31, 2017 and 2016, interest income not recognized on non-accrual loans was minimal.
An age analysis of past due loans, aggregated by class of loans, as of December 31, 2017 and 2016 is as follows:
December 31, 2017 | |||||||||||||||||||||||||||
30 to 59 Days | 60 to 89 Days | 90 Days or Greater | Total Past Due | Total Current(1) | Total Loans | Total 90 Days Past Due and Still Accruing(2) | |||||||||||||||||||||
Real estate: | |||||||||||||||||||||||||||
Construction and land | $ | 320 | $ | — | $ | — | $ | 320 | $ | 277,505 | $ | 277,825 | $ | — | |||||||||||||
Farmland | 104 | — | — | 104 | 9,281 | 9,385 | — | ||||||||||||||||||||
1 - 4 family residential | 1,274 | 139 | — | 1,413 | 250,252 | 251,665 | — | ||||||||||||||||||||
Multi-family residential | — | — | — | — | 91,152 | 91,152 | — | ||||||||||||||||||||
Commercial Real Estate | 1,830 | — | — | 1,830 | 907,462 | 909,292 | — | ||||||||||||||||||||
Commercial | 1,849 | 389 | 389 | 2,627 | 681,924 | 684,551 | — | ||||||||||||||||||||
Consumer | 39 | 51 | 18 | 108 | 9,540 | 9,648 | 18 | ||||||||||||||||||||
$ | 5,416 | $ | 579 | $ | 407 | $ | 6,402 | $ | 2,227,116 | $ | 2,233,518 | $ | 18 | ||||||||||||||
(1) Includes PCI loans.
(2) Loans 90 days past due and still accruing excludes $3.3 million of PCI loans as of December 31, 2017. No PCI loans were considered non-performing loans as of December 31, 2017.
F-21
December 31, 2016 | |||||||||||||||||||||||||||
30 to 59 Days | 60 to 89 Days | 90 Days or Greater | Total Past Due | Total Current | Total Loans | Total 90 Days Past Due and Still Accruing | |||||||||||||||||||||
Real estate: | |||||||||||||||||||||||||||
Construction and land | $ | 1,047 | $ | — | $ | — | $ | 1,047 | $ | 161,567 | $ | 162,614 | $ | — | |||||||||||||
Farmland | — | — | — | — | 8,262 | 8,262 | — | ||||||||||||||||||||
1 - 4 family residential | 510 | 214 | — | 724 | 139,413 | 140,137 | — | ||||||||||||||||||||
Multi-family residential | — | — | — | — | 14,683 | 14,683 | — | ||||||||||||||||||||
Commercial Real Estate | — | — | 754 | 754 | 369,942 | 370,696 | 754 | ||||||||||||||||||||
Commercial | 1,344 | 438 | 532 | 2,314 | 289,102 | 291,416 | 81 | ||||||||||||||||||||
Consumer | 41 | — | — | 41 | 4,048 | 4,089 | — | ||||||||||||||||||||
$ | 2,942 | $ | 652 | $ | 1,286 | $ | 4,880 | $ | 987,017 | $ | 991,897 | $ | 835 | ||||||||||||||
Loans past due 90 days and still accruing, decreased from $835 as of December 31, 2016 to $18 as of December 31, 2017. These loans are also considered well-secured and in the process of collection as of the reporting date with plans in place for the borrowers to bring the notes fully current. The Company believes that it will collect all principal and interest due on each of the loans past due 90 days and still accruing.
Impaired Loans
Impaired loans are those loans where it is probable the Company will be unable to collect all amounts due in accordance with the original contractual terms of the loan agreement, including scheduled principal and interest payments. All troubled debt restructurings (“TDRs”) are considered impaired loans. Impaired loans are measured based on either the present value of expected future cash flows discounted at the loan’s effective interest rate, the loan’s observable market price; or the fair value of the collateral if the loan is collateral dependent. Substantially all of the Company’s impaired loans are measured at the fair value of the collateral. Impaired loans, or portions thereof, are charged off when deemed uncollectible.
Impaired loans, including PCI loans that have experienced further deterioration in credit quality subsequent to the acquisition date and TDRs, at December 31, 2017 and 2016 are summarized in the following tables.
December 31, 2017(1) | |||||||||||||||||||||||
Unpaid Contractual Principal Balance | Recorded Investment with No Allowance | Recorded Investment With Allowance | Total Recorded Investment | Related Allowance | Average Recorded Investment YTD | ||||||||||||||||||
Real estate: | |||||||||||||||||||||||
Construction and land | $ | — | $ | — | $ | — | $ | — | $ | — | $ | — | |||||||||||
Farmland | — | — | — | — | — | — | |||||||||||||||||
1 - 4 family residential | 161 | 161 | — | 161 | — | 163 | |||||||||||||||||
Multi-family residential | — | — | — | — | — | — | |||||||||||||||||
Commercial Real Estate | 434 | 434 | — | 434 | — | 445 | |||||||||||||||||
Commercial | 398 | 282 | 116 | 398 | 12 | 499 | |||||||||||||||||
Consumer | 75 | 75 | — | 75 | — | 87 | |||||||||||||||||
Total | $ | 1,068 | $ | 952 | $ | 116 | $ | 1,068 | $ | 12 | $ | 1,194 | |||||||||||
(1) Excludes PCI loans that have not experienced further deterioration in credit quality subsequent to the acquisition date.
F-22
December 31, 2016 | |||||||||||||||||||||||
Unpaid Contractual Principal Balance | Recorded Investment with No Allowance | Recorded Investment With Allowance | Total Recorded Investment | Related Allowance | Average Recorded Investment YTD | ||||||||||||||||||
Real estate: | |||||||||||||||||||||||
Construction and land | $ | — | $ | — | $ | — | $ | — | $ | — | $ | — | |||||||||||
Farmland | — | — | — | — | — | — | |||||||||||||||||
1 - 4 family residential | 164 | 164 | — | 164 | — | 265 | |||||||||||||||||
Multi-family residential | — | — | — | — | — | — | |||||||||||||||||
Commercial Real Estate | 382 | 382 | — | 382 | — | 440 | |||||||||||||||||
Commercial | 955 | 381 | 574 | 955 | 246 | 463 | |||||||||||||||||
Consumer | 92 | 81 | 11 | 92 | 4 | 12 | |||||||||||||||||
Total | $ | 1,593 | $ | 1,008 | $ | 585 | $ | 1,593 | $ | 250 | $ | 1,180 | |||||||||||
Interest payments on impaired loans are typically applied to principal unless collectability of the principal amount is reasonably assured, in which case interest is recognized on a cash basis.
During the years ended December 31, 2017, 2016 and 2015, total interest income and cash-based interest income recognized on impaired loans was minimal.
Troubled Debt Restructuring
Modifications of terms for the Company’s loans and their inclusion as TDRs are based on individual facts and circumstances. Loan modifications that are included as TDRs may involve a reduction of the stated interest rate of the loan, an extension of the maturity date at a stated rate of interest lower than the current market rate for new debt with similar risk, or deferral of principal payments, regardless of the period of the modification. The recorded investment in TDRs was $618 and $822 as of December 31, 2017 and 2016, respectively.
There were no new TDRs during the year ended December 31, 2017, three new TDRs during the year ended December 31, 2016 and two new TDRs during the year ended December 31, 2015. The terms of certain loans modified as TDRs during the year ended December 31, 2016 and December 31, 2015 are summarized in the following tables:
During the year ended December 31, 2016 | ||||||||||||||||||||||
Post-Modification Outstanding Recorded Investment | ||||||||||||||||||||||
Number of Loans | Pre- Modification Outstanding Recorded Investment | Adjusted Interest Rate | Extended Maturity | Extended Maturity and Restructured Payments | Extended Maturity, Restructured Payments and Adjusted Interest Rate | |||||||||||||||||
Commercial | 2 | $ | 175 | $ | — | $ | — | $ | 169 | $ | — | |||||||||||
Consumer | 1 | 81 | — | — | 81 | — | ||||||||||||||||
Total | 3 | $ | 256 | $ | — | $ | — | $ | 250 | $ | — | |||||||||||
F-23
During the year ended December 31, 2015 | ||||||||||||||||||||||
Post-Modification Outstanding Recorded Investment | ||||||||||||||||||||||
Number of Loans | Pre- Modification Outstanding Recorded Investment | Adjusted Interest Rate | Extended Maturity | Extended Maturity and Restructured Payments | Extended Maturity, Restructured Payments and Adjusted Interest Rate | |||||||||||||||||
Commercial Real Estate | 1 | $ | 399 | $ | — | $ | — | $ | — | $ | 391 | |||||||||||
Commercial | 1 | 268 | — | — | 246 | — | ||||||||||||||||
Total | 2 | $ | 667 | $ | — | $ | — | $ | 246 | $ | 391 | |||||||||||
All TDRs are measured individually for impairment. Of the three new TDR loans during the year ended December 31, 2016, two are past due and one is performing as agreed to modified terms. A specific allowance for loan losses of $38 is recorded for one of the loans as of December 31, 2016. One of the three loans is on non-accrual status as of December 31, 2016.
Of the two new TDR loans during the year ended December 31, 2015, both are performing as agreed to the modified terms. A specific allowance for loan losses of $132 is recorded for one of the loans as of December 31, 2015. One of the two loans were on non-accrual status as of December 31, 2015.
Interest income recorded during 2017, 2016 and 2015 on TDR loans and interest income that would have been recorded had the terms of the loan not been modified was minimal.
There were no loans modified as a troubled debt restructured loan for which there was a payment default during the year ended December 31, 2017 or December 31, 2016. A default for purposes of this disclosure is a troubled debt restructured loan in which the borrower is 90 days past due or results in the foreclosure and repossession of the applicable collateral.
The Company has not committed to lend additional amounts to customers with outstanding loans that were classified as TDRs as of December 31, 2017 and 2016.
Credit Quality Indicators
From a credit risk standpoint, the Company classifies its loans in one of the following categories: (i) pass, (ii) special mention, (iii) substandard or (iv) doubtful. Loans classified as loss are charged-off. Loans not rated special mention, substandard, doubtful, or loss are classified as pass loans.
The classifications of loans reflect a judgment about the risks of default and loss associated with the loan. The Company reviews the ratings on criticized credits monthly. Ratings are adjusted to reflect the degree of risk and loss that is felt to be inherent in each credit as of each monthly reporting period. All classified credits are evaluated for impairments. If impairment is determined to exist, a specific reserve is established. The Company’s methodology is structured so that specific reserves are increased in accordance with deterioration in credit quality (and a corresponding increase in risk and loss) or decreased in accordance with improvement in credit quality (and a corresponding decrease in risk and loss).
Credits rated special mention show clear signs of financial weaknesses or deterioration in credit worthiness, however, such concerns are not so pronounced that the Company generally expects to experience significant loss within the short-term. Such credits typically maintain the ability to perform within standard credit terms and credit exposure is not as prominent as credits with a lower rating.
Credits rated substandard are those in which the normal repayment of principal and interest may be, or has been, jeopardized by reason of adverse trends or developments of a financial, managerial, economic or political nature, or important weaknesses which exist in collateral. A protracted workout on these credits is a distinct possibility. Prompt corrective action is therefore required to strengthen the Company’s position, and/or to reduce exposure and to assure that adequate remedial measures are taken by the borrower. Credit exposure becomes more likely in such credits and a serious evaluation of the secondary support to the credit is performed.
F-24
Credits rated doubtful are those in which full collection of principal appears highly questionable, and in which some degree of loss is anticipated, even though the ultimate amount of loss may not yet be certain and/or other factors exist which could affect collection of debt. Based upon available information, positive action by the Company is required to avert or minimize loss. Credits rated doubtful are generally also placed on non-accrual.
Credits classified as PCI are those that, at acquisition date, had the characteristics of substandard loans and it was probable, at acquisition, that all contractually required principal and interest payments would not be collected. The Company evaluates these loans on a projected cash flow basis with this evaluation performed quarterly.
The following tables summarize the Company’s internal ratings of its loans, including PCI loans, as of December 31, 2017 and 2016:
December 31, 2017 | |||||||||||||||||||||||
Pass | Special Mention | Substandard | Doubtful | PCI | Total | ||||||||||||||||||
Real estate: | |||||||||||||||||||||||
Construction and land | $ | 277,186 | $ | 639 | $ | — | $ | — | $ | — | $ | 277,825 | |||||||||||
Farmland | 9,336 | — | — | — | 49 | 9,385 | |||||||||||||||||
1 - 4 family residential | 250,904 | 462 | 200 | — | 99 | 251,665 | |||||||||||||||||
Multi-family residential | 91,152 | — | — | — | — | 91,152 | |||||||||||||||||
Commercial Real Estate | 882,523 | 8,771 | 681 | — | 17,317 | 909,292 | |||||||||||||||||
Commercial | 634,796 | 18,337 | 1,155 | 116 | 30,147 | 684,551 | |||||||||||||||||
Consumer | 9,540 | — | 108 | — | — | 9,648 | |||||||||||||||||
Total | $ | 2,155,437 | $ | 28,209 | $ | 2,144 | $ | 116 | $ | 47,612 | $ | 2,233,518 | |||||||||||
December 31, 2016 | |||||||||||||||||||
Pass | Special Mention | Substandard | Doubtful | Total | |||||||||||||||
Real estate: | |||||||||||||||||||
Construction and land | $ | 162,614 | $ | — | $ | — | $ | — | $ | 162,614 | |||||||||
Farmland | 8,262 | — | — | — | 8,262 | ||||||||||||||
1 - 4 family residential | 139,212 | 710 | 215 | — | 140,137 | ||||||||||||||
Multi-family residential | 14,683 | — | — | — | 14,683 | ||||||||||||||
Commercial Real Estate | 368,370 | 2,326 | — | — | 370,696 | ||||||||||||||
Commercial | 289,589 | 686 | 1,034 | 107 | 291,416 | ||||||||||||||
Consumer | 4,078 | — | 11 | — | 4,089 | ||||||||||||||
Total | $ | 986,808 | $ | 3,722 | $ | 1,260 | $ | 107 | $ | 991,897 | |||||||||
An analysis of the allowance for loan losses for the years ended December 31, 2017 , 2016 and 2015 is as follows:
For the | For the | For the | |||||||||
Year Ended | Year Ended | Year Ended | |||||||||
December 31, 2017 | December 31, 2016 | December 31, 2015 | |||||||||
Balance at beginning of year | $ | 8,524 | $ | 6,772 | $ | 5,981 | |||||
Provision charged to earnings | 5,114 | 2,050 | 868 | ||||||||
Charge-offs | (839 | ) | (333 | ) | (140 | ) | |||||
Recoveries | 9 | 35 | 63 | ||||||||
Net charge-offs | (830 | ) | (298 | ) | (77 | ) | |||||
Balance at end of year | $ | 12,808 | $ | 8,524 | $ | 6,772 | |||||
F-25
The allowance for loan losses as a percentage of total loans was 0.57%, 0.86% and 0.83% as of December 31, 2017, 2016 and 2015, respectively.
The following tables summarize the activity in the allowance for loan losses by portfolio segment for the years ended December 31, 2017, 2016 and 2015:
December 31, 2017 | |||||||||||||||||||||||
Real Estate | |||||||||||||||||||||||
Construction, Land and Farmland | Residential | Commercial Real Estate | Commercial | Consumer | Total | ||||||||||||||||||
Balance at beginning of year | $ | 1,415 | $ | 1,116 | $ | 3,003 | $ | 2,955 | $ | 35 | $ | 8,524 | |||||||||||
Provision (recapture) charged to earnings | (100 | ) | 368 | 1,407 | 3,452 | (13 | ) | 5,114 | |||||||||||||||
Charge-offs | — | (11 | ) | — | (828 | ) | — | (839 | ) | ||||||||||||||
Recoveries | — | — | — | 9 | — | 9 | |||||||||||||||||
Net charge-offs (recoveries) | — | (11 | ) | — | (819 | ) | — | (830 | ) | ||||||||||||||
Balance at end of year | $ | 1,315 | $ | 1,473 | $ | 4,410 | $ | 5,588 | $ | 22 | $ | 12,808 | |||||||||||
Period-end amount allocated to: | |||||||||||||||||||||||
Specific reserves: | $ | — | $ | — | $ | — | $ | 12 | $ | — | $ | 12 | |||||||||||
General reserves | 1,315 | 1,473 | 4,410 | 5,576 | 22 | 12,796 | |||||||||||||||||
Total | $ | 1,315 | $ | 1,473 | $ | 4,410 | $ | 5,588 | $ | 22 | $ | 12,808 | |||||||||||
December 31, 2016 | |||||||||||||||||||||||
Real Estate | |||||||||||||||||||||||
Construction, Land and Farmland | Residential | Commercial Real Estate | Commercial | Consumer | Total | ||||||||||||||||||
Balance at beginning of year | $ | 1,104 | $ | 1,124 | $ | 2,189 | $ | 2,324 | $ | 31 | $ | 6,772 | |||||||||||
Provision (recapture) charged to earnings | 311 | (8 | ) | 814 | 913 | 20 | 2,050 | ||||||||||||||||
Charge-offs | — | — | — | (314 | ) | (19 | ) | (333 | ) | ||||||||||||||
Recoveries | — | — | — | 32 | 3 | 35 | |||||||||||||||||
Net charge-offs (recoveries) | — | — | — | (282 | ) | (16 | ) | (298 | ) | ||||||||||||||
Balance at end of year | $ | 1,415 | $ | 1,116 | $ | 3,003 | $ | 2,955 | $ | 35 | $ | 8,524 | |||||||||||
Period-end amount allocated to: | |||||||||||||||||||||||
Specific reserves: | $ | — | $ | — | $ | — | $ | 246 | $ | 4 | $ | 250 | |||||||||||
General reserves | 1,415 | 1,116 | 3,003 | 2,709 | 31 | 8,274 | |||||||||||||||||
Total | $ | 1,415 | $ | 1,116 | $ | 3,003 | $ | 2,955 | $ | 35 | $ | 8,524 | |||||||||||
F-26
December 31, 2015 | |||||||||||||||||||||||
Real Estate | |||||||||||||||||||||||
Construction, Land and Farmland | Residential | Commercial Real Estate | Commercial | Consumer | Total | ||||||||||||||||||
Balance at beginning of year | $ | 769 | $ | 1,166 | $ | 1,890 | $ | 2,092 | $ | 64 | $ | 5,981 | |||||||||||
Provision (recapture) charged to earnings | 383 | (42 | ) | 294 | 262 | (29 | ) | 868 | |||||||||||||||
Charge-offs | (48 | ) | — | — | (87 | ) | (5 | ) | (140 | ) | |||||||||||||
Recoveries | — | — | 5 | 57 | 1 | 63 | |||||||||||||||||
Net charge-offs (recoveries) | (48 | ) | — | 5 | (30 | ) | (4 | ) | (77 | ) | |||||||||||||
Balance at end of year | $ | 1,104 | $ | 1,124 | $ | 2,189 | $ | 2,324 | $ | 31 | $ | 6,772 | |||||||||||
Period-end amount allocated to: | |||||||||||||||||||||||
Specific reserves: | $ | — | $ | — | $ | — | $ | 186 | $ | 7 | $ | 193 | |||||||||||
General reserves | 1,104 | 1,124 | 2,189 | 2,138 | 24 | 6,579 | |||||||||||||||||
Total | $ | 1,104 | $ | 1,124 | $ | 2,189 | $ | 2,324 | $ | 31 | $ | 6,772 | |||||||||||
The Company’s recorded investment in loans as of December 31, 2017 and 2016 related to the balance in the allowance for loan losses on the basis of the Company’s impairment methodology is as follows:
December 31, 2017 | |||||||||||||||||||||||
Real Estate | |||||||||||||||||||||||
Construction, Land and Farmland | Residential | Commercial Real Estate | Commercial | Consumer | Total | ||||||||||||||||||
Loans individually evaluated for impairment | $ | — | $ | 161 | $ | 434 | $ | 398 | $ | 75 | $ | 1,068 | |||||||||||
Loans collectively evaluated for impairment | 287,161 | 342,557 | 891,541 | 654,006 | 9,573 | 2,184,838 | |||||||||||||||||
PCI loans | 49 | 99 | 17,317 | 30,147 | — | 47,612 | |||||||||||||||||
Total | $ | 287,210 | $ | 342,817 | $ | 909,292 | $ | 684,551 | $ | 9,648 | $ | 2,233,518 | |||||||||||
December 31, 2016 | |||||||||||||||||||||||
Real Estate | |||||||||||||||||||||||
Construction, Land and Farmland | Residential | Commercial Real Estate | Commercial | Consumer | Total | ||||||||||||||||||
Loans individually evaluated for impairment | $ | — | $ | 164 | $ | 382 | $ | 955 | $ | 92 | $ | 1,593 | |||||||||||
Loans collectively evaluated for impairment | 170,876 | 154,656 | 370,314 | 290,461 | 3,997 | 990,304 | |||||||||||||||||
Total | $ | 170,876 | $ | 154,820 | $ | 370,696 | $ | 291,416 | $ | 4,089 | $ | 991,897 | |||||||||||
Loans acquired with evidence of credit quality deterioration at acquisition, for which it was probable that the Company would not be able to collect all contractual amounts due, were accounted for as PCI loans. The carrying amount of PCI loans included in the consolidated balance sheets and the related outstanding balances at December 31, 2017 are set forth in the table below. The outstanding balance represents the total amount owed, including accrued but unpaid interest, and any amounts previously charged off. The carrying amount of PCI loans for the year ended December 31, 2016 was minimal and has been excluded from the table below.
F-27
Year Ended December 31, 2017 | |||
Carrying amount | $ | 47,612 | |
Outstanding balance | 63,940 | ||
Changes in the accretable yield for PCI loans for the year ended December 31, 2017 are included in table below. There was no accretable yield balance for PCI loans for the years ended December 31, 2016 and 2015.
Year Ended December 31, 2017 | |||
Balance at beginning of period | $ | — | |
Additions through acquisitions | 3,927 | ||
Accretion | (1,204 | ) | |
Balance at year-end | $ | 2,723 | |
Servicing Assets
The Company was servicing loans of approximately $74,737 and $32,905 as of December 31, 2017 and 2016. A summary of the changes in the related servicing assets are as follows:
Year Ended December 31, | |||||||
2017 | 2016 | ||||||
Balance at beginning of year | $ | 601 | $ | 426 | |||
Servicing assets acquired through acquisition | 313 | — | |||||
Increase from loan sales | 522 | 365 | |||||
Amortization charged to income | (193 | ) | (190 | ) | |||
Transfer of servicing assets to held for sale | (28 | ) | — | ||||
Balance at year-end | $ | 1,215 | $ | 601 | |||
The estimated fair value of the servicing assets approximated the carrying amount at December 31, 2017. Fair value is estimated by discounting estimated future cash flows from the servicing assets using discount rates that approximate current market rates over the expected lives of the loans being serviced. A valuation allowance is recorded when the fair value is below the carrying amount of the asset. As of December 31, 2017 and 2016, there were no valuation allowances recorded.
The Company may also receive a portion of subsequent interest collections on loans sold that exceed the contractual servicing fee. In that case, the Company records an interest-only strip based on its relative fair market value and the other components of the loans. There was no interest-only strip receivable recorded at December 31, 2017 and 2016.
During the fiscal year ended December 31, 2017, 2016 and 2015, the Bank sold $27,747, $18,704 and $6,724, respectively, of SBA loans resulting in a gain of $1,940, $1,690 and $550, respectively. The gain on sale of SBA loans is recorded in Gain on sales of loans in the Consolidated Statements of Income.
F-28
6. Bank Premises and Equipment
Bank premises and equipment in the accompanying consolidated balance sheets are summarized as follows:
December 31, | |||||||
2017 | 2016 | ||||||
Building and improvements | $ | 35,239 | $ | 7,673 | |||
Site improvements | 140 | — | |||||
Tenant improvements | 744 | — | |||||
Leasehold improvements | 5,132 | 3,119 | |||||
Land | 33,002 | 6,671 | |||||
Furniture, fixtures and equipment | 7,588 | 5,106 | |||||
Construction in Progress | 456 | 365 | |||||
82,301 | 22,934 | ||||||
Less accumulated depreciation | 7,050 | 5,521 | |||||
$ | 75,251 | $ | 17,413 | ||||
The Company recorded depreciation expense of approximately $1,566, $1,111 and $1,040 for the years ended December 31, 2017, 2016 and 2015, respectively.
7. Non-marketable Equity Securities
Investments in non-marketable equity securities in the accompanying consolidated balance sheets are summarized as follows:
December 31, | |||||||
2017 | 2016 | ||||||
FHLB of Dallas stock | $ | 6,431 | $ | 3,846 | |||
FRB of Dallas stock | 3,482 | 3,470 | |||||
Other non-marketable equity securities | 3,819 | 50 | |||||
$ | 13,732 | $ | 7,366 | ||||
8. Intangible Assets
Intangible assets in the accompanying consolidated balance sheets are summarized as follows:
December 31, 2017 | |||||||||||||
Weighted | Gross | Net | |||||||||||
Amortization | Intangible | Accumulated | Intangible | ||||||||||
Period | Asset | Amortization | Asset | ||||||||||
Core deposit intangibles | 8.7 years | $ | 17,007 | $ | 2,694 | $ | 14,313 | ||||||
Servicing asset | 6.8 years | 1,621 | 406 | 1,215 | |||||||||
Intangible lease assets | 3.3 years | 5,281 | 368 | 4,913 | |||||||||
$ | 23,909 | $ | 3,468 | $ | 20,441 | ||||||||
F-29
December 31, 2016 | |||||||||||||
Weighted | Gross | Net | |||||||||||
Amortization | Intangible | Accumulated | Intangible | ||||||||||
Period | Asset | Amortization | Asset | ||||||||||
Core deposit intangibles | 6.2 years | $ | 3,459 | $ | 1,914 | $ | 1,545 | ||||||
Servicing asset | 7.9 years | 814 | 213 | 601 | |||||||||
Other intangible assets | 4.3 years | 106 | 71 | 35 | |||||||||
$ | 4,379 | $ | 2,198 | $ | 2,181 | ||||||||
For the years ended December 31, 2017, 2016 and 2015, amortization expense related to intangible assets of approximately $1,270, $595 and $378 respectively, is included within amortization of intangibles, occupancy and equipment and other income within the consolidated statements of income. The estimated aggregate future amortization expense for intangible assets remaining as of December 31, 2017 was as follows:
Year | Amount | |||
2018 | $ | 3,744 | ||
2019 | 2,981 | |||
2020 | 2,692 | |||
2021 | 2,147 | |||
2022 | 1,896 | |||
Thereafter | 6,981 | |||
$ | 20,441 | |||
9. Goodwill
Changes in the carrying amount of goodwill in the accompanying consolidated balance sheets are summarized as follows:
December 31, | |||||||
2017 | 2016 | ||||||
Balance as of December 31, 2016 | $ | 26,865 | $ | 26,865 | |||
Sovereign acquisition | 109,091 | — | |||||
Liberty acquisition | 23,496 | — | |||||
Balance as of December 31, 2017 | $ | 159,452 | $ | 26,865 | |||
10. Deposits
Deposits in the accompanying consolidated balance sheets are summarized as follows:
December 31, | |||||||
2017 | 2016 | ||||||
Noninterest-bearing demand accounts | $ | 612,830 | $ | 327,614 | |||
Interest-bearing demand accounts | 187,516 | 69,570 | |||||
Savings accounts | 52,822 | 11,166 | |||||
Limited access money market accounts | 960,149 | 579,950 | |||||
Certificates of deposit, greater than $100 | 419,888 | 115,214 | |||||
Certificates of deposit, less than $100 | 45,425 | 16,116 | |||||
Total | $ | 2,278,630 | $ | 1,119,630 | |||
F-30
As of December 31, 2017, the scheduled maturities of certificates of deposit were as follows:
Year | Amount | |||
2018 | $ | 413,269 | ||
2019 | 37,788 | |||
2020 | 10,508 | |||
2021 | 2,120 | |||
2022 | 1,628 | |||
2023 | — | |||
Total | $ | 465,313 | ||
The aggregate amount of demand deposit overdrafts that have been reclassified as loans were $203 and $30 as of December 31, 2017 and 2016, respectively. Brokered deposits at December 31, 2017 and 2016 totaled approximately $88,195 and $27,035, respectively.
11. Advances from the Federal Home Loan Bank
Advances from the FHLB totaled $71,164 and $38,306 at December 31, 2017 and 2016, respectively. As of December 31, 2017, the advances were collateralized by a blanket floating lien on certain securities and loans, had a weighted average rate of 1.36% and mature on various dates in 2018 and 2022. The Company had the availability to borrow additional funds of approximately $721,594 as of December 31, 2017.
Contractual maturities of FHLB advances at December 31, 2017 were as follows:
2018 | $ | 68,000 | |
2022 | 3,164 | ||
Thereafter | — | ||
Total | $ | 71,164 | |
12. Other Credit Extensions
As of December 31, 2017 and 2016, the Company maintained two credit facilities with commercial banks which provide federal funds credit extensions with an availability to borrow up to an aggregate amount of approximately $55,000 and $14,600, respectively. There were no borrowings against these lines as of December 31, 2017 and 2016.
As of December 31, 2017 and 2016, the Company maintained a secured line of credit with the FRB with an availability to borrow approximately $338,592 and $197,262, respectively. Approximately $423,062 and $265,001 of commercial loans were pledged as collateral at December 31, 2017 and 2016, respectively. There were no borrowings against this line as of December 31, 2017 and 2016.
13. Borrowed Funds
Borrowed funds in the accompanying consolidated balance sheets are as follows:
December 31, | |||||||
2017 | 2016 | ||||||
Junior subordinated debentures | $ | 11,702 | $ | 3,093 | |||
Subordinated notes (1) | 4,987 | 4,942 | |||||
Federal funds purchased | 15,000 | — | |||||
(1) | Subordinated notes are net of discount of $13 and $15 and issuance costs of $36 and $43 as of December 31, 2017 and 2016, respectively. |
F-31
Junior Subordinated Debentures
The Company assumed in a previous acquisition $3,093 in fixed/floating rate junior subordinated debentures underlying common securities and preferred capital securities, or the Parkway Trust Securities, issued by Parkway National Capital Trust I (“Parkway Trust”), a statutory business trust and acquired wholly-owned subsidiary of the Company. The Company assumed the guarantor position and as such, unconditionally guarantees payment of accrued and unpaid distributions required to be paid on the Parkway Trust Securities subject to certain exceptions, the redemption price when a capital security is called for redemption and amounts due if a trust is liquidated or terminated.
The Company owns all of the outstanding common securities of the Parkway Trust. The Parkway Trust used the proceeds from the issuance of its Parkway Trust Securities to buy the debentures originally issued by Fidelity Resource Company. These debentures are the Parkway Trust’s only assets and the interest payments from the debentures finance the distributions paid on the Parkway Trust Securities.
The Parkway Trust Securities pay cumulative cash distributions quarterly at a rate per annum equal to the 3-month LIBOR plus 1.85% percent. So long as no event of default leading to an acceleration event has occurred, the Company has the right at any time and from time to time during the term of the debenture to defer payments of interest by extending the interest distribution period for up to twenty consecutive quarterly periods. The effective rate as of December 31, 2017 and 2016 was 3.44% and 2.70%, respectively. The Parkway Trust Securities are subject to mandatory redemption in whole or in part, upon repayment of the debentures at the stated maturity in the year 2036 or their earlier redemption, in each case at a redemption price equal to the aggregate liquidation preference of the Parkway Trust Securities plus any accumulated and unpaid distributions thereon to the date of redemption. Prior redemption is permitted under certain circumstances.
In connection with the acquisition of Sovereign Bancshares, Inc. (“Sovereign”) on August 1, 2017, the Company assumed $8,609 in floating rate junior subordinated debentures underlying common securities and preferred capital securities, or the SovDallas Trust Securities, issued by SovDallas Capital Trust I (“SovDallas Trust”), a statutory business trust and acquired wholly-owned subsidiary of the Company. The Company assumed the guarantor position and as such, unconditionally guarantees payment of accrued and unpaid distributions required to be paid on the SovDallas Trust Securities subject to certain exceptions, the redemption price when a capital security is called for redemption and amounts due if a trust is liquidated or terminated. The Company also owns all of the outstanding common securities of the SovDallas Trust.
The SovDallas Trust invested the total proceeds from the sale of the SovDallas Trust Securities and the investment in common shares in floating rate junior subordinated debentures originally issued by Sovereign. Interest on the SovDallas Trust Securities is payable quarterly at a rate equal to 3-month LIBOR plus 4.0%. Principal payments are due at maturity in July 2038. The effective rate as of December 31, 2017 was 5.34%. The SovDallas Trust Securities are guaranteed by the Company and are subject to redemption. The Company may redeem the debt securities, in whole or in part, at any time at an amount equal to the principal amount of the debt securities being redeemed plus any accrued and unpaid interest.
The Parkway Trust Securities and SovDallas Trust Securities qualify as Tier 1 capital, subject to regulatory limitations, under guidelines established by the Federal Reserve.
Subordinated Notes
During 2013 the Company issued, in the aggregate principal amount of $5,000, subordinated promissory notes (“Notes”) via a private offering. The Notes were issued to certain entities controlled by an affiliate of the Company for the purpose of using the proceeds to support the growth of the Company. The Notes are unsecured, with interest payable quarterly at a fixed rate of 6.0% per annum, and unpaid principal and interest due at the stated maturity on December 31, 2023. The Notes qualify as Tier 2 Capital, subject to regulatory limitations, under guidelines established by the Federal Reserve. In addition, the Notes may be redeemed in whole or in part on any interest payment date that occurs on or after December 23, 2018 subject to approval of the Federal Reserve in compliance with applicable statutes and regulations.
In connection with the issuance of the Notes, the Company issued warrants to purchase 25,000 shares of common stock of the Company at an exercise price of $11.00 per share, exercisable at any time, in whole or in part, prior to December 31, 2023. The fair value of the warrants was calculated at $0.80 and is recorded as additional paid-in capital and the related debt discount is being accreted into interest expense.
F-32
Federal Funds Purchased
Federal funds purchased are unsecured overnight borrowings from other financial institutions. At December 31, 2017, the Company had $15,000 in federal funds purchased carried at a rate of 2.00% which matured and was paid off on January 1, 2018. At December 31, 2016, the Company had no federal funds purchased.
14. Income Taxes
The Tax Act, enacted on December 22, 2017, reduced the U.S. federal corporate tax rate from 35% to 21%. Also on December 22, 2017, the SEC issued SAB 118, which provides guidance on accounting for tax effects of the Act. SAB 118 provides a measurement period of up to one year from the enactment date to complete the accounting. Based on the information available and current interpretation of the rules, the Company has made reasonable estimates of the impact of the reduction in the corporate tax rate and re-measurement of certain deferred tax assets and liabilities based on the rate at which they are expected to reverse in the future. The Company is still analyzing certain provisional estimates for the Sovereign and Liberty acquisitions as specified in Note 24 - Business Combinations. Any changes to these provisional estimates and re-measurement of deferred taxes could potentially have an impact on our future earnings and effective tax rate. The provisional amount recorded related to the re-measurement of the Company's deferred tax balance was $3,051 for the year ended December 31, 2017.
The provision for income taxes is summarized as follows:
Year Ended December 31, | |||||||||||
2017 | 2016 | 2015 | |||||||||
Income tax expense (benefit): | |||||||||||
Current | $ | 7,886 | $ | 7,833 | $ | 4,492 | |||||
Deferred | 5,143 | (1,366 | ) | (375 | ) | ||||||
$ | 13,029 | $ | 6,467 | $ | 4,117 | ||||||
The table below reconciles income tax expense for the years ended December 31, 2017, 2016 and 2015 computed by applying the applicable U.S. Federal statutory income tax rate, reconciled to the tax expense computed at the effective income tax rate:
Year Ended December 31, | |||||||||||
2017 | 2016 | 2015 | |||||||||
Federal income tax expense rate at 35% for December 31, 2017 and 2016 and 34% for December 31, 2015 | $ | 9,863 | $ | 6,656 | $ | 4,388 | |||||
Bank-owned life insurance | (206 | ) | (216 | ) | (208 | ) | |||||
Non-deductible dues and memberships | 132 | 59 | 56 | ||||||||
Non-deductible meals and entertainment | 80 | 49 | 46 | ||||||||
Excess tax benefit from stock compensation(1) | (268 | ) | — | — | |||||||
Deferred tax asset re-measurement due to the Tax Act(1) | 3,051 | — | — | ||||||||
Other | 377 | (81 | ) | (165 | ) | ||||||
Total income tax expense | $ | 13,029 | $ | 6,467 | $ | 4,117 | |||||
Effective tax rate | 46.2 | % | 34.0 | % | 31.9 | % | |||||
F-33
Deferred income taxes reflect the net tax effects of temporary differences between the recorded amounts of assets and liabilities for financial reporting purposes, and the amounts used for income tax purposes. Significant components of the Company’s deferred tax assets and liabilities are as follows:
December 31, | December 31, | ||||||
2017 | 2016 | ||||||
Deferred tax assets: | |||||||
Net operating loss | $ | — | $ | 165 | |||
Organizational costs | 64 | 405 | |||||
Allowance for loan losses | 2,592 | 2,918 | |||||
Capital loss carryforward | 57 | 95 | |||||
FHLB Borrowing | 28 | 57 | |||||
Deferred rent expenses | 302 | 90 | |||||
Restricted stock | 201 | 182 | |||||
Stock options | 334 | 399 | |||||
Accrued bonuses | 22 | 437 | |||||
Loan discounts | 4,805 | 211 | |||||
Deferred compensation | 115 | — | |||||
Other real estate owned | 219 | — | |||||
Net unrealized gain on securities available for sale | 340 | 643 | |||||
Other | 137 | 214 | |||||
Total deferred tax assets | 9,216 | 5,816 | |||||
Deferred tax liabilities: | |||||||
Core deposit intangibles | 3,034 | 541 | |||||
Partnership investments | 497 | — | |||||
Bank premises and equipment | 912 | 1,795 | |||||
Other | 163 | 13 | |||||
Total deferred tax liabilities | 4,606 | 2,349 | |||||
Net deferred tax asset | $ | 4,610 | $ | 3,467 | |||
Included within other assets in the accompanying consolidated balance sheets as of December 31, 2017 is a current tax receivable of $7,085 and a deferred tax asset of $4,937. The Company also has a deferred tax liability of $327 classified as branch liabilities held for sale in the accompany consolidated balance sheets as of December 31, 2017. See Note 25 - Branch Assets and Liabilities Held for Sale for additional information. Included in the accompanying consolidated balance sheets as of December 31, 2016 is a current tax receivable of $91 and a net deferred tax asset of $3,467 in other assets.
15. Commitments and Contingencies
Litigation
The Company may from time to time be involved in legal actions arising from normal business activities. Management believes that these actions are without merit or that the ultimate liability, if any, resulting from them will not materially affect the financial position or results of operations of the Company.
Lessee: Operating Leases
The Company leases several of its banking facilities under operating leases expiring in various years through 2022 and sublets one operating lease which expired in February of 2018. Certain of the operating leases have rent escalation clauses based on pre-determined annual rate increases and provide for renewal options at their fair value at the time of renewal.
F-34
As of December 31, 2017, future minimum rental payments, exclusive of taxes and other charges, under non-cancelable operating leases for each of the next five years were:
Year End December 31, | Future Minimum Rentals | ||
2018 | $ | 2,349 | |
2019 | 2,215 | ||
2020 | 1,703 | ||
2021 | 889 | ||
2022 | 691 | ||
Thereafter | 2,134 | ||
Total | $ | 9,981 | |
Rental expense was approximately $2,298, $1,432 and $1,399 for the years ended December 31, 2017, 2016 and 2015, respectively. Sublease rental income was approximately $139, $58 and $30 for the years ended December 31, 2017, 2016 and 2015. The total minimum sublease rental to be received in 2018 under the non-cancelable sublease is approximately $5.
As part of the Sovereign acquisition and our evaluation of acquired facilities owned or leased for ongoing economic benefit, a decision was made to cease using two acquired leases during the current year that expire between 2026 and 2029. In accordance with accounting for exit and disposal activities, the Company recognized a liability for lease exit costs incurred when it no longer derived economic benefits from the related leases. A cease-use liability of $1,407 is included in accrued interest payable and other liabilities in the consolidated balance sheets as of December 31, 2017. The liability was recognized and measured based on a discounted cash flow model when the cease use date occurred. The liability to be recorded as of the cease use date was determined based on the remaining lease rental due, reduced by (1) estimated sublease rental income that could be reasonably obtained for the properties and (2) the associated $1,290 lease intangible liability recorded for unfavorable lease terms on these two acquired leases given the market conditions as of the Sovereign acquisition date. The total expense related to the cease-use liability for the year ended December 31, 2017 was $117, which was recorded in the noninterest expense line item "other" in the consolidated statements of income.
Lessor: Operating Leases
The Company has multiple operating leases with various tenants for partial use of our owned corporate building space, which was purchased by the Company during the year ended December 31, 2017. The rest of the building is used by the Company for corporate offices. These operating leases expire in various years through 2023.
As of December 31, 2017, future minimum payments receivable under non-cancelable operating leases for each of the next five years were:
Year End December 31, | Future Minimum Rentals | ||
2018 | $ | 1,546 | |
2019 | 1,244 | ||
2020 | 1,076 | ||
2021 | 471 | ||
2022 | 100 | ||
Thereafter | 100 | ||
Total | $ | 4,537 | |
Rental income was approximately $158 for the year ended December 31, 2017 which is included within other noninterest income in the accompanying consolidated statements of income. No rental income was recognized for the years ended December 31, 2016 and 2015.
F-35
The below table summarizes the costs, accumulated amortization/depreciation and carrying amount of the corporate building asset and liability components as they are presented on the consolidated balance sheets as of December 31, 2017.
Cost | Accumulated Amortization/ Depreciation | Net Carrying Amount | |||||||
Bank premises, furniture and equipment: | |||||||||
Building and improvements | $ | 19,872 | $ | (33 | ) | $ | 19,839 | ||
Site and tenant improvements | 884 | (32 | ) | 852 | |||||
Land | 16,781 | — | 16,781 | ||||||
37,537 | (65 | ) | 37,472 | ||||||
Intangible assets: | |||||||||
Intangible lease assets | 4,765 | (241 | ) | 4,524 | |||||
Accrued interest payable and other liabilities: | |||||||||
Intangible lease obligations | 584 | (19 | ) | 565 | |||||
Total | $ | 41,718 | $ | (287 | ) | $ | 41,431 | ||
Qualified Affordable Housing Investment
On July 26, 2017, the Company began investing in a qualified housing project. At December 31, 2017, the balance of the investment for qualified affordable housing projects was $1,982. This balance is reflected in non-marketable equity securities on the consolidated balance sheets. The total unfunded commitment related to the investment in a qualified housing project totaled $1,765 at December 31, 2017 which is reflected in accrued interest payable and other liabilities on the consolidated balance sheets. The Company expects to fulfill this commitment during the year ending 2031.
16. Fair Value Disclosures
The authoritative guidance for fair value measurements defines fair value as the price that would be received to sell an asset or paid to transfer a liability in an orderly transaction between market participants. A fair value measurement assumes that the transaction to sell the asset or transfer the liability occurs in the principal market for the asset or liability or, in the absence of a principal market, the most advantageous market for the asset or liability. The price in the principal (or most advantageous) market used to measure the fair value of the asset or liability shall not be adjusted for transaction costs. An orderly transaction is a transaction that assumes exposure to the market for a period prior to the measurement date to allow for marketing activities that are usual and customary for transactions involving such assets and liabilities; it is not a forced transaction. Market participants are buyers and sellers in the principal market that are (i) independent, (ii) knowledgeable, (iii) able to transact and (iv) willing to transact.
The authoritative guidance requires the use of valuation techniques that are consistent with the market approach, the income approach and/or the cost approach. The market approach uses prices and other relevant information generated by market transactions involving identical or comparable assets and liabilities. The income approach uses valuation techniques to convert future amounts, such as cash flows or earnings, to a single present amount on a discounted basis. The cost approach is based on the amount that currently would be required to replace the service capacity of an asset (replacement costs). Valuation techniques should be consistently applied. Inputs to valuation techniques refer to the assumptions that market participants would use in pricing the asset or liability. Inputs may be observable, meaning those that reflect the assumptions market participants would use in pricing the asset or liability developed based on market data obtained from independent sources, or unobservable, meaning those that reflect the reporting entity’s own assumptions about the assumptions market participants would use in pricing the asset or liability developed based on the best information available in the circumstances. In that regard, the authoritative guidance establishes a fair value hierarchy for valuation inputs that gives the highest priority to quoted prices in active markets for identical assets or liabilities and the lowest priority to unobservable inputs. The fair value hierarchy is as follows:
F-36
Level 1 Inputs. Unadjusted quoted prices in active markets for identical assets or liabilities that the reporting entity has the ability to access at the measurement date.
Level 2 Inputs. Inputs other than quoted prices included in Level 1 that are observable for the asset or liability, either directly or indirectly. These include quoted prices for similar assets or liabilities in active markets, quoted prices for identical or similar assets or liabilities in markets that are not active, inputs other than quoted prices that are observable for the asset or liability (for example, interest rates, volatilities, prepayment speeds, loss severities, credit risks and default rates) or inputs that are derived principally from or corroborated by observable market data by correlation or other means. Level 2 investments consist primarily of obligations of U.S. government agencies, corporate bonds, municipal securities, mortgage-backed securities, collateralized mortgage obligations and asset-backed securities.
Level 3 Inputs. Significant unobservable inputs that reflect an entity’s own assumptions that market participants would use in pricing the assets or liabilities.
In general, fair value is based upon quoted market prices, where available. If such quoted market prices are not available, fair value is based upon internally developed models that primarily use, as inputs, observable market- based parameters. Valuation adjustments may be made to ensure that financial instruments are recorded at fair value. While management believes the Company’s valuation methodologies are appropriate and consistent with other market participants, the use of different methodologies or assumptions to determine the fair value of certain financial instruments could result in a different estimate of fair value at the reporting date.
A description of the valuation methodologies used for instruments measured at fair value, as well as the general classification of such instruments pursuant to the valuation hierarchy, is set forth below.
Assets and liabilities measured at fair value on a recurring basis include the following:
Investment Securities Available For Sale: Securities classified as available for sale are reported at fair value utilizing Level 2 inputs. For those securities classified as Level 2, the Company obtains fair value measurements from an independent pricing service. The fair value measurements consider observable data that may include dealer quotes, market spreads, cash flows, the U. S. Treasury yield curve, live trading levels, trade execution data for similar securities, market consensus prepayments speeds, credit information and the bond’s terms and conditions, among other things.
The following table summarizes assets measured at fair value on a recurring basis as of December 31, 2017 and 2016, segregated by the level of the valuation inputs within the fair value hierarchy utilized to measure fair value:
Fair Value | |||||||||||||||
Measurements Using | |||||||||||||||
Level 1 | Level 2 | Level 3 | Total | ||||||||||||
Inputs | Inputs | Inputs | Fair Value | ||||||||||||
As of December 31, 2017 | |||||||||||||||
Investment securities available for sale | $ | — | $ | 228,117 | $ | — | $ | 228,117 | |||||||
As of December 31, 2016 | |||||||||||||||
Investment securities available for sale | $ | — | $ | 102,559 | $ | — | $ | 102,559 | |||||||
There were no liabilities measured at fair value on a recurring basis as of December 31, 2017 and 2016.
There were no transfers between Level 2 and Level 3 during the years ended December 31, 2017 and 2016.
Certain assets and liabilities are measured at fair value on a non-recurring basis; that is, the instruments are not measured at fair value on an ongoing basis but are subject to fair value adjustments in certain circumstances (for example, when there is evidence of impairment).
F-37
Assets measured at fair value on a non-recurring basis include impaired loans and other real estate owned. Impaired loans and other real estate owned that are collateral dependent are measured for impairment using the fair value of the collateral adjusted by additional Level 3 inputs, such as estimated costs to sell. Impaired loans and other real estate owned secured by real estate, receivables or inventory had discounts determined by management on an individual loan basis. Impaired loans and other real estate owned that are not collateral dependent are measured for impairment by a discounted cash flow analysis using a net present value calculation that utilizes data from the loan file. As such, the fair value of impaired loans and other real estate owned are considered a Level 3 in the fair value hierarchy.
Appraisals for impaired loans and other real estate owned are performed by certified general appraisers whose qualifications and licenses have been reviewed and verified by the Company. Once reviewed, a member of the credit department reviews the assumptions and approaches utilized in the appraisal as well as the overall resulting fair value in comparisons to independent data sources such as recent market data or industry wide-statistics. On a periodic basis, the Company compares the actual selling price of collateral that has been sold to the most recent appraised value to determine what additional adjustments, if any, should be made to the appraisal value to arrive at fair value.
The Company records other real estate owned at fair value less estimated costs to sell at the date of foreclosure. After foreclosure, other real estate owned is carried at the lower of the initial carrying amount (fair value less estimated costs to sell or lease), or at the value determined by subsequent appraisals or internal valuations of the other real estate owned.
The following table summarizes assets measured at fair value on a non-recurring basis as of December 31, 2017 and 2016, segregated by the level of the valuation inputs within the fair value hierarchy utilized to measure fair value:
Fair Value | |||||||||||||||
Measurements Using | |||||||||||||||
Level 1 | Level 2 | Level 3 | Total | ||||||||||||
Inputs | Inputs | Inputs | Fair Value | ||||||||||||
As of December 31, 2017 | |||||||||||||||
Assets: | |||||||||||||||
Impaired loans | $ | — | $ | — | $ | 116 | $ | 116 | |||||||
Other real estate owned | $ | — | $ | — | $ | 449 | $ | 449 | |||||||
As of December 31, 2016 | |||||||||||||||
Assets: | |||||||||||||||
Impaired loans | $ | — | $ | — | $ | 1,593 | $ | 1,593 | |||||||
Other real estate owned | $ | — | $ | — | $ | 662 | $ | 662 | |||||||
At December 31, 2017, impaired loans had a carrying value of $116 with $12 specific allowance for loan loss allocated. At December 31, 2016, impaired loans had a carrying value of $1,593, with $250 specific allowance for loan loss allocated.
There were no liabilities measured at fair value on a non-recurring basis as of December 31, 2017 and 2016.
For Level 3 financial assets measured at fair value on a non-recurring basis as of December 31, 2017 and 2016, the significant unobservable inputs used in the fair value measurements were as follows:
December 31, 2017 | |||||||||||
Valuation | Unobservable | Weighted | |||||||||
Assets/Liabilities | Fair Value | Technique | Input(s) | Average | |||||||
Impaired loans | $ | 116 | Collateral Method | Adjustments for selling costs | 8 | % | |||||
Other real estate owned | $ | 449 | Collateral Method | Adjustments for selling costs | 8 | % | |||||
F-38
December 31, 2016 | |||||||||||
Valuation | Unobservable | Weighted | |||||||||
Assets/Liabilities | Fair Value | Technique | Input(s) | Average | |||||||
Impaired loans | $ | 1,593 | Collateral Method | Adjustments for selling costs | 8 | % | |||||
Other real estate owned | $ | 662 | Collateral Method | Adjustments for selling costs | 8 | % | |||||
Fair Value of Financial Instruments
The Company is required under current authoritative guidance to disclose the estimated fair value of its financial instrument assets and liabilities including those subject to the requirements discussed above. For the Company, as for most financial institutions, substantially all of its assets and liabilities are considered financial instruments, as defined. Many of the Company’s financial instruments, however, lack an available trading market as characterized by a willing buyer and willing seller engaging in an exchange transaction.
The estimated fair value amounts of financial instruments have been determined by the Company using available market information and appropriate valuation methodologies. However, considerable judgment is required to interpret data to develop an estimate of fair value. Accordingly, the estimates presented herein are not necessarily indicative of the amounts the Company could realize in a current market exchange. The use of different market assumptions and/or valuation methodologies may have a material effect on the estimated fair value amounts. In addition, reasonable comparability between financial institutions may not be likely due to the wide range of permitted valuation techniques and numerous estimates that must be made given the absence of active secondary markets for many of the financial instruments. This lack of uniform valuation methodologies also introduces a greater degree of subjectivity to these estimated fair values.
The methods and assumptions used by the Company in estimating fair values of financial instruments as disclosed herein in accordance with ASC Topic 825, Financial Instruments, other than for those measured at fair value on a recurring and nonrecurring basis discussed above, are as follows:
Cash and cash equivalents: The carrying amount of cash and cash equivalents approximates their fair value.
Loans and loans held for sale: For variable-rate loans that reprice frequently and have no significant changes in credit risk, fair values are based on carrying values. Fair values for certain mortgage loans (for example, 1-4 family residential), commercial real estate and commercial loans are estimated using discounted cash flow analysis, using interest rates currently being offered for loans with similar terms to borrowers of similar credit quality.
Accrued interest: The carrying amounts of accrued interest approximate their fair values due to short-term maturity.
Bank-owned life insurance: The carrying amounts of bank-owned life insurance approximate their fair value.
Servicing Assets: The estimated fair value of the servicing assets approximated the carrying amount at December 31, 2017 and December 31, 2016. Fair value is estimated by discounting estimated future cash flows from the servicing assets using discount rates that approximate current market rates over the expected lives of the loans being serviced. A valuation allowance is recorded when the fair value is below the carrying amount of the asset. At December 31, 2017 and December 31, 2016 no valuation allowance was recorded.
Non-marketable equity securities: The carrying value of restricted securities such as stock in the FHLB of Dallas, FRB of Dallas and other non-marketable equity securities approximates fair value.
Branch assets held for sale: This includes loans, accrued interest, bank premises, furniture and equipment, intangible assets and the cash balances related to branches that were held for sale. The carrying amount of cash and cash equivalents, accrued interest and intangible assets approximates their fair value. The fair value of the bank premises, furniture and equipment is determined based on third party appraisals of similar properties. The fair value of the loans held-for-sale are estimated using discounted cash flow analysis, using interest rates currently being offered for loans with similar terms to borrowers of similar credit quality.
F-39
Deposits: The fair values disclosed for demand deposits are, by definition, equal to the amount payable on demand at the reporting date (that is, their carrying amounts). The carrying amounts of variable-rate certificates of deposit (“CDs”) approximate their fair values at the reporting date. Fair values for fixed-rate CDs are estimated using a discounted cash flow calculation that applies interest rates currently being offered on certificates to a schedule of aggregated expected monthly maturities on time deposits.
Advances from Federal Home Loan Bank: The fair value of advances maturing within 90 days approximates carrying value. Fair value of other advances is based on the Company’s current borrowing rate for similar arrangements.
Junior subordinated debentures, subordinated notes and other borrowings: The fair values are based upon prevailing rates on similar debt in the market place.
Branch liabilities held for sale: This includes deposits and accrued interest related to branches that were held for sale. The carrying amount of accrued interest approximates its fair value. The fair values disclosed for demand deposits are, by definition, equal to the amount payable on demand at the reporting date (that is their carrying amounts). The carrying amounts of variable-rate CDs approximate their fair values at the reporting date. Fair values for fixed-rate CDs are estimated using a discounted cash flow calculation that applies interest rates currently being offered on certificates to a schedule of aggregated expected monthly maturities on time deposits.
Off-balance sheet instruments: Commitments to extend credit and standby letters of credit are generally priced at market at the time of funding and were not material to the Company’s consolidated financial statements.
F-40
The estimated fair values and carrying values of all financial instruments under current authoritative guidance as of December 31, 2017 and 2016 were as follows:
Fair Value | |||||||||||||||
Carrying | |||||||||||||||
Amount | Level 1 | Level 2 | Level 3 | ||||||||||||
December 31, 2017 | |||||||||||||||
Financial assets: | |||||||||||||||
Cash and cash equivalents | $ | 149,044 | $ | — | $ | 149,044 | $ | — | |||||||
Loans held for sale | 841 | — | 841 | — | |||||||||||
Loans | 2,220,682 | — | — | 2,234,094 | |||||||||||
Accrued interest receivable | 7,676 | — | 7,676 | — | |||||||||||
Bank-owned life insurance | 21,476 | — | 21,476 | — | |||||||||||
Servicing asset | 1,243 | — | 1,243 | — | |||||||||||
Non-marketable equity securities | 13,732 | — | 13,732 | — | |||||||||||
Financial instruments assets held for sale | 31,828 | — | 5,515 | 26,313 | |||||||||||
Financial liabilities: | |||||||||||||||
Deposits | $ | 2,278,630 | $ | — | $ | 2,164,498 | $ | — | |||||||
Advances from FHLB | 71,164 | — | 70,110 | — | |||||||||||
Accrued interest payable | 445 | — | 445 | — | |||||||||||
Junior subordinated debentures | 11,702 | — | 11,702 | — | |||||||||||
Subordinated notes | 4,987 | — | 4,987 | — | |||||||||||
Other borrowings | 15,000 | — | 15,000 | — | |||||||||||
Financial instruments liabilities held for sale | 64,300 | — | 64,300 | — | |||||||||||
December 31, 2016 | |||||||||||||||
Financial assets: | |||||||||||||||
Cash and cash equivalents | $ | 234,791 | $ | — | $ | 234,791 | $ | — | |||||||
Loans held for sale | 5,208 | — | 5,208 | — | |||||||||||
Loans | 983,318 | — | — | 987,021 | |||||||||||
Accrued interest receivable | 2,907 | — | 2,907 | — | |||||||||||
Bank-owned life insurance | 20,077 | — | 20,077 | — | |||||||||||
Servicing asset | 601 | — | 601 | — | |||||||||||
Non-marketable equity securities | 7,366 | — | 7,366 | — | |||||||||||
Financial liabilities: | |||||||||||||||
Deposits | $ | 1,119,630 | $ | — | $ | 1,085,888 | $ | — | |||||||
Advances from FHLB | 38,306 | — | 38,570 | — | |||||||||||
Accrued interest payable | 141 | — | 141 | — | |||||||||||
Junior subordinated debentures | 3,093 | — | 3,093 | — | |||||||||||
Subordinated notes | 4,942 | — | 4,942 | — | |||||||||||
F-41
17. Financial Instruments with Off-Balance Sheet Risk
The Company is a party to financial instruments with off-balance sheet risk in the normal course of business to meet the financing needs of its customers. These financial instruments include commitments to extend credit and standby letters of credit. Those instruments involve, to varying degrees, elements of credit risk in excess of the amount recognized in the consolidated balance sheets.
The Company’s exposure to credit loss in the event of nonperformance by the other party to the financial instrument for commitments to extend credit and standby letters of credit is represented by the contractual amount of those instruments. The Company uses the same credit policies in making commitments and conditional obligations as it does for on balance sheet instruments.
The following table sets forth the approximate amounts of these financial instruments as of December 31, 2017 and 2016:
December 31, | December 31, | ||||||
2017 | 2016 | ||||||
Commitments to extend credit | $ | 606,451 | $ | 236,919 | |||
Standby and commercial letters of credit | 9,299 | 6,933 | |||||
$ | 615,750 | $ | 243,852 | ||||
Commitments to extend credit are agreements to lend to a customer as long as there is no violation of any condition established in the contract. Commitments generally have fixed expiration dates or other termination clauses and may require payment of a fee. Since many of the commitments may expire without being drawn upon, the total commitment amounts do not necessarily represent future cash requirements. Management evaluates each customer’s creditworthiness on a case-by-case basis. The amount of collateral obtained, if deemed necessary upon extension of credit, is based on management’s credit evaluation of the borrower.
Standby letters of credit are conditional commitments issued by the Company to guarantee the performance of a customer to a third party. Standby letters of credit generally have fixed expiration dates or other termination clauses and may require payment of a fee. The credit risk involved in issuing letters of credit is essentially the same as that involved in extending loan facilities to customers. The Company’s policy for obtaining collateral and the nature of such collateral is essentially the same as that involved in making commitments to extend credit.
Although the maximum exposure to loss is the amount of such commitments, management currently anticipates no material losses from such activities.
18. Employee Benefits
Defined Contribution Plan
The Company maintains a retirement savings 401(k) profit sharing plan (the “Plan”) in which substantially all employees may participate. The Plan provides for “before tax” employee contributions through salary reductions under section 401(k) of the Internal Revenue Code. The Company may make a discretionary match of employees’ contributions based on a percentage of salary deferrals and certain discretionary profit sharing contributions. No matching contributions to the Plan were made for the years ending December 31, 2017 and 2016.
F-42
ESOP
Effective January 1, 2012, the Company adopted the ESOP covering all employees that meet certain age and service requirements. Plan assets are held and managed by the Company. Shares of the Company’s common stock purchased by the ESOP are held in a suspense account until released for allocation to participants. Shares released are allocated to each eligible participant based on the participant’s 401(k) contribution made during that year. Compensation expense is measured based upon the expected amount of the Company’s discretionary contribution that is determined on an annual basis and is accrued ratably over the year. Shares are committed to be released to settle the liability upon formal declaration of the contribution at the end of the year. The number of shares released to settle the liability is based upon fair value of the shares and become outstanding shares for earnings per share computations. The cost of shares issued to the ESOP, but not yet committed to be released, is shown as a reduction of stockholders’ equity. To the extent that the fair value of the ESOP shares differs from the cost of such shares, the difference is charged or credited to stockholders’ equity as additional paid in capital.
In January 2014, the ESOP borrowed $500 from the Company and purchased 46,082 shares of the common stock of the Company. The ESOP debt is secured by shares of the Company. The loan will be repaid from contributions to the ESOP from the Company. As the debt is repaid, shares are released from collateral and allocated to employees’ accounts. As of December 31, 2017 and 2016, the Company received a $109 debt payment from the ESOP and released 9,012 and 9,210 shares from collateral. The released shares were allocated to employee accounts. The shares pledged as collateral are reported as unearned ESOP shares in the consolidated balance sheets.
The Company issued 9,147 shares to the ESOP in June of 2015 to settle in full the 401(k) matching liability that was accrued prior to the origination of the $500 loan to the ESOP in January 2014.
Compensation expense attributed to the ESOP contributions recorded in the accompanying consolidated statements of income for years ended December 31, 2017, 2016 and 2015 was approximately $240, $204 and $154, respectively.
The following is a summary of the ESOP shares as of December 31, 2017 and December 31, 2016.
December 31, 2017 | December 31, 2016 | ||||||
Allocated shares | 53,269 | 44,257 | |||||
Unearned shares | 9,771 | 18,783 | |||||
Total ESOP shares | 63,040 | 63,040 | |||||
Fair value of unearned shares | $ | 256 | $ | 502 | |||
19. Stock and Incentive Plans
2010 Stock Option and Equity Incentive Plan
In 2010, the Company adopted the 2010 Stock Option and Equity Incentive Plan (the “2010 Incentive Plan”), which the Company’s shareholders approved in 2011. The maximum number of shares of common stock that may be issued pursuant to grants or options under the 2010 Incentive Plan is 1,000,000. The 2010 Incentive Plan is administered by the Board of Directors and provides for both the direct award of stock and the grant of stock options to eligible directors, officers, employees and outside consultants of the Company or its affiliates as defined in the 2010 Incentive Plan. The Company may grant either incentive stock options or nonqualified stock options as directed in the 2010 Incentive Plan.
The Board authorized that the 2010 Incentive Plan provide for the award of 100,000 shares of direct stock awards (restricted shares) and 900,000 shares of stock options, of which 500,000 shares are performance-based stock options. Options are generally granted with an exercise price equal to the market price of the Company’s stock at the date of the grant; those option awards generally vest based on 5 years of continuous service and have 10-year contractual terms for non-controlling participants as defined by the 2010 Incentive Plan, and forfeiture of unexercised options upon termination of employment with the Company. Other grant terms can vary for controlling participants as defined by the 2010 Incentive Plan. Restricted share awards generally vest after 4 years of continuous service. The terms of the 2010 Incentive Plan include a provision whereby all unearned non-performance options and restricted shares become immediately exercisable and fully vested upon a change in control.
With the adoption of the 2014 Omnibus Plan, which is discussed below, the Company does not plan to award any additional grants or options under the 2010 Incentive Plan.
F-43
During the years ending December 31, 2017 , 2016, and 2015, the Company did not award any restricted stock units, non-performance based stock options or performance-based stock options under the 2010 Incentive Plan.
Stock based compensation expense is measured based upon the fair market value of the award at the grant date and is recognized ratably over the period during which the shares are earned (the requisite service period). For the years ended December 31, 2017, 2016 and 2015, approximately $63, $125 and $224 of stock compensation expense related to the 2010 Incentive Plan, respectively, was recognized in the accompanying consolidated statements of income.
A summary of option activity under the 2010 Incentive Plan at December 31, 2017, 2016, and 2015 and changes during the years then ended is presented below:
2010 Incentive Plan | ||||||||||||
Nonperformance-based stock options | ||||||||||||
Shares Underlying Options | Weighted Average Exercise Price | Weighted Average Remaining Contractual Term | Aggregate Intrinsic Value | |||||||||
Outstanding at December 31, 2014 | 352,500 | $ | 10.14 | 6.58 years | ||||||||
Forfeited | (6,000 | ) | 10.00 | |||||||||
Exercised | (21,000 | ) | 10.00 | 130 | ||||||||
Outstanding at December 31, 2015 and 2016 | 325,500 | $ | 10.15 | 4.56 years | ||||||||
Forfeited | (3,000 | ) | 10.00 | |||||||||
Exercised | (17,500 | ) | 10.00 | 308 | ||||||||
Outstanding at December 31, 2017 | 305,000 | $ | 10.16 | 3.59 years | $ | 5,316 | ||||||
Options exercisable at December 31, 2017 | 298,000 | $ | 10.12 | 3.53 years | $ | 5,206 | ||||||
As of December 31, 2017, 2016, 2015, there was approximately $8, $21, and $51, respectively, of unrecognized compensation expense related to non-performance-based stock options. The unrecognized compensation expense as of December 31, 2017 is expected to be recognized over the remaining weighted average requisite service period of 1.25 years.
A summary of the status of the Company’s restricted stock units under the 2010 Incentive Plan as of December 31, 2017, 2016, and 2015 and changes during the years is presented below:
2010 Incentive Plan | ||||||
Nonperformance-based restricted stock units | ||||||
Shares Underlying Options | Weighted Average Exercise Price | |||||
Outstanding at December 31, 2014 | 62,250 | $ | 10.86 | |||
Forfeited | (2,500 | ) | 10.17 | |||
Vested | (20,000 | ) | 10.00 | |||
Outstanding at December 31, 2015 | 39,750 | $ | 11.34 | |||
Exercised | (12,000 | ) | 10.00 | |||
Outstanding at December 31, 2016 | 27,750 | $ | 11.92 | |||
Forfeited | (2,500 | ) | 10.85 | |||
Vested | (1,000 | ) | 10.85 | |||
Outstanding at December 31, 2017 | 24,250 | $ | 13.19 | |||
As of December 31, 2017, 2016, and 2015 there was $15, $90 and $174, respectively, of total unrecognized compensation expense related to non-vested restricted stock units.
F-44
A summary of the fair value of the Company’s stock options exercised and restricted stock units vested under the 2010 Incentive Plan as of December 31, 2017, 2016 and 2015 is presented below:
Fair Value of Options Exercised or Restricted Stock Units Vested as of December 31, | ||||||||
2017 | 2016 | 2015 | ||||||
Nonperformance-based stock options exercised | 488 | — | 9 | |||||
Nonperformance-based restricted stock units vested | 26 | 194 | 287 | |||||
2014 Omnibus Plan
In September 2014, the Company adopted an omnibus incentive plan (the “2014 Omnibus Plan”). The purpose of the 2014 Omnibus Plan is to align the long-term financial interests of the employees, directors, consultants and other service providers with those of the shareholders, to attract and retain those employees, directors, consultants and other service providers by providing compensation opportunities that are competitive with other companies and to provide incentives to those individuals who contribute significantly to the Company’s long-term performance and growth. To accomplish these goals, the 2014 Omnibus Plan permits the issuance of shares, stock options, share appreciation rights, restricted shares, restricted share units, deferred shares, unrestricted shares and cash-based awards. The maximum number of shares of the Company’s common stock that may be issued pursuant to grants or options under the 2014 Omnibus Plan is 1,000,000.
During the year ended December 31, 2017, the Company awarded 121,125 non-performance restricted stock units, 26,398 performance based restricted and 212,983 non-performance-based stock options under the 2014 Omnibus Plan. During the year ended December 31, 2016, the Company awarded 25,060 non-performance based restricted stock units, 34,190 performance based restricted stock units, and 76,286 non-performance-based stock options under the 2014 Omnibus Plan. During the year ended December 31, 2015, the Company awarded 8,000 non-performance based restricted stock units, 25,474 performance based restricted stock units and 52,080 non-performance-based stock options under the 2014 Omnibus Plan.
The non-performance options generally vest equally over three years from the date of grant. The performance-based restricted stock units include a market condition based on the Company’s total shareholder return relative to a market index that determines the number of restricted stock units that may vest equally over a three year period from the grant date. The non-performance restricted stock units fully vest over the requisite service period generally ranging from one to five years.
Stock based compensation expense is measured based upon the fair market value of the award at the grant date and is recognized ratably over the period during which the shares are earned (the requisite service period). For the year ended December 31, 2017, compensation expense for option awards and restricted stock unity awards granted under the 2014 Omnibus Plan was approximately $503 and $1,373, respectively. For the year ended December 31, 2016, compensation expense for option awards and restricted stock unity awards granted under the 2014 Omnibus Plan was approximately $224 and $633, respectively. For the year ended December 31, 2015, compensation expense for option awards and restricted stock unity awards granted under the 2014 Omnibus Plan was approximately $83 and $326, respectively.
The fair value of each option award is estimated on the grant date using the Black-Scholes option-pricing model with the following assumptions used for the grants:
For the Year Ended December 31, | ||||||||
2017 | 2016 | 2015 | ||||||
Dividend yield | — | % | — | % | — | % | ||
Expected life | 6.13 to 7.5 years | 5.0 to 6.5 years | 6.0 to 6.5 years | |||||
Expected volatility | 30.56% to 33.19% | 33.37% to 37.55% | 37.00% to 37.55% | |||||
Risk-free interest rate | 1.96% to 2.32% | 1.06% to 2.01% | 1.76% to 1.81% | |||||
The expected life is based on the expected amount of time that options granted are expected to be outstanding. The dividend yield assumption is based on the Company’s history. The expected volatility is based on historical volatility of the Company as well as the volatility of certain comparable public company peers. The risk-free interest rates are based upon yields of U.S. Treasury issues with a term equal to the expected life of the option being valued.
F-45
A summary of the status of the Company’s options under the 2014 Omnibus Plan as of December 31, 2017, 2016, and 2015 changes during the year then ended, is as follows:
2014 Omnibus Plan | |||||||||||||
Nonperformance-based stock options | |||||||||||||
Shares Underlying Options | Weighted Average Exercise Price | Weighted Average Remaining Contractual Term | Aggregate Intrinsic Value | ||||||||||
Outstanding at December 31, 2014 | — | $ | — | — | |||||||||
Granted | 52,080 | 14.35 | |||||||||||
Outstanding at December 31, 2015 | 52,080 | $ | 14.35 | 9.12 years | |||||||||
Granted | 76,286 | 15.98 | |||||||||||
Outstanding at December 31, 2016 | 128,366 | $ | 15.32 | 8.69 years | |||||||||
Granted | 212,983 | 26.97 | |||||||||||
Forfeited | (9,082 | ) | 19.45 | ||||||||||
Exercised | (1,544 | ) | 15.00 | $ | 19 | ||||||||
Outstanding at December 31, 2017 | 330,723 | $ | 22.71 | 8.86 years | $ | 1,614 | |||||||
Options exercisable at end of period | 51,821 | $ | 15.01 | 7.49 years | $ | 652 | |||||||
Weighted average fair value of options granted during the period | $ | 9.88 | |||||||||||
As of December 31, 2017, 2016, and 2015 there was $1,958, $425 and $187 of total unrecognized compensation expense related to stock options awarded under the 2014 Omnibus Plan, respectively.
A summary of the status of the Company’s non-performance based restricted stock units under the 2014 Omnibus Plan as of December 31, 2017, 2016 and 2015, and changes during the year then ended is as follows:
2014 Omnibus Plan | ||||||
Nonperformance-based restricted stock units | ||||||
Shares | Weighted Average Grant Date Fair Value | |||||
Outstanding at December 31, 2014 | 82,903 | $ | 13.00 | |||
Granted | 8,000 | 15.58 | ||||
Vested | (16,451 | ) | 13.00 | |||
Forfeited | (3,533 | ) | 13.00 | |||
Outstanding at December 31, 2015 | 70,919 | $ | 13.29 | |||
Granted | 25,060 | 15.83 | ||||
Vested | (28,023 | ) | 14.35 | |||
Outstanding at December 31, 2016 | 67,956 | $ | 13.79 | |||
Granted | 121,125 | 27.19 | ||||
Vested | (34,342 | ) | 19.74 | |||
Forfeited | (4,017 | ) | 21.36 | |||
Outstanding at December 31, 2017 | 150,722 | $ | 13.29 | |||
F-46
A summary of the status of the Company’s performance based restricted stock units under the 2014 Omnibus Plan as of December 31, 2017, 2016 and 2015, and changes during the years then ended is as follows:
2014 Omnibus Plan | ||||||
Performance-based restricted stock units | ||||||
Shares | Weighted Average Grant Date Fair Value | |||||
Outstanding at December 31, 2014 | — | $ | 9.45 | |||
Granted | 25,474 | 9.52 | ||||
Outstanding at December 31, 2015 | 25,474 | $ | 8.72 | |||
Granted | 34,190 | 9.52 | ||||
Vested | (8,467 | ) | 14.17 | |||
Outstanding at December 31, 2016 | 51,197 | $ | 8.72 | |||
Granted | 26,398 | 24.43 | ||||
Vested | (19,861 | ) | 15.34 | |||
Forfeited | (4,140 | ) | 17.91 | |||
Outstanding at December 31, 2017 | 53,594 | $ | 8.72 | |||
As of December 31, 2017, 2016, and 2015 there was $3,592, $1,089 and $979 of total unrecognized compensation expense related to restricted stock units awarded under the 2014 Omnibus Plan, respectively.
A summary of the fair value of the Company’s stock options exercised and restricted stock units vested under the 2014 Omnibus Plan as of December 31, 2017, 2016 and 2015 is presented below:
Fair Value of Options Exercised or Restricted Stock Units Vested as of December 31, | ||||||||
2017 | 2016 | 2015 | ||||||
Nonperformance-based stock options exercised | 41 | — | 200 | |||||
Nonperformance-based restricted stock units vested | 568 | 505 | 267 | |||||
Performance-based restricted stock units vested | 530 | 137 | — | |||||
20. Significant Concentrations of Credit Risk
Most of the Company’s business activity is with customers located within the Dallas-Fort Worth metroplex and Houston metropolitan area. Such customers are normally also depositors of the Company.
The distribution of commitments to extend credit approximates the distribution of loans outstanding. Commercial and standby letters of credit were granted primarily to commercial borrowers.
The contractual amounts of credit related financial instruments such as commitments to extend credit, credit card arrangements, and letters of credit represent the amounts of potential accounting loss should the contract be fully drawn upon, the customer default, and the value of any existing collateral become worthless.
F-47
21. Related Party Transactions
In the ordinary course of business, the Company has and expects to continue to have transactions, including borrowings, with its employees, officers, directors and their affiliates. In the opinion of management, such transactions are on the same terms, including interest rates and collateral requirements, as those prevailing at the time for comparable transactions with unaffiliated persons. The aggregate amounts of such loans were approximately $44,134 and $27,296 as of December 31, 2017 and 2016, respectively. During the year ended December 31, 2017, new advances of approximately $34,903 were made with approximately $18,065 principal payments received. During the year ended December 31, 2016, new advances of approximately $23,469 were made with approximately $4,586 principal payments received. There were $7,191 and $9,951 in unfunded commitments to related parties as of December 31, 2017 and 2016, respectively.
Deposits received from related parties as of December 31, 2017 and 2016 totaled approximately $16,023 and $25,994, respectively.
As disclosed in Note 13, the Company issued $5,000 in subordinated notes to two entities controlled by a certain affiliate of the Company.
22. Preferred Stock
On August 25, 2011, the Company entered into a Small Business Lending Fund-Securities Purchase Agreement (“SBLF Purchase Agreement”) with the Secretary of the Treasury, pursuant to which the Company (i) sold 8,000 shares of the Company’s Senior Non-Cumulative Perpetual Preferred Stock, Series C (the “SBLF Preferred Stock”) to the Secretary of the Treasury for a purchase price of $8,000. The issuance was pursuant to the Small Business Lending Fund (“SBLF’) program, a fund established under the Small Business Jobs Act of 2010 that was created to encourage lending to small business by providing capital to qualified community banks.
The SBLF Preferred Stock qualified as Tier 1 capital and paid non-cumulative dividends quarterly, on each January 1, April 1, July 1 and October 1. The dividend rate, as a percentage of the liquidation amount, can fluctuate on a quarterly basis during the first 10 quarters during which the SBLF Preferred Stock is outstanding, based upon changes in the level of “Qualified Small Business Lending” or “QBSL” (as defined in the SBLF Purchase Agreement) by the Bank. Based upon the increase in the Bank’s level of QBSL over the baseline level calculated under the terms of the SBLF Purchase Agreement, the dividend rate for the initial dividend period for the Company was set at 1.00%. For the tenth calendar quarter through 4.5 years after issuance, the dividend rate will be fixed and as of December 22, 2015 was set at 1.00% based upon the increase in QBSL as compared to the baseline.
The SBLF Preferred Stock may be redeemed at any time at the Company’s option, at a redemption price of 100% of the liquidation amount of $1,000 per share plus accrued but unpaid dividends to the date of redemption for the current period, subject to the approval of its federal banking regulator.
On December 22, 2015, the Company redeemed all 8,000 shares of SBLF Preferred Stock at its liquidation value of $1,000 per share plus accrued dividends for a total redemption amount of $8,018. The redemption was approved by the Company’s primary federal regulator and was funded with the Company’s surplus capital. Immediately after the redemption, the Company’s capital ratios exceeded those levels necessary to be categorized as “well capitalized” under the regulatory framework for prompt corrective action. The redemption terminated the Company’s participation in the SBLF program.
In connection with the acquisition of Sovereign on August 1, 2017, the Company assumed 24,500 shares of Sovereign’s Senior Non-Cumulative Perpetual Preferred Stock, Series C, no par value (the “Sovereign SBLF Preferred Stock”), issued and outstanding immediately prior to the consummation of the acquisition. At the time of the consummation of the acquisition, each share of Sovereign SBLF Preferred Stock was converted into one share of Senior Non-Cumulative Perpetual, Series D Preferred Stock of the Company (“Veritex Series D Preferred Stock”).
On August 8, 2017, the Company redeemed all 24,500 shares of the Veritex Series D Preferred Stock at its liquidation value of $1,000 per share plus accrued dividends for a total redemption amount of $24,727. The Company assumed $185 of accrued dividends in connection with the acquisition of Sovereign on August 1, 2017 out of the $227 in dividends paid in the year ended December 31, 2017. The redemption was approved by the Company’s primary federal regulator and was funded with the Company’s surplus capital. The redemption terminated the Company’s participation in the SBLF program.
F-48
23. Capital Requirements and Restrictions on Retained Earnings
Under applicable U.S. banking laws, there are legal restrictions limiting the amount of dividends the Company can declare. Approval of the regulatory authorities is required if the effect of the dividends declared would cause regulatory capital of the Company to fall below specified minimum levels.
The Company on a consolidated basis and the Bank are subject to various regulatory capital requirements administered by federal banking agencies. Failure to meet minimum capital requirements can initiate certain mandatory and possibly additional discretionary actions by regulators that, if undertaken, could have a direct material effect on the Company’s financial statements. Under capital adequacy guidelines and the regulatory framework for prompt corrective action, the Company must meet specific capital guidelines that involve quantitative measures of the Company’s assets, liabilities, and certain off balance sheet items as calculated under regulatory accounting practices. The Company’s capital amounts and classification are also subject to qualitative judgments by the regulators about components, risk weightings, and other factors.
In July 2013, the Federal Reserve published final rules for the adoption of the Basel III regulatory capital framework (the “Basel III Capital Rules”). The Basel III Capital Rules, among other things, (i) introduce a new capital measure called “Common Equity Tier 1” (“CET1”), (ii) specify that Tier 1 capital consist of Common Equity Tier 1 and “Additional Tier 1 Capital” instruments meeting specified requirements, (iii) define Common Equity Tier 1 narrowly by requiring that most deductions/adjustments to regulatory capital measures be made to Common Equity Tier 1 and not to the other components of capital and (iv) expand the scope of the deductions/adjustments as compared to existing regulations. The Basel III Capital Rules became effective for the Company on January 1, 2015, with certain transition provisions to be fully phased in by January 1, 2019.
Starting in January 2016, the implementation of the capital conservation buffer will be effective for the Company starting at the 0.625% level and increasing 0.625% each year thereafter, until it reaches 2.5% on January 1, 2019. The capital conservation buffer is designed to absorb losses during periods of economic stress and effectively increases the minimum required risk-weighted capital ratios.
Quantitative measures established by regulation to ensure capital adequacy require the Bank to maintain minimum amounts and ratios (set forth in the table below) of total, CET1 and Tier 1 capital (as defined in the regulations) to risk-weighted assets (as defined), and of Tier 1 capital (as defined) to average assets (as defined). Management believes, as of December 31, 2017 and December 31, 2016 that the Bank met all capital adequacy requirements to which it was subject.
As of December 31, 2017 and December 31, 2016, the Company’s capital ratios exceeded those levels necessary to be categorized as “well capitalized” under the regulatory framework for prompt corrective action. To be categorized as “well capitalized”, the Company must maintain minimum total risk‑based, CET1, Tier 1 risk‑based and Tier 1 leverage ratios as set forth in the table. There are no conditions or events since December 31, 2017 that management believes have changed the Company’s category.
F-49
A comparison of the Company’s and Bank’s actual capital amounts and ratios to required capital amounts and ratios is presented in the following table:
Actual | For Capital Adequacy Purposes | To Be Well Capitalized Under Prompt Corrective Action Provisions | |||||||||||||||||||||||||||
Amount | Ratio | Amount | Ratio | Amount | Ratio | ||||||||||||||||||||||||
As of December 31, 2017 | |||||||||||||||||||||||||||||
Total capital (to risk-weighted assets) | |||||||||||||||||||||||||||||
Company | $ | 342,521 | 13.16 | % | $ | 208,219 | 8.0 | % | n/a | n/a | |||||||||||||||||||
Bank | $ | 296,207 | 11.37 | % | $ | 208,413 | 8.0 | % | $ | 260,516 | 10.0 | % | |||||||||||||||||
Tier 1 capital (to risk-weighted assets) | |||||||||||||||||||||||||||||
Company | $ | 324,726 | 12.48 | % | $ | 156,118 | 6.0 | % | n/a | n/a | |||||||||||||||||||
Bank | $ | 283,399 | 10.88 | % | $ | 156,286 | 6.0 | % | $ | 208,382 | 8.0 | % | |||||||||||||||||
Common equity tier 1 (to risk-weighted assets) | |||||||||||||||||||||||||||||
Company | $ | 313,024 | 12.03 | % | $ | 117,091 | 4.5 | % | n/a | n/a | |||||||||||||||||||
Bank | $ | 283,399 | 10.88 | % | $ | 117,215 | 4.5 | % | $ | 169,310 | 6.5 | % | |||||||||||||||||
Tier 1 capital (to average assets) | |||||||||||||||||||||||||||||
Company | $ | 324,726 | 12.92 | % | $ | 100,534 | 4.0 | % | n/a | n/a | |||||||||||||||||||
Bank | $ | 283,399 | 11.28 | % | $ | 100,496 | 4.0 | % | $ | 125,620 | 5.0 | % | |||||||||||||||||
As of December 31, 2016 | |||||||||||||||||||||||||||||
Total capital (to risk-weighted assets) | |||||||||||||||||||||||||||||
Company | $ | 228,566 | 22.02 | % | $ | 83,039 | 8.0 | % | n/a | n/a | |||||||||||||||||||
Bank | $ | 130,237 | 12.55 | % | $ | 83,020 | 8.0 | % | $ | 103,775 | 10.0 | % | |||||||||||||||||
Tier 1 capital (to risk-weighted assets) | |||||||||||||||||||||||||||||
Company | $ | 215,057 | 20.72 | % | $ | 62,275 | 6.0 | % | n/a | n/a | |||||||||||||||||||
Bank | $ | 121,713 | 11.73 | % | $ | 62,257 | 6.0 | % | $ | 83,010 | 8.0 | % | |||||||||||||||||
Common equity tier 1 (to risk-weighted assets) | |||||||||||||||||||||||||||||
Company | $ | 211,964 | 20.42 | % | $ | 46,711 | 4.5 | % | n/a | n/a | |||||||||||||||||||
Bank | $ | 121,713 | 11.73 | % | $ | 46,693 | 4.5 | % | $ | 67,445 | 6.5 | % | |||||||||||||||||
Tier 1 capital (to average assets) | |||||||||||||||||||||||||||||
Company | $ | 215,057 | 16.82 | % | $ | 51,143 | 4.0 | % | n/a | n/a | |||||||||||||||||||
Bank | $ | 121,713 | 9.52 | % | $ | 51,140 | 4.0 | % | $ | 63,925 | 5.0 | % | |||||||||||||||||
24. Business Combinations
All acquisitions were accounted for using the acquisition method of accounting. Accordingly, the assets and liabilities of the acquired entities were recorded at their estimated fair values at the acquisition date. ASC 820 defines fair value as the price that would be received to sell an asset or paid to transfer a liability in an orderly transaction between market willing participants at the measurement date. The Company determines the estimated fair values after review and consideration of relevant information, including discounted cash flows, quoted market prices, third party valuations, and estimates made by management. The excess of the purchase price over the estimated fair value of the net assets for tax-free acquisitions is recorded as goodwill, none of which is deductible for tax purposes. Acquisition-related costs are recognized separately from the acquisition and are expensed as incurred. The results of operations for each acquisition have been included in the Company’s consolidated financial results beginning on the respective acquisition date.
F-50
Sovereign Bancshares, Inc.
On August 1, 2017, the Company acquired Sovereign Bancshares, Inc. (“Sovereign”), a Texas corporation and parent company of Sovereign Bank. The Company issued 5,117,642 shares of its common stock and paid out $56,215 in cash to Sovereign in consideration for the acquisition. Additionally, under the terms of the merger agreement, each share of Sovereign SBLF Preferred Stock, no par value, issued and outstanding immediately prior to the effective time was converted into one share of Veritex Series D Preferred Stock. See Note 22 - Preferred Stock for additional information.
The business combination was accounted for under the acquisition method of accounting. Under this method of accounting, assets acquired and liabilities assumed are recorded at their estimated fair values. The excess cost over fair value of net assets acquired is recorded as goodwill. As the consideration paid for Sovereign exceeded the provisional value of the net assets acquired, goodwill of $109,091 was recorded related to the acquisition. This goodwill resulted from the combination of expected operational synergies and increased market share in the Dallas-Fort Worth metroplex and Houston metropolitan area. Goodwill is not tax deductible.
Fair Value
The measurement period for the Company to determine the fair values of acquired identifiable assets and assumed liabilities will end at the earlier of (i) twelve months from the date of the acquisition or (ii) as soon as the Company receives the information it was seeking about facts and circumstances that existed as of the acquisition date or learns that more information is not obtainable. Provisional estimates for certain PCI loans, bank premises, furniture and equipment, core deposit intangibles, goodwill and deferred taxes have been recorded for the acquisition as the Company is still waiting on final appraisals from independent third parties to complete valuations. The Company does not expect any significant differences from estimated values upon finalization of the valuations. Estimated fair values of the assets acquired and liabilities assumed in this transaction as of the closing date are as follows:
F-51
Initial Estimate | Adjustments | Revised Fair Value | |||||||||
Assets | |||||||||||
Cash and cash equivalents | $ | 44,775 | $ | — | $ | 44,775 | |||||
Investment securities | 166,307 | — | 166,307 | ||||||||
Loans | 750,856 | 1,594 | 752,450 | ||||||||
Accrued interest receivable | 3,437 | (335 | ) | 3,102 | |||||||
Bank premises, furniture and equipment | 21,512 | (3,707 | ) | 17,805 | |||||||
Non-marketable equity securities | 6,751 | — | 6,751 | ||||||||
Other real estate owned | 282 | — | 282 | ||||||||
Intangible assets | 8,662 | (208 | ) | 8,454 | |||||||
Goodwill | 108,967 | 124 | 109,091 | ||||||||
Other assets | 10,331 | 2,817 | 13,148 | ||||||||
Total assets | $ | 1,121,880 | $ | 285 | $ | 1,122,165 | |||||
Liabilities | |||||||||||
Deposits | $ | 809,366 | $ | — | $ | 809,366 | |||||
Accounts payable and accrued expenses | 5,189 | 1,095 | 6,284 | ||||||||
Accrued interest payable and other liabilities | 1,616 | (810 | ) | 806 | |||||||
Advances from FHLB | 80,000 | — | 80,000 | ||||||||
Junior subordinated debentures | 8,609 | — | 8,609 | ||||||||
Total liabilities | $ | 904,780 | $ | 285 | $ | 905,065 | |||||
Preferred stock - series D | $ | 24,500 | $ | — | $ | 24,500 | |||||
Total stockholders’ equity | $ | 24,500 | $ | — | $ | 24,500 | |||||
Consideration | |||||||||||
Market value of common stock issued | $ | 136,385 | $ | — | $ | 136,385 | |||||
Cash paid | $ | 56,215 | $ | — | $ | 56,215 | |||||
Total fair value of consideration | $ | 192,600 | $ | — | $ | 192,600 | |||||
Acquisition-related Expenses
For the years ended December 31, 2017 and 2016, the Company incurred $1,731 and $195, respectively, of pre-tax merger and acquisition expenses related to the Sovereign acquisition. Acquisition expenses are included in professional fees in the consolidated statements of income.
Acquired Loans and Purchased Credit Impaired Loans
Acquired loans were recorded at fair value based on a discounted cash flow valuation methodology that considers, among other things, projected default rates, loss given defaults and recovery rates. No allowance for credit losses was carried over from Sovereign.
The Company has identified certain acquired loans as PCI. PCI loan identification considers payment history and past due status, debt service coverage, loan grading, collateral values and other factors that may indicate deterioration of credit quality since origination.
F-52
The following table discloses the fair value and contractual value of loans acquired from Sovereign on August 1, 2017:
PCI loans | Other acquired loans | Total Acquired Loans | |||||||||
Real Estate | $ | 17,708 | $ | 518,261 | $ | 535,969 | |||||
Commercial | 34,507 | 180,722 | 215,229 | ||||||||
Consumer | — | 1,252 | 1,252 | ||||||||
Total fair value | $ | 52,215 | $ | 700,235 | $ | 752,450 | |||||
Contractual principal balance | $ | 67,985 | $ | 707,071 | $ | 775,056 | |||||
The following table presents additional information about PCI loans acquired from Sovereign on August 1, 2017:
PCI Loans | |||
Contractually required principal and interest | $ | 85,000 | |
Non-accretable difference | 29,288 | ||
Cash flows expected to be collected | 55,712 | ||
Accretable difference | 3,497 | ||
Fair value of PCI loans | $ | 52,215 | |
Intangible Assets
The following table discloses the fair value of intangible assets acquired from Sovereign on August 1, 2017:
Gross Intangible Asset | |||
Core deposit intangibles(1) | $ | 7,703 | |
Servicing asset(2) | 317 | ||
Intangible lease assets(3) | 434 | ||
$ | 8,454 | ||
(1) The Company initially estimated a useful life of 10 years for core deposit intangibles. During the fourth quarter of 2017, the Company revised the estimated useful life of core deposit intangible to 7.7 years which will be amortized on a straight line basis.
(2) The Company initially estimated a weighted-average useful life of 6.1 years for servicing asset which will be amortized on a straight line basis.
(3) The Company initially estimated a weighted-average useful life of 5 years for intangible lease assets which will be amortized on a straight line basis.
Advances from Federal Home Loan Bank
The Company assumed from Sovereign $80,000 in advances from the FHLB as of August 1, 2017 that matured in full from August 1, 2017 to December 31, 2017.
Redemption of Veritex Series D Preferred Stock
On August 8, 2017, the Company redeemed all 24,500 shares of the Veritex Series D Preferred Stock at its liquidation value of $1,000 per share plus accrued dividends for a total redemption amount of $24,727. The Company assumed $185 of accrued dividends in connection with the acquisition of Sovereign on August 1, 2017 out of the $227 in dividends paid in the year ended December 31, 2017. The redemption was approved by the Company’s primary federal regulator and was funded with the Company’s surplus capital. The redemption terminated the Company’s participation in the SBLF program.
F-53
Liberty Bancshares, Inc.
On December 1, 2017, the Company acquired Liberty Bancshares, Inc. (“Liberty”), a Texas corporation and parent company of Liberty Bank. The Company issued 1,449,944 shares of its common stock and paid out $25,009 in cash to Liberty in consideration for the acquisition.
The business combination was accounted for under the acquisition method of accounting. As the consideration paid for Liberty exceeded the provisional value of the net assets acquired, goodwill of $23,496 was recorded related to the acquisition. This goodwill resulted from the combination of expected operational synergies and increased market share in Tarrant County. Goodwill is not tax deductible.
Fair Value
The measurement period for the Company to determine the fair values of acquired identifiable assets and assumed liabilities will end at the earlier of (i) twelve months from the date of the acquisition or (ii) as soon as the Company receives the information it was seeking about facts and circumstances that existed as of the acquisition date or learns that more information is not obtainable. Provisional estimates for loans, bank premises, furniture and equipment, goodwill, intangible assets, accrued expenses, deposits and deferred taxes have been recorded for the acquisition, as independent valuations have not been finalized. The Company does not expect any significant differences from estimated values upon completion of the valuations. Estimated fair values of the assets acquired and liabilities assumed in this transaction as of the closing date are as follows:
Initial Estimate | |||
Assets | |||
Cash and cash equivalents | $ | 57,384 | |
Investment securities | 54,137 | ||
Loans | 312,608 | ||
Accrued interest receivable | 1,191 | ||
Bank premises, furniture and equipment | 6,145 | ||
Non-marketable equity securities | 2,096 | ||
Other real estate owned | 166 | ||
Intangible assets | 7,519 | ||
Goodwill | 23,496 | ||
Other assets | 2,509 | ||
Total assets | $ | 467,251 | |
Liabilities | |||
Deposits | $ | 395,851 | |
Accounts payable and accrued expenses | 1,287 | ||
Accrued interest payable and other liabilities | 142 | ||
Subordinated notes(1) | 4,625 | ||
Total liabilities | $ | 401,905 | |
Consideration | |||
Market value of common stock issued | $ | 40,337 | |
Cash paid | $ | 25,009 | |
Total fair value of consideration | $ | 65,346 | |
(1) The subordinated note was paid off in full on December 1, 2017, subsequent to closing.
Acquisition-related Expenses
For the year ended December 31, 2017, the Company incurred $960 of pre-tax merger and acquisition expenses related to the Liberty acquisition. The Company incurred no acquisition expenses related to the Liberty acquisition in 2016. Acquisition expenses are included in professional fees in the consolidated statements of income.
F-54
Acquired Loans and Purchased Credit Impaired Loans
Acquired loans were recorded at fair value based on a discounted cash flow valuation methodology that considers, among other things, projected default rates, loss given defaults and recovery rates. No allowance for credit losses was carried over from Liberty.
The Company has identified certain acquired loans as PCI. PCI loan identification considers payment history and past due status, debt service coverage, loan grading, collateral values and other factors that may indicate deterioration of credit quality since origination. Accretion of purchase discounts on PCI loans is based on estimated future cash flows, regardless of contractual maturities, that include undiscounted expected principal and interest payments and use credit risk, interest rate and prepayment risk models to incorporate management’s best estimate of current key assumptions such as default rates, loss severity and payment speeds. Accretion of purchase discounts on acquired non-impaired loans will be recognized on a level-yield basis based on contractual maturity of individual loans per ASC 310-20.
The following table discloses the fair value and contractual value of loans acquired from Liberty on December 1, 2017:
PCI loans | Other acquired loans | Total Acquired Loans | |||||||||
Real Estate | $ | 868 | $ | 257,026 | $ | 257,894 | |||||
Commercial | 307 | 49,660 | 49,967 | ||||||||
Consumer | — | 4,747 | 4,747 | ||||||||
Total fair value | 1,175 | 311,433 | 312,608 | ||||||||
Contractual principal balance | $ | 1,748 | $ | 316,119 | $ | 317,867 | |||||
The following table presents additional information about PCI loans acquired from Liberty on December 1, 2017:
PCI Loans | |||
Contractually required principal and interest | $ | 2,316 | |
Non-accretable difference | 711 | ||
Cash flows expected to be collected | 1,605 | ||
Accretable difference | 430 | ||
Fair value of PCI loans | $ | 1,175 | |
Intangible Assets
The acquisition also resulted in a core deposit intangible of $7,519, which will be amortized on an accelerated basis over the estimated life, currently expected to be 10 years.
F-55
Pro Forma Information (unaudited)
The following table presents unaudited supplemental pro forma financial information for the years ended December 31, 2017 and 2016 as if the Sovereign and Liberty acquisitions had occurred on January 1, 2016. The pro forma information includes adjustments for interest income on loans acquired, depreciation expense on property acquired, amortization of intangibles arising from the transaction, merger and acquisition costs incurred by the Company in 2017 to be reflected as incurred in 2016, merger and acquisition costs incurred by Sovereign and Liberty prior to the acquisition close date and the related income tax effects. The pro forma financial information is not necessarily indicative of the results of operations that would have occurred had the transactions been completed on the assumed date.
Year Ended December 31, | |||||||
2017 | 2016 | ||||||
Net interest income | $ | 102,440 | $ | 98,701 | |||
Net income available to common stockholders | 22,270 | 26,984 | |||||
Basic earnings per share | $ | 0.98 | $ | 1.55 | |||
Diluted earnings per share | 0.96 | 1.53 | |||||
The following net interest income and net income available to common stockholders for the Sovereign and Liberty transactions are included in the Company’s operating results for the year ended December 31, 2017.
Year Ended December 31, | |||
2017 | |||
Net interest income | $ | 14,825 | |
Net income available to common stockholders | 4,615 | ||
Deferred Taxes Related to Business Combinations
Due to the provisional estimates used for the Sovereign and Liberty acquisitions as indicated above, the Company has made a reasonable estimate related to amounts recorded for the re-measurement of deferred taxes acquired in accordance with SAB 118. These estimates may be refined in future periods as the valuation of all assets and liabilities acquired in acquisitions are finalized and recorded.
25. Branch Assets and Liabilities Held for Sale
On October 23, 2017, the Company entered into a Purchase and Assumption Agreement to sell certain assets and liabilities associated with two branch locations in the Austin metropolitan market. On January 1, 2018, the Company completed the sale of these assets and liabilities to Horizon Bank, SSB. The Company determined that this transaction met the criteria for held for sale as of December 31, 2017. The completion of this sale resulted in the Company exiting the Austin metropolitan market.
Additionally, in the fourth quarter of 2017, the Company ceased using one of our Dallas, Texas branch buildings. The Company entered into an agreement to sell the property in January 2018 and expects to close the sale in the first six months of 2018. The associated building and improvements are included in branch assets held for sale as of December 31, 2017.
F-56
The following table presents the assets and liabilities held for sale as of December 31, 2017.
December 31, 2017 | |||
Assets | |||
Cash and cash equivalents | $ | 334 | |
Loans | 26,313 | ||
Accrued interest receivable | 63 | ||
Bank premises, furniture and equipment | 5,118 | ||
Intangible assets | 1,724 | ||
Total assets | $ | 33,552 | |
Liabilities | |||
Deposits | $ | 64,282 | |
Accounts payable and accrued expenses | 2 | ||
Deferred tax liability | 327 | ||
Accrued interest payable and other liabilities | 16 | ||
Total liabilities | $ | 64,627 | |
26. Parent Company Only Financial Statements
The following balance sheets, statements of income and statements of cash flows for Veritex Holdings, Inc. should be read in conjunction with the consolidated financial statements and the notes thereto.
Balance Sheet
December 31, | |||||||
2017 | 2016 | ||||||
Assets | |||||||
Cash and cash equivalents | $ | 46,724 | $ | 98,366 | |||
Investment in subsidiaries | 459,654 | 148,921 | |||||
Other assets | 2,267 | 438 | |||||
Total assets | $ | 508,645 | $ | 247,725 | |||
Liabilities and Stockholders’ Equity | |||||||
Other liabilities | $ | 3,027 | $ | 602 | |||
Other borrowings | 16,689 | 8,035 | |||||
Total liabilities | 19,716 | 8,637 | |||||
Stockholders’ equity | |||||||
Preferred stock | — | — | |||||
Common stock | 241 | 152 | |||||
Additional paid-in capital | 445,517 | 211,173 | |||||
Retained earnings | 44,627 | 29,290 | |||||
Unallocated employee stock ownership plan shares | (106 | ) | (209 | ) | |||
Accumulated other comprehensive income | (1,280 | ) | (1,248 | ) | |||
Treasury stock | (70 | ) | (70 | ) | |||
Total stockholders’ equity | 488,929 | 239,088 | |||||
Total liabilities and stockholders’ equity | $ | 508,645 | $ | 247,725 | |||
F-57
Statements of Income
Year Ended December 31, | |||||||||||
2017 | 2016 | 2015 | |||||||||
Interest income: | |||||||||||
Other | $ | 8 | $ | 2 | $ | 2 | |||||
Interest expense: | |||||||||||
Interest on borrowings | 598 | 388 | 376 | ||||||||
Net interest expense | (590 | ) | (386 | ) | (374 | ) | |||||
Noninterest expense: | |||||||||||
Salaries and employee benefits | 712 | 161 | 161 | ||||||||
Professional fees | 2,256 | 828 | 799 | ||||||||
Other | — | 1 | 2 | ||||||||
Total noninterest expense | 2,968 | 990 | 962 | ||||||||
Loss before income tax benefit and equity in undistributed income of subsidiaries | (3,558 | ) | (1,376 | ) | (1,336 | ) | |||||
Income tax benefit | (730 | ) | (480 | ) | (454 | ) | |||||
Loss before equity in undistributed income of subsidiaries | (2,828 | ) | (896 | ) | (882 | ) | |||||
Equity in undistributed income of bank | 17,980 | 13,447 | 9,672 | ||||||||
Net income | $ | 15,152 | $ | 12,551 | $ | 8,790 | |||||
F-58
Statements of Cash Flows
Year Ended December 31, | |||||||||||
2017 | 2016 | 2015 | |||||||||
Cash flows from operating activities: | |||||||||||
Net income | $ | 15,152 | $ | 12,551 | $ | 8,790 | |||||
Adjustments to reconcile net income to net cash provided by (used in) operating activities: | |||||||||||
Amortization of debt costs | 45 | 8 | 2 | ||||||||
Equity in undistributed net income of Bank | (17,980 | ) | (13,447 | ) | (9,672 | ) | |||||
Decrease (increase) in other assets | 3,523 | (155 | ) | 9 | |||||||
Increase (decrease) in other liabilities | 1,353 | 270 | (144 | ) | |||||||
Net cash provided by (used in) operating activities | 2,093 | (773 | ) | (1,015 | ) | ||||||
Cash flows from investing activities: | |||||||||||
Net cash paid in Sovereign acquisition | (55,949 | ) | — | — | |||||||
Net cash paid in Liberty acquisition | (24,812 | ) | — | — | |||||||
Net cash paid in IBT acquisition | — | — | (3,841 | ) | |||||||
Capital investment in subsidiary | — | (10,000 | ) | — | |||||||
Net cash used in investing activities | (80,761 | ) | (10,000 | ) | (3,841 | ) | |||||
Cash flows from financing activities: | |||||||||||
Net proceeds from sale of common stock in public offering | 56,681 | 94,518 | — | ||||||||
Redemption of preferred stock | (24,500 | ) | — | — | |||||||
Net change in other borrowings | (4,625 | ) | — | — | |||||||
Proceeds from exercise of employee stock options | 175 | — | 210 | ||||||||
Redemption of SBLF preferred stock series C | — | — | (8,000 | ) | |||||||
Proceeds from payments on ESOP loan | 109 | 109 | 109 | ||||||||
Offering costs paid in connection with acquisition | (772 | ) | — | (252 | ) | ||||||
Dividends paid on preferred stock | (42 | ) | — | (98 | ) | ||||||
Net cash provided by (used in) financing activities | 27,026 | 94,627 | (8,031 | ) | |||||||
Net (decrease) increase in cash and cash equivalents | (51,642 | ) | 83,854 | (12,887 | ) | ||||||
Cash and cash equivalents at beginning of year | 98,366 | 14,512 | 27,399 | ||||||||
Cash and cash equivalents at end of year | $ | 46,724 | $ | 98,366 | $ | 14,512 | |||||
F-59
27. Summary of Quarterly Financial Statements (Unaudited)
The following quarterly information is unaudited. However, in the opinion of management, the information reflects all adjustments, which are necessary for the fair presentation of the results of operations, for the periods presented.
2017 | |||||||||||||||
Fourth Quarter (1) | Third Quarter (1) | Second Quarter | First Quarter | ||||||||||||
Interest Income | $ | 29,897 | $ | 22,279 | $ | 14,307 | $ | 13,069 | |||||||
Interest Expense | 4,147 | 3,150 | 1,931 | 1,816 | |||||||||||
Net interest income | 25,750 | 19,129 | 12,376 | 11,253 | |||||||||||
Provision for loan losses | 2,529 | 752 | 943 | 890 | |||||||||||
Noninterest income | 2,298 | 1,977 | 1,766 | 1,535 | |||||||||||
Noninterest expense | 15,035 | 12,522 | 7,782 | 7,450 | |||||||||||
Provision for income taxes | 7,227 | 2,650 | 1,802 | 1,350 | |||||||||||
Net income | 3,257 | 5,182 | 3,615 | 3,098 | |||||||||||
Less income available to common stockholders | — | 42 | — | — | |||||||||||
Net income available to common stockholders | $ | 3,257 | $ | 5,140 | $ | 3,615 | $ | 3,098 | |||||||
Earnings per share: | |||||||||||||||
Basic | $ | 0.14 | $ | 0.26 | $ | 0.24 | $ | 0.20 | |||||||
Diluted | 0.14 | 0.25 | 0.23 | 0.20 | |||||||||||
(1) These results include the addition of Sovereign upon acquisition during the third quarter.
2016 | |||||||||||||||
Fourth Quarter | Third Quarter | Second Quarter | First Quarter | ||||||||||||
Interest Income | $ | 12,281 | $ | 12,054 | $ | 11,477 | $ | 10,783 | |||||||
Interest Expense | 1,761 | 1,537 | 1,249 | 1,093 | |||||||||||
Net interest income | 10,520 | 10,517 | 10,228 | 9,690 | |||||||||||
Provision for loan losses | 440 | 238 | 527 | 845 | |||||||||||
Noninterest income | 1,825 | 1,893 | 1,412 | 1,373 | |||||||||||
Noninterest expense | 7,085 | 7,029 | 6,301 | 5,975 | |||||||||||
Provision for income taxes | 1,630 | 1,768 | 1,639 | 1,430 | |||||||||||
Net income | 3,190 | 3,375 | 3,173 | 2,813 | |||||||||||
Less income available to common stockholders | — | — | — | — | |||||||||||
Net income available to common stockholders | $ | 3,190 | $ | 3,375 | $ | 3,173 | $ | 2,813 | |||||||
Earnings per share: | |||||||||||||||
Basic | $ | 0.28 | $ | 0.32 | $ | 0.30 | $ | 0.26 | |||||||
Diluted | 0.27 | 0.31 | 0.29 | 0.26 | |||||||||||
F-60
Exhibit Index
Each exhibit marked with an asterisk (*) is filed or furnished with this Annual Report on Form 10-K. Each exhibit marked with a “†” denotes a management contract or compensatory plan or arrangement.
Exhibit Number | Description | |
101* | The following materials from Veritex Holdings Inc.’s Annual Report on Form 10-K for the fiscal year ended December 31, 2016 (Extensible Business Reporting Language): (i) Consolidated Balance Sheets, (ii) Consolidated Statements of Operations, (iii) Consolidated Statements of Comprehensive Income (Loss), (iv) Consolidated Statements of Changes in Shareholders’ Equity, (v) Consolidated Statements of Cash Flows, and (vi) Notes to Consolidated Financial Statements. | |
F-61
SIGNATURES
Pursuant to the requirements of Section 13 or 15(d) of the Securities Exchange Act of 1934, the registrant has duly caused this report to be signed on its behalf by the undersigned thereunto duly authorized.
Date: March 14, 2018 | Veritex Holdings, Inc. | ||
By: | /s/ C. Malcolm Holland, III | ||
Name: | C. Malcolm Holland, III | ||
Title: | Chairman and Chief Executive Officer | ||
Pursuant to the requirements of the Securities Exchange Act of 1934, this report has been signed below by the following persons, on behalf of the registrant and in the capacities and on the dates indicated.
Name | Title | Date | ||
/s/ C. Malcolm Holland, III C. Malcolm Holland, III | Chairman and Chief Executive Officer (Principal Executive Officer) | March 14, 2018 | ||
/s/ William C. Murphy William C. Murphy | Vice Chairman | March 14, 2018 | ||
/s/ Noreen E. Skelly Noreen E. Skelly | Chief Financial Officer (Principal Financial and Principal Accounting Officer) | March 14, 2018 | ||
/s/ Pat S. Bolin Pat S. Bolin | Director | March 14, 2018 | ||
/s/ April Box April Box | Director | March 14, 2018 | ||
/s/ Blake Bozman Blake Bozman | Director | March 14, 2018 | ||
/s/ T.J. Falgout T.J. Falgout | Director | March 14, 2018 | ||
/s/ Ned N. Fleming, III Ned N. Fleming, III | Director | March 14, 2018 | ||
/s/ Mark C. Griege Mark C. Griege | Director | March 14, 2018 | ||
/s/ Gordon Huddleston Gordon Huddleston | Director | March 14, 2018 | ||
/s/ Michael A. Kowalski Michael A. Kowalski | Director | March 14, 2018 | ||
/s/ Thomas J. Mastor Thomas J. Mastor | Director | March 14, 2018 | ||
/s/ Gregory B. Morrison Gregory B. Morrison | Director | March 14, 2018 | ||
/s/ John T. Sughrue John T. Sughrue | Director | March 14, 2018 | ||
F-62