Attached files
| file | filename |
|---|---|
| 8-K - 8-K - First Foundation Inc. | ffwm-20210427x8k.htm |
Exhibit 99.1
| PRIVATE WEALTH MANAGEMENT ● PERSONAL BANKING ● BUSINESS BANKING April 2021 INVESTOR PRESENTATION |

| Copyright © 2021 First Foundation Inc. All Rights Reserved This presentation and the accompanying oral commentary contain "forward-looking statements" as defined in the Private Securities Litigation Reform Act of 1995. Forward-looking statements often include words such as "believe," " ex pect ," "anticipate," "intend," " pla n," "estimate," "project," "outlook," or words of similar mea ning , or future or conditional verbs such as"will," "would," "should," "could," or "may." The forward-look ing statements in this presentation and any accompanying oral commentary are based on current information and on assumptions that we make about future events and circumstancesthat are subject to a number of risks and uncertainties t ha t are often difficult to predict and beyond our control. Asa result of those risks and uncertainties, our actualfinancialresults in the future could differ, possibly materially, from those expressed in or implied by the forward-looking statements contained in this presentation and any accompanying oral statements and could cause us to mak e cha ng es to our f ut ure plans. Those risks and uncertainties include, but are not limited to the risk of incurring loan losses, which is an inherent risk of the banking business; the negative impacts and disruptions resulting from the COVID-19 pa ndemic on our colleagues, clients, the communities we serve and the domestic and global economy, which ma y have anadverse effect on our business, financial position and results of operations; the risk that we will not be able to continue our internal growth rate; the risk that we will not be able to access the securitization ma rk et on favorableterms or at all; cha ng es in general economic conditions, either nationally or locallyin the areasin which weconduct or will conduct our business; risks associated with the Federal Reserve Board taking actions with respect to interest rates, which could adversely affect our interest income and interest rate margins and, therefore, our future operating results; the risk that the performance of our investment management business or of the equity and bond markets could lead clients to move their funds from or close their investment accountswith us, which would reduce our assets under management and adversely affect our operating results; the risk that we may beunable or that our board of directors may determine that it is inadvisable to payf ut ure dividends; risks associated with cha ng es in income tax laws and regulations;and risks associated with seeking new client relationships and maintaining existing client relationships. Additional information regarding these and other risks and uncertainties to which our business and future financial performance are subject is contained in our 2020 Annual Report on Form 10-K for the fiscal year ended December 31, 2020 that we filed with the SEC on March 31, 2021, our Quarterly Report on Form 10- Q for the quarter ended September 30, 2020 that we filed with the SEC on November 6, 2020, and other documents we file with the SEC from time to time. We urge recipients of this presentation to review those reports and other documents we file with the SEC f rom time to time. Also, our actualfinancial results in the future may differfrom those currently expected due to additional risks and uncertainties of which we are not currently awareor which we do not currently view as, but in the future may become, materialto our business or operating results. Due to these and other possible uncertainties and risks, readers are cautioned not to place undue reliance on the forward-looking statements cont a ined in this presentation, which spea k only asof t oda y's date, or to ma k e predictions based solely on historical financial perf orma nce. We also discla im any obligation to update forward-looking statements contained in this presentation or in the above- referenced reports, whether asa result of new information, future events or otherwise, except asmay berequired bylawor NASDAQ rules. Non-GAAP Financial Measures This presentation contains both financialmeasures based on GAAP and non-GAAP based financialmeasures, which are used when management believes them to be helpful in understanding the Company’s results of operations or financial position. Where non-GAAP financial measures are used, the comparable GAAP financial measure, aswell asthe reconciliation to the compa rable GAAP financialmeasure, can befound in the Company’s press release asof and for the quarter ended March 31, 2021. These disclosures should not be viewed as a substitute for opera t ing results determined in accordance with GAAP, nor are they necessarily comparableto non-GAAP performance measures thatmay bepresented byother companies. Safe Harbor Statement 1 |
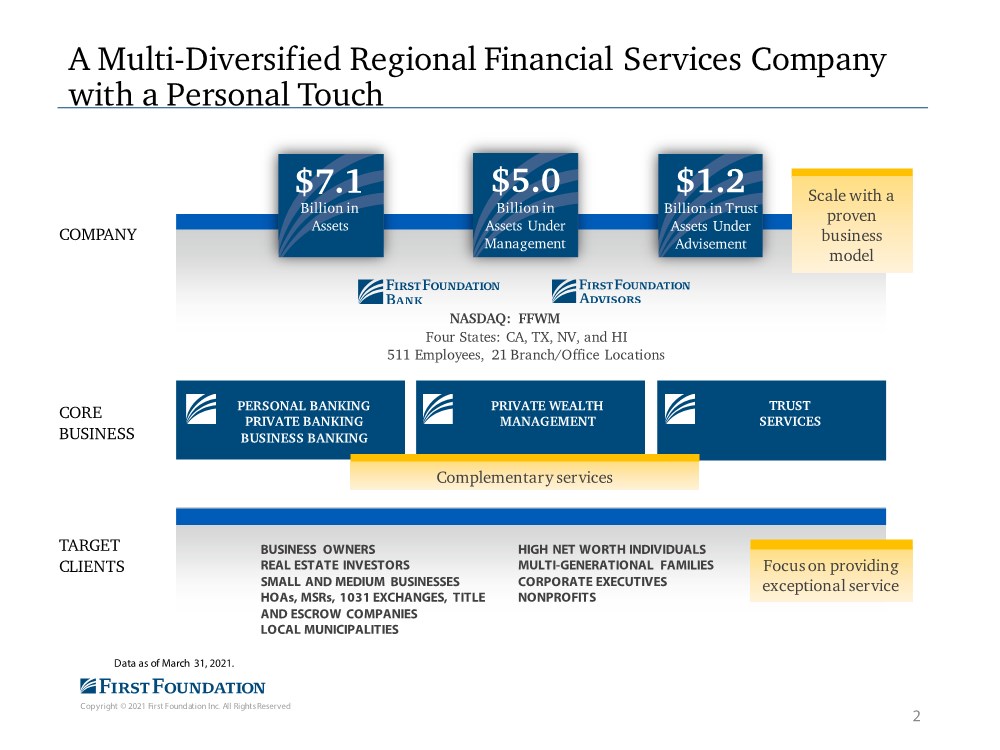
| Copyright © 2021 First Foundation Inc. All Rights Reserved A Multi-Diversified Regional Financial Services Company with a Personal Touch $5.0 Billion in Assets Under Management $7.1 Billion in Assets COMPANY TRUST SERVICES PERSONAL BANKING PRIVATE BANKING BUSINESS BANKING PRIVATE WEALTH MANAGEMENT Data as of March 31, 2021. Four States: CA, TX, NV, and HI 511 Employees, 21 Branch/Office Locations CORE BUSINESS TARGET CLIENTS BUSINESS OWNERS REAL ESTATE INVESTORS SMALL AND MEDIUM BUSINESSES HOAs, MSRs, 1031 EXCHANGES, TITLE AND ESCROW COMPANIES LOCAL MUNICIPALITIES HIGH NET WORTH INDIVIDUALS MULTI-GENERATIONAL FAMILIES CORPORATE EXECUTIVES NONPROFITS Focus on providing exceptional service Complementary services $1.2 Billion in Trust Assets Under Advisement Scale with a proven business model 2 NASDAQ: FFWM |
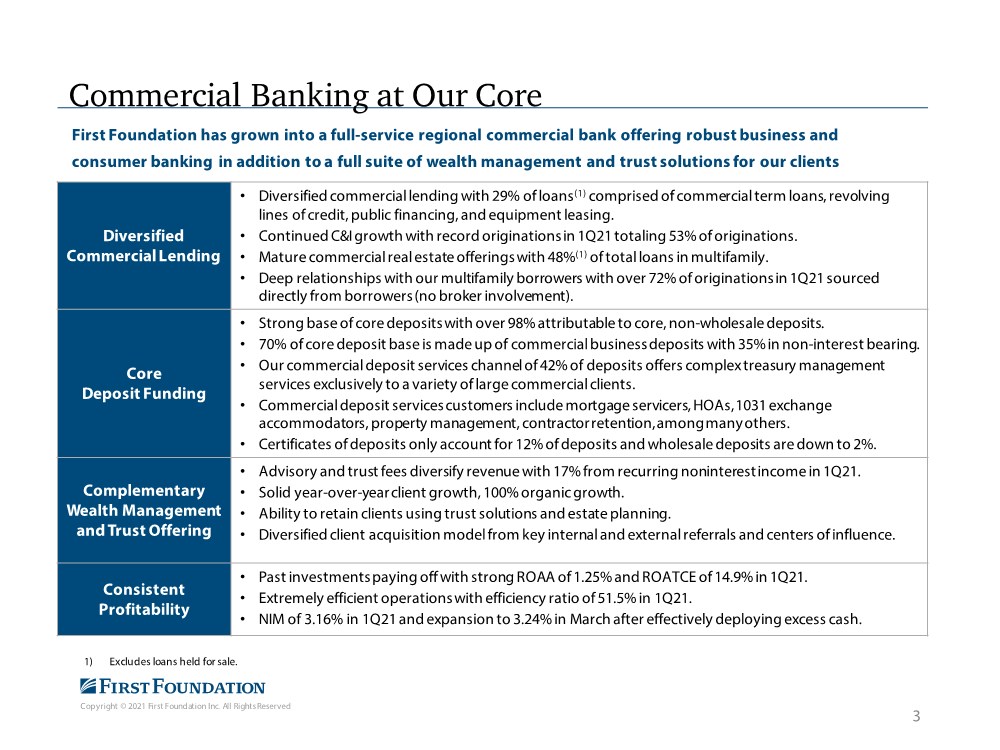
| Copyright © 2021 First Foundation Inc. All Rights Reserved 3 Diversified Commercial Lending • Diversified commercial lending with 29% of loans(1) comprised of commercial term loans, revolving lines of credit, public financing, and equipment leasing. • Continued C&I growth with record originations in 1Q21 totaling 53% of originations. • Mature commercial real estate offerings with 48%(1) of total loans in multifamily. • Deep relationships with our multifamily borrowers with over 72% of originations in 1Q21 sourced directly from borrowers (no broker involvement). Core Deposit Funding • Strong base of core deposits with over 98% attributable to core, non-wholesale deposits. • 70% of core deposit base is made up of commercial business deposits with 35% in non-interest bearing. • Our commercial deposit services channel of 42% of deposits offers complex treasury management services exclusively to a variety of large commercial clients. • Commercial deposit services customers include mortgage servicers, HOAs, 1031 exchange accommodators, property management, contractor retention, among many others. • Certificates of deposits only account for 12% of deposits and wholesale deposits are down to 2%. Complementary Wealth Management and Trust Offering • Advisory and trust fees diversify revenue with 17% from recurring noninterest income in 1Q21. • Solid year-over-year client growth, 100% organic growth. • Ability to retain clients using trust solutions and estate planning. • Diversified client acquisition model from key internal and external referrals and centers of influence. Consistent Profitability • Past investments paying off with strong ROAA of 1.25% and ROATCE of 14.9% in 1Q21. • Extremely efficient operations with efficiency ratio of 51.5% in 1Q21. • NIM of 3.16% in 1Q21 and expansion to 3.24% in March after effectively deploying excess cash. Commercial Banking at Our Core First Foundation has grown into a full-service regional commercial bank offering robust business and consumer banking in addition to a full suite of wealth management and trust solutions for our clients 1) Excludes loans held for sale. |
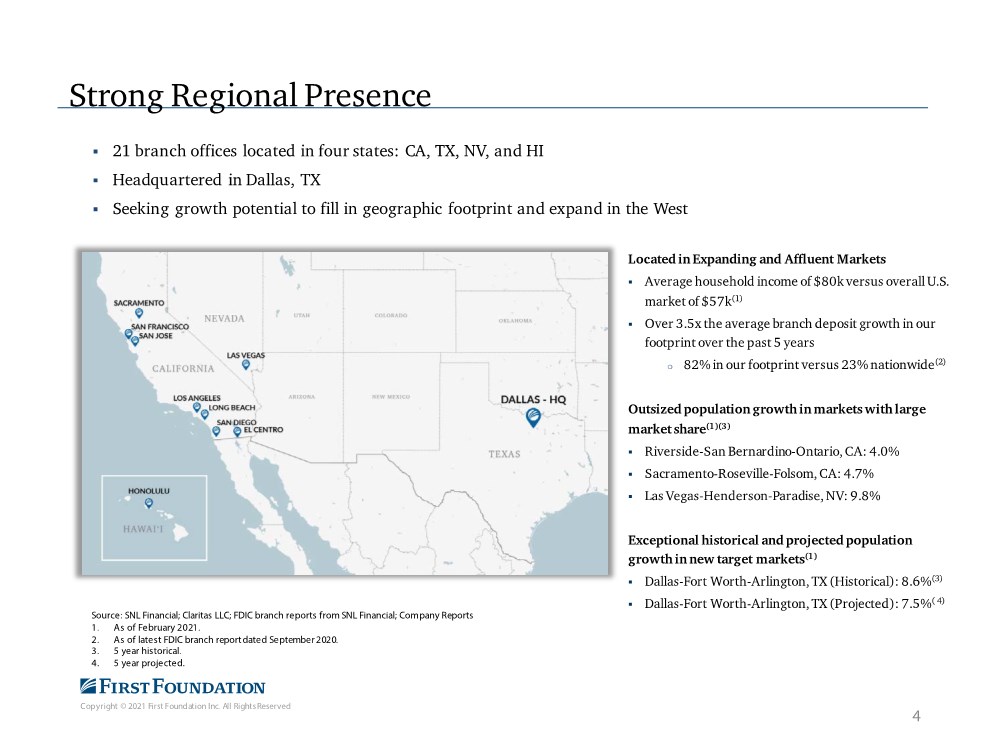
| Copyright © 2021 First Foundation Inc. All Rights Reserved 4 Strong Regional Presence . 21 branch offices located in four states: CA, TX, NV, and HI . Headquartered in Dallas, TX . Seeking growth potential to fill in geographic footprint and expand in the West Located in Expanding and Affluent Markets . Average household income of $80k versus overall U.S. market of $57k(1) . Over 3.5x the average branch deposit growth in our footprint over the past 5 years o 82% in our footprint versus 23% nationwide(2) Outsized population growth in markets with large market share(1)(3) . Riverside-San Bernardino-Ontario, CA: 4.0% . Sacramento-Roseville-Folsom, CA: 4.7% . Las Vegas-Henderson-Paradise, NV: 9.8% Exceptional historical and projected population growth in new target markets(1) . Dallas-Fort Worth-Arlington, TX (Historical): 8.6%(3) . Dallas-Fort Worth-Arlington, TX (Projected): 7.5%( 4) Source: SNL Financial; Claritas LLC; FDIC branch reports from SNL Financial; Company Reports 1. As of February 2021. 2. As of latest FDIC branch report dated September 2020. 3. 5 year historical. 4. 5 year projected. |
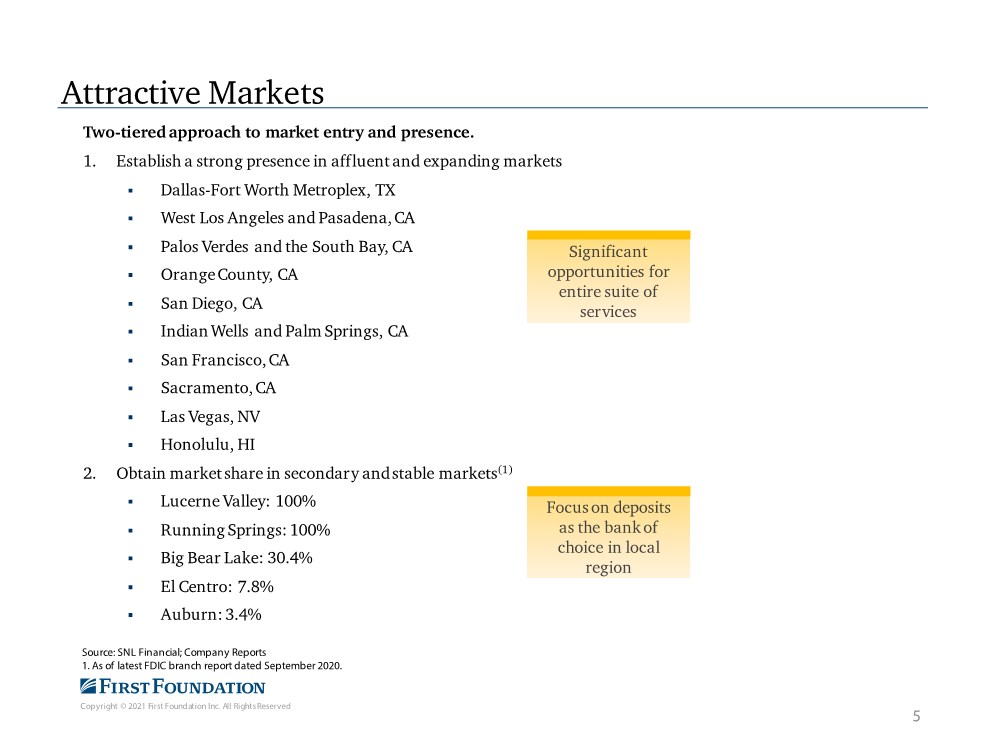
| Copyright © 2021 First Foundation Inc. All Rights Reserved Attractive Markets Two-tiered approach to market entry and presence. 1. Establish a strong presence in affluent and expanding markets . Dallas-Fort Worth Metroplex, TX . West Los Angeles and Pasadena, CA . Palos Verdes and the South Bay, CA . Orange County, CA . San Diego, CA . Indian Wells and Palm Springs, CA . San Francisco,CA . Sacramento, CA . Las Vegas, NV . Honolulu, HI 2. Obtain market share in secondary and stable markets(1) . Lucerne Valley: 100% . Running Springs: 100% . Big Bear Lake: 30.4% . El Centro: 7.8% . Auburn: 3.4% Source: SNL Financial; Company Reports 1. As of latest FDIC branch report dated September 2020. Significant opportunities for entire suite of services Focus on deposits as the bank of choice in local region 5 |
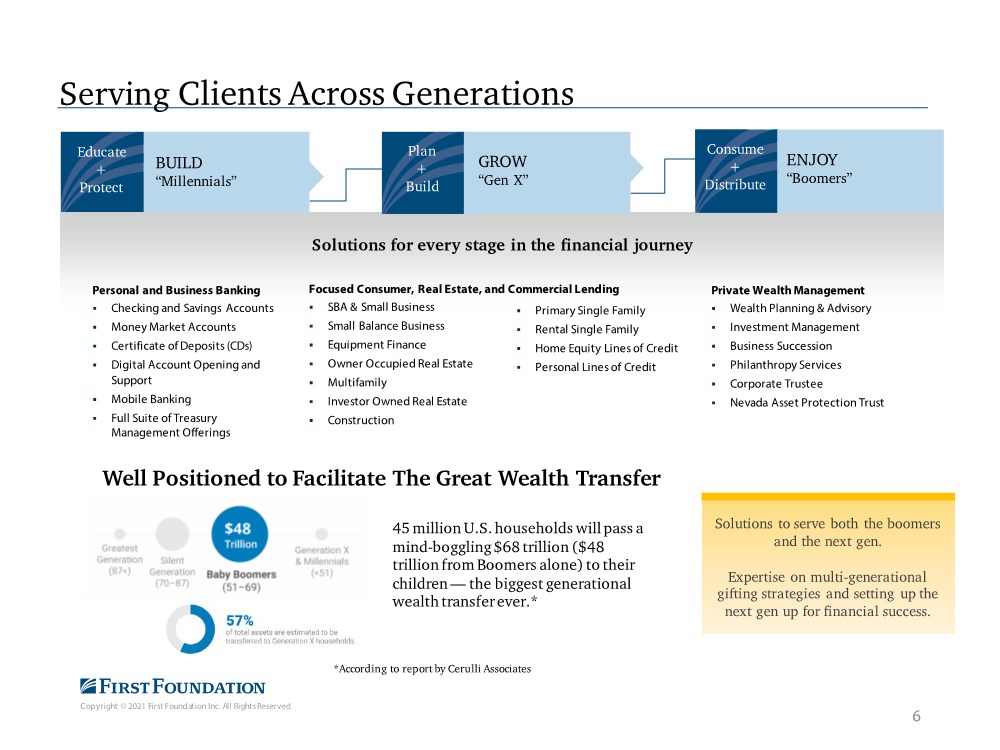
| Copyright © 2021 First Foundation Inc. All Rights Reserved Serving Clients Across Generations Educate + Protect BUILD “Millennials” Plan + Build GROW “Gen X” Consume + Distribute ENJOY “Boomers” Solutions for every stage in the financial journey Focused Consumer, Real Estate, and Commercial Lending . SBA & Small Business . Small Balance Business . Equipment Finance . Owner Occupied Real Estate . Multifamily . Investor Owned Real Estate . Construction Private Wealth Management . Wealth Planning & Advisory . Investment Management . Business Succession . Philanthropy Services . Corporate Trustee . Nevada Asset Protection Trust Personal and Business Banking . Checking and Savings Accounts . Money Market Accounts . Certificate of Deposits (CDs) . Digital Account Opening and Support . Mobile Banking . Full Suite of Treasury Management Offerings . Primary Single Family . Rental Single Family . Home Equity Lines of Credit . Personal Lines of Credit Solutions to serve both the boomers and the next gen. Expertise on multi-generational gifting strategies and setting up the next gen up for financial success. 6 Well Positioned to Facilitate The Great Wealth Transfer 45 million U.S. households will pass a mind-boggling $68 trillion ($48 trillion from Boomers alone) to their children — the biggest generational wealth transfer ever.* *According to report by Cerulli Associates |
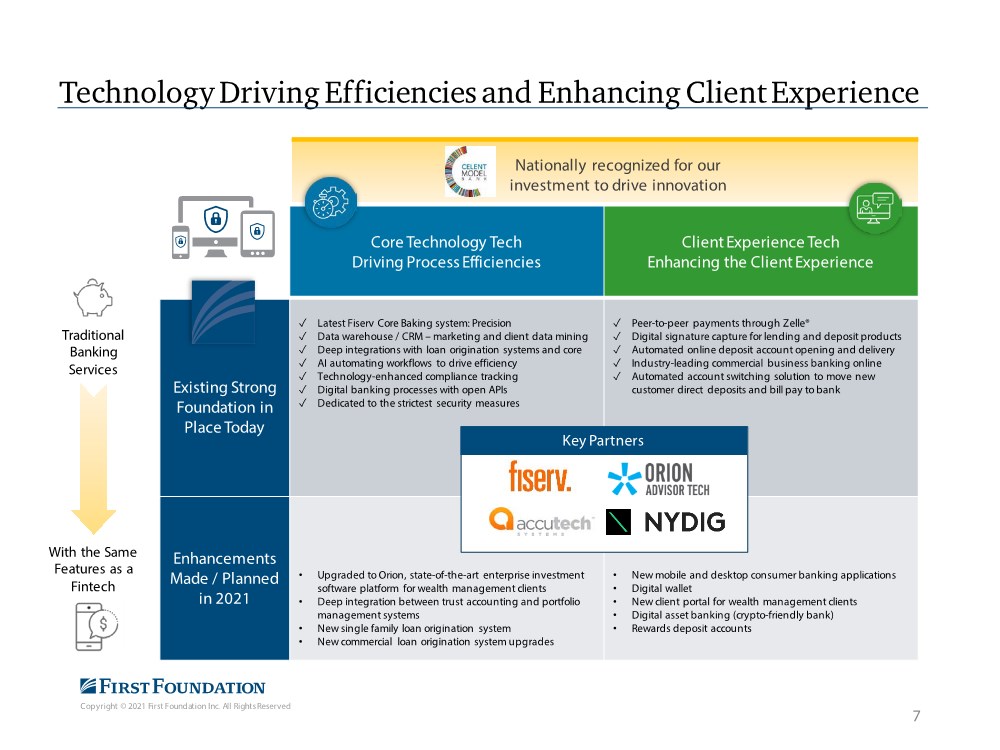
| Copyright © 2021 First Foundation Inc. All Rights Reserved Technology Driving Efficiencies and Enhancing Client Experience 7 Core Technology Tech Driving Process Efficiencies Client Experience Tech Enhancing the Client Experience Existing Strong Foundation in Place Today ✓ Latest Fiserv Core Baking system: Precision ✓ Data warehouse / CRM – marketing and client data mining ✓ Deep integrations with loan origination systems and core ✓ AI automating workflows to drive efficiency ✓ Technology-enhanced compliance tracking ✓ Digital banking processes with open APIs ✓ Dedicated to the strictest security measures ✓ Peer-to-peer payments through Zelle® ✓ Digital signature capture for lending and deposit products ✓ Automated online deposit account opening and delivery ✓ Industry-leading commercial business banking online ✓ Automated account switching solution to move new customer direct deposits and bill pay to bank Enhancements Made / Planned in 2021 • Upgraded to Orion, state-of-the-art enterprise investment software platform for wealth management clients • Deep integration between trust accounting and portfolio management systems • New single family loan origination system • New commercial loan origination system upgrades • New mobile and desktop consumer banking applications • Digital wallet • New client portal for wealth management clients • Digital asset banking (crypto-friendly bank) • Rewards deposit accounts Traditional Banking Services With the Same Features as a Fintech Nationally recognized for our investment to drive innovation Key Partners |
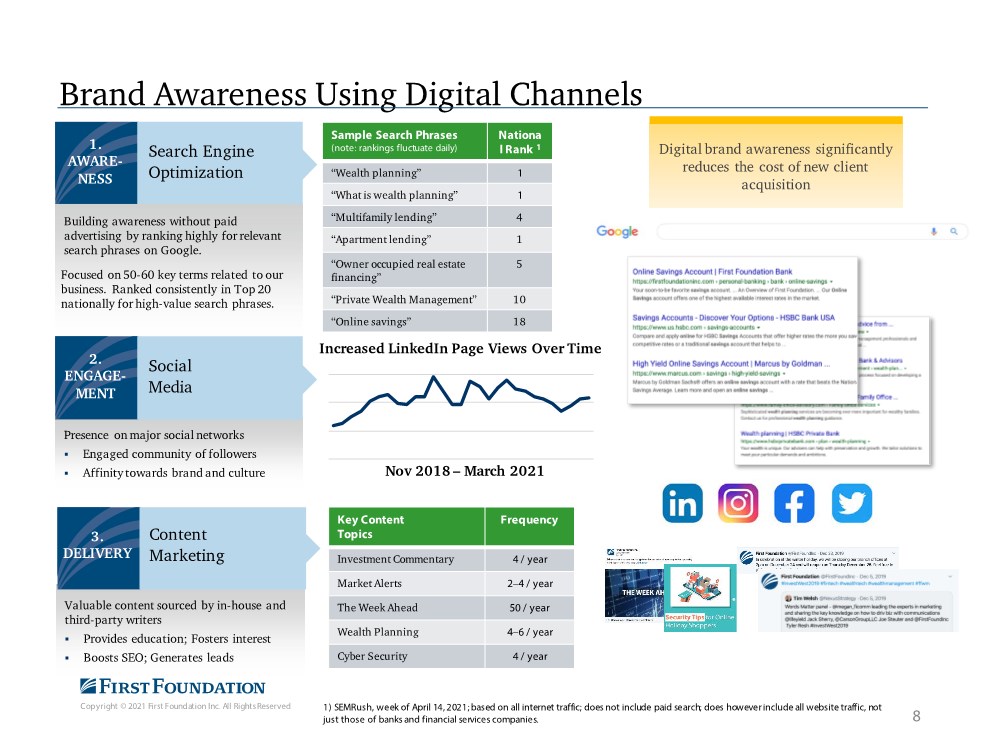
| Copyright © 2021 First Foundation Inc. All Rights Reserved Brand Awareness Using Digital Channels 1) SEMRush, week of April 14, 2021; based on all internet traffic; does not include paid search; does however include all website traffic, not just those of banks and financial services companies. Focused on 50-60 key terms related to our business. Ranked consistently in Top 20 nationally for high-value search phrases. 1. AWARE- NESS Search Engine Optimization Building awareness without paid advertising by ranking highly for relevant search phrases on Google. 2. ENGAGE- MENT Social Media Presence on major social networks . Engaged community of followers . Affinity towards brand and culture Increased LinkedIn Page Views Over Time 3. DELIVERY Content Marketing Valuable content sourced by in-house and third-party writers . Provides education; Fosters interest . Boosts SEO; Generates leads Key Content Topics Frequency Investment Commentary 4 / year Market Alerts 2–4 / year The Week Ahead 50 / year Wealth Planning 4–6 / year Cyber Security 4 / year Nov 2018 – March 2021 8 Sample Search Phrases (note: rankings fluctuate daily) Nationa l Rank 1 “Wealth planning” 1 “What is wealth planning” 1 “Multifamily lending” 4 “Apartment lending” 1 “Owner occupied real estate financing” 5 “Private Wealth Management” 10 “Online savings” 18 Digital brand awareness significantly reduces the cost of new client acquisition |
| Copyright © 2021 First Foundation Inc. All Rights Reserved Loans 9 |
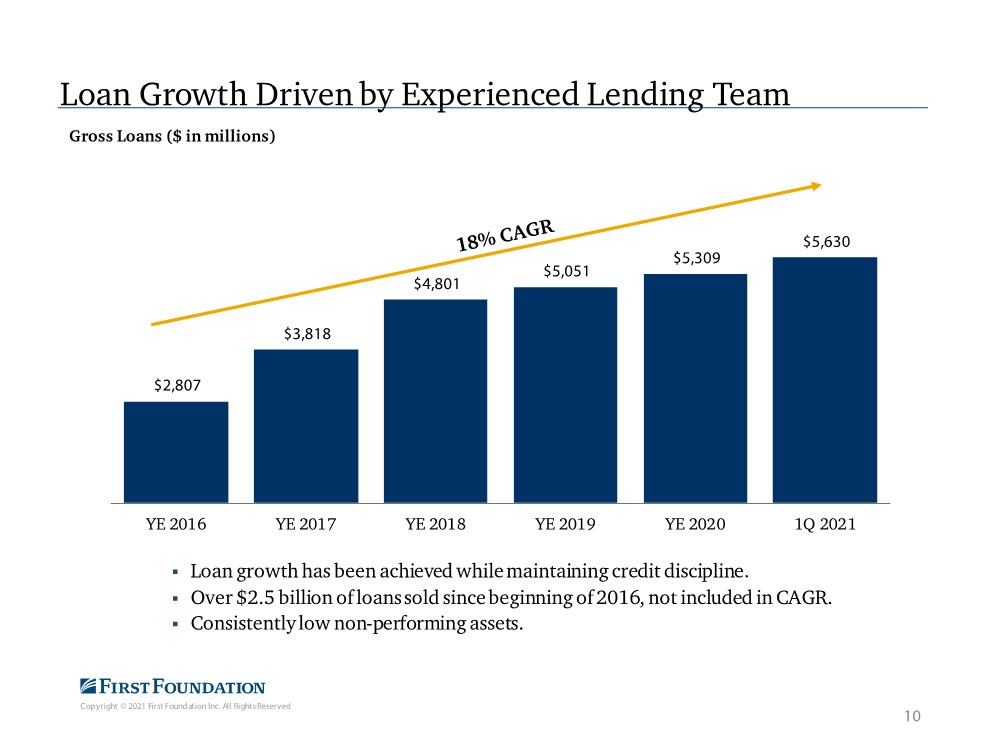
| Copyright © 2021 First Foundation Inc. All Rights Reserved . Loan growth has been achieved whilemaintainingcredit discipline. . Over $2.5 billion of loans sold since beginning of 2016, not included in CAGR. . Consistently low non-performing assets. Loan Growth Driven by Experienced Lending Team Gross Loans ($ in millions) 10 $2,807 $3,818 $4,801 $5,051 $5,309 $5,630 YE 2016 YE 2017 YE 2018 YE 2019 YE 2020 1Q 2021 |
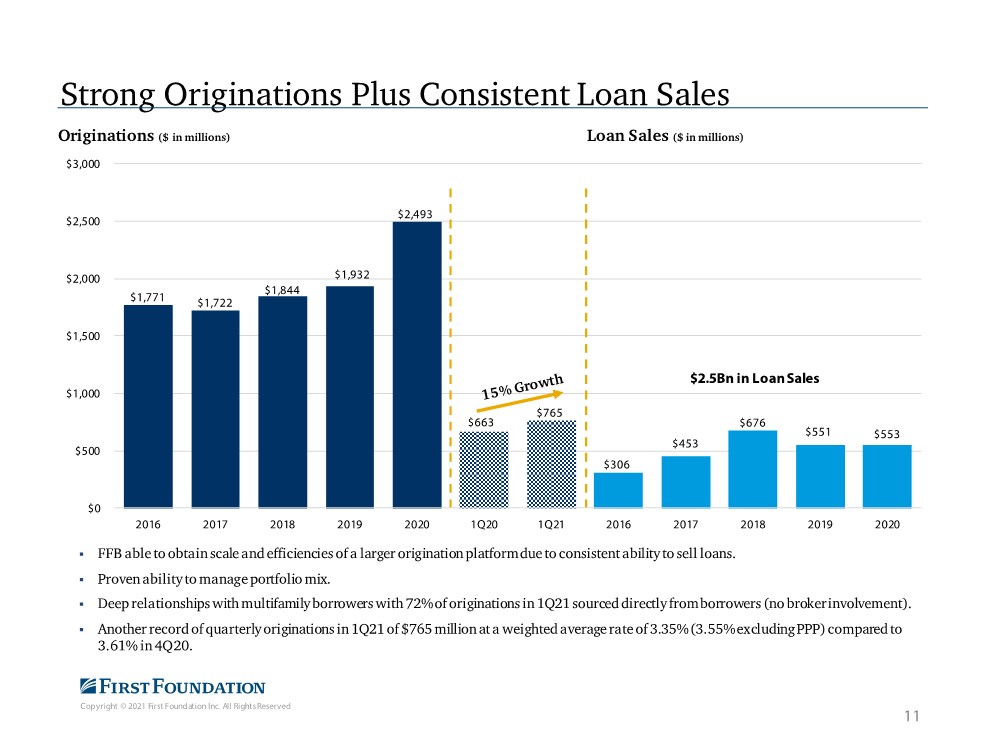
| Copyright © 2021 First Foundation Inc. All Rights Reserved . FFB able to obtain scale and efficiencies of a larger origination platform due to consistent ability to sell loans. . Proven ability to manage portfolio mix. . Deep relationships with multifamily borrowers with 72% of originations in 1Q21 sourced directly from borrowers (no broker involvement). . Another record of quarterly originations in 1Q21 of $765 million at a weighted average rate of 3.35% (3.55% excluding PPP) compared to 3.61% in 4Q20. Strong Originations Plus Consistent Loan Sales Originations ($ in millions) $2.5Bn in Loan Sales 11 Loan Sales ($ in millions) $1,771 $1,722 $1,844 $1,932 $2,493 $663 $765 $306 $453 $676 $551 $553 $0 $500 $1,000 $1,500 $2,000 $2,500 $3,000 2016 2017 2018 2019 2020 1Q20 1Q21 2016 2017 2018 2019 2020 |
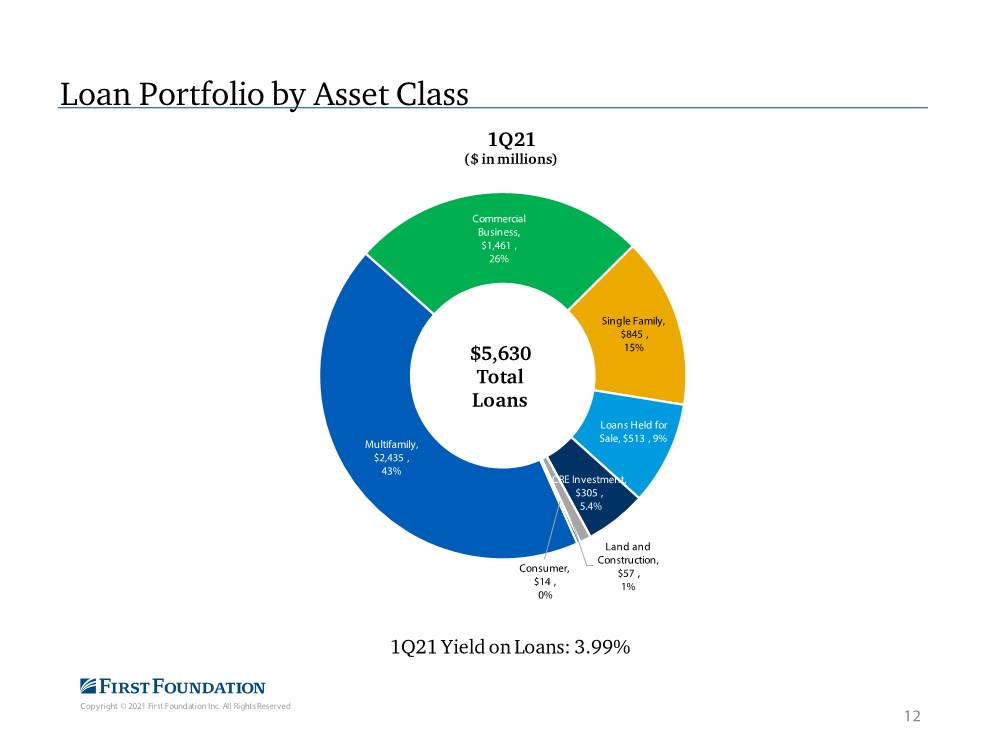
| Copyright © 2021 First Foundation Inc. All Rights Reserved Multifamily, $2,435 , 43% Commercial Business, $1,461 , 26% Single Family, $845 , 15% Loans Held for Sale, $513 , 9% CRE Investment, $305 , 5.4% Land and Construction, $57 , 1% Consumer, $14 , 0% 1Q21 ($ in millions) Loan Portfolio by Asset Class $5,630 Total Loans 1Q21 Yield on Loans: 3.99% 12 |
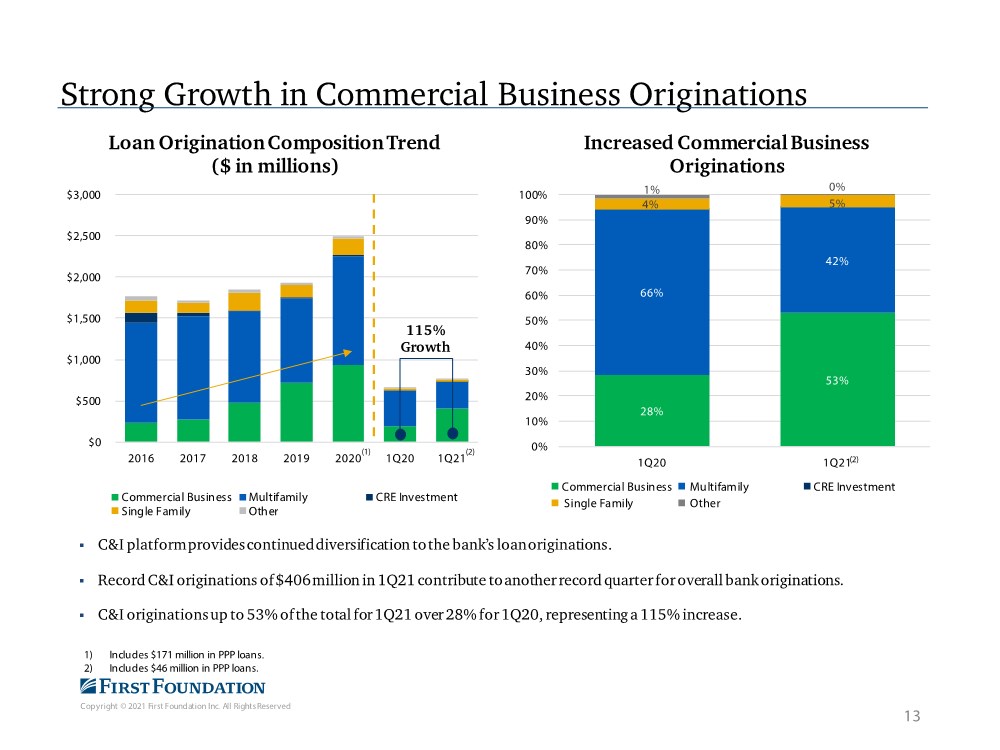
| Copyright © 2021 First Foundation Inc. All Rights Reserved . C&I platform provides continued diversification to the bank’s loan originations. . Record C&I originations of $406 million in 1Q21 contribute to another record quarter for overall bank originations. . C&I originations up to 53% of the total for 1Q21 over 28% for 1Q20, representing a 115% increase. Strong Growth in Commercial Business Originations 13 (1) 1) Includes $171 million in PPP loans. 2) Includes $46 million in PPP loans. (2) $0 $500 $1,000 $1,500 $2,000 $2,500 $3,000 2016 2017 2018 2019 2020 1Q20 1Q21 Loan Origination Composition Trend ($ in millions) Commercial Busin ess Multifamily CRE Investment Single Family Oth er 115% Growth (2) 28% 53% 66% 42% 4% 5% 1% 0% 0% 10% 20% 30% 40% 50% 60% 70% 80% 90% 100% 1Q20 1Q21 Increased Commercial Business Originations Commercial Busin ess Mu ltifamily CRE Investment Single Family Other |
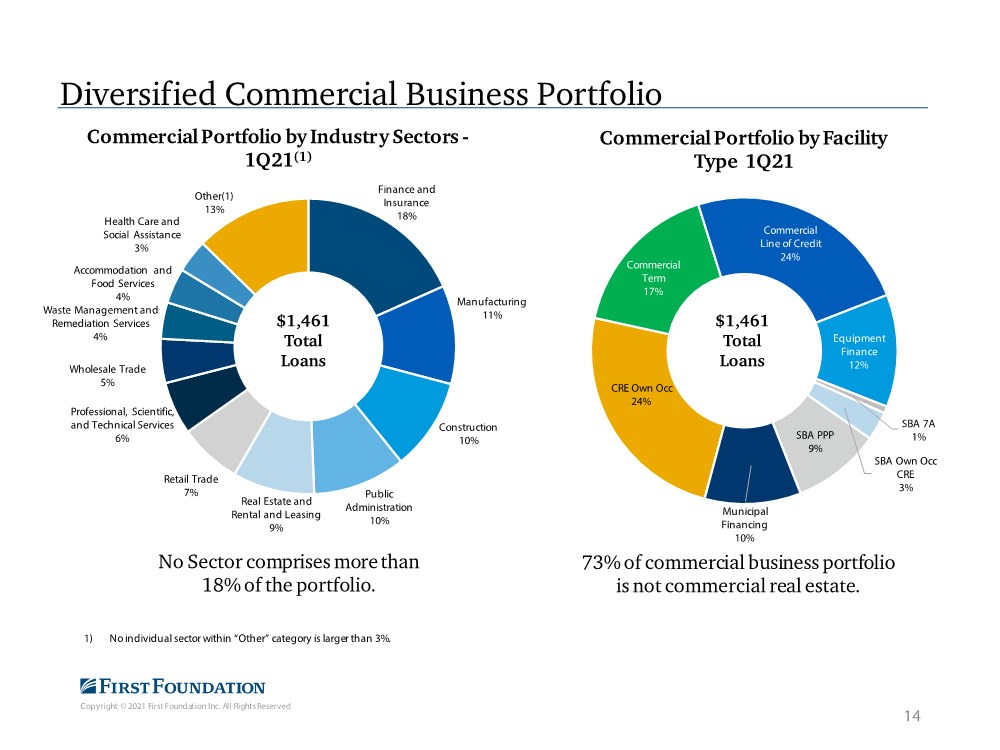
| Copyright © 2021 First Foundation Inc. All Rights Reserved Diversified Commercial Business Portfolio No Sector comprises more than 18% of the portfolio. CRE Own Occ 24% Commercial Term 17% Commercial Line of Credit 24% Equipment Finance 12% SBA 7A 1% SBA Own Occ CRE 3% SBA PPP 9% Municipal Financing 10% Commercial Portfolio by Facility Type 1Q21 1) No individual sector within “Other” category is larger than 3%. Finance and Insurance 18% Manufacturing 11% Construction 10% Public Administration 10% Real Estate and Rental and Leasing 9% Retail Trade 7% Professional, Scientific, and Technical Services 6% Wholesale Trade 5% Waste Management and Remediation Services 4% Accommodation and Food Services 4% Health Care and Social Assistance 3% Other(1) 13% Commercial Portfolio by Industry Sectors - 1Q21(1) 14 73% of commercial business portfolio is not commercial real estate. $1,461 Total Loans $1,461 Total Loans |
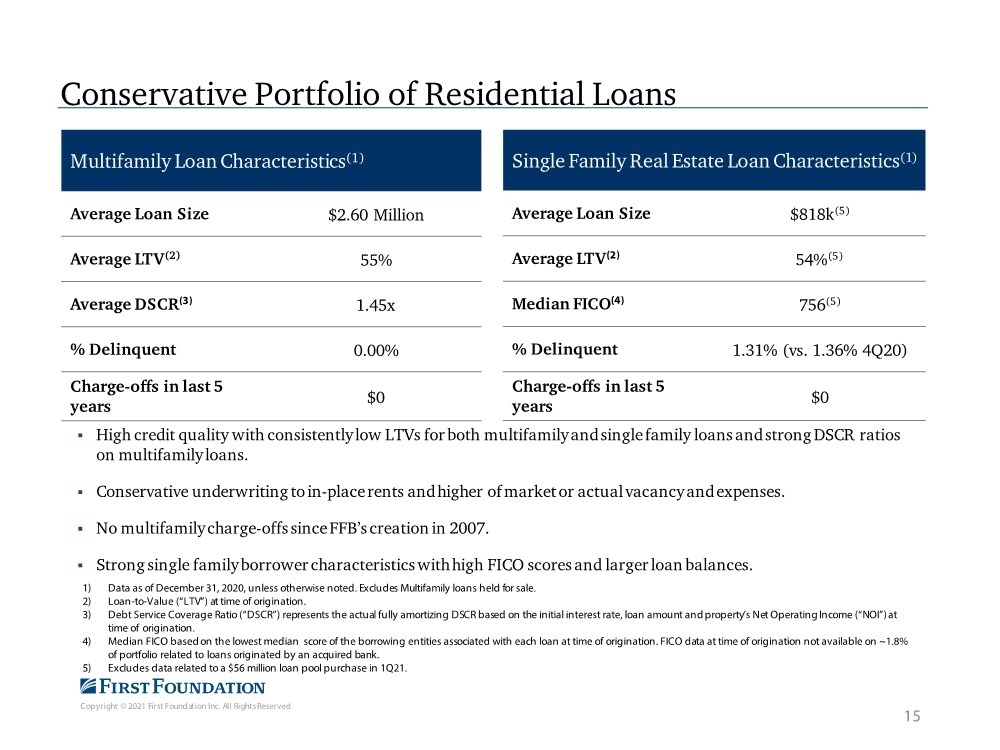
| Copyright © 2021 First Foundation Inc. All Rights Reserved Conservative Portfolio of Residential Loans Multifamily Loan Characteristics(1) Average Loan Size $2.60 Million Average LTV(2) 55% Average DSCR(3) 1.45x % Delinquent 0.00% Charge-offs in last 5 years $0 Single Family Real Estate Loan Characteristics(1) Average Loan Size $818k(5) Average LTV(2) 54%(5) Median FICO(4) 756(5) % Delinquent 1.31% (vs. 1.36% 4Q20) Charge-offs in last 5 years $0 1) Data as of December 31, 2020, unless otherwise noted. Excludes Multifamily loans held for sale. 2) Loan-to-Value (“LTV”) at time of origination. 3) Debt Service Coverage Ratio (“DSCR”) represents the actual fully amortizing DSCR based on the initial interest rate, loan amount and property’s Net Operating Income (“NOI”) at time of origination. 4) Median FICO based on the lowest median score of the borrowing entities associated with each loan at time of origination. FICO data at time of origination not available on ~1.8% of portfolio related to loans originated by an acquired bank. 5) Excludes data related to a $56 million loan pool purchase in 1Q21. . High credit quality with consistently low LTVs for both multifamily and single family loans and strong DSCR ratios on multifamily loans. . Conservative underwriting to in-place rents and higher of market or actual vacancy and expenses. . No multifamily charge-offs since FFB’s creation in 2007. . Strong single family borrower characteristics with high FICO scores and larger loan balances. 15 |
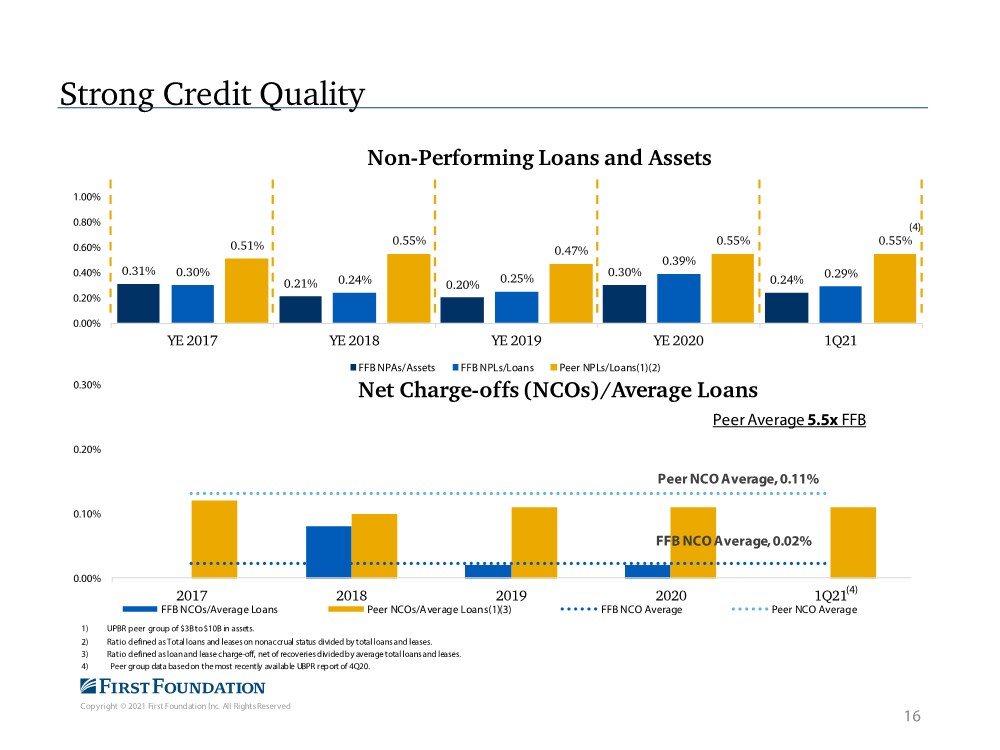
| Copyright © 2021 First Foundation Inc. All Rights Reserved 1) UPBR peer group of $3B to $10B in assets. 2) Ratio defined as Total loans and leases on nonaccrual status divided by total loans and leases. 3) Ratio defined as loan and lease charge-off, net of recoveries divided by average total loans and leases. 4) Peer group data based on the most recently available UBPR report of 4Q20. Strong Credit Quality 16 (4) (4) 0.31% 0.21% 0.20% 0.30% 0.24% 0.30% 0.24% 0.25% 0.39% 0.29% 0.51% 0.55% 0.47% 0.55% 0.55% 0.00% 0.20% 0.40% 0.60% 0.80% 1.00% YE 2017 YE 2018 YE 2019 YE 2020 1Q21 Non-Performing Loans and Assets FFB NPAs/Assets FFB NPLs/Loans Peer NPLs/Loans(1)(2) FFB NCO Average, 0.02% Peer NCO Average, 0.11% 0.00% 0.10% 0.20% 0.30% 2017 2018 2019 2020 1Q21 Net Charge-offs (NCOs)/Average Loans FFB NCOs/Average Loans Peer NCOs/Average Loans(1)(3) FFB NCO Average Peer NCO Average Peer Average 5.5x FFB |
| Copyright © 2021 First Foundation Inc. All Rights Reserved Deposits 17 |
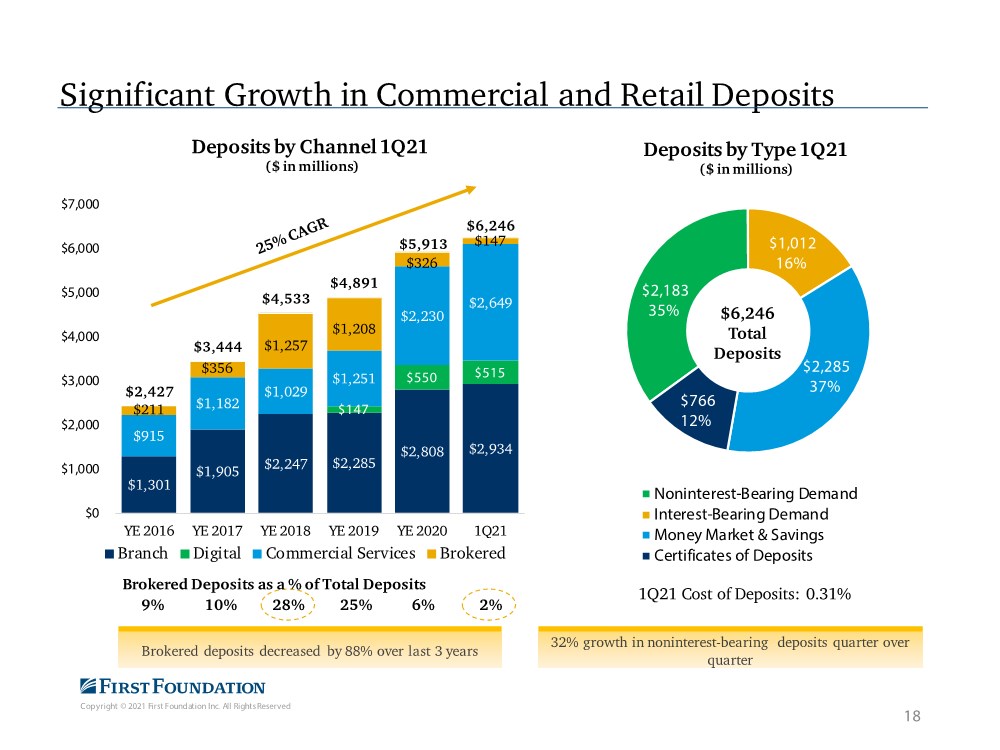
| Copyright © 2021 First Foundation Inc. All Rights Reserved $2,183 35% $1,012 16% $2,285 37% $766 12% Noninterest-Bearing Demand Interest-Bearing Demand Money Market & Savings Certificates of Deposits Deposits by Type 1Q21 ($ in millions) Significant Growth in Commercial and Retail Deposits 1Q21 Cost of Deposits: 0.31% $6,246 Total Deposits 18 Brokered deposits decreased by 88% over last 3 years 32% growth in noninterest-bearing deposits quarter over quarter $1,301 $1,905 $2,247 $2,285 $2,808 $2,934 $147 $550 $515 $915 $1,182 $1,029 $1,251 $2,230 $2,649 $211 $356 $1,257 $1,208 $326 $147 $2,427 $3,444 $4,533 $4,891 $5,913 $6,246 $0 $1,000 $2,000 $3,000 $4,000 $5,000 $6,000 $7,000 YE 2016 YE 2017 YE 2018 YE 2019 YE 2020 1Q21 Deposits by Channel 1Q21 ($ in millions) Branch Digital Commercial Services Brokered Brokered Deposits as a % of Total Deposits 9% 10% 28% 25% 6% 2% |
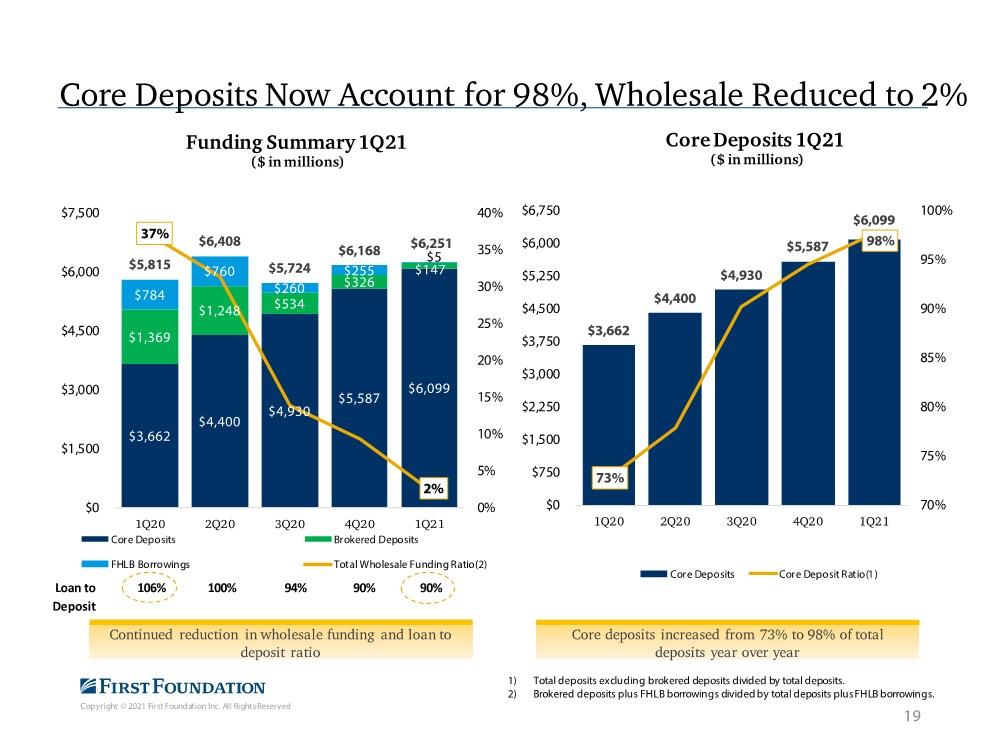
| Copyright © 2021 First Foundation Inc. All Rights Reserved Core Deposits Now Account for 98%, Wholesale Reduced to 2% 19 Core deposits increased from 73% to 98% of total deposits year over year 1) Total deposits excluding brokered deposits divided by total deposits. 2) Brokered deposits plus FHLB borrowings divided by total deposits plus FHLB borrowings. Continued reduction in wholesale funding and loan to deposit ratio $3,662 $4,400 $4,930 $5,587 $6,099 73% 98% 70% 75% 80% 85% 90% 95% 100% $0 $750 $1,500 $2,250 $3,000 $3,750 $4,500 $5,250 $6,000 $6,750 1Q20 2Q20 3Q20 4Q20 1Q21 Core Deposits 1Q21 ($ in millions) Core Deposits Core Deposit Ratio(1) $3,662 $4,400 $4,930 $5,587 $6,099 $1,369 $1,248 $534 $326 $147 $784 $760 $260 $255 $5 $5,815 $6,408 $5,724 $6,168 $6,251 37% 2% 0% 5% 10% 15% 20% 25% 30% 35% 40% $0 $1,500 $3,000 $4,500 $6,000 $7,500 1Q20 2Q20 3Q20 4Q20 1Q21 Funding Summary 1Q21 ($ in millions) Core Deposits Brokered Deposits FHLB Borrowings Total Wholesale Funding Ratio(2) Loan to 106% 100% 94% 90% 90% Deposit |
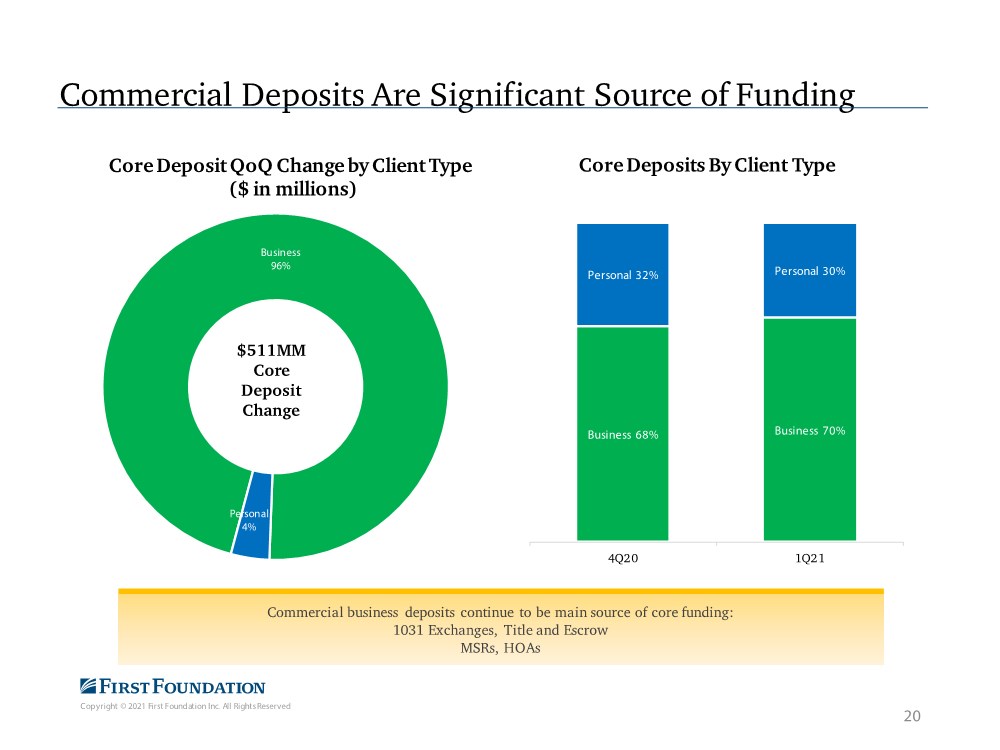
| Copyright © 2021 First Foundation Inc. All Rights Reserved Commercial Deposits Are Significant Source of Funding 20 Business 68% Business 70% Personal 32% Personal 30% 4Q20 1Q21 Core Deposits By Client Type Business 96% Personal 4% Core Deposit QoQ Change by Client Type ($ in millions) $511MM Core Deposit Change Commercial business deposits continue to be main source of core funding: 1031 Exchanges, Title and Escrow MSRs, HOAs |
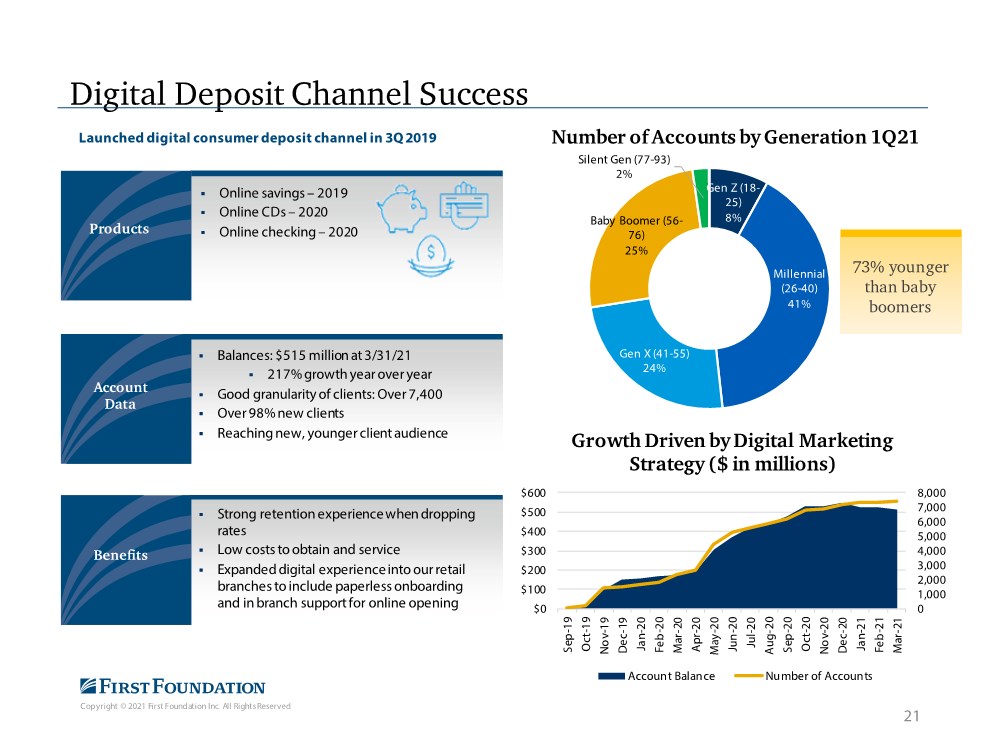
| Copyright © 2021 First Foundation Inc. All Rights Reserved Launched digital consumer deposit channel in 3Q 2019 . Online savings – 2019 . Online CDs – 2020 . Online checking – 2020 . Balances: $515 million at 3/31/21 . 217% growth year over year . Good granularity of clients: Over 7,400 . Over 98% new clients . Reaching new, younger client audience . Strong retention experience when dropping rates . Low costs to obtain and service . Expanded digital experience into our retail branches to include paperless onboarding and in branch support for online opening Account Data Products Benefits 21 Digital Deposit Channel Success Gen Z (18- 25) 8% Millennial (26-40) 41% Gen X (41-55) 24% Baby Boomer (56- 76) 25% Silent Gen (77-93) 2% Number of Accounts by Generation 1Q21 73% younger than baby boomers 0 1,000 2,000 3,000 4,000 5,000 6,000 7,000 8,000 $0 $100 $200 $300 $400 $500 $600 Sep-19 Oct-19 Nov-19 Dec-19 Jan-20 Feb-20 Mar-20 Apr-20 May-20 Jun-20 Jul-20 Aug-20 Sep-20 Oct-20 Nov-20 Dec-20 Jan-21 Feb-21 Mar-21 Growth Driven by Digital Marketing Strategy ($ in millions) Account Balance Number of Accounts |
| Copyright © 2021 First Foundation Inc. All Rights Reserved Wealth Management and Trust 22 |
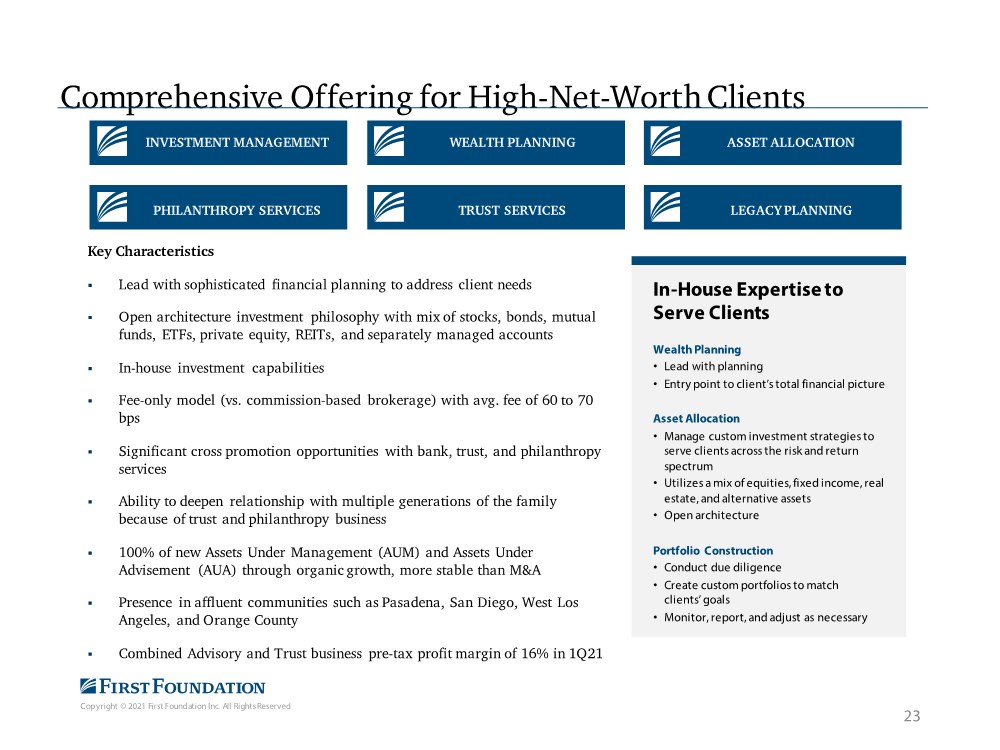
| Copyright © 2021 First Foundation Inc. All Rights Reserved In-House Expertise to Serve Clients Wealth Planning • Lead with planning • Entry point to client’s total financial picture Asset Allocation • Manage custom investment strategies to serve clients across the risk and return spectrum • Utilizes a mix of equities, fixed income, real estate, and alternative assets • Open architecture Portfolio Construction • Conduct due diligence • Create custom portfolios to match clients’ goals • Monitor, report, and adjust as necessary INVESTMENT MANAGEMENT PHILANTHROPY SERVICES WEALTH PLANNING TRUST SERVICES ASSET ALLOCATION LEGACY PLANNING Key Characteristics . Lead with sophisticated financial planning to address client needs . Open architecture investment philosophy with mix of stocks, bonds, mutual funds, ETFs, private equity, REITs, and separately managed accounts . In-house investment capabilities . Fee-only model (vs. commission-based brokerage) with avg. fee of 60 to 70 bps . Significant cross promotion opportunities with bank, trust, and philanthropy services . Ability to deepen relationship with multiple generations of the family because of trust and philanthropy business . 100% of new Assets Under Management (AUM) and Assets Under Advisement (AUA) through organic growth, more stable than M&A . Presence in affluent communities such as Pasadena, San Diego, West Los Angeles, and Orange County . Combined Advisory and Trust business pre-tax profit margin of 16% in 1Q21 Comprehensive Offering for High-Net-Worth Clients 23 |
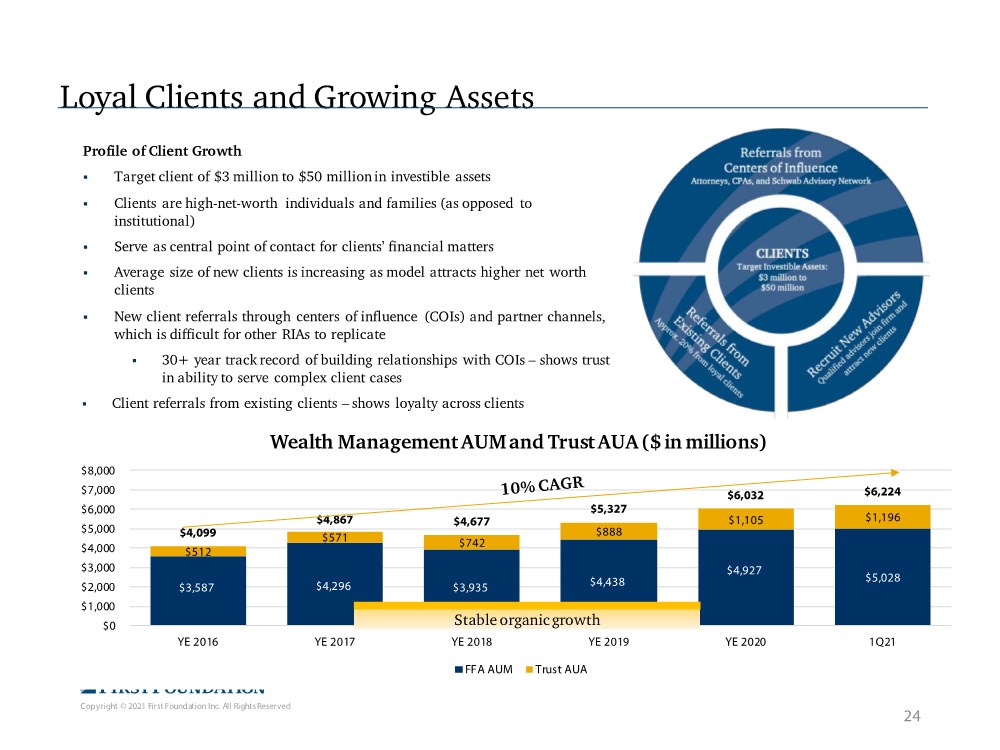
| Copyright © 2021 First Foundation Inc. All Rights Reserved $3,587 $4,296 $3,935 $4,438 $4,927 $5,028 $512 $571 $742 $888 $1,105 $1,196 $4,099 $4,867 $4,677 $5,327 $6,032 $6,224 $0 $1,000 $2,000 $3,000 $4,000 $5,000 $6,000 $7,000 $8,000 YE 2016 YE 2017 YE 2018 YE 2019 YE 2020 1Q21 Wealth Management AUM and Trust AUA ($ in millions) FFA AUM Trust AUA Loyal Clients and Growing Assets Profile of Client Growth . Target client of $3 million to $50 million in investible assets . Clients are high-net-worth individuals and families (as opposed to institutional) . Serve as central point of contact for clients’ financial matters . Average size of new clients is increasing as model attracts higher net worth clients . New client referrals through centers of influence (COIs) and partner channels, which is difficult for other RIAs to replicate . 30+ year track record of building relationships with COIs – shows trust in ability to serve complex client cases . Client referrals from existing clients – shows loyalty across clients Stable organic growth 24 |
| Copyright © 2021 First Foundation Inc. All Rights Reserved Profitability 25 |
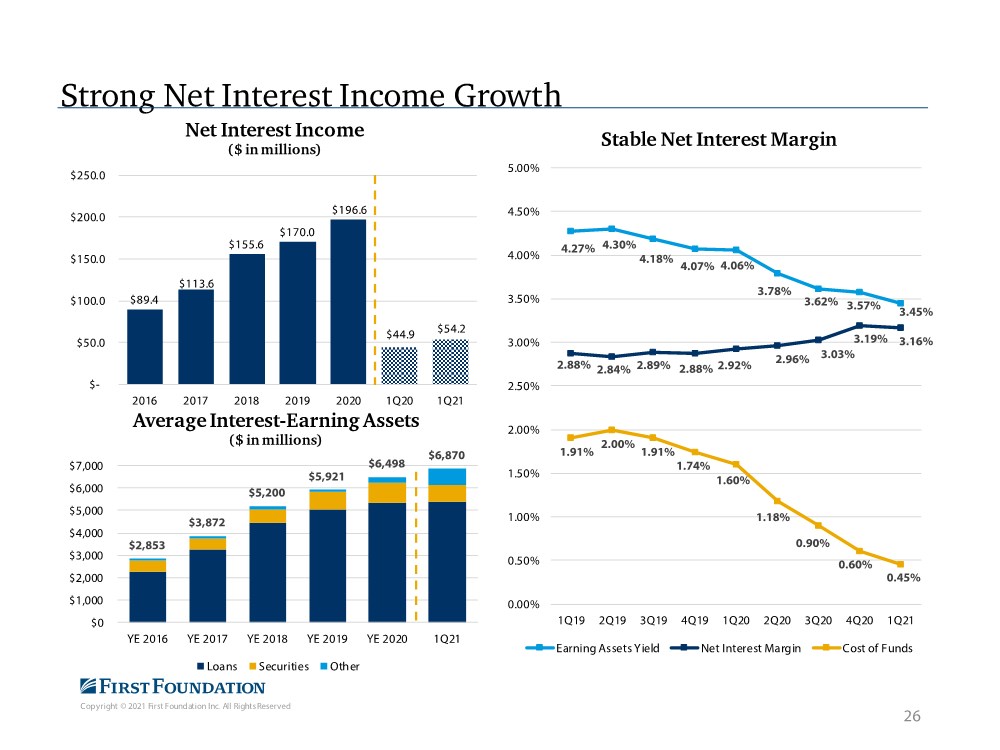
| Copyright © 2021 First Foundation Inc. All Rights Reserved Strong Net Interest Income Growth 26 $2,853 $3,872 $5,200 $5,921 $6,498 $6,870 $0 $1,000 $2,000 $3,000 $4,000 $5,000 $6,000 $7,000 YE 2016 YE 2017 YE 2018 YE 2019 YE 2020 1Q21 Average Interest-Earning Assets ($ in millions) Loans Securities Oth er $89.4 $113.6 $155.6 $170.0 $196.6 $44.9 $54.2 $- $50.0 $100.0 $150.0 $200.0 $250.0 2016 2017 2018 2019 2020 1Q20 1Q21 Net Interest Income ($ in millions) 4.27% 4.30% 4.18% 4.07% 4.06% 3.78% 3.62% 3.57% 3.45% 2.88% 2.84% 2.89% 2.88% 2.92% 2.96% 3.03% 3.19% 3.16% 1.91% 2.00% 1.91% 1.74% 1.60% 1.18% 0.90% 0.60% 0.45% 0.00% 0.50% 1.00% 1.50% 2.00% 2.50% 3.00% 3.50% 4.00% 4.50% 5.00% 1Q19 2Q19 3Q19 4Q19 1Q20 2Q20 3Q20 4Q20 1Q21 Stable Net Interest Margin Earning Assets Yield Net Interest Margin Cost of Funds |
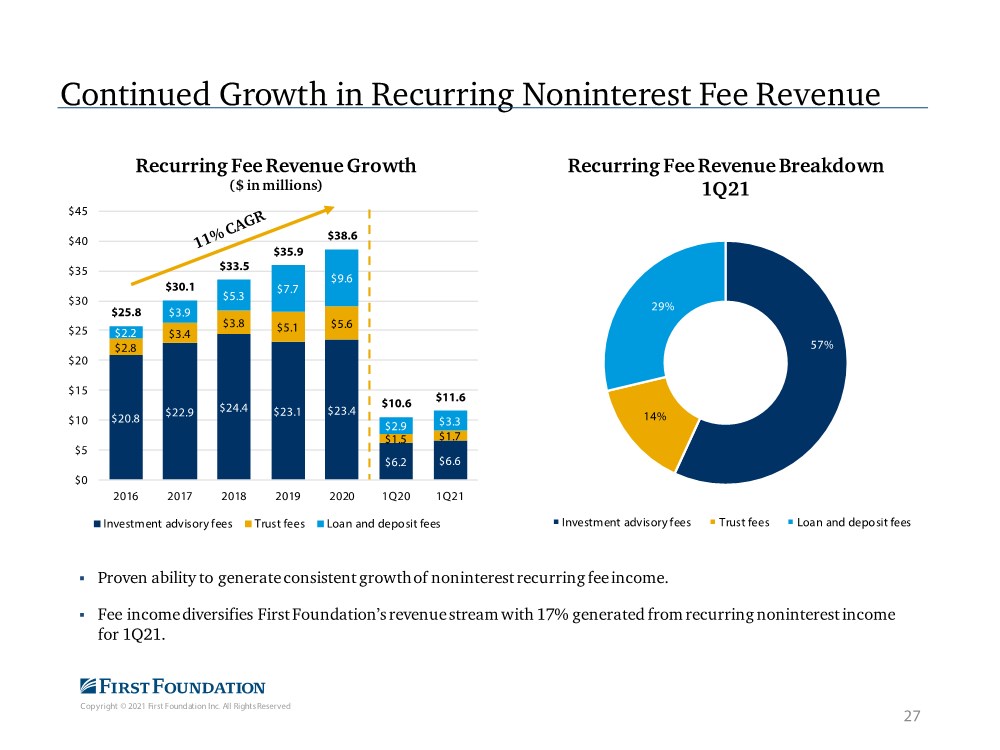
| Copyright © 2021 First Foundation Inc. All Rights Reserved . Proven ability to generate consistent growth of noninterest recurring fee income. . Fee income diversifies First Foundation’s revenue stream with 17% generated from recurring noninterest income for 1Q21. Continued Growth in Recurring Noninterest Fee Revenue 27 $20.8 $22.9 $24.4 $23.1 $23.4 $6.2 $6.6 $2.8 $3.4 $3.8 $5.1 $5.6 $1.5 $1.7 $2.2 $3.9 $5.3 $7.7 $9.6 $2.9 $3.3 $25.8 $30.1 $33.5 $35.9 $38.6 $10.6 $11.6 $0 $5 $10 $15 $20 $25 $30 $35 $40 $45 2016 2017 2018 2019 2020 1Q20 1Q21 Recurring Fee Revenue Growth ($ in millions) Investment advisory fees Trust fees Loan and deposit fees 57% 14% 29% Recurring Fee Revenue Breakdown 1Q21 Investment advisory fees Trust fees Loan and deposit fees |
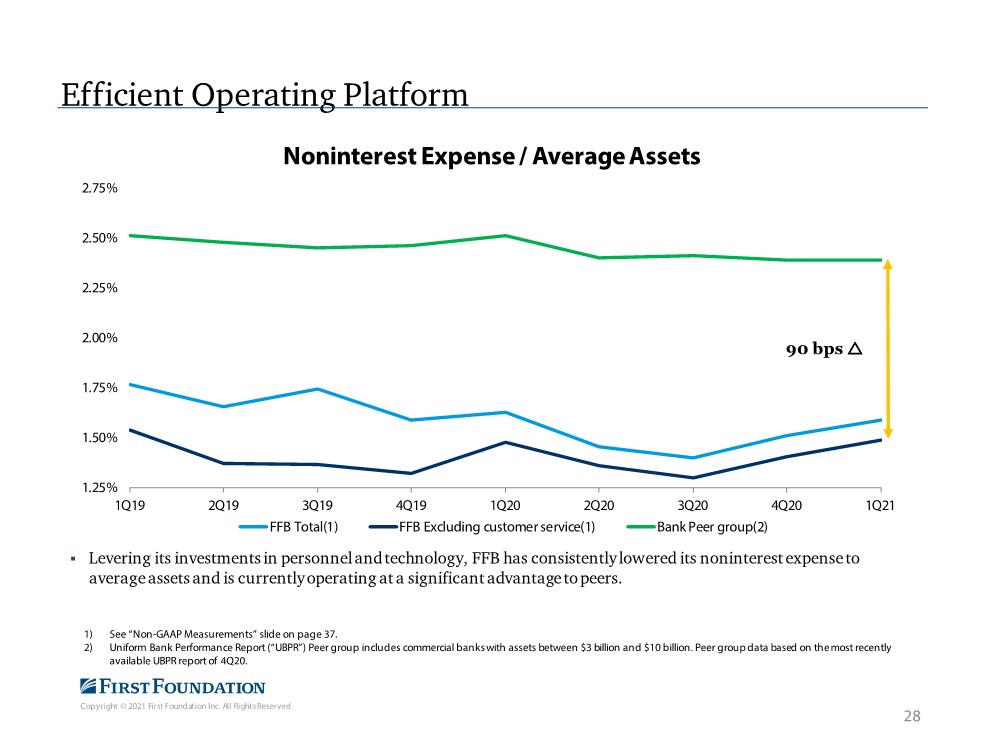
| Copyright © 2021 First Foundation Inc. All Rights Reserved Efficient Operating Platform . Levering its investments in personnel and technology, FFB has consistently lowered its noninterest expense to average assets and is currently operating at a significant advantage to peers. 90 bps 1) See “Non-GAAP Measurements” slide on page 37. 2) Uniform Bank Performance Report (“UBPR”) Peer group includes commercial banks with assets between $3 billion and $10 billion. Peer group data based on the most recently available UBPR report of 4Q20. 28 1.25% 1.50% 1.75% 2.00% 2.25% 2.50% 2.75% 1Q19 2Q19 3Q19 4Q19 1Q20 2Q20 3Q20 4Q20 1Q21 Noninterest Expense / Average Assets FFB Total(1) FFB Excluding customer service(1) Bank Peer group(2) |
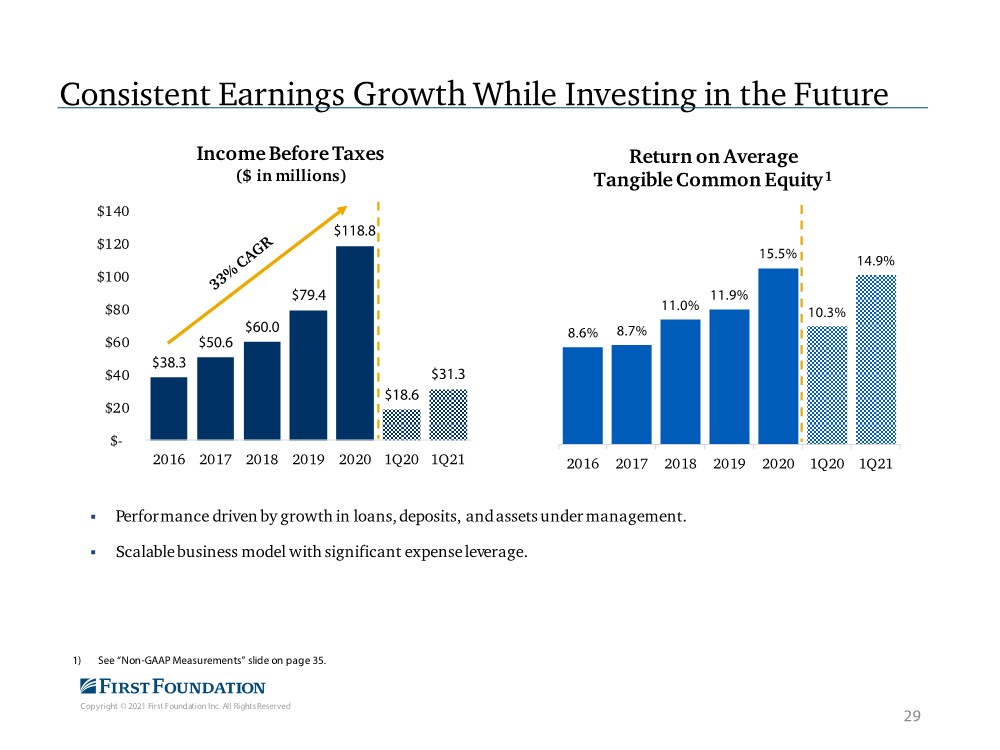
| Copyright © 2021 First Foundation Inc. All Rights Reserved Consistent Earnings Growth While Investing in the Future . Performance driven by growth in loans,deposits, andassets under management. . Scalable business model with significant expenseleverage. 1) See “Non-GAAP Measurements” slide on page 35. 29 $38.3 $50.6 $60.0 $79.4 $118.8 $18.6 $31.3 $- $20 $40 $60 $80 $100 $120 $140 2016 2017 2018 2019 2020 1Q20 1Q21 Income Before Taxes ($ in millions) 8.6% 8.7% 11.0% 11.9% 15.5% 10.3% 14.9% 2016 2017 2018 2019 2020 1Q20 1Q21 Return on Average Tangible Common Equity 1 |
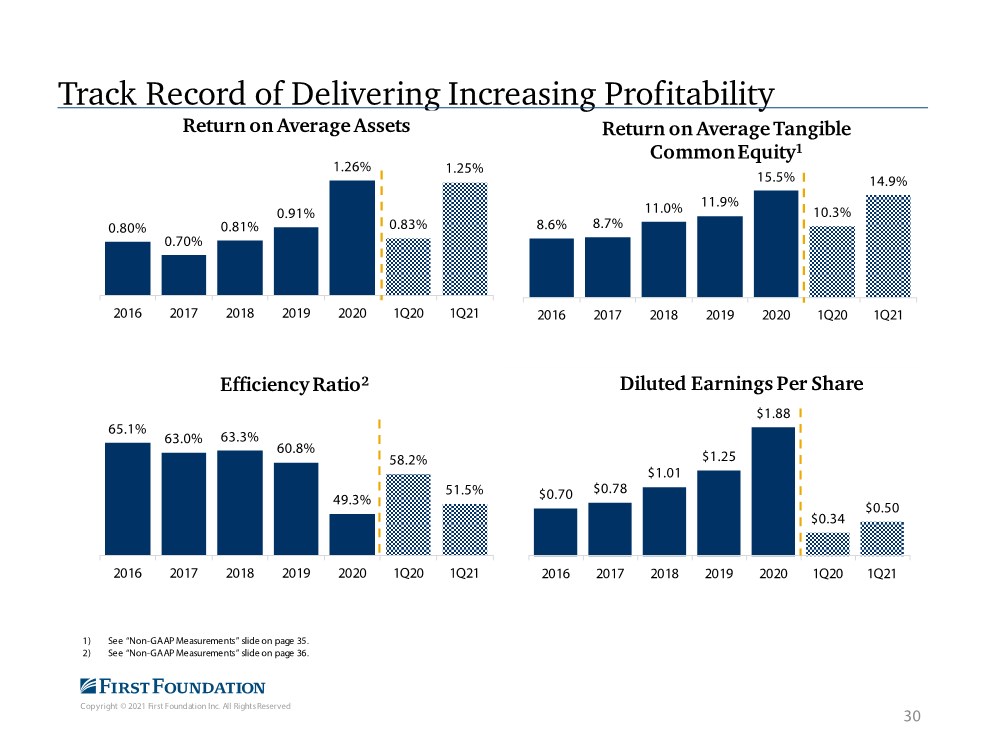
| Copyright © 2021 First Foundation Inc. All Rights Reserved Track Record of Delivering Increasing Profitability 30 1) See “Non-GAAP Measurements” slide on page 35. 2) See “Non-GAAP Measurements” slide on page 36. 0.80% 0.70% 0.81% 0.91% 1.26% 0.83% 1.25% 2016 2017 2018 2019 2020 1Q20 1Q21 Return on Average Assets 65.1% 63.0% 63.3% 60.8% 49.3% 58.2% 51.5% 2016 2017 2018 2019 2020 1Q20 1Q21 Efficiency Ratio2 8.6% 8.7% 11.0% 11.9% 15.5% 10.3% 14.9% 2016 2017 2018 2019 2020 1Q20 1Q21 Return on Average Tangible Common Equity1 $0.70 $0.78 $1.01 $1.25 $1.88 $0.34 $0.50 2016 2017 2018 2019 2020 1Q20 1Q21 Diluted Earnings Per Share |
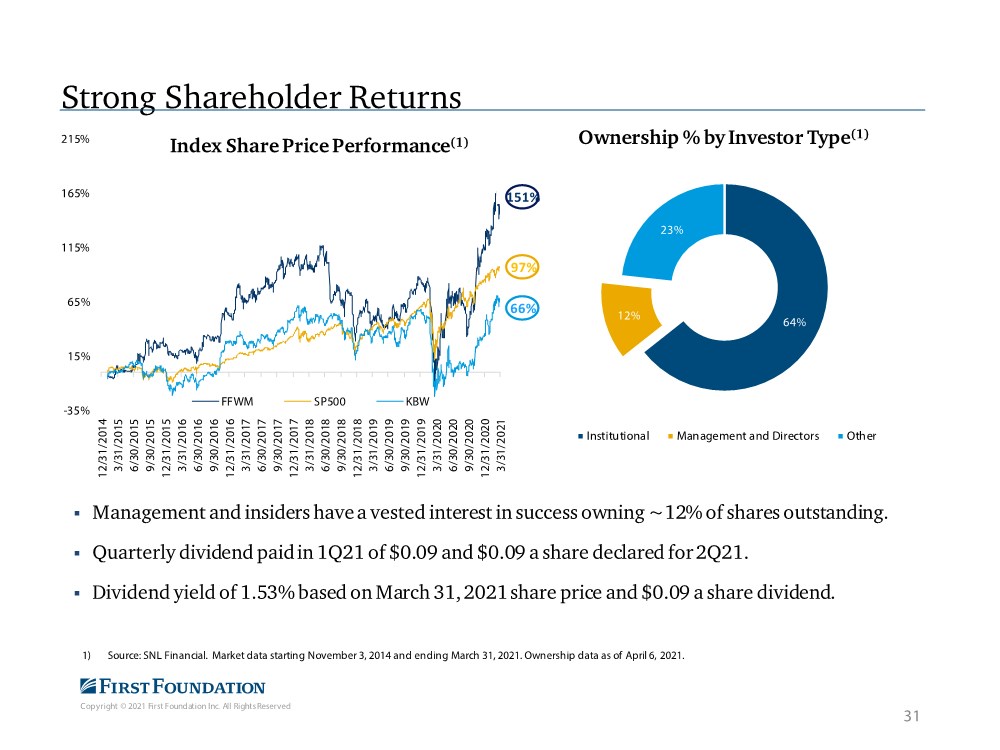
| Copyright © 2021 First Foundation Inc. All Rights Reserved -35% 15% 65% 115% 165% 215% 12/31/2014 3/31/2015 6/30/2015 9/30/2015 12/31/2015 3/31/2016 6/30/2016 9/30/2016 12/31/2016 3/31/2017 6/30/2017 9/30/2017 12/31/2017 3/31/2018 6/30/2018 9/30/2018 12/31/2018 3/31/2019 6/30/2019 9/30/2019 12/31/2019 3/31/2020 6/30/2020 9/30/2020 12/31/2020 3/31/2021 Index Share Price Performance(1) FFWM SP500 KBW Strong Shareholder Returns . Management and insiders have a vested interest in success owning ~12% of shares outstanding. . Quarterly dividend paid in 1Q21 of $0.09 and $0.09 a share declared for 2Q21. . Dividend yield of 1.53% based on March 31, 2021 share price and $0.09 a share dividend. 1) Source: SNL Financial. Market data starting November 3, 2014 and ending March 31, 2021. Ownership data as of April 6, 2021. 31 64% 12% 23% Ownership % by Investor Type(1) Institu tional Management and Directors Oth er 151% 97% 66% |
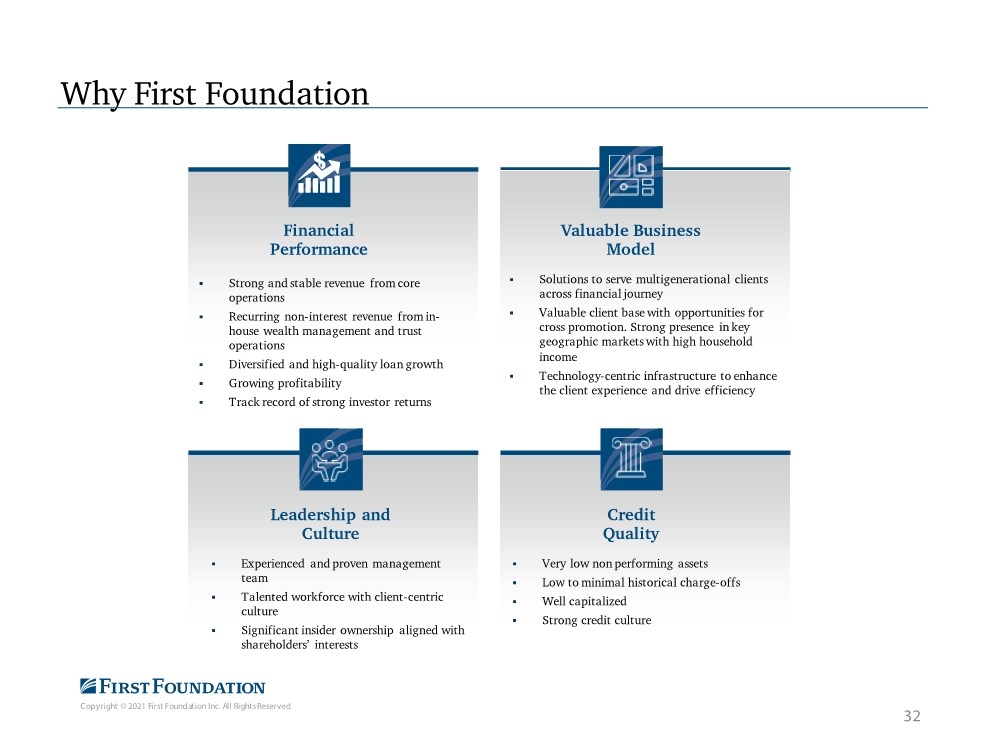
| Copyright © 2021 First Foundation Inc. All Rights Reserved Why First Foundation Financial Performance . Strong and stable revenue from core operations . Recurring non-interest revenue from in- house wealth management and trust operations . Diversified and high-quality loan growth . Growing profitability . Track record of strong investor returns Valuable Business Model . Solutions to serve multigenerational clients across financial journey . Valuable client base with opportunities for cross promotion. Strong presence in key geographic markets with high household income . Technology-centric infrastructure to enhance the client experience and drive efficiency Leadership and Culture . Experienced and proven management team . Talented workforce with client-centric culture . Significant insider ownership aligned with shareholders’ interests Credit Quality . Very low non performing assets . Low to minimal historical charge-offs . Well capitalized . Strong credit culture 32 |
| Copyright © 2021 First Foundation Inc. All Rights Reserved Appendix 33 |
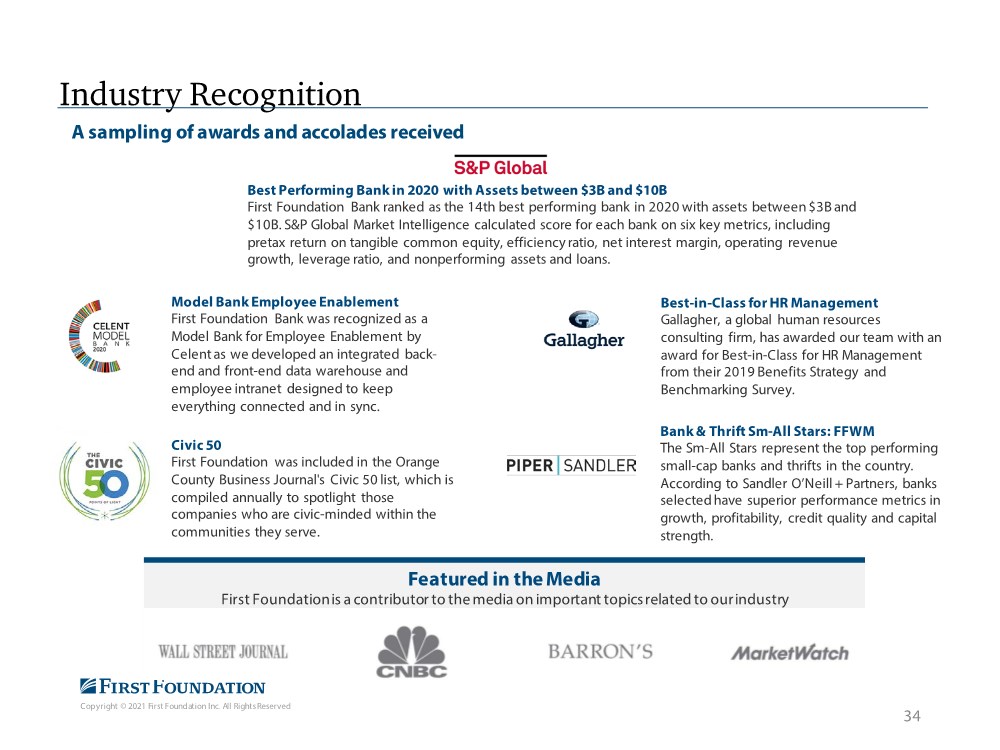
| Copyright © 2021 First Foundation Inc. All Rights Reserved A sampling of awards and accolades received 34 Model Bank Employee Enablement First Foundation Bank was recognized as a Model Bank for Employee Enablement by Celent as we developed an integrated back- end and front-end data warehouse and employee intranet designed to keep everything connected and in sync. Civic 50 First Foundation was included in the Orange County Business Journal's Civic 50 list, which is compiled annually to spotlight those companies who are civic-minded within the communities they serve. Best-in-Class for HR Management Gallagher, a global human resources consulting firm, has awarded our team with an award for Best-in-Class for HR Management from their 2019 Benefits Strategy and Benchmarking Survey. Bank & Thrift Sm-All Stars: FFWM The Sm-All Stars represent the top performing small-cap banks and thrifts in the country. According to Sandler O’Neill + Partners, banks selected have superior performance metrics in growth, profitability, credit quality and capital strength. Featured in the Media First Foundation is a contributor to the media on important topics related to our industry Industry Recognition Best Performing Bank in 2020 with Assets between $3B and $10B First Foundation Bank ranked as the 14th best performing bank in 2020 with assets between $3B and $10B. S&P Global Market Intelligence calculated score for each bank on six key metrics, including pretax return on tangible common equity, efficiency ratio, net interest margin, operating revenue growth, leverage ratio, and nonperforming assets and loans. |
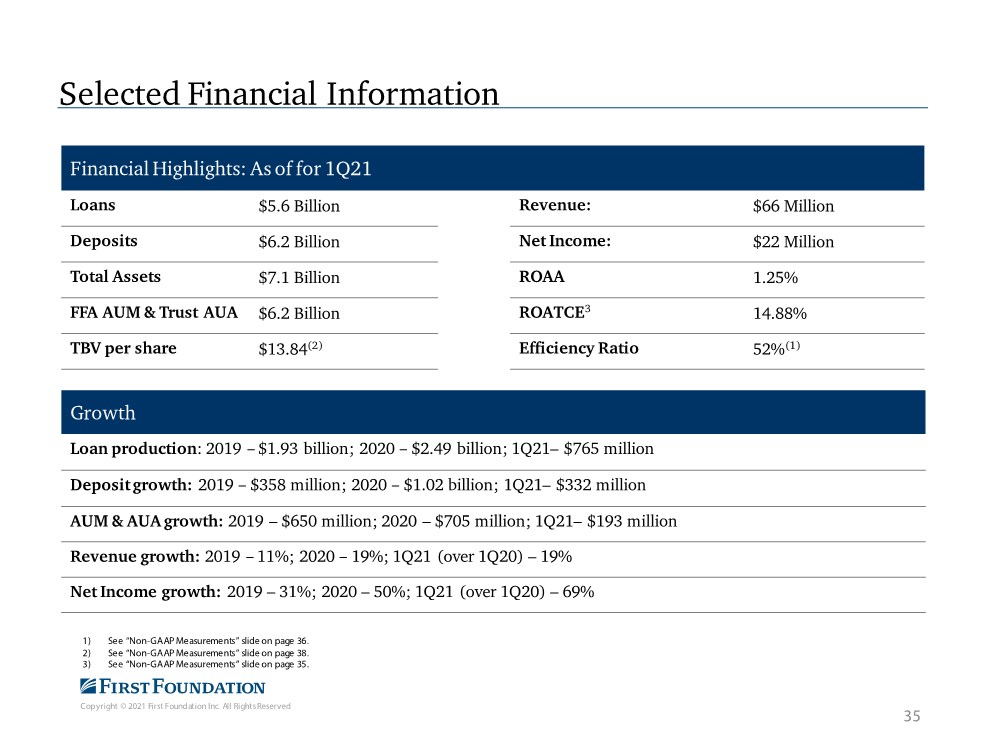
| Copyright © 2021 First Foundation Inc. All Rights Reserved Selected Financial Information Financial Highlights: As of for 1Q21 Loans $5.6 Billion Revenue: $66 Million Deposits $6.2 Billion Net Income: $22 Million Total Assets $7.1 Billion ROAA 1.25% FFA AUM & Trust AUA $6.2 Billion ROATCE3 14.88% TBV per share $13.84(2) Efficiency Ratio 52%(1) Growth Loan production: 2019 – $1.93 billion; 2020 – $2.49 billion; 1Q21– $765 million Depositgrowth: 2019 – $358 million; 2020 – $1.02 billion; 1Q21– $332 million AUM & AUA growth: 2019 – $650 million; 2020 – $705 million; 1Q21– $193 million Revenue growth: 2019 – 11%; 2020 – 19%; 1Q21 (over 1Q20) – 19% Net Income growth: 2019 – 31%; 2020 – 50%; 1Q21 (over 1Q20) – 69% 1) See “Non-GAAP Measurements” slide on page 36. 2) See “Non-GAAP Measurements” slide on page 38. 3) See “Non-GAAP Measurements” slide on page 35. 35 |
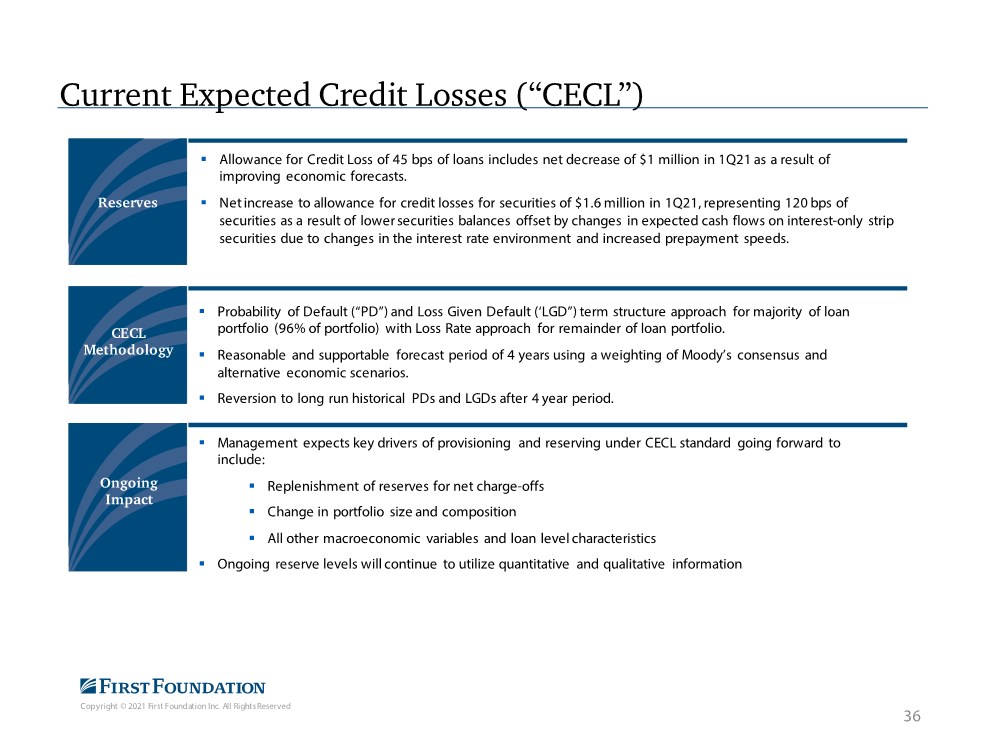
| Copyright © 2021 First Foundation Inc. All Rights Reserved . Allowance for Credit Loss of 45 bps of loans includes net decrease of $1 million in 1Q21 as a result of improving economic forecasts. . Net increase to allowance for credit losses for securities of $1.6 million in 1Q21, representing 120 bps of securities as a result of lower securities balances offset by changes in expected cash flows on interest-only strip securities due to changes in the interest rate environment and increased prepayment speeds. . Probability of Default (“PD”) and Loss Given Default (‘LGD”) term structure approach for majority of loan portfolio (96% of portfolio) with Loss Rate approach for remainder of loan portfolio. . Reasonable and supportable forecast period of 4 years using a weighting of Moody’s consensus and alternative economic scenarios. . Reversion to long run historical PDs and LGDs after 4 year period. . Management expects key drivers of provisioning and reserving under CECL standard going forward to include: . Replenishment of reserves for net charge-offs . Change in portfolio size and composition . All other macroeconomic variables and loan level characteristics . Ongoing reserve levels will continue to utilize quantitative and qualitative information CECL Methodology Reserves Ongoing Impact 36 Current Expected Credit Losses (“CECL”) |
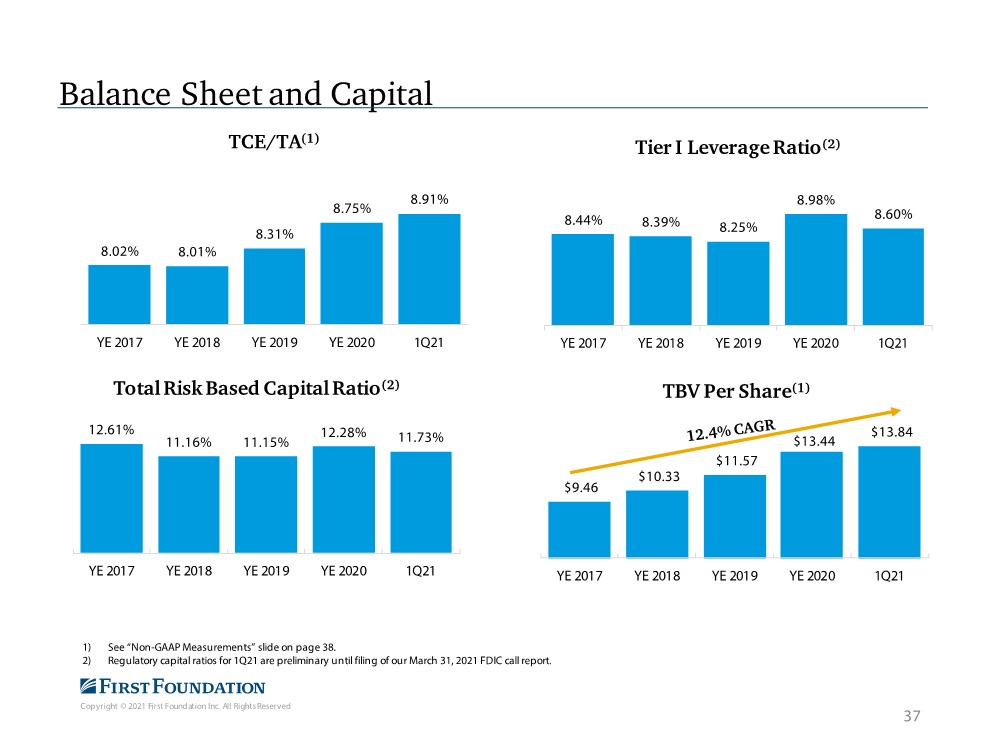
| Copyright © 2021 First Foundation Inc. All Rights Reserved Balance Sheet and Capital 1) See “Non-GAAP Measurements” slide on page 38. 2) Regulatory capital ratios for 1Q21 are preliminary until filing of our March 31, 2021 FDIC call report. 37 $9.46 $10.33 $11.57 $13.44 $13.84 YE 2017 YE 2018 YE 2019 YE 2020 1Q21 TBV Per Share(1) 8.02% 8.01% 8.31% 8.75% 8.91% YE 2017 YE 2018 YE 2019 YE 2020 1Q21 TCE/TA(1) 8.44% 8.39% 8.25% 8.98% 8.60% YE 2017 YE 2018 YE 2019 YE 2020 1Q21 Tier I Leverage Ratio(2) 12.61% 11.16% 11.15% 12.28% 11.73% YE 2017 YE 2018 YE 2019 YE 2020 1Q21 Total Risk Based Capital Ratio(2) |
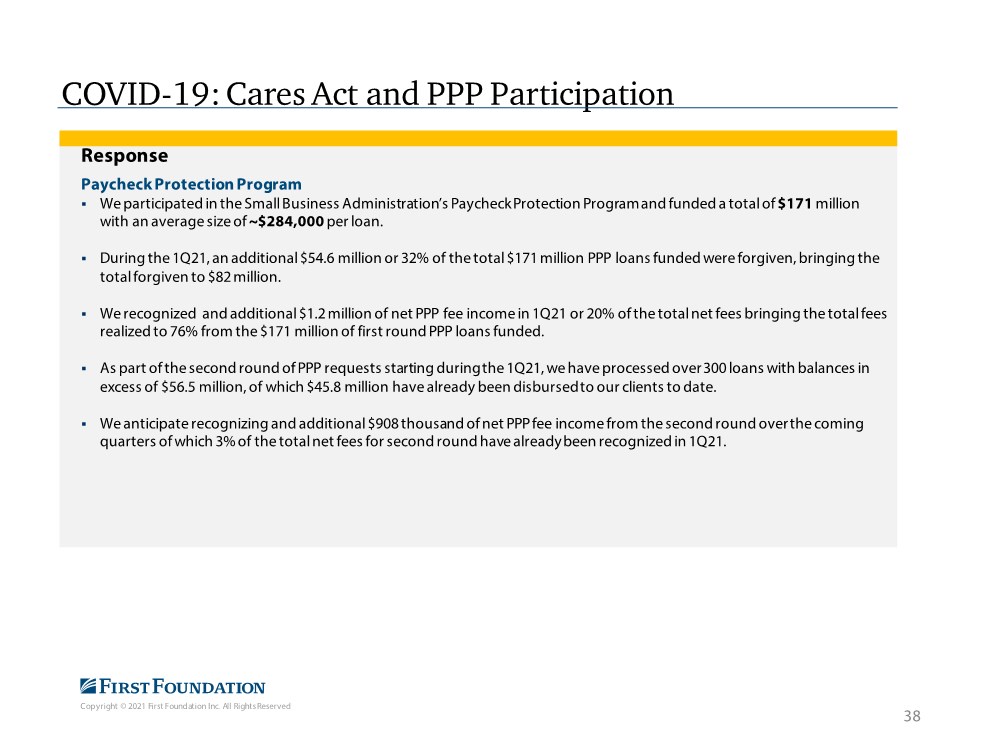
| Copyright © 2021 First Foundation Inc. All Rights Reserved COVID-19: Cares Act and PPP Participation 38 Response Paycheck Protection Program . We participated in the Small Business Administration’s Paycheck Protection Program and funded a total of $171million with an average size of ~$284,000per loan. . During the 1Q21, an additional $54.6 million or 32% of the total $171 million PPP loans funded were forgiven, bringing the total forgiven to $82 million. . We recognized and additional $1.2 million of net PPP fee income in 1Q21 or 20% of the total net fees bringing the total fees realized to 76% from the $171 million of first round PPP loans funded. . As part of the second round of PPP requests starting during the 1Q21, we have processed over 300 loans with balances in excess of $56.5 million, of which $45.8 million have already been disbursed to our clients to date. . We anticipate recognizing and additional $908 thousand of net PPP fee income from the second round over the coming quarters of which 3% of the total net fees for second round have already been recognized in 1Q21. |
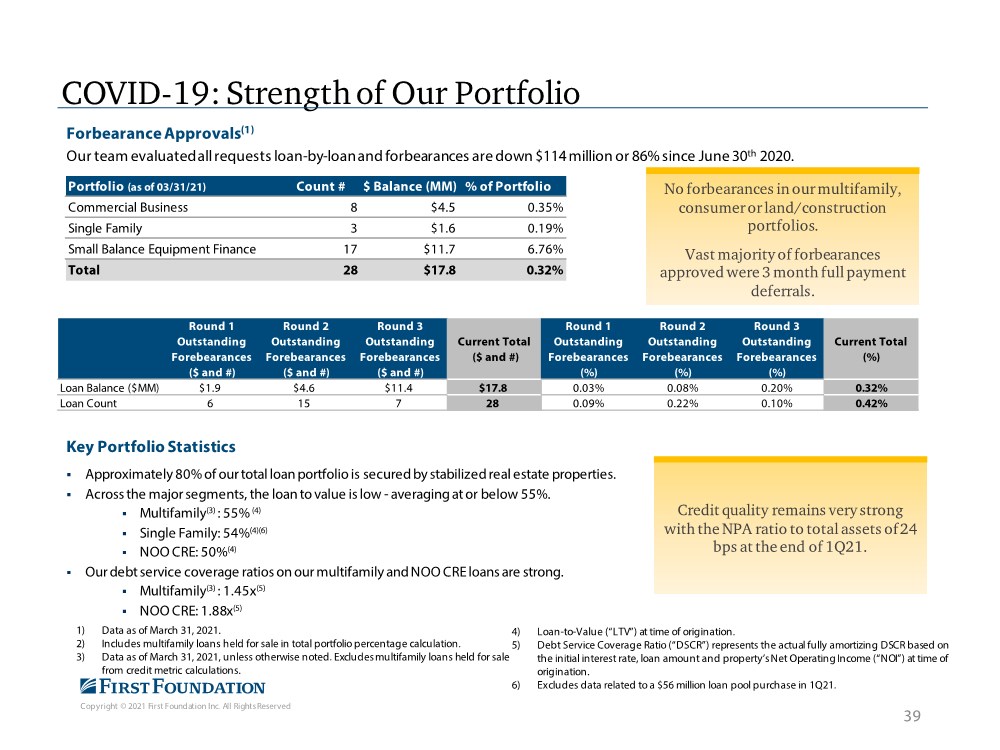
| Copyright © 2021 First Foundation Inc. All Rights Reserved COVID-19: Strength of Our Portfolio 39 Forbearance Approvals(1) Our team evaluated all requests loan-by-loan and forbearances are down $114 million or 86% since June 30th 2020. Key Portfolio Statistics . Approximately 80% of our total loan portfolio is secured by stabilized real estate properties. . Across the major segments, the loan to value is low - averaging at or below 55%. . Multifamily(3) : 55% (4) . Single Family: 54%(4)(6) . NOO CRE: 50%(4) . Our debt service coverage ratios on our multifamily and NOO CRE loans are strong. . Multifamily(3) : 1.45x(5) . NOO CRE: 1.88x(5) 1) Data as of March 31, 2021. 2) Includes multifamily loans held for sale in total portfolio percentage calculation. 3) Data as of March 31, 2021, unless otherwise noted. Excludes multifamily loans held for sale from credit metric calculations. 4) Loan-to-Value (“LTV”) at time of origination. 5) Debt Service Coverage Ratio (“DSCR”) represents the actual fully amortizing DSCR based on the initial interest rate, loan amount and property’s Net Operating Income (“NOI”) at time of origination. 6) Excludes data related to a $56 million loan pool purchase in 1Q21. Credit quality remains very strong with the NPA ratio to total assets of 24 bps at the end of 1Q21. No forbearances in our multifamily, consumer or land/construction portfolios. Vast majority of forbearances approved were 3 month full payment deferrals. Portfolio (as of 03/31/21) Count # $ Balance (MM) % of Portfolio Commercial Business 8 $4.5 0.35% Single Family 3 $1.6 0.19% Small Balance Equipment Finance 17 $11.7 6.76% Total 28 $17.8 0.32% Round 1 Outstanding Forebearances ($ and #) Round 2 Outstanding Forebearances ($ and #) Round 3 Outstanding Forebearances ($ and #) Current Total ($ and #) Round 1 Outstanding Forebearances (%) Round 2 Outstanding Forebearances (%) Round 3 Outstanding Forebearances (%) Current Total (%) Loan Balance ($MM) $1.9 $4.6 $11.4 $17.8 0.03% 0.08% 0.20% 0.32% Loan Count 6 15 7 28 0.09% 0.22% 0.10% 0.42% |
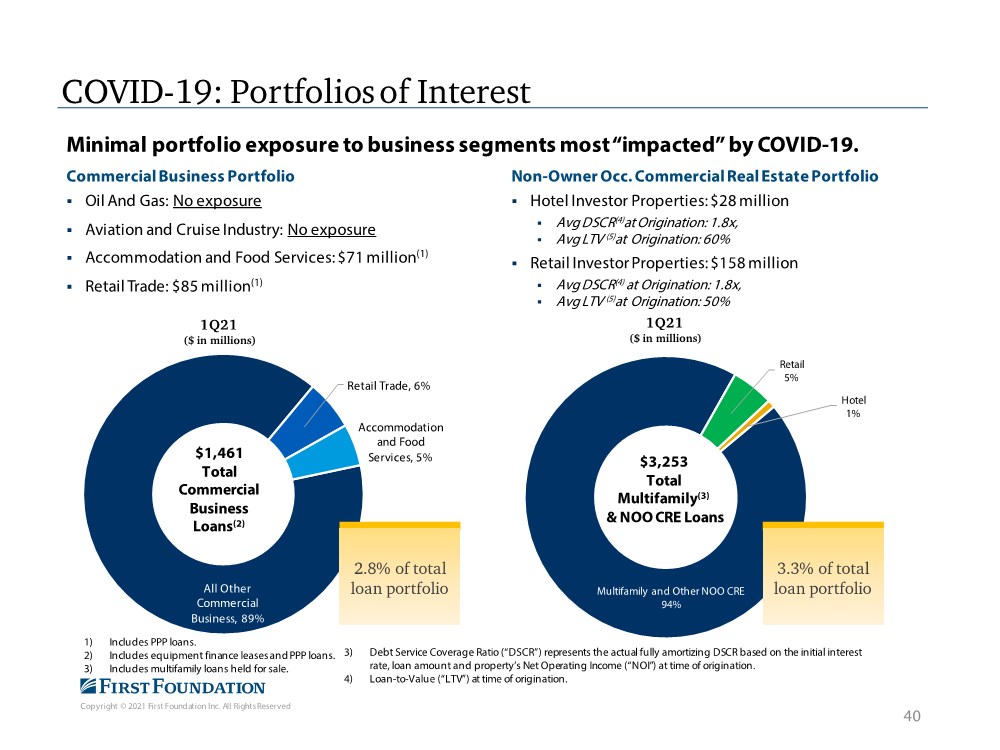
| Copyright © 2021 First Foundation Inc. All Rights Reserved COVID-19: Portfolios of Interest 40 Minimal portfolio exposure to business segments most “impacted” by COVID-19. Commercial Business Portfolio . Oil And Gas: No exposure . Aviation and Cruise Industry: No exposure . Accommodation and Food Services: $71 million(1) . Retail Trade: $85 million(1) Non-Owner Occ. Commercial Real Estate Portfolio . Hotel Investor Properties: $28 million . Avg DSCR(4)at Origination: 1.8x, . Avg LTV (5)at Origination: 60% . Retail Investor Properties: $158 million . Avg DSCR(4) at Origination: 1.8x, . Avg LTV (5)at Origination: 50% All Other Commercial Business, 89% Retail Trade, 6% Accommodation and Food Services, 5% 1Q21 ($ in millions) Multifamily and Other NOO CRE 94% Retail 5% Hotel 1% 1Q21 ($ in millions) $3,253 Total Multifamily(3) & NOO CRE Loans 3.3% of total loan portfolio 2.8% of total loan portfolio $1,461 Total Commercial Business Loans(2) 1) Includes PPP loans. 2) Includes equipment finance leases and PPP loans. 3) Includes multifamily loans held for sale. 3) Debt Service Coverage Ratio (“DSCR”) represents the actual fully amortizing DSCR based on the initial interest rate, loan amount and property’s Net Operating Income (“NOI”) at time of origination. 4) Loan-to-Value (“LTV”) at time of origination. |
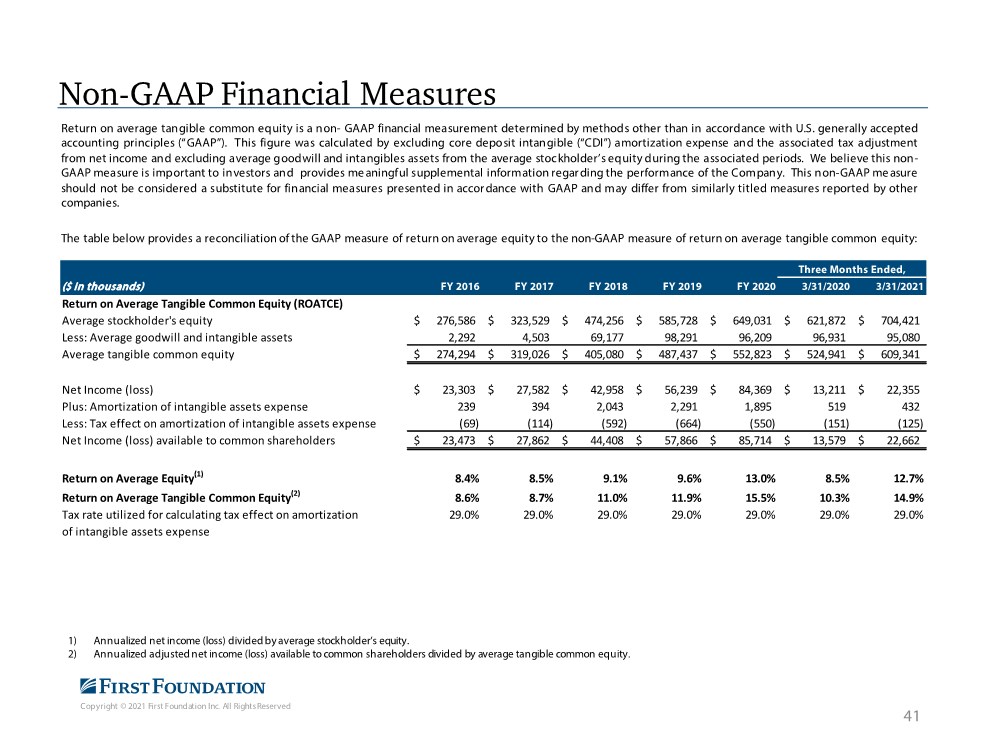
| Copyright © 2021 First Foundation Inc. All Rights Reserved Non-GAAP Financial Measures 41 1) Annualized net income (loss) divided by average stockholder’s equity. 2) Annualized adjusted net income (loss) available to common shareholders divided by average tangible common equity. Return on average tangible common equity is a non- GAAP financial measurement determined by methods other than in accordance with U.S. generally accepted accounting principles (“GAAP”). This figure was calculated by excluding core deposit intangible (“CDI”) amortization expense and the associated tax adjustment from net income and excluding average goodwill and intangibles assets from the average stockholder’s equity during the associated periods. We believe this non- GAAP measure is important to investors and provides me aningful supplemental information regar ding the performance of the Company. This non-GAAP me asure should not be considered a substitute for financial measures presented in accordance with GAAP and may differ from similarly titled measures reported by other companies. The table below provides a reconciliationof the GAAP measure of returnon average equity to the non-GAAP measure of returnon average tangible common equity: Three Months Ended, ($ in thousands) FY 2016 FY 2017 FY 2018 FY 2019 FY 2020 3/31/2020 3/31/2021 Return on Average Tangible Common Equity (ROATCE) Average stockholder's equity 276,586 $ 323,529 $ 474,256 $ 585,728 $ 649,031 $ 621,872 $ 704,421 $ Less: Average goodwill and intangible assets 2,292 4,503 69,177 98,291 96,209 96,931 95,080 Average tangible common equity 274,294 $ 319,026 $ 405,080 $ 487,437 $ 552,823 $ 524,941 $ 609,341 $ Net Income (loss) 23,303 $ 27,582 $ 42,958 $ 56,239 $ 84,369 $ 13,211 $ 22,355 $ Plus: Amortization of intangible assets expense 239 394 2,043 2,291 1,895 519 432 Less: Tax effect on amortization of intangible assets expense (69) (114) (592) (664) (550) (151) (125) Net Income (loss) available to common shareholders 23,473 $ 27,862 $ 44,408 $ 57,866 $ 85,714 $ 13,579 $ 22,662 $ Return on Average Equity(1) 8.4% 8.5% 9.1% 9.6% 13.0% 8.5% 12.7% Return on Average Tangible Common Equity(2) 8.6% 8.7% 11.0% 11.9% 15.5% 10.3% 14.9% Tax rate utilized for calculating tax effect on amortization 29.0% 29.0% 29.0% 29.0% 29.0% 29.0% 29.0% of intangible assets expense |
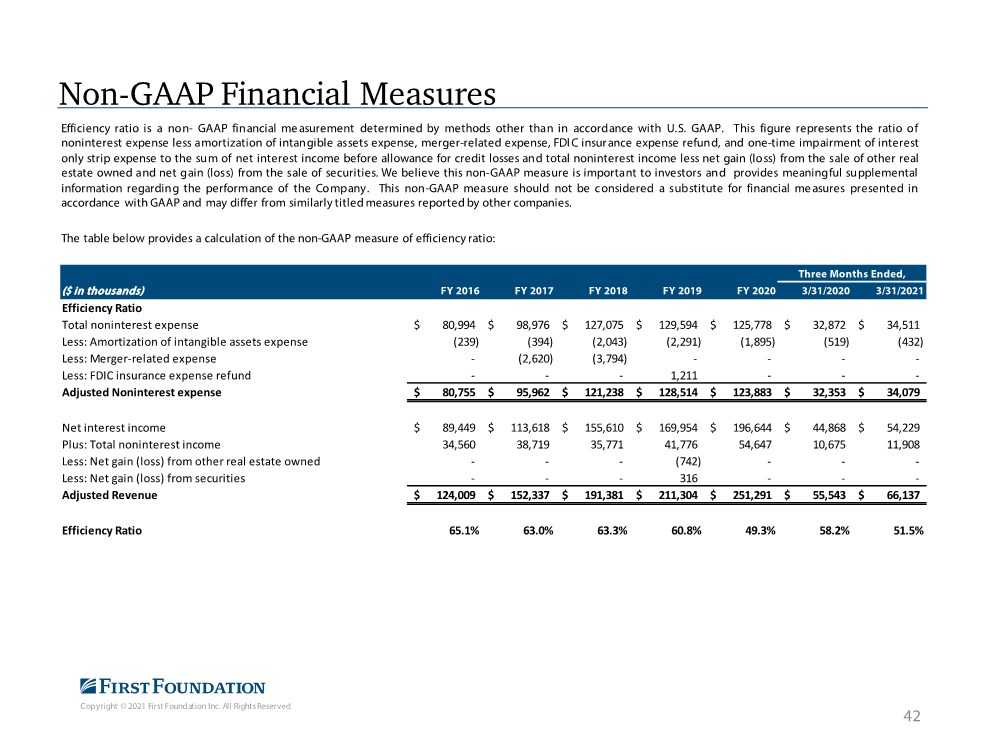
| Copyright © 2021 First Foundation Inc. All Rights Reserved Non-GAAP Financial Measures 42 Efficiency ratio is a non- GAAP financial me asurement determined by methods other than in accordance with U.S. GAAP. This figure represents the ratio of noninterest expense less amortization of intangible assets expense, merger-related expense, FDI C insur ance expense refund, and one-time impairment of interest only strip expense to the sum of net interest income before allowance for credit losses and total noninterest income less net gain (loss) from the sale of other real estate owned and net gain (loss) from the sale of securities. We believe this non-GAAP measure is important to investors and provides meaningful supplemental information regarding the performance of the Company. This non-GAAP measure should not be considered a substitute for financial me asures presented in accordance with GAAP and may differ from similarlytitledmeasures reportedby other companies. The table below provides a calculation of the non-GAAP measure of efficiency ratio: Three Months Ended, ($ in thousands) FY 2016 FY 2017 FY 2018 FY 2019 FY 2020 3/31/2020 3/31/2021 Efficiency Ratio Total noninterest expense 80,994 $ 98,976 $ 127,075 $ 129,594 $ 125,778 $ 32,872 $ 34,511 $ Less: Amortization of intangible assets expense (239) (394) (2,043) (2,291) (1,895) (519) (432) Less: Merger-related expense - (2,620) (3,794) - - - - Less: FDIC insurance expense refund - - - 1,211 - - - Adjusted Noninterest expense 80,755 $ 95,962 $ 121,238 $ 128,514 $ 123,883 $ 32,353 $ 34,079 $ Net interest income 89,449 $ 113,618 $ 155,610 $ 169,954 $ 196,644 $ 44,868 $ 54,229 $ Plus: Total noninterest income 34,560 38,719 35,771 41,776 54,647 10,675 11,908 Less: Net gain (loss) from other real estate owned - - - (742) - - - Less: Net gain (loss) from securities - - - 316 - - - Adjusted Revenue 124,009 $ 152,337 $ 191,381 $ 211,304 $ 251,291 $ 55,543 $ 66,137 $ Efficiency Ratio 65.1% 63.0% 63.3% 60.8% 49.3% 58.2% 51.5% |
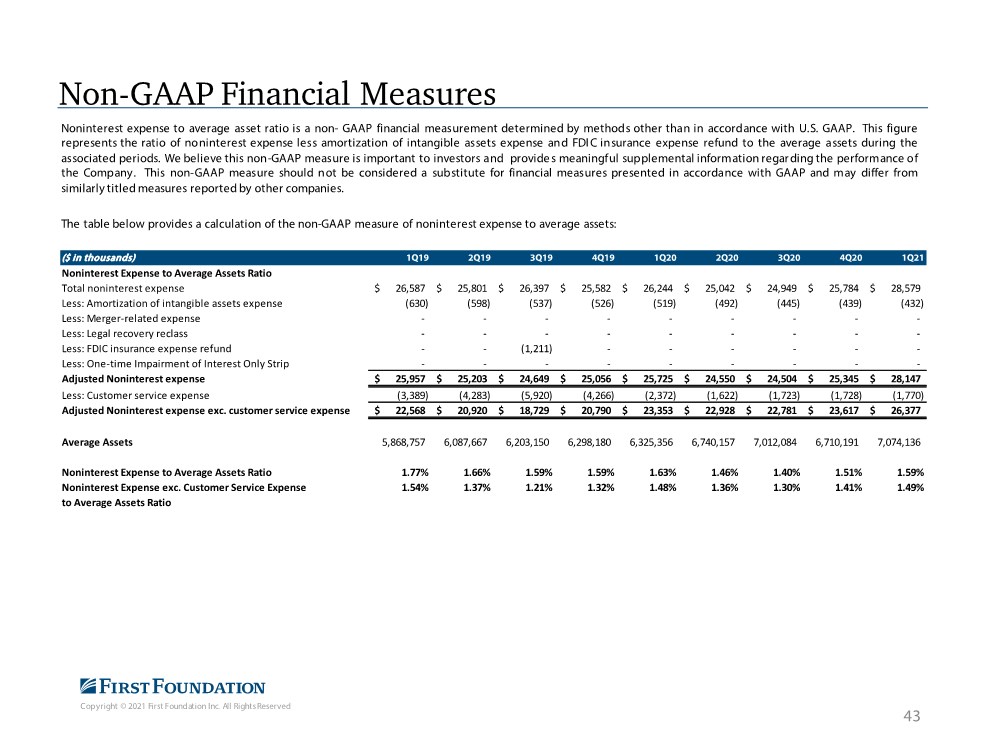
| Copyright © 2021 First Foundation Inc. All Rights Reserved Non-GAAP Financial Measures 43 Noninterest expense to average asset ratio is a non- GAAP financial measurement determined by methods other than in accordance with U.S. GAAP. This figure represents the ratio of noninterest expense less amortization of intangible assets expense and FDI C insurance expense refund to the average assets during the associated periods. We believe this non-GAAP measure is important to investors and provide s meaningful supplemental informationregar ding the performance of the Company. This non-GAAP measure should not be considered a substitute for financial measures presented in accordance with GAAP and may differ from similarlytitledmeasures reportedby other companies. The table below provides a calculation of the non-GAAP measure of noninterest expense to average assets: ($ in thousands) 1Q19 2Q19 3Q19 4Q19 1Q20 2Q20 3Q20 4Q20 1Q21 Noninterest Expense to Average Assets Ratio Total noninterest expense 26,587 $ 25,801 $ 26,397 $ 25,582 $ 26,244 $ 25,042 $ 24,949 $ 25,784 $ 28,579 $ Less: Amortization of intangible assets expense (630) (598) (537) (526) (519) (492) (445) (439) (432) Less: Merger-related expense - - - - - - - - - Less: Legal recovery reclass - - - - - - - - - Less: FDIC insurance expense refund - - (1,211) - - - - - - Less: One-time Impairment of Interest Only Strip - - - - - - - - - Adjusted Noninterest expense 25,957 $ 25,203 $ 24,649 $ 25,056 $ 25,725 $ 24,550 $ 24,504 $ 25,345 $ 28,147 $ Less: Customer service expense (3,389) (4,283) (5,920) (4,266) (2,372) (1,622) (1,723) (1,728) (1,770) Adjusted Noninterest expense exc. customer service expense 22,568 $ 20,920 $ 18,729 $ 20,790 $ 23,353 $ 22,928 $ 22,781 $ 23,617 $ 26,377 $ Average Assets 5,868,757 6,087,667 6,203,150 6,298,180 6,325,356 6,740,157 7,012,084 6,710,191 7,074,136 Noninterest Expense to Average Assets Ratio 1.77% 1.66% 1.59% 1.59% 1.63% 1.46% 1.40% 1.51% 1.59% Noninterest Expense exc. Customer Service Expense 1.54% 1.37% 1.21% 1.32% 1.48% 1.36% 1.30% 1.41% 1.49% to Average Assets Ratio |
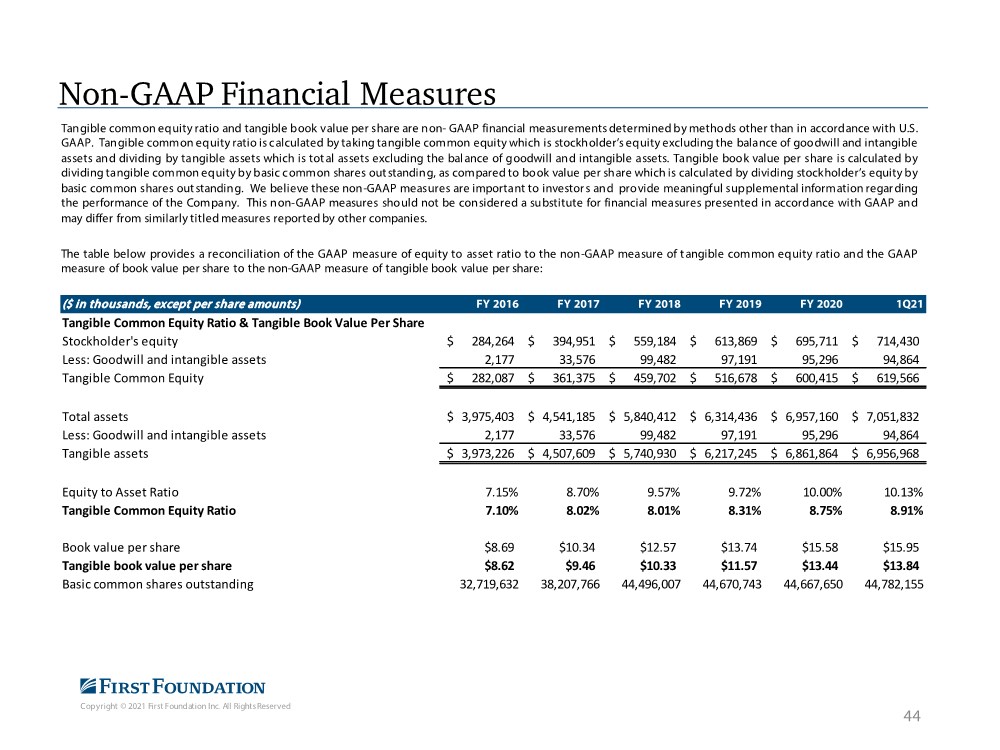
| Copyright © 2021 First Foundation Inc. All Rights Reserved Non-GAAP Financial Measures 44 Tangible common equity ratio and tangible book value per share are non- GAAP financial measurementsdeterminedbymethods other than in accordance with U.S. GAAP. Tangible common equity ratio iscalculated by taking tangible common equity which is stockholder’s equity excluding the balance of goodwill and intangible assets and dividing by tangible assets which is tot al assets excluding the bal ance of goodwill and intangible assets. Tangible book value per share is calculated by dividingtangible common equity bybasic common shares out standing, as compared to book value per share which is calculated by dividing stockholder’s equity by basic common shares out standing. We believe these non-GAAP measures are important to investor s and provide meaningful supplemental informationregar ding the performance of the Company. This non-GAAP measures should not be considered a substitute for financial measures presented in accordance with GAAP and may differ from similarlytitledmeasures reportedby other companies. The table below provides a reconciliation of the GAAP measure of equity to asset ratio to the non-GAAP measure of t angible common equity ratio and the GAAP measure of book value per share to the non-GAAP measure of tangible book value per share: ($ in thousands, except per share amounts) FY 2016 FY 2017 FY 2018 FY 2019 FY 2020 1Q21 Tangible Common Equity Ratio & Tangible Book Value Per Share Stockholder's equity 284,264 $ 394,951 $ 559,184 $ 613,869 $ 695,711 $ 714,430 $ Less: Goodwill and intangible assets 2,177 33,576 99,482 97,191 95,296 94,864 Tangible Common Equity 282,087 $ 361,375 $ 459,702 $ 516,678 $ 600,415 $ 619,566 $ Total assets 3,975,403 $ 4,541,185 $ 5,840,412 $ 6,314,436 $ 6,957,160 $ 7,051,832 $ Less: Goodwill and intangible assets 2,177 33,576 99,482 97,191 95,296 94,864 Tangible assets 3,973,226 $ 4,507,609 $ 5,740,930 $ 6,217,245 $ 6,861,864 $ 6,956,968 $ Equity to Asset Ratio 7.15% 8.70% 9.57% 9.72% 10.00% 10.13% Tangible Common Equity Ratio 7.10% 8.02% 8.01% 8.31% 8.75% 8.91% Book value per share $8.69 $10.34 $12.57 $13.74 $15.58 $15.95 Tangible book value per share $8.62 $9.46 $10.33 $11.57 $13.44 $13.84 Basic common shares outstanding 32,719,632 38,207,766 44,496,007 44,670,743 44,667,650 44,782,155 |
| Copyright © 2021 First Foundation Inc. All Rights Reserved firstfoundationinc.com |