Attached files
| file | filename |
|---|---|
| EX-23.1 - EX-23.1 - First Foundation Inc. | ffwm-ex231_8.htm |
| EX-32.2 - EX-32.2 - First Foundation Inc. | ffwm-ex322_7.htm |
| EX-31.1 - EX-31.1 - First Foundation Inc. | ffwm-ex311_9.htm |
| EX-21.1 - EX-21.1 - First Foundation Inc. | ffwm-ex211_6.htm |
| EX-32.1 - EX-32.1 - First Foundation Inc. | ffwm-ex321_10.htm |
| EX-31.2 - EX-31.2 - First Foundation Inc. | ffwm-ex312_11.htm |
| EX-10.4 - EX-10.4 - First Foundation Inc. | ffwm-ex104_716.htm |
| EX-10.5 - EX-10.5 - First Foundation Inc. | ffwm-ex105_717.htm |
UNITED STATES
SECURITIES AND EXCHANGE COMMISSION
Washington, D.C. 20549
FORM 10-K
ANNUAL REPORT PURSUANT TO SECTION 13 OR 15(d) OF
THE SECURITIES EXCHANGE ACT OF 1934
For the fiscal year ended December 31, 2015
Commission file number: 001-36461
FIRST FOUNDATION INC.
(Exact name of registrant as specified in its charter)
|
Delaware |
|
20-8639702 |
|
(State or other jurisdiction of incorporation or organization) |
|
(I.R.S. Employer Identification No.) |
|
18101 Von Karman Avenue, Suite 700 Irvine, CA 92612 |
|
92612 |
|
(Address of principal executive offices) |
|
(Zip Code) |
(949) 202-4160
(Registrant’s telephone number, including area code)
Securities registered pursuant to Section 12(b) of the Act:
|
Common Stock, par value $0.001 per share |
|
NASDAQ Global Stock Market |
|
(Title of each class) |
|
(Name of exchange on which registered) |
Securities registered pursuant to Section 12(g) of the Act: None
Indicate by check mark if the registrant is a well-known seasoned issuer, as defined in Rule 405 of the Securities Act. Yes ¨ No x.
Indicate by check mark if the registrant is not required to file reports pursuant to Section 13 or Section 15(d) of the Act. Yes ¨ No x.
Indicate by check mark whether the registrant (1) has filed all reports required to be filed by Section 13 or 15(d) of the Securities Exchange Act of 1934 during the preceding 12 months (or for such shorter period that the registrant was required to file such reports); and (2) has been subject to such filing requirements for the past 90 days. Yes x No ¨
Indicate by check mark whether the registrant has submitted electronically and posted on its corporate website, if any, every Interactive Data File required to be submitted and posted pursuant to Rule 405 of Regulation S-T during the preceding 12 months (or for such shorter period that the registrant was required to submit and post such files). Yes x No ¨
Indicate by check mark if disclosure of delinquent filers pursuant to Item 405 of Regulation S-K is not contained herein, and will not be contained, to the best of registrant’s knowledge, in definitive proxy or information statements incorporated by reference in Part III of this Form 10-K or any amendment to this Form 10-K. ¨
Indicate by check mark whether the registrant is a large accelerated filer, an accelerated filer, a non-accelerated filer or a smaller reporting company. See definitions of “large accelerated filer” and “accelerated filer” and “smaller reporting company” in Rule 12b-2 of the Exchange Act. (Check one):
|
¨ Large accelerated filer |
x Accelerated filer |
|
|
|
|
o Non-accelerated filer (Do not check if a smaller reporting company) |
o Smaller reporting company |
Indicate by check mark whether the registrant is a shell company (as defined in Rule 12b-2 of the Act). Yes ¨ No x
As of June 30, 2015, the aggregate market value of the common stock held by non-affiliates of the registrant, computed by reference to the average high and low sales prices on the NASDAQ Global Stock Market as of the close of business on June 30, 2015, was approximately $111 million.
As of March 11, 2016, there were 16,016,326 shares of registrant’s common stock outstanding.
DOCUMENTS INCORPORATED BY REFERENCE
None.
ANNUAL REPORT ON FORM 10-K
FOR THE YEAR ENDED DECEMBER 31, 2015
TABLE OF CONTENTS
|
|
|
Page No. |
||
|
|
ii |
|||
|
|
|
PART I |
|
|
|
Item 1 |
|
|
1 |
|
|
Item 1A |
|
|
20 |
|
|
Item 1B |
|
|
34 |
|
|
Item 2 |
|
|
34 |
|
|
Item 3 |
|
|
34 |
|
|
Item 4 |
|
|
34 |
|
|
|
|
PART II |
|
|
|
Item 5 |
|
|
35 |
|
|
Item 6 |
|
|
38 |
|
|
Item 7 |
|
Management’s Discussion and Analysis of Financial Condition and Results of Operations |
|
41 |
|
Item 8 |
|
|
66 |
|
|
Item 9 |
|
Changes in and Disagreements with Accountants on Accounting and Financial Disclosures |
|
106 |
|
Item 9A |
|
|
106 |
|
|
Item 9B |
|
|
109 |
|
|
|
|
PART III |
|
|
|
Item 10 |
|
|
110 |
|
|
Item 11 |
|
|
116 |
|
|
Item 12 |
|
Security Ownership of Certain Beneficial Owners and Management and Related Stockholder Matters |
|
126 |
|
Item 13 |
|
Certain Relationships and Related Transactions and Director Independence |
|
127 |
|
Item 14 |
|
|
128 |
|
|
|
|
PART IV |
|
|
|
Item 15 |
|
|
130 |
|
|
|
|
|
S-1 |
|
|
|
E-1 |
|||
i
In addition to historical information, this report contains forward-looking statements within the meaning of Section 27A of the Securities Act of 1933, as amended (the “Securities Act”) and Section 21E of the Securities Exchange Act of 1934, as amended (the “Exchange Act”). Forward-looking statements are those that predict or describe future events or trends or that do not relate solely to historical matters. However, our actual results and financial performance in the future will be affected by known and currently unknown risks, uncertainties and other factors that may cause our actual results or financial performance in the future to differ materially from the results or financial performance that may be expressed, predicted or implied by such forward-looking statements. Such risks, uncertainties and other factors include, among others, those set forth below in Item 1.A Risk Factors, and readers of this report are urged to read the cautionary statements contained in that section of this report. In some cases, you can identify forward-looking statements by words like “may,” “will,” “should,” “could,” “believes,” “intends,” “expects,” “anticipates,” “plans,” “estimates,” “predicts,” “potential,” “project” and “continue” and similar expressions. Readers of this report are cautioned not to place undue reliance on any forward-looking statements, which speak only as of the respective dates on which such statements were made and which are subject to risks, uncertainties and other factors that could cause actual results and the timing of certain events to differ materially from future results expressed or implied by such forward-looking statements.
First Foundation Inc. expressly disclaims any intent or any obligation to release publicly any revisions or updates to any of the forward-looking statements contained in this report to reflect events or circumstances after the date of this report or the occurrence of currently unanticipated events or developments or to conform such forward-looking statements to actual results or to changes in its opinions or expectations, except as may be required by applicable law.
ii
Overview
Unless we state otherwise or the context otherwise requires, references in this Annual Report on Form 10-K to “we,” “our,” and “us” refer to First Foundation Inc., a Delaware corporation, (“FFI” or the “Company”) and its consolidated subsidiaries, First Foundation Advisors (“FFA”) and First Foundation Bank (“FFB” or “Bank”), and FFB’s wholly owned subsidiary, First Foundation Insurance Services (“FFIS”).
We are a California based financial services company that provides a comprehensive platform of personalized financial services to high net-worth individuals and their families, family businesses and other affiliated organizations. We consider high net-worth individuals to be individuals with net worth, excluding their primary residence, of over $1.0 million. Our integrated platform provides investment management, wealth planning, consulting, trust, banking products and services, life insurance services and property and casualty insurance services to effectively and efficiently meet the financial needs of our clients. We have also established a lending platform that offers loans to individuals and entities that own and operate multifamily residential and commercial real estate properties. In addition, we provide business banking products and services to small to moderate-sized businesses and professional firms, and consumer banking products and services to individuals and families who would not be considered high net-worth. As of December 31, 2015, we had $3.47 billion of assets under management (or AUM), $2.59 billion of total assets, $1.77 billion of loans and $1.57 billion of deposits. Our investment management, wealth planning, consulting, and trust services provide us with substantial, fee-based, recurring revenues, such that in 2015, our non-interest income was 35% of our total revenues.
Our strategy is focused on expanding our strong and stable client relationships by delivering high quality, coordinated investment management, wealth planning, consulting, trust and banking products and services. We are able to maintain a client-focused approach by recruiting and retaining experienced and qualified staff, including highly qualified relationship managers, bankers and financial planners.
We intend to continue to grow our business by (i) cross-selling our services among our wealth management and banking clients; (ii) obtaining new client referrals from existing clients, attorney and accountant referral sources and through referral agreements with asset custodial firms; (iii) marketing our services directly to prospective new clients; (iv) adding experienced relationship managers and bankers who may have established client relationships that we can serve; (v) establishing de novo offices in select markets, both within and outside our existing market areas; and (vi) making opportunistic acquisitions of complementary businesses.
As a bank holding company, we are subject to regulation and examination by the Board of Governors of the Federal Reserve System (the “Federal Reserve Board” or “FRB”) and the Federal Reserve Bank of San Francisco (“FRBSF”) under delegated authority from the FRB. As an Federal Deposit Insurance Corporation (“FDIC”) insured, California state chartered bank, FFB is subject to regulation and examination by the FDIC and the California Department of Business Oversight (“DBO”). FFB also is a member of the Federal Home Loan Bank of San Francisco (“FHLB”), which provides it with a source of funds in the form of short-term and long-term borrowings. FFA is a registered investment adviser under the Investment Advisers Act of 1940, (“Investment Advisers Act”), and is subject to regulation by the Securities and Exchange Commission, (“SEC”), under that Act.
On October 28, 2015, we changed our state of incorporation from California to Delaware. Other than the change in corporate domicile, the reincorporation did not result in any change in the business, physical location, management, assets, liabilities or total shareholders’ equity of the Company, nor did it result in any change in location of the Company’s employees, including the Company’s management. Additionally, the reincorporation did not alter any shareholder’s percentage ownership interest or number of shares owned in the Company.
Our broad range of financial product and services are more consistent with those offered by larger financial institutions, while our high level of personalized service, accessibility and responsiveness to our clients are more typical of the services offered by boutique investment management firms and community banks. We believe this combination of an integrated platform of comprehensive financial services and products and personalized and responsive service differentiates us from many of our competitors and has contributed to the growth of our client base and our business.
Overview of Our Banking Business
FFB is engaged in private and commercial banking, offering a broad range of personal and business banking products and services and trust services to its clients. Its banking services include a variety of deposit products, including personal checking, savings and money market deposits and certificates of deposit, single family real estate loans, and consumer loans. FFB also provides
1
the convenience of online and other personal banking services to its clients. FFB’s business banking products and services include multifamily and commercial real estate loans, commercial term loans and lines of credit, transaction and other deposit accounts, online banking, mobile banking and enhanced business services. FFB has also established a lending platform that offers loans to individuals and entities who own and operate multifamily residential and commercial real estate properties. In addition, FFB provides its products and services to individuals and families who would not be considered high net-worth, small to moderate sized businesses and professional firms. FFIS was established to provide life, property and casualty agency insurance services as part of the platform of financial products and services. FFIS provides insurance risk management solutions to individuals, families and businesses. Clients are obtained through relationships/referrals from existing FFI clients and newly generated clients via prospecting. At December 31, 2015, FFB had $2.59 billion of total assets, $1.77 billion of loans and $1.52 billion of deposits. FFB’s operations comprise the trust and banking segment of our business.
Overview of our Investment Advisory and Wealth Management Business
FFA is a fee-based investment adviser which provides investment advisory services primarily to high net-worth individuals, their families and their family businesses, and other affiliated organizations. FFA strives to provide its clients with a high level of personalized service by its staff of experienced relationship managers. As of December 31, 2015, FFA had total $3.47 billion of AUM. FFA’s operations comprise the investment management, wealth planning and consulting segment of our business.
Relationship Managers and Bankers
Our operating strategy has been to build strong and stable long-term client relationships, one at a time, by delivering high quality, coordinated investment management, wealth planning, consulting, trust and banking products and services. The success of this strategy is largely attributable to our experienced and high quality client relationship managers and bankers. The primary role of our relationship managers and bankers, in addition to attracting new clients, is to develop and maintain a strong relationship with their clients and to coordinate the services we provide to their clients. We believe we can continue to attract and retain experienced and client-focused relationship managers and bankers.
Banking Products and Services
Through FFB, we offer a wide range of loan products, deposit products, business and personal banking services and trust services. Our loan products are designed to meet the credit needs of our clients in a manner that, at the same time, enables us to effectively manage the credit and interest rate risks inherent in our lending activities. Additional loan products offered to the broader markets we serve include commercial lending and commercial real estate lending, predominantly on multifamily properties. Deposits represent our principal source of funds for making loans and investments and acquiring other interest-earning assets. The yields we realize on our loans and other interest-earning assets and the interest rates we pay to attract and retain deposits are the principal determinants of our banking revenues. See “Management’s Discussion and Analysis of Financial Condition and Results of Operations” elsewhere in this Annual Report on Form 10-K.
Our lending activities serve the credit needs of high net-worth individuals and their businesses, owners of multifamily and commercial real estate properties, individuals and families who would not be considered high net-worth, small to moderate size businesses and professional firms in our market areas. As a result we offer a variety of loan products consisting of multifamily and single family residential real estate loans, commercial real estate loans, commercial term loans and lines of credit, and consumer loans. We handle all loan processing, underwriting and servicing at our administrative office in Irvine, California.
2
The following table sets forth information regarding the types of loans that we make, by amounts and as a percentage of our total loans outstanding at December 31:
|
|
|
2015 |
|
|
2014 |
|
||||||||||
|
(dollars in thousands) |
|
Balance |
|
|
% of Total |
|
|
Balance |
|
|
% of Total |
|
||||
|
Recorded Investment balance: |
|
|
|
|
|
|
|
|
|
|
|
|
|
|
|
|
|
Loans secured by real estate: |
|
|
|
|
|
|
|
|
|
|
|
|
|
|
|
|
|
Residential properties: |
|
|
|
|
|
|
|
|
|
|
|
|
|
|
|
|
|
Multifamily |
|
$ |
627,311 |
|
|
|
35.5 |
% |
|
$ |
481,491 |
|
|
|
41.3 |
% |
|
Single family |
|
|
533,257 |
|
|
|
30.2 |
% |
|
|
360,644 |
|
|
|
30.9 |
% |
|
Total loans secured by residential properties |
|
|
1,160,568 |
|
|
|
65.7 |
% |
|
|
842,135 |
|
|
|
72.2 |
% |
|
Commercial properties |
|
|
358,791 |
|
|
|
20.3 |
% |
|
|
205,320 |
|
|
|
17.6 |
% |
|
Land |
|
|
12,320 |
|
|
|
0.7 |
% |
|
|
4,309 |
|
|
|
0.4 |
% |
|
Total real estate loans |
|
|
1,531,679 |
|
|
|
86.7 |
% |
|
|
1,051,764 |
|
|
|
90.2 |
% |
|
Commercial and industrial loans |
|
|
196,584 |
|
|
|
11.1 |
% |
|
|
93,537 |
|
|
|
8.0 |
% |
|
Consumer loans |
|
|
37,206 |
|
|
|
2.2 |
% |
|
|
21,125 |
|
|
|
1.8 |
% |
|
Total loans |
|
$ |
1,765,469 |
|
|
|
100.0 |
% |
|
$ |
1,166,426 |
|
|
|
100.0 |
% |
Residential Mortgage Loans – Multi-family: We make multi-family residential mortgage loans for terms up to 30 years primarily for properties located in California. These loans generally are adjustable rate loans with interest rates tied to a variety of independent indexes; although in some cases these loans have fixed interest rates for periods ranging from 3 to 10 years and adjust thereafter based on an applicable index. These loans generally have interest rate floors, payment caps, and prepayment penalties. The loans are underwritten based on a variety of underwriting criteria, including an evaluation of the character and creditworthiness of the borrower and guarantors, loan-to-value and debt service coverage ratios, borrower liquidity and credit history. In addition, we perform stress testing for changes in interest rates, capitalization rates and other factors and review general economic trends such as lease rates, values and absorption rates. We typically require personal guarantees from the owners of the entities to which we make such loans.
Residential Mortgage Loans – Single-family: We offer single family residential mortgage loans primarily as an accommodation to our existing clients. In most cases, these take the form of non-conforming jumbo and super jumbo loans and FFB does not currently sell or securitize any of its single family residential mortgage loan originations. FFB does not originate loans defined as high cost by state or federal banking regulators. The majority of FFB’s single family residential loan originations are collateralized by first mortgages on real properties located in Southern California. These loans are generally adjustable rate loans with fixed terms ranging from 3 to 10 years and terms of the loan not exceeding 30 years. These loans generally have interest rate floors and payment caps. The loans are underwritten based on a variety of underwriting criteria, including an evaluation of the character and creditworthiness of the borrower and guarantors, loan-to-value and debt to income ratios, borrower liquidity, income verification and credit history. In addition, we perform stress testing for changes in interest rates and other factors and review general economic trends such as market values.
Commercial Real Estate Loans -Owner Occupied: Owner occupied commercial real estate loans are generally made to businesses that have demonstrated a history of profitable operations. To qualify for such loans, prospective borrowers generally must have operating cash flow sufficient to meet their obligations as they become due, and good payment histories. Our commercial real estate loans are secured by first trust deeds on nonresidential real property. These loans generally are adjustable rate loans with interest rates tied to a variety of independent indexes; although in some cases these loans have fixed interest rates for periods ranging from 3 to 10 years and adjust thereafter based on an applicable index. These loans generally have terms of 10 years, interest rate floors, payment caps, and prepayment penalties. The loans are underwritten based on a variety of underwriting criteria, including an evaluation of the character and creditworthiness of the borrower and guarantors, loan-to-value and debt service coverage ratios, borrower liquidity and credit history. In addition, we perform stress testing for changes in interest rates, cap rates and other factors and review general economic trends such as lease rates, values and absorption rates. We typically require personal guarantees from the owners of the entities to which we make such loans.
Commercial Loans: We offer commercial term loans and commercial lines of credit to our clients. Commercial loans generally are made to businesses that have demonstrated a history of profitable operations. To qualify for such loans, prospective borrowers generally must have operating cash flow sufficient to meet their obligations as they become due, and good payment histories. Commercial term loans are either fixed rate loans or adjustable rate loans with interest rates tied to a variety of independent indexes and are made for terms ranging from 1 to 5 years. Commercial lines of credit are adjustable rate loans with interest rates usually tied to the Wall Street Journal prime rate or LIBOR rates, are made for terms ranging from 1 to 2 years, and contain various covenants, including a requirement that the borrower reduce its credit line borrowings to zero for specified time periods during the term of the line of credit. The loans are underwritten based on a variety of underwriting criteria, including an evaluation of the character and creditworthiness of the borrower and guarantors, debt service coverage ratios, historical and projected client income,
3
borrower liquidity and credit history. In addition, we perform stress testing for changes in interest rates and other factors and review general economic trends in the client’s industry. We typically require personal guarantees from the owners of the entities to which we make such loans.
Equipment financing: Beginning in 2016, we are offering equipment financing to provide financing solutions to third party originators, including equipment brokers, lessors and other referral sources. We expect that a majority of the equipment financing business will be small in nature, typically averaging below $250,000, will have terms ranging from 3 to 7 years, will carry fixed rates and will be secured by the underlying equipment and the operations of the borrower.
Small Business Lending and USDA Lending: The Bank is approved as a SBA lender and as a USDA lender. The Bank intends to expand its use of both the SBA and USDA lending programs as it identifies opportunities to serve existing clients and potential clients. As government guaranteed programs, the Bank will need to comply with underwriting guidelines and terms and conditions set forth under the related programs.
Consumer Loans: We offer a variety of consumer loans and credit products, including personal installment loans and lines of credit, and home equity lines of credit designed to meet the needs of our clients. Consumer loans are either fixed rate loans or adjustable rate loans with interest rates tied to a variety of independent indexes and are made for terms ranging from 1 to 10 years. The loans are underwritten based on a variety of underwriting criteria, including an evaluation of the character creditworthiness and credit history of the borrower and guarantors, debt to income ratios, borrower liquidity, income verification, and the value of any collateral securing the loan. Consumer loan collections are dependent on the borrower’s ongoing cash flows and financial stability and, as a result, generally pose higher credit risks than the other loans that we make.
For all of our loan offerings, we utilize a comprehensive approach in our underwriting process. This includes the requirement that all factors considered in our underwriting be appropriately documented. In our underwriting, our primary focus is always on the borrower’s ability to repay. However, because our underwriting process allows us to view the totality of the borrower’s capacity to repay, concerns or issues in one area can be compensated for by other favorable financial criteria. This personalized and detailed approach allows us to better understand and meet our clients’ lending needs.
Bank Deposit Products: We offer a wide range of deposit products, including personal and business checking, savings accounts, interest-bearing negotiable order of withdrawal accounts, money market accounts and time certificates of deposit. The following table sets forth information regarding the type of deposits which our clients maintained with us and the average interest rates on those deposits as of December 31:
|
|
|
2015 |
|
|
2014 |
|
||||||||||||||||||
|
(dollars in thousands) |
|
Amount |
|
|
% of Total |
|
|
Weighted |
|
|
Amount |
|
|
% of Total |
|
|
Weighted |
|
||||||
|
Demand deposits: |
|
|
|
|
|
|
|
|
|
|
|
|
|
|
|
|
|
|
|
|
|
|
|
|
|
Noninterest-bearing |
|
$ |
299,794 |
|
|
|
19.7 |
% |
|
|
— |
|
|
$ |
246,137 |
|
|
|
25.6 |
% |
|
|
— |
|
|
Interest-bearing |
|
|
260,167 |
|
|
|
17.1 |
% |
|
|
0.359 |
% |
|
|
291,509 |
|
|
|
30.3 |
% |
|
|
0.504 |
% |
|
Money market and savings |
|
|
492,015 |
|
|
|
32.3 |
% |
|
|
0.531 |
% |
|
|
171,958 |
|
|
|
17.8 |
% |
|
|
0.499 |
% |
|
Certificates of deposits |
|
|
470,200 |
|
|
|
30.9 |
% |
|
|
0.554 |
% |
|
|
253,350 |
|
|
|
26.3 |
% |
|
|
0.606 |
% |
|
Total |
|
$ |
1,522,176 |
|
|
|
100.0 |
% |
|
|
0.404 |
% |
|
$ |
962,954 |
|
|
|
100.0 |
% |
|
|
0.398 |
% |
As of December 31, 2015, our 6 largest bank depositors accounted for, in the aggregate, 24% of our total deposits. See Item 1A—Risk Factors.
Trust Services: FFB is licensed to provides trust services to clients in California, Nevada and Hawaii. Those services, which consist primarily of the management of trust assets, complement the investment and wealth management services that FFA offers to our clients and, as a result, provide us with cross-selling opportunities. Additionally, trust service fees provide an additional source of noninterest income for us. At December 31, 2015, trust AUM totaled $1.03 billion.
Insurance Services: Through FFIS, we offer life insurance products provided by unaffiliated insurance carriers from whom we collect a brokerage fee.
Wealth Management Products and Services
FFA is a fee-based investment advisor which provides investment advisory services and wealth management and consulting services primarily for high net-worth individuals and their families, family businesses and other affiliated organizations (including public and closely-held corporations, family foundations and private charitable organizations). FFA provides high net-worth clients
4
with personalized services designed to enable them to reach their personal and financial goals by coordinating FFA’s investment advisory and wealth management services with risk management and estate and tax planning services that are provided by outside service providers, for which FFA does not receive commissions or referral fees. FFA’s clients benefit from certain cost efficiencies available to institutional managers, such as block trading, access to institutionally priced no-load mutual funds, ability to seek competitive bid/ask pricing for bonds, low transaction costs and investment management fees charged as a percentage of the assets managed, with tiered pricing for larger accounts.
FFA’s investment management team strives to create diversified investment portfolios for its clients that are individually designed, monitored and adjusted based on the discipline of fundamental investment analysis. FFA focuses on creating investment portfolios that are commensurate with a client’s objectives, risk preference and time horizon, using traditional investments such as individual stocks and bonds and mutual funds. FFA also provides comprehensive and ongoing advice and coordination regarding estate planning, retirement planning, charitable and business ownership issues, and issues faced by executives of publicly-traded companies.
AUM at FFA has grown at a compound annual growth rate of 12% over the three year period ending December 31, 2015. Changes in our AUM reflects additions from new clients, the gains or losses recognized from investment results, additional funds received from existing clients, withdrawals of funds by clients, and terminations. During the 3 year period ending December 31, 2015, additions from new clients and net gains from investment results were 83% and 17%, respectively, of the total of additions from new clients and net gains from investment results.
FFA does not provide custodial services for its clients. Instead, client investment accounts are maintained under custodial arrangements with large, well established brokerage firms, either directly or through FFB. However, FFA advises its clients that they are not obligated to use those services and that they are free to select securities brokerage firms and custodial service providers of their own choosing. FFA has entered into referral agreements with certain of the asset custodial firms that provide custodial services to our clients. Under these arrangements, the asset custodial firms provide referrals of prospective new clients whose increase in wealth warrants a more personalized and expansive breadth of financial services that we are able to provide in exchange for a fee. This fee is either a percentage of the fees we charge to the client or a percentage of the AUM of the client. The asset custodial firms are entitled to continue to receive these fees for as long as we continue to provide services to the referral client. These referral agreements do not require the client to maintain their assets at the custodial firm and are fully disclosed to the client prior to our providing services to them.
FFA also provides wealth management services, consisting of financial, investment and economic advisory and related services, to high-net-worth individuals and their families, family businesses, and other affiliated organizations (including public and closely-held corporations, family foundations and private charitable organizations). Those services include education, instruction and consultation on financial planning and management matters, and Internet-based data processing administrative support services involving the processing and transmission of financial and economic data primarily for charitable organizations.
Competition
The banking and investment and wealth management businesses in California, Nevada and Hawaii, generally, and in our market areas, in particular, are highly competitive. A relatively small number of major national and regional banks, operating over wide geographic areas, including Wells Fargo, JP Morgan Chase, US Bank, Comerica, Union Bank and Bank of America, dominate our banking markets. Those banks, or their affiliates, also offer banking and investment and wealth management services. We also compete with large, well known banking and wealth management firms, including City National, First Republic, Northern Trust and Boston Private. Those banks and investment and wealth management firms generally have much greater financial and capital resources than we do and as a result of their ability to conduct extensive advertising campaigns and their relatively long histories of operations in our markets, are generally better known than us. In addition, by virtue of their greater total capitalization, the large banks have substantially higher lending limits than we do, which enables them to make much larger loans and to offer loan products that we are not able to offer to our clients.
We compete with these much larger banks and investment and wealth management firms primarily on the basis of the personal and “one-on-one” service that we provide to our clients, which many of these competitors are unwilling or unable to provide, other than to their wealthiest clients, due to costs involved or their “one size fits all” approaches to providing financial services to their clients. We believe that our principal competitive advantage is our ability to offer our banking, trust, insurance, investment and wealth management services through one integrated platform, enabling us to provide our clients with the efficiencies and benefits of dealing with a cohesive group of professional advisors and banking officers working together to assist our clients to meet their personal investment and financial goals. We believe that only the largest financial institutions in our area provide similar integrated platforms of products and services, which they sometimes reserve for their wealthiest and institutional clients. In addition, while we also compete with many local and regional banks and numerous local and regional investment advisory and wealth management firms, we believe that only a very few of these banks offer investment or wealth management services and that a very few of these investment
5
and wealth management firms offer banking services and, therefore, these competitors are not able to provide such an integrated platform of comprehensive financial services to their clients. This enables us to compete effectively for clients who are dissatisfied with the level of service provided at larger financial institutions, yet are not able to receive an integrated platform of comprehensive financial services from other regional or local financial services organizations.
While we provide our clients with the convenience of technological access services, such as remote deposit capture, internet banking and mobile banking, we compete primarily by providing a high level of personal service. As a result, we do not try to compete exclusively on pricing. However, because we are located in a highly competitive market place and because we are seeking to grow our businesses, we attempt to maintain our pricing in line with our principal competitors.
Supervision and Regulation
Both federal and state laws extensively regulate bank holding companies and banks. Such regulation is intended primarily for the protection of depositors and the FDIC’s deposit insurance fund and is not for the benefit of shareholders. Set forth below are summary descriptions of the material laws and regulations that affect or bear on our operations. Those summaries are not intended, and do not purport, to be complete and are qualified in their entirety by reference to the laws and regulations that are summarized below.
First Foundation Inc.
General
First Foundation Inc. is a registered bank holding company subject to regulation under the Bank Holding Company Act of 1956, as amended (the “Holding Company Act”). Pursuant to the Holding Company Act, we are subject to supervision and periodic examination by, and are required to file periodic reports with the FRB.
As a bank holding company, we are allowed to engage, directly or indirectly, only in banking and other activities that the Federal Reserve has determined, or in the future may deem, to be so closely related to banking or managing or controlling banks as to be a proper incident thereto. Business activities which the Federal Reserve has designated as being closely related to banking include the provision of investment advisory, securities brokerage, insurance agency and data processing services, among others.
As a bank holding company, we also are required to obtain the prior approval of the FRB for the acquisition of more than 5% of the outstanding shares of any class of voting securities, or of substantially all of the assets, by merger or purchase, of (i) any bank or other bank holding company and (ii) any other entities engaged in banking-related businesses or that provide banking-related services.
Under FRB regulations, a bank holding company is required to serve as a source of financial and managerial strength to its subsidiary banks and may not conduct its operations in an unsafe or unsound manner. In addition, it is the FRB’s policy that a bank holding company, in serving as a source of strength to its subsidiary banks, should stand ready to use available resources to provide adequate capital funds to its subsidiary banks during periods of financial stress or adversity and should maintain the financial flexibility and capital-raising capacity to obtain additional resources for assisting its subsidiary banks. For that reason, among others, the Federal Reserve requires all bank holding companies to maintain capital at or above certain prescribed levels. A bank holding company’s failure to meet these requirements will generally be considered by the Federal Reserve to be an unsafe and unsound banking practice or a violation of the FRB’s regulations or both, which could lead to the imposition of restrictions (including restrictions on growth) on, or a regulatory enforcement order against, the offending bank holding company.
Additionally, among its powers, the Federal Reserve may require any bank holding company to terminate an activity or terminate control of, or liquidate or divest itself of, any subsidiary or affiliated company that the FRB determines constitutes a significant risk to the financial safety, soundness or stability of the bank holding company or any of its banking subsidiaries. The Federal Reserve also has the authority to regulate provisions of a bank holding company’s debt, including authority to impose interest ceilings and reserve requirements on such debt. Subject to certain exceptions, bank holding companies also are required to file written notice and obtain approval from the Federal Reserve prior to purchasing or redeeming their common stock or other equity securities. A bank holding company and its non-banking subsidiaries also are prohibited from implementing so-called tying arrangements whereby clients may be required to use or purchase services or products from the bank holding company or any of its non-bank subsidiaries in order to obtain a loan or other services from any of the holding company’s subsidiary banks.
Financial Services Modernization Act
The Financial Services Modernization Act (the “Gramm-Leach-Bliley Act” or the “Modernization Act”), was enacted into law in 1999 primarily to establish a comprehensive framework that would permit affiliations among commercial banks, insurance companies, securities and investment banking firms, and other financial service providers. Accordingly, the Modernization Act
6
amended the Holding Company Act to permit a bank holding company that meets certain eligibility requirements to qualify as a “financial holding company,” and its non-bank affiliated companies to engage in a broader range of financial activities to foster greater competition among financial services companies both domestically and internationally.
The Modernization Act also contains provisions that expressly preempt and make unenforceable any state law restricting bank holding companies or their affiliates from engaging in the insurance underwriting or related businesses. That Act also:
|
|
● |
broadened the activities that may be conducted by national banks, bank subsidiaries of bank holding companies, and their financial subsidiaries; |
|
|
● |
provided an enhanced framework for protecting the privacy of consumer information; |
|
|
● |
adopted a number of provisions related to the capitalization, membership, corporate governance, and other measures designed to modernize the Federal Home Loan Bank system; |
|
|
● |
modified the laws governing the implementation of the Community Reinvestment Act (“CRA”), which is described in greater detail below; and |
|
|
● |
addressed a variety of other legal and regulatory issues affecting both day-to-day operations and long-term activities of banking institutions. |
According to current FRB regulations implementing the Modernization Act, activities that are financial in nature and may be engaged in by financial holding companies, through their non-bank subsidiaries, include
|
|
● |
securities underwriting, dealing and market making; |
|
|
● |
sponsoring mutual funds and investment companies; |
|
|
● |
engaging in insurance underwriting; and |
|
|
● |
engaging in merchant banking activities. |
Before a bank holding company may engage in any of those financial activities, it must file an application with its Federal Reserve Bank that confirms that it meets certain qualitative eligibility requirements established by the FRB. A bank holding company that meets those qualifications and files such an application will be designated as a “financial holding company,” entitling it to affiliate with securities firms and insurance companies and engage in other activities, primarily through non-banking subsidiaries, that are financial in nature or are incidental or complementary to activities that are financial in nature.
A bank holding company that does not qualify as, or chooses not to submit an application to become, a financial holding company may not engage in such financial activities. Instead, as discussed above, it will be limited to engaging in banking and such other activities that have been determined by the FRB to be closely related to banking.
Acquisition of Control of a Bank Holding Company or a Bank
Subject to certain limited exemptions, the Holding Company Act and the Change in Bank Control Act of 1978, as amended (the “Change in Control Act”), together with their implementing regulations, require:
|
|
· |
the approval of the FRB before any person or company may acquire “control” of a bank holding company; and |
|
|
· |
the approval of an insured depository institution’s federal bank regulator before any person or company may acquire “control” of the institution. |
Under the Change in Control Act, control of a bank holding company or a bank or other insured depository institution is conclusively presumed to exist if an individual or company (i) acquires 25% or more of any class of voting securities of the bank holding company or the depository institution, or (ii) has the direct or indirect power to direct or cause the direction of the management and policies of the bank holding company or the insured depository institution, whether through ownership of voting securities, by contract or otherwise; except that no individual will be deemed to control a bank holding company or an insured depository institution solely on account of being one of its directors, officers or employees. The Change in Control Act also establishes a presumption, which is rebuttable, that a person will be deemed to control a bank holding company or an insured depository institution if that person acquires 10% or more, but less than 25%, of any class of voting securities of a bank holding company which has a class of equity securities registered with the SEC under the Exchange Act, or if no other person will own a greater percentage of that class of voting securities immediately after the transaction.
However, as a bank holding company, we must obtain the prior approval of the FRB to acquire more than five percent of the outstanding shares of voting securities of a bank or another bank holding company. In addition, the Dodd-Frank Act, which is
7
discussed in greater detail below, provides that an acquisition by a bank holding company of a bank located outside the bank holding company’s home state may not be approved, unless the FRB has determined that the bank holding company is well-capitalized and well managed.
Capital Requirements Applicable to Bank Holding Companies
Because it requires bank holding companies to be a source of financial strength for their bank subsidiaries, the Federal Reserve has adopted regulations that require bank holding companies to meet capital adequacy guidelines similar to those that apply to banks and other insured depository institutions. For additional information regarding these guidelines, see “First Foundation Bank – Capital Adequacy Guidelines” and First Foundation Bank – New Basel III Capital Requirements” below.
Dividends
It is the policy of FRB that bank holding companies should generally pay dividends on common stock only out of income available over the past year, and only if prospective earnings retention is consistent with the holding company’s expected future needs for capital and liquidity and to maintain its financial condition. It is also an FRB policy that bank holding companies should not maintain dividend levels that undermine their ability to be a source of financial strength for their banking subsidiaries. Additionally, due to the current financial and economic environment, the FRB has indicated that bank holding companies should carefully review their dividend policies and has discouraged dividend payment ratios that are at maximum allowable levels unless both asset quality and capital are very strong.
The Dodd-Frank Act
From time to time, federal and state legislation is enacted which can affect our operations and our operating results by materially increasing our costs of doing business, limiting or expanding the activities in which banks and other financial institutions may engage, or altering the competitive balance between banks and non-bank financial service providers.
The recent economic recession and credit crisis that required, among other measures, the federal government to provide substantial financial support to many of the largest of the banks and other financial service organizations in the United States, led the U.S. Congress to adopt a number of new laws, and the federal banking regulators, including the FRB and the FDIC, to take broad actions, to address systemic risks and volatility in the U.S. banking system. Set forth below is a summary of some of the provisions of the most significant of these laws, the Dodd-Frank Wall Street Reform and Consumer Protection Act of 2010 (the “Dodd-Frank Act”). The regulatory sweep of the Dodd-Frank Act is broad and its provisions apply not only to the regulation of bank holding companies and insured depository institutions, but also to investment banking and other financial companies and to public companies that are regulated by the SEC. Accordingly, the following summary focuses primarily on the provisions of the Dodd-Frank Act that are applicable to banking organizations. It is not intended to be complete and is qualified in its entirety by reference to the Dodd-Frank Act itself and the regulations promulgated thereunder.
The Dodd-Frank Act has significantly changed federal regulation of bank holding companies and banks and other insured depository institutions (collectively, “banking institutions”). Among other things, the Dodd-Frank Act has created a new Financial Stability Oversight Council to identify systemic risks in the country’s banking and financial system and gives federal banking regulators new authority to take control of and liquidate banking institutions, and large investment banking and other financial services firms, facing the prospect of imminent failure in any case where such failure would create systemic risks to the U.S. banking or financial system. The Dodd-Frank Act also created the Consumer Financial Protection Bureau (the “CFPB”), which is a new independent federal regulatory agency with broad powers and authority to adopt regulations under, and administer and regulate, federal consumer protection laws.
Imposition of New Capital Standards on Bank Holding Companies. The Dodd-Frank Act required the Federal Reserve to apply consolidated capital requirements to bank holding companies that are no less stringent than those currently applied to insured depository institutions, such as FFB. The Federal Reserve implemented this requirement by its adoption of the new Basel III capital rules in June 2015. See “First Foundation Bank — New Basel III Capital Rules” below.
Increase in Deposit Insurance and Changes Affecting the FDIC Deposit Insurance Fund. The Dodd-Frank Act permanently increased the maximum deposit insurance amount for banks, savings institutions and credit unions from $100,000 to $250,000 per depositor. The Dodd-Frank Act also broadened the base for FDIC insurance assessments which are used to fund the FDIC’s Deposit Insurance Fund (“DIF”) which, as a result, are now based on an insured depository institution’s average consolidated total assets, less tangible equity capital, may lead to increases in FDIC insurance assessments for many FDIC insured banks. The Dodd-Frank Act also requires the FDIC to increase the reserve ratio of the DIF from 1.15% to 1.35% of the total deposits insured by the FDIC by 2020 and eliminates the requirement that the FDIC pay dividends to insured depository institutions when the reserve ratio exceeds certain thresholds. See also, “First Foundation Bank –The Deposit Insurance Fund and FDIC Insurance Premiums” below.
8
Payment of Interest on Business Checking Accounts. The Dodd-Frank Act has eliminated a federal statutory prohibition against the payment of interest on business checking accounts, which is expected to increase the competition for and interest that banks are prepared to pay on such accounts.
Limitations on Conversion of Bank Charters. The Dodd-Frank Act prohibits a bank or other depository institution from converting from a state to federal charter or vice versa while it is subject to a cease and desist order or other formal enforcement action or a memorandum of understanding with respect to a significant supervisory matter, unless the federal or state banking regulatory agency that issued the enforcement action does not object to the proposed conversion within 30 days following its receipt of a notice of that conversion.
Interstate Banking. The Dodd-Frank Act authorizes national and state banks to establish branches in other states to the same extent as a bank chartered by that state would be permitted to establish a branch in that state. Previously, banks could only establish branches in other states if the host state expressly permitted out-of-state banks to establish branches in its state. Accordingly, banks will be able to enter new markets more freely.
The Volcker Rule. Pursuant to the Dodd-Frank Act, the Federal Reserve and the FDIC have adopted regulations, which became effective on April 1, 2014, to implement the “Volcker Rule” which prohibits insured depository institutions and companies affiliated with insured depository institutions (“banking organizations”) from engaging in short-term proprietary trading of certain securities, derivatives, commodity futures, and options on these instruments, for their own account. Those regulations also impose limits on the investments that banking organizations may make in, and other relationships that banking organizations may have with, hedge funds or private equity funds. Certain collateralized debt obligations, securities backed by trust preferred securities have been exempted from those prohibitions due to concerns that many community banks would otherwise have been required to recognize significant losses on such obligations and securities.
These regulations provide exemptions for certain activities, including market making, underwriting, hedging, trading in government obligations, insurance company activities, and, under certain limited circumstances, organizing and offering hedge funds or private equity funds. The regulations also clarify that certain activities are not prohibited by the Volker Rule, including acting as agent, broker, or custodian. The compliance requirements under the regulations vary based on the size of the banking organization and the scope of its activities. Banking organizations with significant trading operations will be required to establish detailed compliance programs and their CEOs will be required to attest that the programs are reasonably designed to achieve compliance with the final regulations. Independent testing and analyses of a banking organization’s compliance program also will be required. On the other hand, the regulations reduce the burden on smaller, less-complex banking organizations by limiting their compliance and reporting requirements. Additionally, a banking organization that does not engage in covered trading activities will not have to establish a compliance program.
Neither the Company nor FFB held any investment positions at December 31, 2015 that were subject to these regulations. Therefore, these regulations have not required us to make any material changes in our operations or businesses.
Executive Compensation Restrictions
In June 2010, the Federal Reserve and the FDIC issued comprehensive guidelines on incentive compensation policies intended to ensure that the incentive compensation policies of banking organizations do not undermine the safety and soundness of the organizations by encouraging excessive risk-taking. The guidelines apply to any employees of a banking organization that have the ability to materially affect the risk profile of a banking organization, either individually or as part of a group.
Pursuant to these guidelines, each federal bank regulatory agency, as part of its regular, risk-focused examination of the banking organizations it regulates, assesses their incentive compensation arrangements based on the key principles their incentive compensation arrangements should (i) provide incentives that do not encourage risk-taking beyond the organization’s ability to effectively identify and manage risks, (ii) be compatible with effective internal controls and risk management, and (iii) be supported by strong corporate governance principles and practices, including active and effective oversight by the banking organization’s board of directors. The federal banking regulatory agencies have the authority to bring enforcement actions against a banking organization if the agency concludes that its incentive compensation arrangements, or related risk-management control or governance processes, pose an undue risk to the organization's safety and soundness and that the organization is not taking prompt and effective measures to correct the deficiencies.
In addition, the Dodd-Frank Act directs federal banking regulators to promulgate rules prohibiting incentive-based compensation arrangements that would encourage imprudent risk-taking by executives of depository institutions and their holding companies that have assets of more than $1.0 billion. Proposed rules were issued in 2011 but have not become final.
9
Moreover, if an insured bank has been determined by its federal banking regulatory agency to be a “troubled” institution, it may not adopt any new, or make any payments or awards under any existing, incentive compensation plans, or make any change in control payments, to its executive officers without first obtaining the approval of its federal banking regulatory agency to do so.
In February 2014, the Company adopted an incentive compensation clawback policy. Among other things, that policy provides that, if any of the Company’s previously published financial statements are restated due to a material noncompliance with any financial reporting requirements under the federal securities laws, the Company will seek to recover the amount by which any incentive compensation paid in the previous three years to any executive officer exceeds the incentive compensation which the Company’s audit committee determines would have been paid to such executive officer had such compensation been determined on the basis of the restated financial statements.
Sarbanes-Oxley Act of 2002
The Sarbanes-Oxley Act of 2002 (the “Sarbanes-Oxley Act”) was enacted into law on July 30, 2002. The primary purposes of the Sarbanes-Oxley Act were to strengthen (i) the oversight of public accounting firms that audit, and (ii) the corporate governance policies and practices of, companies the common stock or other equity securities of which are publicly traded. The Sarbanes-Oxley Act granted authority, primarily to the Securities and Exchange Commission (the “SEC”), to adopt rules for implementing that Act. Among other things, the Sarbanes-Oxley Act:
|
|
· |
provided for enhanced regulation of the independence, responsibilities and conduct of accounting firms which provide auditing services to public companies; |
|
|
· |
established an independent board, known as the Public Company Accounting Oversight Board (the “PCAOB”), with the authority to set auditing, quality and ethical standards for, and the power to investigate and discipline, public accounting firms; |
|
|
· |
increased the criminal penalties for financial fraud committed by public company executives and public accounting firms or their key personnel; |
|
|
· |
required enhanced monitoring of, and certifications by, the chief executive and chief financial officers of public companies of their financial disclosures, internal financial controls and their audit processes; |
|
|
· |
required accelerated disclosures of material information by public companies; and |
|
|
· |
required enhanced disclosures by public companies of their corporate governance policies and practices. |
Additionally, pursuant to requirements of the Sarbanes-Oxley Act, the New York, American and NASDAQ Stock Exchanges promulgated rules requiring public companies to adopt and implement expanded corporate governance policies and practices as a condition to the listing, or continued listing, of their shares on those exchanges. Among other things, those rules (i) require public companies to expand the authority, role and responsibilities of their boards of directors, (ii) require that a majority of the members of their boards of directors be independent of management and establish more stringent standards that directors needed to meet to qualify as independent directors, (iii) require boards of directors to establish standing audit, compensation and nominating and corporate governance committees comprised of independent directors and (iv) increased the corporate transactions for which shareholder approval is required.
Regulation of the Company by the California Department of Business Oversight
Because FFB is a California state chartered bank, the Company is deemed to be a bank holding company within the meaning of Section 1280 of the California Financial Code. As such, we are subject to examination by, and may be required to file reports with, the DBO.
First Foundation Bank
General
FFB is subject to primary supervision, periodic examination and regulation by (i) the FDIC, which is its primary federal banking regulator, and (ii) the DBO, because FFB is a California state chartered bank.
10
Various requirements and restrictions under Federal and California banking laws affect the operations of FFB. These laws and the implementing regulations, which are promulgated by federal and state bank regulatory agencies, can determine the extent of supervisory control to which a bank will be subject by its federal and state bank regulators. These laws and regulations cover most aspects of a bank’s operations, including:
|
|
● |
the reserves a bank must maintain against deposits and for possible loan losses and other contingencies; |
|
|
● |
the types of and limits on loans and investments that a bank may make; |
|
|
● |
the borrowings that a bank may incur; |
|
|
● |
the opening of branch offices; |
|
|
● |
the rate at which it may grow its assets and business; |
|
|
● |
the acquisition and merger activities of a bank; |
|
|
● |
the amount of dividends that a bank may pay; and |
|
|
● |
the capital requirements that a bank must satisfy. |
If, as a result of an examination of a federally regulated bank, its federal banking regulatory agency, such as the FDIC, were to determine that the financial condition, capital resources, asset quality, earnings prospects, management, liquidity, or other aspects of the bank’s operations had become unsatisfactory or that the bank or its management was in violation of any law or regulation, that agency would have the authority to take a number of different remedial actions as it deems appropriate under the circumstances. These actions include the power:
|
|
● |
to enjoin any “unsafe or unsound” banking practices; |
|
|
● |
to require that affirmative action be taken to correct any conditions resulting from any violation of law or unsafe or unsound practice; |
|
|
● |
to issue an administrative order that can be judicially enforced against the bank; |
|
|
● |
to require the bank to increase its capital; |
|
|
● |
to restrict the bank’s growth; |
|
|
● |
to assess civil monetary penalties against the bank or its officers or directors; |
|
|
● |
to remove officers and directors of the bank; and |
|
|
● |
if the federal agency concludes that such conditions cannot be corrected or there is an imminent risk of loss to depositors, to terminate a bank’s deposit insurance, which in the case of a California state chartered bank would result in revocation of its charter and require it to cease its banking operations. |
Additionally, under California law the DBO has many of these same remedial powers with respect to FFB.
Permissible Activities and Subsidiaries
California law permits state chartered commercial banks to engage in any activity permissible for national banks. Those permissible activities include conducting many so-called “closely related to banking” or “nonbanking” activities either directly or through their operating subsidiaries.
Federal Home Loan Bank System
FFB is a member of the FHLB. Among other benefits, each regional Federal Home Loan Bank serves as a reserve or central bank for its members within its assigned region and makes available loans or advances to its member banks. Each regional Federal Home Loan Bank is financed primarily from the sale of consolidated obligations of the overall Federal Home Loan Bank system. As an FHLB member, FFB is required to own a certain amount of capital stock in the FHLB. At December 31, 2015, FFB was in compliance with the FHLB’s stock ownership requirement. Historically, the FHLB has paid dividends on its capital stock to its members.
Federal Reserve Board Deposit Reserve Requirements
The FRB requires all federally-insured depository institutions to maintain reserves at specified levels against their transaction accounts. At December 31, 2015, FFB was in compliance with these requirements.
11
Limitations and Restrictions on the Payment of Dividends and Other Transfers of Funds by FFB
Cash dividends from FFB are one of the principal sources of cash (in addition to any cash dividends that might be paid to us by FFA) that is available to the Company for its operations and to fund any cash dividends that our board of directors might declare in the future. We are a legal entity separate and distinct from FFB and FFB is subject to various statutory and regulatory restrictions on its ability to pay cash dividends to us. Those restrictions would prohibit FFB, subject to certain limited exceptions, from paying cash dividends in amounts that would cause FFB to become undercapitalized. Additionally, the FDIC and the DBO have the authority to prohibit FFB from paying cash dividends, if either of those agencies deems the payment of dividends by FFB to be an unsafe or unsound practice.
The FDIC also has established guidelines with respect to the maintenance of appropriate levels of capital by banks under its jurisdiction. Compliance with the standards set forth in those guidelines and the restrictions that are or may be imposed under the prompt corrective action provisions of federal law could limit the amount of dividends which FFB may pay.
Restrictions on Transactions between FFB and the Company and its other Affiliates
FFB is subject to Sections 23A and 23B of, and FRB Regulation W under, the Federal Reserve Act, which impose restrictions on (i) any extensions of credit to, or the issuance of a guarantee or letter of credit on behalf of, the Company or any of its other subsidiaries; (ii) the purchase of or investments in Company stock or other Company securities; (iii) the taking of Company securities as collateral for the loans that FFB makes; (iv) the purchase of assets from the Company or any of its other subsidiaries and (v) transactions between a bank and its financial subsidiaries, as well as other affiliates. Thus, under the final rule, transactions between a bank and its financial subsidiary, as well as other affiliates, are subject to the requirements of sections 23A and 23B. These restrictions prevent the Company and any of its subsidiaries from obtaining borrowings or extensions of credit from FFB, unless the borrowings are secured by marketable obligations in designated amounts, and such secured loans and any investments by FFB in the Company or any of its subsidiaries are limited, individually, to 10% of FFB’s capital and surplus (as defined by federal regulations), and in the aggregate are limited to 20%, of FFB’s capital and surplus. California law also imposes restrictions with respect to transactions involving the Company and any other persons that may be deemed under that law to control FFB.
The Dodd-Frank Act extended the application of Section 23A of the Federal Reserve Act to derivative transactions, repurchase agreements and securities lending and borrowing transactions that create credit exposure to an affiliate or an insider of a bank. Any such transactions with any affiliates must be fully secured. In addition, the exemption from Section 23A for transactions with financial subsidiaries has been eliminated. The Dodd-Frank Act also expands the definition of “affiliate” for purposes of quantitative and qualitative limitations of Section 23A of the Federal Reserve Act to include mutual funds advised by a depository institution or any of its affiliates.
Safety and Soundness Standards
Banking institutions may be subject to potential enforcement actions by the federal banking regulators for unsafe or unsound practices or for violating any law, rule, regulation, or any condition imposed in writing by its primary federal banking regulatory agency or any written agreement with that agency. The federal banking agencies have adopted guidelines designed to identify and address potential safety and soundness concerns that could, if not corrected, lead to deterioration in the quality of a bank’s assets, liquidity or capital. Those guidelines set forth operational and managerial standards relating to such matters as:
|
|
● |
internal controls, information systems and internal audit systems; |
|
|
● |
risk management; |
|
|
● |
loan documentation; |
|
|
● |
credit underwriting; |
|
|
● |
asset growth; |
|
|
● |
earnings; and |
|
|
● |
compensation, fees and benefits. |
In addition, the federal banking agencies have adopted safety and soundness guidelines with respect to the quality of loans and other assets of insured depository institutions. These guidelines provide standards for establishing and maintaining a system to identify problem loans and other problem assets and to prevent those assets from deteriorating. Under these standards, an FDIC-insured depository institution is expected to:
|
|
● |
conduct periodic asset quality reviews to identify problem loans and any other problem assets, estimate the inherent losses in those loans and other assets and establish reserves that are sufficient to absorb those estimated losses; |
12
|
|
● |
take appropriate corrective action to resolve problem loans and other problem assets; |
|
|
● |
consider the size and potential risks of material asset concentrations; and |
|
|
● |
provide periodic quality reports with respect to their loans and other assets which provide adequate information for the bank’s management and the board of directors to assess the level of risk to its loans and other assets. |
These guidelines also establish standards for evaluating and monitoring earnings and for ensuring that earnings are sufficient for the maintenance of adequate capital and reserves.
Regulatory Guidelines for Commercial Real Estate Loan Concentrations
The Federal Reserve and the FDIC have published guidelines that call for the adoption of heightened risk mitigation measures by insured banks with a concentration of commercial real estate loans in its loan portfolio. The guidelines provide that a bank will be deemed to have a concentration of commercial real estate loans if (i) the total reported loans for construction, land development and other land represent 100% or more of the bank's total capital, or (ii) the total reported loans secured by multifamily and non-farm residential properties, plus loans for construction, land development and other land, represent 300% or more of the bank’s total capital and the bank’s commercial real estate loan portfolio has increased by 50% or more during the prior 36 months. If such a concentration exists, the guidelines call for the bank (x) to implement heightened risk assessment and risk management practices, including board and management oversight and strategic planning, (y) to implement and maintain stringent loan underwriting standards, and to use market analyses and stress testing tools to monitor the condition of the bank’s commercial real estate loan portfolio and to assess the impact that adverse economic conditions affecting the real estate markets could have on the bank’s financial condition and (z) if determined to be necessary on the basis of the results of such stress tests, to increase its allowance for loan losses and its capital.
Single Borrower Loan Limitations
California law imposes on all California state-chartered banks, including FFB, “single borrower loan limitations” which consist of the following:
|
|
· |
unsecured borrowings of any customer of a California state-chartered bank, together with the borrowings of any family members or affiliates of the customer, to the bank may not exceed 15% of the sum of the bank’s shareholders’ equity, allowance for loan losses, capital notes and debentures; and |
|
|
· |
the aggregate of secured and unsecured borrowings of any customer of a California state-chartered bank, together with the borrowings of any family members or affiliates of the customer, to the bank may not exceed 25% of the sum of the bank’s shareholders’ equity, allowance for loan losses, capital notes and debentures. |
Technology Risk Management and Consumer Privacy
Federal and state banking regulatory agencies have issued various policy statements focusing on the importance of technology risk management and supervision in evaluating the safety and soundness of the banks they regulate. According to those policy statements, the use by banking organizations of technology-related products, services, processes and delivery channels, such as the internet, exposes them to a number of risks which include operational, compliance, security, privacy, and reputational risk. The banking regulators generally expect the banking organizations they regulate to prudently manage technology-related risks as part of their comprehensive risk management policies in order to identify, monitor, measure and control risks associated with the use of technology.
Pursuant to the Modernization Act, the federal banking agencies have adopted rules and established standards to be followed in implementing safeguards that are designed to ensure the security and confidentiality of customer records and information, protection against any anticipated threats or hazards to the security or integrity of such records and protection against unauthorized access to or use of such records or information in a way that could result in substantial harm or inconvenience to a customer. Among other requirements, these rules require each bank organization to implement a comprehensive written information security program that includes administrative, technical and physical safeguards relating to customer information.
In addition, the Modernization Act requires banking organizations to provide each of their customers with a notice of their privacy policies and practices and prohibits a banking organization from disclosing nonpublic personal information about a customer to nonaffiliated third parties unless the banking organization satisfies various notice and “opt-out” requirements and the customer has not chosen to opt out of the disclosure. Additionally, the federal banking agencies are authorized to issue regulations as necessary to implement those notice requirements and non-disclosure restrictions. More specifically, the Modernization Act privacy regulations
13
require all banking organizations to develop initial and annual privacy notices that describe in general terms the banking organization’s information sharing practices. Any banking organization that shares nonpublic personal information about customers with nonaffiliated third parties must also provide customers with notices advising them that, subject to certain limited exceptions, the customer has the opportunity and a reasonable time period to inform the bank that it may not share the customer’s nonpublic personal information with nonaffiliates of the bank. These regulations also place limitations on the extent to which a banking organization may disclose an account number or access code for credit card, deposit, or transaction accounts to any nonaffiliated third party for use in marketing such programs.
Capital Adequacy and Prompt Corrective Action Provisions of the FDIC Improvement Act
Capital Adequacy Guidelines. The Federal Deposit Insurance Corporation Improvement Act of 1991 (the “FDICIA”), established a framework for regulation of federally insured depository institutions, including banks, and their parent holding companies and other affiliates, by their federal banking regulators. Among other things, FDICIA requires the relevant federal banking regulator to take “prompt corrective action” with respect to a depository institution if that institution does not meet certain capital adequacy standards, including requiring the prompt submission by that bank of an acceptable capital restoration plan if its bank regulator has concluded that it needs additional capital.
Supervisory actions by a bank’s federal regulator under the prompt corrective action rules generally depend upon an institution’s classification within one of five capital categories, which is determined on the basis of a bank’s Tier 1 leverage ratio, Tier 1 capital ratio and total capital ratio. Tier 1 capital consists principally of common stock and nonredeemable preferred stock and retained earnings.
Under FDICIA regulations, an insured depository institution’s capital category will depend upon how its capital levels compare with these capital measures and the other factors established by the relevant federal banking regulator. Prior to January 1, 2015, those regulations provided that a bank would be classified as:
|
|
● |
“well capitalized” if it had a total risk-based capital ratio of 10.0% or greater, a Tier 1 risk-based capital ratio of 6.0% or greater and a Tier 1 leverage ratio of 5.0% or greater, and was not subject to any order or written directive by any such regulatory agency to meet and maintain a specific capital level for any capital measure; |
|
|
● |
“adequately capitalized” if it had a total risk-based capital ratio of 8.0% or greater, a Tier 1 risk-based capital ratio of 4.0% or greater, and a Tier 1 leverage ratio of 4.0% or greater, but was not “well capitalized”; |
|
|
● |
“undercapitalized” if it had a total risk-based capital ratio that is less than 8.0%, a Tier 1 risk-based capital ratio of less than 4.0% and a Tier 1 leverage ratio of less than 4.0%; |
|
|
● |
“significantly undercapitalized” if it had a total risk-based capital ratio of less than 6.0%, a Tier 1 risk-based capital ratio of less than 3.0%, or a Tier 1 leverage ratio of less than 3.0%; and |
|
|
● |
“critically undercapitalized” if its tangible equity was equal to or less than 2.0% of average quarterly tangible assets. |
Effective January 1, 2016, to be “well-capitalized” under FDICIA, a bank must also have a common equity Tier 1 risk-based capital ratio of at least 6.5% and a Tier 1 ratio of 8.0% or greater.
However, if a bank that was classified as “well-capitalized” is determined (after notice and opportunity for hearing), by its federal banking regulator, to be in an unsafe or unsound condition or to be engaging in an unsafe or unsound practice, that agency could, under certain circumstances, reclassify the bank as adequately capitalized. The federal banking regulator of a bank that is classified as adequately capitalized or undercapitalized could require the bank to comply with bank supervisory provisions and restrictions that would apply to a bank in the next lower capital classification, if the banking regulator has obtained supervisory information regarding the bank (other than with respect to its capital levels) which raises safety or soundness concerns. However, a significantly undercapitalized bank may not be treated by its regulatory agency as critically undercapitalized by reason of such safety or soundness concerns alone.
The capital classification of a bank affects the frequency of examinations of the bank by its primary federal bank regulatory agency, impacts the ability of the bank to engage in certain activities and affects the deposit insurance premiums that are payable by the bank. Under FDICIA, the federal banking regulators are required to conduct a full-scope, on-site examination of every bank at least once every 12 months.
Corrective Measures for Undercapitalized Banks. FDICIA generally prohibits a bank from paying any dividends or making any capital distributions or paying any management fee to its parent holding company if the bank would thereafter be “undercapitalized.” In addition “undercapitalized” banks are subject to growth limitations and are required to submit a capital
14
restoration plan for approval by its federal regulatory agency. However, that agency may not approve the bank’s capital restoration plan unless the agency determines, among other things, that the plan is based on realistic assumptions and is likely to succeed in restoring the bank’s capital.
An undercapitalized bank which fails to submit, or fails to obtain the approval by its federal banking regulator of a capital restoration plan will be treated as if it is “significantly undercapitalized.” In that event, the bank’s federal banking regulator may impose a number of additional requirements and restrictions on the bank, including orders or requirements (i) to sell sufficient voting stock to become “adequately capitalized,” (ii) to reduce its total assets, and (iii) cease the receipt of deposits from correspondent banks. “Critically undercapitalized” institutions are subject to the appointment of a receiver or conservator.
If an undercapitalized bank is a subsidiary of a bank holding company, then, for its capital restoration plan to be approved, the bank’s parent holding company must guarantee that the bank will comply with, and provide assurances of the performance by the bank of, its capital restoration plan. Under such a guarantee and assurance of performance, if the bank fails to comply with its capital restoration plan, the parent holding company may become subject to liability for such failure in an amount up to the lesser of (i) 5.0% of its bank subsidiary’s total assets at the time it became undercapitalized, or (ii) the amount that is necessary (or would have been necessary) to bring the bank into compliance with all applicable capital standards as of the time it failed to comply with the plan.
Corrective Measures for Significantly and Critically Undercapitalized Banks. If a bank is classified as “significantly undercapitalized” or “critically undercapitalized,” its federal banking regulator would be required to take one or more prompt corrective actions that would, among other things require the bank to (i) raise additional capital by means of sales of common stock or nonredeemable preferred shares, (ii) improve its management, (iii) limit the interest rates it may pay on deposits, (iv) altogether prohibit transactions by the bank with its affiliates, (v) terminate certain activities that pose undue or unreasonable risks, and (vi) restrict the compensation being paid to its executive officers. If a bank is classified as critically undercapitalized, FDICIA requires the bank to be placed into conservatorship or receivership within 90 days, unless its federal banking regulatory agency determines that there are other measures that would enable the bank, within a relatively short period of time, to increase its capital in an amount sufficient to improve its capital classification under the prompt corrective action framework.
New Basel III Capital Rules
Prior to 2015, the risk-based capital rules applicable to domestic banks and bank holding companies were based on the 1988 capital accord of the International Basel Committee on Banking Supervision (the “Basel Committee”), which is comprised of central banks and bank supervisors and regulators from the major industrialized countries. The Basel Committee develops broad policy guidelines for use by each country’s banking regulators in determining the banking supervisory policies and rules they apply. In December 2010, the Basel Committee issued a new set of international guidelines for determining regulatory capital, known as “Basel III”. In June 2012, the FRB issued, for public comment, three notices of proposed rulemaking which, if adopted, would have made significant changes, consistent with the Basel III guidelines, to the regulatory risk-based capital and leverage requirements for banks and bank holding companies in the United States.
In July 2012, the FRB adopted final rules (the “New Capital Rules”) establishing a new comprehensive capital framework for U.S. banking organizations, and the FDIC subsequently adopted substantially identical rules. The rules implement the Basel Committee’s December 2010 framework for strengthening international capital standards as well as certain provisions of the Dodd-Frank Act. The New Capital Rules substantially revised the risk-based capital requirements applicable to U.S. banking organizations, including the Company and FFB, from the prior U.S. risk-based capital rules, redefined the components of capital and addressed other issues affecting the capital ratios applicable to banking organizations. The New Capital Rules also replaced the existing approach used in risk-weighting of a banking organization’s assets with a more risk-sensitive approach. The New Capital Rules became effective for the Company and FFB on January 1, 2015 (subject, in the case of certain of those Rules, to phase-in periods).
Among other things, the New Capital Rules (i) introduced a new capital measure called “Common Equity Tier 1” (“CET-1”), (ii) specified that Tier 1 capital consists of CET-1 and “Additional Tier 1 capital” instruments meeting specified requirements, (iii) made most deductions and adjustments to regulatory capital measures applicable to CET-,1 and not to the other components of capital, and expanded the scope of the deductions and adjustments from capital as compared to the prior capital rules, thus potentially requiring banking organizations to achieve and maintain higher levels of CET-1 in order to meet minimum capital ratios.
15
Under the New Capital Rules, the minimum capital ratios (including the applicable increment of the capital conservation buffer discussed below) as of January 1, 2016 are as follows:
|
CET-1 to risk-weighted assets |
|
5.125 |
% |
|
Tier 1 capital (i.e., CET-1 plus Additional Tier 1) to risk-weighted assets |
|
6.625 |
% |
|
Total capital (i.e., Tier 1 plus Tier 2) to risk-weighted assets |
|
8.625 |
% |
|
Tier 1 capital-to-average consolidated assets as reported on consolidated financial statements(1) |
|
4.0 |
% |
|
|
|
|
|
(1) |
Commonly referred to as a banking institution’s “leverage ratio”. |
When fully phased in on January 1, 2019, the New Capital Rules also will require the Company and FFB, as well as most other bank holding companies and banks, to maintain a 2.5% “capital conservation buffer,” on top of the minimum risk-weighted asset ratios set forth in the above table. This capital conservation buffer will have the effect of increasing (i) the CET-1-to-risk-weighted asset ratio to 7.0%, (ii) the Tier 1 capital-to-risk-weighted asset ratio to 8.5%, and (iii) the Total capital-to-risk weighted asset ratio to 10.5%.
The capital conservation buffer is designed to absorb losses during periods of economic stress. Banking organizations with risk-weighted asset ratios above the minimum, but below the capital conservation buffer, will face constraints on dividends, equity repurchases and executive compensation based on the amount of the shortfall. The implementation of the capital conservation buffer will begin on January 1, 2016 at 0.625%, and will increase by 0.625% on each subsequent January 1, until it reaches 2.5% on January 1, 2019.
The New Capital Rules provide for a number of deductions from and adjustments to CET-1. These include, for example, the requirement that mortgage servicing rights, deferred tax assets dependent upon future taxable income, and significant investments in common equity issued by nonconsolidated financial entities, be deducted from CET-1 to the extent that any one such category exceeds 10% of CET-1 or all such categories, in the aggregate, exceed 15% of CET-1. Other deductions and adjustments to CET-1 will be phased in incrementally between January 1, 2015 and January 1, 2018. On the other hand, the impact of these deductions and adjustments may be mitigated prior to or during the phase-in period by the determination of other than temporary impairments (“OTTI”) and additional accumulation of retained earnings. Under current capital standards, the effects of certain items of Accumulated Other Comprehensive Income (“AOCI”) included in capital are excluded for purposes of determining regulatory capital ratios. By contrast, under the New Capital Rules, the effects of certain items of AOCI will not be excluded. However, most banking organizations, including the Company and FFB, were entitled to make a one-time permanent election, not later than the call report for the quarter ended March 31, 2015, to continue to exclude these items from capital. In 2015, we elected to continue this exclusion.
The New Capital Rules require that trust preferred securities be phased out from Tier 1 capital by January 1, 2016, except in the case of banking organizations with total consolidated assets of less than $15 billion, which will be permitted to include trust preferred securities issued prior to May 19, 2010 in Tier 1 capital, subject to a limit of 25% of tier 1 capital elements.
The New Capital Rules prescribe a standardized approach for calculating risk-weighted assets that expand the risk-weighting categories from the former four Basel I-derived categories (0%, 20%, 50% and 100%) to larger and a greater number of risk-sensitive categories, depending on the nature of the assets, generally ranging from 0% for U.S. Government and agency securities, to 600% for certain equity exposures, and resulting in higher risk weights for a variety of asset categories. In addition, the New Capital Rules also provide more advantageous risk weights for derivatives and repurchase-style transactions cleared through a qualifying central counterparty and increase the scope of eligible guarantors and eligible collateral for purposes of credit risk mitigation.
The Deposit Insurance Fund and FDIC Deposit Insurance Premiums
The FDIC insures the deposits of the customers of all FDIC insured depository institutions up to prescribed limits for each depositor through a Deposit Insurance Fund (the “DIF”), from which it makes deposit insurance payments to depositors of failed depository institutions and from which it funds the costs incurred and against which it charges the losses sustained in connection with the closure or other resolution of those institutions. Due to higher levels of bank failures resulting from the recent recession and credit crisis, the insurance payments and the resolution costs increased significantly and largely depleted the DIF. In order to restore the DIF to a statutorily mandated minimum of 1.35% of total deposits which it insures (as compared to 1.15% prior to Dodd-Frank), the FDIC has increased deposit insurance premium rates. The FDIC uses a risk-based system to determine a depository institution’s insurance premium rate based on the institution’s classification. Institutions assigned to higher risk classifications (that is, institutions that pose a higher risk of loss to the DIF) pay premiums at higher rates than institutions that pose a lower risk. A depository institution’s risk classification is assigned based primarily on its capital levels and the level of supervisory concern which the institution poses to the DIF. The FDIC also has the authority, under certain circumstances, to further increase the insurance premium rates of depository
16
institutions. Any increase in FDIC insurance premiums assessed on FFB in the future would increase our noninterest expense and thereby reduce our profitability.
Additionally, all FDIC-insured institutions are required to pay assessments to the FDIC to fund interest payments on bonds issued by the Financing Corporation (“FICO”), an agency of the Federal government established to recapitalize the predecessor to the DIF. The FICO assessment rates, which are determined quarterly, averaged 0.066% of insured deposits in fiscal 2015. These assessments will continue until the FICO bonds mature in 2017.
Community Reinvestment Act and Fair Lending Developments
Like all other federally regulated banks, FFB is subject to fair lending requirements and the evaluation of its small business operations under the CRA. The CRA generally requires the federal banking regulatory agencies to evaluate the record of a bank in meeting the credit needs of its local communities, including those of low and moderate income neighborhoods in its service area. A bank’s compliance with its CRA obligations is based on a performance-based evaluation system which determines the bank’s CRA ratings on the basis of its community lending and community development performance. A bank may have substantial penalties imposed on it and generally will be required to take corrective measures in the event it fails to meet its obligations under the CRA. Federal banking agencies also may take compliance with the CRA and other fair lending laws into account when regulating and supervising other activities of a bank or its bank holding company. Moreover, when a bank holding company files an application for approval to acquire a bank or another bank holding company, the federal banking regulatory agency to which the application is assigned will review the CRA assessment of the subsidiary bank or banks of the applicant bank holding company, and a low CRA rating may be the basis for requiring the applicant’s bank subsidiary to take corrective actions to improve its CRA performance as a condition to the approval of the acquisition or as a basis for denying the application altogether.
USA Patriot Act of 2001 and Bank Secrecy Act
In October 2001, the Uniting and Strengthening America by Providing Appropriate Tools Required to Intercept and Obstruct Terrorism of 2001 (the “USA Patriot Act”) was enacted into law in response to the September 11, 2001 terrorist attacks. The USA Patriot Act was adopted to strengthen the ability of U.S. law enforcement and intelligence agencies to work cohesively to combat terrorism on a variety of fronts. Of particular relevance to banks and other federally insured depository institutions are the USA Patriot Act’s sweeping anti-money laundering and financial transparency provisions and various related implementing regulations that:
|
|
● |
establish due diligence requirements for financial institutions that administer, maintain, or manage private bank accounts and foreign correspondent accounts; |
|
|
● |
prohibit U.S. institutions from providing correspondent accounts to foreign shell banks; |
|
|
● |
establish standards for verifying client identification at account opening; and |
|
|
● |
set rules to promote cooperation among financial institutions, regulatory agencies and law enforcement entities in identifying parties that may be involved in terrorism or money laundering. |
Under implementing regulations issued by the U.S. Treasury Department, banking institutions are required to incorporate a client identification program into their written money laundering plans that includes procedures for:
|
|
● |
verifying the identity of any person seeking to open an account, to the extent reasonable and practicable; |
|
|
● |
maintaining records of the information used to verify the person’s identity; and |
|
|
● |
determining whether the person appears on any list of known or suspected terrorists or terrorist organizations. |
The Company and FFB also are subject to the federal Bank Secrecy Act of 1970, as amended (the “Bank Secrecy Act”), which establishes requirements for recordkeeping and reporting by banks and other financial institutions designed to help identify the source, volume and movement of currency and monetary instruments into and out of the United States to help detect and prevent money laundering and other illegal activities. The Bank Secrecy Act requires financial institutions to develop and maintain a program reasonably designed to ensure and monitor compliance with its requirements, to train employees to comply with and to test the effectiveness of the program. Any failure to meet the requirements of the Bank Secrecy Act can result in the imposition of substantial penalties and in adverse regulatory action against the offending bank. FFI and FFB have each adopted policies and procedures to comply with the Bank Secrecy Act.
Consumer Laws and Regulations
17
The Company and FFB are subject to a broad range of federal and state consumer protection laws and regulations prohibiting unfair or fraudulent business practices, untrue or misleading advertising and unfair competition. Those laws and regulations include:
|
|
● |
The Home Ownership and Equity Protection Act of 1994, which requires additional disclosures and consumer protections to borrowers designed to protect them against certain lending practices, such as practices deemed to constitute “predatory lending.” |
|
|
● |
The Fair Credit Reporting Act, as amended by the Fair and Accurate Credit Transactions Act, which requires banking institutions and financial services businesses to adopt practices and procedures designed to help deter identity theft, including developing appropriate fraud response programs, and provides consumers with greater control of their credit data. |
|
|
● |
The Truth in Lending Act which requires that credit terms be disclosed in a meaningful and consistent way so that consumers may compare credit terms more readily and knowledgeably. |
|
|
● |
The Equal Credit Opportunity Act, which generally prohibits, in connection with any consumer or business credit transactions, discrimination on the basis of race, color, religion, national origin, sex, marital status, age (except in limited circumstances), or the fact that a borrower is receiving income from public assistance programs. |
|
|
● |
The Fair Housing Act, which regulates many lending practices, including making it unlawful for any lender to discriminate in its housing-related lending activities against any person because of race, color, religion, national origin, sex, handicap or familial status. |
|
|
● |
The Home Mortgage Disclosure Act, which includes a “fair lending” aspect that requires the collection and disclosure of data about applicant and borrower characteristics as a way of identifying possible discriminatory lending patterns and enforcing anti-discrimination statutes. |
|
|
● |
The Real Estate Settlement Procedures Act, which requires lenders to provide borrowers with disclosures regarding the nature and cost of real estate settlements and prohibits certain abusive practices, such as kickbacks. |
|
|
● |
The National Flood Insurance Act, which requires homes in flood-prone areas with mortgages from a federally regulated lender to have flood insurance. |
|
|
● |
The Secure and Fair Enforcement for Mortgage Licensing Act of 2008, which requires mortgage loan originator employees of federally insured institutions to register with the Nationwide Mortgage Licensing System and Registry, a database created by the states to support the licensing of mortgage loan originators, prior to originating residential mortgage loans. |
Consumer Financial Protection Bureau
The Dodd-Frank Act created a new, independent federal agency, called the Consumer Financial Protection Bureau, which has been granted broad rulemaking, supervisory and enforcement powers under various federal consumer financial protection laws, including the Equal Credit Opportunity Act, Truth in Lending Act, Real Estate Settlement Procedures Act, Fair Credit Reporting Act, Fair Debt Collection Act, the Consumer Financial Privacy provisions of the Gramm-Leach-Bliley Act and certain other statutes. The CFPB has examination and primary enforcement authority with respect to the compliance by depository institutions with $10 billion or more in assets with federal consumer protection laws and regulations. Smaller institutions are subject to rules promulgated by the CFPB, but continue to be examined and supervised by federal banking regulators for consumer compliance purposes. The CFPB has authority to prevent unfair, deceptive or abusive practices in connection with the offering of consumer financial products. The Dodd-Frank Act also (i) authorizes the CFPB to establish certain minimum standards for the origination of residential mortgages, including a determination of the borrower’s ability to repay, and (ii) will allow borrowers to raise certain defenses to foreclosure if they receive any loan other than a “qualified mortgage” as defined by the CFPB. The Dodd-Frank Act permits states to adopt consumer protection laws and standards that are more stringent than those adopted at the federal level and, in certain circumstances, permits state attorneys general to enforce compliance with both the state and federal financial consumer protection laws and regulations.
In January 2013, the CFPB approved certain mortgage lending reform regulations impacting the Truth in Lending Act (the “TILA”) and the Real Estate Settlement Procedures Act (“RESPA”). Among other things, those reforms:
|
|
● |
expand the population of loans that are subject to higher cost loan regulations and additional disclosures; |
|
|
● |
prohibit the payment of compensation to mortgage brokers based on certain fees or premiums, such as yield spread premiums, payable by or charged to home borrowers; |
|
|
● |
increase the regulation of mortgage servicing activities, including with respect to error resolution, forced-placement insurance and loss mitigation and collection activities; |
18
|
|
● |
impose appraisal requirements for high cost loans and loans secured by first mortgage liens on residential real estate. |
The CFPB also issued final rules for residential mortgage lending, which became effective January 10, 2014, including definitions for “qualified mortgages” and detailed standards by which leaders must satisfy themselves of the borrower’s ability to repay the loan and revised forms of disclosure under the TILA and RESPA. New CFPB disclosure rules for residential mortgages went into effect in October 2015.
Debit Card Fees
The Dodd-Frank Act provides that the amount of any interchange fee charged by a debit card issuer with respect to a debit card transaction must be reasonable and proportional to the cost incurred by the card issuer and requires the FRB to establish standards for reasonable and proportional fees which may take into account the costs of preventing fraud. As a result, the FRB adopted a rule, effective October 1, 2011, which limits interchange fees on debit card transactions to a maximum of 21 cents per transaction plus 5 basis points of the transaction amount. A debit card issuer may recover an additional one cent per transaction for fraud prevention purposes if the issuer complies with certain fraud-related requirements prescribed by the FRB. Although, as a technical matter, this new limitation applies only to institutions with assets of more than $10 billion, it is expected that many smaller institutions will reduce their interchange fees in order to remain competitive with the larger institutions that are required to comply with this new limitation.
First Foundation Advisors
Registered Investment Adviser Regulation
FFA is a registered investment adviser under the Investment Advisers Act and the SEC’s regulations promulgated thereunder. The Investment Advisers Act imposes numerous obligations on registered investment advisers, including fiduciary, recordkeeping, operational, and disclosure obligations. FFA is also subject to regulation under the securities laws and fiduciary laws of certain states and to Employee Retirement Income Security Act of 1974 (“ERISA”), and to regulations promulgated thereunder, insofar as it is a “fiduciary” under ERISA with respect to certain of its clients. ERISA and the applicable provisions of the Code, impose certain duties on persons who are fiduciaries under ERISA, and prohibit certain transactions by the fiduciaries (and certain other related parties) to such plans. The foregoing laws and regulations generally grant supervisory agencies broad administrative powers, including the power to limit or restrict FFA from conducting its business in the event that it fails to comply with such laws and regulations. Possible sanctions that may be imposed in the event of such noncompliance include the suspension of individual employees, limitations on the business activities for specified periods of time, revocation of registration as an investment adviser and/or other registrations, and other censures and fines. Changes in these laws or regulations could have a material adverse impact on the profitability and mode of operations of FFI and its subsidiaries.
Future Legislation
Congress may enact legislation from time to time that affects the regulation of the financial services industry, and state legislatures may enact legislation from time to time affecting the regulation of financial institutions chartered by or operating in those states. Federal and state regulatory agencies also periodically propose and adopt changes to their regulations or change the manner in which existing regulations are applied. The substance or impact of pending or future legislation or regulations, or the application thereof, cannot be predicted, although enactment of the proposed legislation could impact the regulatory structure under which we operate and may significantly increase our costs, impede the efficiency of our internal business processes, require us to increase our regulatory capital, modify our business strategy and limit our ability to pursue business opportunities in an efficient manner.
Employees
As of December 31, 2015, the Company had approximately 295 full-time employees.
Available Information
The Company’s annual reports on Form 10-K, the proxy statements, quarterly reports on Form 10-Q, current reports on Form 8-K, and amendments to those reports filed or furnished pursuant to Section 13 (a) or 15 (d) of the Exchange Act are accessible for free at the Investor Relations section of our website at www.ff-inc.com as soon as reasonably practicable after the Company
19
electronically files such material with, or furnishes it to, the SEC. These reports are also available for free on the SEC’s website at www.sec.gov. Additionally, these reports can be found and copied at the SEC’s Public Reference Room at 100 F Street, N.E., Washington, DC 20549, or by calling the SEC at 1-800-SEC-0330. All website addresses given in this report are for information only and are not intended to be an active link or to incorporate any website information into this report.
Our business is subject to a number of risks and uncertainties that could prevent us from achieving our business objectives and could hurt our future financial performance and the price performance of our common stock. Such risks and uncertainties also could cause our future financial condition and future financial performance to differ significantly from our current expectations, which are described in the forward-looking statements contained in this report. Those risks and uncertainties, many of which are outside of our ability to control or prevent, include the following:
Risks Related to Our Business
We could incur losses on the loans we make.
Loan defaults and the incurrence of losses on loans are inherent risks in our business. The incurrence of loan losses necessitate loan charge-offs and write-downs in the carrying values of a banking organization’s loans and, therefore, can adversely affect its results of operations and financial condition. Accordingly, our results of operations will be directly affected by the volume and timing of loan losses, which for a number of reasons can vary from period to period. The risks of loan losses are exacerbated by economic recessions and downturns, or by other events that can lead to local or regional business downturns. If there is a sustained weakness or further weakening in business and economic conditions generally or specifically in the principal markets in which we do business, more of our borrowers may fail to perform in accordance with the terms of their loans, in which event loan charge-offs and asset write-downs could increase, which could have a material adverse effect on our business, financial condition, results of operations and prospects.
Our allowance for credit losses may not be adequate to cover actual losses.
In accordance with regulatory requirements and generally accepted accounting principles in the United States, we maintain an allowance for loan and lease losses (“ALLL”) to provide for loan and lease defaults and non-performance and a reserve for unfunded loan commitments, which, when combined, we refer to as the allowance for credit losses. Our allowance for credit losses may not be adequate to absorb actual credit losses, and future provisions for credit losses could materially and adversely affect our operating results. Our allowance for credit losses is based on prior experience and an evaluation of the risks inherent in the current portfolio. The amount of future losses may also vary depending on changes in economic, operating and other conditions, including changes in interest rates that may be beyond our control, and these losses may exceed current estimates. Our federal and state regulators, as an integral part of their examination process, review our loans and leases and allowance for credit losses. While we believe our allowance for credit losses is appropriate for the risk identified in our loan and lease portfolio, we cannot provide assurance that we will not further increase the allowance for credit losses, that it will be sufficient to address losses, or that regulators will not require us to increase this allowance. Any of these occurrences could materially and adversely affect our financial condition and results of operations.
Our business and operations may be adversely affected in numerous and complex ways by weak economic conditions.
Our businesses and operations, which primarily consist of lending money to customers in the form of loans, borrowing money from customers in the form of deposits and investing in securities, are sensitive to general business and economic conditions in the United States. If the United States economy weakens, our growth and profitability from our lending, deposit and investment operations could be constrained. Uncertainty about the federal fiscal policymaking process, the medium and long-term fiscal outlook of the federal government, and future tax rates is a concern for businesses, consumers and investors in the United States. In addition, economic conditions in foreign countries could affect the stability of global financial markets, which could hinder United States economic growth. Weak economic conditions are characterized by deflation, fluctuations in debt and equity capital markets, a lack of liquidity and/or depressed prices in the secondary market for loans, increased delinquencies on mortgage, consumer and commercial loans, residential and commercial real estate price declines and lower home sales and commercial activity. The current economic environment is also characterized by interest rates at historically low levels, which impacts our ability to attract deposits and to generate attractive earnings through our investment portfolio. All of these factors are detrimental to our business, and the interplay between these factors can be complex and unpredictable. Adverse economic conditions and government policy responses to such conditions could have a material adverse effect on our business, financial condition and results of operations.
20
Our banking, investment advisory and wealth management operations are geographically concentrated in California, Nevada and Hawaii, leading to significant exposure to those markets.
Our business activities and credit exposure, including real estate collateral for many of our loans, are concentrated in California, Nevada and Hawaii, as approximately 95% of the loans in our loan portfolio were made to borrowers who live and/or conduct business in those states. This geographic concentration imposes risks from lack of geographic diversification. Difficult economic conditions, including state and local government deficits, in California, Nevada and Hawaii may affect our business, financial condition, results of operations and future prospects, where adverse economic developments, among other things, could affect the volume of loan originations, increase the level of nonperforming assets, increase the rate of foreclosure losses on loans and reduce the value of our loans and loan servicing portfolio. Any regional or local economic downturn that affects California, Nevada or Hawaii or existing or prospective borrowers or property values in such areas may affect us and our profitability more significantly and more adversely than our competitors whose operations are less geographically concentrated.
Changes in interest rates could reduce our net interest margins and net interest income.
Income and cash flows from our banking operations depend to a great extent on the difference or “spread” between the interest we earn on interest-earning assets, such as loans and investment securities, and the rates at which we pay interest on interest-bearing liabilities, such as deposits and borrowings. However, interest rates are highly sensitive to many factors that are beyond our control, including (among others) general and regional and local economic conditions, the monetary policies of the Federal Reserve, bank regulatory requirements, competition from other banks and financial institutions and a change over time in the mix of our loans, investment securities, on the one hand, and on our deposits and other liabilities, on the other hand. Changes in monetary policy will, in particular, influence the origination and market value of and the yields we can realize on loans and investment securities and the interest we pay on deposits. Additionally, sustained low levels of market interest rates, as we have experienced during the past five years, could continue to place downward pressure on our net interest margins and, therefore, on our earnings. Our net interest margins and earnings also could be adversely affected if we are unable to adjust our interest rates on loans and deposits on a timely basis in response to changes in economic conditions or monetary policies. For example, if the rates of interest we pay on deposits, borrowings and other interest-bearing liabilities increase faster than we are able to increase the rates of interest we charge on loans or the yields we realize on investments and other interest-earning assets, our net interest income and, therefore, our earnings will decrease. On the other hand, increasing interest rates generally lead to increases in net interest income; however, such increases also may result in a reduction in loan originations, declines in loan prepayment rates and reductions in the ability of borrowers to repay their current loan obligations, which could result in increased loan defaults and charge-offs and could require increases to our ALLL, thereby offsetting either partially or totally the increases in net interest income resulting from the increase in interest rates. Additionally, we could be prevented from increasing the interest rates we charge on loans or from reducing the interest rates we offer on deposits due to “price” competition from other banks and financial institutions with which we compete. Conversely, in a declining interest rate environment, our earnings could be adversely affected if the interest rates we are able to charge on loans or other investments decline more quickly than those we pay on deposits and borrowings.
Real estate loans represent a high percentage of the loans we make, making our results of operations vulnerable to downturns in the real estate market.
At December 31, 2015, loans secured by multifamily and commercial real estate represented approximately 56% of our outstanding loans. The repayment of such loans is highly dependent on the ability of the borrowers to meet their loan repayment obligations to us, which can be adversely affected by economic downturns that can lead to (i) declines in the rents and, therefore, in the cash flows generated by those real properties on which the borrowers depend to fund their loan payments to us, and (ii) decreases in the values of those real properties, which make it more difficult for the borrowers to sell those real properties for amounts sufficient to repay their loans in full. As a result, our operating results are more vulnerable to adverse changes in the real estate market than other financial institutions with more diversified loan portfolios and we could incur losses in the event of changes in economic conditions that disproportionately affect the real estate markets.
Liquidity risk could adversely affect our ability to fund operations and hurt our financial condition.
Liquidity is essential to our banking business, as we use cash to make loans and purchase investment securities and other interest-earning assets and to fund deposit withdrawals that occur in the ordinary course of our business. Our principal sources of liquidity include earnings, deposits, FHLB borrowings, sales of loans or investment securities held for sale, repayments by clients of loans we have made to them, and the proceeds from sales by us of our equity securities or from borrowings that we may obtain. If the ability to obtain funds from these sources becomes limited or the costs of those funds increase, whether due to factors that affect us specifically, including our financial performance, or due to factors that affect the financial services industry in general, including weakening economic conditions or negative views and expectations about the prospects for the financial services industry as a whole, then our ability to grow our banking and investment advisory and wealth management businesses would be harmed, which could have a material adverse effect on our business, financial condition, results of operations and prospects.
21
We may not be able to maintain a strong core deposit base or other low-cost funding sources.
We depend on checking, savings and money market deposit account balances and other forms of customer deposits as our primary source of funding for our lending activities. Our future growth will largely depend on our ability to maintain and grow a strong deposit base. There is no assurance that we will be able to grow and maintain our deposit base. The account and deposit balances can decrease when customers perceive alternative investments, such as the stock market, as providing a better risk/return tradeoff. If customers move money out of bank deposits and into investments (or similar deposit products at other institutions that may provide a higher rate of return), we could lose a relatively low cost source of funds, increasing our funding costs and reducing our net interest income and net income. Additionally, any such loss of funds could result in lower loan originations, which could materially negatively impact our growth strategy.
Our 6 largest deposit clients account for 24% of our total deposits.
As of December 31, 2015, our 6 largest bank depositors accounted for, in the aggregate, 24% of our total deposits. As a result, a material decrease in the volume of those deposits by a relatively small number of our depositors could reduce our liquidity, in which event it could became necessary for us to replace those deposits with higher-cost deposits, lower-yielding securities or FHLB borrowings, which would adversely affect our net interest income and, therefore, our results of operations.
Although we plan to grow our business by acquiring other banks, there is no assurance that we will succeed in doing so.
One of the key elements of our business plan is to grow our banking franchise and increase our market share, and for that reason, we intend to take advantage of opportunities to acquire other banks. However, there is no assurance that we will succeed in doing so. Our ability to execute on our strategy to acquire other banks may require us to raise additional capital and to increase FFB’s capital position to support the growth of our banking franchise, and will also depend on market conditions, over which we have no control. Moreover, any bank acquisitions will require the approval of our bank regulators and there can be no assurance that we will be able to obtain such approvals on acceptable terms, if at all.
Our acquisitions may subject us to unknown risks.
Certain events may arise after the date of an acquisition, or we may learn of certain facts, events or circumstances after the closing of an acquisition, that may affect our financial condition or performance or subject us to risk of loss. These events include, but are not limited to: litigation resulting from circumstances occurring at the acquired entity prior to the date of acquisition; loan downgrades and credit loss provisions resulting from underwriting of certain acquired loans determined not to meet our credit standards; personnel changes that cause instability within a department; delays in implementing new policies or procedures or the failure to apply new policies or procedures; and other events relating to the performance of our business. Acquisitions involve inherent uncertainty and we cannot determine all potential events, facts and circumstances that could result in loss or increased costs or give assurances that our due diligence or mitigation efforts will be sufficient to protect against any such loss or increased costs.
Our ability to execute strategic activities successfully will depend on a variety of factors. These factors likely will vary based on the nature of the activity but may include our success in integrating the operations, services, products, personnel and systems of an acquired company into our business, operating effectively with any partner with whom we elect to do business, retaining key employees, achieving anticipated synergies, meeting expectations and otherwise realizing the undertaking's anticipated benefits. Our ability to address these matters successfully cannot be assured. In addition, our strategic initiatives may divert resources or management's attention from ongoing business operations and may subject us to additional regulatory scrutiny. If we do not successfully execute a strategic undertaking, it could adversely affect our business, financial condition, results of operations, reputation, regulatory relationships and growth prospects. In addition, if we determined that the value of an acquired business had decreased and that the related goodwill was impaired, an impairment of goodwill charge to earnings would be recognized. To the extent we issue capital stock in connection with additional transactions, these transactions and related stock issuances may have a dilutive effect on book value, earnings per share and share ownership.
Growing our banking business may not increase our profitability and may adversely affect our future operating results.
Since we commenced our banking business in October 2007, we have grown our banking franchise and now have nine branch offices and three loan production offices in California, Nevada and Hawaii. We plan to continue to grow our banking business both organically and through acquisitions of other banks. However, the implementation of our growth strategy poses a number of risks for us, including:
22
|
|
● |
the risk that any newly established wealth management offices will not generate revenues in amounts sufficient to cover the start-up costs of those offices, which would reduce our earnings; |
|
|
● |
the risk that any bank acquisitions we might consummate in the future will prove not to be accretive to or may reduce our earnings if we do not realize anticipated cost savings or if we incur unanticipated costs in integrating the acquired banks into our operations or if a substantial number of the clients of any of the acquired banks move their banking business to our competitors; |
|
|
● |
the risk that such expansion efforts will divert management time and effort from our existing banking operations, which could adversely affect our future financial performance; and |
|
|
● |
the risk that the additional capital which we may need to support our growth or the issuance of shares in any bank acquisitions will be dilutive of the investments that our existing stockholders have in the shares of our common stock that they own and in their respective percentage ownership interests they have in the Company. |
We may not have the ability to attract capital necessary to maintain regulatory ratios and fund growth.
We may need to raise additional capital in the future to provide us with sufficient capital resources and liquidity to meet our commitments and business needs, particularly if our asset quality or earnings were to deteriorate. Our ability to raise additional capital, if needed, will depend on several things, especially conditions in the capital markets at that time, that are outside of our control, as well as our own financial performance. Economic conditions and the loss of confidence in financial institutions may increase our cost of funds and limit our access to some customary sources of capital. We cannot provide assurances that such capital will be available on acceptable terms or at all. Any occurrence that may limit our access to the capital markets, such as a decline in the confidence of debt purchasers, our depositors, or counterparties participating in the capital markets may adversely affect our capital costs, ability to raise capital, and liquidity. Moreover, if we need to raise capital in the future, we may have to do so when many other financial institutions are also seeking to raise capital which, in turn, would require that we compete with those other institutions for investors. An inability to raise additional capital on acceptable terms when needed could have a materially adverse effect on our financial condition and results of operations.
New lines of business or new products and services may subject us to additional risks.
From time to time, we may implement new lines of business or offer new products and services within existing lines of business. There are substantial risks and uncertainties associated with these efforts. We may invest significant time and resources in developing and marketing new lines of business and/or new products and services. Initial timetables for the introduction and development of new lines of business and/or new products or services may not be achieved and price and profitability targets may not prove feasible or may be dependent on identifying and hiring a qualified person to lead the division. In addition, existing management personnel may not have the experience or capacity to provide effective oversight of new lines of business and/or new products and services.
External factors, such as compliance with regulations, competitive alternatives, and shifting market preferences, may also impact the successful implementation of a new line of business or a new product or service. Furthermore, any new line of business and/or new product or service could have a significant impact on the effectiveness of our system of internal controls. Failure to successfully manage these risks in the development and implementation of new lines of business or new products or services could have a material adverse effect on our business, results of operations, financial condition and prospects.
A reduction in demand for our products and our failure to adapt to such a reduction could adversely affect our business, results of operations and financial condition.
The demand for the products that we offer may be reduced due to a variety of factors, such as demographic patterns, changes in customer preferences or financial conditions, regulatory restrictions that decrease customer access to particular products, or the availability of competing products. Should we fail to adapt to significant changes in our customers’ demand for, or access to, our products, our revenues could decrease significantly and our operations could be harmed. Even if we do make changes to existing products or introduce new products to fulfill customer demand, customers may resist such changes or may reject such products. Moreover, the effect of any product change on the results of our business may not be fully ascertainable until the change has been in effect for some time, and, by that time, it may be too late to make further modifications to such product without causing further harm to our business, results of operations, and financial condition.
We face intense competition from other banks and financial institutions and other wealth and investment management firms that could hurt our business.
23
We conduct our business operations in markets where the banking business is highly competitive and is dominated by large multi-state and in-state banks with operations and offices covering wide geographic areas. We also compete with other financial service businesses, including investment advisory and wealth management firms, mutual fund companies, and securities brokerage and investment banking firms that offer competitive banking and financial products and services as well as products and services that we do not offer. Larger banks and many of those other financial service organizations have greater financial and marketing resources that enable them to conduct extensive advertising campaigns and to shift resources to regions or activities of greater potential profitability. They also have substantially more capital and higher lending limits, which enable them to attract larger clients and offer financial products and services that we are unable to offer, putting us at a disadvantage in competing with them for loans and deposits and investment management clients. If we are unable to compete effectively with those banking or other financial services businesses, we could find it more difficult to attract new and retain existing clients and our net interest margins, net interest income and investment management advisory fees could decline, which would adversely affect our results of operations and could cause us to incur losses in the future.
In addition, our ability to successfully attract and retain investment advisory and wealth management clients is dependent on our ability to compete with competitors’ investment products, level of investment performance, client services and marketing and distribution capabilities. If we are not successful in retaining existing and attracting new investment management clients, our business, financial condition, results of operations and prospects may be materially and adversely affected.
The loss of key personnel or inability to attract additional personnel could hurt our future financial performance.
We currently depend heavily on the contributions and services provided by Rick Keller, our Executive Chairman, Scott Kavanaugh, Chief Executive Officer of FFI and FFB, David DePillo, President of FFB, John Hakopian, President of FFA, and John Michel, Chief Financial Officer of FFI, FFB and FFA, as well as a number of other key management personnel. Our future success also will depend, in part, on our ability to retain our existing, and attract additional, qualified private banking officers, relationship managers and investment advisory personnel. Competition for such personnel is intense. If we are not successful in retaining and attracting key personnel, our ability to retain existing clients or attract new clients could be adversely affected and our business, financial condition, results of operations or prospects could as a result be significantly harmed.
We are required to make significant estimates and assumptions in the preparation of our financial statements and our estimates and assumptions may not be accurate.
The preparation of our consolidated financial statements in conformity with generally accepted accounted principles in the United States of America requires our management to make significant estimates and assumptions that affect the reported amounts of assets and liabilities and disclosures of contingent assets and liabilities at the date of the consolidated financial statements, and the reported amounts of income and expense during the reporting periods. Critical estimates are made by management in determining, among other things, the allowance for loan losses, amounts of impairment, and valuation of income taxes. If our underlying estimates and assumptions prove to be incorrect, our financial condition and results of operations may be materially adversely affected.
The fair value of our investment securities can fluctuate due to factors outside of our control.
As of December 31, 2015, the fair value of our investment securities portfolio was $565.1 million. Factors beyond our control can significantly influence and cause adverse changes to occur in the fair values of securities in that portfolio. These factors include, but are not limited to, rating agency actions in respect of the securities, defaults by the issuers of the securities, concerns with respect to the enforceability of the payment or other key terms of the securities, changes in market interest rates and continued instability in the capital markets. Any of these factors, as well as others, could cause other-than-temporary impairments and realized and/or unrealized losses in future periods and declines in other comprehensive income, which could materially and adversely affect our business, results of operations, financial condition and prospects. In addition, the process for determining whether an impairment of a security is other-than-temporary usually requires complex, subjective judgments, which could subsequently prove to have been wrong, regarding the future financial performance and liquidity of the issuer of the security, the fair value of any collateral underlying the security and whether and the extent to which the principal of and interest on the security will ultimately be paid in accordance with its payment terms.
A loss or material reduction of access to securitization markets for multifamily loans may adversely impact our business model, profitability and growth.
We intend to sell multifamily loans through securitization market. The securitization market, along with credit markets in general, experienced unprecedented disruptions during the recent economic downturn. Although market conditions have improved since 2009, for a number of years following the economic downturn, certain issuers experienced increased risk premiums while there was a relatively lower level of investor demand for certain asset-backed securities (particularly those securities backed by nonprime
24
collateral). In addition, the risk of volatility surrounding the global economic system and uncertainty surrounding regulatory reforms such as the Dodd-Frank Act continue to create uncertainty around access to the capital markets. As a result, there can be no assurance that we will continue to be successful in selling multifamily loans through the securitization market. Adverse changes in the securitization market generally could materially adversely affect our ability to securitize loans on a timely basis or upon terms acceptable to us. This could increase our cost of funding, reduce our margins or cause us to hold assets until investor demand improves.
Technology and marketing costs may negatively impact our future operating results.
The financial services industry is constantly undergoing technological changes in the types of products and services provided to clients to enhance client convenience. Our future success will depend upon our ability to address the changing technological needs of our clients and to compete with other financial services organizations which have successfully implemented new technologies. The costs of implementing technological changes, new product development and marketing costs may increase our operating expenses without a commensurate increase in our business or revenues, in which event our business, financial condition, results of operations and prospects could be materially and adversely affected.
The occurrence of fraudulent activity, breaches of our information security, and cyber-security attacks could have a material adverse effect on our business, financial condition, results of operations or future prospects.
As a financial institution, we are susceptible to fraudulent activity, information security breaches and cybersecurity-related incidents that may be committed against us or our clients and that may result in financial losses or increased costs to us or our clients, disclosure or misuse of confidential information belonging to us or personal or confidential information belonging to our clients, misappropriation of assets, litigation, or damage to our reputation. Fraudulent activity may take many forms, including check “kiting” or fraud, electronic fraud, wire fraud, “phishing” and other dishonest acts. Information security breaches and cybersecurity-related incidents may include fraudulent or unauthorized access to data processing or data storage systems used by us or by our clients, denial or degradation of service attacks, and malware or other cyber-attacks. We have been seeing increases in electronic fraudulent activity, security breaches and cyber-attacks within the financial services industry, including in the commercial banking sector, as cyber-criminals have been targeting commercial bank and brokerage accounts on an increasing basis. Moreover, in recent periods, several large corporations, including financial service organizations and retail companies, have suffered major data breaches, in some cases exposing not only their confidential and proprietary corporate information, but also sensitive financial and other personal information of their clients or customers and their employees, and subjecting those corporations to potential fraudulent activity and their clients and customers to identity theft and fraudulent activity in their credit card and banking accounts. Therefore, security breaches and cyber-attacks can cause significant increases in operating costs, including the costs of compensating clients and customers for any resulting losses they may incur and the costs and capital expenditures required to correct the deficiencies in and strengthen the security of data processing and storage systems.
Although we invest in systems and processes that are designed to detect and prevent security breaches and cyber-attacks and we conduct periodic tests of our security systems and processes, there is no assurance that we will succeed in anticipating or adequately protecting against or preventing all security breaches and cyber-attacks from occurring due to a number of possible causes, many of which will be outside of our control, including the changing nature and increasing frequency of such attacks, the increasing sophistication of cyber-criminals, and possible weaknesses that go undetected in our data systems notwithstanding the testing we conduct of those systems. If we are unable to detect or prevent a security breach or cyber-attack from occurring, then, we and our clients could incur losses or damages; and we could sustain damage to our reputation, lose clients and business, suffer disruptions to our business and incur increased operating costs, and be exposed to additional regulatory scrutiny or penalties and to civil litigation and possible financial liability, any of which could have a material adverse effect on our business, financial condition, results of operations and future prospects.
We rely on communications, information, operating and financial control systems technology and related services from third-party service providers and there can be no assurance that we will not suffer an interruption in those systems.
We rely heavily on third-party service providers for much of our communications, information, operating and financial control systems technology, including our internet banking services and data processing systems. Any failure or interruption of, or security breaches in, these systems could result in failures or interruptions in our operations or in the client services we provide. Additionally, interruptions in service and security breaches could damage our reputation, lead existing clients to terminate their business relationships with us, make it more difficult for us to attract new clients and subject us to additional regulatory scrutiny and possibly financial liability, any of which could have a material adverse effect on our business, financial condition, results of operations and prospects.
Our ability to attract and retain clients and key employees could be adversely affected if our reputation is harmed.
25
The ability of FFB and FFA to attract and retain clients and key employees could be adversely affected if our reputation is harmed. Any actual or perceived failure to address various issues could cause reputational harm, including a failure to address any of the following types of issues: legal and regulatory requirements; the proper maintenance or protection of the privacy of client and employee financial or other personal information; record keeping deficiencies or errors; money-laundering; potential conflicts of interest and ethical issues. Moreover, any failure to appropriately address any issues of this nature could give rise to additional regulatory restrictions, and legal risks, which could lead to costly litigation or subject us to enforcement actions, fines, or penalties and cause us to incur related costs and expenses. In addition, our banking, investment advisory and wealth management businesses are dependent on the integrity of our banking personnel and our investment advisory and wealth managers. Lapses in integrity could cause reputational harm to our businesses that could lead to the loss of existing clients and make it more difficult for us to attract new clients and, therefore, could have a material adverse effect on our business, financial condition, results of operations and prospects.
We may incur significant losses due to ineffective risk management processes and strategies.
We seek to monitor and control our risk exposures through a risk and control framework encompassing a variety of separate but complementary financial, credit, operational and compliance systems, and internal control and management review processes. However, those systems and review processes and the judgments that accompany their application may not be effective and, as a result, we may not anticipate every economic and financial outcome in all market environments or the specifics and timing of such outcomes, particularly in the event of the kinds of dislocations in market conditions experienced over the last several years, which highlight the limitations inherent in using historical data to manage risk. If those systems and review processes prove to be ineffective in identifying and managing risks, we could be subjected to increased regulatory scrutiny and regulatory restrictions could be imposed on our business, including on our growth, as a result of which our business and operating results could be adversely affected.
A natural disaster could harm our business.
Historically, California, in which a substantial portion of our business is located, has been susceptible to natural disasters, such as earthquakes, floods and wild fires. The nature and level of natural disasters cannot be predicted. These natural disasters could harm our operations through interference with communications, including the interruption or loss of our computer systems, which could prevent or impede us from gathering deposits, originating loans and processing and controlling our flow of business, as well as through the destruction of facilities and our operational, financial and management information systems. Additionally, natural disasters could negatively impact the values of collateral securing borrowers’ loans and interrupt borrowers’ abilities to conduct their business in a manner to support their debt obligations, either of which could result in losses and increased provisions for loan losses.
We are exposed to risk of environmental liabilities with respect to real properties that we may acquire.
From time to time, in the ordinary course of our business, we acquire, by or in lieu of foreclosure, real properties which collateralize nonperforming loans (“Real Estate Owned” or “REO”). As an owner of such properties, we could become subject to environmental liabilities and incur substantial costs for any property damage, personal injury, investigation and clean-up that may be required due to any environmental contamination that may be found to exist at any of those properties, even if we did not engage in the activities that led to such contamination and those activities took place prior to our ownership of the properties. In addition, if we are the owner or former owner of a contaminated site, we may be subject to common law claims by third parties seeking damages for environmental contamination emanating from the site. If we were to become subject to significant environmental liabilities or costs, our business, financial condition, results of operations and prospects could be materially and adversely affected.
Our investment advisory and wealth management business may be negatively impacted by changes in economic and market conditions.
Our investment advisory and wealth management business may be negatively impacted by changes in general economic and market conditions because the performance of that business is directly affected by conditions in the financial and securities markets. The performance of the financial markets and the businesses operating in the securities industry can be highly volatile within relatively short periods of time and is directly affected by, among other factors, domestic and foreign economic conditions and general trends in business and finance, and by the threat, as well as the occurrence, of global conflicts, all of which are beyond our ability to control. We cannot assure you that broad market performance will be favorable in the future. Declines or a lack of sustained growth in the financial markets may adversely affect the market value and performance of the investment securities that we manage, which could lead to reductions in our investment management and advisory fees and, therefore, may result in a decline in the performance of our investment advisory and wealth management business. Additionally, if FFA’s performance were to decline, that could lead some of our clients to reduce their assets under management by us and make it more difficult for us to retain existing clients and attract new clients. If any of these events or circumstances were to occur, the operating results of our investment advisory and wealth management business and, therefore, our earnings could be materially and adversely affected.
26
The investment management contracts we have with our clients are terminable without cause and on relatively short notice by our clients, which makes us vulnerable to short term declines in the performance of the securities under our management.
Like most investment advisory and wealth management businesses, the investment advisory contracts we have with our clients are typically terminable by the client without cause upon less than 30 days’ notice. As a result, even short term declines in the performance of the securities we manage, which can result from factors outside our control, such as adverse changes in market or economic condition or the poor performance of some of the investments we have recommended to our clients, could lead some of our clients to move assets under our management to other asset classes such as broad index funds or treasury securities, or to investment advisors which have investment product offerings or investment strategies different than ours. Therefore, our operating results are heavily dependent on the financial performance of our investment portfolios and the investment strategies we employ in our investment advisory businesses and even short-term declines in the performance of the investment portfolios we manage for our clients, whatever the cause, could result in a decline in assets under management and a corresponding decline in investment management fees, which would adversely affect our results of operations.
The market for investment managers is extremely competitive and the loss of a key investment manager to a competitor could adversely affect our investment advisory and wealth management business.
We believe that investment performance is one of the most important factors that affect the amount of assets under our management and, for that reason, the success of FFA’s business is heavily dependent on the quality and experience of our investment managers and their track records in terms of making investment decisions that result in attractive investment returns for our clients. However, the market for such investment managers is extremely competitive and is increasingly characterized by frequent movement of investment managers among different firms. In addition, our individual investment managers often have direct contact with particular clients, which can lead to a strong client relationship based on the client’s trust in that individual manager. As a result, the loss of a key investment manager to a competitor could jeopardize our relationships with some of our clients and lead to the loss of client accounts, which could have a material adverse effect on our business, financial condition, results of operations and prospects.
We may be adversely affected by the soundness of certain securities brokerage firms.
FFA does not provide custodial services for its clients. Instead, client investment accounts are maintained under custodial arrangements with large, well established securities brokerage firms, either directly or through arrangements made by FFA with those firms. As a result, the performance of, or even rumors or questions about the integrity or performance of, any of those brokerage firms could adversely affect the confidence of FFA’s clients in the services provided by those firms or otherwise adversely impact their custodial holdings. Such an occurrence could negatively impact the ability of FFA to retain existing or attract new clients and, as a result, could have a material adverse effect on our business, financial condition, results of operations and prospects.
Risks Related to Our Regulatory Environment
The banking industry is highly regulated, and legislative or regulatory actions taken now or in the future may have a significant adverse effect on our operations.
The banking industry is extensively regulated and supervised under both federal and state laws and regulations that are intended primarily to protect customers, depositors, the FDIC’s Deposit Insurance Fund, and the banking system as a whole, not our stockholders. We are subject to the regulation and supervision of the Federal Reserve Board, the FDIC and the California Department of Business Oversight. The banking laws, regulations and policies applicable to us govern matters ranging from the maintenance of adequate capital, safety and soundness, mergers and changes in control to the general business operations conducted by us, including permissible types, amounts and terms of loans and investments, the amount of reserves held against deposits, restrictions on dividends, imposition of specific accounting requirements, establishment of new offices and the maximum interest rate that may be charged on loans.
We are subject to changes in federal and state banking statutes, regulations and governmental policies, or the interpretation or implementation of them, including regulations to be implemented as a result of the enactment of the Dodd-Frank Act. Any changes in any federal or state banking statute, regulation or governmental policy could affect us in substantial and unpredictable ways, including ways that may adversely affect our business, results of operations, financial condition or prospects. Compliance with laws and regulations can be difficult and costly, and changes to laws and regulations often impose additional compliance costs. In addition, federal and state banking regulators have broad authority to supervise our banking business and that of our subsidiaries, including the authority to prohibit activities that represent unsafe or unsound banking practices or constitute violations of statute, rule, regulation, or administrative order. Failure to comply with any such laws, regulations or regulatory policies could result in sanctions by regulatory agencies, restrictions on our business activities, civil money penalties or damage to our reputation, all of which could adversely affect our business, results of operations, financial condition or prospects.
27
Federal and state banking agencies periodically conduct examinations of our business, including compliance with laws and regulations, and our failure to comply with any supervisory actions to which we are or becomes subject as a result of such examinations may adversely affect us.
The Federal Reserve Board, the FDIC and the California Department of Business Oversight may conduct examinations of our business, including for compliance with applicable laws and regulations. As a result of an examination, regulatory agencies may determine that the financial condition, capital resources, asset quality, asset concentrations, earnings prospects, management, liquidity, sensitivity to market risk, or other aspects of any of our operations are unsatisfactory, or that we or our management are in violation of any law, regulation or guideline in effect from time to time. Regulatory agencies may take a number of different remedial actions, including the power to enjoin “unsafe or unsound” practices, to require affirmative actions to correct any conditions resulting from any violation or practice, to issue an administrative order that can be judicially enforced, to direct an increase in our capital, to restrict our growth, to change the composition of our concentrations in portfolio or balance sheet assets, to assess civil monetary penalties against officers or directors, to remove officers and directors and, if such conditions cannot be corrected or there is an imminent risk of loss to depositors, the FDIC may terminate our deposit insurance. A regulatory action against us could have a material adverse effect on our business, results of operations, financial condition and prospects.
The enactment of the Dodd-Frank Act may have a material effect on our operations.
The enactment of the Dodd-Frank Act imposes significant regulatory and compliance changes on financial institutions and non-bank providers of financial products. The Dodd-Frank Act has had and will have an impact on our business in the following ways:
|
|
· |
changes to regulatory capital requirements; |
|
|
· |
creation of new government regulatory agencies (particularly the Consumer Financial Protection Bureau (the “CFPB”), which will develop and enforce rules for bank and non-bank providers of consumer financial products); |
|
|
· |
changes to deposit insurance assessments; |
|
|
· |
regulation of debit interchange fees we earn; |
|
|
· |
changes in retail banking regulations, including potential limitations on certain fees we may charge; and |
|
|
· |
changes in regulation of consumer mortgage loan origination and risk retention. |
In addition, the Dodd-Frank Act restricts the ability of banks to engage in certain proprietary trading or to sponsor or invest in private equity or hedge funds. The Dodd-Frank Act also contains provisions designed to limit the ability of insured depository institutions, their holding companies and their affiliates to conduct certain swaps and derivatives activities and to take certain principal positions in financial instruments. Some provisions of the Dodd-Frank Act have not been completely implemented. The changes resulting from the Dodd-Frank Act may impact the profitability of our business activities or otherwise adversely affect our business. Failure to comply with the requirements may negatively impact our results of operations and financial condition. While we cannot predict what effect any presently contemplated or future changes in the laws or regulations or their interpretations would have on us, these changes could be materially adverse to investors in our equity securities.
As a result of the Dodd-Frank Act and recent rulemaking, we will become subject to more stringent capital requirements.
The Dodd-Frank Act required, among other things, that the federal banking agencies establish minimum leverage and risk-based capital requirements for insured banks and their holding companies. In July 2013, the federal banking agencies adopted final rules (the “Final Capital Rule”), implementing the Basel III capital standards and establishing the minimum capital levels required under the Dodd-Frank Act, which apply to all U.S. banks, subject to various transition periods. We were required to comply with the Final Capital Rule by January 1, 2015 with capital conservation buffer and deductions from common equity tier 1 capital phased in through 2019. The Final Capital Rule establishes a common equity Tier 1 capital ratio of 6.5% of risk-weighted assets, tier 1 capital ratio of 8.0%, and total capital ratio of 10.0%, and leverage ratio of 5.0% for a financial institution to be considered “well capitalized” for regulatory purposes. Additionally, the Final Capital Rule requires an institution to maintain a 2.5% common equity Tier 1 capital conservation buffer (phased in in annual increments of 0.625% beginning January 1, 2016) over the minimum risk-based capital requirement to avoid restrictions on the ability to pay dividends, discretionary bonuses, and to engage in share repurchases. The Final Capital Rule increases the required capital for certain categories of assets, including high volatility construction real estate loans and certain exposures related to securitizations; however, the Final Capital Rule retains the current capital treatment of residential mortgages. Under the Final Capital Rule, we made a one-time, permanent election to continue to exclude accumulated other
28
comprehensive income from capital. Implementation of these capital requirements, or any other new regulations, may adversely affect our ability to pay dividends, or require us to reduce business levels or raise capital, including in ways that may adversely affect our results of operations, financial condition or prospects.
New and future rulemaking by the CFPB and other regulators, as well as enforcement of existing consumer protection laws, may have a material effect on our operations and operating costs.
The CFPB has the authority to implement and enforce a variety of existing federal consumer protection statutes and to issue new regulations but, with respect to institutions of our size, does not have primary examination and enforcement authority with respect to such laws and regulations. The authority to examine depository institutions with $10.0 billion or less in assets, like us, for compliance with federal consumer laws remains largely with our primary federal regulator, the FDIC. However, the CFPB may participate in examinations of smaller institutions on a “sampling basis” and may refer potential enforcement actions against such institutions to their primary regulators. In some cases, regulators such as the Federal Trade Commission and the Department of Justice also retain certain rulemaking or enforcement authority, and we also remain subject to certain state consumer protection laws. As an independent bureau within the Federal Reserve, the CFPB may impose requirements more severe than the previous bank regulatory agencies. The CFPB has placed significant emphasis on consumer complaint management and has established a public consumer complaint database to encourage consumers to file complaints they may have against financial institutions. We are expected to monitor and respond to these complaints, including those that we deem frivolous, and doing so may require management to reallocate resources away from more profitable endeavors.
We are subject to numerous laws designed to protect consumers, including the Community Reinvestment Act and fair lending laws, and failure to comply with these laws could lead to a wide variety of sanctions.
The Community Reinvestment Act, the Equal Credit Opportunity Act, the Fair Housing Act and other fair lending laws and regulations impose nondiscriminatory lending requirements on financial institutions. The Department of Justice, the CFPB and other federal agencies are responsible for enforcing these laws and regulations. A successful regulatory challenge to an institution’s performance under the Community Reinvestment Act or fair lending laws and regulations could result in a wide variety of sanctions, including damages and civil money penalties, injunctive relief, restrictions on mergers and acquisitions activity, restrictions on expansion, and restrictions on entering new business lines. Private parties may also have the ability to challenge an institution’s performance under fair lending laws in private class action litigation. Any such actions could have a material adverse effect on our business, financial condition, results of operations and prospects.
We face a risk of noncompliance and enforcement action with the Bank Secrecy Act and other anti-money laundering statutes and regulations.
The federal Bank Secrecy Act, the USA PATRIOT Act of 2001 and other laws and regulations require financial institutions, among other duties, to institute and maintain effective anti-money laundering programs and file suspicious activity and currency transaction reports as appropriate. The federal Financial Crimes Enforcement Network, established by the Treasury to administer the Bank Secrecy Act, is authorized to impose significant civil money penalties for violations of those requirements and has recently engaged in coordinated enforcement efforts with the individual federal banking regulators, as well as the U.S. Department of Justice, Drug Enforcement Administration and Internal Revenue Service. There is also increased scrutiny of compliance with the rules enforced by the Office of Foreign Assets Control. If our policies, procedures and systems are deemed deficient or the policies, procedures and systems of any financial institutions that we may acquire in the future are deficient, we would be subject to liability, including fines and regulatory actions such as restrictions on our ability to pay dividends and the necessity to obtain regulatory approvals to proceed with certain aspects of our business plan, which would negatively impact our business, financial condition and results of operations. Failure to maintain and implement adequate programs to combat money laundering and terrorist financing could also have serious reputational consequences for us. Any of these results could materially and adversely affect our business, financial condition, results of operations and prospects.
Regulations relating to privacy, information security and data protection could increase our costs, affect or limit how we collect and use personal information and adversely affect our business opportunities.
We are subject to various privacy, information security and data protection laws, including requirements concerning security breach notification, and we could be negatively impacted by these laws. For example, our business is subject to the Gramm-Leach-Bliley Act which, among other things: (i) imposes certain limitations on our ability to share non-public personal information about our customers with non-affiliated third parties; (ii) requires that we provide certain disclosures to customers about our information collection, sharing and security practices and afford customers the right to “opt out” of any information sharing by us with non-affiliated third parties (with certain exceptions) and (iii) requires we develop, implement and maintain a written comprehensive information security program containing safeguards appropriate based on our size and complexity, the nature and scope of our activities, and the sensitivity of customer information we process, as well as plans for responding to data security breaches. Various
29
state and federal banking regulators and states have also enacted data security breach notification requirements with varying levels of individual, consumer, regulatory or law enforcement notification in certain circumstances in the event of a security breach. Moreover, legislators and regulators in the United States are increasingly adopting or revising privacy, information security and data protection laws that potentially could have a significant impact on our current and planned privacy, data protection and information security-related practices, our collection, use, sharing, retention and safeguarding of consumer or employee information, and some of our current or planned business activities. This could also increase our costs of compliance and business operations and could reduce income from certain business initiatives. This includes increased privacy-related enforcement activity at the federal level, by the Federal Trade Commission, as well as at the state level, such as with regard to mobile applications.
Compliance with current or future privacy, data protection and information security laws (including those regarding security breach notification) affecting customer or employee data to which we are subject could result in higher compliance and technology costs and could restrict our ability to provide certain products and services, which could have a material adverse effect on our business, financial conditions or results of operations. Our failure to comply with privacy, data protection and information security laws could result in potentially significant regulatory or governmental investigations or actions, litigation, fines, sanctions and damage to our reputation, which could have a material adverse effect on our business, financial condition or results of operations.
FFA’s business is highly regulated, and the regulators have the ability to limit or restrict, and impose fines or other sanctions on, FFA’s business.
FFA is registered as an investment adviser with the SEC under the Investment Advisers Act and its business is highly regulated. The Investment Advisers Act imposes numerous obligations on registered investment advisers, including fiduciary, record keeping, operational and disclosure obligations. Moreover, the Investment Advisers Act grants broad administrative powers to regulatory agencies such as the SEC to regulate investment advisory businesses. If the SEC or other government agencies believe that FFA has failed to comply with applicable laws or regulations, these agencies have the power to impose fines, suspensions of individual employees or other sanctions, which could include revocation of FFA’s registration under the Investment Advisers Act. We are also subject to the provisions and regulations of ERISA to the extent that we act as a “fiduciary” under ERISA with respect to certain of our clients. ERISA and the applicable provisions of the federal tax laws, impose a number of duties on persons who are fiduciaries under ERISA and prohibit certain transactions involving the assets of each ERISA plan which is a client, as well as certain transactions by the fiduciaries (and certain other related parties) to such plans. Additionally, like other investment advisory and wealth management companies, FFA also faces the risks of lawsuits by clients. The outcome of regulatory proceedings and lawsuits is uncertain and difficult to predict. An adverse resolution of any regulatory proceeding or lawsuit against FFA could result in substantial costs or reputational harm to FFA and, therefore, could have an adverse effect on the ability of FFA to retain key relationship and wealth managers, and to retain existing clients or attract new clients, any of which could have a material adverse effect on our business, financial condition, results of operations and prospects.
Changes in legal, regulatory, accounting, tax and compliance requirements also could adversely affect FFA’s operations and financial results, by, among other things, increasing its operating expenses and placing restrictions on the marketing of certain investment products. Recently, the Obama Administration directed the U.S. Department of Labor to adopt new rules that would require some financial advisors to act as “fiduciaries” for their clients in connection with the management of 401-K retirement plan and IRA investments, which is a higher standard than currently applies to investment managers and brokers when managing investments in 401-K retirement plans and IRAs. We cannot predict whether these new rules will be adopted and we do not have enough information at this time to determine whether these proposed new rules, if adopted, will apply to FFA or will have an impact on FFA’s business or operating results. However, we expect that these rules, if adopted, would apply primarily to investment advisors and brokers who receive commissions from the issuers of investment securities that are purchased, based on the advice of such advisors or brokers, for the accounts of their clients. FFA, by contrast, is compensated for its services primarily by investment advisory fees paid directly by its clients based on the market value of the investment securities that are managed by FFA for them and not by commissions paid by issuers of those investment securities.
Risks Related to Ownership of Our Common Stock
We do not plan to pay dividends for at least the foreseeable future. Additionally, our ability to pay dividends is subject to statutory, regulatory and other restrictions.
In order to support and fund the growth of our banking business, it is our policy to retain cash rather than pay dividends. As a result, we have not paid any cash dividends since FFB commenced its banking operations in October 2007 and we have no plans to pay cash dividends at least for the foreseeable future. Additionally, our ability to pay dividends to our stockholders is restricted by Delaware and federal law and the policies and regulations of the Federal Reserve, which is our federal banking regulator.
30
Our ability to pay dividends to stockholders is also dependent on the payment to us of cash dividends by FFA and FFB. FFA and FFB are corporations that are separate and distinct from us and, as a result, they are subject to separate statutory or regulatory dividend restrictions that can affect their ability to pay cash dividends to us. FFA’s ability to pay cash dividends to us is restricted under California corporate law. FFB’s ability to pay dividends to us is limited by various banking statutes and regulations. Moreover, based on their assessment of the financial condition of FFB or other factors, the FDIC or the DBO could find that payment of cash dividends by FFB to us would constitute an unsafe or unsound banking practice, in which event they could restrict FFB from paying cash dividends, even if FFB meets the statutory requirements to do so. See the section entitled “Dividend Policy and Restrictions on the Payment of Dividends” in Item 5 of this report below for additional information about our dividend policy and the dividend restrictions that apply to us and to FFB and FFA.
Trading in our common stock has been limited and there is no assurance that a more active trading market for our shares will develop in the future. As a result, stockholders may not be able to sell their shares of our common stock at attractive prices if and when they need or desire to do so.
On November 3, 2014, our common stock was listed and commenced trading on the NASDAQ Global Stock Market, under the ticker symbol “FFWM”. However, the trading volume in our common stock has been limited. For example, the average daily trading volume of our shares on NASDAQ during the month of February 2016 was approximately 20,300 shares. There can be no assurance that a more active trading market for our shares will develop or can be sustained in the future. If a more active trading market does not develop, or cannot be sustained, our stockholders may have difficulty selling their shares at attractive prices when they need or desire to do so. Additionally, the lack of an active trading market for our shares may make it more difficult for us to sell shares in the future to raise additional capital and to offer our shares as consideration for acquisitions of other banks or investment management or other financial services businesses, without diluting our existing stockholders.
The market prices and trading volume of our common stock may be volatile.
Even if an active market develops for our common stock, the market prices of our common stock may be volatile and the trading volume may fluctuate and cause significant price variations to occur. We cannot assure you that, if a market does develop for our common stock, the market prices of our common stock will not fluctuate or decline significantly in the future. Some of the factors that could negatively affect the prices of our shares or result in fluctuations in those prices or in trading volume of our common stock could include the following, many of which are outside of our control:
|
|
● |
quarterly variations in our operating results or in the quality of our earnings or assets; |
|
|
● |
operating results that differ from the expectations of management, securities analysts and investors; |
|
|
● |
changes in expectations as to our future financial performance; |
|
|
● |
the operating and securities price performance of other companies that investors believe are comparable to us; |
|
|
● |
the implementation of our growth strategy and performance of acquired businesses that vary from the expectations of securities analysts and investors; |
|
|
● |
the enactment of new more costly government regulations that are applicable to our businesses or the imposition of regulatory restrictions on us; |
|
|
● |
our dividend policy and any changes that might occur to that policy in the future; |
|
|
● |
future sales of by us of our common stock or any other of our equity securities; |
|
|
● |
changes in global financial markets and global economies and general market conditions, such as changes in interest rates or fluctuations in stock, commodity or real estate valuations; and |
|
|
● |
announcements of strategic developments, material acquisitions and other material events in our business or in the businesses of our competitors. |
These broad market and industry factors may decrease the market price of our common stock, regardless of our actual operating performance. The stock market in general has from time to time experienced extreme price and volume fluctuations, including in recent months. In addition, in the past, following periods of volatility in the overall market and the market price of a company’s securities, securities class action litigation has often been instituted against these companies. This litigation, if instituted against us, could result in substantial costs and a diversion of our management’s attention and resources
31
Share ownership by our officers and directors and certain agreements may make it more difficult for third parties to acquire us or effectuate a change of control that might be viewed favorably by other stockholders.
As of February 27, 2016, our executive officers and directors owned, in the aggregate, approximately 21% of our outstanding shares. As a result, if the officers and directors were to oppose a third party’s acquisition proposal for, or a change in control of, FFI, the officers and directors may have sufficient voting power to be able to block or at least delay such an acquisition or change in control from taking place, even if other stockholders would support such a sale or change of control. In addition, a number of FFI’s officers have change of control agreements which could increase the costs and, therefore, lessen the attractiveness of an acquisition of FFI to a potential acquiring party. For additional information regarding these change of control agreements, see Item 11 “Executive Compensation” below in this report.
Our corporate governance documents, and certain corporate and banking laws applicable to us, could make a takeover attempt, which may be beneficial to our stockholders, more difficult.
Our Board of Directors has the power under our certificate of incorporation to issue additional shares of common stock and create and authorize the sale of one or more series of preferred stock without having to obtain stockholder approval for such action. As a result, our Board could authorize the issuance of shares of a series of preferred stock to implement a shareholders rights plan (often referred to as a “poison pill”) or could sell and issue preferred shares with special voting rights or conversion rights, which could deter or delay attempts by our stockholders to remove or replace management, and attempts of third parties either to engage in proxy contests or to acquire control of FFI. In addition, our charter documents:
|
|
● |
enable our Board to fill any vacancy on the Board, unless the vacancy was created by the removal of a director; |
|
|
● |
enable our Board to amend our bylaws without stockholder approval, subject to certain exceptions; and |
|
|
● |
require compliance with an advance notice procedure with regard to any business that is to be brought by a shareholder before an annual or special meeting of stockholders and with regard to the nomination by stockholders of candidates for election as directors. |
Furthermore, federal and state banking laws and regulations applicable to us require anyone seeking to acquire more than 10% of our outstanding shares or otherwise effectuate a change of control of the Company or of FFB, to file an application with, and to receive approval from, the Federal Reserve and the FDIC to do so. These laws and regulations may discourage potential acquisition proposals and could delay or prevent a change of control of the Company, including by means of a transaction in which our stockholders might receive a premium over the market price of our common stock.
We may sell additional shares of common stock in the future which could result in dilution to our stockholders.
A total of approximately 52 million authorized but unissued shares of our common stock are available for future sale and issuance by action of our Board of Directors alone. Accordingly, if we were to sell additional shares in the future, our stockholders could suffer dilution in their investment in their shares of our common stock and in their percentage ownership of the Company.
We may issue additional equity securities, or engage in other transactions which could dilute our book value or affect the priority of our common stock, which may adversely affect the market price of our common stock.
Our Board of Directors may determine from time to time that we need to raise additional capital by issuing additional shares of our common stock or other securities. We are not restricted from issuing additional shares of common stock, including securities that are convertible into or exchangeable for, or that represent the right to receive, common stock. Because our decision to issue securities in any future offering will depend on market conditions and other factors beyond our control, we cannot predict or estimate the amount, timing, or nature of any future offerings, or the prices at which such offerings may be affected. Such offerings could be dilutive to common stockholders. New investors also may have rights, preferences and privileges that are senior to, and that adversely affect, our then-current common stockholders. Additionally, if we raise additional capital by making additional offerings of debt or preferred equity securities, upon liquidation of the Company, holders of our debt securities and shares of preferred stock, and lenders with respect to other borrowings, will receive distributions of our available assets prior to the holders of our common stock. Additional equity offerings may dilute the holdings of our existing stockholders or reduce the market price of our common stock, or both. Holders of our common stock are not entitled to preemptive rights or other protections against dilution.
We may elect under the JOBS Act to use an extended transition period for complying with new or revised accounting standards.
We are an “emerging growth company” under the Jumpstart Our Business Startups Act of 2012, (the “JOBS Act”. The JOBS Act allows us, as an emerging growth company, to take advantage of extended transition periods for the implementation of new or
32
revised accounting standards. As a result, we will not be required to comply with new or revised accounting standards (i) until those standards apply to private companies, even if that is later than the date or dates on which they become effective for public companies or (ii) if sooner, until we cease to be an “emerging growth company” as defined in the JOBS Act. As a result, our financial statements may not be fully comparable to the financial statements of public companies that contain new or revised accounting standards not yet applicable to private companies, which could make our common stock less attractive to investors.
The reduced disclosures and relief from certain other significant disclosure requirements that are available to emerging growth companies may make our common stock less attractive to investors.
As an “emerging growth company” we are entitled to exemptions from certain reporting requirements that apply to public companies that are not emerging growth companies. These exemptions include the following:
|
|
● |
an exemption from the requirements of the Section 404 of the Sarbanes-Oxley Act of 2002, which requires public companies that are accelerated filers or large accelerated filers (within the meaning of the Exchange Act) to obtain and include in their annual reports on Form 10-K an attestation report from their independent registered public accountants with respect to the effectiveness of their internal control over financial reporting; |
|
|
● |
less extensive disclosure obligations regarding executive compensation in our proxy statements or other periodic reports that we file with the SEC; and |
|
|
● |
exemptions from the requirements to have our stockholders vote, on an advisory and nonbinding basis, on executive compensation and on any golden parachute payments. |
In addition, even if we choose voluntarily to comply with any of the requirements from which we are exempt, we may later rely on those exemptions to avail ourselves of the reduced reporting and disclosure requirements applicable to emerging growth companies.
We may remain an emerging growth company for the period ending in December 2018, although we may cease to be an emerging growth company earlier under certain circumstances, including if, before the end of that period, it is determined that we have become a large accelerated filer under the rules of the SEC (which depends on, among other things, having a market value of common stock held by non-affiliates in excess of $700 million).
Because we will be relying on one or more of these exemptions, investors and securities analysts may find it more difficult to evaluate our common stock, and some investors may find our common stock less attractive, and, as a result, there may be a less active trading market for our common stock than would be the case if we were not an emerging growth company, which could result in a reductions the trading volume and greater volatility in the prices of our common stock.
A failure to maintain effective internal control over financial reporting could have a material adverse effect on our business and stock prices.
Although, as an emerging growth company, we are not required to obtain or include in our annual reports on Form 10-K an attestation report from their independent registered accountants with respect to the effectiveness of our internal control over financial reporting, like all other public companies, our Chief Executive Officer and our Chief Financial Officer are required, annually, to assess, and disclose their findings in our annual reports on Form 10-K with respect to, the effectiveness of our internal control over financial reporting in a manner that meets the requirements of Section 404(a) of the Sarbanes-Oxley Act. The rules governing the standards that must be met for our Chief Executive and Chief Financial Officers to assess and report on the effectiveness of our internal control over financial reporting are complex and require significant documentation, testing and possible remediation, which could significantly increase our operating expenses. See Item 9A “Controls and Procedures” below to review the attestation report of our Chief Executive Officer and Chief Financial Officer regarding the effectiveness of our internal control over financial reporting as of December 31, 2015.
Additionally, If we are unable to maintain the effectiveness of our internal control over financial reporting in the future, we may be unable to report our financial results accurately and on a timely basis. In such an event, investors and clients may lose confidence in the accuracy and completeness of our financial statements, as a result of which our liquidity, access to capital markets, and perceptions of our creditworthiness could be adversely affected and the market prices of our common stock could decline. In addition, we could become subject to investigations by NASDAQ, the SEC, or the Federal Reserve, or other regulatory authorities, which could require us to expend additional financial and management resources. As a result, an inability to maintain the effectiveness of our internal control over financial reporting in the future could have a material adverse effect on our business, financial condition, results of operations and prospects.
33
If securities or industry analysts do not publish research or publish inaccurate or unfavorable research about our business, our stock price and trading volume could decline.
The trading market for our common stock will depend in part on the research and reports that securities or industry analysts publish about us or our business. Securities and industry analysts first initiated coverage of our stock in July 2015, and may never, publish research on our company. If additional securities or industry analysts do not commence coverage of our company, the trading price of our stock would likely be negatively impacted. If one or more of the analysts who cover us downgrade our stock or publish inaccurate or unfavorable research about our business, our stock price would likely decline. If one or more of these analysts cease coverage of our company or fail to publish reports on us regularly, demand for our stock could decrease, which might cause our stock price and trading volume to decline.
An investment in our common stock is not an insured deposit and is not guaranteed by the FDIC, so you could lose some or all of your investment.
An investment in our common stock is not a bank deposit and is not insured against loss or guaranteed by the FDIC, any other deposit insurance fund or by any other public or private entity. An investment in our common stock is inherently risky for the reasons described herein.
Other Risks and Uncertainties.
Additional risks that we currently do not know about or that we currently believe to be immaterial may also impair our business, financial condition, operating results and future prospects.
Not applicable.
The corporate headquarters for all of the companies is located in Irvine, California. The Company has offices in California in Newport Beach, Irvine, Indian Wells, Pasadena, El Centro, West Los Angeles, El Segundo, Oakland, Sacramento, Burlingame, and San Diego and in Las Vegas, Nevada, and in Honolulu, Hawaii. All of these offices are leased pursuant to non-cancelable operating leases that will expire between 2017 and 2025.
In the ordinary course of business, we are subject to claims, counter claims, suits and other litigation of the type that generally arise from the conduct of financial services businesses. We are not aware of any threatened or pending litigation that we expect will have a material adverse effect on our business operations, financial condition or results of operations.
Not applicable.
34
|
Market for Registrant’s Common Equity, Related Stockholder Matters and Issuer Purchases of Equity Securities. |
Market Information
Prior to November 3, 2014, there was no public trading market or any publicly available quotations for our common stock. On November 3, 2014, our common stock became listed and commenced trading on the NASDAQ Global Stock Market under the trading symbol “FFWM”. The following table shows the high and low sales prices of our shares for the respective periods set forth below, as reported on the NASDAQ Global Stock Market:
|
Quarter Ended |
|
High |
|
Low |
|
2015: |
|
|
|
|
|
March 31 |
$ |
19.75 |
$ |
17.60 |
|
June 30 |
|
19.79 |
|
18.59 |
|
September 30 |
|
24.33 |
|
19.52 |
|
December 31 |
|
24.62 |
|
22.20 |
|
2014 |
|
|
|
|
|
December 31 (November 3 to December 31) |
$ |
23.00 |
$ |
17.50 |
The closing per share sales price of our common stock, as reported by NASDAQ, on March 10, 2016 was $21.01. As of the same date, a total of 16,016,326 shares of our common stock were issued and outstanding which were held of record by approximately 1,200 shareholders.
Dividend Policy and Restrictions on the Payment of Dividends
We have not previously paid cash dividends on our common stock. It is our current intention to invest our cash flow and earnings in the growth of our businesses and, therefore, we have no plans to pay cash dividends for the foreseeable future.
Our ability to pay dividends to our stockholders is subject to the restrictions set forth in the Delaware General Corporation Law (the “DGCL”) and the regulatory authority of the Federal Reserve. The DGCL provides that a corporation, unless otherwise restricted by its certificate of incorporation, may declare and pay dividends out of its surplus or, if there is no surplus, out of net profits for the fiscal year in which the dividend is declared and/or for the preceding fiscal year, as long as the amount of capital of the corporation is not less than the aggregate amount of the capital represented by the issued and outstanding stock of all classes having a preference upon the distribution of assets. Surplus is defined as the excess of a corporation’s net assets (i.e., its total assets minus its total liabilities) over the capital associated with issuances of its common stock. Moreover, the DGCL permits a board of directors to reduce its capital and transfer such amount to its surplus. In determining the amount of surplus of a Delaware corporation, the assets of the corporation, including stock of subsidiaries owned by the corporation, must be valued at their fair market value as determined by the board of directors, regardless of their historical book value. In addition, since we are a bank holding company subject to regulation by the FRB, it may become necessary for us to obtain the approval of the FRB before we can pay cash dividends to our stockholders.
Cash dividends from our two wholly-owned subsidiaries, FFB and FFA, represent the principal source of funds available to us, which we might use to pay cash dividends to our shareholders or for other corporate purposes. Since FFA and FFB are California corporations, they are subject to dividend payment restrictions under the California General Corporation Law (the “CGCL”). The laws of the State of California, as they pertain to the payment of cash dividends by California state chartered banks, limit the amount of funds that FFB would be permitted to dividend to us more strictly than does the CGCL. In particular, under California law, cash dividends by a California state chartered bank may not exceed, in any calendar year, the lesser of (i) the sum of its net income for the year and its retained net income from the preceding two years (after deducting all dividends paid during the period), or (ii) the amount of its retained earnings.
Also, because the payment of cash dividends has the effect of reducing capital, capital requirements imposed on FFB by the DBO and the FDIC may operate, as a practical matter, to preclude the payment, or limit the amount of, cash dividends that might otherwise be permitted to be made under California law; and the DBO and the FDIC, as part of their supervisory powers, generally require insured banks to adopt dividend policies which limit the payment of cash dividends much more strictly than do applicable state laws.
35
Restrictions on Intercompany Transactions
Sections 23A and 23B of the Federal Reserve Act, and the implementing regulations thereunder, limit transactions between a bank and its affiliates and limit a bank’s ability to transfer to its affiliates the benefits arising from the bank’s access to insured deposits, the payment system and the discount window and other benefits of the Federal Reserve System. Those Sections of the Act and the implementing regulations impose quantitative and qualitative limits on the ability of a bank to extend credit to, or engage in certain other transactions with, an affiliate (and a non-affiliate if an affiliate benefits from the transaction).
Equity Compensation Plans
Certain information with respect to our equity compensation plans, as of December 31, 2015, is set forth in Item 12, in Part III of this Report and is incorporated herein by this reference.
Recent Sales of Unregistered Securities
During 2015, we sold 272,035 shares of common stock to Mr. DePillo. These shares were exempt from the registration requirements under the Securities Act of 1933, as amended (or Securities Act). The sales of these shares were made in reliance on the exemptions from registration under Section 4(2) of, and Regulation D and Rule 506 promulgated under, the Securities Act. Mr. DePillo represented his intention to acquire the shares for investment only, and not with a view to offer or sell any such shares in connection with any distribution of the shares, and appropriate restrictive legends were set forth on the share certificates issued.
Use of Proceeds
On August 12, 2015, we issued 6,233,766 shares of common stock, at a price of $19.25 per share, in a registered, underwritten public offering. The offering resulted in gross proceeds of $120.0 million and net proceeds of approximately $113.7 million, after underwriting discounts and estimated expenses of the offering. The Company used a portion of the net proceeds from the offering to repay all of its $29 million of outstanding term debt and intends to use the remaining proceeds for general corporate purposes, including to support of organic growth and possible acquisitions. On August 14, 2015, the underwriters exercised their option to purchase an additional 935,065 shares of the Company’s common stock, at a price of $19.25 per share, to cover any over-allotments in the public offering. As a result, the Company received additional gross proceeds of $18.0 million and net proceeds of $17.1 million, after underwriting discounts. The Company intends to use the proceeds for general corporate purposes, including to support organic growth and possible acquisitions.
36
The following graph shows a comparison from November 3, 2014 (the date our common stock commenced trading on the NASDAQ Global Market) through December 31, 2015 of the cumulative total return for our common stock, compared against (i) the Russell 2000 Index, which measures the performance of the smallest 2,000 members, by market cap, (i) the Russell 3000 Index, which measures the performance of the smallest 3,000 members, by market cap, of the Russell Index, and (ii) an index published by SNL Securities L.C. (“SNL”) and known as the SNL Western Bank Index, which is comprised of 51 banks and bank holding companies (including the Company), the shares of which are listed on NASDAQ or the New York Stock Exchange and most of which are based in California and the remainder of which are based in nine other western states.
The stock performance graph assumes that $100 was invested in Company common stock at the close of market on December 31, 2015, and, at that same date, in the Russell 2000 Index, the Russell 3000 Index and the SNL Western Bank Index and that any dividends paid in the indicated periods were reinvested. Shareholder returns shown in the stock performance graph are not necessarily indicative of future stock price performance.
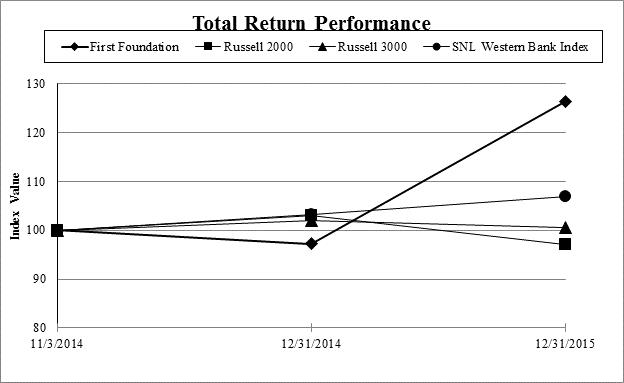
|
|
|
Period Ending |
|
||||
|
|
|
11/3/2014 |
|
12/31/2014 |
|
12/31/2015 |
|
|
First Foundation Inc. (FFWM) |
|
100.00 |
|
97.21 |
|
126.42 |
|
|
Russell 2000 Index |
|
100.00 |
|
102.95 |
|
97.07 |
|
|
Russell 3000 Index |
|
100.00 |
|
102.06 |
|
100.55 |
|
|
SNL Western Bank Index |
|
100.00 |
|
103.25 |
|
106.98 |
|
|
|
|
|
|
|
|
|
|
The above performance graph shall not be deemed “filed” for purposes of Section 18 of the Exchange Act or otherwise subject to the liabilities under that section and shall not be deemed to be incorporated by reference into any of our filings under the Securities Act or the Exchange Act.
37
With the exception of the certain items included in the selected performance and capital ratios, the following selected consolidated financial information as of and for the years ended December 31, 2015, 2014, and 2013 have been derived from our audited consolidated financial statements appearing elsewhere in this Annual Report on Form 10-K, and the selected consolidated financial information as of and for the years ended December 31, 2012 and 2011 have been derived from our audited consolidated financial statements not appearing in this Annual Report on Form 10-K.
38
You should read the following selected financial and operating data in conjunction with other information contained in this Annual Report on Form 10-K, including the information set forth in the sections entitled “Capitalization” and “Management’s Discussion and Analysis of Financial Condition and Results of Operations”, as well as our consolidated financial statements and the related notes included elsewhere in this Annual Report on Form 10-K. The average balances used in computing certain ratios, have been computed using daily averages, except for average equity, which is computed using the average of beginning and end of month balances.
|
|
|
As of and for the Year Ended December 31, |
|
|||||||||||||||||
|
(In thousands, except share and per share data) |
|
2015 |
|
|
2014 |
|
|
2013 |
|
|
2012 |
|
|
2011 |
|
|||||
|
Selected Income Statement Data: |
|
|
|
|
|
|
|
|
|
|
|
|
|
|
|
|
|
|
|
|
|
Net interest income |
|
$ |
64,471 |
|
|
$ |
42,814 |
|
|
$ |
35,674 |
|
|
$ |
27,729 |
|
|
$ |
20,141 |
|
|
Provision for loan losses |
|
|
2,673 |
|
|
|
235 |
|
|
|
2,395 |
|
|
|
2,065 |
|
|
|
2,297 |
|
|
Noninterest Income: |
|
|
|
|
|
|
|
|
|
|
|
|
|
|
|
|
|
|
|
|
|
Asset management, consulting and other fees |
|
|
23,486 |
|
|
|
21,798 |
|
|
|
18,240 |
|
|
|
15,326 |
|
|
|
13,211 |
|
|
Other(1) |
|
|
5,287 |
|
|
|
2,951 |
|
|
|
1,584 |
|
|
|
1,294 |
|
|
|
4,489 |
|
|
Noninterest expense |
|
|
61,458 |
|
|
|
52,507 |
|
|
|
43,622 |
|
|
|
34,476 |
|
|
|
26,446 |
|
|
Income before taxes |
|
|
22,832 |
|
|
|
14,821 |
|
|
|
9,481 |
|
|
|
7,808 |
|
|
|
9,098 |
|
|
Net income |
|
|
13,378 |
|
|
|
8,394 |
|
|
|
7,851 |
|
|
|
5,801 |
|
|
|
9,098 |
|
|
Share and Per Share Data: |
|
|
|
|
|
|
|
|
|
|
|
|
|
|
|
|
|
|
|
|
|
Net income per share: |
|
|
|
|
|
|
|
|
|
|
|
|
|
|
|
|
|
|
|
|
|
Basic |
|
$ |
1.20 |
|
|
$ |
1.08 |
|
|
$ |
1.06 |
|
|
$ |
0.88 |
|
|
$ |
1.48 |
|
|
Diluted |
|
|
1.16 |
|
|
|
1.03 |
|
|
|
1.01 |
|
|
|
0.85 |
|
|
|
1.42 |
|
|
Shares used in computation: |
|
|
|
|
|
|
|
|
|
|
|
|
|
|
|
|
|
|
|
|
|
Basic |
|
|
11,155,007 |
|
|
|
7,737,036 |
|
|
|
7,424,210 |
|
|
|
6,603,533 |
|
|
|
6,164,283 |
|
|
Diluted |
|
|
11,575,855 |
|
|
|
8,166,343 |
|
|
|
7,742,215 |
|
|
|
6,831,955 |
|
|
|
6,393,713 |
|
|
Tangible book value per share(2) |
|
$ |
16.10 |
|
|
$ |
12.66 |
|
|
$ |
11.18 |
|
|
$ |
9.94 |
|
|
$ |
7.98 |
|
|
Shares outstanding at end of period(3) |
|
|
15,980,526 |
|
|
|
7,845,182 |
|
|
|
7,733,514 |
|
|
|
7,366,126 |
|
|
|
6,166,574 |
|
|
Selected Balance Sheet Data: |
|
|
|
|
|
|
|
|
|
|
|
|
|
|
|
|
|
|
|
|
|
Cash and cash equivalents |
|
$ |
215,748 |
|
|
$ |
29,692 |
|
|
$ |
56,954 |
|
|
$ |
63,108 |
|
|
$ |
10,098 |
|
|
Loans, net of deferred fees |
|
|
1,754,883 |
|
|
|
1,166,392 |
|
|
|
903,645 |
|
|
|
743,627 |
|
|
|
524,103 |
|
|
Allowance for loan and lease losses (“ALLL”) |
|
|
(10,600 |
) |
|
|
(10,150 |
) |
|
|
(9,915 |
) |
|
|
(8,340 |
) |
|
|
(6,550 |
) |
|
Total assets |
|
|
2,592,579 |
|
|
|
1,355,424 |
|
|
|
1,037,360 |
|
|
|
830,509 |
|
|
|
551,584 |
|
|
Noninterest-bearing deposits |
|
|
299,794 |
|
|
|
246,137 |
|
|
|
217,782 |
|
|
|
131,827 |
|
|
|
66,383 |
|
|
Interest-bearing deposits |
|
|
1,222,382 |
|
|
|
716,817 |
|
|
|
584,255 |
|
|
|
517,914 |
|
|
|
340,443 |
|
|
Borrowings(4) |
|
|
796,000 |
|
|
|
282,886 |
|
|
|
141,603 |
|
|
|
100,000 |
|
|
|
91,000 |
|
|
Shareholders’ equity(3) |
|
|
259,736 |
|
|
|
99,496 |
|
|
|
86,762 |
|
|
|
73,580 |
|
|
|
49,197 |
|
|
Selected Performance and Capital Ratios: |
|
|
|
|
|
|
|
|
|
|
|
|
|
|
|
|
|
|
|
|
|
Return on average assets |
|
|
0.76 |
% |
|
|
0.71 |
% |
|
|
0.86 |
% |
|
|
0.80 |
% |
|
|
1.91 |
% |
|
Return on average equity |
|
|
8.10 |
% |
|
|
9.10 |
% |
|
|
10.2 |
% |
|
|
9.9 |
% |
|
|
20.7 |
% |
|
Net yield on interest-earning assets |
|
|
3.39 |
% |
|
|
3.70 |
% |
|
|
4.06 |
% |
|
|
4.20 |
% |
|
|
4.43 |
% |
|
Efficiency ratio(5) |
|
|
70.7 |
% |
|
|
76.0 |
% |
|
|
78.6 |
% |
|
|
77.7 |
% |
|
|
77.4 |
% |
|
Noninterest income as a % of total revenues |
|
|
33.1 |
% |
|
|
36.6 |
% |
|
|
35.7 |
% |
|
|
37.5 |
% |
|
|
46.8 |
% |
|
Tangible common equity to tangible assets(2) |
|
|
9.93 |
% |
|
|
7.33 |
% |
|
|
8.34 |
% |
|
|
8.82 |
% |
|
|
8.92 |
% |
|
Tier 1 leverage ratio |
|
|
11.82 |
% |
|
|
7.32 |
% |
|
|
8.67 |
% |
|
|
9.19 |
% |
|
|
8.92 |
% |
|
Tier 1 risk-based capital ratio |
|
|
17.99 |
% |
|
|
11.01 |
% |
|
|
13.04 |
% |
|
|
13.60 |
% |
|
|
13.54 |
% |
|
Total risk-based capital ratio |
|
|
18.77 |
% |
|
|
12.26 |
% |
|
|
14.30 |
% |
|
|
14.85 |
% |
|
|
14.80 |
% |
|
Other Information: |
|
|
|
|
|
|
|
|
|
|
|
|
|
|
|
|
|
|
|
|
|
Assets under management (end of period) |
|
$ |
3,471,237 |
|
|
$ |
3,221,674 |
|
|
$ |
2,594,961 |
|
|
$ |
2,229,116 |
|
|
$ |
1,827,436 |
|
|
NPAs to total assets |
|
|
0.32 |
% |
|
|
0.11 |
% |
|
|
0.32 |
% |
|
|
0.17 |
% |
|
|
0.00 |
% |
|
Charge-offs to average loans |
|
|
0.15 |
% |
|
|
0.00 |
% |
|
|
0.10 |
% |
|
|
0.04 |
% |
|
|
0.05 |
% |
|
Ratio of ALLL to loans(6) |
|
|
0.61 |
% |
|
|
0.87 |
% |
|
|
1.16 |
% |
|
|
1.25 |
% |
|
|
1.25 |
% |
|
Number of wealth management offices |
|
|
7 |
|
|
|
7 |
|
|
|
7 |
|
|
|
6 |
|
|
|
4 |
|
|
|
|
(1) |
The 2015 amount includes $2.9 in gains on sales of loans. The 2014 and 2011 amounts include $1.0 million and $3.7 million of gains on sale of REO, respectively. |
|
(2) |
Tangible common equity, (also referred to as tangible book value) and tangible assets, are equal to common equity and assets, respectively, less $2.4 of intangible assets as of December 31, 2015, $0.2 million of intangible assets as of December 31, 2014, and less $0.3 million of intangible assets as of December 31, 2013 and December 31, 2012. |
39
|
(4) |
Borrowings consist primarily of overnight and short-term advances obtained by FFB from the Federal Home Loan Bank. |
|
(5) |
The efficiency ratio is the ratio of noninterest expense to the sum of net interest income and noninterest income. The efficiency ratio excludes (i) gains on sale of REO of $1.0 million and $3.7 million in 2014 and 2011, respectively; and (ii) in 2014, $1.0 million of costs related to a cancelled initial public offering and $1.0 million of contingent payout expense related to the acquisition of DCB. |
|
(6) |
This ratio excludes loans acquired in our acquisitions of PRB and DCB, as generally accepted accounting principles in the United States, or GAAP, requires estimated credit losses for acquired loans to be recorded as discounts to those loans. |
40
The following discussion and analysis is intended to facilitate the understanding and assessment of significant changes and trends in our businesses that accounted for the changes in our results of operations in the year ended December 31, 2015, as compared to our results of operation in the year ended December 31, 2014; in our results of operations in the year ended December 31, 2014, as compared to our results of operations in the year ended December 31, 2013, and our financial condition at December 31, 2015 as compared to our financial condition at December 31, 2014. This discussion and analysis is based on and should be read in conjunction with our consolidated financial statements and the accompanying notes thereto contained elsewhere in this Annual Report on Form 10-K. In addition to historical information, this discussion contains forward-looking statements that involve risks, uncertainties and assumptions that could cause results to differ materially from management’s expectations. Some of the factors that could cause results to differ materially from expectations are discussed in the sections entitled “Risk Factors” and “Forward-Looking Statements” contained elsewhere in this Annual Report on Form 10-K.
Critical Accounting Policies
Our consolidated financial statements are prepared in accordance with generally accepted accounting principles in the United States (“GAAP”) and accounting practices in the banking industry. Certain of those accounting policies are considered critical accounting policies, because they require us to make estimates and assumptions regarding circumstances or trends that could materially affect the value of those assets, such as economic conditions or trends that could impact our ability to fully collect our loans or ultimately realize the carrying value of certain of our other assets. Those estimates and assumptions are made based on current information available to us regarding those economic conditions or trends or other circumstances. If changes were to occur in the events, trends or other circumstances on which our estimates or assumptions were based, or other unanticipated events were to occur that might affect our operations, we may be required under GAAP to adjust our earlier estimates and to reduce the carrying values of the affected assets on our balance sheet, generally by means of charges against income, which could also affect our results of operations in the fiscal periods when those charges are recognized.
Utilization and Valuation of Deferred Income Tax Benefits. We record as a “deferred tax asset” on our balance sheet an amount equal to the tax credit and tax loss carryforwards and tax deductions (collectively “tax benefits”) that we believe will be available to us to offset or reduce income taxes in future periods. Under applicable federal and state income tax laws and regulations, tax benefits related to tax loss carryforwards will expire if they cannot be used within specified periods of time. Accordingly, the ability to fully use our deferred tax asset related to tax loss carryforwards to reduce income taxes in the future depends on the amount of taxable income that we generate during those time periods. At least once each year, or more frequently, if warranted, we make estimates of future taxable income that we believe we are likely to generate during those future periods. If we conclude, on the basis of those estimates and the amount of the tax benefits available to us, that it is more likely, than not, that we will be able to fully utilize those tax benefits prior to their expiration, we recognize the deferred tax asset in full on our balance sheet. On the other hand, if we conclude on the basis of those estimates and the amount of the tax benefits available to us that it has become more likely, than not, that we will be unable to utilize those tax benefits in full prior to their expiration, then, we would establish a valuation allowance to reduce the deferred tax asset on our balance sheet to the amount with respect to which we believe it is still more likely, than not, that we will be able to use to offset or reduce taxes in the future. The establishment of such a valuation allowance, or any increase in an existing valuation allowance, would be effectuated through a charge to the provision for income taxes or a reduction in any income tax credit for the period in which such valuation allowance is established or increased.
Allowance for Loan and Lease Losses. Our ALLL is established through a provision for loan losses charged to expense and may be reduced by a recapture of previously established loss reserves, which are also reflected in the statement of income. Loans are charged against the ALLL when management believes that collectability of the principal is unlikely. The ALLL is an amount that management believes will be adequate to absorb estimated losses on existing loans that may become uncollectible based on an evaluation of the collectability of loans and prior loan loss experience. This evaluation also takes into consideration such factors as changes in the nature and volume of the loan portfolio, overall portfolio quality, review of specific problem loans, current economic conditions and certain other subjective factors that may affect the borrower’s ability to pay. While we use the best information available to make this evaluation, future adjustments to our ALLL may be necessary if there are significant changes in economic or other conditions that can affect the collectability in full of loans in our loan portfolio.
Adoption of new or revised accounting standards. We have elected to take advantage of the extended transition period afforded by the JOBS Act, for the implementation of new or revised accounting standards. As a result, we will not be required to comply with new or revised accounting standards that have different effective dates for public and private companies until those standards apply to private companies or we cease to be an “emerging growth” company as defined in the JOBS Act. As a result of this election, our financial statements may not be comparable to the financials statements of companies that comply with public company effective dates.
41
We have two business segments, “Banking” and “Investment Management, Wealth Planning and Consulting” (“Wealth Management”). Banking includes the operations of FFB and FFIS and Wealth Management includes the operations of FFA. The financial position and operating results of the stand-alone holding company, FFI, are included under the caption “Other” in certain of the tables that follow, along with any consolidation elimination entries.
Recent Developments and Overview
On July 1, 2015, the Company filed a “shelf” registration statement with the SEC on Form S-3 for the purpose of registering, under the Securities Act of 1933, as amended, an aggregate of $150 million of shares of its common stock that would be available for possible sale, in one or more transactions, in the future. The registration statement was declared effective on July 20, 2015. Pursuant to this registration statement, the Company commenced a public offering in which it sold a total of 6,233,766 shares of its common stock, at a public offering price of $19.25 per share, on August 12, 2015. The offering resulted in gross proceeds of $120.0 million and net proceeds of approximately $113.7 million, after underwriting discounts and estimated expenses of the offering. The Company used a portion of the net proceeds from the offering to repay all of its $29 million of outstanding term debt and intends to use the remaining proceeds for general corporate purposes, including supporting organic growth and possible acquisitions. On August 14, 2015, the underwriters exercised their option to purchase an additional 935,065 shares of the Company’s common stock, at a price of $19.25 per share, to cover any over-allotments in the public offering. As a result, the Company received additional gross proceeds of $18.0 million and net proceeds of $17.1 million, after underwriting discounts.
We have continued to grow our operations. Comparing 2015 to 2014, we have increased our revenues (net interest income and noninterest income) by 29%. This growth in revenues is the result of the growth in Banking’s total interest-earning assets. During 2015, total loans in Banking increased by $599 million or 51% while securities available for sale increased by $427 million. Wealth Management’s AUM increased by $250 million or 8% during 2015, and totaled $3.47 billion as of December 31, 2015.
The results of operations for Banking and Wealth Management reflect the benefits of this growth. Income before taxes for Banking increased $6.3 million from $18.7 million in 2014 to $25.0 million in 2015. Income before taxes for Wealth Management increased from $1.4 million in 2014 to $2.2 million in 2015. On a consolidated basis, income before taxes increased $8.0 million from $14.8 million in 2014 to $22.8 million in 2015.
Results of Operations
Years Ended December 31, 2015 and 2014.
Our net income for 2015 was $13.4 million, as compared to $8.4 million for 2014. The primary sources of revenue for Banking are net interest income, fees from its deposits, trust and insurance services, gains on sales of loans, certain loan fees, and, beginning in the second half of 2014, fees charged for consulting and administrative services. The primary sources of revenue for Wealth Management are asset management fees assessed on the balance of AUM and, up through the first half of 2014, fees charged for consulting and administrative services. Compensation and benefit costs, which represent the largest component of noninterest expense, accounted for 63% and 76%, respectively, of the total noninterest expense for Banking and Wealth Management in 2015.
42
The following tables show key operating results for each of our business segments for the years ended December 31:
|
(dollars in thousands) |
|
Banking |
|
|
Wealth |
|
|
Other |
|
|
Total |
|
||||
|
2015: |
|
|
|
|
|
|
|
|
|
|
|
|
|
|
|
|
|
Interest income |
|
$ |
64,471 |
|
|
$ |
— |
|
|
$ |
— |
|
|
$ |
64,471 |
|
|
Interest expense |
|
|
5,607 |
|
|
|
— |
|
|
|
674 |
|
|
|
6,281 |
|
|
Net interest income |
|
|
58,864 |
|
|
|
— |
|
|
|
(674 |
) |
|
|
58,190 |
|
|
Provision for loan losses |
|
|
2,673 |
|
|
|
— |
|
|
|
— |
|
|
|
2,673 |
|
|
Noninterest income |
|
|
8,833 |
|
|
|
20,530 |
|
|
|
(590 |
) |
|
|
28,773 |
|
|
Noninterest expense |
|
|
39,982 |
|
|
|
18,352 |
|
|
|
3,124 |
|
|
|
61,458 |
|
|
Income (loss) before taxes on income |
|
$ |
25,042 |
|
|
$ |
2,178 |
|
|
$ |
(4,388 |
) |
|
$ |
22,832 |
|
|
2014: |
|
|
|
|
|
|
|
|
|
|
|
|
|
|
|
|
|
Interest income |
|
$ |
47,398 |
|
|
$ |
— |
|
|
$ |
— |
|
|
$ |
47,398 |
|
|
Interest expense |
|
|
3,844 |
|
|
|
— |
|
|
|
740 |
|
|
|
4,584 |
|
|
Net interest income |
|
|
43,554 |
|
|
|
— |
|
|
|
(740 |
) |
|
|
42,814 |
|
|
Provision for loan losses |
|
|
235 |
|
|
|
— |
|
|
|
— |
|
|
|
235 |
|
|
Noninterest income |
|
|
5,866 |
|
|
|
19,422 |
|
|
|
(539 |
) |
|
|
24,749 |
|
|
Noninterest expense |
|
|
30,509 |
|
|
|
17,979 |
|
|
|
4,019 |
|
|
|
52,507 |
|
|
Income (loss) before taxes on income |
|
$ |
18,676 |
|
|
$ |
1,443 |
|
|
$ |
(5,298 |
) |
|
$ |
14,821 |
|
General. Income before taxes was $22.8 million in 2015 as compared to $14.8 million in 2014. This increase was due to increases in income before taxes for Banking and Wealth Management of $6.4 million and $0.7 million, respectively, and a $0.9 million decrease in corporate interest and noninterest expenses. The $6.4 million increase in income before taxes for Banking in 2015 as compared to 2014 was due to higher net interest income and higher noninterest income, which were partially offset by a higher provision for loan losses and higher noninterest expenses. For Wealth Management, the $0.7 million increase was due to higher noninterest income which was partially offset by higher noninterest expenses.
The decrease in corporate interest and noninterest expenses in 2015 as compared to 2014 was primarily due to a $0.9 million decrease in professional services and marketing expenses.
43
Net Interest Income. The following tables set forth information regarding (i) the total dollar amount of interest income from interest-earning assets and the resultant average yields on those assets; (ii) the total dollar amount of interest expense and the average rate of interest on our interest-bearing liabilities; (iii) net interest income; (iv) net interest rate spread; and (v) net yield on interest-earning assets for the year ended December 31:
|
|
|
2015 |
|
|
2014 |
|
||||||||||||||||||
|
(dollars in thousands) |
|
Average |
|
|
Interest |
|
|
Average |
|
|
Average |
|
|
Interest |
|
|
Average |
|
||||||
|
Interest-earning assets: |
|
|
|
|
|
|
|
|
|
|
|
|
|
|
|
|
|
|
|
|
|
|
|
|
|
Loans |
|
$ |
1,450,081 |
|
|
$ |
57,481 |
|
|
|
3.96 |
% |
|
$ |
1,016,374 |
|
|
$ |
44,140 |
|
|
|
4.34 |
% |
|
Securities |
|
|
224,906 |
|
|
|
5,227 |
|
|
|
2.32 |
% |
|
|
105,755 |
|
|
|
2,545 |
|
|
|
2.41 |
% |
|
FHLB stock, fed funds |
|
|
41,356 |
|
|
|
1,763 |
|
|
|
4.26 |
% |
|
|
33,749 |
|
|
|
713 |
|
|
|
2.11 |
% |
|
Total interest-earning assets |
|
|
1,716,343 |
|
|
|
64,471 |
|
|
|
3.76 |
% |
|
|
1,155,878 |
|
|
|
47,398 |
|
|
|
4.10 |
% |
|
Noninterest-earning assets: |
|
|
|
|
|
|
|
|
|
|
|
|
|
|
|
|
|
|
|
|
|
|
|
|
|
Nonperforming assets |
|
|
2,098 |
|
|
|
|
|
|
|
|
|
|
|
3,581 |
|
|
|
|
|
|
|
|
|
|
Other |
|
|
24,741 |
|
|
|
|
|
|
|
|
|
|
|
16,116 |
|
|
|
|
|
|
|
|
|
|
Total assets |
|
$ |
1,743,182 |
|
|
|
|
|
|
|
|
|
|
$ |
1,175,575 |
|
|
|
|
|
|
|
|
|
|
Interest-bearing liabilities: |
|
|
|
|
|
|
|
|
|
|
|
|
|
|
|
|
|
|
|
|
|
|
|
|
|
Demand deposits |
|
$ |
293,502 |
|
|
|
1,351 |
|
|
|
0.46 |
% |
|
$ |
245,969 |
|
|
|
1,248 |
|
|
|
0.51 |
% |
|
Money market and savings |
|
|
281,539 |
|
|
|
1,641 |
|
|
|
0.58 |
% |
|
|
148,541 |
|
|
|
841 |
|
|
|
0.57 |
% |
|
Certificates of deposit |
|
|
339,846 |
|
|
|
1,894 |
|
|
|
0.56 |
% |
|
|
262,070 |
|
|
|
1,497 |
|
|
|
0.57 |
% |
|
Total interest-bearing deposits |
|
|
914,887 |
|
|
|
4,886 |
|
|
|
0.53 |
% |
|
|
656,580 |
|
|
|
3,586 |
|
|
|
0.55 |
% |
|
Borrowings |
|
|
369,225 |
|
|
|
1,395 |
|
|
|
0.38 |
% |
|
|
192,768 |
|
|
|
998 |
|
|
|
0.52 |
% |
|
Total interest-bearing liabilities |
|
|
1,284,112 |
|
|
|
6,281 |
|
|
|
0.49 |
% |
|
|
849,348 |
|
|
|
4,584 |
|
|
|
0.54 |
% |
|
Noninterest-bearing liabilities: |
|
|
|
|
|
|
|
|
|
|
|
|
|
|
|
|
|
|
|
|
|
|
|
|
|
Demand deposits |
|
|
282,822 |
|
|
|
|
|
|
|
|
|
|
|
226,367 |
|
|
|
|
|
|
|
|
|
|
Other liabilities |
|
|
10,865 |
|
|
|
|
|
|
|
|
|
|
|
8,484 |
|
|
|
|
|
|
|
|
|
|
Total liabilities |
|
|
1,577,799 |
|
|
|
|
|
|
|
|
|
|
|
1,084,199 |
|
|
|
|
|
|
|
|
|
|
Stockholders’ equity |
|
|
165,383 |
|
|
|
|
|
|
|
|
|
|
|
91,376 |
|
|
|
|
|
|
|
|
|
|
Total liabilities and equity |
|
$ |
1,743,182 |
|
|
|
|
|
|
|
|
|
|
$ |
1,175,575 |
|
|
|
|
|
|
|
|
|
|
Net Interest Income |
|
|
|
|
|
$ |
58,190 |
|
|
|
|
|
|
|
|
|
|
$ |
42,814 |
|
|
|
|
|
|
Net Interest Rate Spread |
|
|
|
|
|
|
|
|
|
|
3.27 |
% |
|
|
|
|
|
|
|
|
|
|
3.56 |
% |
|
Net Yield on Interest-earning Assets |
|
|
|
|
|
|
|
|
|
|
3.39 |
% |
|
|
|
|
|
|
|
|
|
|
3.70 |
% |
Net interest income is impacted by the volume (changes in volume multiplied by prior rate), interest rate (changes in rate multiplied by prior volume) and mix of interest-earning assets and interest-bearing liabilities. The following table provides a breakdown of the changes in net interest income due to volume and rate changes between 2015 as compared to 2014.
|
|
|
Increase (Decrease) due to |
|
|
Net Increase |
|
||||||
|
(dollars in thousands) |
|
Volume |
|
|
Rate |
|
|
|
||||
|
Interest earned on: |
|
|
|
|
|
|
|
|
|
|
|
|
|
Loans |
|
$ |
17,472 |
|
|
$ |
(4,131 |
) |
|
$ |
13,341 |
|
|
Securities |
|
|
2,772 |
|
|
|
(90 |
) |
|
|
2,682 |
|
|
FHLB stock, fed funds and deposits |
|
|
191 |
|
|
|
859 |
|
|
|
1,050 |
|
|
Total interest-earning assets |
|
|
20,435 |
|
|
|
(3,362 |
) |
|
|
17,073 |
|
|
Interest paid on: |
|
|
|
|
|
|
|
|
|
|
|
|
|
Demand deposits |
|
|
224 |
|
|
|
(121 |
) |
|
|
103 |
|
|
Money market and savings |
|
|
774 |
|
|
|
26 |
|
|
|
800 |
|
|
Certificates of deposit |
|
|
435 |
|
|
|
(38 |
) |
|
|
397 |
|
|
Borrowings |
|
|
725 |
|
|
|
(328 |
) |
|
|
397 |
|
|
Total interest-bearing liabilities |
|
|
2,158 |
|
|
|
(461 |
) |
|
|
1,697 |
|
|
Net interest income |
|
$ |
18,277 |
|
|
$ |
(2,901 |
) |
|
$ |
15,376 |
|
Net interest income increased 36% from $42.8 million in 2014, to $58.2 million in 2015 because of a 48% increase in interest-earning assets, which was partially offset by a decrease in our net interest rate spread. The decrease in the net interest rate spread from 3.56% for 2014 to 3.27% for 2015 was due to a decrease in yield on total interest earning assets which was partially offset by a decrease in rates paid on interest bearing liabilities. The yield on interest earning assets decreased from 4.10% to 3.76% due to an
44
increase in the proportion of lower yielding securities to total interest earning assets and a decrease in the yield on loans. The decrease in yield on loans was due to prepayments of higher yielding loans and the addition of loans at current market rates which are lower than the current yield on our loan portfolio. The rate on interest bearing liabilities decreased as a result of the payoff of the higher cost term loan in August of 2015 and the impact of lower cost deposits from the acquisition of PRB in 2015. We realized $0.3 million and $1.3 million on the net recovery of mark to mark adjustments related to payoffs of acquired loans in 2015 and 2014, respectively.
Provision for loan losses. The provision for loan losses represents our determination of the amount necessary to be charged against the current period’s earnings to maintain the ALLL at a level that is considered adequate in relation to the estimated losses inherent in the loan portfolio. The provision for loan losses is impacted by changes in loan balances as well as changes in estimated loss assumptions and charge-offs and recoveries. The amount of our provision for loan losses also takes into consideration such factors as changes in the nature and volume of the loan portfolio, overall portfolio quality, review of specific problem loans, current economic conditions and certain other subjective factors that may affect the ability of borrowers to meet their repayment obligations to us. The provision for loan losses was $2.7 million for 2015 and $0.2 million for 2014. The increase reflects the significant increase in loans and increase in loan chargeoffs, which were partially offset by a decrease in estimated loss assumptions. We recognized $2.2 million in chargeoffs in 2015, and we did not recognize any chargeoffs in 2014.
Noninterest income. Noninterest income for Banking includes fees charged to clients for trust services and deposit services, consulting fees, prepayment and late fees charged on loans, gain on sale or REO and insurance commissions. The following table provides a breakdown of noninterest income for Banking for the years ended December 31:
|
(dollars in thousands) |
|
2015 |
|
|
2014 |
|
||
|
Trust fees |
|
$ |
2,331 |
|
|
$ |
2,153 |
|
|
Consulting fees |
|
|
979 |
|
|
|
576 |
|
|
Deposit charges |
|
|
427 |
|
|
|
397 |
|
|
Gain on sale of loans |
|
|
2,935 |
|
|
|
— |
|
|
Gain on sale of REO |
|
|
— |
|
|
|
1,038 |
|
|
Prepayment fees |
|
|
1,317 |
|
|
|
903 |
|
|
Other |
|
|
844 |
|
|
|
799 |
|
|
Total noninterest income |
|
$ |
8,833 |
|
|
$ |
5,866 |
|
The $3.0 million increase in noninterest income for Banking in 2015 as compared to 2014 was due primarily to a $2.7 million gain on sale of $102 million of loans in the fourth quarter of 2015, and an increase of $0.4 million loan prepayment fees. In June of 2014, the foundation and family consulting activities were transferred from Wealth Management to Banking and, as a result, the related revenues are now recognized under Banking.
Noninterest income for Wealth Management includes fees charged to high net-worth clients for managing their assets and for providing financial planning consulting services. The following table provides a breakdown of noninterest income for Wealth Management for the years ended December 31:
|
(dollars in thousands) |
|
2015 |
|
|
2014 |
|
||
|
Asset management fees |
|
$ |
20,470 |
|
|
$ |
18,904 |
|
|
Consulting and administration fees |
|
|
121 |
|
|
|
533 |
|
|
Other |
|
|
(61 |
) |
|
|
(15 |
) |
|
Total noninterest income |
|
$ |
20,530 |
|
|
$ |
19,422 |
|
The $1.1 million increase in noninterest income in Wealth Management in 2015 as compared to 2014 was primarily due to increases in asset management fees of 8% which was partially offset by a decrease in consulting and administration fees. The increases in asset management fees were primarily due to a 8% increase in the AUM balances used for computing the asset management fees in 2015, as compared to AUM balances used for computing the asset management fees in 2014. In June of 2014, the foundation and family consulting activities were transferred from Wealth Management to Banking and, as a result, the related revenues are now recognized under Banking.
45
Noninterest Expense. The following table provides a breakdown of noninterest expense for Banking and Wealth Management for the years ended December 31:
|
|
|
Banking |
|
|
Wealth Management |
|
||||||||||
|
(dollars in thousands) |
|
2015 |
|
|
2014 |
|
|
2015 |
|
|
2014 |
|
||||
|
Compensation and benefits |
|
$ |
25,273 |
|
|
$ |
18,694 |
|
|
$ |
14,031 |
|
|
$ |
13,760 |
|
|
Occupancy and depreciation |
|
|
7,117 |
|
|
|
5,366 |
|
|
|
1,952 |
|
|
|
1,818 |
|
|
Professional services and marketing |
|
|
2,863 |
|
|
|
2,420 |
|
|
|
1,549 |
|
|
|
1,645 |
|
|
Other expenses |
|
|
4,729 |
|
|
|
4,029 |
|
|
|
820 |
|
|
|
756 |
|
|
Total noninterest expense |
|
$ |
39,982 |
|
|
$ |
30,509 |
|
|
$ |
18,352 |
|
|
$ |
17,979 |
|
The $9.5 million increase in noninterest expense in Banking in 2015 as compared to 2014 was due primarily to increases in staffing and costs associated with the Bank’s expansion and growth of its balances of loans and deposits. Compensation and benefits for Banking increased $6.6 million during 2015 as compared to 2014 as the number of full time equivalent employees (“FTE”) in Banking increased to 191.3 during 2015 from 144.5 during 2014, as a result of the acquisition of PRB and increased staffing to support the growth in loans and deposits. The $2.9 million increase in occupancy and depreciation, professional services and marketing and other expenses were related to increased costs related to the acquisition of PRB and costs associated with its expansion into additional corporate space and opening of new offices. In addition, $0.3 million of costs related to the conversion of PRB core processing systems were included in other expenses in the third quarter of 2015.
Noninterest expenses in Wealth Management increased $0.4 million in 2015 as compared to 2014 primarily due to increases in compensation and benefits. The increase in compensation and benefits reflects increased incentive compensation incurred primarily as a result of the increase in AUM.
Years Ended December 31, 2014 and 2013.
Our net income for 2014 was $8.4 million, as compared to $7.9 million for 2013. The proportional increase in net income was less than the proportional increase in income before taxes because of an increase in our effective tax rate from 17% in 2013 to 43% in 2014. In 2013, the valuation allowance for deferred taxes was reduced by $2.4 million and certain credits under California tax laws were eliminated at the beginning of 2014 resulting in a higher effective tax rate in 2014.
The primary sources of revenue for Banking are net interest income, fees from its deposits, trust and insurance services, certain loan fees, and, beginning in the second half of 2014, fees charged for consulting and administrative services. The primary sources of revenue for Wealth Management are asset management fees assessed on the balance of AUM and, up through the first half of 2015, fees charged for consulting and administrative services. Compensation and benefit costs, which represent the largest component of noninterest expense accounted for 61% and 77%, respectively, of the total noninterest expense for Banking and Wealth Management in 2014.
The following tables show key operating results for each of our business segments for the years ended December 31:
|
(dollars in thousands) |
|
Banking |
|
|
Wealth |
|
|
Other |
|
|
Total |
|
|||||||||||||||
|
2014: |
|
|
|
|
|
|
|
|
|
|
|
|
|
|
|
|
|||||||||||
|
Interest income |
|
$ |
47,398 |
|
|
$ |
— |
|
|
$ |
— |
|
|
$ |
47,398 |
|
|||||||||||
|
Interest expense |
|
|
3,844 |
|
|
|
— |
|
|
|
740 |
|
|
|
4,584 |
|
|||||||||||
|
Net interest income |
|
|
43,554 |
|
|
|
— |
|
|
|
(740 |
) |
|
|
42,814 |
|
|||||||||||
|
Provision for loan losses |
|
|
235 |
|
|
|
— |
|
|
|
— |
|
|
|
235 |
|
|||||||||||
|
Noninterest income |
|
|
5,866 |
|
|
|
19,422 |
|
|
|
(539 |
) |
|
|
24,749 |
|
|||||||||||
|
Noninterest expense |
|
|
30,509 |
|
|
|
17,979 |
|
|
|
4,019 |
|
|
|
52,507 |
|
|||||||||||
|
Income (loss) before taxes on income |
|
$ |
18,676 |
|
|
$ |
1,443 |
|
|
$ |
(5,298 |
) |
|
$ |
14,821 |
|
|||||||||||
|
2013: |
|
|
|
|
|
|
|
|
|
|
|
|
|
|
|
|
|||||||||||
|
Interest income |
|
$ |
39,181 |
|
|
$ |
— |
|
|
$ |
— |
|
|
$ |
39,181 |
|
|||||||||||
|
Interest expense |
|
|
3,288 |
|
|
|
— |
|
|
|
219 |
|
|
|
3,507 |
|
|||||||||||
|
Net interest income |
|
|
35,893 |
|
|
|
— |
|
|
|
(219 |
) |
|
|
35,674 |
|
|||||||||||
|
Provision for loan losses |
|
|
2,395 |
|
|
|
— |
|
|
|
— |
|
|
|
2,395 |
|
|||||||||||
|
Noninterest income |
|
|
3,514 |
|
|
|
16,715 |
|
|
|
(405 |
) |
|
|
19,824 |
|
|||||||||||
|
Noninterest expense |
|
|
24,302 |
|
|
|
17,400 |
|
|
|
1,920 |
|
|
|
43,622 |
|
|||||||||||
|
Income (loss) before taxes on income |
|
$ |
12,710 |
|
|
$ |
(685 |
) |
|
$ |
(2,544 |
) |
|
$ |
9,481 |
|
|||||||||||
46
General. Income before taxes was $14.8 million in 2014 as compared to $9.5 million in 2013. This increase was due to increases in income before taxes for Banking and Wealth Management of $6.0 million and $2.1 million, respectively, which were partially offset by a $2.8 million increase in corporate interest and noninterest expenses. The $6.0 million increase in income before taxes for Banking in 2014 as compared to 2013 was due to higher net interest income, higher noninterest income and a lower provision for loan losses, which were partially offset by higher noninterest expenses. For Wealth Management, a $0.7 million loss before taxes in 2013 improved to income before taxes of $1.4 million in 2014 due to higher noninterest income which was partially offset by higher noninterest expenses.
The increase in corporate interest and noninterest expenses in 2014 as compared to 2013 was primarily due to a $0.5 million increase in interest costs related to the higher balance of the term loan, the expensing of $1.0 million in IPO costs, $0.3 million of increased allocations of executive compensation related to the time spent on the IPO by management employees of the Bank and $0.3 million of costs related to the implementation of a new firm-wide client relationship management system.
47
Net Interest Income: The following tables set forth information regarding (i) the total dollar amount of interest income from interest-earning assets and the resultant average yields on those assets; (ii) the total dollar amount of interest expense and the average rate of interest on our interest-bearing liabilities; (iii) net interest income; (iv) net interest rate spread; and (v) net yield on interest-earning assets for the years ended December 31:
|
|
|
2014 |
|
|
2013 |
|
||||||||||||||||||
|
(dollars in thousands) |
|
Average |
|
|
Interest |
|
|
Average |
|
|
Average |
|
|
Interest |
|
|
Average |
|
||||||
|
Interest-earning assets: |
|
|
|
|
|
|
|
|
|
|
|
|
|
|
|
|
|
|
|
|
|
|
|
|
|
Loans |
|
$ |
1,016,374 |
|
|
$ |
44,140 |
|
|
|
4.34 |
% |
|
$ |
803,808 |
|
|
$ |
37,918 |
|
|
|
4.69 |
% |
|
Securities |
|
|
105,755 |
|
|
|
2,545 |
|
|
|
2.41 |
% |
|
|
37,325 |
|
|
|
864 |
|
|
|
2.31 |
% |
|
FHLB stock, fed funds and deposits |
|
|
33,749 |
|
|
|
713 |
|
|
|
2.11 |
% |
|
|
37,918 |
|
|
|
399 |
|
|
|
1.05 |
% |
|
Total interest-earning assets |
|
|
1,155,878 |
|
|
|
47,398 |
|
|
|
4.10 |
% |
|
|
879,051 |
|
|
|
39,181 |
|
|
|
4.43 |
% |
|
Noninterest-earning assets: |
|
|
|
|
|
|
|
|
|
|
|
|
|
|
|
|
|
|
|
|
|
|
|
|
|
Nonperforming assets |
|
|
3,581 |
|
|
|
|
|
|
|
|
|
|
|
2,778 |
|
|
|
|
|
|
|
|
|
|
Other |
|
|
16,116 |
|
|
|
|
|
|
|
|
|
|
|
18,875 |
|
|
|
|
|
|
|
|
|
|
Total assets |
|
$ |
1,175,575 |
|
|
|
|
|
|
|
|
|
|
$ |
900,704 |
|
|
|
|
|
|
|
|
|
|
Interest-bearing liabilities: |
|
|
|
|
|
|
|
|
|
|
|
|
|
|
|
|
|
|
|
|
|
|
|
|
|
Demand deposits |
|
$ |
245,969 |
|
|
|
1,248 |
|
|
|
0.51 |
% |
|
$ |
165,736 |
|
|
|
857 |
|
|
|
0.52 |
% |
|
Money market and savings |
|
|
148,541 |
|
|
|
841 |
|
|
|
0.57 |
% |
|
|
99,826 |
|
|
|
434 |
|
|
|
0.44 |
% |
|
Certificates of deposit |
|
|
262,070 |
|
|
|
1,497 |
|
|
|
0.57 |
% |
|
|
279,470 |
|
|
|
1,876 |
|
|
|
0.67 |
% |
|
Total interest-bearing |
|
|
656,580 |
|
|
|
3,586 |
|
|
|
0.55 |
% |
|
|
545,032 |
|
|
|
3,167 |
|
|
|
0.58 |
% |
|
Borrowings |
|
|
192,768 |
|
|
|
998 |
|
|
|
0.52 |
% |
|
|
84,409 |
|
|
|
340 |
|
|
|
0.40 |
% |
|
Total interest-bearing |
|
|
849,348 |
|
|
|
4,584 |
|
|
|
0.54 |
% |
|
|
629,441 |
|
|
|
3,507 |
|
|
|
0.56 |
% |
|
Noninterest-bearing liabilities: |
|
|
|
|
|
|
|
|
|
|
|
|
|
|
|
|
|
|
|
|
|
|
|
|
|
Demand deposits |
|
|
226,367 |
|
|
|
|
|
|
|
|
|
|
|
186,760 |
|
|
|
|
|
|
|
|
|
|
Other liabilities |
|
|
8,484 |
|
|
|
|
|
|
|
|
|
|
|
7,813 |
|
|
|
|
|
|
|
|
|
|
Total liabilities |
|
|
1,084,199 |
|
|
|
|
|
|
|
|
|
|
|
824,014 |
|
|
|
|
|
|
|
|
|
|
Stockholders’ equity |
|
|
91,376 |
|
|
|
|
|
|
|
|
|
|
|
76,690 |
|
|
|
|
|
|
|
|
|
|
Total liabilities and equity |
|
$ |
1,175,575 |
|
|
|
|
|
|
|
|
|
|
$ |
900,704 |
|
|
|
|
|
|
|
|
|
|
Net Interest Income |
|
|
|
|
|
$ |
42,814 |
|
|
|
|
|
|
|
|
|
|
$ |
35,674 |
|
|
|
|
|
|
Net Interest Rate Spread |
|
|
|
|
|
|
|
|
|
|
3.56 |
% |
|
|
|
|
|
|
|
|
|
|
3.87 |
% |
|
Net Yield on Interest- |
|
|
|
|
|
|
|
|
|
|
3.70 |
% |
|
|
|
|
|
|
|
|
|
|
4.04 |
% |
Net interest income is impacted by the volume (changes in volume multiplied by prior rate), interest rate (changes in rate multiplied by prior volume) and mix of interest-earning assets and interest-bearing liabilities. The following table provides a breakdown of the changes in net interest income due to volume and rate changes between 2014 as compared to corresponding period in 2013.
|
|
|
Increase (Decrease) due to |
|
|
Net Increase |
|
||||||
|
(dollars in thousands) |
|
Volume |
|
|
Rate |
|
|
|
||||
|
Interest earned on: |
|
|
|
|
|
|
|
|
|
|
|
|
|
Loans |
|
$ |
9,178 |
|
|
$ |
(2,956 |
) |
|
$ |
6,222 |
|
|
Securities |
|
|
1,646 |
|
|
|
35 |
|
|
|
1,681 |
|
|
FHLB stock, fed funds and deposits |
|
|
(48) |
|
|
|
362 |
|
|
|
314 |
|
|
Total interest-earning assets |
|
|
10,776 |
|
|
|
(2,559 |
) |
|
|
8,217 |
|
|
Interest paid on: |
|
|
|
|
|
|
|
|
|
|
|
|
|
Demand deposits |
|
|
408 |
|
|
|
(17 |
) |
|
|
391 |
|
|
Money market and savings |
|
|
252 |
|
|
|
155 |
) |
|
|
407 |
|
|
Certificates of deposit |
|
|
(111) |
|
|
|
(268 |
) |
|
|
(379 |
) |
|
Borrowings |
|
|
538 |
|
|
|
120 |
|
|
|
658 |
|
|
Total interest-bearing liabilities |
|
|
1,087 |
|
|
|
(10 |
) |
|
|
1,077 |
|
|
Net interest income |
|
$ |
9,689 |
|
|
$ |
(2,549 |
) |
|
$ |
7,140 |
|
48
Net interest income increased 21% from $34.8 million in 2013, to $42.3 million in 2014 because of a 31% increase in interest-earning assets, which was partially offset by a decrease in our net interest rate spread. The decrease in the net interest rate spread from 3.87% for 2013 to 3.56% for 2014 was due to a decrease in yield on total interest earning assets which was partially offset by a decrease in rates paid on interest bearing liabilities. The yield on interest earning assets decreased from 4.43% to 4.10% due to an increase in the proportion of lower yielding securities to total interest earning assets and a decrease in the yield on loans. The decrease in yield on loans was due to prepayments of higher yielding loans and the addition of loans at current market rates which are lower than the current yield on our loan portfolio. The rate on interest bearing liabilities decreased as a decrease in the rate on interest bearing deposits was partially offset by an increase in the rate on borrowings. The decrease in rates paid on deposits was due to lower market rates while the increase in the rates paid on borrowings was primarily due to the higher proportion of borrowings being from the term loan which bears interest at ninety day Libor plus 4.0% per annum as compared to the FHLB weighted average borrowing rate of 0.15% during 2014. We realized $1.3 million and $1.1 million on the net recovery of mark to mark adjustments related to payoffs of acquired loans in 2014 and 2013, respectively.
Provision for loan losses. The provision for loan losses represents our determination of the amount necessary to be charged against the current period’s earnings to maintain the ALLL at a level that is considered adequate in relation to the estimated losses inherent in the loan portfolio. The provision for loan losses is impacted by changes in loan balances as well as changes in estimated loss assumptions and charge-offs and recoveries. The amount of our provision also takes into consideration such factors as changes in the nature and volume of the loan portfolio, overall portfolio quality, review of specific problem loans, current economic conditions and certain other subjective factors that may affect the ability of borrowers to meet their repayment obligations to us. The provision for loan losses was $0.2 million for 2014 and $2.4 million for 2013. The lower provision for loan losses in 2014 as compared to 2013 reflects reductions in estimated loss assumptions and the lower amount of chargeoffs. We did not recognize any chargeoffs in the 2014, as compared to $0.8 million of chargeoffs recognized in 2013.
Noninterest income: The following table provides a breakdown of noninterest income for Banking for the years ended December 31:
|
(dollars in thousands) |
|
2014 |
|
|
2013 |
|
||
|
Trust fees |
|
$ |
2,153 |
|
|
$ |
1,785 |
|
|
Consulting fees |
|
|
576 |
|
|
|
— |
|
|
Deposit charges |
|
|
397 |
|
|
|
366 |
|
|
Gain on sale of REO |
|
|
1,038 |
|
|
|
— |
|
|
Prepayment fees |
|
|
903 |
|
|
|
846 |
|
|
Other |
|
|
799 |
|
|
|
517 |
|
|
Total noninterest income |
|
$ |
5,866 |
|
|
$ |
3,514 |
|
The $2.4 million increase in noninterest income for Banking in 2014 as compared to 2013 was due primarily to the $1.0 million gain on sale of REO, $0.6 million of consulting fees, a $0.4 million increase in trust fees and a $0.2 million increase in insurance commissions. In June of 2014, the foundation and family consulting activities were transferred from Wealth Management to Banking and, as a result, the related revenues are now recognized under Banking. The increase in trust fees is due to a 22% increase in trust AUM during 2014 and the increase in insurance commissions reflects a higher level of large dollar cases closed in 2014 as compared to 2013
Noninterest income for Wealth Management includes fees charged to high net-worth clients for managing their assets and for providing financial planning consulting services. The following table provides a breakdown of noninterest income for Wealth Management for the years ended December 31:
|
(dollars in thousands) |
|
2014 |
|
|
2013 |
|
||
|
Asset management fees |
|
$ |
18,904 |
|
|
$ |
15,560 |
|
|
Consulting and administration fees |
|
|
533 |
|
|
|
1,164 |
|
|
Other |
|
|
(15 |
) |
|
|
(9 |
) |
|
Total noninterest income |
|
$ |
19,422 |
|
|
$ |
16,715 |
|
The $2.7 million increase in noninterest income in Wealth Management in 2014 as compared to 2013 was primarily due to increases in asset management fees of 21% which was partially offset by a decrease in consulting and administration fees. The increases in asset management fees were primarily due to a 22% increase in the AUM balances used for computing the asset management fees in 2014, as compared to AUM balances used for computing the asset management fees in 2013. In June of 2014, the foundation and family consulting activities were transferred from Wealth Management to Banking and, as a result, the related revenues are now recognized under Banking.
49
Noninterest Expense: The following table provides a breakdown of noninterest expense for Banking and Wealth Management for the years ended December 31:
|
|
|
Banking |
|
|
Wealth Management |
|
||||||||||
|
(dollars in thousands) |
|
2014 |
|
|
2013 |
|
|
2014 |
|
|
2013 |
|
||||
|
Compensation and benefits |
|
$ |
18,694 |
|
|
$ |
14,971 |
|
|
$ |
13,760 |
|
|
$ |
13,176 |
|
|
Occupancy and depreciation |
|
|
5,366 |
|
|
|
4,568 |
|
|
|
1,818 |
|
|
|
1,922 |
|
|
Professional services and marketing |
|
|
2,420 |
|
|
|
1,752 |
|
|
|
1,645 |
|
|
|
1,536 |
|
|
Other expenses |
|
|
4,029 |
|
|
|
3,011 |
|
|
|
756 |
|
|
|
766 |
|
|
Total noninterest expense |
|
$ |
30,509 |
|
|
$ |
24,302 |
|
|
$ |
17,979 |
|
|
$ |
17,400 |
|
The $6.2 million increase in noninterest expense in Banking in 2014 as compared to 2013 was due primarily to increases in staffing and costs associated with the Bank’s higher balances of loans and deposits and our continuing expansion and a $1.0 million provision related to contingent consideration to be paid to the former shareholders of DCB. Compensation and benefits for Banking increased $3.7 million during 2014 as compared to 2013 as the number of FTE in Banking increased to 144.5 during 2014 from 123.1 during 2013 and the Bank recorded $0.5 million of severance costs. The $0.8 million increase in occupancy and depreciation costs for Banking in 2014 as compared to 2013 was due to an office opening and the expansion into additional space at the administrative office in the second quarter of 2013. The $0.7 million increase in professional services and marketing was due primarily to higher legal costs related to ongoing litigation matters and increased management fees related to the increased trust AUM. The $1.0 million increase in other expenses in 2014 as compared to 2013 was primarily due to the $1.0 million provision related to contingent consideration to be paid to the former shareholders of DCB.
Noninterest expenses in Wealth Management increased $0.6 million in 2014 as compared to 2013 primarily due to increases in compensation and benefits. The increase in compensation and benefits reflects increased incentive compensation incurred as a result of the increase in AUM.
50
The following table shows the financial position for each of our business segments, and of FFI and elimination entries used to arrive at our consolidated totals which are included in the column labeled Other, at December 31:
|
(dollars in thousands) |
|
Banking |
|
|
Wealth |
|
|
Other and |
|
|
Total |
|
||||
|
2015: |
|
|
|
|
|
|
|
|
|
|
|
|
|
|
|
|
|
Cash and cash equivalents |
|
$ |
215,671 |
|
|
$ |
5,682 |
|
|
$ |
(5,605 |
) |
|
$ |
215,748 |
|
|
Securities AFS |
|
|
565,135 |
|
|
|
— |
|
|
|
— |
|
|
|
565,135 |
|
|
Loans, net |
|
|
1,754,883 |
|
|
|
— |
|
|
|
— |
|
|
|
1,754,883 |
|
|
Premises and equipment |
|
|
1,996 |
|
|
|
545 |
|
|
|
112 |
|
|
|
2,653 |
|
|
FHLB Stock |
|
|
21,492 |
|
|
|
— |
|
|
|
— |
|
|
|
21,492 |
|
|
Deferred taxes |
|
|
14,466 |
|
|
|
630 |
|
|
|
296 |
|
|
|
15,392 |
|
|
REO |
|
|
4,036 |
|
|
|
— |
|
|
|
— |
|
|
|
4,036 |
|
|
Goodwill and Intangibles |
|
|
2,416 |
|
|
|
— |
|
|
|
— |
|
|
|
2,416 |
|
|
Other assets |
|
|
8,645 |
|
|
|
314 |
|
|
|
1,865 |
|
|
|
10,824 |
|
|
Total assets |
|
$ |
2,588,740 |
|
|
$ |
7,171 |
|
|
$ |
(3,332 |
) |
|
$ |
2,592,579 |
|
|
Deposits |
|
$ |
1,569,932 |
|
|
$ |
— |
|
|
$ |
(47,756 |
) |
|
$ |
1,522,176 |
|
|
Borrowings |
|
|
796,000 |
|
|
|
— |
|
|
|
— |
|
|
|
796,000 |
|
|
Intercompany balances |
|
|
2,748 |
|
|
|
121 |
|
|
|
(2,869 |
) |
|
|
— |
|
|
Other liabilities |
|
|
9,309 |
|
|
|
2,634 |
|
|
|
2,724 |
|
|
|
14,667 |
|
|
Shareholders’ equity |
|
|
210,751 |
|
|
|
4,416 |
|
|
|
44,569 |
|
|
|
259,736 |
|
|
Total liabilities and equity |
|
$ |
2,588,740 |
|
|
$ |
7,171 |
|
|
$ |
(3,332 |
) |
|
$ |
2,592,579 |
|
|
2014: |
|
|
|
|
|
|
|
|
|
|
|
|
|
|
|
|
|
Cash and cash equivalents |
|
$ |
29,585 |
|
|
$ |
3,750 |
|
|
$ |
(3,643 |
) |
|
$ |
29,692 |
|
|
Securities AFS |
|
|
138,270 |
|
|
|
— |
|
|
|
— |
|
|
|
138,270 |
|
|
Loans, net |
|
|
1,156,021 |
|
|
|
221 |
|
|
|
— |
|
|
|
1,156,242 |
|
|
Premises and equipment |
|
|
1,539 |
|
|
|
548 |
|
|
|
100 |
|
|
|
2,187 |
|
|
FHLB Stock |
|
|
12,361 |
|
|
|
— |
|
|
|
— |
|
|
|
12,361 |
|
|
Deferred taxes |
|
|
9,196 |
|
|
|
601 |
|
|
|
(49 |
) |
|
|
9,748 |
|
|
REO |
|
|
334 |
|
|
|
— |
|
|
|
— |
|
|
|
334 |
|
|
Other assets |
|
|
4,827 |
|
|
|
500 |
|
|
|
1,263 |
|
|
|
6,590 |
|
|
Total assets |
|
$ |
1,352,133 |
|
|
$ |
5,620 |
|
|
$ |
(2,329 |
) |
|
$ |
1,355,424 |
|
|
Deposits |
|
$ |
972,319 |
|
|
$ |
— |
|
|
$ |
(9,365 |
) |
|
$ |
962,954 |
|
|
Borrowings |
|
|
263,000 |
|
|
|
— |
|
|
|
19,886 |
|
|
|
282,886 |
|
|
Intercompany balances |
|
|
1,287 |
|
|
|
73 |
|
|
|
(1,360 |
) |
|
|
— |
|
|
Other liabilities |
|
|
6,352 |
|
|
|
2,486 |
|
|
|
1,250 |
|
|
|
10,088 |
|
|
Shareholders’ equity |
|
|
109,175 |
|
|
|
3,061 |
|
|
|
(12,740 |
) |
|
|
99,496 |
|
|
Total liabilities and equity |
|
$ |
1,352,133 |
|
|
$ |
5,620 |
|
|
$ |
(2,329 |
) |
|
$ |
1,355,424 |
|
|
2013: |
|
|
|
|
|
|
|
|
|
|
|
|
|
|
|
|
|
Cash and cash equivalents |
|
$ |
56,795 |
|
|
$ |
2,134 |
|
|
$ |
(1,975 |
) |
|
$ |
56,954 |
|
|
Securities AFS |
|
|
59,111 |
|
|
|
— |
|
|
|
— |
|
|
|
59,111 |
|
|
Loans, net |
|
|
893,364 |
|
|
|
366 |
|
|
|
— |
|
|
|
893,730 |
|
|
Premises and equipment |
|
|
2,286 |
|
|
|
863 |
|
|
|
100 |
|
|
|
3,249 |
|
|
FHLB Stock |
|
|
6,721 |
|
|
|
— |
|
|
|
— |
|
|
|
6,721 |
|
|
Deferred taxes |
|
|
11,426 |
|
|
|
865 |
|
|
|
(239) |
|
|
|
12,052 |
|
|
REO |
|
|
375 |
|
|
|
— |
|
|
|
— |
|
|
|
375 |
|
|
Other assets |
|
|
3,840 |
|
|
|
717 |
|
|
|
611 |
|
|
|
5,168 |
|
|
Total assets |
|
$ |
1,033,918 |
|
|
$ |
4,945 |
|
|
$ |
(1,503 |
) |
|
$ |
1,037,360 |
|
|
Deposits |
|
$ |
809,306 |
|
|
$ |
— |
|
|
$ |
(7,269 |
) |
|
$ |
802,037 |
|
|
Borrowings |
|
|
134,000 |
|
|
|
— |
|
|
|
7,063 |
|
|
|
141,063 |
|
|
Intercompany balances |
|
|
857 |
|
|
|
248 |
|
|
|
(1,105 |
) |
|
|
— |
|
|
Other liabilities |
|
|
4,018 |
|
|
|
2,590 |
|
|
|
890 |
|
|
|
7,498 |
|
|
Shareholders’ equity |
|
|
85,737 |
|
|
|
2,107 |
|
|
|
(1,082) |
|
|
|
86,762 |
|
|
Total liabilities and equity |
|
$ |
1,033,918 |
|
|
$ |
4,945 |
|
|
$ |
(1,503 |
) |
|
$ |
1,037,360 |
|
51
Our consolidated balance sheet is primarily affected by changes occurring in our Banking operations as our Wealth Management operations do not maintain significant levels of assets. Banking has experienced and is expected to continue to experience increases in its total assets as a result of our growth strategy.
During 2015, total assets for the Company and the Bank increased by $1.2 billion. For the Bank, during 2015, loans increased by $599 million, deposits increased by $598 million, cash and cash equivalents increased by $186 million, securities AFS increased by $427 million and FHLB advances increased by $533 million. Borrowings at FFI decreased by $20 million during 2015. During 2014, total assets for the Company and the Bank increased by $318 million. For the Bank, during 2014, loans increased by $263 million, deposits increased by $163 million, cash and cash equivalents decreased by $27 million, securities AFS increased by $79 million and FHLB advances increased by $129 million. Borrowings at FFI increased by $13 million during 2014.
Cash and cash equivalents, certificates of deposit and securities: Cash and cash equivalents, which primarily consist of funds held at the Federal Reserve Bank or at correspondent banks, including fed funds, increased by $186 million during 2015. Changes in cash and cash equivalents are primarily affected by the funding of loans, investments in securities, and changes in our sources of funding: deposits, FHLB advances and FFI borrowings. During 2015 the Company obtained net proceeds of $131 million from a public offering of shares of our common stock and used a portion of the net proceeds from the offering to repay all of its $29 million of outstanding term debt.
Securities available for sale: The following table provides a summary of the Company’s AFS securities portfolio at December 31:
|
|
|
Amortized Cost |
|
|
Gross Unrealized |
|
|
Estimated Fair Value |
|
|||||||
|
(dollars in thousands) |
|
|
|
Gains |
|
|
Losses |
|
|
|
||||||
|
2015: |
|
|
|
|
|
|
|
|
|
|
|
|
|
|
|
|
|
US Treasury securities |
|
$ |
300 |
|
|
$ |
— |
|
|
$ |
— |
|
|
$ |
300 |
|
|
Agency notes |
|
|
16,108 |
|
|
|
— |
|
|
|
(95 |
) |
|
|
16,013 |
|
|
Agency mortgage-backed securities |
|
|
537,819 |
|
|
|
909 |
|
|
|
(3,030 |
) |
|
|
536,148 |
|
|
Beneficial interest – FHLMC securitization |
|
|
12,674 |
|
|
|
476 |
|
|
|
(476 |
) |
|
|
12,674 |
|
|
Total |
|
$ |
567,351 |
|
|
$ |
1,385 |
|
|
$ |
(3,601 |
) |
|
$ |
565,135 |
|
|
2014: |
|
|
|
|
|
|
|
|
|
|
|
|
|
|
|
|
|
US Treasury Securities |
|
$ |
300 |
|
|
$ |
— |
|
|
$ |
— |
|
|
$ |
300 |
|
|
Agency notes |
|
|
10,496 |
|
|
|
— |
|
|
|
(219 |
) |
|
|
10,277 |
|
|
Agency mortgage-backed securities |
|
|
125,944 |
|
|
|
1,881 |
|
|
|
(132 |
) |
|
|
127,693 |
|
|
Total |
|
$ |
136,740 |
|
|
$ |
1,881 |
|
|
$ |
(351 |
) |
|
$ |
138,270 |
|
|
2013: |
|
|
|
|
|
|
|
|
|
|
|
|
|
|
|
|
|
US Treasury Securities |
|
$ |
300 |
|
|
$ |
— |
|
|
$ |
— |
|
|
$ |
300 |
|
|
Agency note |
|
|
10,496 |
|
|
|
— |
|
|
|
(716 |
) |
|
|
9,780 |
|
|
Agency mortgage-backed securities |
|
|
50,983 |
|
|
|
30 |
|
|
|
(1,982 |
) |
|
|
49,031 |
|
|
Total |
|
$ |
61,779 |
|
|
$ |
30 |
|
|
$ |
(2,698 |
) |
|
$ |
59,111 |
|
The US Treasury Securities are pledged as collateral to the State of California to meet regulatory requirements related to FFB’s trust operations.
The $427 million increase in AFS Securities in 2015 was the result of a capital leverage strategy under which the Company utilized the capital raised in its public offering to leverage an increase in its AFS securities portfolio through the use of FHLB advances. The purchases of securities under this strategy were limited to fifteen year term agency mortgage-backed securities. The $75 million increase in AFS Securities in 2014 reflected our actions to increase our on-balance sheet sources of liquidity.
52
The table below indicates, as of December 31, 2015, the gross unrealized losses and fair values of our investments, aggregated by investment category and length of time that the individual securities have been in a continuous unrealized loss position.
|
|
|
Securities with Unrealized Loss at December 31, 2015 |
|
|||||||||||||||||||||
|
(dollars in thousands) |
|
Less than 12 months |
|
|
12 months or more |
|
|
Total |
|
|||||||||||||||
|
|
Fair |
|
|
Unrealized |
|
|
Fair |
|
|
Unrealized |
|
|
Fair |
|
|
Unrealized |
|
|||||||
|
Agency notes |
|
$ |
16,013 |
|
|
$ |
(95 |
) |
|
$ |
— |
|
|
$ |
— |
|
|
$ |
16,013 |
|
|
$ |
(95 |
) |
|
Agency mortgage backed securities |
|
|
397,850 |
|
|
|
(3,030 |
) |
|
|
— |
|
|
|
— |
|
|
|
397,850 |
|
|
|
(3,030 |
) |
|
Beneficial interest – FHLMC securitization |
|
|
12,674 |
|
|
|
(476 |
) |
|
|
— |
|
|
|
— |
|
|
|
12,674 |
|
|
|
(476 |
) |
|
Total temporarily impaired securities |
|
$ |
426,537 |
|
|
$ |
(3,601 |
) |
|
$ |
— |
|
|
$ |
— |
|
|
$ |
426,537 |
|
|
$ |
(3,601 |
) |
Unrealized losses on agency notes and agency mortgage-backed securities have not been recognized into income because the issuer bonds are of high credit quality, management does not intend to sell and it is not more likely than not that management would be required to sell the securities prior to their anticipated recovery, and the decline in fair value is largely due to changes in interest rates. The fair value is expected to recover as the bonds approach maturity.
The scheduled maturities of securities AFS, other than agency mortgage backed securities, and the related weighted average yield is as follows as of December 31, 2015:
|
(dollars in thousands) |
|
Less than |
|
|
1 Through |
|
|
5 Through |
|
|
After |
|
|
Total |
|
|||||
|
Amortized Cost: |
|
|
|
|
|
|
|
|
|
|
|
|
|
|
|
|
|
|
|
|
|
US Treasury securities |
|
$ |
300 |
|
|
$ |
— |
|
|
$ |
— |
|
|
$ |
— |
|
|
$ |
300 |
|
|
Agency notes |
|
|
— |
|
|
|
12,760 |
|
|
|
2,748 |
|
|
|
600 |
|
|
|
16,108 |
|
|
Total |
|
$ |
300 |
|
|
$ |
12,760 |
|
|
$ |
2,748 |
|
|
$ |
600 |
|
|
$ |
16,408 |
|
|
Weighted average yield |
|
|
0.45 |
% |
|
|
1.50 |
% |
|
|
1.94 |
% |
|
|
2.86 |
% |
|
|
1.60 |
% |
|
Estimated Fair Value: |
|
|
|
|
|
|
|
|
|
|
|
|
|
|
|
|
|
|
|
|
|
US Treasury securities |
|
$ |
300 |
|
|
$ |
— |
|
|
$ |
— |
|
|
$ |
— |
|
|
$ |
300 |
|
|
Agency notes |
|
|
— |
|
|
|
12,692 |
|
|
|
2,725 |
|
|
|
596 |
|
|
|
16,013 |
|
|
Total |
|
$ |
300 |
|
|
$ |
12,692 |
|
|
$ |
2,725 |
|
|
$ |
596 |
|
|
$ |
16,313 |
|
Agency mortgage backed securities are excluded from the above table because such securities are not due at a single maturity date. The weighted average yield of the agency mortgage backed securities as of December 31, 2015 was 2.24%.
Loans. The following table sets forth our loans, by loan category, as of December 31:
|
(dollars in thousands) |
|
2015 |
|
|
2014 |
|
|
2013 |
|
|
2012 |
|
|
2011 |
|
|||||
|
Recorded investment balance: |
|
|
|
|
|
|
|
|
|
|
|
|
|
|
|
|
|
|
|
|
|
Loans secured by real estate: |
|
|
|
|
|
|
|
|
|
|
|
|
|
|
|
|
|
|
|
|
|
Residential properties: |
|
|
|
|
|
|
|
|
|
|
|
|
|
|
|
|
|
|
|
|
|
Multifamily |
|
$ |
627,311 |
|
|
$ |
481,491 |
|
|
$ |
405,984 |
|
|
$ |
367,412 |
|
|
$ |
320,053 |
|
|
Single family |
|
|
533,257 |
|
|
|
360,644 |
|
|
|
227,096 |
|
|
|
155,864 |
|
|
|
85,226 |
|
|
Total real estate loans secured by residential properties |
|
|
1,160,568 |
|
|
|
842,135 |
|
|
|
633,080 |
|
|
|
523,276 |
|
|
|
405,279 |
|
|
Commercial properties |
|
|
358,791 |
|
|
|
205,320 |
|
|
|
154,982 |
|
|
|
132,217 |
|
|
|
75,542 |
|
|
Land |
|
|
12,320 |
|
|
|
4,309 |
|
|
|
3,794 |
|
|
|
7,575 |
|
|
|
— |
|
|
Total real estate loans |
|
|
1,531,679 |
|
|
|
1,051,764 |
|
|
|
791,856 |
|
|
|
663,068 |
|
|
|
480,821 |
|
|
Commercial and industrial loans |
|
|
196,584 |
|
|
|
93,537 |
|
|
|
93,255 |
|
|
|
67,920 |
|
|
|
35,377 |
|
|
Consumer loans |
|
|
37,206 |
|
|
|
21,125 |
|
|
|
18,484 |
|
|
|
12,585 |
|
|
|
8,012 |
|
|
Total loans |
|
|
1,765,469 |
|
|
|
1,166,426 |
|
|
|
903,595 |
|
|
|
743,573 |
|
|
|
542,210 |
|
|
Premiums, discounts and deferred fees and expenses |
|
|
14 |
|
|
|
(34 |
) |
|
|
50 |
|
|
|
54 |
|
|
|
(107 |
) |
|
Total |
|
$ |
1,765,483 |
|
|
$ |
1,166,392 |
|
|
$ |
903,645 |
|
|
$ |
743,627 |
|
|
$ |
524,103 |
|
The $599 million increase in loans during 2015 was the result of loan originations and funding of existing credit commitments of $944 million and $80 million of loans obtained in the acquisition of PRB, which were partially offset by $426 million of payoffs, scheduled principal payments, and loans sold. The $263 million increase in loans during 2014 was the result of loan originations and funding of existing credit commitments of $504 million, offset by $241 million of payoffs and scheduled principal
53
payments. The scheduled maturities, as of December 31, 2015, of the performing loans categorized as land loans and as commercial and industrial loans, are as follows:
|
|
|
Scheduled Maturity |
|
|
Loans With a Scheduled |
|
||||||||||||||
|
(dollars in thousands) |
|
Due in One Year or Less |
|
|
Due After One |
|
|
Due After |
|
|
Loans With |
|
|
Loan With |
|
|||||
|
Land loans |
|
$ |
8,709 |
|
|
$ |
2,224 |
|
|
$ |
1,895 |
|
|
$ |
3,395 |
|
|
$ |
724 |
|
|
Commercial and industrial loans |
|
$ |
81,085 |
|
|
$ |
69,854 |
|
|
$ |
42,625 |
|
|
$ |
46,081 |
|
|
$ |
66,398 |
|
Deposits: The following table sets forth information with respect to our deposits and the average rates paid on deposits, as of December 31:
|
|
|
2015 |
|
|
2014 |
|
2013 |
|
||||||||||||||||
|
(dollars in thousands) |
|
Amount |
|
|
Weighted |
|
|
Amount |
|
|
Weighted |
|
|
Amount |
Weighted |
|
||||||||
|
Demand deposits: |
|
|
|
|
|
|
|
|
|
|
|
|
|
|
|
|
|
|
|
|
|
|
|
|
|
Noninterest-bearing |
|
$ |
299,794 |
|
|
|
— |
|
|
$ |
246,137 |
|
|
|
— |
|
|
$ |
217,782 |
|
|
|
|
|
|
Interest-bearing |
|
|
260,167 |
|
|
|
0.359 |
% |
|
|
291,509 |
|
|
|
0.502 |
% |
|
|
217,129 |
|
|
|
0.504 |
% |
|
Money market and savings |
|
|
492,015 |
|
|
|
0.531 |
% |
|
|
171,958 |
|
|
|
0.626 |
% |
|
|
121,260 |
|
|
|
0.499 |
% |
|
Certificates of deposits |
|
|
470,200 |
|
|
|
0.554 |
% |
|
|
253,350 |
|
|
|
0.619 |
% |
|
|
245,866 |
|
|
|
0.606 |
% |
|
Total |
|
$ |
1,522,176 |
|
|
|
0.404 |
% |
|
$ |
962,954 |
|
|
|
0.427 |
% |
|
$ |
802,037 |
|
|
|
0.398 |
% |
The $559 million increase in deposits during 2015 reflect the organic growth of our Banking operations, $120 million of deposits acquired in an acquisition, and a $251 million increase in brokered deposits. The $161 million increase in deposits during 2014 reflects the organic growth of our Banking operations.
During 2015, deposit market rates, which were declining in prior years, have been stable. However, in 2015, the Company benefited from the lower cost deposits obtained in its acquisition of PRB. The weighted average rate of interest-bearing deposits, which increased slightly from 0.55% at December 31, 2013 to 0.57% at December 31, 2014, decreased to 0.50% at December 31, 2015, while the weighted average interest rates of both interest-bearing and noninterest-bearing deposits, which increased from 0.40% at December 31, 2013, to 0.43% at December 31, 2014, decreased to 0.40% at December 31, 2015. As the Company continues to grow, it has emphasized its money market products and has offered increased rates on promotional products to attract new deposit clients.
The maturities of our certificates of deposit of $100,000 or more were as follows as of December 31, 2015:
|
(dollars in thousands) |
|
|||
|
3 months or less |
|
$ |
124,232 |
|
|
Over 3 months through 6 months |
|
|
162,301 |
|
|
Over 6 months through 12 months |
|
|
57,417 |
|
|
Over 12 months |
|
|
28,008 |
|
|
Total |
|
$ |
371,958 |
|
FFB utilizes a third party program called CDARs which allows FFB to transfer funds of its clients in excess of the FDIC insurance limit (currently $250,000) to other institutions in exchange for an equal amount of funds from clients of these other institutions. This has allowed FFB to provide FDIC insurance coverage to its clients. Under certain regulatory guidelines, these deposits are considered brokered deposits. From time to time, the Bank will utilize brokered deposits as a source of funding. As of December 31, 2015, the Bank held $328 million of deposits which are classified as brokered deposits, including $49 million of CDARs reciprocal deposits.
Borrowings: At December 31, 2015, our borrowings consisted of $796 million of overnight FHLB advances at FFB. At December 31, 2014, our borrowings consisted of $263 million of overnight FHLB advances at FFB and a $20 million term loan at FFI. These FHLB advances were paid in full in the early parts of January 2016 and January 2015, respectively. Because FFB utilizes overnight borrowings, the balance of outstanding borrowings fluctuates on a daily basis. The weighted average interest rate on these overnight borrowings was 0.20% for 2015 and 0.15% for 2014. The average balance of overnight borrowings was $352 million during 2015, as compared to $175 million during 2014. The maximum amount of short-term FHLB advances outstanding at any month-end during 2015, and 2014, was $796 million, and $263 million, respectively.
54
Term Loan. In the second quarter of 2013, we entered into a secured loan agreement with a lender to borrow $7.5 million for a term of five years. In the first quarter of 2014, we entered into an amendment to this loan agreement pursuant to which we obtained an additional $15.0 million of borrowings. This amendment did not alter any of the terms of the loan agreement or the loan, other than to increase the principal amount and to correspondingly increase the amount of the monthly installments of principal and interest payable on the loan. In the first quarter of 2015, we entered into a second amendment to this loan agreement pursuant to which, we obtained an additional $10.3 million of borrowings, bringing the outstanding balance of this loan to $30.0 million as of February 28, 2015. This second amendment also reduced the interest rate on this loan to 3.75% over ninety day LIBOR from 4.00% over ninety day LIBOR, extended the maturity date of this loan to May 1, 2022 and made corresponding changes to the amount of the principal payments required to be made by us on this loan. This loan was paid off in full on August 13, 2015.
Delinquent Loans, Nonperforming Assets and Provision for Credit Losses
Loans are considered past due following the date when either interest or principal is contractually due and unpaid. Loans on which the accrual of interest has been discontinued are designated as nonaccrual loans. Accrual of interest on loans is discontinued when reasonable doubt exists as to the full, timely collection of interest or principal and, generally, when a loan becomes contractually past due for 90 days or more with respect to principal or interest. However, the accrual of interest may be continued on a well-secured loan contractually past due 90 days or more with respect to principal or interest if the loan is in the process of collection or collection of the principal and interest is deemed probable. The following tables provide a summary of past due and nonaccrual loans as of December 31:
|
|
|
Past Due and Still Accruing |
|
|
|
Total Past |
|
Current |
|
Total |
|
||||||||||||||||||
|
(dollars in thousands) |
|
30–59 Days |
|
|
60-89 Days |
|
|
90 Days |
|
|
Nonaccrual |
|
|
|
|
||||||||||||||
|
2015: |
|
|
|
|
|
|
|
|
|
|
|
|
|
|
|
|
|
|
|
|
|
|
|
|
|
|
|
|
|
|
Real estate loans: |
|
|
|
|
|
|
|
|
|
|
|
|
|
|
|
|
|
|
|
|
|
|
|
|
|
|
|
|
|
|
Residential properties |
|
$ |
— |
|
|
$ |
— |
|
|
$ |
— |
|
|
$ |
— |
|
|
$ |
— |
|
|
$ |
1,160,568 |
|
|
$ |
1,160,568 |
|
|
|
Commercial properties |
|
|
1,232 |
|
|
|
— |
|
|
|
793 |
|
|
|
1,552 |
|
|
|
3,577 |
|
|
|
355,214 |
|
|
|
358,791 |
|
|
|
Land |
|
|
— |
|
|
|
— |
|
|
|
— |
|
|
|
— |
|
|
|
— |
|
|
|
12,320 |
|
|
|
12,320 |
|
|
|
Commercial and |
|
|
2,425 |
|
|
|
1,639 |
|
|
|
5,713 |
|
|
|
2,509 |
|
|
|
12,286 |
|
|
|
184,298 |
|
|
|
196,584 |
|
|
|
Consumer loans |
|
|
1,010 |
|
|
|
— |
|
|
|
1,991 |
|
|
|
75 |
|
|
|
3,076 |
|
|
|
34,130 |
|
|
|
37,206 |
|
|
|
Total |
|
$ |
4,667 |
|
|
$ |
1,639 |
|
|
$ |
8,497 |
|
|
$ |
4,136 |
|
|
$ |
18,939 |
|
|
$ |
1,746,530 |
|
|
$ |
1,765,469 |
|
|
|
Percentage of total loans |
|
|
0.26 |
% |
|
|
0.09 |
% |
|
|
0.48 |
% |
|
|
0.23 |
% |
|
|
1.07 |
% |
|
|
|
|
|
|
|
|
|
|
2014: |
|
|
|
|
|
|
|
|
|
|
|
|
|
|
|
|
|
|
|
|
|
|
|
|
|
|
|
|
|
|
Real estate loans: |
|
|
|
|
|
|
|
|
|
|
|
|
|
|
|
|
|
|
|
|
|
|
|
|
|
|
|
|
|
|
Residential properties |
|
$ |
— |
|
|
$ |
— |
|
|
$ |
— |
|
|
$ |
— |
|
|
$ |
— |
|
|
$ |
842,135 |
|
|
$ |
842,135 |
|
|
|
Commercial properties |
|
|
— |
|
|
|
805 |
|
|
|
200 |
|
|
|
596 |
|
|
|
1,601 |
|
|
|
203,719 |
|
|
|
205,320 |
|
|
|
Land |
|
|
— |
|
|
|
— |
|
|
|
651 |
|
|
|
— |
|
|
|
651 |
|
|
|
3,658 |
|
|
|
4,309 |
|
|
|
Commercial and |
|
|
2,092 |
|
|
|
289 |
|
|
|
700 |
|
|
|
342 |
|
|
|
3,423 |
|
|
|
90,114 |
|
|
|
93,537 |
|
|
|
Consumer loans |
|
|
— |
|
|
|
— |
|
|
|
637 |
|
|
|
163 |
|
|
|
800 |
|
|
|
20,325 |
|
|
|
21,125 |
|
|
|
Total |
|
$ |
2,092 |
|
|
$ |
1,094 |
|
|
$ |
2,188 |
|
|
$ |
1,101 |
|
|
$ |
6,475 |
|
|
$ |
1,159,951 |
|
|
$ |
1,166,426 |
|
|
|
Percentage of total loans |
|
|
0.18 |
% |
|
|
0.09 |
% |
|
|
0.19 |
% |
|
|
0.09 |
% |
|
|
0.56 |
% |
|
|
|
|
|
|
|
|
|
|
2013: |
|
|
|
|
|
|
|
|
|
|
|
|
|
|
|
|
|
|
|
|
|
|
|
|
|
|
|
|
|
|
Real estate loans: |
|
|
|
|
|
|
|
|
|
|
|
|
|
|
|
|
|
|
|
|
|
|
|
|
|
|
|
|
|
|
Residential properties |
|
$ |
— |
|
|
$ |
— |
|
|
$ |
— |
|
|
$ |
1,820 |
|
|
$ |
1,820 |
|
|
$ |
631,260 |
|
|
$ |
633,080 |
|
|
|
Commercial properties |
|
|
— |
|
|
|
— |
|
|
|
417 |
|
|
|
598 |
|
|
|
1,015 |
|
|
|
153,967 |
|
|
|
154,982 |
|
|
|
Land |
|
|
— |
|
|
|
— |
|
|
|
1,480 |
|
|
|
— |
|
|
|
1,480 |
|
|
|
2,314 |
|
|
|
3,794 |
|
|
|
Commercial and industrial |
|
|
— |
|
|
|
2,744 |
|
|
|
1,315 |
|
|
|
344 |
|
|
|
4,403 |
|
|
|
88,852 |
|
|
|
93,255 |
|
|
|
Consumer loans |
|
|
— |
|
|
|
— |
|
|
|
— |
|
|
|
132 |
|
|
|
132 |
|
|
|
18,352 |
|
|
|
18,484 |
|
|
|
Total |
|
$ |
— |
|
|
$ |
2,744 |
|
|
$ |
3,212 |
|
|
$ |
2,894 |
|
|
$ |
8,850 |
|
|
$ |
894,745 |
|
|
$ |
903,595 |
|
|
|
Percentage of total loans |
|
|
0.00 |
% |
|
|
0.30 |
% |
|
|
0.36 |
% |
|
|
0.32 |
% |
|
|
0.98 |
% |
|
|
|
|
|
|
|
|
|
As of December 31, 2012, the Company had $3.2 million of loans 30 to 59 days past due which represented 0.43% of total loans outstanding, $1.3 million of loans 60 to 89 days past due, which represented 0.17% of loans outstanding, and $3.2 million of loans 90 days or more past due, which represented 0.43% of total loans outstanding As of December 31, 2011, the Company had $0.5 million of loans 30 to 59 days past due which represented 0.10% of total loans outstanding. The Company did not have any loans over 60 days past due as of December 31, 2011.
55
The Company had $0.8 million of loans classified as nonaccrual as of December 31, 2012, and did not have any loans classified as nonaccrual as December 31, 2011.
The level of delinquent loans and nonaccrual loans have been adversely impacted by the loans acquired in an acquisition. As of December 31, 2015, of the $12.6 million in loans over 90 days past due, including loans on nonaccrual, $6.8 million, or 54% were loans acquired in an acquisition. As of December 31, 2015, the Company had two loans with a balance of $0.3 million classified as troubled debt restructurings (“TDR”) and as of December 31, 2014, the Company had two loans with a balance of $0.5 million classified as a TDR, all of which are included as nonaccrual in the table above.
The following is a breakdown of our loan portfolio by the risk category of loans at December 31:
|
(dollars in thousands) |
|
Pass |
|
|
Special |
|
|
Substandard |
|
|
Impaired |
|
|
Total |
|
|||||
|
2015: |
|
|
|
|
|
|
|
|
|
|
|
|
|
|
|
|
|
|
|
|
|
Real estate loans: |
|
|
|
|
|
|
|
|
|
|
|
|
|
|
|
|
|
|
|
|
|
Residential properties |
|
$ |
1,159,029 |
|
|
$ |
1,539 |
|
|
$ |
— |
|
|
$ |
— |
|
|
$ |
1,160,568 |
|
|
Commercial properties |
|
|
351,988 |
|
|
|
174 |
|
|
|
354 |
|
|
|
6,275 |
|
|
|
358,791 |
|
|
Land |
|
|
11,180 |
|
|
|
— |
|
|
|
1,140 |
|
|
|
— |
|
|
|
12,320 |
|
|
Commercial and industrial loans |
|
|
180,755 |
|
|
|
4,977 |
|
|
|
5,165 |
|
|
|
5,687 |
|
|
|
196,584 |
|
|
Consumer loans |
|
|
37,130 |
|
|
|
— |
|
|
|
— |
|
|
|
76 |
|
|
|
37,206 |
|
|
Total |
|
$ |
1,740,082 |
|
|
$ |
6,690 |
|
|
$ |
6,659 |
|
|
$ |
12,038 |
|
|
$ |
1,765,469 |
|
|
2014: |
|
|
|
|
|
|
|
|
|
|
|
|
|
|
|
|
|
|
|
|
|
Real estate loans: |
|
|
|
|
|
|
|
|
|
|
|
|
|
|
|
|
|
|
|
|
|
Residential properties |
|
$ |
841,538 |
|
|
$ |
554 |
|
|
$ |
— |
|
|
$ |
43 |
|
|
$ |
842,135 |
|
|
Commercial properties |
|
|
198,112 |
|
|
|
1,266 |
|
|
|
200 |
|
|
|
5,742 |
|
|
|
205,320 |
|
|
Land |
|
|
4,309 |
|
|
|
— |
|
|
|
— |
|
|
|
— |
|
|
|
4,309 |
|
|
Commercial and industrial loans |
|
|
81,067 |
|
|
|
5,276 |
|
|
|
1,559 |
|
|
|
5,635 |
|
|
|
93,537 |
|
|
Consumer loans |
|
|
20,962 |
|
|
|
— |
|
|
|
47 |
|
|
|
116 |
|
|
|
21,125 |
|
|
Total |
|
$ |
1,145,988 |
|
|
$ |
7,096 |
|
|
$ |
1,806 |
|
|
$ |
11,536 |
|
|
$ |
1,166,426 |
|
|
2013: |
|
|
|
|
|
|
|
|
|
|
|
|
|
|
|
|
|
|
|
|
|
Real estate loans: |
|
|
|
|
|
|
|
|
|
|
|
|
|
|
|
|
|
|
|
|
|
Residential properties |
|
$ |
630,832 |
|
|
$ |
— |
|
|
$ |
— |
|
|
$ |
2,248 |
|
|
$ |
633,080 |
|
|
Commercial properties |
|
|
150,053 |
|
|
|
— |
|
|
|
4,108 |
|
|
|
821 |
|
|
|
154,982 |
|
|
Land |
|
|
2,314 |
|
|
|
— |
|
|
|
1,480 |
|
|
|
— |
|
|
|
3,794 |
|
|
Commercial and industrial loans |
|
|
88,166 |
|
|
|
43 |
|
|
|
2,047 |
|
|
|
2,999 |
|
|
|
93,255 |
|
|
Consumer loans |
|
|
18,309 |
|
|
|
— |
|
|
|
175 |
|
|
|
— |
|
|
|
18,484 |
|
|
Total |
|
$ |
889,674 |
|
|
$ |
43 |
|
|
$ |
7,810 |
|
|
$ |
6,068 |
|
|
$ |
903,595 |
|
|
2012: |
|
|
|
|
|
|
|
|
|
|
|
|
|
|
|
|
|
|
|
|
|
Real estate loans: |
|
|
|
|
|
|
|
|
|
|
|
|
|
|
|
|
|
|
|
|
|
Residential properties |
|
$ |
519,288 |
|
|
$ |
— |
|
|
$ |
1,731 |
|
|
$ |
2,257 |
|
|
$ |
523,276 |
|
|
Commercial properties |
|
|
127,803 |
|
|
|
— |
|
|
|
4,414 |
|
|
|
— |
|
|
|
132,217 |
|
|
Land |
|
|
3,818 |
|
|
|
— |
|
|
|
3,214 |
|
|
|
543 |
|
|
|
7,575 |
|
|
Commercial and industrial loans |
|
|
62,000 |
|
|
|
889 |
|
|
|
2,295 |
|
|
|
2,736 |
|
|
|
67,920 |
|
|
Consumer loans |
|
|
12,387 |
|
|
|
127 |
|
|
|
71 |
|
|
|
— |
|
|
|
12,585 |
|
|
Total |
|
$ |
725,296 |
|
|
$ |
1,016 |
|
|
$ |
11,725 |
|
|
$ |
5,536 |
|
|
$ |
743,573 |
|
|
2011: |
|
|
|
|
|
|
|
|
|
|
|
|
|
|
|
|
|
|
|
|
|
Real estate loans: |
|
|
|
|
|
|
|
|
|
|
|
|
|
|
|
|
|
|
|
|
|
Residential properties |
|
$ |
402,630 |
|
|
$ |
291 |
|
|
$ |
— |
|
|
$ |
2,358 |
|
|
$ |
405,279 |
|
|
Commercial properties |
|
|
75,542 |
|
|
|
— |
|
|
|
— |
|
|
|
— |
|
|
|
75,542 |
|
|
Commercial and industrial loans |
|
|
31,627 |
|
|
|
3,750 |
|
|
|
— |
|
|
|
— |
|
|
|
35,377 |
|
|
Consumer loans |
|
|
7,860 |
|
|
|
152 |
|
|
|
— |
|
|
|
— |
|
|
|
8,012 |
|
|
Total |
|
$ |
517,659 |
|
|
$ |
4,193 |
|
|
$ |
— |
|
|
$ |
2,358 |
|
|
$ |
524,210 |
|
We consider a loan to be impaired when, based upon current information and events, we believe that it is probable that we will be unable to collect all amounts due according to the contractual terms of the loan. We measure impairment using either the present value of the expected future cash flows discounted at the loan’s effective interest rate, or the fair value of the properties collateralizing the loan. Impairment losses are included in the allowance for loan losses through a charge to provision for loan losses. Adjustments to impairment losses due to changes in the fair value of the property collateralizing an impaired loan are considered in computing the provision for loan losses. Loans collectively reviewed for impairment include all loans except for loans which are
56
individually reviewed based on specific criteria, such as delinquency, debt coverage, adequacy of collateral and condition of property collateralizing the loans. Impaired loans include nonaccrual loans (excluding those collectively reviewed for impairment), certain restructured loans and certain performing loans less than ninety days delinquent (“other impaired loans”) which we believe are not likely to be collected in accordance with contractual terms of the loans.
In 2012 and 2015, we purchased loans, for which there was, at acquisition, evidence of deterioration of credit quality since origination and it was probable, at acquisition, that all contractually required payments would not be collected. The carrying amount of these purchased credit impaired loans is as follows at December 31:
|
(dollars in thousands) |
|
2015 |
|
|
2014 |
|
||
|
Outstanding principal balance: |
|
|
|
|
|
|
|
|
|
Loans secured by real estate: |
|
|
|
|
|
|
|
|
|
Commercial properties |
|
$ |
533 |
|
|
$ |
206 |
|
|
Land |
|
|
1,616 |
|
|
|
— |
|
|
Total real estate loans |
|
|
2,149 |
|
|
|
206 |
|
|
Commercial and industrial loans |
|
|
6,787 |
|
|
|
2002 |
|
|
Consumer loans |
|
|
14 |
|
|
|
249 |
|
|
Total loans |
|
|
8,950 |
|
|
|
2,457 |
|
|
Unaccreted discount on purchased credit impaired loans |
|
|
(2,291 |
) |
|
|
(651 |
) |
|
Total |
|
$ |
6,659 |
|
|
$ |
1,806 |
|
57
Allowance for Loan Losses. The following table summarizes the activity in our ALLL for the year ended December 31:
|
(dollars in thousands) |
|
Beginning |
|
|
Provision for |
|
|
Charge-offs |
|
|
Recoveries |
|
|
Ending |
|
|||||
|
2015: |
|
|
|
|
|
|
|
|
|
|
|
|
|
|
|
|
|
|
|
|
|
Real estate loans: |
|
|
|
|
|
|
|
|
|
|
|
|
|
|
|
|
|
|
|
|
|
Residential properties |
|
$ |
6,586 |
|
|
$ |
243 |
|
|
$ |
— |
|
|
$ |
— |
|
|
$ |
6,829 |
|
|
Commercial properties / land |
|
|
1,526 |
|
|
|
670 |
|
|
|
(310 |
) |
|
|
— |
|
|
|
1,886 |
|
|
Commercial and industrial loans |
|
|
1,897 |
|
|
|
1,665 |
|
|
|
(1,913 |
) |
|
|
— |
|
|
|
1,649 |
|
|
Consumer loans |
|
|
141 |
|
|
|
95 |
|
|
|
— |
|
|
|
— |
|
|
|
236 |
|
|
Total |
|
$ |
10,150 |
|
|
$ |
2,673 |
|
|
$ |
(2,223 |
) |
|
$ |
— |
|
|
$ |
10,600 |
|
|
2014: |
|
|
|
|
|
|
|
|
|
|
|
|
|
|
|
|
|
|
|
|
|
Real estate loans: |
|
|
|
|
|
|
|
|
|
|
|
|
|
|
|
|
|
|
|
|
|
Residential properties |
|
$ |
6,157 |
|
|
$ |
429 |
|
|
$ |
— |
|
|
$ |
— |
|
|
$ |
6,586 |
|
|
Commercial properties / land |
|
|
1,440 |
|
|
|
86 |
|
|
|
— |
|
|
|
— |
|
|
|
1,526 |
|
|
Commercial and industrial loans |
|
|
2,149 |
|
|
|
(252) |
|
|
|
— |
|
|
|
— |
|
|
|
1,897 |
|
|
Consumer loans |
|
|
169 |
|
|
|
(28 |
) |
|
|
— |
|
|
|
— |
|
|
|
141 |
|
|
Total |
|
$ |
9,915 |
|
|
$ |
235 |
|
|
$ |
— |
|
|
$ |
— |
|
|
$ |
10,150 |
|
|
2013: |
|
|
|
|
|
|
|
|
|
|
|
|
|
|
|
|
|
|
|
|
|
Real estate loans: |
|
|
|
|
|
|
|
|
|
|
|
|
|
|
|
|
|
|
|
|
|
Residential properties |
|
$ |
4,355 |
|
|
$ |
1,802 |
|
|
$ |
— |
|
|
$ |
— |
|
|
$ |
6,157 |
|
|
Commercial properties / land |
|
|
936 |
|
|
|
561 |
|
|
|
(57) |
|
|
|
— |
|
|
|
1,440 |
|
|
Commercial and industrial loans |
|
|
2,841 |
|
|
|
71 |
|
|
|
(763) |
|
|
|
— |
|
|
|
2,149 |
|
|
Consumer loans |
|
|
208 |
|
|
|
(39 |
) |
|
|
— |
|
|
|
— |
|
|
|
169 |
|
|
Total |
|
$ |
8,340 |
|
|
$ |
2,395 |
|
|
$ |
(820 |
) |
|
$ |
— |
|
|
$ |
9,915 |
|
|
2012: |
|
|
|
|
|
|
|
|
|
|
|
|
|
|
|
|
|
|
|
|
|
Real estate loans: |
|
|
|
|
|
|
|
|
|
|
|
|
|
|
|
|
|
|
|
|
|
Residential properties |
|
$ |
3,984 |
|
|
$ |
646 |
|
|
$ |
(275) |
|
|
$ |
— |
|
|
$ |
4,355 |
|
|
Commercial properties |
|
|
1,218 |
|
|
|
(282 |
) |
|
|
— |
|
|
|
— |
|
|
|
936 |
|
|
Commercial and industrial loans |
|
|
1,104 |
|
|
|
1,737 |
|
|
|
— |
|
|
|
— |
|
|
|
2,841 |
|
|
Consumer loans |
|
|
244 |
|
|
|
(36 |
) |
|
|
— |
|
|
|
— |
|
|
|
208 |
|
|
Total |
|
$ |
6,550 |
|
|
$ |
2,065 |
|
|
$ |
(275 |
) |
|
$ |
— |
|
|
$ |
8,340 |
|
|
2011: |
|
|
|
|
|
|
|
|
|
|
|
|
|
|
|
|
|
|
|
|
|
Real estate loans: |
|
|
|
|
|
|
|
|
|
|
|
|
|
|
|
|
|
|
|
|
|
Residential properties |
|
$ |
2,185 |
|
|
$ |
1,524 |
|
|
$ |
— |
|
|
$ |
275 |
|
|
$ |
3,984 |
|
|
Commercial properties |
|
|
900 |
|
|
|
318 |
|
|
|
— |
|
|
|
— |
|
|
|
1,218 |
|
|
Commercial and industrial loans |
|
|
955 |
|
|
|
381 |
|
|
|
(232 |
) |
|
|
— |
|
|
|
1,104 |
|
|
Consumer loans |
|
|
170 |
|
|
|
74 |
|
|
|
— |
|
|
|
— |
|
|
|
244 |
|
|
Total |
|
$ |
4,210 |
|
|
$ |
2,297 |
|
|
$ |
(232 |
) |
|
$ |
275 |
|
|
$ |
6,550 |
|
Excluding the loans acquired in an Acquisition and any related allocated ALLL, our ALLL as a percentage of total loans was 0.61% and 0.87% as of December 31, 2015, and December 31, 2014, respectively.
The amount of the ALLL is adjusted periodically by charges to operations (referred to in our income statement as the “provision for loan losses”) (i) to replenish the ALLL after it has been reduced due to loan write-downs or charge-offs, (ii) to reflect increases in the volume of outstanding loans, and (iii) to take account of changes in the risk of potential loan losses due to a deterioration in the condition of borrowers or in the value of property securing non–performing loans or adverse changes in economic conditions. The amounts of the provisions we make for loan losses are based on our estimate of losses in our loan portfolio. In estimating such losses, we use economic and loss migration models that are based on bank regulatory guidelines and industry standards, and our historical charge-off experience and loan delinquency rates, local and national economic conditions, a borrower’s ability to repay its borrowings, and the value of any property collateralizing the loan, as well as a number of subjective factors. However, these determinations involve judgments about changes and trends in current economic conditions and other events that can affect the ability of borrowers to meet their loan obligations to us and a weighting among the quantitative and qualitative factors we consider in determining the sufficiency of the ALLL. Moreover, the duration and anticipated effects of prevailing economic conditions or trends can be uncertain and can be affected by a number of risks and circumstances that are outside of our control. If changes in economic or market conditions or unexpected subsequent events were to occur, or if changes were made to bank regulatory guidelines or industry standards that are used to assess the sufficiency of the ALLL, it could become necessary for us to incur additional, and possibly significant, charges to increase the ALLL, which would have the effect of reducing our income.
58
In addition, the FDIC and the DBO, as an integral part of their examination processes, periodically review the adequacy of our ALLL. These agencies may require us to make additional provisions for loan losses, over and above the provisions that we have already made, the effect of which would be to reduce our income.
The following table presents the balance in the ALLL and the recorded investment in loans by impairment method at December 31:
|
(dollars in thousands) |
|
|
Allowance for Loan Losses |
|
|
Unaccreted |
|
|||||||||||||
|
|
|
Evaluated for Impairment |
|
|
Purchased |
|
|
Total |
|
|
|
|||||||||
|
|
|
Individually |
|
|
Collectively |
|
|
|
|
|
|
|
||||||||
|
2015: |
|
|
|
|
|
|
|
|
|
|
|
|
|
|
|
|
|
|
|
|
|
Allowance for loan losses: |
|
|
|
|
|
|
|
|
|
|
|
|
|
|
|
|
|
|
|
|
|
Real estate loans: |
|
|
|
|
|
|
|
|
|
|
|
|
|
|
|
|
|
|
|
|
|
Residential properties |
|
$ |
— |
|
|
$ |
6,799 |
|
|
$ |
— |
|
|
$ |
6,799 |
|
|
$ |
127 |
|
|
Commercial properties |
|
|
30 |
|
|
|
1,783 |
|
|
|
— |
|
|
|
1,813 |
|
|
|
363 |
|
|
Land |
|
|
— |
|
|
|
103 |
|
|
|
— |
|
|
|
103 |
|
|
|
42 |
|
|
Commercial and industrial loans |
|
|
— |
|
|
|
1,649 |
|
|
|
— |
|
|
|
1,649 |
|
|
|
187 |
|
|
Consumer loans |
|
|
— |
|
|
|
236 |
|
|
|
— |
|
|
|
236 |
|
|
|
13 |
|
|
Total |
|
$ |
30 |
|
|
$ |
10,570 |
|
|
$ |
— |
|
|
$ |
10,600 |
|
|
$ |
732 |
|
|
Loans: |
|
|
|
|
|
|
|
|
|
|
|
|
|
|
|
|
|
|
|
|
|
Real estate loans: |
|
|
|
|
|
|
|
|
|
|
|
|
|
|
|
|
|
|
|
|
|
Residential properties |
|
$ |
— |
|
|
$ |
1,160,568 |
|
|
$ |
— |
|
|
$ |
1,160,568 |
|
|
$ |
7,747 |
|
|
Commercial properties |
|
|
6,275 |
|
|
|
352,162 |
|
|
|
354 |
|
|
|
358,791 |
|
|
|
43,287 |
|
|
Land |
|
|
— |
|
|
|
11,180 |
|
|
|
1,140 |
|
|
|
12,320 |
|
|
|
4,267 |
|
|
Commercial and industrial loans |
|
|
5,687 |
|
|
|
185,732 |
|
|
|
5,165 |
|
|
|
196,584 |
|
|
|
28,231 |
|
|
Consumer loans |
|
|
76 |
|
|
|
37,130 |
|
|
|
— |
|
|
|
37,206 |
|
|
|
1,761 |
|
|
Total |
|
$ |
12,038 |
|
|
$ |
1,746,772 |
|
|
$ |
6,659 |
|
|
$ |
1,765,469 |
|
|
$ |
85,293 |
|
|
2014: |
|
|
|
|
|
|
|
|
|
|
|
|
|
|
|
|
|
|
|
|
|
Allowance for loan losses: |
|
|
|
|
|
|
|
|
|
|
|
|
|
|
|
|
|
|
|
|
|
Real estate loans: |
|
|
|
|
|
|
|
|
|
|
|
|
|
|
|
|
|
|
|
|
|
Residential properties |
|
$ |
— |
|
|
$ |
6,586 |
|
|
$ |
— |
|
|
$ |
6,586 |
|
|
$ |
26 |
|
|
Commercial properties |
|
|
26 |
|
|
|
1,500 |
|
|
|
— |
|
|
|
1,526 |
|
|
|
193 |
|
|
Land |
|
|
— |
|
|
|
— |
|
|
|
— |
|
|
|
— |
|
|
|
4 |
|
|
Commercial and industrial loans |
|
|
686 |
|
|
|
1,211 |
|
|
|
— |
|
|
|
1,897 |
|
|
|
45 |
|
|
Consumer loans |
|
|
— |
|
|
|
141 |
|
|
|
— |
|
|
|
141 |
|
|
|
— |
|
|
Total |
|
$ |
712 |
|
|
$ |
9,438 |
|
|
$ |
— |
|
|
$ |
10,150 |
|
|
$ |
268 |
|
|
Loans: |
|
|
|
|
|
|
|
|
|
|
|
|
|
|
|
|
|
|
|
|
|
Real estate loans: |
|
|
|
|
|
|
|
|
|
|
|
|
|
|
|
|
|
|
|
|
|
Residential properties |
|
$ |
43 |
|
|
$ |
842,092 |
|
|
$ |
— |
|
|
$ |
842,135 |
|
|
$ |
2,861 |
|
|
Commercial properties |
|
|
5,742 |
|
|
|
199,378 |
|
|
|
200 |
|
|
|
205,320 |
|
|
|
21,126 |
|
|
Land |
|
|
— |
|
|
|
4,309 |
|
|
|
— |
|
|
|
4,309 |
|
|
|
1,099 |
|
|
Commercial and industrial loans |
|
|
5,635 |
|
|
|
86,343 |
|
|
|
1,559 |
|
|
|
93,537 |
|
|
|
5,893 |
|
|
Consumer loans |
|
|
116 |
|
|
|
20,962 |
|
|
|
47 |
|
|
|
21,125 |
|
|
|
8 |
|
|
Total |
|
$ |
11,536 |
|
|
$ |
1,153,084 |
|
|
$ |
1,806 |
|
|
$ |
1,166,426 |
|
|
$ |
30,987 |
|
|
|
|
|
|
|
|
|
|
|
|
|
|
|
|
|
|
|
|
|
|
|
59
|
(dollars in thousands) |
|
|
Allowance for Loan Losses |
|
|
Unaccreted |
|
|||||||||||||
|
|
|
Evaluated for Impairment |
|
|
Purchased |
|
|
Total |
|
|
|
|||||||||
|
|
|
Individually |
|
|
Collectively |
|
|
|
|
|
|
|
||||||||
|
|
|
|
|
|
|
|
|
|
|
|
|
|
|
|
|
|
|
|
|
|
|
Allowance for loan losses: |
|
|
|
|
|
|
|
|
|
|
|
|
|
|
|
|
|
|
|
|
|
Real estate loans: |
|
|
|
|
|
|
|
|
|
|
|
|
|
|
|
|
|
|
|
|
|
Residential properties |
|
$ |
— |
|
|
$ |
6,157 |
|
|
$ |
— |
|
|
$ |
6,157 |
|
|
$ |
36 |
|
|
Commercial properties |
|
|
190 |
|
|
|
1,250 |
|
|
|
— |
|
|
|
1,440 |
|
|
|
290 |
|
|
Land |
|
|
— |
|
|
|
— |
|
|
|
— |
|
|
|
— |
|
|
|
26 |
|
|
Commercial and industrial loans |
|
|
925 |
|
|
|
1,224 |
|
|
|
— |
|
|
|
2,149 |
|
|
|
126 |
|
|
Consumer loans |
|
|
— |
|
|
|
169 |
|
|
|
— |
|
|
|
169 |
|
|
|
11 |
|
|
Total |
|
$ |
1,115 |
|
|
$ |
8,800 |
|
|
$ |
— |
|
|
$ |
9,915 |
|
|
$ |
489 |
|
|
Loans: |
|
|
|
|
|
|
|
|
|
|
|
|
|
|
|
|
|
|
|
|
|
Real estate loans: |
|
|
|
|
|
|
|
|
|
|
|
|
|
|
|
|
|
|
|
|
|
Residential properties |
|
$ |
2,248 |
|
|
$ |
630,832 |
|
|
$ |
— |
|
|
$ |
633,080 |
|
|
$ |
3,449 |
|
|
Commercial properties |
|
|
821 |
|
|
|
150,053 |
|
|
|
4,108 |
|
|
|
154,982 |
|
|
|
23,968 |
|
|
Land |
|
|
— |
|
|
|
2,314 |
|
|
|
1,480 |
|
|
|
3,794 |
|
|
|
1,939 |
|
|
Commercial and industrial loans |
|
|
2,999 |
|
|
|
88,209 |
|
|
|
2,047 |
|
|
|
93,255 |
|
|
|
10,354 |
|
|
Consumer loans |
|
|
— |
|
|
|
18,441 |
|
|
|
43 |
|
|
|
18,484 |
|
|
|
160 |
|
|
Total |
|
$ |
6,068 |
|
|
$ |
889,849 |
|
|
$ |
7,678 |
|
|
$ |
903,595 |
|
|
$ |
39,870 |
|
|
2012: |
|
|
|
|
|
|
|
|
|
|
|
|
|
|
|
|
|
|
|
|
|
Allowance for loan losses: |
|
|
|
|
|
|
|
|
|
|
|
|
|
|
|
|
|
|
|
|
|
Real estate loans: |
|
|
|
|
|
|
|
|
|
|
|
|
|
|
|
|
|
|
|
|
|
Residential properties |
|
$ |
— |
|
|
$ |
4,355 |
|
|
$ |
— |
|
|
$ |
4,355 |
|
|
$ |
62 |
|
|
Commercial properties |
|
|
— |
|
|
|
936 |
|
|
|
— |
|
|
|
936 |
|
|
|
617 |
|
|
Land |
|
|
— |
|
|
|
— |
|
|
|
— |
|
|
|
— |
|
|
|
129 |
|
|
Commercial and industrial loans |
|
|
1,536 |
|
|
|
1,305 |
|
|
|
— |
|
|
|
2,841 |
|
|
|
302 |
|
|
Consumer loans |
|
|
— |
|
|
|
208 |
|
|
|
— |
|
|
|
208 |
|
|
|
19 |
|
|
Total |
|
$ |
1,536 |
|
|
$ |
6,804 |
|
|
$ |
— |
|
|
$ |
8,340 |
|
|
$ |
1,129 |
|
|
Loans: |
|
|
|
|
|
|
|
|
|
|
|
|
|
|
|
|
|
|
|
|
|
Real estate loans: |
|
|
|
|
|
|
|
|
|
|
|
|
|
|
|
|
|
|
|
|
|
Residential properties |
|
$ |
2,257 |
|
|
$ |
519,288 |
|
|
$ |
1,731 |
|
|
$ |
523,276 |
|
|
$ |
5,121 |
|
|
Commercial properties |
|
|
— |
|
|
|
128,035 |
|
|
|
4,182 |
|
|
|
132,217 |
|
|
|
39,862 |
|
|
Land |
|
|
543 |
|
|
|
3,818 |
|
|
|
3,214 |
|
|
|
7,575 |
|
|
|
4,521 |
|
|
Commercial and industrial loans |
|
|
2,736 |
|
|
|
62,989 |
|
|
|
2,195 |
|
|
|
67,920 |
|
|
|
16,512 |
|
|
Consumer loans |
|
|
— |
|
|
|
12,514 |
|
|
|
71 |
|
|
|
12,585 |
|
|
|
324 |
|
|
Total |
|
$ |
5,536 |
|
|
$ |
726,644 |
|
|
$ |
11,393 |
|
|
$ |
743,573 |
|
|
$ |
66,340 |
|
|
2011: |
|
|
|
|
|
|
|
|
|
|
|
|
|
|
|
|
|
|
|
|
|
Allowance for loan losses: |
|
|
|
|
|
|
|
|
|
|
|
|
|
|
|
|
|
|
|
|
|
Real estate loans: |
|
|
|
|
|
|
|
|
|
|
|
|
|
|
|
|
|
|
|
|
|
Residential properties |
|
$ |
— |
|
|
$ |
3,984 |
|
|
$ |
— |
|
|
$ |
3,984 |
|
|
$ |
— |
|
|
Commercial properties |
|
|
— |
|
|
|
1,218 |
|
|
|
— |
|
|
|
1,218 |
|
|
|
— |
|
|
Commercial and industrial loans |
|
|
— |
|
|
|
1,104 |
|
|
|
— |
|
|
|
1,104 |
|
|
|
— |
|
|
Consumer loans |
|
|
— |
|
|
|
244 |
|
|
|
— |
|
|
|
244 |
|
|
|
— |
|
|
Total |
|
$ |
— |
|
|
$ |
6,550 |
|
|
$ |
— |
|
|
$ |
6,550 |
|
|
$ |
— |
|
|
Loans: |
|
|
|
|
|
|
|
|
|
|
|
|
|
|
|
|
|
|
|
|
|
Real estate loans: |
|
|
|
|
|
|
|
|
|
|
|
|
|
|
|
|
|
|
|
|
|
Residential properties |
|
$ |
2,358 |
|
|
$ |
402,921 |
|
|
$ |
— |
|
|
$ |
405,279 |
|
|
$ |
— |
|
|
Commercial properties |
|
|
— |
|
|
|
75,542 |
|
|
|
— |
|
|
|
75,542 |
|
|
|
— |
|
|
Commercial and industrial loans |
|
|
— |
|
|
|
35,377 |
|
|
|
— |
|
|
|
35,377 |
|
|
|
— |
|
|
Consumer loans |
|
|
— |
|
|
|
8,012 |
|
|
|
— |
|
|
|
8,012 |
|
|
|
— |
|
|
Total |
|
$ |
2,358 |
|
|
$ |
521,852 |
|
|
$ |
— |
|
|
$ |
524,210 |
|
|
$ |
— |
|
The column labeled “Unaccreted Credit Component Other Loans” represents the amount of unaccreted credit component discount for the other loans acquired in the DCB and PRB acquisitions, and the stated principal balance of the related loans. The discount is equal to 0.86% and 0.86% of the stated principal balance of these loans as of December 31, 2015 and 2014, respectively. In addition to this unaccreted credit component discount, an additional $0.3 million and $0.3 million of the ALLL were provided for these loans as of December 31, 2015 and 2014, respectively.
60
Liquidity management focuses on our ability to generate, on a timely and cost-effective basis, cash sufficient to meet the funding needs of current loan demand, deposit withdrawals, principal and interest payments with respect to outstanding borrowings and to pay operating expenses. Our liquidity management is both a daily and long-term function of funds management. Liquid assets are generally invested in marketable securities or held as cash at the FRB or other financial institutions.
We monitor our liquidity in accordance with guidelines established by our Board of Directors and applicable regulatory requirements. Our need for liquidity is affected by our loan activity, net changes in deposit levels and the maturities of our borrowings. The principal sources of our liquidity consist of deposits, loan interest and principal payments and prepayments, investment management and consulting fees, FHLB advances and proceeds from borrowings and sales of shares by FFI. The remaining balances of the Company’s lines of credit available to draw down totaled $98 million at December 31, 2015.
Cash Flows Provided by Operating Activities. During the year ended December 31, 2015 operating activities provided net cash of $13.9 million, comprised primarily of our net income of $13.4 million. In 2014, operating activities provided net cash of $9.4 million, comprised primarily of our net income of $8.4 million.
Cash Flows Used in Investing Activities. During the year ended December 31, 2015, investing activities used net cash of $916.5 million, primarily to fund a $626.2 million net increase in loans and a $426.9 million net increase in securities AFS, offset partially by $106.2 million in proceeds from loan sales and $38.1 million of cash in from the acquisition of PRB. In 2014, investing activities used net cash of $340.3 million, primarily to fund a $262.3 million net increase in loans and a $83.5 million net increase in securities AFS.
Cash Flow Provided by Financing Activities. During the year ended December 31, 2015, financing activities provided net cash of $1.1 billion, consisting primarily of a net increase of $439.4 million in deposits and a net increase of $533.0 million in borrowings, and $136.2 million proceeds from the sale of stock. In 2014, financing activities provided net cash of $303.7 million, consisting primarily of a net increase of $160.9 million in deposits and a net increase of $141.8 million in borrowings.
Ratio of Loans to Deposits. The relationship between gross loans and total deposits can provide a useful measure of a bank’s liquidity. Since repayment of loans tends to be less predictable than the maturity of investments and other liquid resources, the higher the loan-to-deposit ratio the less liquid are our assets. On the other hand, since we realize greater yields on loans than we do on other interest-earning assets, a lower loan-to-deposit ratio can adversely affect interest income and earnings. As a result, our goal is to achieve a loan-to-deposit ratio that appropriately balances the requirements of liquidity and the need to generate a fair return on our assets. At December 31, 2015 and December 31, 2014, the loan-to-deposit ratios at FFB were 116.0%, and 118.9%, respectively.
Contractual Obligations
The following table summarizes the indicated contractual obligations of the Company as of the December 31, 2015:
|
|
|
Payments Due by Period |
|
|||||||||||||||||
|
(dollars in thousands) |
|
Total |
|
|
Less Than 1 Year |
|
|
1 – 3 Years |
|
|
3 – 5 Years |
|
|
More Than 5 Years |
|
|||||
|
|
|
|
|
|
|
|
|
|
|
|
|
|
|
|
|
|
|
|
|
|
|
FHLB Advances |
|
$ |
796,000 |
|
|
$ |
796,000 |
|
|
$ |
— |
|
|
$ |
— |
|
|
$ |
— |
|
|
Operating lease obligations |
|
|
29,363 |
|
|
|
3,951 |
|
|
|
9,057 |
|
|
|
8,376 |
|
|
|
7,979 |
|
|
Total |
|
$ |
825,363 |
|
|
$ |
799,951 |
|
|
$ |
9,057 |
|
|
$ |
8,376 |
|
|
$ |
7,979 |
|
Off-Balance Sheet Arrangements
The following table provides the off-balance sheet arrangements of the Company as of December 31, 2015:
|
(dollars in thousands) |
|
|
|
|
|
Commitments to fund new loans |
|
$ |
51,887 |
|
|
Commitments to fund under existing loans, lines of credit |
|
|
153,606 |
|
|
Commitments under standby letters of credit |
|
|
8,617 |
|
Some of the commitments to fund existing loans, lines of credit and letters of credit are expected to expire without being drawn upon. Therefore, the total commitments do not necessarily represent future cash requirements. As of December 31, 2015, FFB was obligated on $101.5 million of letters of credit to the FHLB which were being used as collateral for public fund deposits, including $86.0 million of deposits from the State of California.
61
Asset and Liability Management: Interest Rate Risk
Interest rate risk is inherent in financial services businesses. Management of interest-earning assets and interest-bearing liabilities in terms of rate and maturity has an important effect on our liquidity and net interest margin. Interest rate risk results from interest-earning assets and interest-bearing liabilities maturing or repricing at different times, on a different basis or in unequal amounts. The Board of Directors of FFB approves policies and limits governing the management of interest rate risk. The asset / liability committee formed by these policies is responsible for monitoring our interest rate risk and providing periodic reports to the Board of Directors regarding our compliance with these policies and limits. We have established three primary measurement processes to quantify and manage our interest rate risk. These include: (i) gap analysis which measures the repricing mismatches of asset and liability cash flows; (ii) net interest income simulations which are used to measure the impact of instantaneous changes in interest rates on net interest income over a 12 month forecast period; and (iii) economic value of equity calculations which measure the sensitivity of our economic value of equity to simultaneous changes in interest rates.
Gap Analysis. Under this analysis, rate sensitivity is measured by the extent to which our interest-earning assets and interest-bearing liabilities reprice or mature at different times. Rate sensitivity gaps in which the repricing of interest-earning assets exceed the repricing of interest-bearing liabilities tend to produce an expanded net yield on interest-earning assets in rising interest rate environments and a reduced net yield on interest-earning assets in declining interest rate environments. Conversely, when the repricing of interest-bearing liabilities exceed the repricing of interest-earning assets, the net yield on interest-earning assets generally declines in rising interest rate environments and increases in declining interest rate environments. The following table sets forth the interest-earning assets and interest-bearing liabilities on the basis of when they reprice or mature as of December 31, 2015:
|
(dollars in thousands) |
|
Less than |
|
|
From 1 to |
|
|
From 3 to |
|
|
Over 5 |
|
|
Total |
|
|||||
|
Interest-earnings assets: |
|
|
|
|
|
|
|
|
|
|
|
|
|
|
|
|
|
|
|
|
|
Cash equivalents |
|
$ |
207,666 |
|
|
$ |
— |
|
|
$ |
— |
|
|
$ |
— |
|
|
$ |
207,666 |
|
|
Securities, FHLB stock |
|
|
116,750 |
|
|
|
152,079 |
|
|
|
112,582 |
|
|
|
208,122 |
|
|
|
589,533 |
|
|
Loans |
|
|
341,078 |
|
|
|
271,091 |
|
|
|
635,339 |
|
|
|
517,962 |
|
|
|
1,765,470 |
|
|
Interest-bearing liabilities: |
|
|
|
|
|
|
|
|
|
|
|
|
|
|
|
|
|
|
|
|
|
Deposits: |
|
|
|
|
|
|
|
|
|
|
|
|
|
|
|
|
|
|
|
|
|
Interest-bearing checking |
|
|
(260,167 |
) |
|
|
— |
|
|
|
— |
|
|
|
— |
|
|
|
(260,167 |
) |
|
Money market and savings |
|
|
(492,015 |
) |
|
|
— |
|
|
|
— |
|
|
|
— |
|
|
|
(492,015 |
) |
|
Certificates of deposit |
|
|
(430,179 |
) |
|
|
(39,322 |
) |
|
|
(630 |
) |
|
|
— |
|
|
|
(470,131 |
) |
|
Borrowings |
|
|
(796,000 |
) |
|
|
— |
|
|
|
— |
|
|
|
— |
|
|
|
(796,000 |
) |
|
Net: Current Period |
|
$ |
(1,312,867 |
) |
|
$ |
383,848 |
|
|
$ |
747,291 |
|
|
$ |
726,084 |
|
|
$ |
544,356 |
|
|
Net: Cumulative |
|
$ |
(1,312,867 |
) |
|
$ |
(929,019 |
) |
|
$ |
(181,728 |
) |
|
$ |
544,356 |
|
|
|
|
|
The cumulative positive total of $544 million reflects the funding provided by noninterest-bearing deposits and equity. Because we had a $1.3 billion net negative position at December 31, 2015 for the repricing period of less than one year, the result of this analysis indicate that we would be adversely impacted by a short term increase in interest rates and would benefit from a short term decrease in interest rates.
However, the extent to which our net interest margin will be impacted by changes in prevailing interest rates will depend on a number of factors, including how quickly interest-earning assets and interest-bearing liabilities react to interest rate changes. It is not uncommon for rates on certain assets or liabilities to lag behind changes in the market rates of interest. Additionally, prepayments of loans and early withdrawals of certificates of deposit could cause interest sensitivities to vary. As a result, the relationship or “gap” between interest-earning assets and interest-bearing liabilities, as shown in the above table, is only a general indicator of interest rate sensitivity and the effect of changing rates of interest on our net interest income is likely to be different from that predicted solely on the basis of the interest rate sensitivity analysis set forth in the above table.
62
Net Interest Income Simulations (“NII”). Under this analysis, we use a simulation model to measure and evaluate potential changes in our net interest income resulting from changes in interest rates. This model measures the impact of instantaneous shocks of 100, 200, 300 and 400 basis points on our net interest income over a 12 month forecast period. The computed changes to our net interest income between hypothetical rising and declining rate scenarios for the twelve month period beginning December 31, 2015 are as follows:
|
Assumed Instantaneous Change in Interest Rates |
|
Estimated Increase |
|
|
|
+ 100 basis points |
|
|
(10.8 |
)% |
|
+ 200 basis points |
|
|
(21.1 |
)% |
|
+ 300 basis points |
|
|
(31.8 |
)% |
|
+ 400 basis points |
|
|
(42.1 |
)% |
|
- 100 basis points |
|
|
1.9 |
% |
|
- 200 basis points |
|
|
1.5 |
% |
We did not include scenarios below the minus 200 basis point scenario because we believe those scenarios are not meaningful based on current interest rate levels. The NII results indicate that we would be adversely impacted by a short term increase in interest rates and would benefit from a short term decrease in interest rates. The results of the NII are hypothetical, and a variety of factors might cause actual results to differ substantially from what is depicted. These could include non-parallel yield curve shifts, changes in market interest rate spreads and the actual reaction to changes in interest rate levels of interest-earning assets and interest-bearing liabilities. It is not uncommon for rates on certain assets or liabilities to lag behind changes in the market rates of interest. Additionally, prepayments of loans and early withdrawals of certificates of deposit could cause interest sensitivities to vary.
Economic Value of Equity Calculations (“EVE”). The EVE measures the sensitivity of our market value equity to simultaneous changes in interest rates. EVE is derived by subtracting the economic value of FFB’s liabilities from the economic value of its assets, assuming current and hypothetical interest rate environments. EVE is based on all of the future cash flows expected to be generated by the FFB’s current balance sheet, discounted to derive the economic value of FFB’s assets & liabilities. These cash flows may change depending on the assumed interest rate environment and the resulting changes in other assumptions, such as prepayment speeds. The computed changes to our economic value of equity between hypothetical rising and declining rate scenarios as of December 31, 2015 are as follows:
|
Assumed Simultaneous Change in Interest Rates |
|
Estimated |
|
|
|
+ 100 basis points |
|
|
(2.62 |
)% |
|
+ 200 basis points |
|
|
(17.82 |
)% |
|
+ 300 basis points |
|
|
(24.62 |
)% |
|
+ 400 basis points |
|
|
(31.24 |
)% |
|
- 100 basis points |
|
|
(4.01 |
)% |
|
- 200 basis points |
|
|
(11.67 |
)% |
We did not include scenarios below the minus 200 basis point scenario because we believe those scenarios are not meaningful based on current interest rate levels. The EVE results indicate that we would be adversely impacted by a short term increase in interest rates and a short term decrease in interest rates. This differs from the NII results because, in the current interest rate environment, assumed interest rate floors for loans eliminates the benefit normally derived for loans in a declining interest rate environment. The results of the EVE are hypothetical, and a variety of factors might cause actual results to differ substantially from what is depicted. These could include non-parallel yield curve shifts, changes in market interest rate spreads and the actual reaction to changes in interest rate levels of interest-earning assets and interest-bearing liabilities. It is not uncommon for rates on certain assets or liabilities to lag behind changes in the market rates of interest. Additionally, prepayments of loans and early withdrawals of certificates of deposit could cause interest sensitivities to vary.
The results of these analyses and simulations do not contemplate all of the actions that we may undertake in response to changes in interest rates. In response to actual or anticipated changes in interest rates, we have various alternatives for managing and reducing FFB’s exposure to interest rate risk, such as entering into hedges and obtaining long-term fixed rate FHLB advances. To date, we have not entered into any hedges or other derivative instruments for this or any other purpose and it is our policy not to use derivatives or other financial instruments for trading or other speculative purposes.
63
Capital Resources and Dividends
Under federal banking regulations that apply to all United States based bank holding companies and federally insured banks, the Company (on a consolidated basis) and FFB (on a stand-alone basis) must meet specific capital adequacy requirements that, for the most part, involve quantitative measures, primarily in terms of the ratios of their capital to their assets, liabilities, and certain off-balance sheet items, calculated under regulatory accounting practices. Under those regulations, which are based primarily on those quantitative measures, each bank holding company must meet a minimum capital ratio and each federally insured bank is determined by its primary federal bank regulatory agency to come within one of the following capital adequacy categories on the basis of its capital ratios: (i) well capitalized; (ii) adequately capitalized; (iii) undercapitalized; (iv) significantly undercapitalized; or (v) critically undercapitalized.
Certain qualitative assessments also are made by a banking institution’s primary federal regulatory agency that could lead the agency to determine that the banking institution should be assigned to a lower capital category than the one indicated by the quantitative measures used to assess the institution’s capital adequacy. At each successive lower capital category, a banking institution is subject to greater operating restrictions and increased regulatory supervision by its federal bank regulatory agency.
The following table sets forth the capital and capital ratios of FFI (on a consolidated basis) and FFB as of the respective dates indicated below, as compared to the respective regulatory requirements applicable to them:
|
|
|
Actual |
|
|
For Capital |
|
|
To Be Well Capitalized |
|
|||||||||||||||
|
(dollars in thousands) |
|
Amount |
|
|
Ratio |
|
|
Amount |
|
|
Ratio |
|
|
Amount |
|
|
Ratio |
|
||||||
|
FFI |
|
|
|
|
|
|
|
|
|
|
|
|
|
|
|
|
|
|
|
|
|
|
|
|
|
December 31, 2015 |
|
|
|
|
|
|
|
|
|
|
|
|
|
|
|
|
|
|
|
|
|
|
|
|
|
CET1 capital ratio |
|
$ |
256,305 |
|
|
|
17.99 |
% |
|
$ |
64,099 |
|
|
|
4.50 |
% |
|
|
|
|
|
|
|
|
|
Tier 1 leverage ratio |
|
|
256,305 |
|
|
|
11.82 |
% |
|
|
86,747 |
|
|
|
4.00 |
% |
|
|
|
|
|
|
|
|
|
Tier 1 risk-based capital ratio |
|
|
256,305 |
|
|
|
17.99 |
% |
|
|
85,466 |
|
|
|
6.00 |
% |
|
|
|
|
|
|
|
|
|
Total risk-based capital ratio |
|
|
267,325 |
|
|
|
18.77 |
% |
|
|
113,954 |
|
|
|
8.00 |
% |
|
|
|
|
|
|
|
|
|
December 31, 2014 |
|
|
|
|
|
|
|
|
|
|
|
|
|
|
|
|
|
|
|
|
|
|
|
|
|
Tier 1 leverage ratio |
|
$ |
95,582 |
|
|
|
7.32 |
% |
|
$ |
52,200 |
|
|
|
4.00 |
% |
|
|
|
|
|
|
|
|
|
Tier 1 risk-based capital ratio |
|
|
95,582 |
|
|
|
11.02 |
% |
|
|
34,700 |
|
|
|
4.00 |
% |
|
|
|
|
|
|
|
|
|
Total risk-based capital ratio |
|
|
106,132 |
|
|
|
12.23 |
% |
|
|
69,399 |
|
|
|
8.00 |
% |
|
|
|
|
|
|
|
|
|
December 31, 2013 |
|
|
|
|
|
|
|
|
|
|
|
|
|
|
|
|
|
|
|
|
|
|
|
|
|
Tier 1 leverage ratio |
|
$ |
85,268 |
|
|
|
8.67 |
% |
|
$ |
39,321 |
|
|
|
4.00 |
% |
|
|
|
|
|
|
|
|
|
Tier 1 risk-based capital ratio |
|
|
85,268 |
|
|
|
13.04 |
% |
|
|
26,150 |
|
|
|
4.00 |
% |
|
|
|
|
|
|
|
|
|
Total risk-based capital ratio |
|
|
93,465 |
|
|
|
14.30 |
% |
|
|
52,300 |
|
|
|
8.00 |
% |
|
|
|
|
|
|
|
|
|
FFB |
|
|
|
|
|
|
|
|
|
|
|
|
|
|
|
|
|
|
|
|
|
|
|
|
|
December 31, 2015 |
|
|
|
|
|
|
|
|
|
|
|
|
|
|
|
|
|
|
|
|
|
|
|
|
|
CET1 capital ratio |
|
$ |
206,807 |
|
|
|
14.56 |
% |
|
$ |
63,907 |
|
|
|
4.50 |
% |
|
$ |
92,310 |
|
|
|
6.50 |
% |
|
Tier 1 leverage ratio |
|
|
206,807 |
|
|
|
9.56 |
% |
|
|
86,562 |
|
|
|
4.00 |
% |
|
|
108,202 |
|
|
|
5.00 |
% |
|
Tier 1 risk-based capital ratio |
|
|
206,807 |
|
|
|
14.56 |
% |
|
|
85,209 |
|
|
|
6.00 |
% |
|
|
113,612 |
|
|
|
8.00 |
% |
|
Total risk-based capital ratio |
|
|
217,827 |
|
|
|
15.34 |
% |
|
|
113,612 |
|
|
|
8.00 |
% |
|
|
142,015 |
|
|
|
10.00 |
% |
|
December 31, 2014 |
|
|
|
|
|
|
|
|
|
|
|
|
|
|
|
|
|
|
|
|
|
|
|
|
|
Tier 1 leverage ratio |
|
$ |
105,261 |
|
|
|
8.09 |
% |
|
$ |
52,036 |
|
|
|
4.00 |
% |
|
$ |
65,045 |
|
|
|
5.00 |
% |
|
Tier 1 risk-based capital ratio |
|
|
105,261 |
|
|
|
12.18 |
% |
|
|
34,572 |
|
|
|
4.00 |
% |
|
|
51,858 |
|
|
|
6.00 |
% |
|
Total risk-based capital ratio |
|
|
115,811 |
|
|
|
13,40 |
% |
|
|
69,144 |
|
|
|
8.00 |
% |
|
|
86,430 |
|
|
|
10.00 |
% |
|
December 31, 2013 |
|
|
|
|
|
|
|
|
|
|
|
|
|
|
|
|
|
|
|
|
|
|
|
|
|
Tier 1 leverage ratio |
|
$ |
84,243 |
|
|
|
8.61 |
% |
|
$ |
39,115 |
|
|
|
4.00 |
% |
|
$ |
48,894 |
|
|
|
5.00 |
% |
|
Tier 1 risk-based capital ratio |
|
|
84,243 |
|
|
|
12.95 |
% |
|
|
26,017 |
|
|
|
4.00 |
% |
|
|
39,025 |
|
|
|
6.00 |
% |
|
Total risk-based capital ratio |
|
|
92,399 |
|
|
|
14.21 |
% |
|
|
52,034 |
|
|
|
8.00 |
% |
|
|
65,042 |
|
|
|
10.00 |
% |
As of each of the dates set forth in the above table, the Company (on a consolidated basis) exceeded the minimum required capital ratios applicable to it and FFB (on a stand-alone basis) qualified as a well-capitalized depository institution under the capital adequacy guidelines described above.
As of December 31, 2015, the amount of capital at FFB in excess of amounts required to be Well Capitalized was 114.5 million for the CET1 capital ratio, $98.6 million for the Tier 1 Leverage Ratio, $93.2 million for the Tier 1 risk-based capital ratio and $75.8 million for the Total risk-based capital ratio.
64
During the years ended December 31, 2015 and 2014, FFI made capital contributions to FFB of $76.5 million and $10.5 million, respectively. As of December 31, 2015, FFI had $49.3 million of available capital and, therefore, has the ability and financial resources to contribute additional capital to FFB, if needed.
In July, 2013, the federal bank regulatory agencies approved the final rules implementing the Basel Committee on Banking Supervision's capital guidelines for U.S. banks. The new rules became effective on January 1, 2015, with certain of the requirements phased-in over a multi-year schedule, and fully phased in by January 1, 2019. The rules include a new common equity Tier 1 ("CET1") capital to risk-weighted assets ratio with minimums for capital adequacy and prompt corrective action purposes of 4.5% and 6.5%, respectively. The net unrealized gain or loss on available for sale securities is not included in computing regulatory capital. Capital amounts and ratios for December 31, 2014 are calculated using Basel I rules. For additional information regarding these New Capital Rules, see Item 1 “Business —Supervision and Regulation—First Foundation Bank —New Basel III Capital Rules” above in Item I of this report.
We did not pay dividends in 2015 or 2014 and we have no plans to pay dividends at least for the foreseeable future. Instead, it is our intention to retain internally generated cash flow to support our growth. Moreover, the payment of dividends is subject to certain regulatory restrictions, which are discussed in Item 1 “Business—Supervision and Regulation—Dividends.” included elsewhere in this Annual Report on Form 10-K.
We had no material commitments for capital expenditures as of December 31, 2015. However, we intend to take advantage of opportunities that may arise in the future to grow our businesses, including by opening additional wealth management offices or acquiring complementary businesses that we believe will provide us with attractive risk-adjusted returns, although we do not have any immediate plans, arrangements or understandings relating to any material acquisition. As a result, we may seek to obtain additional borrowings and to sell additional shares of our common stock to raise funds which we might need for these purposes. There is no assurance, however, that, if required, we will succeed in obtaining additional borrowings or selling additional shares of our common stock on terms that are acceptable to us, if at all, as this will depend on market conditions and other factors outside of our control, as well as our future results of operations. See Item 1A – “Risk Factors for information regarding the impact that future sales of our common stock may have on the share ownership of our existing stockholders.
Item 7A. Quantitative and Qualitative Disclosures About Market Risk
For quantitative and qualitative disclosures regarding market risk in the Company’s portfolio, please see Item 7 “Management’s Discussion and Analysis—Asset and Liability Management: Interest Rate Risk” in Part II above.
65
FIRST FOUNDATION INC
INDEX TO CONSOLIDATED FINANCIAL STATEMENTS
|
Report of Independent Registered Public Accounting Firm on the Consolidated Financial Statements |
|
67 |
|
Consolidated Balance Sheets: December 31, 2015 and December 31, 2014 |
|
68 |
|
|
69 |
|
|
|
70 |
|
|
|
71 |
|
|
|
72 |
|
|
|
73 |
66

REPORT OF INDEPENDENT REGISTERED PUBLIC ACCOUNTING FIRM
To the Board of Directors and Shareholders
First Foundation Inc. and Subsidiaries
Irvine, California
We have audited the accompanying consolidated balance sheets of First Foundation Inc. and Subsidiaries as of December 31, 2015 and 2014, and the related consolidated statements of income, comprehensive income, shareholders’ equity, and cash flows for each of the years in the three year period ended December 31, 2015. These consolidated financial statements are the responsibility of the Company’s management. Our responsibility is to express an opinion on these consolidated financial statements based on our audits.
We conducted our audits in accordance with the standards of the Public Company Accounting Oversight Board (United States). Those standards require that we plan and perform the audits to obtain reasonable assurance about whether the consolidated financial statements are free of material misstatement. An audit includes examining, on a test basis, evidence supporting the amounts and disclosures in the consolidated financial statements. An audit also includes assessing the accounting principles used and significant estimates made by management, as well as evaluating the overall consolidated financial statement presentation. We believe that our audits provide a reasonable basis for our opinion.
In our opinion, the consolidated financial statements referred to above present fairly, in all material respects, the financial position of First Foundation Inc. and Subsidiaries as of December 31, 2015 and 2014 and the results of their operations and their cash flows for each of the years in the three year period ended December 31, 2015, in conformity with U.S. generally accepted accounting principles.
We have also audited, in accordance with the standards of the Public Company Accounting Oversight Board (United States), First Foundation Inc. and Subsidiaries’ internal control over financial reporting as of December 31, 2015, based on criteria established in Internal Control – Integrated Framework (2013) issued by the Committee of Sponsoring Organizations of the Treadway Commission (COSO), and our report dated March 15, 2016, expressed an unqualified opinion on the effectiveness of the Company’s internal control over financial reporting.

Laguna Hills, California
March 15, 2016

67
(In thousands, except share and per share amounts)
|
|
|
December 31, |
|
|||||
|
|
|
2015 |
|
|
2014 |
|
||
|
ASSETS |
|
|
|
|
|
|
|
|
|
Cash and cash equivalents |
|
$ |
215,748 |
|
|
$ |
29,692 |
|
|
Securities available-for-sale (“AFS”) |
|
|
565,135 |
|
|
|
138,270 |
|
|
|
|
|
|
|
|
|
|
|
|
Loans, net of deferred fees |
|
|
1,765,483 |
|
|
|
1,166,392 |
|
|
Allowance for loan and lease losses (“ALLL”) |
|
|
(10,600 |
) |
|
|
(10,150 |
) |
|
Net loans |
|
|
1,754,883 |
|
|
|
1,156,242 |
|
|
|
|
|
|
|
|
|
|
|
|
Premises and equipment, net |
|
|
2,653 |
|
|
|
2,187 |
|
|
Investment in FHLB stock |
|
|
21,492 |
|
|
|
12,361 |
|
|
Deferred taxes |
|
|
15,392 |
|
|
|
9,748 |
|
|
Real estate owned (“REO”) |
|
|
4,036 |
|
|
|
334 |
|
|
Goodwill and intangibles |
|
|
2,416 |
|
|
|
197 |
|
|
Other assets |
|
|
10,824 |
|
|
|
6,393 |
|
|
Total Assets |
|
$ |
2,592,579 |
|
|
$ |
1,355,424 |
|
|
|
|
|
|
|
|
|
|
|
|
LIABILITIES AND SHAREHOLDERS’ EQUITY |
|
|
|
|
|
|
|
|
|
Liabilities: |
|
|
|
|
|
|
|
|
|
Deposits |
|
$ |
1,522,176 |
|
|
$ |
962,954 |
|
|
Borrowings |
|
|
796,000 |
|
|
|
282,886 |
|
|
Accounts payable and other liabilities |
|
|
14,667 |
|
|
|
10,088 |
|
|
Total Liabilities |
|
|
2,332,843 |
|
|
|
1,255,928 |
|
|
Commitments and contingencies |
|
|
— |
|
|
|
— |
|
|
Shareholders’ Equity |
|
|
|
|
|
|
|
|
|
Common Stock, par value $.001: 70,000,000 shares authorized; 15,980,526 and 7,845,182 shares issued and outstanding at December 31, 2015 and December 31, 2014, respectively |
|
|
16 |
|
|
|
8 |
|
|
Additional paid-in-capital |
|
|
227,262 |
|
|
|
78,204 |
|
|
Retained earnings |
|
|
33,762 |
|
|
|
20,384 |
|
|
Accumulated other comprehensive income (loss), net of tax |
|
|
(1,304 |
) |
|
|
900 |
|
|
Total Shareholders’ Equity |
|
|
259,736 |
|
|
|
99,496 |
|
|
Total Liabilities and Shareholders’ Equity |
|
$ |
2,592,579 |
|
|
$ |
1,355,424 |
|
(See accompanying notes to the consolidated financial statements)
68
CONSOLIDATED INCOME STATEMENTS
(In thousands, except share and per share amounts)
|
|
|
For the Year Ended December 31, |
|
|||||||||
|
|
|
2015 |
|
|
2014 |
|
|
2013 |
|
|||
|
Interest income: |
|
|
|
|
|
|
|
|
|
|
|
|
|
Loans |
|
$ |
57,481 |
|
|
$ |
44,140 |
|
|
$ |
37,918 |
|
|
Securities |
|
|
5,227 |
|
|
|
2,545 |
|
|
|
864 |
|
|
FHLB stock, fed funds sold and interest-bearing deposits |
|
|
1,763 |
|
|
|
713 |
|
|
|
399 |
|
|
Total interest income |
|
|
64,471 |
|
|
|
47,398 |
|
|
|
39,181 |
|
|
Interest expense: |
|
|
|
|
|
|
|
|
|
|
|
|
|
Deposits |
|
|
4,886 |
|
|
|
3,586 |
|
|
|
3,167 |
|
|
Borrowings |
|
|
1,395 |
|
|
|
998 |
|
|
|
340 |
|
|
Total interest expense |
|
|
6,281 |
|
|
|
4,584 |
|
|
|
3,507 |
|
|
Net interest income |
|
|
58,190 |
|
|
|
42,814 |
|
|
|
35,674 |
|
|
Provision for loan losses |
|
|
2,673 |
|
|
|
235 |
|
|
|
2,395 |
|
|
Net interest income after provision for loan losses |
|
|
55,517 |
|
|
|
42,579 |
|
|
|
33,279 |
|
|
Noninterest income: |
|
|
|
|
|
|
|
|
|
|
|
|
|
Asset management, consulting and other fees |
|
|
23,486 |
|
|
|
21,798 |
|
|
|
18,240 |
|
|
Gain on sale of loans |
|
|
2,935 |
|
|
|
— |
|
|
|
— |
|
|
Other income |
|
|
2,352 |
|
|
|
2,951 |
|
|
|
1,584 |
|
|
Total noninterest income |
|
|
28,773 |
|
|
|
24,749 |
|
|
|
19,824 |
|
|
Noninterest expense: |
|
|
|
|
|
|
|
|
|
|
|
|
|
Compensation and benefits |
|
|
40,456 |
|
|
|
33,550 |
|
|
|
28,760 |
|
|
Occupancy and depreciation |
|
|
9,260 |
|
|
|
7,325 |
|
|
|
6,556 |
|
|
Professional services and marketing costs |
|
|
5,490 |
|
|
|
5,995 |
|
|
|
4,003 |
|
|
Other expenses |
|
|
6,252 |
|
|
|
5,637 |
|
|
|
4,303 |
|
|
Total noninterest expense |
|
|
61,458 |
|
|
|
52,507 |
|
|
|
43,622 |
|
|
Income before taxes on income |
|
|
22,832 |
|
|
|
14,821 |
|
|
|
9,481 |
|
|
Taxes on income |
|
|
9,454 |
|
|
|
6,427 |
|
|
|
1,630 |
|
|
Net income |
|
$ |
13,378 |
|
|
$ |
8,394 |
|
|
$ |
7,851 |
|
|
Net income per share: |
|
|
|
|
|
|
|
|
|
|
|
|
|
Basic |
|
$ |
1.20 |
|
|
$ |
1.08 |
|
|
$ |
1.06 |
|
|
Diluted |
|
$ |
1.16 |
|
|
$ |
1.03 |
|
|
$ |
1.01 |
|
|
Shares used in computation: |
|
|
|
|
|
|
|
|
|
|
|
|
|
Basic |
|
|
11,155,007 |
|
|
|
7,737,036 |
|
|
|
7,424,210 |
|
|
Diluted |
|
|
11,575,855 |
|
|
|
8,166,343 |
|
|
|
7,742,215 |
|
(See accompanying notes to the consolidated financial statements)
69
CONSOLIDATED STATEMENTS OF COMPREHENSIVE INCOME
(In thousands)
|
|
|
For the Year Ended December 31, |
|
|||||||||
|
|
|
2015 |
|
|
2014 |
|
|
2013 |
|
|||
|
Net income |
|
$ |
13,378 |
|
|
$ |
8,394 |
|
|
$ |
7,851 |
|
|
Other comprehensive income (loss): |
|
|
|
|
|
|
|
|
|
|
|
|
|
Unrealized holding gains (losses) on securities arising during the period |
|
|
(3,746 |
) |
|
|
4,198 |
|
|
|
(2,668) |
|
|
Other comprehensive income (loss) before tax |
|
|
(3,746 |
) |
|
|
4,198 |
|
|
|
(2,668) |
|
|
Income tax (expense) benefit related to items of other comprehensive income |
|
|
1,542 |
|
|
|
(1,728) |
|
|
|
1,098 |
|
|
Other comprehensive income (loss) |
|
|
(2,204 |
) |
|
|
2,470 |
|
|
|
(1,570) |
|
|
Total comprehensive income |
|
$ |
11,174 |
|
|
$ |
10,864 |
|
|
$ |
6,281 |
|
(See accompanying notes to the consolidated financial statements)
70
CONSOLIDATED STATEMENTS OF CHANGES
IN SHAREHOLDERS’ EQUITY
(In thousands, except share amounts)
|
|
|
Common Stock |
|
|
Additional |
|
|
|
|
|
Accumulated |
|
|
Total |
|
|||||||||
|
|
|
Number |
|
|
Amount |
|
|
|
|
|
|
|
|
|
||||||||||
|
|
|
|
|
|
|
|
|
|
|
|
|
|
||||||||||||
|
Balance: December 31, 2012 |
|
|
7,366,126 |
|
|
$ |
7 |
|
|
$ |
69,434 |
|
|
$ |
4,139 |
|
|
$ |
— |
|
|
$ |
73,580 |
|
|
Net income |
|
|
— |
|
|
|
— |
|
|
|
— |
|
|
|
7,851 |
|
|
|
— |
|
|
|
7,851 |
|
|
Other comprehensive loss |
|
|
— |
|
|
|
— |
|
|
|
— |
|
|
|
— |
|
|
|
(1,570) |
|
|
|
(1,570) |
|
|
Issuance of restricted stock |
|
|
9,667 |
|
|
|
— |
|
|
|
— |
|
|
|
— |
|
|
|
— |
|
|
|
— |
|
|
Issuance of common stock |
|
|
357,721 |
|
|
|
1 |
|
|
|
6,321 |
|
|
|
— |
|
|
|
— |
|
|
|
6,322 |
|
|
Stock-based compensation |
|
|
— |
|
|
|
— |
|
|
|
579 |
|
|
|
— |
|
|
|
— |
|
|
|
579 |
|
|
Balance: December 31, 2013 |
|
|
7,733,514 |
|
|
|
8 |
|
|
|
76,334 |
|
|
|
11,990 |
|
|
|
(1,570) |
|
|
|
86,762 |
|
|
Net income |
|
|
— |
|
|
|
— |
|
|
|
— |
|
|
|
8,394 |
|
|
|
— |
|
|
|
8,394 |
|
|
Other comprehensive income |
|
|
— |
|
|
|
— |
|
|
|
— |
|
|
|
— |
|
|
|
2,470 |
|
|
|
2,470 |
|
|
Issuance of restricted stock |
|
|
3,222 |
|
|
|
— |
|
|
|
— |
|
|
|
— |
|
|
|
— |
|
|
|
— |
|
|
Issuance of common stock: |
|
|
|
|
|
|
|
|
|
|
|
|
|
|
|
|
|
|
|
|
|
|
|
|
|
Exercise of options |
|
|
84,866 |
|
|
|
— |
|
|
|
949 |
|
|
|
— |
|
|
|
— |
|
|
|
949 |
|
|
Payout of contingent consideration |
|
|
23,580 |
|
|
|
— |
|
|
|
354 |
|
|
|
— |
|
|
|
— |
|
|
|
354 |
|
|
Stock-based compensation |
|
|
— |
|
|
|
— |
|
|
|
451 |
|
|
|
— |
|
|
|
— |
|
|
|
451 |
|
|
Tax windfall from exercise of stock options |
|
|
— |
|
|
|
— |
|
|
|
116 |
|
|
|
— |
|
|
|
— |
|
|
|
116 |
|
|
Balance: December 31, 2014 |
|
|
7,845,182 |
|
|
|
8 |
|
|
|
78,204 |
|
|
|
20,384 |
|
|
|
900 |
|
|
|
99,496 |
|
|
Net income |
|
|
— |
|
|
|
— |
|
|
|
— |
|
|
|
13,378 |
|
|
|
— |
|
|
|
13,378 |
|
|
Other comprehensive loss |
|
|
— |
|
|
|
— |
|
|
|
— |
|
|
|
— |
|
|
|
(2,204 |
) |
|
|
(2,204 |
) |
|
Stock based compensation |
|
|
— |
|
|
|
— |
|
|
|
613 |
|
|
|
— |
|
|
|
— |
|
|
|
613 |
|
|
Issuance of common stock: |
|
|
|
|
|
|
|
|
|
|
|
|
|
|
|
|
|
|
|
|
|
|
|
|
|
Exercise of options |
|
|
31,307 |
|
|
|
— |
|
|
|
405 |
|
|
|
— |
|
|
|
— |
|
|
|
405 |
|
|
Stock grants – vesting of RSUs |
|
|
10,762 |
|
|
|
— |
|
|
|
— |
|
|
|
— |
|
|
|
— |
|
|
|
— |
|
|
Payout of contingent |
|
|
31,064 |
|
|
|
— |
|
|
|
452 |
|
|
|
— |
|
|
|
— |
|
|
|
452 |
|
|
Sale of stock |
|
|
272,035 |
|
|
|
— |
|
|
|
5,000 |
|
|
|
— |
|
|
|
— |
|
|
|
5,000 |
|
|
Stock issued in acquisition |
|
|
621,345 |
|
|
|
1 |
|
|
|
11,805 |
|
|
|
— |
|
|
|
— |
|
|
|
11,806 |
|
|
Public offering |
|
|
7,168,831 |
|
|
|
7 |
|
|
|
130,751 |
|
|
|
— |
|
|
|
— |
|
|
|
130,758 |
|
|
Tax windfall from exercise of stock options |
|
|
— |
|
|
|
— |
|
|
|
32 |
|
|
|
— |
|
|
|
— |
|
|
|
32 |
|
|
Balance: December 31, 2015 |
|
|
15,980,526 |
|
|
$ |
16 |
|
|
$ |
227,262 |
|
|
$ |
33,762 |
|
|
$ |
(1,304 |
) |
|
$ |
259,736 |
|
(See accompanying notes to the consolidated financial statements)
71
CONSOLIDATED STATEMENTS OF CASH FLOWS
(In thousands)
|
|
|
For the Year Ended December 31, |
|
|||||||||
|
|
|
2015 |
|
|
2014 |
|
|
2013 |
|
|||
|
Cash Flows from Operating Activities: |
|
|
|
|
|
|
|
|
|
|
|
|
|
Net income |
|
$ |
13,378 |
|
|
$ |
8,394 |
|
|
$ |
7,851 |
|
|
Adjustments to reconcile net income to net cash provided by operating activities: |
|
|
|
|
|
|
|
|
|
|
|
|
|
Provision for loan losses |
|
|
2,673 |
|
|
|
235 |
|
|
|
2,395 |
|
|
Depreciation and amortization |
|
|
1,350 |
|
|
|
1,231 |
|
|
|
1,040 |
|
|
Stock–based compensation expense |
|
|
613 |
|
|
|
451 |
|
|
|
579 |
|
|
Deferred tax expense (benefit) |
|
|
(1,866 |
) |
|
|
576 |
|
|
|
(1,267 |
) |
|
Amortization of discounts (premiums) on purchased loans - net |
|
|
(612 |
) |
|
|
(2,310 |
) |
|
|
(3,219 |
) |
|
Gain on sale of REO |
|
|
— |
|
|
|
(1,038 |
) |
|
|
— |
|
|
Gain on sale of loans |
|
|
(2,935 |
) |
|
|
— |
|
|
|
— |
|
|
Provision for REO losses |
|
|
— |
|
|
|
— |
|
|
|
250 |
|
|
Increase in other assets |
|
|
(3,473 |
) |
|
|
(1,244 |
) |
|
|
(366 |
) |
|
Increase in accounts payable and other liabilities |
|
|
4,741 |
|
|
|
3,060 |
|
|
|
703 |
|
|
Net cash provided by operating activities |
|
|
13,869 |
|
|
|
9,355 |
|
|
|
7,966 |
|
|
Cash Flows from Investing Activities: |
|
|
|
|
|
|
|
|
|
|
|
|
|
Net increase in loans |
|
|
(626,245 |
) |
|
|
(262,271 |
) |
|
|
(157,619 |
) |
|
Proceeds from sale of loans |
|
|
106,251 |
|
|
|
— |
|
|
|
— |
|
|
Purchases of AFS securities |
|
|
(446,652 |
) |
|
|
(83,527 |
) |
|
|
(62,664 |
) |
|
Maturities of AFS securities |
|
|
22,826 |
|
|
|
8,388 |
|
|
|
6,608 |
|
|
Proceeds from sale of REO |
|
|
— |
|
|
|
4,198 |
|
|
|
— |
|
|
Purchase of note on REO property |
|
|
— |
|
|
|
(1,285 |
) |
|
|
— |
|
|
Cash in from merger |
|
|
38,081 |
|
|
|
— |
|
|
|
— |
|
|
Sale (purchase) of FHLB stock, net |
|
|
(8,979 |
) |
|
|
(5,640 |
) |
|
|
1,779 |
|
|
Purchase of premises and equipment |
|
|
(1,753 |
) |
|
|
(169 |
) |
|
|
(1,905 |
) |
|
Net cash used in investing activities |
|
|
(916,471 |
) |
|
|
(340,306 |
) |
|
|
(213,801 |
) |
|
Cash Flows from Financing Activities: |
|
|
|
|
|
|
|
|
|
|
|
|
|
Increase in deposits |
|
|
439,381 |
|
|
|
160,917 |
|
|
|
152,296 |
|
|
Net increase in FHLB advances |
|
|
533,000 |
|
|
|
129,000 |
|
|
|
34,000 |
|
|
Term note - borrowings |
|
|
10,114 |
|
|
|
15,000 |
|
|
|
7,500 |
|
|
Term note - payments |
|
|
(30,000 |
) |
|
|
(2,177 |
) |
|
|
(437 |
) |
|
Proceeds from the sale of stock, net |
|
|
136,163 |
|
|
|
949 |
|
|
|
6,322 |
|
|
Net cash provided by financing activities |
|
|
1,088,658 |
|
|
|
303,689 |
|
|
|
199,681 |
|
|
Increase (decrease) in cash and cash equivalents |
|
|
186,056 |
|
|
|
(27,262 |
) |
|
|
(6,154 |
) |
|
Cash and cash equivalents at beginning of year |
|
|
29,692 |
|
|
|
56,954 |
|
|
|
63,108 |
|
|
Cash and cash equivalents at end of year |
|
$ |
215,748 |
|
|
$ |
29,692 |
|
|
$ |
56,954 |
|
|
Supplemental disclosures of cash flow information: |
|
|
|
|
|
|
|
|
|
|
|
|
|
Cash paid during the period for: |
|
|
|
|
|
|
|
|
|
|
|
|
|
Interest |
|
$ |
6,082 |
|
|
$ |
4,585 |
|
|
$ |
3,506 |
|
|
Income taxes |
|
$ |
10,050 |
|
|
$ |
5,394 |
|
|
$ |
3,490 |
|
|
Noncash transactions: |
|
|
|
|
|
|
|
|
|
|
|
|
|
Transfer of loans to loans held for sale |
|
$ |
102,026 |
|
|
$ |
— |
|
|
$ |
— |
|
|
Chargeoffs against allowance for loans losses |
|
$ |
2,223 |
|
|
$ |
— |
|
|
$ |
820 |
|
|
Transfer from loans to REO |
|
$ |
— |
|
|
$ |
1,834 |
|
|
$ |
— |
|
(See accompanying notes to the consolidated financial statements)
72
NOTES TO THE CONSOLIDATED FINANCIAL STATEMENTS
Years Ended December 31, 2015, 2014, and 2013
NOTE 1: SUMMARY OF SIGNIFICANT ACCOUNTING POLICIES
Business
First Foundation Inc. (“FFI”) is a financial services holding company whose operations are conducted through its wholly owned subsidiaries: First Foundation Advisors (“FFA”) and First Foundation Bank (“FFB” or the “Bank”), and First Foundation Insurance Services (“FFIS”), a wholly owned subsidiary of FFB (collectively the “Company”). FFI also has two inactive wholly owned subsidiaries, First Foundation Consulting (“FFC”) and First Foundation Advisors, LLC (“FFA LLC”). In addition, FFA has set up a limited liability company, which is not included in these consolidated financial statements, as a private investment fund to provide an investment vehicle for its clients. The corporate headquarters for all of the companies is located in Irvine, California. The Company has offices in California in Newport Beach, Irvine, Indian Wells, Pasadena, El Centro, West Los Angeles, El Segundo, Oakland, Sacramento, Burlingame, and San Diego and in Las Vegas, Nevada, and in Honolulu, Hawaii.
On October 28, 2015, FFI changed its state of incorporation from California to Delaware. Other than the change in corporate domicile, the reincorporation did not result in any change in the business, physical location, management, assets, liabilities or total shareholders’ equity of the Company, nor did it result in any change in location of the Company’s employees, including the Company’s management. Additionally, the reincorporation did not alter any shareholder’s percentage ownership interest or number of shares owned in the Company.
FFA, established in 1985 and incorporated in the State of California, began operating in 1990 as a fee based registered investment advisor. FFA provides (i) investment management and financial planning services for high net-worth individuals, retirement plans, charitable institutions and private foundations; (ii) provides financial, investment and economic advisory and related services to high net-worth individuals and their families, family-owned businesses, and other related organizations; and (iii) provides support services involving the processing and transmission of financial and economic data for charitable organizations. At the end of 2015, these services were provided to approximately 1,400 clients, primarily located in Southern California, with an aggregate of $3.5 billion of assets under management.
The Bank commenced operations in 2007 and currently operates in California, Nevada, and in Hawaii. The Bank offers a wide range of deposit instruments including personal and business checking and savings accounts, including interest-bearing negotiable order of withdrawal (“NOW”) accounts, money market accounts, and time certificates of deposit (“CD”) accounts. As a lender, the Bank originates, and retains for its portfolio, loans secured by real estate and commercial loans. Over 90% of the Bank’s loans are to clients located in California. The Bank also offers a wide range of specialized services including trust services, on-line banking, remote deposit capture, merchant credit card services, ATM cards, Visa debit cards, business sweep accounts, and through FFIS, insurance brokerage services. The Bank has a state non-member bank charter and it is subject to continued examination by the California Department of Business Oversight and Federal Deposit Insurance Corporation.
At December 31, 2015, the Company employed 295 employees.
Basis of Presentation
The consolidated financial statements have been prepared in conformity with U. S. generally accepted accounting standards and prevailing practices within the banking industry. In preparing the consolidated financial statements, management is required to make estimates and assumptions that affect the reported amounts of assets and liabilities as of the date of the balance sheet and revenues and expenses during the reporting periods and related disclosures. Actual results could differ significantly from those estimates.
The consolidated financial statements include the accounts of the Company and its wholly owned subsidiaries. All inter-company balances and transactions have been eliminated in consolidation.
Variable Interest Entities
The Company may have variable interests in Variable Interest Entities (“VIEs”) arising from debt, equity or other monetary interests in an entity, which change with fluctuations in the fair value of the entity's assets. VIEs are entities that, by design, either (1) lack sufficient equity to permit the entity to finance its activities without additional subordinated financial support from other parties, or (2) have equity investors that do not have the ability to make significant decisions relating to the entity's operations through voting
73
FIRST FOUNDATION INC.
NOTES TO THE CONSOLIDATED FINANCIAL STATEMENTS (continued)
Years Ended December 31, 2015, 2014, and 2013
rights, or do not have the obligation to absorb the expected losses, or do not have the right to receive the residual returns of the entity. The primary beneficiary of a VIE (i.e., the party that has a controlling financial interest) is required to consolidate the assets and liabilities of the VIE. The primary beneficiary is the party that has both (1) the power to direct the activities of an entity that most significantly impact the VIE's economic performance; and (2) through its interests in the VIE, the obligation to absorb losses or the right to receive benefits from the VIE that could potentially be significant to the VIE.
The Company's has sold loans through a securitization sponsored by a government sponsored entity, Freddie Mac, who also provided credit enhancement of the loans through certain guarantee provisions. The Company retained the right to provide servicing for the loans except for special servicing for which a unrelated third party was engaged by the VIE. In addition the Company acquired the “B” piece of the securitization, which is structured to absorb any losses from the securitization, and two interest only strips from the securitization. Because the Company does not act as the special servicer for the VIE and because of the power of Freddie Mac over the VIE that holds the assets from the mortgage loan securitizations, the Company is not the primary beneficiary of the VIE and therefore the VIE is not consolidated.
Reclassifications
Certain amounts in the 2014 consolidated financial statements have been reclassified to conform to the 2015 presentation.
Cash and Cash Equivalents
For purposes of reporting cash flows, cash and cash equivalents include cash, due from banks, certificates of deposits with maturities of less than ninety days, investment securities with original maturities of less than ninety days, money market mutual funds and Federal funds sold. At times, the Bank maintains cash at major financial institutions in excess of Federal Deposit Insurance Corporation (“FDIC”) insured limits. However, as the Bank places these deposits with major well-capitalized financial institutions and monitors the financial condition of these institutions, management believes the risk of loss to be minimal. The Bank maintains most of its excess cash at the Federal Reserve Bank, with well-capitalized correspondent banks or with other depository institutions at amounts less than the FDIC insured limits. At December 31, 2015, included in cash and cash equivalents were $200.9 million in funds held at the Federal Reserve Bank.
Banking regulations require that banks maintain a percentage of their deposits as reserves in cash or on deposit with the Federal Reserve Bank. The Bank was in compliance with its reserve requirements as of December 31, 2015.
Certificates of Deposit
From time to time, the Company may invest funds with other financial institutions through certificates of deposit. Certificates of deposit with maturities of less than ninety days are included as cash and cash equivalents. Certificates of deposit are carried at cost.
Investment Securities
Investment securities for which the Company has the positive intent and ability to hold to maturity are reported at cost, adjusted for premiums and discounts that are recognized in interest income using the interest method over the period to maturity. Investments not classified as trading securities nor as held-to-maturity securities are classified as available-for-sale securities and recorded at fair value. Unrealized gains or losses on available-for-sale securities are excluded from net income and reported as an amount net of taxes as a separate component of other comprehensive income included in shareholders’ equity. Premiums or discounts on held-to-maturity and available-for-sale securities are amortized or accreted into income using the interest method.
Realized gains or losses on sales of held-to-maturity or available-for-sale securities are recorded using the specific identification method. Declines in the fair value of individual held-to-maturity and available-for-sale securities below their cost that are considered other-than-temporary impairment (“OTTI”) result in write-downs of the individual securities to their fair value. The credit component of any OTTI related write-downs is charged against earnings.
Management evaluates securities for OTTI at least on a quarterly basis, and more frequently when economic or market conditions warrant such an evaluation. For securities in an unrealized loss position, management considers the extent and duration of the unrealized loss, and the financial condition and near-term prospects of the issuer. Management also assesses whether it intends to sell, or it is more likely than not that it will be required to sell, a security in an unrealized loss position before recovery of its amortized
74
FIRST FOUNDATION INC.
NOTES TO THE CONSOLIDATED FINANCIAL STATEMENTS (continued)
Years Ended December 31, 2015, 2014, and 2013
cost basis. If either of the criteria regarding intent or requirement to sell is met, the entire difference between amortized cost and fair value is recognized as impairment through earnings. For debt securities that do not meet the aforementioned criteria, the amount of impairment is split into two components as follows; OTTI related to credit loss, which must be recognized in the income statement and; OTTI related to other factors, which is recognized in other comprehensive income. The credit loss is defined as the difference between the present value of the cash flows expected to be collected and the amortized cost basis. For equity securities, the entire amount of impairment is recognized through earnings.
In order to determine OTTI for purchased beneficial interests that, on the purchase date, were not highly rated, the Company compares the present value of the remaining cash flows as estimated at the preceding evaluation date to the current expected remaining cash flows. OTTI is deemed to have occurred if there has been an adverse change in the remaining expected future cash flows.
Loan Origination Fees and Costs
Net loan origination fees and direct costs associated with lending are deferred and amortized to interest income as an adjustment to yield over the respective lives of the loans using the interest method. The amortization of deferred fees and costs is discontinued on loans that are placed on nonaccrual status. When a loan is paid off, any unamortized net loan origination fees are recognized in interest income.
Loans Held for Investment
Loans held for investment are reported at the principal amount outstanding, net of cumulative chargeoffs, interest applied to principal (for loans accounted for using the cost recovery method), unamortized net deferred loan origination fees and costs and unamortized premiums or discounts on purchased loans. Interest on loans is accrued and recognized as interest income at the contractual rate of interest. When a loan is designated as held for investment, the intent is to hold these loans for the foreseeable future or until maturity or payoff. If subsequent changes occur, the Company may change its intent to hold these loans. Once a determination has been made to sell such loans, they are immediately transferred to loans held for sale and carried at the lower of cost or fair value.
Loans Held for Sale
Loans designated for sale through securitization or in the secondary market are classified as loans held for sale. Loans held for sale are accounted for at the lower of amortized cost or fair value. The fair value of loans held for sale is generally based on observable market prices from other loans in the secondary market that have similar collateral, credit, and interest rate characteristics. If quoted market prices are not readily available, the Company may consider other observable market data such as dealer quotes for similar loans or forward sale commitments. In certain cases, the fair value may be based on a discounted cash flow model. Related gains and losses are recognized in net gain on mortgage loan origination and sale activities. Direct loan origination costs and fees for loans classified as held for sale are deferred at origination and recognized in earnings at the time of sale.
Nonaccrual Loans
Loans are placed on nonaccrual status when the full and timely collection of principal and interest is doubtful, generally when the loan becomes 90 days or more past due for principal or interest payment All payments received on nonaccrual loans are accounted for using the cost recovery method. Under the cost recovery method, all cash collected is applied to first reduce the principal balance. A loan may be returned to accrual status if all delinquent principal and interest payments are brought current and the collectability of the remaining principal and interest payments in accordance with the loan agreement is reasonably assured. Loans that are well secured and in the collection process may be maintained on accrual status, even if they are 90 days or more past due.
Purchased Credit Impaired Loans
The Company may purchase individual loans and groups of loans which have shown evidence of credit deterioration and are considered credit impaired. Purchased credit impaired loans are recorded at the amount paid and there is no carryover of the seller’s allowance for loan losses.
75
FIRST FOUNDATION INC.
NOTES TO THE CONSOLIDATED FINANCIAL STATEMENTS (continued)
Years Ended December 31, 2015, 2014, and 2013
Purchased credit impaired loans are accounted for individually or aggregated into pools of loans based on common risk characteristics such as, credit score, loan type, and date of origination. The Company estimates the amount and timing of expected cash flows for each loan or pool, and the expected cash flows in excess of amount paid is recorded as interest income over the remaining life of the loan or pool (accretable yield). The excess of the loan’s or pool’s contractual principal and interest over expected cash flows is not recorded (nonaccretable difference). Over the life of the loan or pool, expected cash flows continue to be estimated. If the present value of expected cash flows is less than the carrying amount, a loss is recorded by an increase in the allowance for loan losses. If the present value of expected cash flows is greater than the carrying amount, it is recognized as part of future interest income.
Allowance for Loan Losses
The allowance for loan losses is a valuation allowance for probable incurred credit losses. Provisions for loan losses are charged to operations based on management’s evaluation of the estimated losses in its loan portfolio. The major factors considered in evaluating losses are historical charge-off experience, delinquency rates, local and national economic conditions, the borrower’s ability to repay the loan and timing of repayments, and the value of any related collateral. Management’s estimate of fair value of the collateral considers current and anticipated future real estate market conditions, thereby causing these estimates to be particularly susceptible to changes that could result in a material adjustment to results of operations in the future. Recovery of the carrying value of such loans and related real estate is dependent, to a great extent, on economic, operating and other conditions that may be beyond the Bank’s control.
The Bank’s primary regulatory agencies periodically review the allowance for loan losses and such agencies may require the Bank to recognize additions to the allowance based on information and factors available to them at the time of their examinations. Accordingly, no assurance can be given that the Bank will not recognize additional provisions for loan losses with respect to its loan portfolio.
The allowance consists of specific and general reserves. Specific reserves relate to loans that are individually classified as impaired. Loan losses are charged against the allowance when management believes a loan balance is uncollectible. Subsequent recoveries, if any, are credited to the allowance. Allocations of the allowance may be made for specific loans, but the entire allowance is available for any loan that, in management’s judgment, should be charged off.
The Bank considers a loan to be impaired when, based upon current information and events, it believes it is probable that the Bank will be unable to collect all amounts due according to the contractual terms of the loan agreement. The Bank bases the measurement of loan impairment using either the present value of the expected future cash flows discounted at the loan’s effective interest rate, or the fair value of the loan’s collateral properties. Impairment losses are included in the allowance for loan losses through a charge to provision for loan losses. Adjustments to impairment losses due to changes in the fair value of impaired loans’ collateral properties are included in the provision for loan losses. The Bank’s impaired loans include nonaccrual loans (excluding those collectively reviewed for impairment), certain restructured loans and certain performing loans less than ninety days delinquent (“other impaired loans”) that the Bank believes will likely not be collected in accordance with contractual terms of the loans. Loans, for which the terms have been modified resulting in a concession, and for which the borrower is experiencing financial difficulties, are generally considered troubled debt restructurings and classified as impaired.
Commercial loans and loans secured by multifamily and commercial real estate are individually evaluated for impairment. If a loan is impaired, a portion of the allowance is allocated so that the loan is reported, net, at the present value of estimated future cash flows using the loan’s existing rate or at the fair value of collateral if repayment is expected solely from the collateral. Large groups of smaller balance homogeneous loans, such as consumer and residential real estate loans, are collectively evaluated for impairment, and accordingly, they are not separately identified for impairment disclosures.
Troubled debt restructurings are separately identified for impairment disclosures and are measured at the present value of estimated future cash flows using the loan’s effective rate at inception. If a troubled debt restructuring is considered to be a collateral dependent loan, the loan is reported, net, at the fair value of the collateral. For troubled debt restructurings that subsequently default, the Bank determines the amount of reserve in accordance with the accounting policy for the allowance for loan losses.
General reserves cover non-impaired loans and are based on historical loss rates for each portfolio segment, adjusted for the effects of qualitative or environmental factors that are likely to cause estimated credit losses as of the evaluation date to differ from the portfolio segment’s historical loss experience. Because the Bank is relatively new and has not experienced any meaningful amount of losses in any of its current portfolio segments, the Bank calculates the historical loss rates on industry data, specifically loss rates published by the FDIC. Qualitative factors include consideration of the following: changes in lending policies and procedures;
76
FIRST FOUNDATION INC.
NOTES TO THE CONSOLIDATED FINANCIAL STATEMENTS (continued)
Years Ended December 31, 2015, 2014, and 2013
changes in economic conditions, changes in the nature and volume of the portfolio; changes in the experience, ability and depth of lending management and other relevant staff; changes in the volume and severity of past due, nonaccrual and other adversely graded loans; changes in the loan review system; changes in the value of the underlying collateral for collateral-dependent loans; concentrations of credit and the effect of other external factors such as competition and legal and regulatory requirements.
Portfolio segments identified by the Bank include loans secured by residential real estate, including multifamily and single family properties, loans secured by commercial real estate, commercial and industrial loans and consumer loans. Relevant risk characteristics for these portfolio segments generally include debt service coverage, loan-to-value ratios and financial performance on non-consumer loans and debt-to income, collateral type and loan-to-value ratios for consumer loans.
Financial Instruments
In the ordinary course of business, the Bank has entered into off-balance sheet financial instruments consisting of commitments to extend credit, commercial letters of credit, and standby letters of credit. Such financial instruments are recorded in the financial statements when they are funded or related fees are incurred or received.
Transfers of Financial Assets
Transfers of financial assets are accounted for as sales, when control over the assets has been relinquished. Control over transferred assets is deemed to be surrendered when the assets have been isolated from the Company, the transferee obtains the right (free of conditions that constrain it from taking advantage of that right) to pledge or exchange the transferred assets, and the Company does not maintain effective control over the transferred assets through an agreement to repurchase them before their maturity.
Real Estate Owned
REO represents the collateral acquired through foreclosure in full or partial satisfaction of the related loan. REO is recorded at the fair value less estimated selling costs at the date of foreclosure. Any write-down at the date of transfer is charged to the allowance for loan losses. The recognition of gains or losses on sales of REO is dependent upon various factors relating to the nature of the property being sold and the terms of sale. REO values are reviewed on an ongoing basis and any decline in value is recognized as foreclosed asset expense in the current period. The net operating results from these assets are included in the current period in noninterest expense as foreclosed asset expense (income).
Premises and Equipment
Premises and equipment are stated at cost, less accumulated depreciation and amortization, which is charged to expense on a straight-line basis over the estimated useful lives of 3 to 10 years. Premises under leasehold improvements are amortized on a straight-line basis over the term of the lease or the estimated useful life of the improvements, whichever is shorter. Expenditures for major renewals and betterments of premises and equipment are capitalized and those for maintenance and repairs are charged to expense as incurred. A valuation allowance is established for any impaired long-lived assets. The Company did not have impaired long-lived assets as of December 31, 2015 or 2014.
Federal Home Loan Bank Stock
As a member of the Federal Home Loan Bank (“FHLB”), the Bank is required to purchase FHLB stock in accordance with its advances, securities and deposit agreement. This stock, which is carried at cost, may be redeemed at par value. However, there are substantial restrictions regarding redemption and the Bank can only receive a full redemption in connection with the Bank surrendering its FHLB membership. At December 31, 2015, the Bank held $21.5 million of FHLB stock. The Company does not believe that this stock is currently impaired and no adjustments to its carrying value have been recorded.
Mortgage Servicing Rights
When mortgage loans are sold with servicing retained, servicing rights are initially recorded at fair value with the income statement effect recorded in gains on sales of loans. Fair value is based on a valuation model that calculates the present value of estimated future net servicing income. All classes of servicing assets are subsequently measured using the amortization method which
77
FIRST FOUNDATION INC.
NOTES TO THE CONSOLIDATED FINANCIAL STATEMENTS (continued)
Years Ended December 31, 2015, 2014, and 2013
requires servicing rights to be amortized into noninterest income in proportion to, and over the period of, the estimated future net servicing income of the underlying loans.
Servicing rights are evaluated for impairment based upon the fair value of the rights as compared to carrying amount. Impairment is recognized through a valuation allowance for an individual grouping, to the extent that fair value is less than the carrying amount. If the Company later determines that all or a portion of the impairment no longer exists for a particular grouping, a reduction of the allowance may be recorded as an increase to income.
Servicing fee income, which is reported on the income statement as other income, is recorded for fees earned for servicing loans. The fees are based on a contractual percentage of the outstanding principal. The amortization of mortgage servicing rights is netted against loan servicing fee income.
Goodwill
Goodwill is recorded upon completion of a business combination as the difference between the purchase price and the fair value of net identifiable assets acquired. Subsequent to initial recognition, the Company will test goodwill for impairment on an annual basis. The goodwill recorded by the Company was recognized from the acquisition of Pacific Rim Bank in June of 2015, and was not considered impaired at December 31, 2015.
Other Intangible Assets
Intangible assets with definite useful lives are amortized over their estimated useful lives to their estimated residual values. Other intangible assets consist of core deposit intangible assets arising from whole bank acquisitions and are amortized on an accelerated method over their estimated useful lives, which range from 7 to 10 years. At December 31, 2015 and 2014, core deposit intangible assets totaled $1.1 million and $0.2 million, respectively, and we recognized $0.2 million, $0.1 million and $0.1 million in core deposit intangible amortization expense in 2015, 2014 and 2013, respectively.
Revenue Recognition
Interest on Loans: Loans on which the accrual of interest has been discontinued are designated as nonaccrual loans. Accrual of interest on loans is discontinued when reasonable doubt exists as to the full, timely collection of interest or principal and, generally, when a loan becomes contractually past due for ninety days or more with respect to principal or interest. The accrual of interest may be continued on a well-secured loan contractually past due ninety days or more with respect to principal or interest if the loan is in the process of collection or collection of the principal and interest is deemed probable.
When a loan is placed on nonaccrual status, all interest previously accrued but not collected is reversed against current period income. Interest on such loans is then recognized only to the extent that cash is received and where the future collection of principal is probable. Accrual of interest is resumed on loans only when, in the judgment of management, the loan is estimated to be fully collectible. The Bank continues to accrue interest on restructured loans since full payment of principal and interest is expected and such loans are performing or less than ninety days delinquent and, therefore, do not meet the criteria for nonaccrual status. Restructured loans that have been placed on nonaccrual status are returned to accrual status when the remaining loan balance, net of any charge-offs related to the restructure, is estimated to be fully collectible by management and performing in accordance with the applicable loan terms.
Other Fees: Asset management fees are billed on a monthly or quarterly basis based on the amount of assets under management and the applicable contractual fee percentage. Asset management fees are recognized as revenue in the period in which they are billed and earned. Financial planning fees are due and billed at the completion of the planning project and are recognized as revenue at that time.
Stock-Based Compensation
The Company recognizes the cost of employee services received in exchange for awards of stock options, or other equity instruments, based on the grant-date fair value of those awards. This cost is recognized over the period, which an employee is required to provide services in exchange for the award, generally the vesting period. A Black-Scholes model is utilized to estimate the fair value of stock options, while the market price of the Company’s common stock at the date of grant is used for stock awards.
78
FIRST FOUNDATION INC.
NOTES TO THE CONSOLIDATED FINANCIAL STATEMENTS (continued)
Years Ended December 31, 2015, 2014, and 2013
The Company expenses marketing costs, including advertising, in the period incurred.
Income Taxes
The Company accounts for income taxes using the asset and liability method. Under the asset and liability method, deferred tax assets and liabilities are recognized for the future tax consequences attributable to differences between the financial statement carrying amounts of existing assets and liabilities and their respective tax bases. A valuation allowance is established if it is “more likely than not” that all or a portion of the deferred tax asset will not be realized.
The tax effects from an uncertain tax position can be recognized in the financial statements only if, based on its merits, the position is more likely than not to be sustained on audit by the taxing authorities. Interest and penalties related to uncertain tax positions are recorded as part of income tax expense.
Comprehensive Income
Comprehensive income consists of net income and other comprehensive income. Changes in unrealized gains and losses on available-for-sale securities and the related tax costs or benefits are the only components of other comprehensive income for the Company.
Earnings Per Share (“EPS”)
Basic earnings per share represents income available to common shareholders divided by the weighted-average number of common shares outstanding during the period. Diluted earnings per share reflect additional common shares that would have been outstanding if dilutive potential common shares had been issued, as well as any adjustment to income that would result from the assumed issuance. Potential common shares that may be issued by the Company relate to outstanding stock options and restricted stock, which are determined using the treasury stock method, and stock to be issued as contingent consideration related to an acquisition that occurred in 2012.
Fair Value Measurement
Fair values of financial instruments are estimated using relevant market information and other assumptions, as more fully disclosed in a separate note. Fair value estimates involve uncertainties and matters of significant judgment regarding interest rates, credit risk, prepayments, and other factors, especially in the absence of broad markets for particular items. Changes in assumptions or in market conditions could significantly affect these estimates.
New Accounting Pronouncements
On February 25, 2016, the Financial Accounting Standards Board (“FASB”) issued Accounting Standards Update (“ASU”) 2016-02, Leases (Topic 842). The most significant change for lessees is the requirement under the new guidance to recognize right-of-use assets and lease liabilities for all leases not considered short-term leases, which is generally defined as a lease term of less than 12 months. This change will result in lessees recognizing right-of-use assets and lease liabilities for most leases currently accounted for as operating leases under current lease accounting guidance. The amendments in this Update are effective for interim and annual periods beginning after December 15, 2018. The Company is currently evaluating the effects of ASU 2016-02 on its financial statements and disclosures.
On January 5, 2016, the FASB issued ASU 2016-01, Financial Instruments–Overall: Recognition and Measurement of Financial Assets and Financial Liabilities (Subtopic 825-10). Changes made to the current measurement model primarily affect the accounting for equity securities with readily determinable fair values, where changes in fair value will impact earnings instead of other comprehensive income. The accounting for other financial instruments, such as loans, investments in debt securities, and financial liabilities is largely unchanged. The Update also changes the presentation and disclosure requirements for financial instruments including a requirement that public business entities use exit price when measuring the fair value of financial instruments measured at amortized cost for disclosure purposes. This Update is generally effective for public business entities in fiscal years beginning after
79
FIRST FOUNDATION INC.
NOTES TO THE CONSOLIDATED FINANCIAL STATEMENTS (continued)
Years Ended December 31, 2015, 2014, and 2013
December 15, 2017, including interim periods within those fiscal years. The Company is currently evaluating the effects of ASU 2016-01 on its financial statements and disclosures.
In September, 2015, the FASB issued ASU 2015-16, Business Combinations (Topic 805): Simplifying the Accounting for Measurement-Period Adjustments. The amendments in this update require that an acquirer recognize adjustments to provisional amounts that are identified during the measurement period in the reporting period in which the adjustment amounts are determined. For public companies, this update will be effective for interim and annual periods beginning after December 15, 2015, including interim periods within those fiscal periods. The adoption of ASU No. 2015-16 is not expected to have a material impact on the Company’s Consolidated Financial Statements.
In May 2014, the FASB issued ASU 2015-09, Revenue from Contracts with Customers (Topic 660): Summary and Amendments that Create Revenue from Contracts with Customers (Topic 606) and Other Assets and Deferred Costs-Contracts with Customers (Subtopic 340-40). The guidance in this update supersedes the revenue recognition requirements in ASC Topic 605, Revenue Recognition, and most industry-specific guidance throughout the industry topics of the codification. For public companies, this update will be effective for interim and annual periods beginning after December 15, 2016. The Company is currently assessing the impact that this guidance will have on its consolidated financial statements, but does not expect the guidance to have a material impact on the Company’s consolidated financial statements.
NOTE 2: ACQUISITIONS
On June 16, 2015, the Company completed the acquisition of Pacific Rim Bank (‘PRB”), through a merger of PRB with and into the Bank, in exchange for 621,345 shares of its common stock with a fair value of $19.00 per share and $543,000 in cash, which was paid to dissenting shareholders. The primary reason for acquiring PRB was to expand our operations into Hawaii.
The acquisition of PRB was accounted for under the purchase method of accounting. The acquired assets, assumed liabilities and identifiable intangible assets are recorded at their respective acquisition date fair values. Goodwill of $1.3 million, which is not tax deductible, is included in intangible assets in the table below.
80
FIRST FOUNDATION INC.
NOTES TO THE CONSOLIDATED FINANCIAL STATEMENTS (continued)
Years Ended December 31, 2015, 2014, and 2013
The following table represents the assets acquired and liabilities assumed of PRB as of June 15, 2015 and the fair value adjustments and amounts recorded by the Bank in 2015 under the acquisition method of accounting:
|
|
PRB Book Value |
|
Fair Value Adjustments |
|
Fair Value |
||||||
|
(dollars in thousands) |
|
|
|
|
|
|
|
|
|
|
|
|
Assets Acquired: |
|
|
|
|
|
|
|
|
|
|
|
|
Cash and cash equivalents |
$ |
38,624 |
|
|
$ |
— |
|
|
$ |
38,624 |
|
|
Securities AFS |
|
7,179 |
|
|
|
115 |
|
|
|
7,294 |
|
|
Loans, net of deferred fees |
|
80,192 |
|
|
|
(2,419 |
) |
|
|
77,773 |
|
|
Allowance for loan losses |
|
(2,034 |
) |
|
|
2,034 |
|
|
|
— |
|
|
Premises and equipment, net |
|
251 |
|
|
|
(188 |
) |
|
|
63 |
|
|
Investment in FHLB stock |
|
152 |
|
|
|
— |
|
|
|
152 |
|
|
Deferred taxes |
|
— |
|
|
|
2,258 |
|
|
|
2,258 |
|
|
REO |
|
4,374 |
|
|
|
(672 |
) |
|
|
3,702 |
|
|
Goodwill |
|
— |
|
|
|
1,300 |
|
|
|
1,300 |
|
|
Core deposit intangible |
|
— |
|
|
|
1,099 |
|
|
|
1,099 |
|
|
Other assets |
|
269 |
|
|
|
— |
|
|
|
269 |
|
|
Total assets acquired |
$ |
129,007 |
|
|
$ |
3,527 |
|
|
$ |
132,534 |
|
|
|
|
|
|
|
|
|
|
|
|
|
|
|
Liabilities Assumed: |
|
|
|
|
|
|
|
|
|
|
|
|
Deposits |
$ |
119,663 |
|
|
$ |
178 |
|
|
$ |
119,841 |
|
|
Accounts payable and other liabilities |
|
442 |
|
|
|
(98 |
) |
|
|
344 |
|
|
Total liabilities assumed |
|
120,105 |
|
|
|
80 |
|
|
|
120,185 |
|
|
Excess of assets acquired over liabilities assumed |
|
8,902 |
|
|
|
3,447 |
|
|
|
12,349 |
|
|
Total |
$ |
129,007 |
|
|
$ |
3,527 |
|
|
$ |
132,534 |
|
|
|
|
|
|
|
|
|
|
|
|
|
|
|
Consideration: |
|
|
|
|
|
|
|
|
|
|
|
|
Stock issued |
|
|
|
|
|
|
|
|
$ |
11,806 |
|
|
Cash paid |
|
|
|
|
|
|
|
|
|
543 |
|
|
Total |
|
|
|
|
|
|
|
|
$ |
12,349 |
|
|
|
|
|
|
|
|
|
|
|
|
|
|
In many cases, the fair values of assets acquired and liabilities assumed were determined by estimating the cash flows expected to result from those assets and liabilities and discounting them at appropriate market rates. The most significant category of assets for which this procedure was used was that of acquired loans. The excess of expected cash flows above the fair value of the majority of loans will be accreted to interest income over the remaining lives of the loans in accordance with FASB Accounting Standards Codification (“ASC”) 310-20.
Certain loans, for which specific credit-related deterioration since origination was identified, are recorded at fair value reflecting the present value of the amounts expected to be collected. Income recognition on these “purchased credit impaired” loans is based on a reasonable expectation about the timing and amount of cash flows to be collected. Acquired loans deemed impaired and considered collateral dependent, with the timing of the sale of loan collateral indeterminate, remain on nonaccrual status and have no accretable yield. All purchased credit impaired loans were classified as accruing loans as of and subsequent to the acquisition date.
81
FIRST FOUNDATION INC.
NOTES TO THE CONSOLIDATED FINANCIAL STATEMENTS (continued)
Years Ended December 31, 2015, 2014, and 2013
For loans acquired from PRB, the contractual amounts due, expected cash flows to be collected and fair value as of the acquisition date were as follows:
|
(dollars in thousands) |
|
Purchased Credit Impaired |
|
All Other Acquired Loans |
||||
|
|
|
|
|
|
|
|
|
|
|
|
|
|
|
|
|
|
|
|
|
Contractual amounts due |
|
$ |
9,418 |
|
|
$ |
86,466 |
|
|
Cash flows not expected to be collected |
|
|
2,201 |
|
|
|
1,155 |
|
|
Expected cash flows |
|
|
7,217 |
|
|
|
85,311 |
|
|
Interest component of expected cash flows |
|
|
805 |
|
|
|
13,950 |
|
|
Fair value of acquired loans |
|
$ |
6,412 |
|
|
$ |
71,361 |
|
|
|
|
|
|
|
|
|
|
|
In accordance with generally accepted accounting principles there was no carryover of the allowance for loan losses that had been previously recorded by PRB.
The Company recorded a deferred income tax asset of $2.3 million related to PRB’s operating loss carry-forward and other tax attributes of PRB, along with the effects of fair value adjustments resulting from applying the purchase method of accounting.
The fair value of savings and transaction deposit accounts acquired from PRB were assumed to approximate their carrying value as these accounts have no stated maturity and are payable on demand. Certificates of deposit accounts were valued by comparing the contractual cost of the portfolio to an identical portfolio bearing current market rates. The portfolio was segregated into pools based on remaining maturity. For each pool, the projected cash flows from maturing certificates were then calculated based on contractual rates and prevailing market rates. The valuation adjustment for each pool is equal to the present value of the difference of these two cash flows, discounted at the assumed market rate for a certificate with a corresponding maturity. This valuation adjustment will be accreted to reduce interest expense over the remaining maturities of the respective pools. The Company also recorded a core deposit intangible, which represents the value of the deposit relationships acquired from PRB, of $1.1 million. The core deposit intangible will be amortized over a period of 7 years.
Pro Forma Information (unaudited)
The following table presents unaudited pro forma information as if the acquisition of PRB had occurred on January 1, 2015, and January 1, 2014, for 2015 and 2014, respectively, after giving effect to certain adjustments. The unaudited pro forma information for these periods includes adjustments for interest income on loans acquired, amortization of intangibles arising from the transaction, adjustments for interest expense on deposits acquired, and the related income tax effects of all these items and the income tax benefits derived from PRB’s loss before taxes. The net effect of these pro forma adjustments were increases of $0.3 million and $0.5 million in net income for 2015 and 2014, respectively. The unaudited pro forma financial information is not necessarily indicative of the results of operations that would have occurred had the transaction been effected on the assumed dates.
|
|
|
2015 |
|
2014 |
||||
|
(dollars in thousands) |
|
|
|
|
|
|
|
|
|
|
|
|
|
|
|
|
|
|
|
Net interest income |
|
$ |
59,918 |
|
|
$ |
46,935 |
|
|
Provision for loan losses |
|
|
2,673 |
|
|
|
235 |
|
|
Noninterest income |
|
|
28,891 |
|
|
|
25,156 |
|
|
Noninterest expenses |
|
|
64,167 |
|
|
|
57,577 |
|
|
Income before taxes |
|
|
21,969 |
|
|
|
14,279 |
|
|
Taxes on income |
|
|
9,097 |
|
|
|
6,192 |
|
|
Net income |
|
$ |
12,872 |
|
|
$ |
8,087 |
|
|
|
|
|
|
|
|
|
|
|
|
Net income per share: |
|
|
|
|
|
|
|
|
|
Basic |
|
$ |
1.09 |
|
|
$ |
0.97 |
|
|
Diluted |
|
$ |
1.06 |
|
|
$ |
0.92 |
|
|
|
|
|
|
|
|
|
|
|
82
FIRST FOUNDATION INC.
NOTES TO THE CONSOLIDATED FINANCIAL STATEMENTS (continued)
Years Ended December 31, 2015, 2014, and 2013
The revenues (net interest income and noninterest income) and income before taxes for the period from June 16, 2015 to December 31, 2015 related to the operations acquired from PRB and included in the results of operations for 2015 was approximately $2.5 million and $0.8 million, respectively.
NOTE 3: FAIR VALUE
Assets Measured at Fair Value on a Recurring Basis
Fair value is the exchange price that would be received for an asset or paid to transfer a liability (exit price) in the principal or most advantageous market for the asset or liability in an orderly transaction between market participants on the measurement date. Current accounting guidance establishes a fair value hierarchy, which requires an entity to maximize the use of observable inputs and minimize the use of unobservable inputs when measuring fair value. There are three levels of inputs that may be used to measure fair values:
Level 1: Quoted prices (unadjusted) for identical assets or liabilities in active markets that the entity has the ability to access as of the measurement date.
Level 2: Significant other observable inputs other than Level 1 prices such as quoted prices for similar assets or liabilities; quoted prices in markets that are not active; or other inputs that are observable or can be corroborated by observable market data.
Level 3: Significant unobservable inputs that reflect the Company's own assumptions about the assumptions that market participants would use in pricing an asset or liability.
The following tables show the recorded amounts of assets and liabilities measured at fair value on a recurring basis as of:
|
|
|
|
|
|
Fair Value Measurement Level |
|
||||||||||
|
|
|
Total |
|
|
Level 1 |
|
|
Level 2 |
|
|
Level 3 |
|
||||
|
(dollars in thousands) |
|
|
|
|
|
|
|
|
|
|
|
|
||||
|
December 31, 2015: |
|
|
|
|
|
|
|
|
|
|
|
|
|
|
|
|
|
Investment securities available for sale |
|
|
|
|
|
|
|
|
|
|
|
|
|
|
|
|
|
US Treasury securities |
|
$ |
300 |
|
|
$ |
300 |
|
|
$ |
— |
|
|
$ |
— |
|
|
FNMA and FHLB Agency notes |
|
|
16,013 |
|
|
|
— |
|
|
|
16,013 |
|
|
|
— |
|
|
Agency mortgage-backed securities |
|
|
536,148 |
|
|
|
— |
|
|
|
536,148 |
|
|
|
— |
|
|
Beneficial interest – FHLMC securitization |
|
|
12,674 |
|
|
|
— |
|
|
|
— |
|
|
|
12,674 |
|
|
Total assets at fair value on a recurring basis |
|
$ |
565,135 |
|
|
$ |
300 |
|
|
$ |
552,161 |
|
|
$ |
12,674 |
|
|
December 31, 2014: |
|
|
|
|
|
|
|
|
|
|
|
|
|
|
|
|
|
Investment securities available for sale |
|
|
|
|
|
|
|
|
|
|
|
|
|
|
|
|
|
US Treasury securities |
|
$ |
300 |
|
|
$ |
300 |
|
|
$ |
— |
|
|
$ |
— |
|
|
FNMA and FHLB Agency notes |
|
|
10,277 |
|
|
|
— |
|
|
|
10,277 |
|
|
|
— |
|
|
Agency mortgage-backed securities |
|
|
127,693 |
|
|
|
— |
|
|
|
127,693 |
|
|
|
— |
|
|
Total assets at fair value on a recurring basis |
|
$ |
138,270 |
|
|
$ |
300 |
|
|
$ |
137,970 |
|
|
$ |
— |
|
The Company did not have any material assets measured at fair value on a non recurring basis as of December 31, 2015 and 2014.
Fair Value of Financial Instruments
We have elected to use fair value measurements to record fair value adjustments to certain assets and liabilities and to determine fair value disclosures. Securities available for sale are measured at fair value on a recurring basis. Additionally, from time to time, we may be required to measure at fair value other assets on a nonrecurring basis, such as loans held for investment and certain other assets. These nonrecurring fair value adjustments typically involve application of lower of cost or market accounting or write-downs of individual assets.
83
FIRST FOUNDATION INC.
NOTES TO THE CONSOLIDATED FINANCIAL STATEMENTS (continued)
Years Ended December 31, 2015, 2014, and 2013
Fair value estimates are made at a discrete point in time based on relevant market information and other information about the financial instruments. Because no active market exists for a significant portion of our financial instruments, fair value estimates are based in large part on judgments we make primarily regarding current economic conditions, risk characteristics of various financial instruments, prepayment rates, and future expected loss experience. These estimates are subjective in nature and invariably involve some inherent uncertainties. Additionally, unexpected changes in events or circumstances can occur that could require us to make changes to our assumptions and which, in turn, could significantly affect and require us to make changes to our previous estimates of fair value.
In addition, the fair value estimates are based on existing on and off-balance sheet financial instruments without attempting to estimate the value of existing and anticipated future customer relationships and the value of assets and liabilities that are not considered financial instruments, such as premises and equipment and other real estate owned.
The following methods and assumptions were used to estimate the fair value of financial instruments.
Cash and Cash Equivalents. The fair value of cash and cash equivalents approximates its carrying value.
Interest-Bearing Deposits with Financial Institutions. The fair values of interest-bearing deposits maturing within ninety days approximate their carrying values.
Investment Securities Available for Sale. Investment securities available-for-sale are measured at fair value on a recurring basis. Fair value measurement is based upon quoted prices, if available. If quoted prices are not available, fair values are measured using independent pricing models or other model-based valuation techniques such as the present value of future cash flows, adjusted for the security’s credit rating, prepayment assumptions and other factors such as credit loss assumptions. When a market is illiquid or there is a lack of transparency around the inputs to valuation, the securities are classified as Level 3 and reliance is placed upon internally developed models, and management judgment and evaluation for valuation. Level 1 securities include those traded on an active exchange, such as the New York Stock Exchange, U.S. Treasury securities that are traded by dealers or brokers in active over-the-counter markets and money market funds. Level 2 securities include mortgage-backed securities issued by government sponsored entities, municipal bonds and corporate debt securities. Securities classified as level 3 include beneficial interests – FHLMC securitization. Significant assumptions in the valuation of these Level 3 securities as of December 31, 2015 included a prepayment rate of 15% and discount rates ranging from 4.0% to 10%.
Federal Home Loan Bank and Federal Reserve Bank Stock. The Bank is a member of the Federal Home Loan Bank (the “FHLB”) and the Federal Reserve Bank of San Francisco (the “FRB”). As members, we are required to own stock of the FHLB and the FRB, the amount of which is based primarily on the level of our borrowings from those institutions. We also have the right to acquire additional shares of stock in either or both of the FHLB and the FRB; however, to date, we have not done so. The fair values of that stock are equal to their respective carrying amounts, are classified as restricted securities and are periodically evaluated for impairment based on our assessment of the ultimate recoverability of our investments in that stock. Any cash or stock dividends paid to us on such stock are reported as income.
Loans. The fair value for loans with variable interest rates is the carrying amount. The fair value of fixed rate loans is derived by calculating the discounted value of future cash flows expected to be received by the various homogeneous categories of loans. All loans have been adjusted to reflect changes in credit risk.
Impaired Loans. ASC 820-10 applies to loans measured for impairment in accordance with ASC 310-10, “Accounting by Creditors for Impairment of a Loan”, including impaired loans measured at an observable market price (if available), and at the fair value of the loan’s collateral (if the loan is collateral dependent) less selling cost. The fair value of an impaired loan is estimated using one of several methods, including collateral value, market value of similar debt, enterprise value, liquidation value and discounted cash flows. When the fair value of the collateral is based on an observable market price or a current appraised value, we measure the impaired loan at nonrecurring Level 2. When an appraised value is not available, or management determines the fair value of the collateral is further impaired below the appraised value and there is no observable market price or a discounted cash flow has been used to determine the fair value, we measure the impaired loan at nonrecurring Level 3.
Deposits. The fair value of demand deposits, savings deposits, and money market deposits is defined as the amounts payable on demand at quarter-end. The fair value of fixed maturity certificates of deposit is estimated based on the discounted value of the future cash flows expected to be paid on the deposits.
84
FIRST FOUNDATION INC.
NOTES TO THE CONSOLIDATED FINANCIAL STATEMENTS (continued)
Years Ended December 31, 2015, 2014, and 2013
Borrowings. The fair value of $796 million in borrowings is the carrying value of overnight FHLB advances that approximate fair value because of the short-term maturity of this instrument, resulting in a Level 2 classification. The fair value of term borrowings is derived by calculating the discounted value of future cash flows expected to be paid out by the Company.
The following table sets forth the estimated fair values and related carrying amounts of our financial instruments as of:
|
|
|
Carrying |
|
|
Fair Value Measurement Level |
|
||||||||||||||
|
(dollars in thousands) |
|
Value |
|
1 |
|
|
2 |
|
|
3 |
|
|
Total |
|
||||||
|
December 31, 2015: |
|
|
|
|
|
|
|
|
|
|
|
|
|
|
|
|
|
|
|
|
|
Assets: |
|
|
|
|
|
|
|
|
|
|
|
|
|
|
|
|
|
|
|
|
|
Cash and cash equivalents |
|
$ |
215,748 |
|
|
$ |
215,748 |
|
|
$ |
— |
|
|
$ |
— |
|
|
$ |
215,748 |
|
|
Securities AFS |
|
|
565,135 |
|
|
|
300 |
|
|
|
552,161 |
|
|
|
12,674 |
|
|
|
565,135 |
|
|
Loans |
|
|
1,754,883 |
|
|
|
— |
|
|
|
— |
|
|
|
1,779,941 |
|
|
|
1,779,941 |
|
|
Investment in FHLB stock |
|
|
21,492 |
|
|
|
— |
|
|
|
21,492 |
|
|
|
— |
|
|
|
21,492 |
|
|
Liabilities: |
|
|
|
|
|
|
|
|
|
|
|
|
|
|
|
|
|
|
|
|
|
Deposits |
|
|
1,522,176 |
|
|
|
1,051,976 |
|
|
|
470,128 |
|
|
|
— |
|
|
|
1,522,104 |
|
|
Borrowings |
|
|
796,000 |
|
|
|
— |
|
|
|
796,000 |
|
|
|
— |
|
|
|
796,000 |
|
|
December 31, 2014: |
|
|
|
|
|
|
|
|
|
|
|
|
|
|
|
|
|
|
|
|
|
Assets: |
|
|
|
|
|
|
|
|
|
|
|
|
|
|
|
|
|
|
|
|
|
Cash and cash equivalents |
|
$ |
29,692 |
|
|
$ |
29,692 |
|
|
$ |
— |
|
|
$ |
— |
|
|
$ |
29,692 |
|
|
Securities AFS |
|
|
138,270 |
|
|
|
300 |
|
|
|
137,970 |
|
|
|
— |
|
|
|
138,270 |
|
|
Loans |
|
|
1,156,242 |
|
|
|
— |
|
|
|
— |
|
|
|
1,186,408 |
|
|
|
1,186,408 |
|
|
Investment in FHLB stock |
|
|
12,361 |
|
|
|
— |
|
|
|
12,361 |
|
|
|
— |
|
|
|
12,361 |
|
|
Liabilities: |
|
|
|
|
|
|
|
|
|
|
|
|
|
|
|
|
|
|
|
|
|
Deposits |
|
|
962,954 |
|
|
|
709,604 |
|
|
|
253,244 |
|
|
|
— |
|
|
|
962,848 |
|
|
Borrowings |
|
|
282,886 |
|
|
|
— |
|
|
|
263,000 |
|
|
|
19,886 |
|
|
|
282,886 |
|
NOTE 4: SECURITIES
The following table provides a summary of the Company’s AFS securities portfolio at December 31:
|
|
|
|
Amortized |
|
|
|
Gross Unrealized |
|
|
|
Estimated |
|
||||
|
(dollars in thousands) |
|
|
|
|
|
Gains |
|
|
|
Losses |
|
|
|
|
||
|
2015: |
|
|
|
|
|
|
|
|
|
|
|
|
|
|
|
|
|
US Treasury securities |
|
$ |
300 |
|
|
$ |
— |
|
|
$ |
— |
|
|
$ |
300 |
|
|
Agency notes |
|
|
16,108 |
|
|
|
— |
|
|
|
(95 |
) |
|
|
16,013 |
|
|
Agency mortgage-backed securities |
|
|
538,269 |
|
|
|
909 |
|
|
|
(3,030 |
) |
|
|
536,148 |
|
|
Beneficial interest – FHLMC securitization |
|
|
12,674 |
|
|
|
476 |
|
|
|
(476 |
) |
|
|
12,674 |
|
|
Total |
|
$ |
567,351 |
|
|
$ |
1,385 |
|
|
$ |
(3,601 |
) |
|
$ |
565,135 |
|
|
2014: |
|
|
|
|
|
|
|
|
|
|
|
|
|
|
|
|
|
US Treasury securities |
|
$ |
300 |
|
|
$ |
— |
|
|
$ |
— |
|
|
$ |
300 |
|
|
Agency notes |
|
|
10,496 |
|
|
|
— |
|
|
|
(219 |
) |
|
|
10,277 |
|
|
Agency mortgage-backed securities |
|
|
125,944 |
|
|
|
1,881 |
|
|
|
(132 |
) |
|
|
127,693 |
|
|
Total |
|
$ |
136,740 |
|
|
$ |
1,881 |
|
|
$ |
(351 |
) |
|
$ |
138,270 |
|
The US Treasury Securities are pledged as collateral to the State of California to meet regulatory requirements related to the Bank’s trust operations.
85
FIRST FOUNDATION INC.
NOTES TO THE CONSOLIDATED FINANCIAL STATEMENTS (continued)
Years Ended December 31, 2015, 2014, and 2013
The table below indicates, as of December 31, 2015, the gross unrealized losses and fair values of our investments, aggregated by investment category and length of time that the individual securities have been in a continuous unrealized loss position.
|
|
|
Securities with Unrealized Loss at December 31, 2015 |
|
|||||||||||||||||||||
|
(dollars in thousands) |
|
Less than 12 months |
|
|
12 months or more |
|
|
Total |
|
|||||||||||||||
|
|
Fair |
|
|
Unrealized |
|
|
Fair |
|
|
Unrealized |
|
|
Fair |
|
|
Unrealized |
|
|||||||
|
Agency notes |
|
$ |
16,013 |
|
|
$ |
(95 |
) |
|
$ |
— |
|
|
$ |
— |
|
|
$ |
16,013 |
|
|
$ |
(95 |
) |
|
Agency mortgage backed securities |
|
|
397,850 |
|
|
|
(3,030 |
) |
|
|
— |
|
|
|
— |
|
|
|
397,850 |
|
|
|
(3,030 |
) |
|
Beneficial interest – FHLMC securitization |
|
|
12,674 |
|
|
|
(476 |
) |
|
|
— |
|
|
|
— |
|
|
|
12,674 |
|
|
|
(476 |
) |
|
Total temporarily impaired securities |
|
$ |
426,537 |
|
|
$ |
(3,601 |
) |
|
$ |
— |
|
|
$ |
— |
|
|
$ |
426,537 |
|
|
$ |
(3,601 |
) |
Unrealized losses on agency notes and agency mortgage-backed securities have not been recognized into income because the issuer bonds are of high credit quality, management does not intend to sell and it is not more likely than not that management would be required to sell the securities prior to their anticipated recovery, and the decline in fair value is largely due to changes in interest rates. The fair value is expected to recover as the bonds approach maturity.
The scheduled maturities of securities AFS, other than agency mortgage backed securities, and the related weighted average yield is as follows as of December 31, 2015:
|
(dollars in thousands) |
|
Less than |
|
|
1 Through |
|
|
5 Through |
|
|
After |
|
|
Total |
|
|||||
|
Amortized Cost: |
|
|
|
|
|
|
|
|
|
|
|
|
|
|
|
|
|
|
|
|
|
US Treasury securities |
|
$ |
300 |
|
|
$ |
— |
|
|
$ |
— |
|
|
$ |
— |
|
|
$ |
300 |
|
|
Agency notes |
|
|
— |
|
|
|
12,760 |
|
|
|
2,748 |
|
|
|
600 |
|
|
|
16,108 |
|
|
Total |
|
$ |
300 |
|
|
$ |
12,760 |
|
|
$ |
2,748 |
|
|
$ |
600 |
|
|
$ |
16,408 |
|
|
Weighted average yield |
|
|
0.45 |
% |
|
|
1,50 |
% |
|
|
1.94 |
% |
|
|
2.86 |
% |
|
|
1.60 |
% |
|
Estimated Fair Value: |
|
|
|
|
|
|
|
|
|
|
|
|
|
|
|
|
|
|
|
|
|
US Treasury securities |
|
$ |
300 |
|
|
$ |
— |
|
|
$ |
— |
|
|
$ |
— |
|
|
$ |
300 |
|
|
Agency notes |
|
|
— |
|
|
|
12,692 |
|
|
|
2,725 |
|
|
|
596 |
|
|
|
16,013 |
|
|
Total |
|
$ |
300 |
|
|
$ |
12,692 |
|
|
$ |
2,725 |
|
|
$ |
596 |
|
|
$ |
16,313 |
|
Agency mortgage backed securities are excluded from the above table because such securities are not due at a single maturity date. The weighted average yield of the agency mortgage backed securities as of December 31, 2015 was 2.24%.
86
FIRST FOUNDATION INC.
NOTES TO THE CONSOLIDATED FINANCIAL STATEMENTS (continued)
Years Ended December 31, 2015, 2014, and 2013
The following is a summary of our loans as of December 31:
|
(dollars in thousands) |
|
2015 |
|
|
2014 |
|
||
|
Recorded investment balance: |
|
|
|
|
|
|
|
|
|
Loans secured by real estate: |
|
|
|
|
|
|
|
|
|
Residential properties: |
|
|
|
|
|
|
|
|
|
Multifamily |
|
$ |
627,311 |
|
|
$ |
481,491 |
|
|
Single family |
|
|
533,257 |
|
|
|
360,644 |
|
|
Total real estate loans secured by residential properties |
|
|
1,160,568 |
|
|
|
842,135 |
|
|
Commercial properties |
|
|
358,791 |
|
|
|
205,320 |
|
|
Land |
|
|
12,320 |
|
|
|
4,309 |
|
|
Total real estate loans |
|
|
1,531,679 |
|
|
|
1,051,764 |
|
|
Commercial and industrial loans |
|
|
196,584 |
|
|
|
93,537 |
|
|
Consumer loans |
|
|
37,206 |
|
|
|
21,125 |
|
|
Total loans |
|
|
1,765,469 |
|
|
|
1,166,426 |
|
|
Deferred (fees) and expenses |
|
|
14 |
|
|
|
(34 |
) |
|
Total |
|
$ |
1,765,483 |
|
|
$ |
1,166,392 |
|
As of December 31, 2015 and 2014, the principal balances shown above are net of unaccreted discount related to loans acquired in an acquisition of $2.8 million and $0.8 million, respectively.
In 2012 and 2015, the Company purchased loans, for which there was, at acquisition, evidence of deterioration of credit quality since origination and it was probable, at acquisition, that all contractually required payments would not be collected. The carrying amount of these purchased credit impaired loans is as follows at December 31:
|
(dollars in thousands) |
|
2015 |
|
|
2014 |
|
||
|
Outstanding principal balance: |
|
|
|
|
|
|
|
|
|
Loans secured by real estate: |
|
|
|
|
|
|
|
|
|
Commercial properties |
|
$ |
533 |
|
|
$ |
206 |
|
|
Land |
|
|
1,616 |
|
|
|
— |
|
|
Total real estate loans |
|
|
2,149 |
|
|
|
206 |
|
|
Commercial and industrial loans |
|
|
6,787 |
|
|
|
2,002 |
|
|
Consumer loans |
|
|
14 |
|
|
|
249 |
|
|
Total loans |
|
|
8,950 |
|
|
|
2,457 |
|
|
Unaccreted discount on purchased credit impaired loans |
|
|
(2,291 |
) |
|
|
(651 |
) |
|
Total |
|
$ |
6,659 |
|
|
$ |
1,806 |
|
Accretable yield, or income expected to be collected on purchased credit impaired loans, is as follows at December 31:
|
(dollars in thousands) |
|
2015 |
|
|
2014 |
|
||
|
Beginning balance |
|
$ |
130 |
|
|
$ |
2,349 |
|
|
Accretion of income |
|
|
(529 |
) |
|
|
(1,076 |
) |
|
Reclassifications from nonaccretable difference |
|
|
175 |
|
|
|
(391 |
) |
|
Acquisitions |
|
|
805 |
|
|
|
— |
|
|
Disposals |
|
|
— |
|
|
|
(752 |
) |
|
Ending balance |
|
$ |
581 |
|
|
$ |
130 |
|
87
FIRST FOUNDATION INC.
NOTES TO THE CONSOLIDATED FINANCIAL STATEMENTS (continued)
Years Ended December 31, 2015, 2014, and 2013
The following table summarizes our delinquent and nonaccrual loans as of December 31:
|
|
|
Past Due and Still Accruing |
|
|
|
Total Past |
|
|
|
|
|
|
|
|||||||||||||||
|
(dollars in thousands) |
|
30–59 Days |
|
|
60-89 Days |
|
|
90 Days |
|
|
Nonaccrual |
|
|
|
Current |
|
|
Total |
|
|||||||||
|
2015: |
|
|
|
|
|
|
|
|
|
|
|
|
|
|
|
|
|
|
|
|
|
|
|
|
|
|
|
|
|
Real estate loans: |
|
|
|
|
|
|
|
|
|
|
|
|
|
|
|
|
|
|
|
|
|
|
|
|
|
|
|
|
|
Residential properties |
|
$ |
— |
|
|
$ |
— |
|
|
$ |
— |
|
|
$ |
— |
|
|
$ |
— |
|
|
$ |
1,160,568 |
|
|
$ |
1,160,568 |
|
|
Commercial properties |
|
|
1,232 |
|
|
|
— |
|
|
|
793 |
|
|
|
1,552 |
|
|
|
3,577 |
|
|
|
355,214 |
|
|
|
358,791 |
|
|
Land |
|
|
— |
|
|
|
— |
|
|
|
— |
|
|
|
— |
|
|
|
— |
|
|
|
12,320 |
|
|
|
12,320 |
|
|
Commercial and industrial loans |
|
|
2,425 |
|
|
|
1,639 |
|
|
|
5,713 |
|
|
|
2,509 |
|
|
|
12,286 |
|
|
|
184,298 |
|
|
|
196,584 |
|
|
Consumer loans |
|
|
1,010 |
|
|
|
— |
|
|
|
1,991 |
|
|
|
75 |
|
|
|
3,076 |
|
|
|
34,130 |
|
|
|
37,206 |
|
|
Total |
|
$ |
4,667 |
|
|
$ |
1,639 |
|
|
$ |
8,497 |
|
|
$ |
4,136 |
|
|
$ |
18,939 |
|
|
$ |
1,746,530 |
|
|
$ |
1,765,469 |
|
|
Percentage of total loans |
|
|
0.26 |
% |
|
|
0.09 |
% |
|
|
0.48 |
% |
|
|
0.23 |
% |
|
|
1.07 |
% |
|
|
|
|
|
|
|
|
|
2014: |
|
|
|
|
|
|
|
|
|
|
|
|
|
|
|
|
|
|
|
|
|
|
|
|
|
|
|
|
|
Real estate loans: |
|
|
|
|
|
|
|
|
|
|
|
|
|
|
|
|
|
|
|
|
|
|
|
|
|
|
|
|
|
Residential properties |
|
$ |
— |
|
|
$ |
— |
|
|
$ |
— |
|
|
$ |
— |
|
|
$ |
— |
|
|
$ |
842,135 |
|
|
$ |
842,135 |
|
|
Commercial properties |
|
|
— |
|
|
|
805 |
|
|
|
200 |
|
|
|
596 |
|
|
|
1,601 |
|
|
|
203,719 |
|
|
|
205,320 |
|
|
Land |
|
|
— |
|
|
|
— |
|
|
|
651 |
|
|
|
— |
|
|
|
651 |
|
|
|
3,658 |
|
|
|
4,309 |
|
|
Commercial and industrial loans |
|
|
2,092 |
|
|
|
289 |
|
|
|
700 |
|
|
|
342 |
|
|
|
3,423 |
|
|
|
90,114 |
|
|
|
93,537 |
|
|
Consumer loans |
|
|
— |
|
|
|
— |
|
|
|
637 |
|
|
|
163 |
|
|
|
800 |
|
|
|
20,325 |
|
|
|
21,125 |
|
|
Total |
|
$ |
2,092 |
|
|
$ |
1,094 |
|
|
$ |
2,188 |
|
|
$ |
1,101 |
|
|
$ |
6,475 |
|
|
$ |
1,159,951 |
|
|
$ |
1,166,426 |
|
|
Percentage of total loans |
|
|
0.18 |
% |
|
|
0.09 |
% |
|
|
0.19 |
% |
|
|
0.09 |
% |
|
|
0.56 |
% |
|
|
|
|
|
|
|
|
The level of delinquent loans and nonaccrual loans have been adversely impacted by the loans acquired in an acquisition. As of December 31, 2015, of the $12.6 million in loans over 90 days past due, including loans on nonaccrual, $6.8 million, or 54% were loans acquired in an acquisition.
Accrual of interest on loans is discontinued when reasonable doubt exists as to the full, timely collection of interest or principal and, generally, when a loan becomes contractually past due for ninety days or more with respect to principal or interest. The accrual of interest may be continued on a well-secured loan contractually past due ninety days or more with respect to principal or interest if the loan is in the process of collection or collection of the principal and interest is deemed probable. The Bank considers a loan to be impaired when, based upon current information and events, it believes it is probable that the Bank will be unable to collect all amounts due according to the contractual terms of the loan agreement. The determination of past due, nonaccrual or impairment status of loans acquired in an acquisition, other than loans deemed purchased impaired, is the same as loans we originate.
As of December 31, 2015, the Company had two loans with a balance of $0.3 million classified as troubled debt restructurings (“TDR”) which are included as nonaccrual in the table above. Both loans were classified as a TDR as a result of a reduction in required principal payments and an extension of the maturity date of the loans. As of December 31, 2014, the Company had two loans with a balance of $0.5 million classified as troubled debt restructurings (“TDR”) which are included as nonaccrual in the table above. Both loans were classified as a TDR as a result of a reduction in required principal payments and an extension of the maturity date of the loans.
In 2015, FFB sold through a securitization sponsored by Freddie Mac $102 million of multifamily loans and recognized a gain of $2.7 million. In the securitization, the Company obtained a beneficial interest in an interest-only strip. The $0.9 million fair value of this beneficial interest, which was determined based on variety of factors including market prepayment speeds, discount rates and yield curve assumptions, was included in the determination of the gain on sale of loans. In addition the Company purchased the “B” piece of the securitization, which is structured to absorb any losses incurred on the loans in the securitization, and an interest only strip. As of December 31, 2015, FFB is servicing $102 million of loans, and, in 2015, earned $0.1 million of servicing fees related to this transaction.
88
FIRST FOUNDATION INC.
NOTES TO THE CONSOLIDATED FINANCIAL STATEMENTS (continued)
Years Ended December 31, 2015, 2014, and 2013
NOTE 6: ALLOWANCE FOR LOAN LOSSES
The following is a rollforward of the Bank’s allowance for loan losses for the years ended December 31:
|
(dollars in thousands) |
|
Beginning |
|
|
Provision for |
|
|
Charge-offs |
|
|
Recoveries |
|
|
Ending |
|
|||||
|
2015: |
|
|
|
|
|
|
|
|
|
|
|
|
|
|
|
|
|
|
|
|
|
Real estate loans: |
|
|
|
|
|
|
|
|
|
|
|
|
|
|
|
|
|
|
|
|
|
Residential properties |
|
$ |
6,586 |
|
|
$ |
243 |
|
|
$ |
— |
|
|
$ |
— |
|
|
$ |
6,829 |
|
|
Commercial properties |
|
|
1,526 |
|
|
|
670 |
|
|
|
(310 |
) |
|
|
— |
|
|
|
1,886 |
|
|
Commercial and industrial loans |
|
|
1,897 |
|
|
|
1,665 |
|
|
|
(1,913 |
) |
|
|
— |
|
|
|
1,649 |
|
|
Consumer loans |
|
|
141 |
|
|
|
95 |
|
|
|
— |
|
|
|
— |
|
|
|
236 |
|
|
Total |
|
$ |
10,150 |
|
|
$ |
2,673 |
|
|
$ |
(2,223 |
) |
|
$ |
— |
|
|
$ |
10,600 |
|
|
2014: |
|
|
|
|
|
|
|
|
|
|
|
|
|
|
|
|
|
|
|
|
|
Real estate loans: |
|
|
|
|
|
|
|
|
|
|
|
|
|
|
|
|
|
|
|
|
|
Residential properties |
|
$ |
6,157 |
|
|
$ |
429 |
|
|
$ |
— |
|
|
$ |
— |
|
|
$ |
6,586 |
|
|
Commercial properties |
|
|
1,440 |
|
|
|
86 |
|
|
|
— |
|
|
|
— |
|
|
|
1,526 |
|
|
Commercial and industrial loans |
|
|
2,149 |
|
|
|
(252 |
) |
|
|
— |
|
|
|
— |
|
|
|
1,897 |
|
|
Consumer loans |
|
|
169 |
|
|
|
(28 |
) |
|
|
— |
|
|
|
— |
|
|
|
141 |
|
|
Total |
|
$ |
9,915 |
|
|
$ |
235 |
|
|
$ |
— |
|
|
$ |
— |
|
|
$ |
10,150 |
|
|
2013: |
|
|
|
|
|
|
|
|
|
|
|
|
|
|
|
|
|
|
|
|
|
Real estate loans: |
|
|
|
|
|
|
|
|
|
|
|
|
|
|
|
|
|
|
|
|
|
Residential properties |
|
$ |
4,355 |
|
|
$ |
1,802 |
|
|
$ |
— |
|
|
$ |
— |
|
|
$ |
6,157 |
|
|
Commercial properties |
|
|
936 |
|
|
|
561 |
|
|
|
(57 |
) |
|
|
— |
|
|
|
1,440 |
|
|
Commercial and industrial loans |
|
|
2,841 |
|
|
|
71 |
|
|
|
(763 |
) |
|
|
— |
|
|
|
2,149 |
|
|
Consumer loans |
|
|
208 |
|
|
|
(39 |
) |
|
|
— |
|
|
|
— |
|
|
|
169 |
|
|
Total |
|
$ |
8,340 |
|
|
$ |
2,395 |
|
|
$ |
(820 |
) |
|
$ |
— |
|
|
$ |
9,915 |
|
89
FIRST FOUNDATION INC.
NOTES TO THE CONSOLIDATED FINANCIAL STATEMENTS (continued)
Years Ended December 31, 2015, 2014, and 2013
The following table presents the balance in the allowance for loan losses and the recorded investment in loans by impairment method as of December 31:
|
(dollars in thousands) |
|
Allowance for Loan Losses |
|
|
Unaccreted |
|
||||||||||||||
|
|
|
Evaluated for Impairment |
|
|
Purchased |
|
|
Total |
|
|
|
|||||||||
|
|
|
Individually |
|
|
Collectively |
|
|
|
|
|
|
|
||||||||
|
2015: |
|
|
|
|
|
|
|
|
|
|
|
|
|
|
|
|
|
|
|
|
|
Allowance for loan losses: |
|
|
|
|
|
|
|
|
|
|
|
|
|
|
|
|
|
|
|
|
|
Real estate loans: |
|
|
|
|
|
|
|
|
|
|
|
|
|
|
|
|
|
|
|
|
|
Residential properties |
|
$ |
— |
|
|
$ |
6,799 |
|
|
$ |
— |
|
|
$ |
6,799 |
|
|
$ |
127 |
|
|
Commercial properties |
|
|
30 |
|
|
|
1,783 |
|
|
|
— |
|
|
|
1,813 |
|
|
|
363 |
|
|
Land |
|
|
— |
|
|
|
103 |
|
|
|
— |
|
|
|
103 |
|
|
|
42 |
|
|
Commercial and industrial loans |
|
|
— |
|
|
|
1,649 |
|
|
|
— |
|
|
|
1,649 |
|
|
|
187 |
|
|
Consumer loans |
|
|
— |
|
|
|
236 |
|
|
|
— |
|
|
|
236 |
|
|
|
13 |
|
|
Total |
|
$ |
30 |
|
|
$ |
10,570 |
|
|
$ |
— |
|
|
$ |
10,600 |
|
|
$ |
732 |
|
|
Loans: |
|
|
|
|
|
|
|
|
|
|
|
|
|
|
|
|
|
|
|
|
|
Real estate loans: |
|
|
|
|
|
|
|
|
|
|
|
|
|
|
|
|
|
|
|
|
|
Residential properties |
|
$ |
— |
|
|
$ |
1,160,568 |
|
|
$ |
— |
|
|
$ |
1,160,568 |
|
|
$ |
7,747 |
|
|
Commercial properties |
|
|
6,275 |
|
|
|
352,162 |
|
|
|
354 |
|
|
|
358,791 |
|
|
|
43,287 |
|
|
Land |
|
|
— |
|
|
|
11,180 |
|
|
|
1,140 |
|
|
|
12,320 |
|
|
|
4,267 |
|
|
Commercial and industrial loans |
|
|
5,687 |
|
|
|
185,732 |
|
|
|
5,165 |
|
|
|
196,584 |
|
|
|
28,231 |
|
|
Consumer loans |
|
|
76 |
|
|
|
37,130 |
|
|
|
— |
|
|
|
37,206 |
|
|
|
1,761 |
|
|
Total |
|
$ |
12,038 |
|
|
$ |
1,746,772 |
|
|
$ |
6,659 |
|
|
$ |
1,765,469 |
|
|
$ |
85,293 |
|
|
2014: |
|
|
|
|
|
|
|
|
|
|
|
|
|
|
|
|
|
|
|
|
|
Allowance for loan losses: |
|
|
|
|
|
|
|
|
|
|
|
|
|
|
|
|
|
|
|
|
|
Real estate loans: |
|
|
|
|
|
|
|
|
|
|
|
|
|
|
|
|
|
|
|
|
|
Residential properties |
|
$ |
— |
|
|
$ |
6,586 |
|
|
$ |
— |
|
|
$ |
6,586 |
|
|
$ |
26 |
|
|
Commercial properties |
|
|
26 |
|
|
|
1,500 |
|
|
|
— |
|
|
|
1,526 |
|
|
|
193 |
|
|
Land |
|
|
— |
|
|
|
— |
|
|
|
— |
|
|
|
— |
|
|
|
4 |
|
|
Commercial and industrial loans |
|
|
686 |
|
|
|
1,211 |
|
|
|
— |
|
|
|
1,897 |
|
|
|
45 |
|
|
Consumer loans |
|
|
— |
|
|
|
141 |
|
|
|
— |
|
|
|
141 |
|
|
|
— |
|
|
Total |
|
$ |
712 |
|
|
$ |
9,438 |
|
|
$ |
— |
|
|
$ |
10,150 |
|
|
$ |
268 |
|
|
Loans: |
|
|
|
|
|
|
|
|
|
|
|
|
|
|
|
|
|
|
|
|
|
Real estate loans: |
|
|
|
|
|
|
|
|
|
|
|
|
|
|
|
|
|
|
|
|
|
Residential properties |
|
$ |
43 |
|
|
$ |
842,092 |
|
|
$ |
— |
|
|
$ |
842,135 |
|
|
$ |
2,861 |
|
|
Commercial properties |
|
|
5,742 |
|
|
|
199,378 |
|
|
|
200 |
|
|
|
205,320 |
|
|
|
21,126 |
|
|
Land |
|
|
— |
|
|
|
4,309 |
|
|
|
— |
|
|
|
4,309 |
|
|
|
1,099 |
|
|
Commercial and industrial loans |
|
|
5,635 |
|
|
|
86,343 |
|
|
|
1,559 |
|
|
|
93,537 |
|
|
|
5,893 |
|
|
Consumer loans |
|
|
116 |
|
|
|
20,962 |
|
|
|
47 |
|
|
|
21,125 |
|
|
|
8 |
|
|
Total |
|
$ |
11,536 |
|
|
$ |
1,153,084 |
|
|
$ |
1,806 |
|
|
$ |
1,166,426 |
|
|
$ |
30,987 |
|
The column labeled “Unaccreted Credit Component Other Loans” represents the amount of unaccreted credit component discount for the other loans acquired in a business combination, and the stated principal balance of the related loans. The discount is equal to 0.86% and 0.86% of the stated principal balance of these loans as of December 31, 2015 and 2014, respectively. In addition to this unaccreted credit component discount, an additional $0.3 million and $0.3 million of the ALLL was provided for these loans as of December 31, 2015 and 2014, respectively.
90
FIRST FOUNDATION INC.
NOTES TO THE CONSOLIDATED FINANCIAL STATEMENTS (continued)
Years Ended December 31, 2015, 2014, and 2013
The Bank categorizes loans into risk categories based on relevant information about the ability of borrowers to service their debt such as current financial information, historical payment experience, collateral adequacy, credit documentation, and current economic trends, among other factors. The Bank analyzes loans individually by classifying the loans as to credit risk. This analysis typically includes larger, non-homogeneous loans such as loans secured by multifamily or commercial real estate and commercial and industrial loans. This analysis is performed on an ongoing basis as new information is obtained. The Bank uses the following definitions for risk ratings:
Pass: Loans classified as pass are strong credits with no existing or known potential weaknesses deserving of management’s close attention.
Special Mention: Loans classified as special mention have a potential weakness that deserves management’s close attention. If left uncorrected, these potential weaknesses may result in deterioration of the repayment prospects for the loan or of the institution’s credit position at some future date.
Substandard: Loans classified as substandard are inadequately protected by the current net worth and paying capacity of the obligor or of the collateral pledged, if any. Loans so classified have a well-defined weakness or weaknesses that jeopardize the liquidation of the debt. They are characterized by the distinct possibility that the institution will sustain some loss if the deficiencies are not corrected.
Impaired: A loan is considered impaired, when, based on current information and events, it is probable that the Bank will be unable to collect all amounts due according to the contractual terms of the loan agreement.
Additionally, all loans classified as troubled debt restructurings (“TDRs”) are considered impaired. Purchased credit impaired loans are not considered impaired loans for these purposes.
Loans listed as pass include larger non-homogeneous loans not meeting the risk rating definitions above and smaller, homogeneous loans not assessed on an individual basis.
Based on the most recent analysis performed, the risk category of loans by class of loans is as follows as of December 31:
|
(dollars in thousands) |
|
Pass |
|
|
Special |
|
|
Substandard |
|
|
Impaired |
|
|
Total |
|
|||||
|
2015: |
|
|
|
|
|
|
|
|
|
|
|
|
|
|
|
|
|
|
|
|
|
Real estate loans: |
|
|
|
|
|
|
|
|
|
|
|
|
|
|
|
|
|
|
|
|
|
Residential properties |
|
$ |
1,159,029 |
|
|
$ |
1,539 |
|
|
$ |
— |
|
|
$ |
— |
|
|
$ |
1,160,568 |
|
|
Commercial properties |
|
|
351,988 |
|
|
|
174 |
|
|
|
354 |
|
|
|
6,275 |
|
|
|
358,791 |
|
|
Land |
|
|
11,180 |
|
|
|
— |
|
|
|
1,140 |
|
|
|
— |
|
|
|
12,320 |
|
|
Commercial and industrial loans |
|
|
180,755 |
|
|
|
4,977 |
|
|
|
5,165 |
|
|
|
5,687 |
|
|
|
196,584 |
|
|
Consumer loans |
|
|
37,130 |
|
|
|
— |
|
|
|
— |
|
|
|
76 |
|
|
|
37,206 |
|
|
Total |
|
$ |
1,740,082 |
|
|
$ |
6,690 |
|
|
$ |
6,659 |
|
|
$ |
12,038 |
|
|
$ |
1,765,469 |
|
|
2014: |
|
|
|
|
|
|
|
|
|
|
|
|
|
|
|
|
|
|
|
|
|
Real estate loans: |
|
|
|
|
|
|
|
|
|
|
|
|
|
|
|
|
|
|
|
|
|
Residential properties |
|
$ |
841,538 |
|
|
$ |
554 |
|
|
$ |
— |
|
|
$ |
43 |
|
|
$ |
842,135 |
|
|
Commercial properties |
|
|
198,112 |
|
|
|
1,266 |
|
|
|
200 |
|
|
|
5,742 |
|
|
|
205,320 |
|
|
Land |
|
|
4,309 |
|
|
|
— |
|
|
|
— |
|
|
|
— |
|
|
|
4,309 |
|
|
Commercial and industrial loans |
|
|
81,067 |
|
|
|
5,276 |
|
|
|
1,559 |
|
|
|
5,635 |
|
|
|
93,537 |
|
|
Consumer loans |
|
|
20,962 |
|
|
|
— |
|
|
|
47 |
|
|
|
116 |
|
|
|
21,125 |
|
|
Total |
|
$ |
1,145,988 |
|
|
$ |
7,096 |
|
|
$ |
1,806 |
|
|
$ |
11,536 |
|
|
$ |
1,166,426 |
|
91
FIRST FOUNDATION INC.
NOTES TO THE CONSOLIDATED FINANCIAL STATEMENTS (continued)
Years Ended December 31, 2015, 2014, and 2013
Impaired loans evaluated individually and any related allowance is as follows as of December 31:
|
|
|
With No Allowance Recorded |
|
|
With an Allowance Recorded |
|
||||||||||||||
|
(dollars in thousands) |
|
Unpaid |
|
|
Recorded |
|
|
Unpaid |
|
|
Recorded |
|
|
Related |
|
|||||
|
2015: |
|
|
|
|
|
|
|
|
|
|
|
|
|
|
|
|
|
|
|
|
|
Real estate loans: |
|
|
|
|
|
|
|
|
|
|
|
|
|
|
|
|
|
|
|
|
|
Residential properties |
|
$ |
— |
|
|
$ |
— |
|
|
$ |
— |
|
|
$ |
— |
|
|
$ |
— |
|
|
Commercial properties |
|
|
5,925 |
|
|
|
5,925 |
|
|
|
590 |
|
|
|
350 |
|
|
|
30 |
|
|
Commercial and industrial loans |
|
|
7,770 |
|
|
|
5,687 |
|
|
|
— |
|
|
|
— |
|
|
|
— |
|
|
Consumer loans |
|
|
114 |
|
|
|
76 |
|
|
|
— |
|
|
|
— |
|
|
|
— |
|
|
Total |
|
$ |
13,809 |
|
|
$ |
11,688 |
|
|
$ |
590 |
|
|
$ |
350 |
|
|
$ |
30 |
|
|
2014: |
|
|
|
|
|
|
|
|
|
|
|
|
|
|
|
|
|
|
|
|
|
Real estate loans: |
|
|
|
|
|
|
|
|
|
|
|
|
|
|
|
|
|
|
|
|
|
Residential properties |
|
$ |
43 |
|
|
$ |
43 |
|
|
$ |
— |
|
|
$ |
— |
|
|
$ |
— |
|
|
Commercial properties |
|
|
5,568 |
|
|
|
5,568 |
|
|
|
174 |
|
|
|
174 |
|
|
|
26 |
|
|
Commercial and industrial loans |
|
|
2,094 |
|
|
|
2,094 |
|
|
|
3,541 |
|
|
|
3,541 |
|
|
|
686 |
|
|
Consumer loans |
|
|
116 |
|
|
|
116 |
|
|
|
— |
|
|
|
— |
|
|
|
— |
|
|
Total |
|
$ |
7,821 |
|
|
$ |
7,821 |
|
|
$ |
3,715 |
|
|
$ |
3,715 |
|
|
$ |
712 |
|
The weighted average annualized average balance of the recorded investment for impaired loans, beginning from when the loan became impaired, and any interest income recorded on impaired loans after they became impaired is as follows for the years ending December 31:
|
|
|
2015 |
|
|
2014 |
|
|
2013 |
|
|||||||||||||||
|
(dollars in thousands) |
|
Average |
|
|
Interest |
|
|
Average |
|
|
Interest |
|
|
Average |
|
|
Interest |
|
||||||
|
Real estate loans: |
|
|
|
|
|
|
|
|
|
|
|
|
|
|
|
|
|
|
|
|
|
|
|
|
|
Residential properties |
|
$ |
27 |
|
|
$ |
2 |
|
|
$ |
3,000 |
|
|
$ |
25 |
|
|
$ |
2,250 |
|
|
$ |
32 |
|
|
Commercial properties |
|
|
6,487 |
|
|
|
281 |
|
|
|
3,217 |
|
|
|
140 |
|
|
|
323 |
|
|
|
22 |
|
|
Commercial and industrial loans |
|
|
7,850 |
|
|
|
394 |
|
|
|
1,196 |
|
|
|
241 |
|
|
|
2,690 |
|
|
|
168 |
|
|
Consumer loans |
|
|
105 |
|
|
|
— |
|
|
|
126 |
|
|
|
— |
|
|
|
— |
|
|
|
— |
|
|
Total |
|
$ |
14,469 |
|
|
$ |
677 |
|
|
$ |
7,539 |
|
|
$ |
406 |
|
|
$ |
5,263 |
|
|
$ |
222 |
|
There was no interest income recognized on a cash basis in either 2015 or 2014 on impaired loans.
NOTE 7: PREMISES AND EQUIPMENT
A summary of premises and equipment is as follows at December 31:
|
(dollars in thousands) |
|
2015 |
|
|
2014 |
|
||
|
Leasehold improvements and artwork |
|
$ |
1,473 |
|
|
$ |
1,202 |
|
|
Information technology equipment |
|
|
4,358 |
|
|
|
3,073 |
|
|
Furniture and fixtures |
|
|
2,230 |
|
|
|
1,969 |
|
|
Total |
|
|
8,061 |
|
|
|
6,244 |
|
|
Accumulated depreciation and amortization |
|
|
(5,408 |
) |
|
|
(4,057 |
) |
|
Net |
|
$ |
2,653 |
|
|
$ |
2,187 |
|
92
FIRST FOUNDATION INC.
NOTES TO THE CONSOLIDATED FINANCIAL STATEMENTS (continued)
Years Ended December 31, 2015, 2014, and 2013
The activity in our portfolio of REO is as follows during the periods ending December 31:
|
(dollars in thousands) |
|
2015 |
|
|
2014 |
|
||
|
Beginning balance |
|
$ |
334 |
|
|
$ |
375 |
|
|
Loans transferred to REO |
|
|
— |
|
|
|
1,834 |
|
|
Purchase of note on REO property |
|
|
— |
|
|
|
1,285 |
|
|
REO chargeoffs |
|
|
— |
|
|
|
— |
|
|
REO acquired in merger |
|
|
3,702 |
|
|
|
— |
|
|
Dispositions of REO |
|
|
— |
|
|
|
(3,160 |
) |
|
Ending balance |
|
$ |
4,036 |
|
|
$ |
334 |
|
NOTE 9: DEPOSITS
The following table summarizes the outstanding balance of deposits and average rates paid thereon at December 31:
|
|
|
2015 |
|
|
2014 |
|
||||||||||
|
(dollars in thousands) |
|
Amount |
|
|
Weighted |
|
|
Amount |
|
|
Weighted |
|
||||
|
Demand deposits: |
|
|
|
|
|
|
|
|
|
|
|
|
||||
|
Noninterest-bearing |
|
$ |
299,794 |
|
|
|
— |
|
|
$ |
246,137 |
|
|
|
— |
|
|
Interest-bearing |
|
|
260,167 |
|
|
|
0.359 |
% |
|
|
291,509 |
|
|
|
0.502 |
% |
|
Money market and savings |
|
|
492,015 |
|
|
|
0.531 |
% |
|
|
171,958 |
|
|
|
0.626 |
% |
|
Certificates of deposits |
|
|
470,200 |
|
|
|
0.554 |
% |
|
|
253,350 |
|
|
|
0.619 |
% |
|
Total |
|
$ |
1,522,176 |
|
|
|
0.404 |
% |
|
$ |
962,954 |
|
|
|
0.427 |
% |
At December 31, 2015, of the $149.2 million of certificates of deposits of $250,000 or more, $137.8 million mature within one year and $11.4 million mature after one year. Of the $321 million of certificates of deposit of less than $250,000, $292.5 million mature within one year and $28.5 million mature after one year. At December 31, 2014, of the $117.0 million of certificates of deposits of $250,000 or more, $96.9 million mature within one year and $20.1 million mature after one year. Of the $136.4 million of certificates of deposit of less than $250,000, $127.1 million mature within one year and $9.3 million mature after one year.
NOTE 10: BORROWINGS
Borrowings: At December 31, 2015, our borrowings consisted of $796.0 million of overnight FHLB advances. At December 31, 2014, our borrowings consisted of $263.0 million of overnight FHLB advances and a $19.9 million term loan payable by FFI. These FHLB advances were paid in full in the early part of January 2016 and 2015, respectively, and bore interest rates of 0.27% and 0.27%, respectively. Because the Bank utilizes overnight borrowings, the balance of outstanding borrowings fluctuates on a daily basis.
FHLB advances are collateralized by loans secured by multifamily and commercial real estate properties with a carrying value of $1.3 billion as of December 31, 2015. As a matter of practice, the Bank provides substantially all of its qualifying loans as collateral to the FHLB. The Bank’s total borrowing capacity from the FHLB at December 31, 2015 was $898.1 million. In addition to the $796.0 million borrowing, the Bank had in place $101.5 million of letters of credit from the FHLB which are used to meet collateral requirements for borrowings from the State of California and local agencies.
The Bank also has a $20.0 million available unsecured fed funds line with Pacific Coast Banker’s Bank, a $2.0 million available unsecured fed funds line with Wells Fargo Bank, a $25.0 million available unsecured fed funds line with US Bank, a $25.0 million available unsecured fed funds line with PNC Bank, and a $25.0 million available unsecured fed funds line at Zions Bank. None of these lines had outstanding borrowings as of December 31, 2015. Combined, the Bank’s unused lines of credit as of December 31, 2015 were $97.6 million. The average daily balance of borrowings outstanding during 2015 and 2014 was $352.7 million and $192.8 million, respectively.
93
FIRST FOUNDATION INC.
NOTES TO THE CONSOLIDATED FINANCIAL STATEMENTS (continued)
Years Ended December 31, 2015, 2014, and 2013
NOTE 11: SHAREHOLDERS’ EQUITY
In August 2012, the Company acquired all of the assets and assumed all of the liabilities of Desert Commercial Bank. The merger agreement for this acquisition included a contingent payout based on the performance of certain assets over a two year period. The Company has determined that the amount of the contingent payout to be $1.0 million, of which $0.90 million is to be paid out in common stock of FFI using an assumed value of $15.00 per share and $0.1 million is to be paid out in cash. As of December 31, 2015, the Company had issued 54,644 shares of FFI common stock as part of this payout.
FFI is a holding company and does not have any direct operating activities. Any future cash flow needs of FFI are expected to be met by its existing cash and cash equivalents and dividends from its subsidiaries. The Bank is subject to various laws and regulations that limit the amount of dividends that a bank can pay without obtaining prior approval from bank regulators. As of December 31, 2015, FFI’s cash and cash equivalents totaled $42.2 million.
NOTE 12: EARNINGS PER SHARE
The following table sets forth the Company’s earnings per share calculations for the years ended December 31:
|
|
|
2015 |
|
|
2014 |
|
|
2013 |
|
|||||||||||||||
|
(dollars in thousands, except share and per share amounts) |
|
Basic |
|
|
Diluted |
|
|
Basic |
|
|
Diluted |
|
|
Basic |
|
|
Diluted |
|
||||||
|
Net income |
|
$ |
13,378 |
|
|
$ |
13,378 |
|
|
$ |
8,394 |
|
|
$ |
8,394 |
|
|
$ |
7,851 |
|
|
$ |
7,851 |
|
|
Basic common shares outstanding |
|
|
11,155,007 |
|
|
|
11,155,007 |
|
|
|
7,737,036 |
|
|
|
7,737,036 |
|
|
|
7,424,210 |
|
|
|
7,424,210 |
|
|
Effect of options, restricted stock and contingent shares issuable |
|
|
|
|
|
|
420,848 |
|
|
|
|
|
|
|
429,307 |
|
|
|
|
|
|
|
318,005 |
|
|
Diluted common shares outstanding |
|
|
|
|
|
|
11,575,855 |
|
|
|
|
|
|
|
8,166,343 |
|
|
|
|
|
|
|
7,742,215 |
|
|
Earnings per share |
|
$ |
1.20 |
|
|
$ |
1.16 |
|
|
$ |
1.08 |
|
|
$ |
1.03 |
|
|
$ |
1.06 |
|
|
$ |
1.01 |
|
Based on a weighted average basis, options to purchase 42,518, 66,324, and 154,814 shares of common stock were excluded for 2015, 2014, and 2013 respectively, because their effect would have been anti-dilutive.
NOTE 13: STOCK BASED COMPENSATION
In 2007, the Board of Directors of FFI approved two equity incentive plans that provided for the grant of stock options, shares of restricted stock, restricted stock units (“RSUs”), stock bonus awards and performance awards (collectively, “Equity Incentive Awards”) to the Company’s executive officers, other key employees and directors up to 1,300,282 shares of the FFI’s common stock. In 2010, shareholders approved an increase of 580,000 in the number of shares available for issuance under one of these plans. In 2015, shareholders approved a new equity incentive plan whereby: the Company can no longer issue Equity Incentive Awards under the previously approved plans; 750,000 shares of common stock will be available for the grant of Equity Incentive Awards to the Company’s executive officers, other key employees and directors; Equity Incentive Awards that are outstanding under the prior plans will remain outstanding and unchanged and subject to the terms of those Plans; and upon termination, cancellation or forfeiture of any of the Equity Incentive Awards that are outstanding under the prior plans, those shares will be added to the pool of shares available for future grants of Equity Incentive Awards under the plan approved in 2015. The Company recognized stock-based compensation expense of $0.6 million, $0.5 million, and $0.6 million in 2015, 2014, and 2013, respectively. Included in the 2015 amount is $0.4 million of expense related to RSUs.
Stock options, when granted, have an exercise price not less than the current market value of the common stock and expire after ten years if not exercised. If applicable, vesting periods are set at the date of grant and the Plans provide for accelerated vesting
94
FIRST FOUNDATION INC.
NOTES TO THE CONSOLIDATED FINANCIAL STATEMENTS (continued)
Years Ended December 31, 2015, 2014, and 2013
should a change in control occur. The fair value of the each option granted in 2015, 2014 and 2013 was estimated on the date of the grant using the Black-Scholes option pricing model with the following assumptions:
|
Expected Volatility |
|
|
20 |
% |
|
Expected Term |
|
|
6.5 years |
|
|
Expected Dividends |
|
|
None |
|
|
Weighted Average Risk Free Rate: |
|
|
|
|
|
2015 grants |
|
|
1.714 |
% |
|
2014 grants |
|
|
2.269 |
% |
|
2013 grants |
|
|
1.181 |
% |
|
Weighted-Average Grant Fair Value: |
|
|
|
|
|
2015 grants |
|
$ |
4.89 |
|
|
2014 grants |
|
|
4.77 |
|
|
2013 grants |
|
|
3.79 |
|
Since the Company has limited historical stock activity, the expected volatility is based on the historical volatility of similar companies that have a longer trading history. The expected term represents the estimated average period of time that the options remain outstanding. Since the Company does not have sufficient historical data on the exercise of stock options, the expected term is based on the “simplified” method that measures the expected term as the average of the vesting period and the contractual term. The risk free rate of return reflects the grant date interest rate offered for zero coupon U.S. Treasury bonds over the expected term of the options.
The following table summarizes the activities in the Plans during 2015:
|
(dollars in thousands except |
|
Options Granted |
|
|
Weighted Average |
|
|
Weighted Average |
|
|
Aggregate |
|
||||
|
Balance: December 31, 2014 |
|
|
1,384,808 |
|
|
$ |
12.67 |
|
|
|
|
|
|
|
|
|
|
Options granted |
|
|
11,500 |
|
|
|
19.75 |
|
|
|
|
|
|
|
|
|
|
Options exercised |
|
|
(31,307 |
) |
|
|
12.94 |
|
|
|
|
|
|
|
|
|
|
Options forfeited |
|
|
(6,584 |
) |
|
|
16.48 |
|
|
|
|
|
|
|
|
|
|
Balance: December 31, 2015 |
|
|
1,358,417 |
|
|
|
12.71 |
|
|
|
3.52 Years |
|
|
$ |
14,782 |
|
|
Options exercisable |
|
|
1,299,504 |
|
|
$ |
12.46 |
|
|
|
3.30 Years |
|
|
$ |
14,463 |
|
As of December 31, 2015, the Company had $0.2 million of unrecognized compensation costs related to outstanding stock options which will be recognized through February 2018, subject to the vesting requirements for these stock options. The intrinsic value of stock options exercised in 2015 was $0.3 million.
The following table summarizes the activities in the Plans during 2014:
|
(dollars in thousands except |
|
Options Granted |
|
|
Weighted Average |
|
|
Weighted Average |
|
|
Aggregate |
|
||||
|
Balance: December 31, 2013 |
|
|
1,430,967 |
|
|
$ |
12.37 |
|
|
|
|
|
|
|
|
|
|
Options granted |
|
|
71,735 |
|
|
|
18.08 |
|
|
|
|
|
|
|
|
|
|
Options exercised |
|
|
(84,866 |
) |
|
|
11.19 |
|
|
|
|
|
|
|
|
|
|
Options forfeited |
|
|
(32,668 |
) |
|
|
15.28 |
|
|
|
|
|
|
|
|
|
|
Balance: December 31, 2014 |
|
|
1,384,808 |
|
|
|
12.67 |
|
|
|
4.50 Years |
|
|
$ |
7,378 |
|
|
Options exercisable |
|
|
1,279,091 |
|
|
$ |
12.32 |
|
|
|
4.15 Years |
|
|
$ |
7,272 |
|
95
FIRST FOUNDATION INC.
NOTES TO THE CONSOLIDATED FINANCIAL STATEMENTS (continued)
Years Ended December 31, 2015, 2014, and 2013
The following table summarizes the activities in the Plans during 2013:
|
(dollars in thousands except |
|
Options Granted |
|
|
Weighted Average |
|
|
Weighted Average |
|
|
Aggregate |
|
||||
|
Balance: December 31, 2012 |
|
|
1,423,965 |
|
|
$ |
12.36 |
|
|
|
|
|
|
|
|
|
|
Options granted |
|
|
26,000 |
|
|
|
15.58 |
|
|
|
|
|
|
|
|
|
|
Options exercised |
|
|
— |
|
|
|
— |
|
|
|
|
|
|
|
|
|
|
Options forfeited |
|
|
(18,998 |
) |
|
|
15.53 |
|
|
|
|
|
|
|
|
|
|
Balance: December 31, 2013 |
|
|
1,430,967 |
|
|
|
12.37 |
|
|
|
5.25 Years |
|
|
$ |
8,051 |
|
|
Options exercisable |
|
|
1,249,960 |
|
|
$ |
11.98 |
|
|
|
4.83 Years |
|
|
$ |
7,527 |
|
The following table provides a summary of the RSUs issued by the Company under its equity incentive plans for the periods ended December 31:
|
|
|
2015 |
|
2014 |
|
2013 |
|||||||||||||||
|
|
|
Shares |
|
Weighted Average Grant Date Fair Value |
|
Shares |
|
Weighted Average Grant Date Fair Value |
|
Shares |
|
Weighted Average Grant Date Fair Value |
|||||||||
|
|
|
|
|
|
|
|
|
|
|
|
|
|
|
|
|
|
|
|
|
|
|
|
Balance: January 1 |
|
4,444 |
|
|
$ |
18.00 |
|
|
7,666 |
|
|
$ |
17.61 |
|
|
10,667 |
|
|
$ |
15.00 |
|
|
New RSUs |
|
73,682 |
|
|
|
20.00 |
|
|
— |
|
|
|
— |
|
|
6,666 |
|
|
|
18.00 |
|
|
Shares vested and issued |
|
(10,762 |
) |
|
|
19.99 |
|
|
(3,222 |
) |
|
|
17.07 |
|
|
(9,667 |
) |
|
|
15.00 |
|
|
RSUs forfeited |
|
— |
|
|
|
— |
|
|
— |
|
|
|
— |
|
|
— |
|
|
|
— |
|
|
Balance December 31 |
|
67,364 |
|
|
$ |
19.87 |
|
|
4,444 |
|
|
$ |
18.00 |
|
|
7,666 |
|
|
$ |
17.61 |
|
The fair value of the shares vested and issued was $0.2 million, $0.1 million and $0.2 million in 2015, 2014 and 2013, respectively. As of December 31, 2015, the Company had $1.1 million of unrecognized compensation costs related to outstanding RSUs which will be recognized through November 2018, subject to the related vesting requirements.
NOTE 14: 401(k) PROFIT SHARING PLAN
The Company’s employees participate in the Company’s 401(k) profit sharing plan (the “401k Plan”) that covers all employees eighteen years of age or older who have completed three months of employment. Each employee eligible to participate in the 401k Plan may contribute up to 100% of his or her compensation, subject to certain statutory limitations. In 2015, 2014 and 2013, the Company matched 50% of the participant’s contribution up to 5% of employee compensation, which is subject to the plan’s vesting schedule. The Company contributions of $0.5 million, $0.5 million and $0.4 million were included in Compensation and Benefits for 2015, 2014 and 2013, respectively. The Company may also make an additional profit sharing contribution on behalf of eligible employees. No profit sharing contributions were made in 2015, 2014 or 2013.
96
FIRST FOUNDATION INC.
NOTES TO THE CONSOLIDATED FINANCIAL STATEMENTS (continued)
Years Ended December 31, 2015, 2014, and 2013
NOTE 15: INCOME TAXES
The Company is subject to federal income tax and California franchise tax. Income tax expense (benefit) was as follows for the years ended December 31:
|
(dollars in thousands) |
|
2015 |
|
|
2014 |
|
|
2013 |
|
|||
|
Current expense: |
|
|
|
|
|
|
|
|
|
|
|
|
|
Federal |
|
$ |
8,620 |
|
|
$ |
4,485 |
|
|
$ |
2,505 |
|
|
State |
|
|
2,700 |
|
|
|
1,366 |
|
|
|
392 |
|
|
Deferred expense (benefit): |
|
|
|
|
|
|
|
|
|
|
|
|
|
Federal |
|
|
(1,525 |
) |
|
|
263 |
|
|
|
992 |
|
|
State |
|
|
(341 |
) |
|
|
313 |
|
|
|
354 |
|
|
Benefit of net operating loss carryforwards |
|
|
— |
|
|
|
— |
|
|
|
(172 |
) |
|
Change in valuation allowance |
|
|
— |
|
|
|
— |
|
|
|
(2,441 |
) |
|
Total |
|
$ |
9,454 |
|
|
$ |
6,427 |
|
|
$ |
1,630 |
|
The following is a comparison of the federal statutory income tax rates to the Company’s effective income tax rate for the years ended December 31:
|
|
|
2015 |
|
|
2014 |
|
|
2013 |
|
|||||||||||||||
|
(dollars in thousands) |
|
Amount |
|
|
Rate |
|
|
Amount |
|
|
Rate |
|
|
Amount |
|
|
Rate |
|
||||||
|
Income before taxes |
|
$ |
22,832 |
|
|
|
|
|
|
$ |
14,821 |
|
|
|
|
|
|
$ |
9,481 |
|
|
|
|
|
|
Federal tax statutory rate |
|
$ |
7,991 |
|
|
|
35.00 |
% |
|
$ |
5,070 |
|
|
|
34.20 |
% |
|
|
3,224 |
|
|
|
34.00 |
% |
|
State tax, net of Federal benefit |
|
|
1,536 |
|
|
|
6.73 |
% |
|
|
1,009 |
|
|
|
6.81 |
% |
|
|
664 |
|
|
|
7.00 |
% |
|
Change in valuation allowance |
|
|
— |
|
|
|
— |
% |
|
|
— |
|
|
|
— |
% |
|
|
(2,441 |
) |
|
|
(25.74) |
% |
|
DCB Asset Pool payout |
|
|
— |
|
|
|
— |
% |
|
|
154 |
|
|
|
1.04 |
% |
|
|
— |
|
|
|
— |
% |
|
Other items, net |
|
|
(73 |
) |
|
|
(0.32) |
% |
|
|
194 |
|
|
|
1.31 |
% |
|
|
183 |
|
|
|
1.93 |
% |
|
Effective tax rate |
|
$ |
9,454 |
|
|
|
41.41 |
% |
|
$ |
6,427 |
|
|
|
43.36 |
% |
|
$ |
1,630 |
|
|
|
17.19 |
% |
Deferred taxes are a result of differences between income tax accounting and generally accepted accounting principles with respect to income tax recognition. The following is a summary of the components of the net deferred tax assets recognized in the accompanying consolidated balance sheets at December 31:
|
(dollars in thousands) |
|
2015 |
|
|
2014 |
|
||
|
Deferred tax assets (liabilities) |
|
|
|
|
|
|
|
|
|
Allowance for loan and REO losses |
|
$ |
5,092 |
|
|
$ |
4,024 |
|
|
Operating loss carryforwards |
|
|
4,249 |
|
|
|
2,972 |
|
|
Market valuation: Acquired loans and REO |
|
|
2,056 |
|
|
|
880 |
|
|
Stock-based compensation |
|
|
1,524 |
|
|
|
1,396 |
|
|
State taxes |
|
|
937 |
|
|
|
461 |
|
|
Accumulated other comprehensive income |
|
|
912 |
|
|
|
(630 |
) |
|
Organizational expenses |
|
|
288 |
|
|
|
321 |
|
|
Depreciation |
|
|
(179 |
) |
|
|
(435 |
) |
|
Prepaid expenses |
|
|
(562 |
) |
|
|
(489 |
) |
|
Accrued vacation |
|
|
542 |
|
|
|
531 |
|
|
Other |
|
|
533 |
|
|
|
717 |
|
|
Net deferred tax assets |
|
|
15,392 |
|
|
$ |
9,748 |
|
97
FIRST FOUNDATION INC.
NOTES TO THE CONSOLIDATED FINANCIAL STATEMENTS (continued)
Years Ended December 31, 2015, 2014, and 2013
As part of the merger with DCB, the Company acquired operating loss carryforwards of approximately $13.4 million. These operating loss carryforwards are subject to limitation under Section 382 of the Internal Revenue Service Code and expire in 2032. As a result, the Company will only be able to utilize operating loss carryforwards of $8.2 million, ratably over a period of 20 years. As part of the merger with PRB, the Company acquired operating loss carryforwards of approximately $3.9 million. These operating loss carryforwards are subject to limitation under Section 382 of the Internal Revenue Service Code and expire in 2035. As a result, the Company will only be able to utilize these operating loss carryforwards, ratably over a period of 20 years. As of December 31, 2015, the remaining operating loss carryforwards from DCB and PRB available to be utilized by the Company were $10.4 million.
The Company has no other operating loss carryforwards. The Company is subject to federal income tax and franchise tax of the state of California. Income tax returns for the periods 2012 through 2015 are open to audit by federal authorities and for the periods 2012 through 2015 by California state authorities, and for 2015 by Hawaii state authorities.
NOTE 16: COMMITMENTS AND CONTINGENCIES
Leases
The Company leases certain facilities for its corporate offices and branch operations under non-cancelable operating leases that expire through 2027. Lease expense for 2015, 2014, and 2013 was $3.7 million, $3.1 million, and $2.7 million, respectively. Future minimum lease commitments under all non-cancelable operating leases at December 31, 2015 are as follows:
|
(dollars in thousands) |
|
|
|
|
|
Year Ending December 31, |
|
|
|
|
|
2016 |
|
$ |
3,951 |
|
|
2017 |
|
|
4,637 |
|
|
2018 |
|
|
4,419 |
|
|
2019 |
|
|
4,330 |
|
|
2020 and after |
|
|
12,026 |
|
|
Total |
|
$ |
29,363 |
|
Financial Instruments with Off-Balance Sheet Risk
In the normal course of business, the Bank is a party to financial instruments with off-balance sheet risk to meet the financing needs of customers and to reduce exposure to fluctuations in interest rates. These financial instruments may include commitments to extend credit and standby and commercial letters of credit. Commitments to extend credit are agreements to lend to a customer as long as there is no violation of any condition established in the contract. Standby and commercial letters of credit and financial guarantees are conditional commitments issued by the Bank to guaranty the performance of a customer to a third party. Commitments generally have fixed expiration dates or other termination clauses and may require payment of a fee. The following table provides the off-balance sheet arrangements of the Bank as of December 31:
|
(dollars in thousands) |
|
|
2015 |
|
|
2014 |
|
|
|
Commitments to fund new loans |
|
$ |
51,887 |
|
|
$ |
18,217 |
|
|
Commitments to fund under existing loans, lines of credit |
|
|
153,606 |
|
|
|
104,881 |
|
|
Commitments under standby letters of credit |
|
|
8,617 |
|
|
|
5,402 |
|
Since many of the commitments are expected to expire without being drawn upon, the total commitment amounts do not necessarily represent future cash requirements. The credit risk involved in issuing letters of credit is essentially the same as that involved in extending loan facilities to customers. The Bank evaluates each customer’s creditworthiness on a case-by-case basis. The amount of collateral obtained, if deemed necessary by the Bank upon extension of credit, is based on management’s credit evaluation of the counter-party. Collateral held varies but may include deposits, marketable securities, accounts receivable, inventory, property, plant and equipment, motor vehicles and real estate.
98
FIRST FOUNDATION INC.
NOTES TO THE CONSOLIDATED FINANCIAL STATEMENTS (continued)
Years Ended December 31, 2015, 2014, and 2013
From time to time, the Company may become party to various lawsuits, which have arisen in the course of business. While it is not possible to predict with certainty the outcome of such litigation, it is the opinion of management, based in part upon opinions of counsel, that the liability, if any, arising from such lawsuits would not have a material adverse effect on the Company’s financial position or results of operations.
NOTE 17: RELATED-PARTY TRANSACTIONS
Loans to related parties, including directors and executive officers of the Company and their affiliates, were as follows for the periods presented:
|
(dollars in thousands) |
|
2015 |
|
|
|
Balance, January 1 |
|
$ |
454 |
|
|
New loans and advances |
|
|
5,910 |
|
|
Principal payments received |
|
|
(454 |
) |
|
Balance, December 31 |
|
$ |
5,910 |
|
Interest earned from loans to related parties was $0.2 million in 2015, and $0.1 million in each of 2014 and 2013. In addition, the Bank has a $0.5 million commitment to an affiliate of a director under a commercial line of credit under which no balances were outstanding as of December 31, 2015.
The Bank held $1.9 million and $6.1 million of deposits from related parties, including directors and executive officers of the Company and their affiliates, as of December 31, 2015 and December 31, 2014, respectively. Interest paid on deposit accounts held by related parties was $7,000 in 2015, $9,000 in 2014 and $5,000 in 2013. As of December 31,
As of December 31, 2015, related parties, including directors and executive officers of the Company and their affiliates, held $11.7 million in assets under management with FFA and FFB. In 2015, the Company received $0.1 million in fees related to these assets under management.
The CEO of the Company was, from 2013 to 2015, a member of the board of directors of a bank that provided a term loan to the Company. Under this loan, which was originated in the first quarter of 2013, subsequently amended in 2014 and 2015, and paid off in August 2015, the Company had average borrowings of $16.6 million, $17.5 million and $5.1 million in 2015, 2014 and 2013 respectively, and the Company incurred interest of $0.7 million, $0.7 million and $0.2 million in 2015, 2014 and 2013, respectively. As of December 31, 2015, this Bank held $40.1 million of deposits at FFB and the Bank paid interest of $0.1 million on this account in 2015. The President of FFB has a minority interest in an entity which FFB uses for software services, for which FFB paid $0.1 million in 2015. During 2014 and 2013, an entity in which one of the directors of the Company had an ownership interest, provided insurance brokerage services to the Company. Broker fees earned by this entity for the services it provided to the Company were $0.2 million in 2014 and $0.1 million in 2013.
FFI and the Bank are subject to various regulatory capital requirements administered by the federal banking agencies. Failure to meet minimum capital requirements can initiate certain mandatory, and possible additional discretionary, actions by regulators that, if undertaken, could have a direct material effect on FFI and the Bank’s financial condition. Under capital adequacy guidelines and the regulatory framework for prompt corrective action, the Company and the Bank must meet specific capital guidelines that involve quantitative measures of FFI and the Bank’s assets, liabilities, and certain off-balance sheet items as calculated under regulatory accounting practices. In July, 2013, the federal bank regulatory agencies approved the final rules implementing the Basel Committee on Banking Supervision's capital guidelines for U.S. banks. The new rules became effective on January 1, 2015, with certain of the requirements phased-in over a multi-year schedule, and fully phased in by January 1, 2019. The rules include a new common equity Tier 1 ("CET1") capital to risk-weighted assets ratio with minimums for capital adequacy and prompt corrective action purposes of 4.5% and 6.5%, respectively. The net unrealized gain or loss on available for sale securities is not included in computing regulatory capital. Capital
99
FIRST FOUNDATION INC.
NOTES TO THE CONSOLIDATED FINANCIAL STATEMENTS (continued)
Years Ended December 31, 2015, 2014, and 2013
amounts and ratios for December 31, 2014 are calculated using Basel I rules. FFI’s and the Bank’s capital amounts and classification are also subject to qualitative judgments by the regulators about components, risk weightings, and other factors.
Quantitative measures established by the regulators to ensure capital adequacy require FFI and the Bank to maintain minimum amounts and ratios (set forth in the table below) of total and Tier 1 capital (as defined in the regulations) to risk-weighted assets (as defined), and of Tier 1 capital (as defined) to assets (as defined). Management believes, as of December 31, 2015 that FFI and the Bank met all capital adequacy requirements.
The following table presents the regulatory standards for well-capitalized institutions and the capital ratios for FFI and the Bank as of:
|
|
|
Actual |
|
|
For Capital |
|
|
To Be Well-Capitalized |
|
|||||||||||||||
|
(dollars in thousands) |
|
Amount |
|
|
Ratio |
|
|
Amount |
|
|
Ratio |
|
|
Amount |
|
|
Ratio |
|
||||||
|
FFI |
|
|
|
|
|
|
|
|
|
|
|
|
|
|
|
|
|
|
|
|
|
|
|
|
|
December 31, 2015 |
|
|
|
|
|
|
|
|
|
|
|
|
|
|
|
|
|
|
|
|
|
|
|
|
|
CET1 capital ratio |
|
$ |
256,305 |
|
|
|
17.99 |
% |
|
$ |
64,099 |
|
|
|
4.50 |
% |
|
|
|
|
|
|
|
|
|
Tier 1 leverage ratio |
|
|
256,305 |
|
|
|
11.82 |
% |
|
|
86,747 |
|
|
|
4.00 |
% |
|
|
|
|
|
|
|
|
|
Tier 1 risk-based capital ratio |
|
|
256,305 |
|
|
|
17.99 |
% |
|
|
85,466 |
|
|
|
6.00 |
% |
|
|
|
|
|
|
|
|
|
Total risk-based capital ratio |
|
|
267,325 |
|
|
|
18.77 |
% |
|
|
113,954 |
|
|
|
8.00 |
% |
|
|
|
|
|
|
|
|
|
December 31, 2014 |
|
|
|
|
|
|
|
|
|
|
|
|
|
|
|
|
|
|
|
|
|
|
|
|
|
Tier 1 leverage ratio |
|
$ |
95,582 |
|
|
|
7.32 |
% |
|
$ |
52,200 |
|
|
|
4.00 |
% |
|
|
|
|
|
|
|
|
|
Tier 1 risk-based capital ratio |
|
|
95,582 |
|
|
|
11.01 |
% |
|
|
34,711 |
|
|
|
4.00 |
% |
|
|
|
|
|
|
|
|
|
Total risk-based capital ratio |
|
|
106,426 |
|
|
|
12.26 |
% |
|
|
69,423 |
|
|
|
8.00 |
% |
|
|
|
|
|
|
|
|
|
BANK |
|
|
|
|
|
|
|
|
|
|
|
|
|
|
|
|
|
|
|
|
|
|
|
|
|
December 31, 2015 |
|
|
|
|
|
|
|
|
|
|
|
|
|
|
|
|
|
|
|
|
|
|
|
|
|
CET1 capital ratio |
|
$ |
206,807 |
|
|
|
14.56 |
% |
|
$ |
63,907 |
|
|
|
4.50 |
% |
|
$ |
92,310 |
|
|
|
6.50 |
% |
|
Tier 1 leverage ratio |
|
|
206,807 |
|
|
|
9.56 |
% |
|
|
86,562 |
|
|
|
4.00 |
% |
|
|
108,202 |
|
|
|
5.00 |
% |
|
Tier 1 risk-based capital ratio |
|
|
206,807 |
|
|
|
14.56 |
% |
|
|
85,209 |
|
|
|
6.00 |
% |
|
|
113,612 |
|
|
|
8.00 |
% |
|
Total risk-based capital ratio |
|
|
217,827 |
|
|
|
15.34 |
% |
|
|
113,612 |
|
|
|
8.00 |
% |
|
|
142,015 |
|
|
|
10.00 |
% |
|
December 31, 2014 |
|
|
|
|
|
|
|
|
|
|
|
|
|
|
|
|
|
|
|
|
|
|
|
|
|
Tier 1 leverage ratio |
|
$ |
105,261 |
|
|
|
8.09 |
% |
|
$ |
52,036 |
|
|
|
4.00 |
% |
|
$ |
65,045 |
|
|
|
5.00 |
% |
|
Tier 1 risk-based capital ratio |
|
|
105,261 |
|
|
|
12.18 |
% |
|
|
34,572 |
|
|
|
4.00 |
% |
|
|
51,858 |
|
|
|
6.00 |
% |
|
Total risk-based capital ratio |
|
|
115,811 |
|
|
|
13.40 |
% |
|
|
69,144 |
|
|
|
8.00 |
% |
|
|
86,430 |
|
|
|
10.00 |
% |
As of each of the dates set forth in the above table, the Company (on a consolidated basis) exceeded the minimum required capital ratios applicable to it and FFB (on a stand-alone basis) qualified as a well-capitalized depository institution under the capital adequacy guidelines.
NOTE 19: OTHER EXPENSES
The following items are included in the consolidated income statements as professional services and marketing costs and other expenses for the years ended December 31:
|
(dollars in thousands) |
|
2015 |
|
|
2014 |
|
|
2013 |
|
|||
|
Regulatory assessments |
|
$ |
1,105 |
|
|
$ |
788 |
|
|
$ |
650 |
|
|
Directors’ compensation expenses |
|
|
558 |
|
|
|
522 |
|
|
|
604 |
|
|
Contingent payout related to DCB acquisition |
|
|
— |
|
|
|
960 |
|
|
|
— |
|
|
Costs related to cancelled initial public offering |
|
|
— |
|
|
|
1,000 |
|
|
|
— |
|
100
FIRST FOUNDATION INC.
NOTES TO THE CONSOLIDATED FINANCIAL STATEMENTS (continued)
Years Ended December 31, 2015, 2014, and 2013
In 2015, 2014, and 2013 the Company had two reportable business segments: Banking (FFB) and Wealth Management (FFA). The results of FFI and any elimination entries are included in the column labeled Other. The reportable segments are determined by products and services offered and the corporate structure. Business segment earnings before taxes are the primary measure of the segment's performance as evaluated by management. Business segment earnings before taxes include direct revenue and expenses of the segment as well as corporate and inter-company cost allocations. Allocations of corporate expenses, such as finance and accounting, data processing and human resources, are calculated based on estimated activity or usage levels. The management accounting process measures the performance of the operating segments based on the Company's management structure and is not necessarily comparable with similar information for other financial services companies. If the management structures and/or the allocation process changes, allocations, transfers and assignments may change. The following tables show key operating results for each of our business segments used to arrive at our consolidated totals for the years ended December 31:
|
(dollars in thousands) |
|
Banking |
|
|
Wealth |
|
|
Other |
|
|
Total |
|
||||
|
2015: |
|
|
|
|
|
|
|
|
|
|
|
|
|
|
|
|
|
Interest income |
|
$ |
64,471 |
|
|
$ |
— |
|
|
$ |
— |
|
|
$ |
64,471 |
|
|
Interest expense |
|
|
5,607 |
|
|
|
— |
|
|
|
674 |
|
|
|
6,281 |
|
|
Net interest income |
|
|
58,864 |
|
|
|
— |
|
|
|
(674 |
) |
|
|
58,190 |
|
|
Provision for loan losses |
|
|
2,673 |
|
|
|
— |
|
|
|
— |
|
|
|
2,673 |
|
|
Noninterest income |
|
|
8,833 |
|
|
|
20,530 |
|
|
|
(590 |
) |
|
|
28,773 |
|
|
Noninterest expense |
|
|
39,982 |
|
|
|
18,352 |
|
|
|
3,124 |
|
|
|
61,458 |
|
|
Income (loss) before taxes on income |
|
$ |
25,042 |
|
|
$ |
2,178 |
|
|
$ |
(4,388 |
) |
|
$ |
22,832 |
|
|
2014: |
|
|
|
|
|
|
|
|
|
|
|
|
|
|
|
|
|
Interest income |
|
$ |
47,398 |
|
|
$ |
— |
|
|
$ |
— |
|
|
$ |
47,398 |
|
|
Interest expense |
|
|
3,844 |
|
|
|
— |
|
|
|
740 |
|
|
|
4,584 |
|
|
Net interest income |
|
|
43,554 |
|
|
|
— |
|
|
|
(740 |
) |
|
|
42,814 |
|
|
Provision for loan losses |
|
|
235 |
|
|
|
— |
|
|
|
— |
|
|
|
235 |
|
|
Noninterest income |
|
|
5,866 |
|
|
|
19,422 |
|
|
|
(539 |
) |
|
|
24,749 |
|
|
Noninterest expense |
|
|
30,509 |
|
|
|
17,979 |
|
|
|
4,019 |
|
|
|
52,507 |
|
|
Income (loss) before taxes on income |
|
$ |
18,676 |
|
|
$ |
1,443 |
|
|
$ |
(5,298 |
) |
|
$ |
14,821 |
|
|
2013: |
|
|
|
|
|
|
|
|
|
|
|
|
|
|
|
|
|
Interest income |
|
$ |
39,181 |
|
|
$ |
— |
|
|
$ |
— |
|
|
$ |
39,181 |
|
|
Interest expense |
|
|
3,288 |
|
|
|
— |
|
|
|
219 |
|
|
|
3,507 |
|
|
Net interest income |
|
|
35,893 |
|
|
|
— |
|
|
|
(219 |
) |
|
|
35,674 |
|
|
Provision for loan losses |
|
|
2,395 |
|
|
|
— |
|
|
|
— |
|
|
|
2,395 |
|
|
Noninterest income |
|
|
3,514 |
|
|
|
16,715 |
|
|
|
(405 |
) |
|
|
19,824 |
|
|
Noninterest expense |
|
|
24,302 |
|
|
|
17,400 |
|
|
|
1,920 |
|
|
|
43,622 |
|
|
Income (loss) before taxes on income |
|
$ |
12,710 |
|
|
$ |
(685 |
) |
|
$ |
(2,544 |
) |
|
$ |
9,481 |
|
101
FIRST FOUNDATION INC.
NOTES TO THE CONSOLIDATED FINANCIAL STATEMENTS (continued)
Years Ended December 31, 2015, 2014, and 2013
The following tables show the financial position for each of our business segments, and of FFI which is included in the column labeled Other, and the eliminating entries used to arrive at our consolidated totals at December 31:
|
(dollars in thousands) |
|
Banking |
|
|
Wealth |
|
|
Other |
|
|
Eliminations |
|
|
Total |
|
|||||
|
2015: |
|
|
|
|
|
|
|
|
|
|
|
|
|
|
|
|
|
|
|
|
|
Cash and cash equivalents |
|
$ |
215,671 |
|
|
$ |
5,682 |
|
|
$ |
42,151 |
|
|
$ |
(47,756 |
) |
|
$ |
215,748 |
|
|
Securities AFS |
|
|
565,135 |
|
|
|
— |
|
|
|
— |
|
|
|
— |
|
|
|
565,135 |
|
|
Loans, net |
|
|
1,754,883 |
|
|
|
— |
|
|
|
— |
|
|
|
— |
|
|
|
1,754,883 |
|
|
Premises and equipment |
|
|
1,996 |
|
|
|
545 |
|
|
|
112 |
|
|
|
— |
|
|
|
2,653 |
|
|
FHLB Stock |
|
|
21,492 |
|
|
|
— |
|
|
|
— |
|
|
|
— |
|
|
|
21,492 |
|
|
Deferred taxes |
|
|
14,466 |
|
|
|
630 |
|
|
|
296 |
|
|
|
— |
|
|
|
15,392 |
|
|
REO |
|
|
4,036 |
|
|
|
— |
|
|
|
— |
|
|
|
— |
|
|
|
4,036 |
|
|
Goodwill and intangibles |
|
|
2,416 |
|
|
|
— |
|
|
|
— |
|
|
|
— |
|
|
|
2,416 |
|
|
Other assets |
|
|
8,645 |
|
|
|
314 |
|
|
|
217,032 |
|
|
|
(215,167 |
) |
|
|
10,824 |
|
|
Total assets |
|
$ |
2,588,740 |
|
|
$ |
7,171 |
|
|
$ |
259,591 |
|
|
$ |
(262,923 |
) |
|
$ |
2,592,579 |
|
|
Deposits |
|
$ |
1,569,932 |
|
|
$ |
— |
|
|
$ |
— |
|
|
$ |
(47,756 |
) |
|
$ |
1,522,176 |
|
|
Borrowings |
|
|
796,000 |
|
|
|
— |
|
|
|
— |
|
|
|
— |
|
|
|
796,000 |
|
|
Intercompany balances |
|
|
2,748 |
|
|
|
121 |
|
|
|
(2,869 |
) |
|
|
— |
|
|
|
— |
|
|
Other liabilities |
|
|
9,309 |
|
|
|
2,634 |
|
|
|
2,724 |
|
|
|
— |
|
|
|
14,667 |
|
|
Shareholders’ equity |
|
|
210,751 |
|
|
|
4,416 |
|
|
|
259,736 |
|
|
|
(215,167 |
) |
|
|
259,736 |
|
|
Total liabilities and equity |
|
$ |
2,588,740 |
|
|
$ |
7,171 |
|
|
$ |
259,591 |
|
|
$ |
(262,923 |
) |
|
$ |
2,592,579 |
|
|
2014: |
|
|
|
|
|
|
|
|
|
|
|
|
|
|
|
|
|
|
|
|
|
Cash and cash equivalents |
|
$ |
29,585 |
|
|
$ |
3,750 |
|
|
$ |
5,722 |
|
|
$ |
(9,365 |
) |
|
$ |
29,692 |
|
|
Securities AFS |
|
|
138,270 |
|
|
|
— |
|
|
|
— |
|
|
|
— |
|
|
|
138,270 |
|
|
Loans, net |
|
|
1,156,021 |
|
|
|
221 |
|
|
|
— |
|
|
|
— |
|
|
|
1,156,242 |
|
|
Premises and equipment |
|
|
1,539 |
|
|
|
548 |
|
|
|
100 |
|
|
|
— |
|
|
|
2,187 |
|
|
FHLB Stock |
|
|
12,361 |
|
|
|
— |
|
|
|
— |
|
|
|
— |
|
|
|
12,361 |
|
|
Deferred taxes |
|
|
9,196 |
|
|
|
601 |
|
|
|
(49 |
) |
|
|
— |
|
|
|
9,748 |
|
|
REO |
|
|
334 |
|
|
|
— |
|
|
|
— |
|
|
|
— |
|
|
|
334 |
|
|
Goodwill and Intangibles |
|
|
197 |
|
|
|
— |
|
|
|
— |
|
|
|
— |
|
|
|
197 |
|
|
Other assets |
|
|
4,630 |
|
|
|
500 |
|
|
|
113,499 |
|
|
|
(112,236 |
) |
|
|
6,393 |
|
|
Total assets |
|
$ |
1,352,133 |
|
|
$ |
5,620 |
|
|
$ |
119,272 |
|
|
$ |
(121,601 |
) |
|
$ |
1,355,424 |
|
|
Deposits |
|
$ |
972,319 |
|
|
$ |
— |
|
|
$ |
— |
|
|
$ |
(9,365 |
) |
|
$ |
962,954 |
|
|
Borrowings |
|
|
263,000 |
|
|
|
— |
|
|
|
19,886 |
|
|
|
— |
|
|
|
282,886 |
|
|
Intercompany balances |
|
|
1,287 |
|
|
|
73 |
|
|
|
(1,360 |
) |
|
|
— |
|
|
|
— |
|
|
Other liabilities |
|
|
6,352 |
|
|
|
2,486 |
|
|
|
1,250 |
|
|
|
— |
|
|
|
10,088 |
|
|
Shareholders’ equity |
|
|
109,175 |
|
|
|
3,061 |
|
|
|
99,496 |
|
|
|
(112,236 |
) |
|
|
99,496 |
|
|
Total liabilities and equity |
|
$ |
1,352,133 |
|
|
$ |
5,620 |
|
|
$ |
119,272 |
|
|
$ |
(121,601 |
) |
|
$ |
1,355,424 |
|
102
FIRST FOUNDATION INC.
NOTES TO THE CONSOLIDATED FINANCIAL STATEMENTS (continued)
Years Ended December 31, 2015, 2014, and 2013
NOTE 21: QUARTERLY FINANCIAL INFORMATION (Unaudited)
|
(dollars in thousands, |
|
First |
|
|
Second |
|
|
Third |
|
|
Fourth |
|
|
Full Year |
|
|||||
|
Year Ended December 31, 2015: |
|
|
|
|
|
|
|
|
|
|
|
|
|
|
|
|
|
|
|
|
|
Interest income |
|
$ |
13,158 |
|
|
$ |
14,993 |
|
|
$ |
17,108 |
|
|
$ |
19,212 |
|
|
$ |
64,471 |
|
|
Interest expense |
|
|
1,287 |
|
|
|
1,569 |
|
|
|
1,647 |
|
|
|
1,778 |
|
|
|
6,281 |
|
|
Net interest income |
|
|
11,871 |
|
|
|
13,424 |
|
|
|
15,461 |
|
|
|
17,434 |
|
|
|
58,190 |
|
|
Provision for loan losses |
|
|
150 |
|
|
|
753 |
|
|
|
570 |
|
|
|
1,200 |
|
|
|
2,673 |
|
|
Noninterest income |
|
|
6,204 |
|
|
|
6,420 |
|
|
|
6,868 |
|
|
|
9,281 |
|
|
|
28,773 |
|
|
Noninterest expense |
|
|
13,358 |
|
|
|
13,974 |
|
|
|
16,956 |
|
|
|
17,170 |
|
|
|
61,458 |
|
|
Income before taxes on income |
|
|
4,567 |
|
|
|
5,117 |
|
|
|
4,803 |
|
|
|
8,345 |
|
|
|
22,832 |
|
|
Taxes on income |
|
|
1,941 |
|
|
|
2,175 |
|
|
|
2,041 |
|
|
|
3,297 |
|
|
|
9,454 |
|
|
Net income |
|
$ |
2,626 |
|
|
$ |
2,942 |
|
|
$ |
2,762 |
|
|
$ |
5,048 |
|
|
$ |
13,378 |
|
|
Income per share |
|
|
|
|
|
|
|
|
|
|
|
|
|
|
|
|
|
|
|
|
|
Basic |
|
$ |
0.33 |
|
|
$ |
0.36 |
|
|
$ |
0.22 |
|
|
$ |
0.32 |
|
|
$ |
1.20 |
|
|
Diluted |
|
$ |
0.32 |
|
|
$ |
0.35 |
|
|
$ |
0.21 |
|
|
$ |
0.31 |
|
|
$ |
1.16 |
|
|
Year Ended December 31, 2014: |
|
|
|
|
|
|
|
|
|
|
|
|
|
|
|
|
|
|
|
|
|
Interest income |
|
$ |
10,675 |
|
|
$ |
10,931 |
|
|
$ |
12,384 |
|
|
$ |
13,408 |
|
|
$ |
47,398 |
|
|
Interest expense |
|
|
925 |
|
|
|
1,115 |
|
|
|
1,237 |
|
|
|
1,307 |
|
|
|
4,584 |
|
|
Net interest income |
|
|
9,750 |
|
|
|
9,816 |
|
|
|
11,147 |
|
|
|
12,101 |
|
|
|
42,814 |
|
|
Provision for loan losses |
|
|
235 |
|
|
|
— |
|
|
|
— |
|
|
|
— |
|
|
|
235 |
|
|
Noninterest income |
|
|
5,551 |
|
|
|
6,416 |
|
|
|
6,737 |
|
|
|
6,045 |
|
|
|
24,749 |
|
|
Noninterest expense |
|
|
12,546 |
|
|
|
13,871 |
|
|
|
13,095 |
|
|
|
12,995 |
|
|
|
52,507 |
|
|
Income before taxes on income |
|
|
2,520 |
|
|
|
2,361 |
|
|
|
4,789 |
|
|
|
5,151 |
|
|
|
14,821 |
|
|
Taxes on income |
|
|
1,058 |
|
|
|
1,094 |
|
|
|
2,130 |
|
|
|
2,145 |
|
|
|
6,427 |
|
|
Net income |
|
$ |
1,462 |
|
|
$ |
1,267 |
|
|
$ |
2,659 |
|
|
$ |
3,006 |
|
|
$ |
8,394 |
|
|
Income per share |
|
|
|
|
|
|
|
|
|
|
|
|
|
|
|
|
|
|
|
|
|
Basic |
|
$ |
0.19 |
|
|
$ |
0.16 |
|
|
$ |
0.34 |
|
|
$ |
0.39 |
|
|
$ |
1.08 |
|
|
Diluted |
|
$ |
0.18 |
|
|
$ |
0.16 |
|
|
$ |
0.32 |
|
|
$ |
0.37 |
|
|
$ |
1.03 |
|
|
Year Ended December 31, 2013: |
|
|
|
|
|
|
|
|
|
|
|
|
|
|
|
|
|
|
|
|
|
Interest income |
|
$ |
9,004 |
|
|
$ |
10,350 |
|
|
$ |
9,524 |
|
|
$ |
10,303 |
|
|
$ |
39,181 |
|
|
Interest expense |
|
|
812 |
|
|
|
862 |
|
|
|
886 |
|
|
|
947 |
|
|
|
3,507 |
|
|
Net interest income |
|
|
8,192 |
|
|
|
9,488 |
|
|
|
8,638 |
|
|
|
9,356 |
|
|
|
35,674 |
|
|
Provision for loan losses |
|
|
622 |
|
|
|
686 |
|
|
|
445 |
|
|
|
642 |
|
|
|
2,395 |
|
|
Noninterest income |
|
|
4,533 |
|
|
|
5,210 |
|
|
|
5,088 |
|
|
|
4,993 |
|
|
|
19,824 |
|
|
Noninterest expense |
|
|
10,396 |
|
|
|
11,025 |
|
|
|
10,938 |
|
|
|
11,263 |
|
|
|
43,622 |
|
|
Income before taxes on income |
|
|
1,707 |
|
|
|
2,987 |
|
|
|
2,343 |
|
|
|
2,444 |
|
|
|
9,481 |
|
|
Taxes on income |
|
|
649 |
|
|
|
1,135 |
|
|
|
890 |
|
|
|
(1,044 |
) |
|
|
1,630 |
|
|
Net income |
|
$ |
1,058 |
|
|
$ |
1,852 |
|
|
$ |
1,453 |
|
|
$ |
3,488 |
|
|
$ |
7,851 |
|
|
Income per share |
|
|
|
|
|
|
|
|
|
|
|
|
|
|
|
|
|
|
|
|
|
Basic |
|
$ |
0.14 |
|
|
$ |
0.25 |
|
|
$ |
0.20 |
|
|
$ |
0.47 |
|
|
$ |
1.06 |
|
|
Diluted |
|
$ |
0.14 |
|
|
$ |
0.24 |
|
|
$ |
0.19 |
|
|
$ |
0.44 |
|
|
$ |
1.01 |
|
103
FIRST FOUNDATION INC.
NOTES TO THE CONSOLIDATED FINANCIAL STATEMENTS (continued)
Years Ended December 31, 2015, 2014, and 2013
NOTE 22: PARENT ONLY FINANCIAL STATEMENTS
BALANCE SHEETS
|
(dollars in thousands) |
|
December 31, |
|
|||||
|
|
|
2015 |
|
|
2014 |
|
||
|
ASSETS |
|
|
|
|
|
|
|
|
|
Cash and cash equivalents |
|
$ |
42,151 |
|
|
$ |
5,722 |
|
|
Premises and equipment, net |
|
|
112 |
|
|
|
100 |
|
|
Deferred taxes |
|
|
296 |
|
|
|
(49 |
) |
|
Investment in subsidiaries |
|
|
215,167 |
|
|
|
112,236 |
|
|
Intercompany receivable |
|
|
2,869 |
|
|
|
1,360 |
|
|
Other assets |
|
|
1,865 |
|
|
|
1,263 |
|
|
Total Assets |
|
$ |
262,460 |
|
|
$ |
120,632 |
|
|
LIABILITIES AND SHAREHOLDERS’ EQUITY |
|
|
|
|
|
|
|
|
|
Liabilities: |
|
|
|
|
|
|
|
|
|
Borrowings |
|
$ |
— |
|
|
$ |
19,886 |
|
|
Accounts payable and other liabilities |
|
|
2,724 |
|
|
|
1,250 |
|
|
Total Liabilities |
|
|
2,724 |
|
|
|
21,136 |
|
|
Shareholders’ Equity |
|
|
|
|
|
|
|
|
|
Common Stock |
|
|
16 |
|
|
|
8 |
|
|
Additional paid-in-capital |
|
|
227,262 |
|
|
|
78,204 |
|
|
Retained earnings |
|
|
33,762 |
|
|
|
20,384 |
|
|
Accumulated other comprehensive income (loss), net of tax |
|
|
(1,304 |
) |
|
|
900 |
|
|
Total Shareholders’ Equity |
|
|
259,736 |
|
|
|
99,496 |
|
|
Total Liabilities and Shareholders’ Equity |
|
$ |
262,460 |
|
|
$ |
120,632 |
|
INCOME STATEMENTS
|
(dollars in thousands) |
|
For the Year Ended |
|
|||||||||
|
|
|
2015 |
|
|
2014 |
|
|
2013 |
|
|||
|
Interest expense—borrowings |
|
$ |
674 |
|
|
$ |
740 |
|
|
$ |
219 |
|
|
Noninterest income—earnings from investment in subsidiaries |
|
|
15,801 |
|
|
|
11,050 |
|
|
|
9,883 |
|
|
Noninterest expense: |
|
|
|
|
|
|
|
|
|
|
|
|
|
Compensation and benefits |
|
|
1,152 |
|
|
|
1,096 |
|
|
|
613 |
|
|
Occupancy and depreciation |
|
|
191 |
|
|
|
141 |
|
|
|
66 |
|
|
Professional services and marketing costs |
|
|
1,669 |
|
|
|
2,469 |
|
|
|
1,120 |
|
|
Other expenses |
|
|
702 |
|
|
|
852 |
|
|
|
526 |
|
|
Total noninterest expense |
|
|
3,714 |
|
|
|
4,558 |
|
|
|
2,325 |
|
|
Income before taxes on income |
|
|
11,413 |
|
|
|
5,752 |
|
|
|
7,339 |
|
|
Taxes on income |
|
|
(1,965 |
) |
|
|
(2,642 |
) |
|
|
(512 |
) |
|
Net income |
|
$ |
13,378 |
|
|
$ |
8,394 |
|
|
|
7,851 |
|
104
FIRST FOUNDATION INC.
NOTES TO THE CONSOLIDATED FINANCIAL STATEMENTS (continued)
Years Ended December 31, 2015, 2014, and 2013
STATEMENTS OF COMPREHENSIVE INCOME
|
(dollars in thousands) |
|
For the Year Ended |
|
|||||||||
|
|
|
2015 |
|
|
2014 |
|
|
2013 |
|
|||
|
Net income |
|
$ |
13,378 |
|
|
$ |
8,394 |
|
|
$ |
7,851 |
|
|
Other comprehensive income (loss): |
|
|
|
|
|
|
|
|
|
|
|
|
|
Unrealized holding gains (losses) on securities arising during the period |
|
|
(3,746 |
) |
|
|
4,198 |
|
|
|
(2,668 |
) |
|
Other comprehensive income (loss) before tax |
|
|
(3,746 |
) |
|
|
4,198 |
|
|
|
(2,668 |
) |
|
Income tax (expense) benefit related to items of other comprehensive income |
|
|
1,542 |
|
|
|
(1,728 |
) |
|
|
1,098 |
|
|
Other comprehensive income (loss) |
|
|
(2,204 |
) |
|
|
2,470 |
|
|
|
(1,570 |
) |
|
Total comprehensive income |
|
$ |
11,174 |
|
|
$ |
10,864 |
|
|
$ |
6,281 |
|
STATEMENTS OF CASH FLOWS
|
(dollars in thousands) |
|
For the Year Ended |
|
|||||||||
|
|
|
2015 |
|
|
2014 |
|
|
2013 |
|
|||
|
Cash Flows from Operating Activities: |
|
|
|
|
|
|
|
|
|
|
||
|
Net income |
|
$ |
13,378 |
|
|
$ |
8,394 |
|
|
$ |
7,851 |
|
|
Adjustments to reconcile net income to net cash provided by (used in) operating activities: |
|
|
|
|
|
|
|
|
|
|
|
|
|
Earnings from investment in subsidiaries |
|
|
(15,801 |
) |
|
|
(11,050 |
) |
|
|
(9,883 |
) |
|
Stock–based compensation expense |
|
|
113 |
|
|
|
50 |
|
|
|
41 |
|
|
Deferred tax liability (benefit) |
|
|
(345 |
) |
|
|
(190 |
) |
|
|
579 |
|
|
Increase in other assets |
|
|
(602 |
) |
|
|
(652 |
) |
|
|
(46 |
) |
|
Increase (decrease) in accounts payable and other liabilities |
|
|
1,926 |
|
|
|
829 |
|
|
|
(828 |
) |
|
Net cash provided by (used in) operating activities |
|
|
(1,331 |
) |
|
|
(2,619 |
) |
|
|
(2,286 |
) |
|
Cash Flows from Investing Activities: |
|
|
|
|
|
|
|
|
|
|
|
|
|
Investment in subsidiaries |
|
|
(76,453 |
) |
|
|
(10,470 |
) |
|
|
(8,500 |
) |
|
Payment to shareholders of acquired companies |
|
|
(543 |
) |
|
|
— |
|
|
|
— |
|
|
Purchase of premises and equipment |
|
|
(12 |
) |
|
|
— |
|
|
|
(34 |
) |
|
Net cash used in investing activities |
|
|
(77,008 |
) |
|
|
(10,470 |
) |
|
|
(8,534 |
) |
|
Cash Flows from Financing Activities: |
|
|
|
|
|
|
|
|
|
|
|
|
|
Proceeds from borrowings |
|
|
10,114 |
|
|
|
15,000 |
|
|
|
7,500 |
|
|
Paydowns of borrowings |
|
|
(30,000 |
) |
|
|
(2,177 |
) |
|
|
(437 |
) |
|
Proceeds from the sale of stock, net |
|
|
136,163 |
|
|
|
949 |
|
|
|
6,322 |
|
|
Intercompany accounts, net decrease (increase) |
|
|
(1,509 |
) |
|
|
(255 |
) |
|
|
551 |
|
|
Net cash provided by financing activities |
|
|
114,768 |
|
|
|
13,517 |
|
|
|
13,936 |
|
|
Increase (decrease) in cash and cash equivalents |
|
|
36,429 |
|
|
|
428 |
|
|
|
3,116 |
|
|
Cash and cash equivalents at beginning of year |
|
|
5,722 |
|
|
|
5,294 |
|
|
|
2,178 |
|
|
Cash and cash equivalents at end of year |
|
$ |
42,151 |
|
|
$ |
5,722 |
|
|
$ |
5,294 |
|
105
None.
Disclosure Controls and Procedures
We maintain disclosure controls and procedures that are designed to ensure that information required to be disclosed in our reports under the Exchange Act is recorded, processed, summarized and reported within the time periods specified in the rules and forms of the SEC, and that such information is accumulated and communicated to our management, including our Chief Executive Officer and Chief Financial Officer, to allow timely decisions regarding required disclosure. In designing and evaluating our disclosure controls and procedures, our management recognized that any system of controls and procedures, no matter how well designed and operated, can provide only reasonable assurance of achieving the desired control objectives, as ours are designed to do, and management necessarily was required to apply its judgment in evaluating the cost-benefit relationship of possible controls and procedures.
As required by SEC rules, an evaluation was performed under the supervision and with the participation of the Chief Executive Officer and Chief Financial Officer of the effectiveness as of December 31, 2015, of the Company’s disclosure controls and procedures (as defined in Rules 13a-15(e) under the Exchange Act). Based on that evaluation, our Chief Executive Officer and Chief Financial Officer concluded that, as of December 31, 2015, the Company’s disclosure controls and procedures were effective to provide reasonable assurance that information required to be disclosed in the reports that we file under the Exchange Act is recorded, processed, summarized and reported within the time periods specified in the SEC’s rules and forms and that such information is accumulated and communicated to management, including our Chief Executive Officer and Chief Financial Officer, to allow timely decisions regarding required disclosure.
Changes in Internal Controls
There was no change in the Company’s internal control over financial reporting in 2015 that has materially affected, or is reasonably likely to materially affect, the Company’s internal control over financial reporting.
Internal Control Over Financial Reporting
Management’s Annual Report on Internal Control Over Financial Reporting
Management of First Foundation Inc. is responsible for establishing and maintaining adequate internal control over financial reporting as defined in Rules 13a-15(f) and 15d-15(f) under the Securities Exchange Act of 1934. Our internal control over financial reporting is a process designed to provide reasonable assurance regarding the reliability of financial reporting and the preparation of financial statements for external purposes in accordance with accounting principles generally accepted in the United States of America. Internal control over financial reporting includes those written policies and procedures that:
|
|
· |
pertain to the maintenance of records that, in reasonable detail, accurately and fairly reflect the transactions and dispositions of our assets; |
|
|
· |
provide reasonable assurance that transactions are recorded as necessary to permit preparation of financial statements in accordance with accounting principles generally accepted in the United States of America; |
|
|
· |
provide reasonable assurance that our receipts and expenditures are being made only in accordance with authorization of our management and board of directors; and |
|
|
· |
provide reasonable assurance regarding prevention or timely detection of unauthorized acquisition, use or disposition of assets that could have a material effect on our consolidated financial statements. |
Internal control over financial reporting includes the controls themselves, monitoring and internal auditing practices and actions taken to correct deficiencies as identified. Because of its inherent limitations, internal control over financial reporting may not prevent or detect misstatements. Also, projections of any evaluation of the effectiveness of such controls to future periods are subject to the risks that the controls may become inadequate because of changes in conditions or because the degree of compliance with the policies or procedures may deteriorate.
106
Management’s Assessment of Internal Control over Financial Reporting
Our management assessed the effectiveness of the Company’s internal control over financial reporting as of December 31, 2015, based on criteria for effective internal control over financial reporting described in “Internal Control – Integrated Framework” issued by the Committee of Sponsoring Organizations of the Treadway Commission. Management’s assessment included an evaluation of the design and the testing of the operational effectiveness of the Company’s internal control over financial reporting. Management reviewed the results of its assessment with the Audit Committee of our Board of Directors.
Based on that assessment, management determined that, as of December 31, 2015, the Company maintained effective internal control over financial reporting.
The foregoing report on internal control over financial reporting shall not be deemed “filed” for purposes of Section 18 of the Exchange Act or otherwise subject to the liabilities of that section.
Vavrinek, Trine, Day & Co. LLP, independent registered public accounting firm, which audited our consolidated financial statements for the fiscal year ended December 31, 2015 included in this Annual Report on Form 10-K, has audited the effectiveness of our internal control over financial reporting as of December 31, 2015, as stated in their report below.
107

REPORT OF INDEPENDENT REGISTERED PUBLIC ACCOUNTING FIRM
To the Board of Directors and Shareholders
First Foundation Inc. and Subsidiaries
Irvine, California
We have audited First Foundation, Inc. and Subsidiaries’ (the Company) internal control over financial reporting as of December 31, 2015, based on criteria established in Internal Control – Integrated Framework (2013) issued by the Committee of Sponsoring Organizations of the Treadway Commission (COSO). The Company’s management is responsible for maintaining effective internal control over financial reporting and for its assessment of the effectiveness of internal control over financial reporting included in the accompanying Management’s Report on Internal Control over Financial Reporting. Our responsibility is to express an opinion on the effectiveness of the Company’s internal control over financial reporting based on our audit.
We conducted our audit in accordance with the standards of the Public Company Accounting Oversight Board (United States). Those standards require that we plan and perform the audit to obtain reasonable assurance about whether effective internal control over financial reporting was maintained in all material respects. Our audit of internal control over financial reporting included obtaining an understanding of internal control over financial reporting, assessing the risk that a material weakness exists, and testing and evaluating the design and operating effectiveness of internal control based on the assessed risk. Our audit also included performing such other procedures as we considered necessary in the circumstances. We believe that our audit provides a reasonable basis for our opinion.
A company’s internal control over financial reporting is a process designed to provide reasonable assurance regarding the reliability of financial reporting and the preparation of financial statements for external purposes in conformity with U.S. generally accepted accounting principles. Because management's assessment and our audit were conducted to also meet the reporting requirement of Section 112 of the Federal Deposit Insurance Corporation Improvement Act (FDICIA), management's assessment and our audit of the company's internal control over financial reporting included controls over the preparation of financial statements in accordance with instructions to the consolidated Financial Statements for Bank Holding companies (Form FR Y-9C). A company’s internal control over financial reporting includes those policies and procedures that (1) pertain to the maintenance of records that (1) in reasonable detail, accurately and fairly reflect the transactions and dispositions of the assets of the company; (2) provide reasonable assurance that transactions are recorded as necessary to permit preparation of financial statements in accordance with U.S. generally accepted accounting principles, and the receipts and expenditures of the company are being made only in accordance with authorizations of management and directors of the company; and (3) provide reasonable assurance regarding prevention or timely detection of unauthorized acquisition, use, or disposition of the company’s assets that could have a material effect on the financial statements.
Because of its inherent limitations, internal control over financial reporting may not prevent or detect misstatements. Also, projections of any evaluation of effectiveness to future periods are subject to the risk that controls may become inadequate because of changes in conditions, or that the degree of compliance with the policies or procedures may deteriorate.
In our opinion, the Company maintained, in all material respects, effective internal control over financial reporting as of December 31, 2015, based on criteria established in Internal Control – Integrated Framework (2013) issued by the Committee of Sponsoring Organizations of the Treadway Commission (COSO).
We have also audited, in accordance with the standards of the Public Company Accounting Oversight Board (United States), the consolidated balance sheets of the Company as of December 31, 2015 and 2014 and the related consolidated statements of income, comprehensive income, changes in shareholders’ equity and cash flows for each of the three years in the period ended December 31, 2015, and our report dated March 15, 2016 expressed an unqualified opinion on those consolidated financial statements.

Laguna Hills, California
March 15, 2016

108
None.
109
Executive Officers and Directors
The following table sets forth the name, age and position with the Company of each of the persons who serve as directors and executive officers of the Company. The business address for all of these individuals is 18101 Von Karman Avenue, Suite 700, Irvine, California 92612.
|
Name |
|
Age |
|
Position |
|
Ulrich Keller, Jr., CFP |
|
59 |
|
Executive Chairman and Director |
|
Scott Kavanaugh |
|
55 |
|
Director, Vice Chairman of the Board and Chief Executive Officer |
|
John Hakopian |
|
47 |
|
President of FFA and Director |
|
James Brakke(1) |
|
73 |
|
Director |
|
Max Briggs, CFP(2)(3) |
|
50 |
|
Director |
|
Victoria Collins, Ph.D., CFP |
|
73 |
|
Director |
|
Warren Fix(2) |
|
77 |
|
Director |
|
Gerald Larsen, J.D., LL.M., CFP, CPA(1)(2) |
|
66 |
|
Director |
|
Mitchell Rosenberg, Ph.D.(1)(3) |
|
62 |
|
Director |
|
Jacob Sonenshine, J.D., CFA(3) |
|
45 |
|
Director |
|
David DePillo |
|
54 |
|
President of FFB |
|
John Michel |
|
56 |
|
Executive Vice President and Chief Financial Officer |
|
|
|
(1) |
Member of the compensation committee. |
|
(2) |
Member of the audit committee. |
|
(3) |
Member of the nominating and corporate governance committee. |
Seven of the Company’s ten directors have been determined to be independent directors, because they have not been employed nor have they received any compensation from the Company or any of its subsidiaries during the past three years, other than compensation for their service on the Board and on Board Committees. Those directors are Dr. Collins and Messrs. Brakke, Briggs, Fix, Larsen, Rosenberg and Sonenshine. Set forth below is a biographical summary of the experience of the members of our Board of Directors and our executive officers.
Directors
Ulrich Keller, Jr., CFP. Mr. Keller is one of the founders of the Company and currently is the Executive Chairman of FFI and its wholly-owned subsidiary, First Foundation Advisors (“FFA”). Mr. Keller served as Chief Executive Officer (“CEO”) of FFA from 1990, when it began operations as a fee-only investment advisor, until December 2009, at which time he became its Executive Chairman. In 2007, Mr. Keller became the Executive Chairman of FFI and from June 2007 until December 2009 he also served as the CEO of FFI. Mr. Keller earned a Bachelor of Science degree in Finance from San Diego State University and completed the financial planning program at the University of Southern California. Mr. Keller serves as a member of the University of California, Irvine (“UCI”) Foundation’s Finance & Investment Committee and serves as Co-Chair for the Center for Investment and Wealth Management at the Paul Merage School of Business at UCI. As one of the founders of the Company, who played a key role in the development and successful implementation of our business strategy of providing high quality and personalized wealth management and investment advisory services to our clients and the expansion of the financial services we offer our clients, Mr. Keller brings to the Board considerable knowledge and valuable insights about the wealth management and investment advisory business and the Southern California financial services market.
Scott Kavanaugh. Mr. Kavanaugh is, and since December 2009 has been the CEO of FFI, and from June 2007 until December 2009, he served as President and Chief Operating Officer of FFI. Mr. Kavanaugh has been the Vice- Chairman of FFI since June 2007. He also is, and since September 2007 has been, the Chairman and CEO of FFI’s wholly-owned banking subsidiary, First Foundation Bank (“FFB”). Mr. Kavanaugh was a founding shareholder and served as an Executive Vice President and Chief Administrative Officer and a member of the board of directors of Commercial Capital Bancorp, Inc., the parent holding company of Commercial Capital Bank. During his tenure as an executive officer and director of Commercial Capital Bancorp, Inc. that company became a publicly traded company, listed on NASDAQ, and its total assets grew to more than $1.7 billion. From 1998 until 2003, Mr. Kavanaugh served as the Executive Vice President and Chief Operating Officer and a director of Commercial Capital Mortgage. From
110
1993 to 1998, Mr. Kavanaugh was a partner and head of trading for fixed income and equity securities at Great Pacific Securities, Inc., a west coast-based regional securities firm. Mr. Kavanaugh earned a Bachelor of Science degree in Business Administration and Accounting at the University of Tennessee and a Masters of Business Administration (“MBA”) degree in Information Systems at North Texas State University. Mr. Kavanaugh is, and since 2008 has been, a member of the board of directors of Colorado Federal Savings Bank and its parent holding company, Silver Queen Financial Services, Inc. Since March 2015, Mr. Kavanaugh has served as director for Nexpoint Residential Trust Inc., a publicly traded real estate investment trust that is advised by NexPoint Real Estate Advisors, L.P. an affiliate of Highland Capital Management, L.P.. Mr. Kavanaugh also served as a member of the boards of directors of NexBank SSB and its parent holding company, NexBank Capital, Inc. from December 2013 until December 2015. From January 2000 until June 2012, Mr. Kavanaugh served as Independent Trustee and Chairman of the Audit Committee, and from June 2012 until December 2013 served as Chairman, of the Highland Mutual Funds, a mutual fund group managed by Highland Capital Management, L.P.. The Board believes that Mr. Kavanaugh’s extensive experience as an executive officer of banks and other financial services organizations, combined with his experience as a director of both public and private companies, qualifies him to serve as a member of our Board of Directors. In addition, because Mr. Kavanaugh is the Company’s Chief Executive Officer, the Board of Directors believes that his participation as a member of the Board facilitates communication between the outside Board members and management.
James Brakke. Mr. Brakke has served as a director of FFI since 2007. From 2001 until 2006 Mr. Brakke served as a director of Commercial Capital Bancorp, Inc. and from 2000 until 2006, Mr. Brakke served as a director of Commercial Capital Bank. Mr. Brakke is, and since 2001 has been, Executive Vice President and director of the Dealer Protection Group, an insurance brokerage firm that Mr. Brakke co-founded, which specializes in providing insurance products to the automobile industry. Mr. Brakke also serves as a salesperson for Brakke-Schafnitz Insurance Brokers, a commercial insurance brokerage and consulting firm that he co-founded and where he was President and Chairman from 1971 until 2009. Mr. Brakke currently serves as a director of Maury Microwave Corporation and as Chairman of Advanced Wellness and Lasers. Mr. Brakke earned a Bachelor of Science degree in Business and Finance from Colorado State University. Mr. Brakke’s experience as a director of Commercial Capital Bancorp, Inc. and its wholly owned banking subsidiary, Commercial Capital Bank is valuable to other independent member of the Company’s Board of Directors. Moreover, we believe Mr. Brakke’s extensive knowledge of the insurance industry provides valuable insight and support for our insurance operations.
Max Briggs, CFP. From 2005 to 2012, Mr. Briggs served as Chairman of the Board of DCB. He was elected as a director of the Company following our acquisition of DCB in August 2012. Mr. Briggs is, and since 1996 has been the President and CEO of FLC Capital Advisors, a wealth management firm with over $340 million of assets under administration. Mr. Briggs earned a Business Administration and Finance degree from Stetson University. We believe Mr. Briggs is a valuable member of our Board of Directors due to his knowledge of the banking business, gained from his service as Chairman of DCB, particularly as conducted in Palm Desert, California and its surrounding communities, where we have two of our wealth management offices, and his experience as President and CEO of a wealth management firm.
Victoria Collins, Ph.D. Dr. Collins is and has been a director of FFI since 2007. Beginning in 1990, Dr. Collins served as an executive officer of FFA, including as an Executive Vice President from 1990 until 2009 and as a Senior Managing Director from 2009, until her retirement in December 2011. Dr. Collins currently serves on the Dean’s Advisory Board as well as on the Executive Committee for the Center for Investment and Wealth Management at the Paul Merage School of Business at the University of California, Irvine. Dr. Collins earned a Bachelor’s of Administration degree in Psychology from San Diego State University, a Master of Arts degree in Educational Psychology from St. Mary’s College and a Doctor of Philosophy (or Ph.D.) degree in Cognitive Psychology from the University of California, Berkeley. Dr. Collins’ found that her knowledge of psychology was invaluable in her role as an executive officer and a senior wealth manager at FFA. We believe that the Board has found that Dr. Collins brings to the Board valuable insights about FFA’s business from her knowledge of and her experience in wealth management, and her management experience at FFA.
Warren Fix. Mr. Fix has served as a director of FFI since 2007. Mr. Fix is, and since 1992 has been, a partner in The Contrarian Group, a business investment and management company. From 1995 to 2008, Mr. Fix served in various management capacities and on the Board of Directors of WCH, Inc., formerly Candlewood Hotel Company. From 1989 to 1992, Mr. Fix served as President of the Pacific Company, a real estate investment and development company. From 1964 to 1989, Mr. Fix held numerous positions at the Irvine Company, including serving as its Chief Financial Officer (“CFO”) and a member of the executive committee of the board of directors. Mr. Fix currently serves as a director of Healthcare Trust of America, a publicly traded real estate investment trust, Clark Investment Group, Accel Networks and CT Realty. Mr. Fix earned a Bachelor of Administration degree from Claremont McKenna College. We believe Mr. Fix brings to the Board his knowledge of accounting, real estate and financial matters as a result of his long tenure as CFO of the Irvine Company and his experience as an independent director of both public and private companies.
John Hakopian. Mr. Hakopian is, and since April 2009 has been, the President of FFA and is and since 2007 has been a member of the Company’s Board of Directors. Mr. Hakopian was one of the founders of FFA in 1990, when it began its operations as
111
a fee-based investment advisor and served as its Executive Vice President and Co-Portfolio Manager from 1994 through April 2009. Mr. Hakopian earned a Bachelor of Arts degree in Economics from UCI and a MBA degree in Finance from the University of Southern California. Mr. Hakopian’s extensive knowledge of the Company’s wealth management and investment advisory business makes him a valuable member of the Board who is able to provide the outside Board members with insight in to the operations and risks of that business.
Gerald Larsen, J.D, LL.M, CFP, CPA. Mr. Larsen has served as a director of FFI since 2013 and as a director of FFB since 2008. Mr. Larsen is, and since 1992 has served as the President, Principal and owner of the law firm of Larsen & Risley, located in Costa Mesa, California. Mr. Larsen’s law practice focuses on federal and state taxation, probate, estate planning, partnerships and corporate law. Mr. Larsen earned a Bachelor of Science degree in Accounting from California State University, Northridge, a Juris Doctorate degree from the law school at Stetson University, in Florida, and an LL.M. degree from the University of Florida. We believe that Mr. Larsen’s extensive experience as a tax and estate planning lawyer provides the Board with valuable insights regarding the tax and estate planning aspects of wealth management.
Mitchell Rosenberg, Ph.D. Dr. Rosenberg has served as a director of FFI since 2007. Dr. Rosenberg is, and since 2005 has served as, President and founder of the consulting firm of M. M. Rosenberg & Associates, which provides executive and organizational development services to technology companies, health care businesses and public entities. From 2002 to 2005, Dr. Rosenberg was Chief Executive Officer for The Picerne Group, an international investment firm investing primarily in real estate, and portfolios of loans. Prior to 2002, Dr. Rosenberg served as Executive Vice President and Director of Business Services for Ameriquest Capital Corporation and directed the Human Resource and Organizational Development functions for Washington Mutual Bank, American Savings Bank and Great Western Bank. Dr. Rosenberg earned a Bachelor of Science degree in Psychology from Ohio University, a Masters of Science degree in Industrial Psychology from California State University, Long Beach, and a Ph.D. degree in Psychology with an emphasis on Organizational Behavior from Claremont Graduate University, which is the graduate university of the Claremont Colleges. We believe that Dr. Rosenberg’s educational and operational experience in managing the human resource and organizational development functions of a number of banking organizations and a real estate investment firm provides insight regarding the Company’s human resource functions, including compensation considerations that will impact the Company’s growth and expansion.
Jacob Sonenshine, J.D., CFA. Mr. Sonenshine has served as a director of FFI since 2007. Mr. Sonenshine is, and since 2012, has served as co-chief executive officer of Prell Restaurant Group, an operator of fast casual restaurants. From 2006 until 2012, Mr. Sonenshine served as the President and Chief Operating Officer of Professionals Retirement Strategy, a retirement planning and entity risk management firm. From 1999 to 2005, Mr. Sonenshine was President and co-founder of RSM EquiCo, an investment bank specializing in mergers and acquisitions of privately-held middle market companies. Mr. Sonenshine earned a Bachelor of Science degree in economics and a Bachelor of Administration degree in International Relations from the University of Pennsylvania, and a J.D. degree and a MBA degree from the University of Southern California. We believe Mr. Sonenshine’s experience as CEO of a retirement planning firm is valuable to the Board in overseeing FFA’s wealth management and investment advisory business.
The business address for each director and named executive officer listed is 18101 Von Karman Avenue, Suite 700, Irvine, California 92612.
Executive Officers
David DePillo. Mr. DePillo, is, and since May 2015 has been, the President of FFB. Mr. DePillo has more than 25 years of banking and investment management experience. He was most recently at Umpqua Bank, where he served as Executive Vice President from April 2014, following Umpqua’s acquisition of Sterling Savings Bank, until he left to join FFB. He joined Sterling Savings Bank in October 2010 as its chief credit officer and transitioned to chief lending officer in March 2012, until his appointment as Executive Vice President of Umpqua Bank. Previously, Mr. DePillo served as the vice chairman of the board of Fremont General Corporation, a financial services holding company, and of Fremont Investment & Loan, its wholly-owned bank subsidiary. From November 2007 to September 2009, he was the president of both companies. From 1999 through 2006, Mr. DePillo served as the vice chairman, president and chief operating officer of Commercial Capital Bancorp Inc. and its subsidiary companies.
John Michel. Mr. Michel, is, and since September 2007 has been, the Executive Vice President and CFO of the Company and FFB. Since January 2009, he has also served as the CFO of FFA. Mr. Michel served as the Chief Financial Officer of Sunwest Bank from February 2005 to October 2006 and of Fidelity Federal Bank from September 1998 to December 2001. Mr. Michel earned a Bachelor of Business Administration Accounting degree from the University of Notre Dame.
112
Corporate Governance and Board Matters
We are committed to having sound corporate governance principles, which are essential to running our business efficiently and maintaining our integrity in the marketplace.
Director Qualifications
We believe that our directors should have the highest professional and personal ethics and values, consistent with our longstanding values and standards. They should have broad experience at the policy-making level in business, government or banking. They should be committed to enhancing shareholder value and should have sufficient time to carry out their duties and to provide insight and practical wisdom based on experience. Their service on boards of other companies should be limited to a number that permits them, given their individual circumstances, to perform responsibly all director duties. Each director must represent the interests of all shareholders. When considering potential director candidates, our Board of Directors also considers the candidate’s character, judgment, diversity, age, skills, including financial literacy, and experience in the context of our needs and those of the Board of Directors.
Director Independence
Under the rules of the NASDAQ Stock Market, independent directors must comprise a majority of our Board of Directors. The rules of the NASDAQ Stock Market, as well as those of the SEC, also impose several other requirements with respect to the independence of our directors. Our Board of Directors has evaluated the independence of its members based upon the rules of the NASDAQ Stock Market and the SEC. Applying these standards, our Board of Directors has affirmatively determined that, with the exception of Mr. Kavanaugh, Mr. Keller, and Mr. Hakopian, each of our current directors is an independent director, as defined under the applicable rules.
Family Relationships
There is no family relationship between any director, executive officer or person nominated to become a director or executive director.
Board of Directors
Election of Directors
Our bylaws provide that our directors shall be elected at each annual meeting of shareholders but, if any such annual meeting is not held or the directors are not elected thereat, the directors may be elected at any special meeting of shareholders held for such purpose. All directors shall hold office until their respective successors are elected, subject to the DGCL and our bylaws with respect to vacancies on the Board of Directors. A vacancy on the Board of Directors shall be deemed to exist in case of the death, resignation, retirement, disqualification, or removal from office. Vacancies on the Board of Directors, unless otherwise required by law or by resolution of the Board of Directors, may be filled only by a majority vote of the directors then in office, though less than a quorum or, if there is only one director then in office, by such director (and in neither case by the stockholders). No decrease in the number of authorized directors shall shorten the term of any incumbent director.
Subject to the DGCL and our bylaws, each director shall be elected by the vote of the majority of the votes cast with respect to the director at any meeting for the election of directors at which a quorum is present, provided, however, that at any meeting of stockholders for which the secretary of the Company determines that the number of nominees exceeds the number to be elected as of the record date for such meeting, the directors shall be elected by vote of the plurality of the shares, present in person or represented by proxy and entitled to vote on the election of directors.
Appointment of Executive Officers
Our current and future executive officers and significant employees serve at the discretion of our Board of Directors, subject to any employment agreements under which any such officers may be employed.
Board Leadership Structure
The Chairman of our Board of Directors is Rick Keller who is a member of senior management. However, the Board of Directors has decided to separate the positions of Chairman and Chief Executive Officer because the Board of Directors believes that
113
doing so provides the appropriate leadership structure for us at this time, particularly since the separation of those two positions enables our Chief Executive Officer to focus on our day-to-day management of our business, while the Chairman leads the Board of Directors in the performance of its responsibilities.
The Board’s Role in Risk Oversight
The Board’s responsibilities in overseeing the Company’s management and business include oversight of the Company’s key risks and management processes and controls to manage them appropriately. Management, in turn, is responsible for the day-to-day management of risk and implementation of appropriate risk management controls and procedures.
The risk of incurring losses on the loans we make is an inherent feature of the banking business and, if not effectively managed, such risks can materially affect our results of operations. Accordingly, the Board, as a whole, exercises oversight responsibility over the processes that our management employs to manage those risks. The Board fulfills that oversight responsibility by:
|
|
· |
monitoring trends in the Company’s loan portfolio and the Company’s allowance for loan losses; |
|
|
· |
establishing internal limits related to the Company’s lending exposure and reviewing and determining whether or not to approve loans in amounts exceeding certain specified limits; |
|
|
· |
reviewing and discussing, at least quarterly and more frequently, if the Board deems necessary, reports from the FFB’s chief credit officer relating to such matters as (i) risks in the Company’s loan portfolio, (ii) economic conditions or trends that could reasonably be expected to affect (positively or negatively) the performance of the loan portfolio or require increases in the ALLL and (iii) specific loans that have been classified as “special mention,” “substandard” or “doubtful” and, therefore, require increased attention from management; |
|
|
· |
reviewing, at least quarterly, management’s determinations with respect to the adequacy of, and any provisions required to be made to replenish or increase, the ALLL; |
|
|
· |
reviewing management reports regarding collection efforts with respect to nonperforming loans; and |
|
|
· |
authorizing the retention of, and reviewing the reports of, external loan review consultants with respect to the risks in and the quality of the loan portfolio. |
Although risk oversight permeates many elements of the work of the full Board and its committees, the audit committee has direct and systematic responsibility for overseeing other significant risk management processes.
Committees of our Board of Directors
Our Board of Directors has three standing committees: an audit committee, a compensation committee, and a nominating and governance committee. The Board of Directors has adopted a written charter for each of those committees, and copies of those charters are available at the Investor Relations section of our website at www.ff-inc.com. In addition, from time to time, special committees may be established under the direction of our Board of Directors when necessary to address specific issues.
Audit Committee. We have an audit committee the members of which are Mr. Briggs, Mr. Fix and Mr. Larsen. Mr. Fix serves as chairman. The Board of Directors has determined that all of the members of the audit committee are independent within the meaning of the Listing Rules of the NASDAQ Stock Market and the enhanced independence requirements for audit committee members contained in Rule 10A-3 under the Exchange Act. Our Board of Directors also has determined that Mr. Fix and Mr. Briggs meet the definition of “audit committee financial expert” adopted by the SEC. The audit committee’s responsibilities include:
|
|
· |
Selecting and appointing the independent auditors, following the committee’s evaluation of their qualifications, and determining the compensation of the independent auditors; |
|
|
· |
overseeing the work of and monitoring and evaluating the independent auditors’ performance and independence and making all decisions with respect to the termination of the independent auditors; |
|
|
· |
reviewing all audit and non-audit services to be performed by the independent auditors, taking into consideration whether the provision of any non-audit services to us by the independent auditors is compatible with maintaining their independence; |
|
|
· |
reviewing and discussing with management and the independent auditors the annual and quarterly financial statements prior to their release; |
114
|
|
· |
establishing and overseeing procedures for the receipt, retention and treatment of complaints received by us regarding accounting, internal accounting controls or auditing matters, including procedures for the confidential, anonymous submission by our employees of questions or concerns regarding accounting or auditing matters; |
|
|
· |
investigating any matter brought to the audit committee’s attention within the scope of its duties and engaging independent counsel and other advisors as the audit committee deems necessary; |
|
|
· |
reviewing reports to management prepared by the internal audit function, as well as management’s responses; |
|
|
· |
reviewing and assessing the adequacy of the committee’s formal written charter on an annual basis; |
|
|
· |
reviewing and approving related party transactions for potential conflict of interest situations; and |
|
|
· |
overseeing such other matters that may be specifically delegated to the audit committee by our Board of Directors. |
The Audit Committee met nine times during 2015. The Audit Committee has a written charter that specifies its responsibilities, which include oversight of the Company’s financial reporting process and system of internal accounting controls, and appointment and oversight of the independent registered public accounting firm engaged to audit the Company’s financial statements. A copy of the Audit Committee charter will be provided, without charge, to any shareholder who sends a written request to the Chief Financial Officer of First Foundation Inc. at 18101 Von Karman Avenue, Suite 700 Irvine, CA. 92612.
Compensation Committee. We have a compensation committee the members of which are Mr. Brakke, Mr. Larsen and Mr. Rosenberg. Mr. Rosenberg serves as chairman. The Board of Directors has determined that all of the members of the compensation committee are independent under the applicable Listing Rules of the NASDAQ Stock Market. The compensation committee’s responsibilities include:
|
|
· |
developing, reviewing, and approving our management compensation programs, and regularly reporting to the full Board of Directors regarding the adoption and effectiveness of such programs; |
|
|
· |
developing, reviewing and approving our cash and equity incentive plans, including approving individual grants or awards thereunder, and regularly reporting to the full Board of Directors regarding the terms of such plans and individual grants or awards; |
|
|
· |
reviewing and approving individual and Company performance goals and objectives that may be relevant to the compensation of executive officers and other key management employees; |
|
|
· |
reviewing and approving the terms of any employment agreement, severance or change in control arrangements, or other compensatory arrangement with any executive officers or other key management employees; |
|
|
· |
reviewing and discussing with management the narrative discussion to be included in the annual proxy statements with respect to executive officer and director compensation; |
|
|
· |
reviewing and assessing, on an annual basis, the adequacy of its formal written charter; and |
|
|
· |
overseeing any other matters that may be specifically delegated to the compensation committee by our Board of Directors. |
The Compensation Committee met three times during 2015.
Nominating and Governance Committee. We have a nominating and governance committee, the members of which are Mr. Briggs, Mr. Rosenberg and Mr. Sonenshine. Mr. Rosenberg serves as chairman. The Board of Directors has determined that all of the members of the nominating and governance committee are independent under the Listing Rules of the NASDAQ Stock Market applicable to such committees. The nominating and governance committee’s responsibilities include:
|
|
· |
identifying and recommending nominees for election to the Board of Directors; |
|
|
· |
making recommendations to the Board of Directors regarding the directors to be appointed to each of its standing committees; |
|
|
· |
developing and recommending corporate governance guidelines for adoption by the Board of Directors; and |
|
|
· |
overseeing annual self-assessments by the directors of the performance of the Board and its committees. |
115
The Nominating and Governance Committee met once during 2015.
Compensation Committee Interlocks and Insider Participation
None of the members of our compensation committee have been an officer or employee of the Company or any of our subsidiaries. In addition, none of our executive officers serves or has served as a member of the board of directors or compensation committee (or other board committee performing equivalent functions) of any entity that has one or more executive officers serving as one of our directors or as one of the members of our compensation committee.
Codes of Business and Ethical Conduct
We have adopted a Code of Business and Ethical Conduct for our officers and employees and a Code of Conduct which contains specific ethical policies and principles that apply to our Chief Executive Officer, Chief Financial Officer, FFB Chief Operating Officer and other key accounting and financial personnel. A copy of our Code of Business and Ethical Conduct is accessible at the Investor Relations section of our website at www.ff-inc.com. We intend to disclose, at that same location on our website, any amendments to that Code and any waivers of the requirements of the Code of Conduct that may be granted to our Chief Executive Officer or Chief Financial Officer.
Section 16(a) Beneficial Ownership Reporting Compliance
Pursuant to Section 16(a) of the Exchange Act and the related rules and regulations, our directors and executive officers and any beneficial owners of more than 10% of any registered class of our equity securities, are required to file reports of their ownership, and any changes in the ownership, of our common stock with the SEC pursuant to Section 16(a) of the Exchange Act. To our knowledge, based solely on a review of copies of Section 16(a) reports furnished to us and on written representations from such reporting persons, during 2015, all of those persons complied with the Section 16(a) filing requirements, with the exception of the following reports:
|
|
· |
Mr. Gerald Larson, a director, was granted 519 restricted stock units on December 30, 2015, and a Form 4 was filed on January 6, 2016. |
|
|
· |
Mr. Max Briggs, a director, was granted 519 restricted stock units on December 30, 2015, and a Form 4 was filed on January 6, 2016. |
|
|
· |
Mr. Warren Fix, a director, was granted 519 restricted stock units on December 30, 2015, and a Form 4 was filed on January 6, 2016. |
|
|
· |
Mr. Jacob Sonenshine, a director, was granted 519 restricted stock units on December 30, 2015, and a Form 4 was filed on January 6, 2016. |
Named Executive Officers
Our “named executive officers” include our principal executive officer and our four other most highly compensated executive officers. For 2015, our named executive officers were:
|
|
● |
Ulrich E. Keller, Jr., who currently serves as our Executive Chairman, as well as a member of the Board of Directors. |
|
|
● |
Scott F. Kavanaugh, who currently serves as our Chief Executive Officer, as well as Vice Chairman and a member of the Board of Directors. Mr. Kavanaugh is our Principal Executive Officer. |
116
|
|
● |
John Hakopian, who currently serves as President of FFA, as well as a member of the Board of Directors. |
|
|
● |
David DePillo, who currently serves as President of FFB |
|
|
● |
John Michel, who currently serves as our Executive Vice President and Chief Financial Officer and the Executive Vice President and Chief Financial Officer of FFB and FFA. |
Summary Compensation Table
The following table sets forth, for our named executive officers, the compensation earned in the years ended December 31:
|
Name and Position |
|
Year |
|
|
Salary(2)(3) |
|
|
Non-Equity Incentive Compensation ($)(4)(5) |
|
|
Stock Awards (4)(5)(6)(7) |
|
|
Total |
|
||||||||
|
Ulrich E. Keller, Jr., Executive |
|
|
2015 |
|
|
$ |
500,000 |
|
|
$ |
200,000 |
|
$ |
— |
|
|
$ |
700,000 |
|
||||
|
Chairman of FFI and FFA |
|
|
2014 |
|
|
|
500,000 |
|
|
|
200,000 |
|
|
— |
|
|
|
700,000 |
|
||||
|
Scott F. Kavanaugh, Chief Executive |
|
|
|
|
|
|
|
|
|
|
|
|
|
|
|
|
|
|
|
||||
|
Officer of FFI and FFB, Vice |
|
|
2015 |
|
|
|
556,000 |
|
|
|
309,400 |
|
|
103,100 |
|
|
|
968,500 |
|
||||
|
Chairman of FFI, Chairman of FFB |
|
|
2014 |
|
|
|
556,000 |
|
|
|
412,500 |
|
|
— |
|
|
|
968,500 |
|
||||
|
John Hakopian, |
|
|
2015 |
|
|
|
425,000 |
|
|
|
170,000 |
|
|
— |
|
|
|
595,000 |
|
||||
|
President of FFA |
|
|
2014 |
|
|
|
425,000 |
|
|
|
170,000 |
|
|
— |
|
|
|
595,000 |
|
||||
|
David DePillo, President of FFB(1) |
|
|
2015 |
|
|
|
257,700 |
|
|
|
193,300 |
|
|
301,300 |
|
|
|
752,300 |
|
||||
|
John Michel, Chief Financial Officer |
|
|
2015 |
|
|
|
316,000 |
|
|
|
15,100 |
|
|
50,400 |
|
|
|
381,500 |
|
||||
|
Of FFI, FFB and FFA |
|
|
2014 |
|
|
|
316,000 |
|
|
|
201,500 |
|
|
— |
|
|
|
517,500 |
|
||||
|
|
|
|
|
||||||||||||||||||||
|
(1) |
Mr. DePillo commenced his employment with us on May 11, 2015. |
|
(2) |
Although Messrs. Keller, Kavanaugh and Hakopian are also directors of the Company, they do not receive any fees or other compensation for their service as directors. |
|
(3) |
Mr. Kavanaugh’s and Mr. Michel’s salaries include a $6,000 per year automobile allowance for use of his personal automobile. |
|
(4) |
For 2015 and 2014, the Board of Directors established annual target bonus awards for each of the named executive officers, the payment of which was made contingent on FFI generating earnings before taxes, of $22.8 million in 2015 and $17.5 million in 2014. In 2015, and in 2014, Messrs. Keller, Kavanaugh, Michel and Hakopian each received 100% of their target bonus awards, the respective amounts of which are set forth in this table. Because Mr. DePillo started after the year started, he was awarded his full bonus potential based upon a subjective evaluation by the Compensation Committee. |
(5) For Mr. Kavanaugh and Mr. Michel, 25% of their annual bonus for 2015 was paid to them in the form of restricted stock units (“RSU”). Therefore, on January 27, 2016, Mr. Kavanaugh received a grant of 4,635 RSUs and Mr. Michel received a grant of 2,265 RSUs under our 2015 Equity Incentive Plan. Each RSU, upon vesting, enables its holder to receive one of our common shares. One-third of these awards of RSUs vested immediately at grant date and one-third vests incrementally on each of the first and second anniversaries of the grant date subject to continued employment. Our closing share price on the date of this grant was $22.25.
|
(6) |
On May 11, 2015, Mr. DePillo was granted 15,900 RSUs under our 2007 Equity Incentive Plan as part of his initial compensation in connection with his hire. These RSUs vest in three equal installments on each of the first three anniversaries of the grant date subject to continued employment. Our closing share price on the date of this grant was $18.95. |
|
(7) |
This column reflects the dollar amount of the grant date fair value of an RSU award, computed in accordance with Financial Accounting Standards Board ("FASB") Accounting Standards Codification ("ASC") Topic 718, Stock Compensation. Generally, the grant date fair value is the amount that we would expense in our financial statements over the award’s vesting schedule. |
In addition to the compensation set forth in the table above, each named executive officer receives group health and life insurance benefits. Incidental job related benefits, including employer contributions under the Company’s 401k plan, totaled less than $10,000 for each of the named executive officers in 2015 and 2014.
Employment Agreements
Each of our named executive officers is employed under an employment agreement for a term ending on December 31, 2018. The employment agreements with each named executive officer are substantially the same.
Mr. Kavanaugh originally entered into an employment agreement with FFI and FFB on September 17, 2007 and this agreement was subsequently amended on December 31, 2009, December 28, 2012, August 31, 2013, and January 26, 2016. Mr. Keller and Mr. Hakopian originally entered into an employment agreements with FFA on September 17, 2007 and these agreements were subsequently amended on December 31, 2009, December 31, 2012, August 31, 2013, and January 26, 2016. Mr. Michel originally entered into an employment agreement with FFI, FFB and FFA on September 17, 2007 and this agreement was subsequently amended
117
on December 31, 2009, December 28, 2012, August 31, 2013, and January 26, 2016.Mr. DePillo entered into an employment agreement with FFB on May 11, 2015.
Set forth below are summaries of the material terms of those employment agreements. These summaries are not intended to be complete and are qualified in their entirety by reference to the employment agreements themselves.
Material Terms of the Employment Agreements
Salaries. The employment agreements currently provide for the payment of base annual salaries as follows: Mr. Keller: $500,000; Mr. Kavanaugh: $550,000; Mr. Hakopian: $425,000, Mr. DePillo: $257,700 and Mr. Michel: $310,000. Those salaries are subject to review and may be increased, but not reduced, by the Board of Directors in its discretion.
Participation in Incentive Compensation and Employee Benefit Plans. Each of the employment agreements provides that the named executive officer will be entitled to participate in any management bonus or incentive compensation plans adopted by the Board or its Compensation Committee and in any qualified or any other retirement plans, stock option or equity incentive plans, life, medical and disability insurance plans and other benefit plans which FFI and its subsidiaries may have in effect, from time to time, for all or most of its senior executives. Mr. DePillo’s agreement provides that he will have an annual target bonus of 75% of his then current base annual salary.
Termination and Severance Provisions. Each employment agreement provides that the named executive officer’s employment may be terminated by the Company with or without cause or due to his death or disability or by the named executive officer with or without good reason. In the event of a termination of the named executive officer’s employment by the Company without cause or by the named executive officer for good reason, the Company will become obligated to pay severance compensation to the named executive officer in an amount equal to 12 months of his annual base salary or the aggregate annual base salary that would have been paid to the named executive officer for the remainder of the term of his employment agreement if such remaining term is shorter than 12 months (the “Termination Benefits Period”). In addition, during the Termination Benefits Period or until the named executive officer obtains employment with another employer that offers comparable health insurance benefits, whichever period is shorter, the Company will be obligated to continue to provide any group health plan benefits to the extent authorized by and consistent with 29 U.S.C. § 1161 et seq. (commonly known as “COBRA”), subject to payment of premiums by the named executive officer at the active employee’s rate then in effect. The severance benefits will be reduced by severance benefits received under other severance or similar plans. Payments of the foregoing severance benefits amounts will be paid over the Termination Benefits Period in pro rata installments in accordance with our payroll practices.
The foregoing severance benefits are subject to the named executive officer executing an agreement that releases us and our affiliates from all legal claims. The named executive officer is also required to abide by customary confidentiality provisions and for eighteen months after his termination, the named executive officer may not solicit our employees or use trade secrets or confidential information to solicit current or prospective customers or to encourage customers, suppliers, vendors or service providers to terminate or modify their business relationship with us.
If the named executive officer’s employment is terminated due to his death then his estate shall receive a lump sum payment equal to his then annual base salary with payment occurring as soon as practicable after his death. If, during his employment, a named executive officer experiences a disability such that he cannot perform his essential job functions then we can only terminate his employment after the expiration of the lesser of six months or the remaining term in the employment agreement. During such period of time, the named executive officer shall continue to receive his annual base salary less any disability or sick pay that he is receiving along with continued participation in our employee benefits plans.
Cause/Good Reason Definitions. The employment agreements contain the following definitions with respect to determining whether/when a named executive officer is eligible for severance benefits.
“Cause” generally means the occurrence of any of the following by the named executive officer:
|
|
(i) |
acts of gross negligence, willful misconduct or insubordination and which involve us or our affiliates, or acts of fraud; |
(ii) violation of laws or government regulations which could subject us or our affiliates to disciplinary or enforcement action by a governmental agency, or which could adversely affect our or our affiliates’ reputation or goodwill;
(iii) acts which would constitute a felony or any misdemeanor involving moral turpitude, deceit, dishonesty or fraud;
(iv) failure to perform a substantial portion of the duties and responsibilities assigned or delegated to the named executive officer under this Agreement,
118
(v) breach of the material obligations under the employment agreement;
(vi) violation by Executive of any conflict of interest policy, ethical conduct policy or employment policy or a breach of his fiduciary duties;
(vii) the issuance of an order or directive by any government agency which requires the named executive officer to disassociate himself from us or an affiliates or which suspends his employment or requires him to terminate his employment; or
(viii) for Mr. Keller and Mr. Hakopian, the suspension or loss of, or a failure to maintain in full force and effect, any professional license or certification needed by the named executive officer which is needed to enable him to perform his responsibilities or duties; or
|
|
(ix) |
for Messrs. Kavanaugh, Michel and DePillo, the issuance of an order under Section 8(e)(4) or (g)(1) of the Federal Deposit Insurance Act requiring the named executive officer to be removed or permanently prohibited from participating in the conduct of our business. |
“Good Reason” generally means the occurrence of any of the following actions taken by us with respect to the named executive officer and without his consent:
|
|
(i) |
a material reduction in authority, duties or responsibilities; |
|
|
(ii) |
a material reduction in base salary or base compensation, unless such reduction is made as part of an across-the-board cost-cutting measure that is applied equally or proportionately to all senior executives; |
|
|
(iii) |
a relocation of the named executive officer’s principal place of employment to an office (other than our headquarters offices) located more than thirty (30) miles from his then principal place of employment; or |
|
|
(iv) |
a breach of our material obligations to the named executive officer under the employment agreement which breach continues uncured for a period of thirty (30) days following written notice from the named executive officer. |
The following conditions must be satisfied in order for the named executive officer to terminate his employment for Good Reason: (1) the named executive officer shall have given us a written notice of termination for Good Reason (a “Good Reason Termination Notice”) prior to the expiration of a period of fifteen (15) consecutive calendar days commencing on the date that the named executive officer is first notified in writing that we have taken a Good Reason action, (2) we have failed to rescind or cure the Good Reason action within thirty (30) consecutive calendar days following our receipt of the Good Reason Termination Notice, and (3) the Good Reason Termination Notice must expressly state that the named executive officer is terminating his employment for Good Reason and must describe in reasonable detail the Good Reason action that entitles him to terminate his employment for Good Reason.
Change of Control Agreements
The Company has entered into Change of Control Severance Agreements with each of its named executive officers (the “CC Agreements”). Messrs. Kavanaugh, Keller, Hakopian and Michel each entered into their respective CC Agreements on September 17, 2007 and Mr. DePillo entered into his CC Agreement on May 11, 2015.
The CC Agreements with each named executive officer are substantially the same and can be terminated by the Company upon three years advance written notice to the named executive officer. A CC Agreement will also terminate (without payment of severance benefits) in the event the named executive officer’s employment is terminated by the Company for Cause (as defined in the named executive officer’s employment agreement) or due to his death or disability or retirement, or by the named executive officer without Good Reason.
Each of the CC Agreements provides that if the Company undergoes a Change of Control while the named executive officer is still in the employ of the Company or one of its subsidiaries and, within the succeeding 12 months, the named executive officer terminates his employment due to the occurrence of a “Good Reason Event” then the named executive officer will become eligible to receive the following severance compensation (in lieu of severance benefits that could be provided under the named executive officer’s employment agreement):
|
|
(i) |
two times the sum of (1) his annual base salary as then in effect and (2) the maximum bonus compensation that the named executive officer could have earned under any bonus or incentive compensation plan in which he was then participating, if any; |
|
|
(ii) |
acceleration of the vesting of any then unvested stock options or restricted stock held by the named executive officer, and |
119
The foregoing severance benefits are conditioned upon the named executive officer executing documentation that releases us and our affiliates from all legal claims. Payment of the cash amount under clause (i) above shall be paid on the first business day after the end of the sixth calendar month after the named executive officer’s termination of employment if the Company is subject to the reporting requirements of the Securities Exchange Act of 1934 on the date of the named executive officer’s termination of employment. In all other cases, the payment will be due on the fifth business day after the named executive officer’s termination of employment. The severance benefits will be reduced to avoid the imposition of excise taxes under Internal Revenue Code Sections 280G and 4999 if the named executive officer would be better off an after-tax basis.
Change of Control/Good Reason Definitions. The CC Agreements contain the following definitions with respect to determining whether/when a named executive officer is eligible for severance benefits under the CC Agreements.
“Change of Control” generally means the occurrence of any of the following subject to certain exceptions:
|
|
(iv) |
a person who becomes the beneficial owner, directly or indirectly, of more than twenty-five percent (25%) of the Company’s voting securities subject to certain conditions; |
|
|
(v) |
a consolidation, merger, or reorganization of the Company with or into another person, or of another person with or into the Company, in which the holders of the Company’s outstanding voting securities immediately prior to the consummation of such consolidation, merger or reorganization would not, immediately after such consummation, own beneficially, directly or indirectly, (in the aggregate) at least sixty percent (60%) of the voting securities of (1) the continuing or surviving person in such merger, consolidation or reorganization (whether or not that is the Company) or (2) the ultimate parent, if any, of that continuing or surviving person; |
|
|
(vi) |
a consolidation, merger or reorganization of the Company’s subsidiary with or into another person, or of another person with or into the subsidiary, unless the persons that were the holders of the Company’s voting securities immediately prior to such consummation would have, immediately after such consolidation, merger or reorganization, substantially the same proportionate direct or indirect beneficial ownership of at least sixty (60%) of the voting securities of (1) the continuing or surviving person in such consolidation, merger or reorganization (whether or not that is the Subsidiary) or, (2) the ultimate parent, if any, of that continuing or surviving person; |
|
|
(vii) |
a sale, lease, exchange or other transfer (in one transaction or a series of transactions contemplated or arranged by any party as a single plan) of all or substantially all of the assets of the Company or of its subsidiary; |
|
|
(viii) |
the holders of the voting securities of the Company approve any plan or proposal for the liquidation or dissolution of the Company, unless the plan of liquidation provides for all or substantially all of the assets of the Company to be transferred to a person in which the holders of the Company’s voting securities immediately prior to such liquidation have or will have, immediately after such liquidation, substantially the same proportionate direct or indirect beneficial ownership of at least sixty percent (60%) of the voting securities of such person; or |
|
|
(ix) |
during any period of two (2) consecutive years during the term of the CC Agreement, individuals who at the beginning of that two year period constituted the entire Board of Directors do not, for any reason, constitute a majority thereof, unless the election (or the nomination for election) by the holders of the Company’s voting securities, of each director who was not a member of the Board of Directors at the beginning of that two year period was approved by a vote of at least two-thirds of the directors then still in office who were directors at the beginning of the two year period. |
“Good Reason” generally means the occurrence of any of the following actions taken by us with respect to the named executive officer and without his consent:
|
|
(i) |
The scope of named executive officer’s authority or responsibilities is significantly reduced or diminished or there is an change in his position or title as an officer of the Company or subsidiary, or both, that constitutes or would generally be considered to constitute a demotion; |
|
|
(ii) |
a reduction in base salary, unless such reduction is made as part of an across-the-board cost-cutting measure that is applied equally or proportionately to all senior executives; |
|
|
(iii) |
a significant reduction or discontinuation in the named executive officer's bonus and/or incentive compensation award opportunity unless it is applied equally or proportionately to all senior executives participating in the incentive plan or program; |
120
|
|
(iv) |
a significant reduction or discontinuation in the named executive officer's participation in any other benefit plan subject to certain exceptions; |
|
|
(v) |
a relocation of the named executive officer’s principal place of employment to an office (other than our headquarters offices) located more than thirty (30) miles from his then principal place of employment; or |
|
|
(vi) |
a breach of our material obligations to the named executive officer under either the employment agreement or CC Agreement which breach continues uncured for a period of thirty (30) days following written notice from the named executive officer. |
In order to resign his employment for Good Reason under the CC Agreement, the named executive officer must provide the Company with written notice of termination for Good Reason within 45 days of the occurrence of the applicable Good Reason event.
121
Outstanding Equity Awards at Fiscal Year End
The following table sets forth information regarding outstanding stock options and unvested RSUs held by each of our named executive officers as of December 31, 2015.
Outstanding Equity Awards at 2015 Fiscal Year End
|
|
|
Option Awards(1) |
|
|||||||||||||
|
Name / Grant Date |
|
Number of securities underlying unexercised options(#)(1) |
|
|
Number of securities underlying unexercised options (#) |
|
|
Option Exercise |
|
|
Option Expiration |
|
||||
|
Ulrich E. Keller, Jr. |
|
|
|
|
|
|
|
|
|
|
|
|
|
|
|
|
|
9/17/2007 |
|
|
40,500 |
|
|
|
— |
|
|
|
11.00 |
|
|
|
9/16/2017 |
|
|
1/27/2009 |
|
|
15,000 |
|
|
|
— |
|
|
|
16.50 |
|
|
|
1/26/2019 |
|
|
10/25/2011 |
|
|
40,000 |
|
|
|
— |
|
|
|
16.50 |
|
|
|
10/24/2021 |
|
|
Scott F. Kavanaugh |
|
|
|
|
|
|
|
|
|
|
|
|
|
|
|
|
|
9/17/2007 |
|
|
160,000 |
|
|
|
— |
|
|
|
10.00 |
|
|
|
9/16/2017 |
|
|
1/27/2009 |
|
|
20,000 |
|
|
|
— |
|
|
|
15.00 |
|
|
|
1/26/2019 |
|
|
10/25/2011 |
|
|
80,000 |
|
|
|
— |
|
|
|
15.00 |
|
|
|
10/24/2021 |
|
|
John Hakopian |
|
|
|
|
|
|
|
|
|
|
|
|
|
|
|
|
|
9/17/2007 |
|
|
40,500 |
|
|
|
— |
|
|
|
10.00 |
|
|
|
9/16/2017 |
|
|
1/27/2009 |
|
|
10,000 |
|
|
|
— |
|
|
|
15.00 |
|
|
|
1/26/2019 |
|
|
10/25/2011 |
|
|
40,000 |
|
|
|
— |
|
|
|
15.00 |
|
|
|
10/24/2021 |
|
|
John Michel |
|
|
|
|
|
|
|
|
|
|
|
|
|
|
|
|
|
9/17/2007 |
|
|
80,000 |
|
|
|
— |
|
|
|
10.00 |
|
|
|
9/16/2017 |
|
|
1/27/2009 |
|
|
7,000 |
|
|
|
— |
|
|
|
15.00 |
|
|
|
1/26/2019 |
|
|
10/25/2011 |
|
|
40,000 |
|
|
|
— |
|
|
|
15.00 |
|
|
|
10/24/2021 |
|
|
|
|
Stock Awards |
|
|||||
|
Name / Grant Date |
|
Number of shares or units of stock that have not vested(#) |
|
|
Market value of shares or units of stock that have not vested($)(4) |
|
||
|
Scott F. Kavanaugh |
|
|
|
|
|
|
|
|
|
1/27/2016 |
|
|
3,090 |
|
|
|
72,900 |
|
|
David DePillo |
|
|
|
|
|
|
|
|
|
5/11/2015 |
|
|
15,900 |
|
|
|
375,100 |
|
|
John Michel |
|
|
|
|
|
|
|
|
|
1/27/2016 |
|
|
1,510 |
|
|
|
35,600 |
|
|
|
|
(1) |
Stock options granted to the named executive officers generally incrementally vested over three years at the rate of one-third of the total number of shares subject to the option as of each of the first three anniversaries of the date of grant, provided that the executive was still employed by the Company on that anniversary date. |
|
(2) |
In accordance with the Company’s equity compensation plans, the per share exercise prices was equal to or greater than 100% of the fair market value of a Company share as of the respective grant dates. In accordance with Internal Revenue Code Section 422, the per share exercise price of incentive stock options granted to Mr. Keller was equal to 110% of the fair market value of a share of our common stock on the date of grant because Mr. Keller owned more than 10% of the outstanding common stock of the Company at the date of the grant. |
|
(3) |
The expiration date of each option award is ten years from the date of its grant, subject to earlier termination on a cessation of service with the Company. |
|
(4) |
The remaining RSUs for Messrs. Kavanaugh and Michel vest in equal installments on each of the first and second anniversaries of the grant date subject to continued employment. The RSUs for Mr. DePillo vest in three equal installments on each of the first three anniversaries of the grant date subject to continued employment. Market value is based on the closing share price of $23.59 for our common stock as of December 31, 2015 which was the last day of our fiscal year 2015. |
122
We believe that, although a portion of the compensation provided to our executives and other employees is subject to the achievement of specified financial performance criteria, our executive compensation program does not encourage excessive or unnecessary risk-taking. We do not believe that our compensation programs are reasonably likely to have a material adverse effect on us.
123
Only non-employee directors are entitled to receive compensation for service on the Board and committees of the Board. Each director receives an annual retainer of $45,000 plus annual equity grants with a grant date value of $25,000. The compensation each non-employee director received for their service on the Board and Board committees is set forth in the following table for the year ended December 31 2015:
|
Director Compensation |
||||||||||||
|
|
|
Fees Earned or Paid |
|
|
Stock Awards ($) |
|
|
Total ($) |
|
|||
|
James Brakke |
|
|
45,000 |
|
|
|
25,000 |
|
|
|
70,000 |
|
|
Max Briggs |
|
|
45,000 |
|
|
|
25,000 |
|
|
|
70,000 |
|
|
Victoria Collins |
|
|
45,000 |
|
|
|
25,000 |
|
|
|
70,000 |
|
|
Warren D. Fix |
|
|
45,000 |
|
|
|
25,000 |
|
|
|
70,000 |
|
|
Gerald Larsen |
|
|
45,000 |
|
|
|
25,000 |
|
|
|
70,000 |
|
|
Mitchell M. Rosenberg |
|
|
45,000 |
|
|
|
25,000 |
|
|
|
70,000 |
|
|
Jacob Sonenshine |
|
|
45,000 |
|
|
|
25,000 |
|
|
|
70,000 |
|
|
|
|
(1) |
On January 27, 2015, when our closing share price was $17.82 per share, each non-employee director received a grant of 701 RSUs. These vested on April 28, 2015. On, October 27, 2015, when our closing share price was $24.14, each non-employee director received a grant of 519 RSUs. These shares vested on December 30, 2015. This column reflects the aggregate dollar amount of the grant date fair value of these RSU awards, computed in accordance with FASB ASC Topic 718, Stock Compensation. Generally, the grant date fair value is the amount that we would expense in our financial statements over the award’s vesting schedule. |
Outstanding Equity Awards.
The following table sets forth information regarding outstanding stock options held by each non-employee director as of December 31, 2015.
Outstanding Equity Awards at 2015 Fiscal Year End
|
|
|
Option Awards(1) |
|
|||||||||||||
|
Name / Grant Date |
|
Number of securities underlying unexercised options(#) |
|
|
Number of securities underlying unexercised options (#) |
|
|
Exercise |
|
|
Expiration |
|
||||
|
James Brakke |
|
|
|
|
|
|
|
|
|
|
|
|
|
|
|
|
|
9/17/2007 |
|
|
15,000 |
|
|
|
— |
|
|
|
10.00 |
|
|
|
9/16/2017 |
|
|
1/27/2009 |
|
|
1,500 |
|
|
|
— |
|
|
|
15.00 |
|
|
|
1/26/2019 |
|
|
Max Briggs |
|
|
|
|
|
|
|
|
|
|
|
|
|
|
|
|
|
8/28/2012 |
|
|
15,000 |
|
|
|
— |
|
|
|
15.00 |
|
|
|
8/27/2022 |
|
|
Victoria Collins |
|
|
|
|
|
|
|
|
|
|
|
|
|
|
|
|
|
9/17/2007 |
|
|
40,500 |
|
|
|
— |
|
|
|
10.00 |
|
|
|
9/16/2017 |
|
|
1/27/2009 |
|
|
5,000 |
|
|
|
— |
|
|
|
15.00 |
|
|
|
1/26/2019 |
|
|
Warren D. Fix |
|
|
|
|
|
|
|
|
|
|
|
|
|
|
|
|
|
9/17/2007 |
|
|
15,000 |
|
|
|
— |
|
|
|
10.00 |
|
|
|
9/16/2017 |
|
|
1/27/2009 |
|
|
1,500 |
|
|
|
— |
|
|
|
15.00 |
|
|
|
1/26/2019 |
|
|
Gerald L. Larsen |
|
|
|
|
|
|
|
|
|
|
|
|
|
|
|
|
|
7/22/2008 |
|
|
10,000 |
|
|
|
— |
|
|
|
15.00 |
|
|
|
7/21/2018 |
|
|
1/27/2009 |
|
|
1,000 |
|
|
|
— |
|
|
|
15.00 |
|
|
|
1/26/2019 |
|
|
1/27/2011 |
|
|
— |
|
|
|
— |
|
|
|
— |
|
|
|
— |
|
|
Mitchell M. Rosenberg |
|
|
|
|
|
|
|
|
|
|
|
|
|
|
|
|
|
9/17/2007 |
|
|
15,000 |
|
|
|
— |
|
|
|
10.00 |
|
|
|
9/16/2017 |
|
|
1/27/2009 |
|
|
1,500 |
|
|
|
— |
|
|
|
15.00 |
|
|
|
1/26/2019 |
|
|
Jacob Sonenshine |
|
|
|
|
|
|
|
|
|
|
|
|
|
|
|
|
|
9/17/2007 |
|
|
15,000 |
|
|
|
— |
|
|
|
10.00 |
|
|
|
9/16/2017 |
|
|
1/27/2009 |
|
|
1,500 |
|
|
|
— |
|
|
|
15.00 |
|
|
|
1/26/2019 |
|
|
|
124
|
(2) |
In accordance with the Company’s equity compensation plans, the per share exercise price of these options were equal to or greater than 100% of the fair market value of a Company share as of the respective grant dates. |
|
(3) |
The expiration date of each option award is ten years from the date of its grant, subject to earlier termination on a cessation of service with the Company. |
125
Security Ownership of Certain Beneficial Owners and Management
The following table sets forth certain information with respect to the beneficial ownership of our common stock, as of March 11, 2016 for:
|
|
● |
each of our named executive officers; |
|
|
● |
each of our directors; |
|
|
● |
all our executive officers and directors as a group; and |
|
|
● |
each person, or group of affiliated persons, known by us to be the beneficial owner of more than 5% of our outstanding shares of our common stock. |
For purposes of the table below, the percentage ownership calculations for purposes of determining the beneficial ownership of our directors and executive officers are based on 16,016,326 shares of our common stock outstanding as of March 11, 2016.
Under the rules and regulations of the SEC, a person is deemed to be the beneficial owner of (i) shares with respect to which that person has, either alone or with others, the power to vote or dispose of those shares; and (ii) shares which that person may acquire on exercise of options or other rights to purchase shares of our common stock at any time during a 60 day period which, for purposes of this table, will end on May 10, 2016. The number of shares subject to options that are exercisable or may become exercisable during that 60 day period are deemed outstanding for purposes of computing the number of shares beneficially owned by, and the percentage ownership of, the person holding such options, but not for computing the percentage ownership of any other shareholder named in this table. Except as otherwise noted below, we believe that the persons named in the table have sole voting and dispositive power with respect to all shares shown as beneficially owned by them, subject to community property laws where applicable.
|
|
|
As of March 11, 2016(1) |
|
|||||
|
Name and Title |
|
Number of Shares |
|
|
Percent of |
|
||
|
Wellington Management Company, LLP 280 Congress Street, Boston, MA 02210 |
|
|
1,487,758 |
|
|
|
9.3 |
% |
|
Ulrich Keller, Jr., Executive Chairman |
|
|
1,396,085 |
(3) |
|
|
8.7 |
% |
|
Scott Kavanaugh, Vice Chairman and CEO |
|
|
691,012 |
|
|
|
4.2 |
% |
|
James Brakke, Director |
|
|
63,280 |
|
|
|
* |
|
|
Max Briggs, Director |
|
|
31,477 |
(4) |
|
|
* |
|
|
Victoria Collins, Director |
|
|
408,329 |
(5) |
|
|
2.5 |
% |
|
Warren Fix, Director |
|
|
82,737 |
(6) |
|
|
* |
|
|
John Hakopian, Director and President of FFA |
|
|
485,180 |
|
|
|
3.0 |
% |
|
Gerald Larsen, Director |
|
|
21,920 |
|
|
|
* |
|
|
Mitchell M. Rosenberg, Director |
|
|
34,220 |
|
|
|
* |
|
|
Jacob Sonenshine, Director |
|
|
40,720 |
|
|
|
* |
|
|
David DePillo, President of FFB |
|
|
344,785 |
|
|
|
2.2 |
% |
|
John M. Michel, EVP and Chief Financial Officer |
|
|
144,755 |
|
|
|
* |
|
|
|
|
|
|
|
|
|
|
|
|
All Directors and Executive Officers as a Group |
|
|
3,744,500 |
|
|
|
22.4 |
% |
|
|
|
* |
Represents less than one (1%) percent of the shares outstanding as of March 11, 2016. |
|
(1) |
This table is based upon information supplied to us by our officers, directors and principal shareholders. Except as otherwise noted, we believe that each of the shareholders named in the table has sole voting and investment power with respect to all shares of common stock shown as to which he or she is shown to be the beneficial owner, subject to applicable community property laws. The percentage ownership interest of each individual or group is based upon the total number of shares of the Company’s common stock outstanding plus the shares which the respective individual or group has the right to acquire within 60 days after March 11, 2016 through the exercise of stock options. |
|
(2) |
Includes shares that may be acquired within 60 days of March 11, 2016 pursuant to the exercise of stock options. Shares subject to options are as follows: Mr. Keller—95,500 shares; Mr. Kavanaugh—260,000 shares; Messrs. Brakke, Fix, Sonenshine and Dr. Rosenberg,—16,500 shares each; Mr. Briggs—15,000 shares; Dr. Collins—45,500 shares; Mr. Hakopian—90,500 shares; Mr. Larsen—11,000 shares; Mr. Michel—127,000 shares; and Directors and Executive Officers as a Group—710,500 shares. |
126
|
(3) |
Includes 100,000 shares beneficially owned by Mr. Keller’s wife, as to which he disclaims beneficial ownership. |
|
(4) |
Includes 3,000 shares beneficially owned by Mr. Briggs wife, as to which he disclaims beneficial ownership. |
|
(5) |
Includes 8,121 shares beneficially owned by Dr. Collins husband, as to which she disclaims beneficial ownership. |
|
(6) |
Includes 5,000 shares beneficially owned by Mr. Fix’s wife, as to which he disclaims beneficial ownership. |
The following table provides information as of December 31, 2015 regarding the Company’s Equity Plans:
|
|
|
Column (a) |
|
|
Column (b) |
|
|
Column (c) |
|
|||
|
Plan Category |
|
Number of |
|
|
Weighted- |
|
|
Number of |
|
|||
|
Equity compensation plans approved by |
|
|
1,357,417 |
|
|
$ |
12.71 |
|
|
|
737,271 |
|
|
Equity compensation plans not approved by shareholders |
|
|
— |
|
|
|
— |
|
|
|
— |
|
|
Total |
|
|
1,358,417 |
|
|
$ |
12.71 |
|
|
|
737,271 |
|
|
|
|
(1) |
Options are granted at an exercise price equal to or greater than the fair market value per share of our common stock on their respective dates of grant. |
In addition to the compensation arrangements with directors and executive officers described in “Executive Compensation” above, the following is a description of each transaction since January 1, 2014, and each proposed transaction in which:
|
|
● |
we have been or are to be a participant; |
|
|
● |
the amount involved exceeded or exceeds $120,000; and |
|
|
● |
any of our directors, executive officers or beneficial holders of more than 5% of our capital stock, or any immediate family member of or person sharing the household with any of these individuals (other than tenants or employees), had or will have a direct or indirect material interest. |
Ordinary Banking Relationships
FFB has had, and in the future may have, banking transactions in the ordinary course of its business with directors, principal shareholders and their associates, including the making of loans to directors and their associates. Such loans and other banking transactions were, and in the future will be, made on the same terms, including interest rates and collateral securing the loans, as those prevailing at the time for comparable transactions with persons of comparable creditworthiness who have no affiliation with the Company, FFB or any other subsidiaries of the Company and will be made only if they do not involve more than the normal risk of collectability and do not present any other unfavorable features at the times the loans are made.
Indemnification Agreements with our Directors and Officers
In connection with the reincorporation, and as permitted by the Delaware corporate law and as provided for by the Company’s bylaws, effective October 30, 2015, the Company entered into indemnification agreements with its directors and executive officers. Those indemnification agreements require the Company, among other things, (i) to indemnify its directors and officers against certain liabilities that may arise by reason of their status or service as directors or officers (other than liabilities arising from actions not taken in good faith or in a manner the indemnitee believed to be opposed to the best interests of the Company), (ii) to advance the expenses such directors or executive officers may incur as a result of or in connection with the defense of any proceeding brought against them as to which they could be indemnified, subject to an undertaking by the indemnified party to repay such
127
advances if it is ultimately determined that he or she is not entitled to indemnification, and (iii) to obtain officers’ & directors’ liability insurance if available on reasonable terms.
Procedures for Approval of Related Party Transactions
Transactions by FFI or FFB with related parties are subject to regulatory requirements and restrictions. These requirements and restrictions include Sections 23A and 23B of the Federal Reserve Act (which govern certain transactions by a bank with its affiliates) and the Federal Reserve’s Regulation O (which governs certain loans by FFB to its executive officers, directors, and principal shareholders). We have adopted policies to comply with these regulatory requirements and restrictions.
In addition our Board has adopted a written policy governing the approval of related party transactions that complies with all applicable SEC requirements. FFI’s related parties include directors (including any nominee for election as a director), executive officers, 5% shareholders and the immediate family members of these persons. Our Chief Financial Officer, in consultation with other members of management and outside counsel, as appropriate, will review potential related party transactions to determine if they are subject to the policy. If so, the transaction will be referred to the Board of Directors for approval. In determining whether to approve a related party transaction, the Board of Directors will consider, among other factors, the fairness of the proposed transaction to the Company, the direct or indirect nature of the related party’s interest in the transaction, the appearance of any improper conflict of interests for any director or executive officer, taking into account the size of the transaction and the financial position of the related party, whether the transaction would impair an outside director’s independence, the acceptability of the transaction to our regulators and any possible violations of other of our corporate policies.
Director Independence
Our Board of Directors has evaluated the independence of its members based on the definition of independence for purpose of Board membership and membership on the Board’s standing committees that are applicable to the Company because its shares are listed on the NASDAQ Stock Market. Based on that evaluation, our Board has concluded that (i) six of the ten members of the Board are independent: Messrs. Brakke, Briggs, Fix, Larsen, Rosenberg and Sonenshine, and (ii) all of the members of the Audit Committee, Compensation Committee and Nominating Committee are independent.
Audit and Non-Audit Services Pre-Approval Policy
The Audit Committee’s Charter provides that the Audit Committee must pre-approve services to be performed by the Company’s independent registered public accounting firm. In accordance with that requirement, the Audit Committee pre-approved the engagement of Vavrinek, Trine Day and Co. LLP, (“VTD”) pursuant to which it provided the services described below for the fiscal years ended December 31, 2015 and 2014.
Audit and Other Fees Paid in Fiscal Year 2015 and 2014
Aggregate fees for professional services rendered to the Company by VTD were as follows for the years ended December 31:
|
|
|
2015 |
|
|
2014 |
|
||
|
Audit services |
|
$ |
160,000 |
|
|
$ |
125,000 |
|
|
Audit related services |
|
|
— |
|
|
|
— |
|
|
Tax compliance services |
|
|
— |
|
|
|
— |
|
|
All other services |
|
|
30,000 |
|
|
|
18,200 |
|
|
Total |
|
$ |
190,000 |
|
|
$ |
143,200 |
|
Audit Services
In each of the years ended December 31, 2015 and 2014, VTD rendered audit services which consisted of the audit of the Company’s consolidated financial statements for the years then ended.
Audit Related Services
VTD did not render any other audit related services to us during 2015 or2014.
128
VTD did not render any tax compliance services to us during 2015 or 2014.
Other Services
In 2015, VTD provided comfort letters, consents, and assistance with and review of documents filed with the SEC in conjunction our successful (in 2015) and cancelled (in 2014) public offerings. No other services were provided in 2015 and 2014.
129
|
|
(a) |
Financial Statements, Financial Statement Schedules |
See page 66 for an index of the financial statements filed as part of this Annual Report on Form 10-K. No financial statement schedules are provided because the information called for is not required or is shown either in the financial statements or the notes thereto.
|
|
(b) |
Exhibits |
See the Index of Exhibits on page E-1 for a list of exhibits filed as part of this Annual Report on Form 10-K, which Index of Exhibits is incorporated herein by reference.
130
Pursuant to the requirements of Section 13 or 15(d) of the Securities Exchange Act of 1934, the registrant has duly caused this report to be signed on its behalf by the undersigned, thereunto duly authorized in Irvine California on March 15, 2016.
|
FIRST FOUNDATION INC. |
||
|
By: |
|
/S/ SCOTT F. KAVANAUGH |
|
|
|
Scott F. Kavanaugh, President and Chief Executive Officer |
POWER OF ATTORNEY
Each individual whose signature appears below constitutes and appoints Scott F. Kavanaugh, Ulrich E. Keller, Jr. and John M. Michel, and each of them, acting severally, his or her true and lawful attorneys-in-fact and agents with full power of substitution, for him or her and in his or her name, place and stead, in any and all capacities, to sign and file on his or her behalf and in each capacity stated below, all amendments and/or supplements to this Annual Report on Form 10-K, which amendments or supplements may make changes and additions to this Report as such attorneys-in-fact, or any of them, acting severally, may deem necessary or appropriate.
Pursuant to the requirements of the Securities Exchange Act of 1934, this Report on Form 10-K has been signed below by the following persons in the capacities and on the dates indicated.
|
SIGNATURE |
|
TITLE |
|
DATE |
|
/s/ SCOTT F. KAVANAUGH
Scott F. Kavanaugh |
|
Chief Executive Officer and Director (Principal Executive Officer) |
|
March 15, 2016 |
|
/s/ JOHN M. MICHEL
John M. Michel |
|
Chief Financial Officer (Principal Financial and Accounting Officer) |
|
March 15, 2016 |
|
/s/ ULRICH E. KELLER, JR.
Ulrich E. Keller, Jr. |
|
Chairman and Director |
|
March 15, 2016 |
|
/s/ JAMES BRAKKE
James Brakke |
|
Director |
|
March 15, 2016 |
|
/s/ MAX BRIGGS
Max Briggs |
|
Director |
|
March 15, 2016 |
|
/s/ VICTORIA COLLINS
Victoria Collins |
|
Director |
|
March 15, 2016 |
|
/s/ WARREN D. FIX
Warren D. Fix |
|
Director |
|
March 15, 2016 |
|
/s/ JOHN HAKOPIAN
John Hakopian |
|
Director |
|
March 15, 2016 |
|
/s/ GERALD L. LARSEN
Gerald L. Larsen |
|
Director |
|
March 15, 2016 |
|
/s/ MITCHELL M. ROSENBERG
Mitchell M. Rosenberg |
|
Director |
|
March 15, 2016 |
|
/s/ JACOB SONENSHINE
Jacob Sonenshine |
|
Director |
|
March 15, 2016 |
S-1
|
Exhibit No. |
|
Description |
|
2.1 |
|
Agreement and Plan of Merger, dated October 29, 2015, entered into by First Foundation Inc., a California corporation, and First Foundation Inc., a Delaware corporation, to effectuate the Delaware reincorporation (incorporated by reference to Exhibit 2.99 to the Company’s Current Report on Form 8-K, filed on October 29, 2015).
|
|
2.2 |
|
Agreement and Plan of Merger, dated November 25, 2014, by and among the Company, First Foundation Bank and Pacific Rim Bank (incorporated by reference to Exhibit 2.1 to the Company’s Current Report on Form 8-K, filed on December 1, 2014).
|
|
2.3 |
|
Agreement and Plan of Merger, as amended, by and among the Company, First Foundation Bank and Desert Commercial Bank, dated June 29, 2011, together with First, Second and Third Amendments thereto (incorporated by reference to Exhibit 10.10 to the Company’s Registration Statement on Form 10, filed on October 17, 2013).
|
|
3.1 |
|
Certificate of Incorporation of the Company (incorporated by reference to Exhibit 3.1 to the Company’s Current Report on Form 8-K, filed on October 29, 2015).
|
|
3.2 |
|
Bylaws of the Company (incorporated by reference to Exhibit 3.2 to the Company’s Current Report on Form 8-K, filed on October 29, 2015).
|
|
4.1 |
|
Specimen Certificate for Common Stock (incorporated by reference to Exhibit 4.1 to the Company’s Annual Report on Form 10-K/A, filed on August 3, 2015).
|
|
10.1(1) |
|
First Foundation Inc. 2007 Equity Incentive Plan (incorporated by reference to Exhibit 10.1 to the Company’s Registration Statement on Form 10, filed on October 17, 2013).
|
|
10.2(1) |
|
First Foundation Inc. 2007 Management Stock Incentive Plan (incorporated by reference to Exhibit 10.2 to the Company’s Registration Statement on Form 10, filed on October 17, 2013).
|
|
10.3(1) |
|
First Foundation Inc. 2015 Equity Incentive Plan (incorporated by reference to Exhibit 10.99 to the Company’s Registration Statement on Form S-8, filed on October 28, 2015).
|
|
10.4(1) (2) |
|
First Foundation Inc. Form of Restricted Stock Unit Agreement for 2015 Equity Incentive Plan.
|
|
10.5(1) (2) |
|
First Foundation Inc. Form of Stock Option Agreement for 2015 Equity Incentive Plan.
|
|
10.6(1) |
|
Form of Director and Officer Indemnification Agreement (incorporated by reference to Exhibit 10.99 to the Company’s Current Report on Form 8-K, filed on October 30, 2015).
|
|
10.7(1) |
|
Amended and Restated Employment Agreement, dated December 31, 2009, by and between the Company, First Foundation Advisors and Ulrich E. Keller, Jr., together with First and Second Amendments thereto (incorporated by reference to Exhibit 10.4 to the Company’s Registration Statement on Form 10, filed on October 17, 2013).
|
|
10.8(1) |
|
Amended and Restated Employment Agreement, dated December 31, 2009, by and between the Company, First Foundation Bank and Scott F. Kavanaugh, together with First and Second Amendments thereto (incorporated by reference to Exhibit 10.5 to the Company’s Registration Statement on Form 10, filed on October 17, 2013).
|
|
10.9(1) |
|
Amended and Restated Employment Agreement, dated December 31, 2009, by and between First Foundation Advisors and John Hakopian, together with First and Second Amendments thereto (incorporated by reference to Exhibit 10.6 to the Company’s Registration Statement on Form 10, filed on October 17, 2013).
|
|
10.10(1) |
|
Amended and Restated Employment Agreement, dated December 31, 2009, by and between First Foundation Bank and Dave Rahn, together with First and Second Amendments thereto (incorporated by reference to Exhibit 10.13 to the Company’s Annual Report on Form 10-K, filed on March 25, 2014).
|
E-1
|
Exhibit No. |
|
Description |
|
10.11(1) |
|
Amended and Restated Employment Agreement, dated December 31, 2009, by and between the Company, First Foundation Bank, First Foundation Advisors and John Michel, together with First and Second Amendments thereto (incorporated by reference to Exhibit 10.14 to the Company’s Annual Report on Form 10-K filed on March 25, 2014).
|
|
|
Employment Agreement, dated May 11, 2015, by and between First Foundation Bank and David DePillo (incorporated by reference to Exhibit 10.21 to the Company’s Quarterly Report on Form 10-Q, filed on May 11, 2015).
|
|
|
10.13(1) |
|
Change of Control Agreement, dated September 17, 2007, by and between the Company and Ulrich E. Keller, Jr. (incorporated by reference to Exhibit 10.7 to the Company’s Registration Statement on Form 10, filed on October 17, 2013).
|
|
10.14(1) |
|
Change of Control Agreement, dated September 17, 2007, by and between the Company and Scott F. Kavanaugh (incorporated by reference to Exhibit 10.8 to the Company’s Registration Statement on Form 10, filed on October 17, 2013).
|
|
10.15(1) |
|
Change of Control Agreement, dated September 17, 2007, by and between the Company and John Hakopian (incorporated by reference to Exhibit 10.9 to the Company’s Registration Statement on Form 10, filed on October 17, 2013).
|
|
10.16(1) |
|
Change of Control Agreement, dated September 17, 2007, by and between the Company and Dave Rahn (incorporated by reference to Exhibit 10.15 to the Company’s Annual Report on Form 10-K, filed with the Commission on March 25, 2014).
|
|
10.17(1) |
|
Change of Control Agreement, dated September 17, 2007, by and between Keller Financial Group (predecessor of the Company) and John Michel (incorporated by reference to the Exhibit 10.16 to the Company’s Annual Report on Form 10-K, filed on March 25, 2014).
|
|
10.18(1) |
|
Change of Control Agreement, dated May 11, 2015, by and between the Company and David DePillo (incorporated by reference to Exhibit 10.22 to the Company’s Quarterly Report on Form 10-Q, filed on May 11, 2015).
|
|
10.19 |
|
Earn-Out Agreement, dated August 15, 2012, entered into pursuant to the Agreement and Plan of Merger with Desert Commercial Bank, by and between the Company and Desert Commercial Bank (incorporated by reference to Exhibit 10.11 to the Company’s Registration Statement on Form 10, filed on October 17, 2013).
|
|
10.20 |
|
Loan Agreement, dated April 19, 2013, by and between First Foundation Bank, as borrower, and NexBank SSB, as lender, together with the Company’s Promissory Note and a Security Agreement entered into by the Company pursuant to the Loan Agreement (incorporated by reference to Exhibit 10.12 to the Company’s Registration Statement on Form 10, filed on October 17, 2013).
|
|
10.21 |
|
First Amendment to Loan Agreement with NexBank SSB (incorporated by reference to Exhibit 10.98 to the Company’s Current Report on Form 8-K, filed on March 27, 2014).
|
|
10.22 |
|
Amended & Restated Promissory Note issued by the Company to NexBank SSB pursuant to the First Amendment to Loan Agreement (incorporated by reference to Exhibit 10.99 to the Company’s Current Report on Form 8-K, filed on March 27, 2014).
|
|
10.23 |
|
Second Amendment to Loan Agreement with NexBank (incorporated by reference to Exhibit 10.98 to the Company’s Current Report on Form 8-K, filed on March 3, 2015.)
|
|
10.24 |
|
Second Amended & Restated Promissory Note issued to NexBank pursuant to the Second Amendment to Loan Agreement (incorporated by reference to Exhibit 10.99 to the Company’s Current Report on Form 8-K, filed on March 3, 2015).
|
|
14.1 |
|
Code of Conduct for the Chief Executive Officer and Other Senior Financial Officers (incorporated by reference to Exhibit 14.1 to the Company’s Annual Report on Form 10-K, filed on March 25, 2014).
|
|
21.1(2) |
|
Subsidiaries of the Registrant. |
|
23.1(2) |
|
Consent of Vavrinek, Trine, Day & Co., LLP, independent registered public accounting firm.
|
|
24.1 |
|
Power of Attorney (included on signature page of this Annual Report on Form 10-K).
|
E-2
(1)Management contract or compensatory plan.
(2)Filed herewith.
E-3