Attached files
| file | filename |
|---|---|
| EX-99.1 - EX-99.1 - PACIFIC MERCANTILE BANCORP | pmbc-2021q1pressrelease.htm |
| 8-K - 8-K - PACIFIC MERCANTILE BANCORP | pmbc-20210426.htm |

INVESTOR PRESENTATION A p r i l 2 6 , 2 0 2 1

FORWARD LOOKING STATEMENTS 2 This news presentation contains statements regarding our expectations, beliefs and views about our proposed merger with Banc of California, Inc. (“Banc of California”), our future financial performance and our business, trends and expectations regarding the markets in which we operate, and our future plans, including the credit exposure of certain loan products and other components of our business that could be impacted by the COVID-19 pandemic. Those statements constitute “forward-looking statements” within the meaning of Section 27A of the Securities Act of 1933, as amended, and Section 21E of the Securities Exchange Act of 1934, as amended, can be identified by the fact that they do not relate strictly to historical or current facts. Often, they include words such as “believe,” “expect,” “anticipate,” “intend,” “plan,” “estimate,” “project,” or words of similar meaning, or future or conditional verbs such as “will,” “would,” “should,” “could,” or “may”. Forward-looking statements are based on current information available to us and our assumptions about future events over which we do not have control. Moreover, our business and our markets are subject to a number of risks and uncertainties which could cause our actual financial performance in the future, and the future performance of our markets (which can affect both our financial performance and the market prices of our shares), to differ, possibly materially, from our expectations as set forth in the forward-looking statements contained in this news release. In addition to the risk of incurring loan losses, which is an inherent risk of the banking business, these risks and uncertainties include, but are not limited to, the following: the possibility that the merger does not close when expected or at all because required regulatory, shareholder or other approvals, financial tests or other conditions to closing are not received or satisfied on a timely basis or at all; changes in Banc of California’s or our stock price before closing, including as a result of the companies’ financial performance prior to closing, general stock market movements, and the performance of other financial companies and peer group companies; the risk that the anticipated benefits of the merger may not be fully realized or may take longer to realize than expected, including as a result of changes in general economic and market conditions, interest and exchange rates, monetary policy, laws and regulations and their enforcement, and the degree of competition in the geographic and business areas in which Banc of California and we operate; Banc of California’s ability to promptly and effectively integrate our businesses following the merger; the reaction to the transaction of the companies’ customers, employees and counterparties; diversion of management time on merger-related issues; deteriorating economic conditions and macroeconomic factors such as unemployment rates and the volume of bankruptcies, as well as changes in monetary, fiscal or tax policy to address the impact of COVID-19, any of which could cause us to incur additional loan losses and adversely affect our results of operations in the future; the risk that the credit quality of our borrowers declines; potential declines in the value of the collateral for secured loans; the risk that steps we have taken to strengthen our overall credit administration are not effective; the risk that our interest margins and, therefore, our net interest income will be adversely affected by changes in prevailing interest rates; the risk that we will not succeed in further reducing our remaining nonperforming assets, in which event we would face the prospect of further loan charge-offs and write-downs of other real estate owned and would continue to incur expenses associated with the management and disposition of those assets; the risk that we will not be able to manage our interest rate risks effectively, in which event our operating results could be harmed; the prospect that government regulation of banking and other financial services organizations will increase, causing our costs of doing business to increase and restricting our ability to take advantage of business and growth opportunities; the risk that our efforts to develop a robust commercial banking platform may not succeed; and the risk that we may be unable to realize our expected level of increasing deposit inflows. Many of the foregoing risks and uncertainties are, and will be, exacerbated by the COVID-19 pandemic and any worsening of the global business and economic environment as a result. Readers of this presentation are encouraged to review the additional information regarding these and other risks and uncertainties to which our business is subject that are contained in our Annual Report on Form 10-K, as amended, for the year ended December 31, 2020 which is on file with the Securities and Exchange Commission (the “SEC”). Additional information is set forth in our Quarterly Report on Form 10-Q for the three months ended March 31, 2021, which we plan to file with the SEC on May 7, 2021, and readers of this presentation are urged to review the additional information that is contained in that report. Due to these and other risks and uncertainties to which our business is subject, you are cautioned not to place undue reliance on the forward-looking statements contained in this presentation, which speak only as of its date, or to make predictions about our future financial performance based solely on our historical financial performance. We disclaim any obligation to update or revise any of the forward-looking statements as a result of new information, future events or otherwise, except as may be required by law.

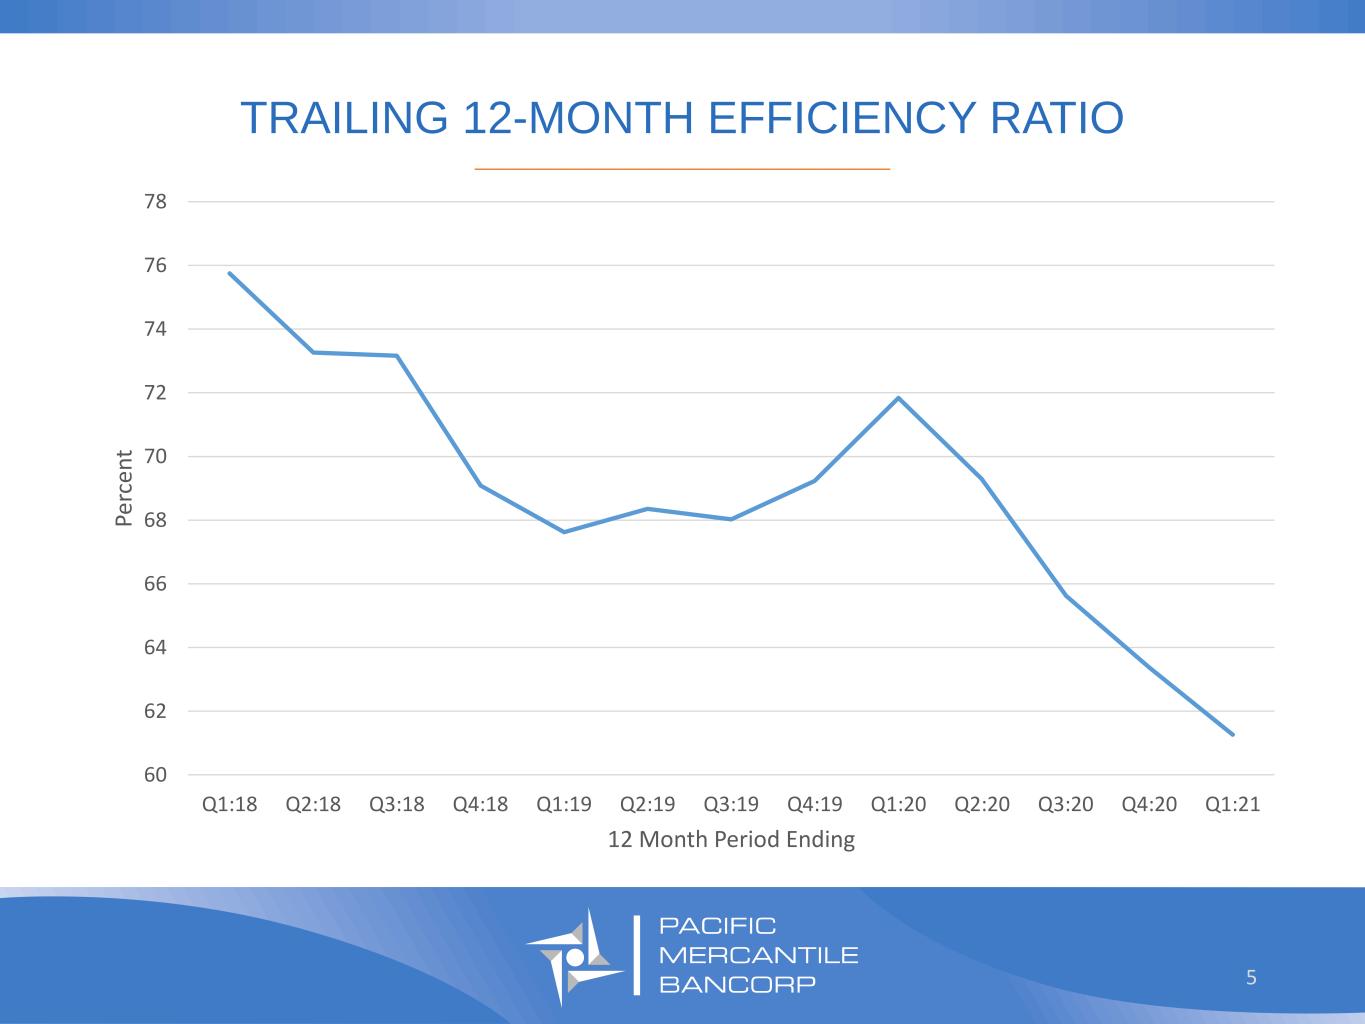
FIRST QUARTER 2021 SUMMARY _________________________________ 3 Net income of $3.4 million, or $0.14 per fully diluted share Improved asset quality resulted in no provision expense in 1Q21 Nonaccrual loans decreased by 49% Classified assets decreased by 30% ALLL/total loans at 1.38% and ALLL/total loans excluding PPP at 1.78% Improvement in efficiency ratio to 66.8% from 77.3% in 1Q20 driven by higher revenue and disciplined cost control NIM expanded 12 bps to 3.43% due primarily to continued decline in our cost of funds Continued improvement in deposit mix – non-maturity deposits represent 85.6% of total deposits Signed definitive agreement to merge with Banc of California, Inc. (BANC)

PMBC LTM STOCK PRICE TREND _________________________________ 4 $3.00 $4.00 $5.00 $6.00 $7.00 $8.00 $9.00 $10.00 BANC merger announced 3/22/21

TRAILING 12-MONTH EFFICIENCY RATIO _________________________________ 5 60 62 64 66 68 70 72 74 76 78 Q1:18 Q2:18 Q3:18 Q4:18 Q1:19 Q2:19 Q3:19 Q4:19 Q1:20 Q2:20 Q3:20 Q4:20 Q1:21 P e rc e n t 12 Month Period Ending

“WELLNESS CHECKS” ON CLIENTS _________________________________ 6 Initial contacts with clients beginning in early February 2020 centered on supply chain impacts associated with China trade, extended client outreach regarding business impact of COVID-19 RYG* qualitative assessment regarding degree of impact on core clients, including rolling cash flow forecasts March 2021 review covered $833 million in total loan balances, or 85% of the loan portfolio (excluding PPP) 14% 42% 43% *Red rating related to those businesses that were heavily impacted, Yellow for those businesses that impact was moderate but acceptable, and Green for those businesses who were stable to positive. 7% 36% 57% Mar ‘20 Jun ‘20 10% 42% 48% 9% 35% 55% Sep ‘20 6% 26% 68% Dec ‘20 Heavy Moderate but Acceptable Stable to Positive Mar ‘21

“WELLNESS CHECKS” ON CLIENTS RYG by Loan Grade – 3/31/2021 _________________________________ 7 1% 22% 77% 15% 54% 31% 53% 32% 15% Pass Watch/Special Mention Classified

“WELLNESS CHECKS” ON CLIENTS RYG by Loan Type – 3/31/2021 _________________________________ 8 13% 31% 57% 3% 24% 73% C&I Commercial Real Estate* * CRE-Owner occupied, CRE-Non-owner occupied, Multifamily and Construction ** Dollar weighted average based upon LTV at origination LTV** of 61%

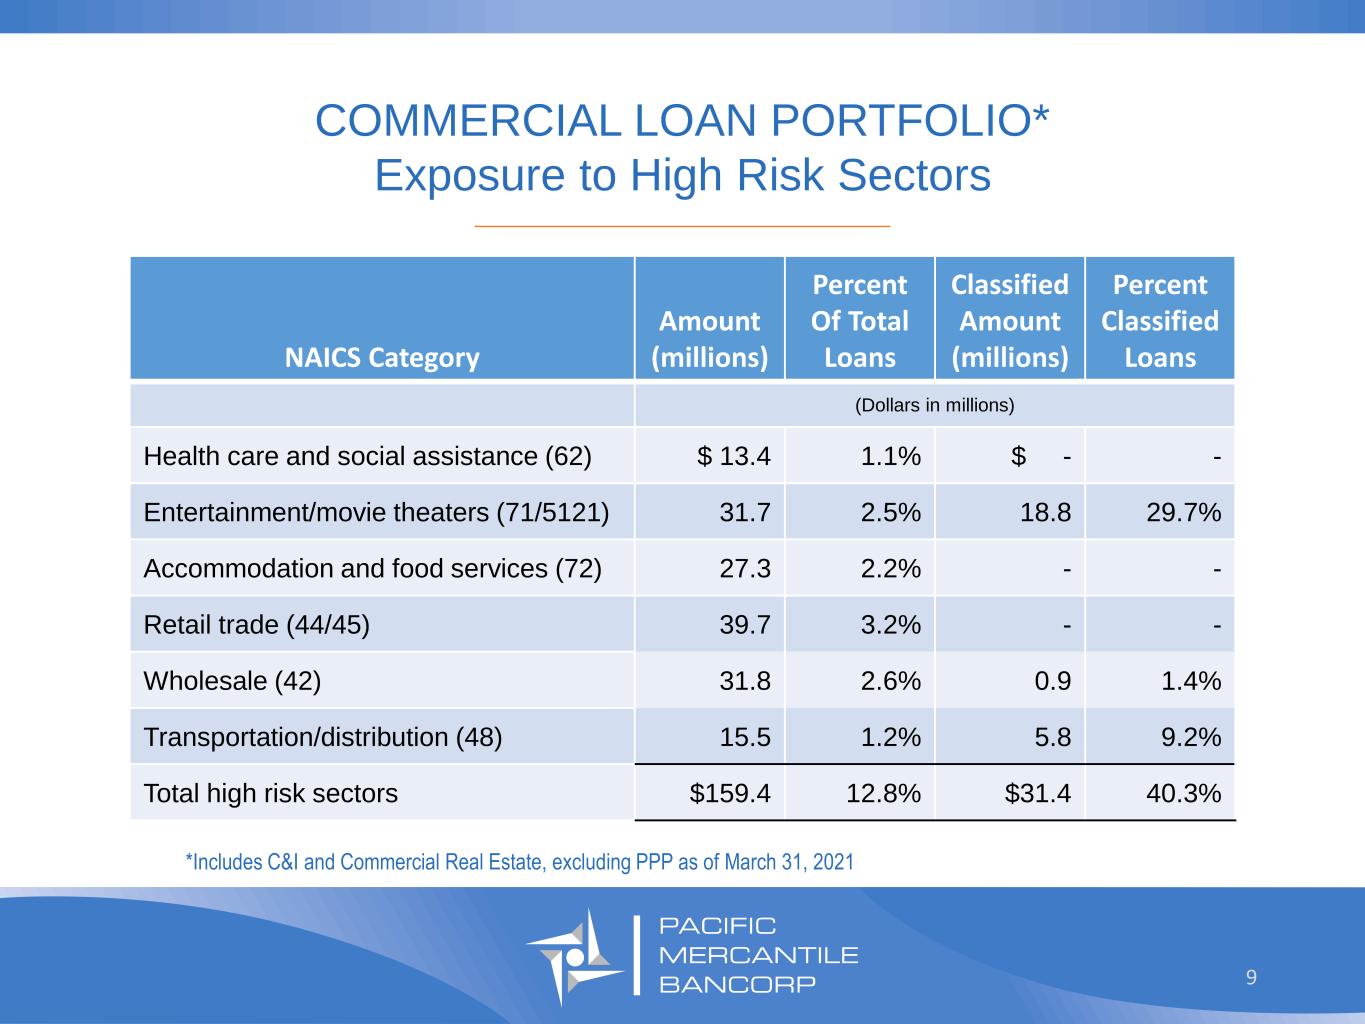
COMMERCIAL LOAN PORTFOLIO* Exposure to High Risk Sectors _________________________________ 9 *Includes C&I and Commercial Real Estate, excluding PPP as of March 31, 2021 NAICS Category Amount (millions) Percent Of Total Loans Classified Amount (millions) Percent Classified Loans (Dollars in millions) Health care and social assistance (62) $ 13.4 1.1% $ - - Entertainment/movie theaters (71/5121) 31.7 2.5% 18.8 29.7% Accommodation and food services (72) 27.3 2.2% - - Retail trade (44/45) 39.7 3.2% - - Wholesale (42) 31.8 2.6% 0.9 1.4% Transportation/distribution (48) 15.5 1.2% 5.8 9.2% Total high risk sectors $159.4 12.8% $31.4 40.3%

“WELLNESS CHECKS” ON CLIENTS RYG by COVID High Impact Industries – 3/31/2021 _________________________________ 10 100% Healthcare Retail Accommodation/Food ServiceEntertainment/Movie Theatres 20% 80% 43% 57% 64% 35% 1% 11% 45% 44% 3% 51% 45% Wholesale Transportation/Distribution

CURRENT* LOAN PAYMENT DEFERRALS By Loan Category _________________________________ 11 1st Deferral 2nd Deferral 3rd Deferral 4th Deferral Loan Category $ # $ # $ # $ # (Dollars in millions) Commercial & industrial $ - - $ 7.88 4 $7.27 7 - - Commercial real estate – owner occupied - - 4.15 1 - - 16.03 1 Consumer 0.06 1 0.30 1 0.07 1 - - Residential - - - - - - - - Totals $0.06 1 $12.33 6 $7.34 8 $16.03 1 * Loans under deferred payment status as of March 31, 2021

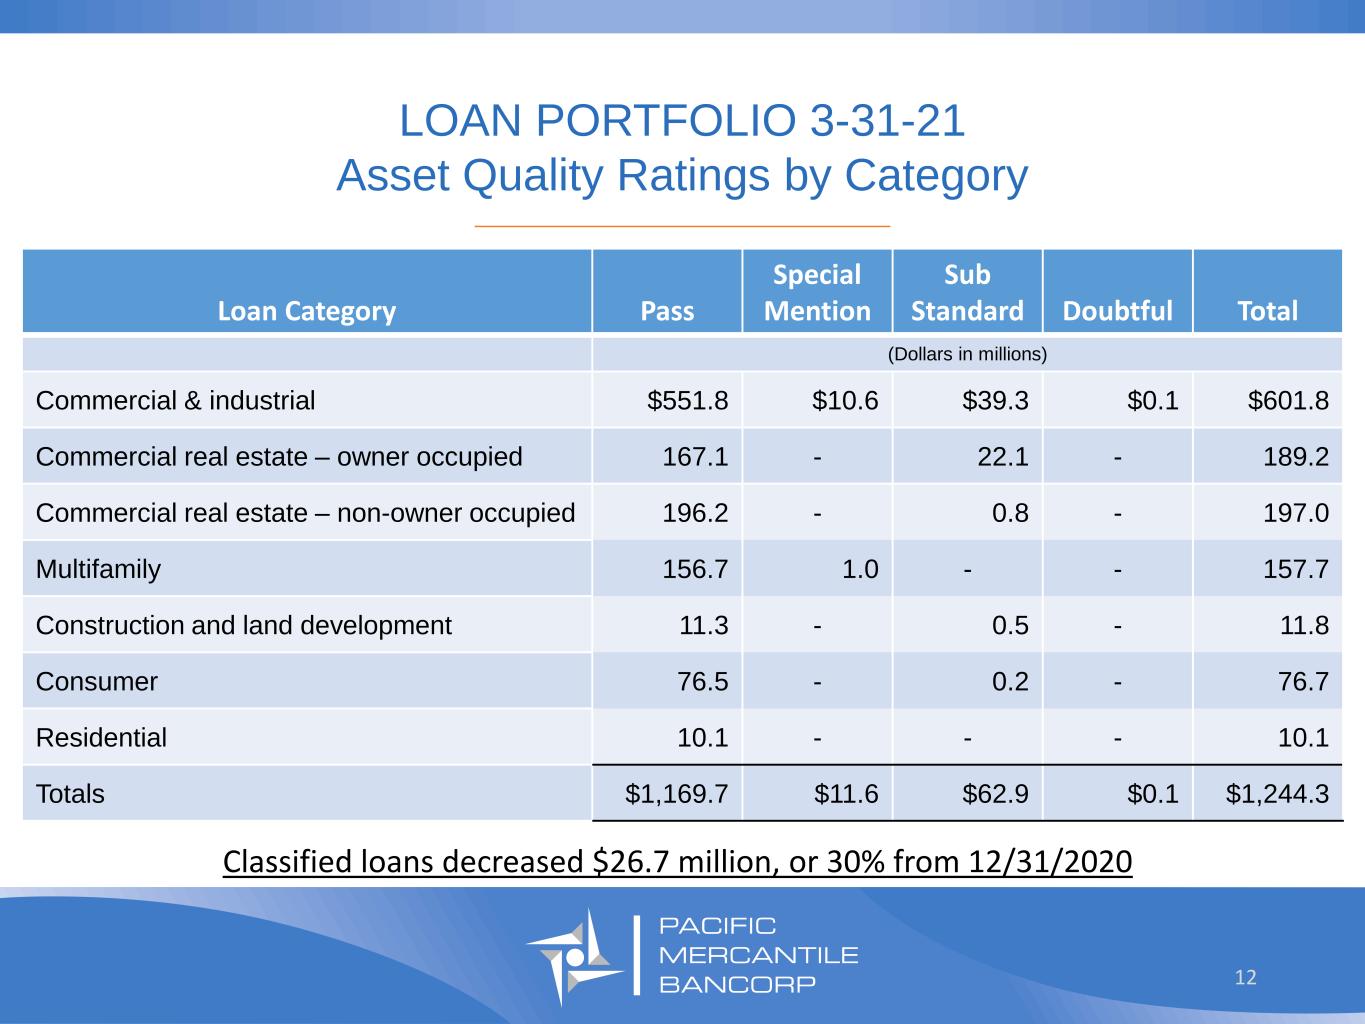
LOAN PORTFOLIO 3-31-21 Asset Quality Ratings by Category _________________________________ 12 Loan Category Pass Special Mention Sub Standard Doubtful Total (Dollars in millions) Commercial & industrial $551.8 $10.6 $39.3 $0.1 $601.8 Commercial real estate – owner occupied 167.1 - 22.1 - 189.2 Commercial real estate – non-owner occupied 196.2 - 0.8 - 197.0 Multifamily 156.7 1.0 - - 157.7 Construction and land development 11.3 - 0.5 - 11.8 Consumer 76.5 - 0.2 - 76.7 Residential 10.1 - - - 10.1 Totals $1,169.7 $11.6 $62.9 $0.1 $1,244.3 Classified loans decreased $26.7 million, or 30% from 12/31/2020

LOAN PORTFOLIO 3-31-21 Reserve Coverage by Category _________________________________ 13 Loan Category Balance Classified Reserve Reserve to Balance Reserve to Classified (Dollars in millions) Commercial & industrial (excluding PPP) $321.3 $39.4 $10.6 3.30% 26.92% Commercial real estate – owner occupied 189.2 22.1 1.8 0.94% 8.00% Commercial real estate – non-owner occupied 197.0 0.8 2.0 1.00% 252.41% Multifamily 157.7 - 0.7 0.46% - Construction and land development 11.8 0.5 0.1 1.40% - Consumer 76.7 0.2 1.6 2.09% 851.33% Residential 10.1 - .3 2.83% - Totals (excluding PPP) 963.8 63.0 17.1 1.78% 18.97% PPP (100% SBA guarantee) 280.5 - - - - Total gross loans $1,244.3 $63.0 $17.1 1.38% 18.97%

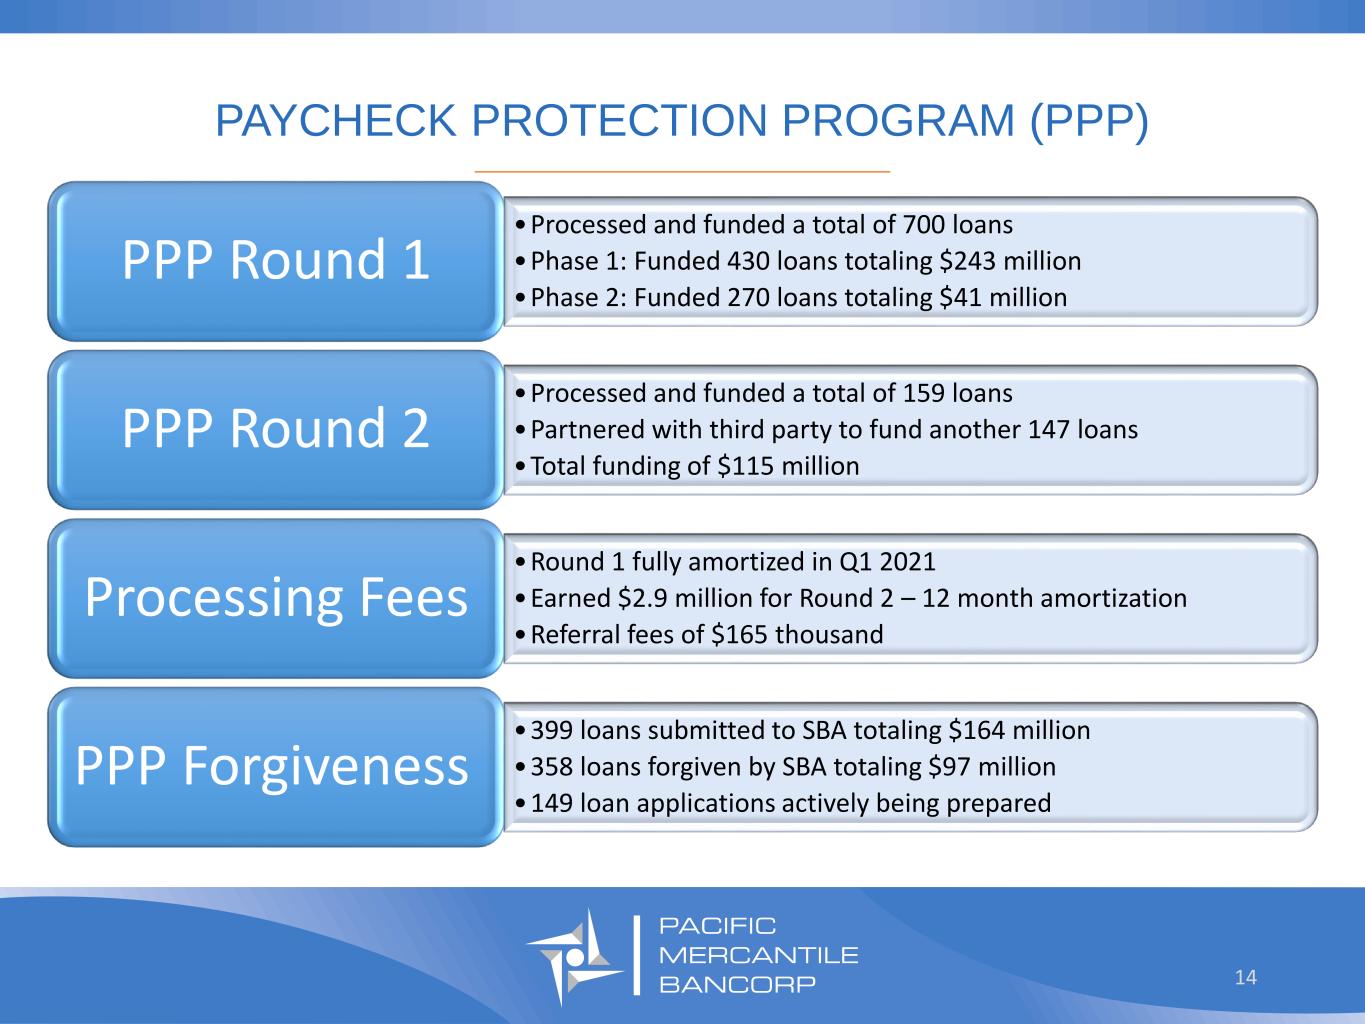
PAYCHECK PROTECTION PROGRAM (PPP) _________________________________ 14 •Processed and funded a total of 700 loans •Phase 1: Funded 430 loans totaling $243 million •Phase 2: Funded 270 loans totaling $41 million PPP Round 1 •Processed and funded a total of 159 loans •Partnered with third party to fund another 147 loans •Total funding of $115 million PPP Round 2 •Round 1 fully amortized in Q1 2021 •Earned $2.9 million for Round 2 – 12 month amortization •Referral fees of $165 thousand Processing Fees •399 loans submitted to SBA totaling $164 million •358 loans forgiven by SBA totaling $97 million •149 loan applications actively being prepared PPP Forgiveness

PAYCHECK PROTECTION PROGRAM (PPP) Forgiveness Process _________________________________ 15 28 205 3991 131 358 $24 $94 $164 $49 $97 $- $20 $40 $60 $80 $100 $120 $140 $160 $180 0 50 100 150 200 250 300 350 400 450 Sep '20 Dec '20 Mar '21 A m o u n t (i n m il li o n s) N u m b e r Cumulative PPP Loan Forgiveness Status – 3-31-2021 # Submitted # Forgiven $ Submitted $ Forgiven By dollar, 59% of PPP loans have been submitted to the SBA, 60% of which have been forgiven

STRONG CAPITAL POSITION AT BANK _________________________________ 0.0% 3.0% 6.0% 9.0% 12.0% 15.0% 18.0% COMMON EQUITY TIER 1 CAPITAL RATIO TIER 1 CAPITAL RATIO TOTAL CAPITAL RATIO 15.5% 15.5% 16.8% 6.5% 8.0% 10.0% PM BANK WELL-CAPITALIZED REQUIREMENT 16 As of March 31, 2021 Stock buy-backs on hold No dividends and none being considered Not adopting Community Bank Leverage Ratio Framework

STRONG LIQUIDITY POSITION AT BANK _________________________________ 17 As of March 31, 2021 $643 million of total available liquidity $298 million of primary liquidity and liquidity ratio of 21% Increased borrowing capacity for funding PPP loans Arranged for PPP loans to be pledged at Federal Reserve Participant in PPPLF-$230mm of additional availability Cash, $219 Unpledged Securities, $44 FHLB Capacity, $286 FRB Capacity, $94 In millions

I n v e s t o r R e l a t i o n s : C u r t C h r i s t i a n s s e n ( 7 1 4 ) 4 3 8 - 2 5 3 1 C u r t . c h r i s t i a n s s e n @ p m b a n k . c o m 16
