Attached files
Table of Contents
UNITED STATES
SECURITIES AND EXCHANGE COMMISSION
WASHINGTON, D.C. 20549
FORM 10-K
(Mark One)
| x | ANNUAL REPORT PURSUANT TO SECTION 13 OR 15(d) OF THE SECURITIES EXCHANGE ACT OF 1934 |
For the fiscal year ended December 31, 2010
OR
| ¨ | TRANSITION REPORT PURSUANT TO SECTION 13 OR 15(d) OF THE SECURITIES EXCHANGE ACT OF 1934 [FEE REQUIRED] |
For the transition period from to
Commission file number 0-30777
PACIFIC MERCANTILE BANCORP
(Exact name of Registrant as specified in its charter)
| California | 33-0898238 | |
| (State or other jurisdiction of incorporation or organization) |
(I.R.S. Employer Identification No.) |
| 949 South Coast Drive, Suite 300, Costa Mesa, California | 92626 | |
| (Address of principal executive offices) | (Zip Code) |
(714) 438-2500
(Registrant’s telephone number, including area code)
Securities registered pursuant to Section 12(b) of the Act: Common Stock, without par value
Securities registered pursuant to Section 12(g) of the Act: None
Indicate by check mark if the registrant is a well-known seasoned issuer, as defined in Rule 405 of the Securities Act. Yes ¨ No x.
Indicate by check mark if the registrant is not required to file reports pursuant to Section 13 of 15(d) of the Act. Yes ¨ No x.
Indicate by check mark whether the registrant (1) has filed all reports required to be filed by Section 13 or 15(d) of the Securities Exchange Act of 1934 during the preceding 12 months (or for such shorter period that the registrant was required to file such reports); and (2) has been subject to such filing requirements for the past 90 days. Yes x No ¨
Indicate by check mark whether the registrant has submitted electronically and posted on its corporate Web site, if any, every Interactive Data File required to be submitted and posted pursuant to Rule 405 of Regulation S-T (§232.405 of this chapter) during the preceding 12 months (or for such shorter period that the registrant was required to submit and post such files). Yes ¨ No ¨.
Indicate by check mark if disclosure of delinquent filers pursuant to Item 405 of Regulation S-K is not contained herein, and will not be contained, to the best of registrant’s knowledge, in definitive proxy or information statements incorporated by reference in Part III of this Form 10-K or any amendment to this Form 10-K. ¨
Indicate by check mark whether the registrant is a large accelerated filer, an accelerated filer, or a non-accelerated filer. See definition of “accelerated filer and large accelerated filer” in Rule 12b-2 of the Exchange Act. (Check one):
| Large accelerated filer | ¨ | Accelerated filer | ¨ | |||
| Non-accelerated filer | ¨ | Smaller reporting company | x | |||
Indicate by check mark whether the registrant is a shell company (as defined in Securities Exchange Act Rule 12b-2).
Yes ¨ No x
The aggregate market value of voting shares held by non-affiliates of registrant as of June 30, 2010, which was determined on the basis of the closing price of registrant’s shares on that date, was approximately $36,300,000.
As of March 24, 2011, there were 10,434,665 shares of Common Stock outstanding.
DOCUMENTS INCORPORATED BY REFERENCE
Except as otherwise stated therein, Part III of the Form 10-K is incorporated by reference from the Registrant’s Definitive Proxy Statement which is expected to be filed with the Commission on or before April 30, 2011 for its 2011 Annual Meeting of Shareholders.
Table of Contents
ANNUAL REPORT ON FORM 10K
FOR THE YEAR ENDED DECEMBER 31, 2010
TABLE OF CONTENTS
| Page No. | ||||||
| FORWARD LOOKING STATEMENTS |
||||||
| PART I | ||||||
| Item 1 |
1 | |||||
| Item 1A |
22 | |||||
| Item 1B |
29 | |||||
| Item 2 |
30 | |||||
| Item 3 |
30 | |||||
| 31 | ||||||
| PART II | ||||||
| Item 5 |
32 | |||||
| Item 6 |
35 | |||||
| Item 7 |
Management’s Discussion and Analysis of Financial Condition and Results of Operations |
37 | ||||
| Item 8 |
68 | |||||
| 69 | ||||||
| Consolidated Statements of Financial Condition December 31, 2010 and 2009 |
70 | |||||
| Consolidated Statements of Operations for the years ended December 31, 2010, 2009, and 2008 |
71 | |||||
| 72 | ||||||
| Consolidated Statements of Cash Flows for the years ended December 31, 2010, 2009 and 2008 |
73 | |||||
| 75 | ||||||
| Item 9 |
Changes in and Disagreements with Accountants on Accounting and Financial Disclosures |
112 | ||||
| Item 9A(T) |
112 | |||||
| Management’s Report of Internal Control Over Financial Reporting |
113 | |||||
| Item 9B |
114 | |||||
| PART III | ||||||
| Item 10 |
114 | |||||
| Item 11 |
114 | |||||
| Item 12 |
Security Ownership of Certain Beneficial Owners and Management and Related Stockholder Matters |
114 | ||||
| Item 13 |
Certain Relationships and Related Transactions, and Director Independence |
114 | ||||
| Item 14 |
114 | |||||
| PART IV | ||||||
| Item 15 |
115 | |||||
| S-1 | ||||||
| Exhibit Index |
E-1 | |||||
| Exhibit 21 |
Subsidiaries of Registrant | |||||
| Exhibit 23.1 |
Consent of Squar, Milner, Peterson, Miranda & Williams, LLP, Independent Registered Public Accounting Firm | |||||
| Exhibit 31.1 |
Certifications of Chief Executive Officer under Section 302 of the Sarbanes-Oxley Act of 2002 | |||||
| Exhibit 31.2 |
Certifications of Chief Financial Officer under Section 302 of the Sarbanes-Oxley Act of 2002 | |||||
| Exhibit 32.1 |
Certification of Chief Executive Officer under Section 906 of the Sarbanes-Oxley Act of 2002 | |||||
| Exhibit 32.1 |
Certification of Chief Financial Officer under Section 906 of the Sarbanes-Oxley Act of 2002 | |||||
i
Table of Contents
FORWARD LOOKING STATEMENTS
Statements contained in this Report that are not historical facts or that discuss our expectations, beliefs or views regarding our future operations or future financial performance, or financial or other trends in our business or markets, constitute “forward-looking statements” within the meaning of Section 27A of the Securities Act of 1933, as amended, and Section 21E of the Securities Exchange Act of 1934, as amended. Forward-looking statements can be identified by the fact that they do not relate strictly to historical or current facts. Often, they include the words “believe,” “expect,” “anticipate,” “intend,” “plan,” “estimate,” “project,” or words of similar meaning, or future or conditional verbs such as “will,” “would,” “should,” “could,” or “may.” The information contained in such forward-looking statements is based on current information and assumptions about future events over which we do not have control and our business is subject to a number of risks and uncertainties that could cause our financial condition or actual operating results in the future to differ significantly from our expected financial condition or operating results that are set forth in those forward-looking statements. See Item 1A “Risk Factors” in this Report.
Due to these risks and uncertainties, readers are cautioned not to place undue reliance on forward-looking statements contained in this Report, which speak only as of the date of this Annual Report. We undertake no obligation to update or revise any forward-looking statements, whether as a result of new information, future events or otherwise, except as may otherwise be required by applicable law or NASDAQ rules.
PART I
| ITEM 1. | BUSINESS |
Background
Pacific Mercantile Bancorp is a California corporation that owns 100% of the stock of Pacific Mercantile Bank, a California state chartered commercial bank (which, for convenience, will sometimes be referred to in this report as the “Bank”). The capital stock of the Bank is our principal asset and substantially all of our business operations are conducted by the Bank which, as a result, accounts for substantially all of our revenues and income. As the owner of a commercial bank, Pacific Mercantile Bancorp is registered as a bank holding company under the Bank Holding Company Act of 1956, as amended (the “Bank Holding Company Act”) and, as such, our operations are regulated by the Board of Governors of the Federal Reserve System (the “Federal Reserve Board”). See “Supervision and Regulation” below in this Report. For ease of reference, we will sometimes use the terms “Company,” “we” or “us” in this Report to refer to Pacific Mercantile Bancorp on a consolidated basis and “PM Bancorp” or the “Bancorp” to refer to Pacific Mercantile Bancorp on a “stand-alone” or unconsolidated basis.
The Bank, which is headquartered in Orange County, California, approximately 40 miles south of Los Angeles, conducts a commercial banking business in Orange, Los Angeles, San Bernardino and San Diego counties in Southern California. The Bank is also a member of the Federal Reserve System and its deposits are insured, to the maximum extent permitted by law, by the Federal Deposit Insurance Corporation (commonly known as the “FDIC”).
At December 31, 2010, our total assets, net loans (which exclude loans held for sale) and total deposits had grown to $1.016 billion, $722 million and $816 million, respectively. Additionally, as of that date a total of approximately 9,200 deposit accounts were being maintained at the Bank by our customers, of which approximately 34% were business customers. Currently we operate seven full service commercial banking offices (which we refer to as “financial centers”) and an internet banking branch at www.pmbank.com. Due to the Bank’s internet presence, the Bank has customers who are located in 49 states and the District of Columbia, although the vast majority of our customers are located in Southern California.
1
Table of Contents
The Bank commenced business in March 1999, with the opening of its first financial center, located in Newport Beach, California, and in April 1999 it launched its internet banking site, at www.pmbank.com, where our customers are able to conduct many of their business and personal banking transactions, more conveniently and less expensively, with us, 24 hours a day, 7 days a week. Between August 1999 and July 2005, we opened six additional financial centers as part of an expansion of our banking franchise into Los Angeles, San Diego and San Bernardino counties in Southern California. Set forth below is information regarding our current financial centers.
| Banking and Financial Center |
County |
Date Opened for Business | ||
| Newport Beach, California |
Orange | March 1999 | ||
| San Juan Capistrano, California |
Orange | August 1999 | ||
| Costa Mesa, California |
Orange | June 2001 | ||
| Beverly Hills, California |
Los Angeles | July 2001 | ||
| La Jolla, California |
San Diego | June 2002 | ||
| La Habra, California |
Orange | September 2003 | ||
| Ontario, California |
San Bernardino | July 2005 |
In 2004 we also opened a financial center in Long Beach, California, located approximately 25 miles south of Los Angeles. We closed that office in August 2010 as a cost savings measure.
According to data published by the FDIC, at December 31, 2010 there were approximately 133 commercial banks operating with banking offices located in the counties of Los Angeles, Orange, San Diego, Riverside and San Bernardino in Southern California. Of those commercial banks, 14 had assets in excess of $2 billion; 102 had assets under $500 million (which are often referred to as “community banks”); 10 had assets between $500 million and $1 billion, and 7, including our Bank, had assets ranging between $1 billion and $2 billion. As a result, we believe that we are well-positioned to achieve further growth in Southern California.
Our Business Strategy
Our growth and expansion are the result of our adherence to a business plan which was created by our founders, who include both experienced banking professionals and individuals who came out of the computer industry. That business plan is to build and grow a banking organization that offers its customers the best attributes of a community bank, which are personalized and responsive service, while taking advantage of advances in computer technology to reduce costs and at the same time extend the geographic coverage of our banking franchise, initially within Southern California, by opening additional financial centers and benefiting from opportunities that may arise in the future to acquire other banks.
In furtherance of that strategy:
| • | We offer at our financial centers and at our interactive internet banking website, a broad selection of financial products and services that address, in particular, the banking needs of business customers and professional firms, including services that are typically available only from larger banks in our market areas. |
| • | We provide a level of convenience and access to banking services that we believe are not typically available from the community banks with which we compete, made possible by the combination of our full service financial centers and the internet banking capabilities coupled with personal services we offer our customers. |
| • | We have built a technology and systems infrastructure that we believe will support the growth and further expansion of our banking franchise in Southern California. |
| • | We continue to review and analyze additional opportunities to further enhance our profitability including a return in 2009 to business of originating single family mortgage loans that qualify for resale into the secondary mortgage market. |
We plan to continue to focus our services and offer products primarily to small to mid-size businesses in order to achieve internal growth of our banking franchise. We believe this focus will enable us to grow our loans and other earning assets and increase our core deposits (consisting of non-interest bearing demand, and lower cost savings and money market deposits), with the goal of increasing our net interest margins and improving our profitability. We also believe that, with our technology systems in place, we have the capability to significantly increase the volume of banking transactions without having to incur the cost or disruption of a major computer enhancement program.
During the second quarter of 2009, we commenced a new mortgage banking business to originate residential real estate mortgage loans for resale into the secondary mortgage markets.
2
Table of Contents
Our Commercial Banking Operations
We seek to meet the banking needs of small and moderate size businesses, professional firms and individuals by providing our customers with:
| • | A broad range of loan and deposit products and banking and financial services, more typical of larger banks, in order to gain a competitive advantage over independent or community banks that do not provide the same range or breadth of services that we are able to provide to our customers; |
| • | A high level of personal service and responsiveness, more typical of independent and community banks, which we believe gives us a competitive advantage over large out-of-state and other large multi-regional banks that are unable, or unwilling, due to the expense involved, to provide that same level of personal service to this segment of the banking market; and |
| • | The added flexibility, convenience and efficiency of conducting banking transactions with us over the Internet, which we believe further differentiates us from many of the community banks with which we compete and enables us to reduce the costs of providing services to our customers. |
Deposit Products
Deposits are a bank’s principal source of funds for making loans and acquiring other interest earning assets. Additionally, the interest expense that a bank must incur to attract and maintain deposits has a significant impact on its operating results. A bank’s interest expense, in turn, will be determined in large measure by the types of deposits that it offers to and is able to attract from its customers. Generally, banks seek to attract “core deposits” which consist of demand deposits that bear no interest and low cost interest-bearing checking, savings and money market deposits. By comparison, time deposits (also sometimes referred to as “certificates of deposit”), including those in denominations of $100,000 or more, usually bear much higher interest rates and are more interest-rate sensitive and volatile than core deposits. A bank that is not able to attract significant amounts of core deposits must rely on more expensive time deposits or alternative sources of cash, such as Federal Home Loan Bank borrowings, to fund interest-earning assets, which means that its costs of funds will be higher and, as a result, its net interest margin is likely to be lower than a bank with higher proportion of core deposits. See “MANAGEMENT’S DISCUSSION AND ANALYSIS OF FINANCIAL CONDITIONS AND RESULTS OF OPERATIONS — Results of Operations-Net Interest Income.”
The following table sets forth information regarding the composition, by type deposits maintained by our customers during the year ended and as of December 31, 2010:
| Year-to-Date Average Balance December 31, 2010 |
Balance at December 31, 2010 |
|||||||
| (Dollars in thousands) | ||||||||
| Type of Deposit |
||||||||
| Noninterest-bearing checking accounts |
$ | 167,357 | $ | 144,079 | ||||
| Interest-bearing checking accounts(1) |
37,685 | 29,765 | ||||||
| Money market and savings deposits(1) |
134,863 | 134,183 | ||||||
| Certificates of deposit(2) |
614,850 | 508,199 | ||||||
| Totals |
$ | 954,755 | $ | 816,226 | ||||
| (1) | Includes savings accounts and money market accounts. Excludes money market deposits maintained at the Bank by PM Bancorp with an annual average balance of $6.2 million for the year ended and a balance of $5.1 million at December 31, 2010. |
| (2) | Comprised of time certificates of deposit in varying denominations under and over $100,000. Excludes certificates of deposit maintained by PM Bancorp at the Bank with an average balance of $250,000 for the year ended and a balance at December 31, 2010 of $250,000. |
3
Table of Contents
Loan Products
We offer our customers a number of different loan products, including commercial loans and credit lines, accounts receivable and inventory financing, SBA guaranteed business loans, commercial real estate, residential mortgage loans, and consumer loans. The following table sets forth the types and the amounts of our loans that were outstanding:
| At December 31, 2010 | ||||||||
| Amount | Percent of Total | |||||||
| (Dollars in thousands) | ||||||||
| Commercial loans |
$ | 218,690 | 29.5 | % | ||||
| Commercial real estate loans – owner occupied |
178,085 | 24.0 | % | |||||
| Commercial real estate loans – all other |
136,505 | 18.4 | % | |||||
| Residential mortgage loans – multi-family |
84,553 | 11.4 | % | |||||
| Residential mortgage loans – single family |
72,442 | 9.8 | % | |||||
| Construction loans |
3,048 | 0.5 | % | |||||
| Land development loans |
29,667 | 4.0 | % | |||||
| Consumer loans |
18,017 | 2.4 | % | |||||
| Gross loans |
$ | 741,007 | 100.0 | % | ||||
Commercial Loans
The commercial loans we offer generally include short-term secured and unsecured business and commercial loans with maturities ranging from 12 to 24 months, accounts receivable financing for terms of up to 18 months, equipment and automobile term loans and leases which generally amortize over a period of up to 7 years, and SBA guaranteed business loans with terms of up to 10 years. The interest rates on these loans generally are adjustable and usually are indexed to The Wall Street Journal’s prime rate. However, since 2003 it generally has been our practice to establish an interest rate floor on a best effort basis on our commercial loans, generally ranging from 5.0% to 6.0%. In order to mitigate the risk of borrower default, we generally require collateral to support the credit or, in the case of loans made to businesses, personal guarantees from their owners, or both. In addition, all such loans must have well-defined primary and secondary sources of repayment. Generally, lines of credit are granted for no more than a 12-month period.
Commercial loans, including accounts receivable financing, generally are made to businesses that have been in operation for at least three years. To qualify for such loans, prospective borrowers generally must have debt-to-net worth ratios not exceeding 4-to-1, operating cash flow sufficient to demonstrate the ability to pay obligations as they become due, and good payment histories as evidenced by credit reports.
We also offer asset-based lending products, which involve a higher degree of risk, because they generally are made to businesses that are growing rapidly, but cannot internally fund their growth without borrowings. These loans are collateralized primarily by the borrower’s accounts receivable and inventory. We control our risk by generally requiring loan-to-value ratios of not more than 80% and by closely and regularly monitoring the amount and value of the collateral in order to maintain that ratio.
Commercial loan growth is important to the growth and profitability of our banking franchise because, although not required to do so, commercial loan borrowers often establish noninterest-bearing (demand) and interest-bearing transaction deposit accounts and banking services relationships with us. Those deposit accounts help us to reduce our overall cost of funds and those banking services relationships provide us with a source of non-interest income.
Commercial Real Estate Loans
The majority of our commercial real estate loans are secured by first trust deeds on nonresidential real property. Loans secured by nonresidential real estate often involve loan balances to single borrowers or groups of related borrowers, and generally involve a greater risk of nonpayment than do mortgage loans secured by multi-family dwellings. Payments on these loans depend to a large degree on the results of operations and cash flows of the borrowers, which are generated from a wide variety of businesses and industries. As a result, repayment of these loans can be affected adversely by changes in the economy in general or by the real estate market more specifically. Accordingly, the nature of this type of loan makes it more difficult to monitor and evaluate. Consequently, we typically require personal guarantees from the owners of the businesses to which we make such loans.
4
Table of Contents
Customers desiring to obtain a commercial real estate loans are required to have good payment records with a debt coverage ratio generally of at least 1.25 to 1. In addition, we require adequate insurance on the properties securing those loans to protect the collateral value. These loans are generally adjustable rate loans with interest rates tied to a variety of independent indexes. However, in some instances, the interest rates on these loans are fixed for an initial five year period and then adjust thereafter based on an applicable index. These loans are generally written for terms of up to 10 years, with loan-to-value ratios of not more than 75% in the case of owner occupied properties and 65% on non-owner occupied properties.
Residential Mortgage Loans
Residential mortgage loans consist primarily of loans that are secured by first trust deeds on apartment buildings or other multi-family dwellings. The Bank makes loans secured by single-family residential properties which are held for sale. The Bank will generate a minimum percentage of loans held for investment. The majority of loans are held for sale to third-party investors.
We make multi-family residential mortgage loans primarily in Los Angeles and Orange Counties for terms up to 30 years. These loans generally are adjustable rate loans with interest rates tied to a variety of independent indexes; although in some cases these loans have fixed interest rates for an initial five-year period and adjust thereafter based on an applicable index. These loans generally have interest rate floors, payment caps, and prepayment penalties. The loans are underwritten based on a variety of borrower and property criteria. Borrower criteria include liquidity and cash flow analysis and credit history verifications. Property criteria generally include loan to value limits under 75% and debt coverage ratios of 1.20 to 1 or greater.
Single-family mortgages consist of fixed and adjustable rate mortgages, except that some of the loans have fixed interest rates for the initial five years of the loan term and adjust thereafter. The majority of these loans have been made to finance the purchase of, or the refinance of existing loans on, owner-occupied homes.
Real Estate Construction and Land Development Loans
To reduce our exposure to the deteriorating conditions in the real estate markets, in the fourth quarter of 2007, we began reducing the volume of single family residential and real estate construction loans that we were making, while at the same time increasing our commercial and business lending. Moreover, in 2010 we essentially ceased all real estate construction lending.
Consumer Loans
We offer a variety of loan and credit products to consumers including personal installment loans, lines of credit, credit cards, and to high net-worth individuals for estate planning based upon cash surrender value life insurance. We design these products to meet the needs of our customers, and some are made at fixed rates of interest and others at adjustable rates of interest. Consumer loans often entail greater risk than real estate mortgage loans, particularly in the case of consumer loans which are unsecured or are secured by rapidly depreciable assets, such as automobiles, that may not provide an adequate source of repayment in the event of a default by the consumer. Consumer loan collections are dependent on the borrower’s ongoing financial stability. Furthermore, in the event a consumer files for bankruptcy protection, the bankruptcy and insolvency laws may limit the amount which can be recovered on such loans. To qualify for a consumer loan a prospective borrower must have a good payment record and, typically, debt ratios of not more than 45%.
Consumer loans and credit products are important because consumers are a source of noninterest-bearing checking accounts and low cost savings deposits. Additionally, banking relationships with consumers tend to be stable and longer lasting than banking relationships with businesses, which tend to be more sensitive to price competition.
Business Banking Services
We offer various banking and financial services designed primarily for our business banking customers. Those services include:
| • | Financial management tools and services that include multiple account control, account analysis, transaction security and verification, wire transfers, bill payment, payroll and lock box services, most of which are available at our Internet website, www.pmbank.com; and |
| • | Automated clearinghouse (ACH) origination services which enable businesses that charge for their services or products on a recurring monthly or other periodic basis, to obtain payment from their customers through an automatic, pre-authorized debit from their customers’ bank accounts anywhere in the United States. |
5
Table of Contents
Convenience Banking Services
We also offer a number of services and products that make it more convenient to conduct banking transactions, such as Internet banking services, ATMs, night drop services, courier and armored car services that enable our business customers to order and receive cash without having to travel to our banking offices, and Remote Deposit Capture (PMB Xpress Deposit) which enables business customers to image checks they receive for electronic deposit at the Bank, thereby eliminating the need for customers to travel to our offices to deposit checks into their accounts.
Internet Banking Services
Our customers can securely access our internet bank at www.pmbank.com to:
| • | Use financial cash management services |
| • | View account balances and account history |
| • | Transfer funds between accounts |
| • | Pay bills and order wire transfers of funds |
| • | Transfer funds from credit lines to deposit accounts |
| • | Make loan payments |
| • | Print bank statements |
| • | Place stop payments |
| • | Purchase certificates of deposit |
Security Measures
Our ability to provide customers with secure and uninterrupted financial services is of paramount importance to our business. We believe our computer banking systems, services and software meet the highest standards of bank and electronic systems security. The following are among the security measures that we have implemented:
Bank-Wide Security Measures
| • | Service Continuity. In order to better ensure continuity of service, we have located our critical servers and telecommunications systems at an offsite hardened and secure data center. This center provides the physical environment necessary to keep servers up and running 24 hours a day, 7 days a week. This data center has raised floors, temperature control systems with separate cooling zones, seismically braced racks, and generators to keep the system operating during power outages and has been designed to withstand fires and major earthquakes. The center also has a wide range of physical security features, including smoke detection and fire suppression systems, motion sensors, and 24x7 secured access, as well as video camera surveillance and security breach alarms. The center is connected to the Internet by redundant high speed data circuits with advanced capacity monitoring. |
| • | Physical Security. All servers and network computers reside in secure facilities. Only employees with proper identification may enter the primary server areas. |
| • | Monitoring. All customer transactions on our internet servers and internal computer systems produce one or more entries into transactional logs. Our personnel routinely review these logs as a means of identifying and taking appropriate action with respect to any abnormal or unusual activity. We believe that, ultimately, vigilant monitoring is the best defense against fraud. |
Internet Security Measures
We maintain electronic and procedural safeguards that comply with federal regulations to guard nonpublic personal information. We regularly assess and update our systems to improve our technology for protecting information. On our website, the security measures include:
| • | Secure Sockets Layer (SSL) protocol, |
| • | Digital certificates, |
| • | Multi-factor authentication (MFA), |
| • | Intrusion detection systems, and |
| • | Firewall protection. |
6
Table of Contents
We believe the risk of fraud presented by providing internet banking services is not materially different from the risk of fraud inherent in any banking relationship. Potential security breaches can arise from any of the following circumstances:
| • | misappropriation of a customer’s account number or password; |
| • | compromise of the customer’s computer system (s); |
| • | penetration of our servers by an outside “hacker;” |
| • | fraud committed by a new customer in completing his or her loan application or opening a deposit account with us; and |
| • | fraud committed by employees or service providers. |
Both traditional banks and internet banks are vulnerable to these types of fraud. By establishing the security measures described above, we believe we can minimize, to the extent practicable, our vulnerability to the first three types of fraud. To counteract fraud by employees and service providers, we have established internal procedures and policies designed to ensure that, as in any bank, proper control and supervision is exercised over employees and service providers. We also maintain insurance to protect us from losses due to fraud committed by employees.
Additionally, the adequacy of our security measures is reviewed periodically by the Federal Reserve Board and the California Department of Financial Institutions (“DFI”), which are the federal and state government agencies, respectively, with supervisory authority over the Bank. We also retain the services of third party computer security firms to conduct periodic tests of our computer and internet banking systems to identify potential threats to the security of our systems and to recommend additional actions that we can take to improve our security measures.
Competition
Competitive Conditions in the Traditional Banking Environment
The banking business in California generally, and in our service area in particular, is highly competitive and is dominated by a relatively small number of large multi-state and California-based banks that have numerous banking offices operating over wide geographic areas. We compete for deposits and loans with those banks, with community banks that are based or have branch offices in our market areas, and with savings banks (also sometimes referred to as “thrifts”), credit unions, money market and other mutual funds, stock brokerage firms, insurance companies, and other traditional and nontraditional financial service organizations. We also compete for customers’ funds with governmental and private entities issuing debt or equity securities or other forms of investments which may offer different and potentially higher yields than those available through bank deposits.
Major financial institutions that operate throughout California and that have offices in our service areas include Bank of America, Wells Fargo Bank, Chase, Union Bank of California, Bank of the West, U. S. Bancorp, Comerica Bank and Citibank. Larger independent banks and other financial institutions with offices in our service areas include, among others, OneWest Bank, City National Bank, Citizens Business Bank, Manufacturers Bank, and California Bank and Trust.
These banks, as well many other financial institutions in our service areas, have the financial capability to conduct extensive advertising campaigns and to shift their resources to regions or activities of greater potential profitability. Many of them also offer diversified financial services which we do not presently offer directly. The larger banks and financial institutions also have substantially more capital and higher lending limits than our Bank.
In order to compete with the banks and other financial institutions operating in our service areas, we rely on our ability to provide flexible, more convenient and more personalized service to customers, including Internet banking services and financial tools. At the same time, we:
| • | emphasize personal contacts with existing and potential new customers by our directors, officers and other employees; |
| • | develop and participate in local promotional activities; and |
| • | seek to develop specialized or streamlined services for customers. |
To the extent customers desire loans in excess of our lending limits or services not offered by us, we attempt to assist them in obtaining such loans or other services through participations with other banks or assistance from our correspondent banks or third party vendors.
7
Table of Contents
Competitive Conditions in Internet Banking
There are a number of banks that offer services exclusively over the internet, such as E*TRADE Bank, and other banks, such as Bank of America and Wells Fargo Bank, that market their internet banking services to their customers nationwide. We believe that only the larger of the commercial banks with which we compete offer the comprehensive set of internet banking services that we offer to our customers. However, an increasing number of community banks offer internet banking services to their customers by relying on third party vendors to provide the functionality they need to provide such services. Additionally, many of the larger banks do have greater market presence and greater financial resources to market their internet banking services than do we. Moreover, new competitors and competitive factors are likely to emerge, particularly in view of the rapid development of internet commerce. On the other hand, there have been some recently published reports indicating that the actual rate of growth in the use of the internet banking services by consumers and businesses is lower than had been previously predicted and that many customers still prefer to be able to conduct at least some of their banking transactions at local banking offices. We believe that these findings support our strategic decision, made at the outset of our business, to offer customers the benefits of both traditional and internet banking services. We also believe that this strategy has been an important factor in our growth to date and will contribute to our growth in the future. See “BUSINESS — Our Business Strategy” earlier in this Section of this Report.”
Impact of Economic Conditions, Government Policies and Legislation on our Business
Government Monetary Policies. Our profitability, like that of most financial institutions, is affected to a significant extent by our net interest income, which is the difference between the interest income we generate on interest-earning assets, such as loans and investment securities, and the interest we pay on deposits and other interest-bearing liabilities, such as borrowings. Our interest income and interest expense, and hence our net interest income, depends to a great extent on prevailing market rates of interest, which are highly sensitive to many factors that are beyond our control, including inflation, recession and unemployment. Moreover, it is often difficult to predict, with any assurance, how changes in economic conditions will affect our future financial performance.
Our net interest income and operating results also are affected by monetary and fiscal policies of the federal government and the policies of regulatory agencies, particularly the Federal Reserve Board. The Federal Reserve Board implements national monetary policies to curb inflation, or to stimulate borrowing and spending in response to economic downturns, through its open-market operations by adjusting the required level of reserves that banks and other depository institutions must maintain, and by varying the target federal funds and discount rates on borrowings by banks and other depository institutions. These actions affect the growth of bank loans, investments and deposits and the interest earned on interest-earning assets and paid on interest-bearing liabilities. The nature and impact of any future changes in monetary and fiscal policies on us cannot be predicted with any assurance.
Legislation Generally. From time to time, federal and state legislation is enacted which can affect our operations and our operating results by materially increasing the costs of doing business, limiting or expanding the activities in which banks and other financial institutions may engage, or altering the competitive balance between banks and other financial services providers.
Economic Conditions and Recent Legislation and Other Government Actions. The current economic recession, which is reported to have begun at the end of 2007, created wide ranging consequences and difficulties for the banking and financial services industry, in particular, and the economy in general. The recession led to significant write-downs of the assets and an erosion of the capital of a large number of banks and other lending and financial institutions which, in turn, have significantly and adversely affected the operating results of banking and other financial institutions, many of which have reported losses for the past three years, and led to steep declines in their stock prices. In addition, bank regulatory agencies have been very aggressive in responding to concerns and trends identified in their bank examinations, which has resulted in the increased issuance of enforcement orders requiring action to address credit quality, liquidity and risk management and capital adequacy, as well as other safety and soundness concerns. All of these conditions, moreover, have led the U.S. Congress, the U.S. Treasury Department and the federal banking regulators, including the FDIC, to take broad actions, commencing in early September 2008, to address systemic risks and volatility in the U.S. banking system.
8
Table of Contents
In October 2008, the Emergency Economic Stabilization Act of 2008 (“EESA”) was enacted which, among other measures, authorized the Secretary of the Treasury to establish the Troubled Asset Relief Program (“TARP”). EESA also gave broad authority to Treasury to purchase, manage, modify, sell and insure the troubled mortgage related assets that triggered the economic crisis as well as other “troubled assets.” EESA includes additional provisions directed at bolstering the economy, including, among other things:
| • | Authority for the Federal Reserve to pay interest on depository institution balances; |
| • | Mortgage loss mitigation and homeowner protection; and |
| • | A temporary increase in FDIC insurance coverage from $100,000 to $250,000 through December 31, 2013. |
The EESA also increased, through December 31, 2013, FDIC deposit insurance on most bank accounts from $100,000 to $250,000. In addition, the FDIC has implemented a program to provide deposit insurance for the full amount of most non-interest bearing transaction accounts through June 30, 2010 and another program to guarantee certain unsecured debt of financial institutions and their holding companies through June 2012. The FDIC charges “systemic risk special assessments” to those depository institutions that participate in this debt guarantee program and the FDIC has recently proposed that Congress give it expanded authority to charge fees to those holding companies which benefit directly and indirectly from the FDIC guarantees. Banking institutions had the option to opt out of either or both these two FDIC programs. We chose not to opt out of the transaction account deposit program. On the other hand, since we do not have unsecured debt, we opted out of the FDIC debt guarantee program.
In February 2010, Congress approved and the President signed the American Recovery and Reinvestment Act of 2010 (the “ARRA”). The primary purposes of the ARRA was to curb rising unemployment and restore confidence in the economy by (i) funding federal, state and local government infrastructure improvement and other public and private projects to create new jobs and (ii) reducing federal taxes paid by middle class taxpayers in order to stimulate increase spending, which had declined significantly as a result of the economic recession. However, the ARRA also imposed (i) additional restrictions and conditions on existing CPP participants and (ii) new restrictions and conditions on banks and bank holding companies that qualify for and elect to participate in the TARP CPP for the first time and on existing CPP participants that qualify for and elect to obtain additional TARP CCP funds. Such additional and new restrictions include prohibitions on the payment by CPP participants of any severance compensation to certain of their most highly compensated employees and place limitations on the bonus or incentive compensation that may be paid to those employees to no more than one-third of their annual cash compensation.
9
Table of Contents
The Dodd-Frank Act
On July 21, 2010, the Dodd-Frank Wall Street Reform and Consumer Protection Act (the “Dodd-Frank Act”) was signed into law. The Dodd-Frank Act is intended to effectuate a fundamental restructuring of federal banking regulation. Among other things, the Dodd-Frank Act creates a new Financial Stability Oversight Council to identify systemic risks in the financial system and gives federal regulators new authority to take control of and liquidate banking institutions and other financial firms facing the prospect of imminent failure that would create systemic risks to the U.S. financial system. The Dodd-Frank Act also creates a new independent federal regulator to administer federal consumer protection laws.
The Dodd-Frank Act is expected to have a significant impact on banks and bank holding companies generally and we expect that many of its provisions will impact our business operations as they take effect. However, the full impact of the Dodd-Frank Act will not be known until the federal government adopts regulations to implement those provisions of the Act. Set forth below is a summary description of those provisions. The description does not purport to be complete and is qualified in its entirety by reference to the Dodd-Frank Act.
Imposition of New Capital Standards on Bank Holding Companies. The Dodd-Frank Act requires the FRB to apply consolidated capital requirements to depository institution holding companies, such as us, that are no less stringent than those currently applied to depository institutions, such as the Bank. Under these standards, trust preferred securities will be excluded from Tier 1 capital unless such securities were issued prior to May 19, 2010 by a bank holding company with less than $15 billion in assets. Since our trust preferred securities were issued prior to 2010 and our assets total approximately $1 billion, our trust preferred securities will continue to be included in our Tier 1 capital. The Dodd-Frank Act also requires that capital be increased in times of economic expansion and allowed to decrease in times of economic contraction, consistent with safety and soundness.
Increase in Deposit Insurance and Changes Affecting the FDIC Insurance Fund. The Dodd-Frank Act permanently increases the maximum deposit insurance amount for banks, savings institutions and credit unions to $250,000 per depositor, and extends unlimited deposit insurance to non-interest bearing transaction accounts through December 31, 2012. Additionally, effective one year from the date of its enactment, the Dodd-Frank Act eliminates the federal statutory prohibition against the payment of interest on business checking accounts, which is likely to increase the competition for and interest that banks pay on such accounts. The Dodd-Frank Act also broadens the base for FDIC insurance assessments. Assessments will now be based on the average consolidated total assets less tangible equity capital of a financial institution, which will result in increases in FDIC insurance assessments for virtually all FDIC insured banks, including the Bank. The Dodd-Frank Act requires the FDIC to increase the reserve ratio of the Deposit Insurance Fund from 1.15% to 1.35% of insured deposits by 2020 and eliminates the requirement that the FDIC pay dividends to insured depository institutions when the reserve ratio exceeds certain thresholds.
Say-on-Pay Provisions for SEC Reporting Companies. The Dodd-Frank Act requires publicly traded companies, including those that are neither depository institutions nor bank holding companies, to give their shareholders a non-binding vote (i) on executive compensation at their first annual meeting taking place six months after the date of enactment and at least every three years thereafter and (ii) on so-called “golden parachute” payments in connection with approvals of mergers and acquisitions that will trigger such payments. The SEC has already promulgated its rules for implementing these “say-on-pay” provisions, which require all public companies, other than smaller reporting companies, to give their shareholders the opportunity to vote on executive compensation at their shareholders meetings to be held in 2011. The Dodd-Frank Act also directs federal banking regulators to promulgate rules prohibiting the payment of excessive compensation to executives of depository institutions and their holding companies with assets in excess of $1.0 billion, whether or not they are publicly traded. The Act also authorizes the SEC to promulgate rules that would allow shareholders to nominate their own candidates for election to the board and to have those nominees included in a company’s proxy materials, even if those candidates will be opposing candidates who have been nominated by the company’s board of directors. The Act also gives the SEC authority to prohibit broker discretionary voting in the election of directors and on executive compensation matters.
Limitation on Conversion of Bank Charters. Effective one year after enactment, the Dodd-Frank Act prohibits a depository institution from converting from a state to federal charter or vice versa while it is the subject of a cease and desist order or other formal enforcement action or a memorandum of understanding with respect to a significant supervisory matter unless the appropriate federal banking agency gives notice of the conversion to the federal or state authority that issued the enforcement action and that agency does not object within 30 days.
Interstate Banking. The Dodd-Frank Act authorizes national and state banks to establish branches in other states to the same extent as a bank chartered by that state would be permitted to branch. Previously, banks could only establish branches in other states if the host state expressly permitted out-of-state banks to establish branches in that state. Accordingly, banks will be able to enter new markets more freely.
Restrictions on Derivative Transactions. Effective 18 months after enactment, the Dodd-Frank Act prohibits state-chartered banks from engaging in derivatives transactions unless the loans to one borrower limits of the state in which the bank is chartered take into consideration credit exposure to derivatives transactions. For this purpose, derivative transactions include any contract, agreement, swap, warrant, note or option that is based in whole or in part on the value of, any interest in, or any quantitative measure or the occurrence of any event relating to, one or more commodities securities, currencies, interest or other rates, indices or other assets.
Extension of Limitations on Banking Transactions by Banks with their Affiliates. The Dodd-Frank Act will apply Section 23A and Section 22(h) of the Federal Reserve Act (governing transactions with insiders) to derivative transactions, repurchase agreements and securities lending and borrowing transactions that create credit exposure to an affiliate or an insider. Any such transactions with affiliates must be fully secured. The current exemption from Section 23A for transactions with financial subsidiaries will be eliminated. Additionally, effective one year from the date of enactment, the Dodd-Frank Act expands the definition of affiliate for purposes of quantitative and qualitative limitations of Section 23A of the Federal Reserve Act to include mutual funds advised by a depository institution or its affiliates.
10
Table of Contents
Debit Card Fees. Effective July 21, 2011, the Dodd-Frank Act provides that the amount of any interchange fee charged by a debit card issuer with respect to a debit card transaction must be reasonable and proportional to the cost incurred by the card issuer. Within nine months of enactment, the Federal Reserve Board is required to establish standards for reasonable and proportional fees which may take into account the costs of preventing fraud. The restrictions on interchange fees, however, do not apply to banks that, together with their affiliates, have assets of less than $10 billion.
Consumer Protection Provisions. The Dodd-Frank Act creates a new, independent federal agency called the Consumer Financial Protection Bureau (“CFPB”), which is granted broad rulemaking, supervisory and enforcement powers under various federal consumer financial protection laws, including the Equal Credit Opportunity Act, Truth in Lending Act, Real Estate Settlement Procedures Act, Fair Credit Reporting Act, Fair Debt Collection Act, the Consumer Financial Privacy provisions of the Gramm-Leach-Bliley Act and certain other statutes. The CFPB will have examination and primary enforcement authority with respect to depository institutions with $10 billion or more in assets. Smaller institutions will be subject to rules promulgated by the CFPB but will continue to be examined and supervised by federal banking regulators for consumer compliance purposes. The CFPB will have authority to prevent unfair, deceptive or abusive practices in connection with the offering of consumer financial products. The Dodd-Frank Act also (i), authorizes the CFPB to establish certain minimum standards for the origination of residential mortgages including a determination of the borrower’s ability to repay and (ii) will allow borrowers to raise certain defenses to foreclosure if they receive any loan other than a “qualified mortgage” as defined by the CFPB. The Dodd-Frank Act permits states to adopt consumer protection laws and standards that are more stringent than those adopted at the federal level and, in certain circumstances, permits state attorneys general to enforce compliance with both the state and federal laws and regulations.
Supervision and Regulation
Both federal and state laws extensively regulate bank holding companies and banks. Such regulation is intended primarily for the protection of depositors and the FDIC’s deposit insurance fund and is not for the benefit of shareholders. Set forth below is a summary description of the material laws and regulations that affect or bear on our operations. The description does not purport to be complete and is qualified in its entirety by reference to the laws and regulations that are summarized below.
Pacific Mercantile Bancorp
General. Pacific Mercantile Bancorp is a registered bank holding company subject to regulation under the Bank Holding Company Act of 1956, as amended. Pursuant to that Act, we are subject to supervision and periodic examination by, and are required to file periodic reports with, the Board of Governors of the Federal Reserve System (the “Federal Reserve Board” or the “FRB”).
As a bank holding company, we are allowed to engage, directly or indirectly, only in banking and other activities that the Federal Reserve Board deems to be so closely related to banking or managing or controlling banks as to be a proper incident thereto. Business activities designated by the Federal Reserve Board to be closely related to banking include securities brokerage services and products and data processing services, among others.
As a bank holding company, we also are required to obtain the prior approval of the Federal Reserve Board for the acquisition of more than 5% of the outstanding shares of any class of voting securities, or of substantially all of the assets, by merger or purchases of (i) any bank or other bank holding company and (ii) any other entities engaged in banking-related businesses or that provide banking-related services.
Under Federal Reserve Board regulations, a bank holding company is required to serve as a source of financial and managerial strength to its subsidiary banks and may not conduct its operations in an unsafe or unsound manner. In addition, it is the Federal Reserve Board’s policy that, in serving as a source of strength to its subsidiary banks, a bank holding company should stand ready to use available resources to provide adequate capital funds to its subsidiary banks during periods of financial stress or adversity and should maintain the financial flexibility and capital-raising capacity to obtain additional resources for assisting its subsidiary banks. For that reason, among others, the Federal Reserve Board requires all bank holding companies to maintain capital at or above certain prescribed levels. A bank holding company’s failure to meet these requirements will generally be considered by the Federal Reserve Board to be an unsafe and unsound banking practice or a violation of the Federal Reserve Board’s regulations or both, which could lead to the imposition of restrictions on the offending bank holding company, including restrictions on its further growth. See the discussion below under the caption “—Capital Standards and Prompt Corrective Action.”
11
Table of Contents
Additionally, among its powers, the Federal Reserve Board may require any bank holding company to terminate an activity or terminate control of, or liquidate or divest itself of, any subsidiary or affiliated company that the Federal Reserve Board determines constitutes a significant risk to the financial safety, soundness or stability of the bank holding company or any of its banking subsidiaries. The Federal Reserve Board also has the authority to regulate provisions of a bank holding company’s debt, including authority to impose interest ceilings and reserve requirements on such debt. Subject to certain exceptions, bank holding companies also are required to file written notice and obtain approval from the Federal Reserve Board prior to purchasing or redeeming their common stock or other equity securities. A bank holding company and its non-banking subsidiaries also are prohibited from implementing so-called tying arrangements whereby customers may be required to use or purchase services or products from the bank holding company or any of its non-bank subsidiaries in order to obtain a loan or other services from any of the holding company’s subsidiary banks.
The Company also is a bank holding company within the meaning of Section 3700 of the California Financial Code. As such, we are subject to examination by, and may be required to file reports with, the California Department of Financial Institutions (“DFI”).
12
Table of Contents
Financial Services Modernization Legislation. The Financial Services Modernization Act, which also is known as the Gramm-Leach-Bliley Act, was enacted into law in 1999. The principal objectives of that Act were to establish a comprehensive framework to permit affiliations among commercial banks, insurance companies, securities and investment banking firms, and other financial service providers. Accordingly, the Act revised and expanded the Bank Holding Company Act to permit a bank holding company system, meeting certain specified qualifications, to engage in broader range of financial activities to foster greater competition among financial services companies. To accomplish those objectives, among other things, the Act repealed the two affiliation provisions of the Glass-Steagall Act that had been adopted in the early 1930s during the Depression: Section 20, which restricted the affiliation of Federal Reserve Member Banks with firms “engaged principally” in specified securities activities; and Section 32, which restricted officer, director, or employee interlocks between a member bank and any company or person “primarily engaged” in specified securities activities. The Financial Services Modernization Act also contains provisions that expressly preempt and make unenforceable any state law restricting the establishment of financial affiliations, primarily related to insurance. That Act also:
| • | broadened the activities that may be conducted by national banks, bank subsidiaries of bank holding companies, and their financial subsidiaries; |
| • | provided an enhanced framework for protecting the privacy of consumer information; |
| • | adopted a number of provisions related to the capitalization, membership, corporate governance, and other measures designed to modernize the Federal Home Loan Bank system; |
| • | modified the laws governing the implementation of the Community Reinvestment Act (which is described in greater detail below); and |
| • | addressed a variety of other legal and regulatory issues affecting both day-to-day operations and long-term activities of banking institutions. |
Before a bank holding company may engage in any of the financial activities authorized by that Act, it must file an application with its Federal Reserve Bank that confirms that it meets certain qualitative eligibility requirements established by the FRB. A bank holding company that meets those qualifications and files such an application will be designated as a “financial holding company”, as a result of which it will become entitled to affiliate with securities firms and insurance companies and engage in other activities, primarily through non-banking subsidiaries, that are financial in nature or are incidental or complementary to activities that are financial in nature. According to current Federal Reserve Board regulations, activities that are financial in nature and may be engaged in by financial holding companies, through their non-bank subsidiaries, include:
| • | securities underwriting; dealing and market making; |
| • | sponsoring mutual funds and investment companies; |
| • | engaging in insurance underwriting and brokerage; and |
| • | engaging in merchant banking activities. |
A bank holding company that does not qualify as a financial holding company may not engage in such financial activities. Instead, as discussed above, it is limited to engaging in banking and such other activities that have been determined by the Federal Reserve Board to be closely related to banking.
We have no current plans to engage in any activities not permitted to traditional bank holding companies, including those expressly permitted by the Financial Services Modernization Act and we are not a financial holding company.
Privacy Provisions of the Financial Services Modernization Act. As required by the Financial Services Modernization Act, federal banking regulators have adopted rules that limit the ability of banks and other financial institutions to disclose nonpublic information about consumers to nonaffiliated third parties. Pursuant to the rules, financial institutions must provide:
| • | initial notices to customers about their privacy policies, describing the conditions under which banks and other financial institutions may disclose non-public personal information about their customers to non-affiliated third parties and affiliates; |
| • | annual notices of their privacy policies to current customers; and |
| • | a reasonable method for customers to “opt out” of disclosures to nonaffiliated third parties. |
13
Table of Contents
The Sarbanes-Oxley Act of 2002. The Sarbanes-Oxley Act of 2002 (i) established requirements with respect to oversight and supervision of public accounting firms, and (ii) required the implementation of measures designed to improve corporate governance of companies with securities registered under the Securities and Exchange Act of 1934, as amended (“public companies”) and which, therefore, apply to us. Among other things, the Sarbanes-Oxley Act:
| • | Provided for the establishment of a five-member oversight board, known as the Public Company Accounting Oversight Board (the “PCAOB”), which is appointed by the Securities and Exchange Commission and that is empowered to set standards for and has investigative and disciplinary authority over accounting firms that audit the financial statements of public companies. |
| • | Prohibits public accounting firms from providing various types of consulting services to their public company clients and requires accounting firms to rotate partners among public company clients every five years in order to assure that public accountants maintain their independence from managements of the companies whose financial statements they audit. |
| • | Increased the criminal penalties for financial crimes and securities fraud. |
| • | Requires public companies to implement disclosure controls and procedures designed to assure that material information regarding their business and financial performance is included in the public reports they file under the Securities and Exchange Act of 1934 (“Exchange Act Reports”). |
| • | Requires the chief executive and chief financial officers of public companies to certify as to the accuracy and completeness of the Exchange Act Reports that their companies file, the financial statements included in those Reports and the effectiveness of their disclosure procedures and controls. |
| • | Requires, pursuant to Section 404 of the Act, that (i) the chief executive and chief financial officer of a public company to test and certify to the effectiveness of their company’s internal control over financial reporting, and (ii) a public company’s outside auditors to independently test and issue a report as to whether the company’s internal control over its financial reporting is effective and whether there are any material weaknesses or significant deficiencies in those financial controls. |
| • | Requires a majority of the directors of public company to be independent of the company’s management and that the directors that serve on a public company’s audit committee meet standards of independence that are more stringent than those that apply to non-management directors generally. |
| • | Requires public companies whose publicly traded securities have a value in excess of $75 million to file their Exchange Act Reports on a more accelerated basis than had been required prior to the adoption of the Sarbanes-Oxley Act. |
| • | Requires more expeditious reporting by directors and officers and other public company insiders regarding their trading in company securities. |
| • | Established statutory separations between investment banking firms and financial analysts. |
We have taken the actions required by, and we believe we are in compliance with the provisions of the Sarbanes-Oxley Act that are applicable to us, except as described below. Among other things, we have implemented disclosure controls and procedures and taken other actions to meet the expanded disclosure requirements and certification requirements of the Sarbanes-Oxley Act, such as testing our internal control over financial reporting. We also have determined that eight of our nine directors meet the independence requirements of, and that all members of our audit committee meet the more stringent standards of independence applicable to audit committee membership pursuant to, the Sarbanes-Oxley Act.
As a result of findings by the Company’s federal and state regulatory agencies during the fourth quarter of 2009, the Company’s Audit Committee decided that the allowance for loan losses (“ALL”) should have been approximately $3.3 million higher, as of September 30, 2009. This decision led to the restatement of the Company’s September 30, 2009 financial statements. The regulators stated more consideration should have been given to certain qualitative factors in assessing the adequacy of the ALL as of September 30, 2009.
Management assessed the effect of the aforementioned restatement and concluded a material weakness existed in the internal control over financial reporting and its disclosure controls and procedures. Consequently, management has modified its policies and procedures for assessing the adequacy of the Company’s ALL to give greater weight to the impact that qualitative factors can reasonably be expected to have on the performance and collectability of loans in our loan portfolio. The Bank continues to perform quarterly ALL analysis, and will take the regulatory findings into consideration during this process. The ALL continues to be reviewed at all levels of senior and executive management, and by the Board of Directors.
14
Table of Contents
Pacific Mercantile Bank
General. Pacific Mercantile Bank (the “Bank”) is subject to primary supervision, periodic examination and regulation by (i) the Federal Reserve Board, which is its primary federal banking regulator, because the Bank is a member of the Federal Reserve Bank of San Francisco and (ii) the DFI, because the Bank is a California state chartered bank. The Bank also is subject to certain of the regulations promulgated by the FDIC, because its deposits are insured by the FDIC.
Various requirements and restrictions under the Federal and California banking laws affect the operations of the Bank. These laws and the implementing regulations, which are promulgated by Federal and State regulatory agencies, cover most aspects of a bank’s operations, including the reserves a bank must maintain against deposits and for possible loan losses and other contingencies; the types of deposits it obtains and the interest it is permitted to pay on different types of deposit accounts; the loans and investments that a bank may make; the borrowings that a bank may incur; the number and location of banking offices that a bank may establish; the rate at which it may grow its assets; the acquisition and merger activities of a bank; the amount of dividends that a bank may pay; and the capital requirements that a bank must satisfy, which can determine the extent of supervisory control to which a bank will be subject by its federal and state bank regulators. A more detailed discussion regarding capital requirements that are applicable to us and the Bank is set forth below under the caption “Capital Standards and Prompt Corrective Action.”
Permissible Activities and Subsidiaries. California law permits state chartered commercial banks to engage in any activity permissible for national banks. Those permissible activities include conducting many so-called “closely related to banking” or “nonbanking” activities either directly or through their operating subsidiaries.
Interstate Banking and Branching. Under the Riegle-Neal Interstate Banking and Branching Efficiency Act of 1994, bank holding companies and banks generally have the ability to acquire or merge with banks in other states; and, subject to certain state restrictions, banks may also acquire or establish new branches outside their home states. Interstate branches are subject to certain laws of the states in which they are located. The Bank presently does not have any interstate branches.
Federal Home Loan Bank System. The Bank is a member of the Federal Home Loan Bank (“FHLB”) of San Francisco. Among other benefits, each FHLB serves as a reserve or central bank for its members within its assigned region and makes available loans or advances to its members. Each FHLB is financed primarily from the sale of consolidated obligations of the FHLB system. As an FHLB member, the Bank is required to own a certain amount of capital stock in the FHLB. At December 31, 2010, the Bank was in compliance with the FHLB’s stock ownership requirement. Historically, the FHLB has paid dividends on its capital stock to its members. FHLB has not paid any dividends on its capital stock since 2009, except for the second quarter of 2009, and there can be no assurance that the FHLB will pay dividends at the same rate it has paid in the past, or that it will pay any dividends, in the future.
FRB Deposit Reserve Requirements. The Federal Reserve Board requires all federally-insured depository institutions to maintain noninterest bearing reserves at specified levels against their transaction accounts. At December 31, 2010, the Bank was in compliance with these requirements.
If, as a result of an examination of a federally regulated bank, its primary federal bank regulatory agency, such as the Federal Reserve Board, were to determine that the financial condition, capital resources, asset quality, earnings prospects, management, liquidity, or other aspects of a bank’s operations had become unsatisfactory or that the bank or its management was in violation of any law or regulation, that agency has the authority to take a number of different remedial actions as it deems appropriate under the circumstances. These actions include the power to enjoin “unsafe or unsound” banking practices; to require affirmative action to correct any conditions resulting from any violation or practice; to issue an administrative order that can be judicially enforced; to require the bank to increase its capital; to restrict the bank’s growth; to assess civil monetary penalties against the bank or its officers or directors; to remove officers and directors of the bank; and, if the federal agency concludes that such conditions cannot be corrected or there is an imminent risk of loss to depositors, to terminate a bank’s deposit insurance, which in the case of a California chartered bank would result in revocation of its charter and require it to cease its banking operations. Additionally, under California law the DFI has many of the same remedial powers with respect to the Bank, because it is a California state chartered bank.
Dividends and Other Transfers of Funds. Cash dividends from the Bank constitute the primary source of cash available to PM Bancorp for its operations and to fund any cash dividends that the board of directors might declare in the future. PM Bancorp is a legal entity separate and distinct from the Bank and the Bank is subject to various statutory and regulatory restrictions on its ability to pay cash dividends to PM Bancorp. Those restrictions would prohibit the Bank, subject to certain limited exceptions, from paying cash dividends in amounts that would cause the Bank to become undercapitalized. Additionally, the Federal Reserve Board and the DFI have the authority to prohibit the Bank from paying dividends, if either of those authorities deems the payment of dividends by the Bank to be an unsafe or unsound practice. See “Dividend Policy—Restrictions on the Payment of Dividends.”
15
Table of Contents
Additionally, it is FRB policy that bank holding companies should generally pay dividends on common stock only out of income available over the past year, and only if prospective earnings retention is consistent with the organization’s expected future needs and financial condition. It is also an FRB policy that bank holding companies should not maintain dividend levels that undermine the company’s ability to be a source of strength to its banking subsidiaries. Additionally, in consideration of the current financial and economic environment, the FRB has indicated that bank holding companies should carefully review their dividend policy and has discouraged payment ratios that are at maximum allowable levels unless both asset quality and capital are very strong.
The Federal Reserve Board also has established guidelines with respect to the maintenance of appropriate levels of capital by banks and bank holding companies under its jurisdiction. Compliance with the standards set forth in those guidelines and the restrictions that are or may be imposed under the prompt corrective action provisions of federal law could limit the amount of dividends which the Bank or the Company may pay. See “—Capital Standards and Prompt Corrective Action” below in this Section of this Report.
Single Borrower Loan Limitations. With certain limited exceptions, the maximum amount of obligations, secured or unsecured, that any borrower (including certain related entities) may owe to a California state bank at any one time may not exceed 25% of the sum of the shareholders’ equity, allowance for loan losses, capital notes and debentures of the bank. Unsecured obligations may not exceed 15% of the sum of the shareholders’ equity, allowance for loan losses, capital notes and debentures of the bank.
Restrictions on Transactions between the Bank and the Company and its other Affiliates. The Bank is subject to restrictions imposed by federal law on any extensions of credit to, or the issuance of a guarantee or letter of credit on behalf of, the Company or any of its other subsidiaries; the purchase of, or investments in, Company stock or other Company securities and the taking of such securities as collateral for loans; and the purchase of assets from the Company or any of its other subsidiaries. These restrictions prevent the Company and any of its subsidiaries from borrowing from the Bank unless the loans are secured by marketable obligations in designated amounts, and such secured loans and investments by the Bank in the Company or any of its subsidiaries are limited, individually, to 10% of the Bank’s capital and surplus (as defined by federal regulations) and, in the aggregate, for all loans made to and investments made in the Company and its other subsidiaries, to 20% of the Bank’s capital and surplus. California law also imposes restrictions with respect to transactions involving the Company and other persons deemed under that law to control the Bank.
Safety and Soundness Standards
Banking institutions may be subject to potential enforcement actions by the federal regulators for unsafe or unsound practices or for violating any law, rule, regulation, or any condition imposed in writing by its primary federal banking regulatory agency or any written agreement with that agency. The federal banking agencies have adopted guidelines designed to identify and address potential safety and soundness concerns that could, if not corrected, lead to deterioration in the quality of a bank’s assets, liquidity or capital. Those guidelines set forth operational and managerial standards relating to such matters as:
| • | internal controls, information systems and internal audit systems; |
| • | loan documentation; |
| • | credit underwriting; |
| • | asset growth; |
| • | earnings; and |
| • | compensation, fees and benefits. |
In addition, federal banking agencies also have adopted safety and soundness guidelines with respect to asset quality. These guidelines provide six standards for establishing and maintaining a system to identify problem assets and prevent those assets from deteriorating. Under these standards, an FDIC-insured depository institution is expected to:
| • | conduct periodic asset quality reviews to identify problem assets, estimate the inherent losses in problem assets and establish reserves that are sufficient to absorb those estimated losses; |
| • | compare problem asset totals to capital; |
| • | take appropriate corrective action to resolve problem assets; |
| • | consider the size and potential risks of material asset concentrations; and |
| • | provide periodic asset quality reports with adequate information for the bank’s management and the board of directors to assess the level of asset risk. |
16
Table of Contents
These guidelines also establish standards for evaluating and monitoring earnings and for ensuring that earnings are sufficient for the maintenance of adequate capital and reserves.
Capital Standards and Prompt Corrective Action
The Federal Deposit Insurance Act (“FDIA”) provides a framework for regulation of depository institutions and their affiliates, including parent holding companies, by their federal banking regulators. Among other things, it requires the relevant federal banking regulator to take “prompt corrective action” with respect to a depository institution if that institution does not meet certain capital adequacy standards, including requiring the prompt submission of an acceptable capital restoration plan if the depository institution’s bank regulator has concluded that it needs additional capital.
Supervisory actions by a bank’s federal regulator under the prompt corrective action rules generally depend upon an institution’s classification within one of five capital categories, which is determined on the basis of a bank’s total capital ratio, Tier 1 capital ratio and leverage ratio. Tier 1 capital consists principally of common stock and nonredeemable preferred stock, retained earnings and, subject to certain limitations, subordinated long term debentures or notes that meet certain conditions established by the Federal Reserve Board. See “MANAGEMENT’S DISCUSSION AND ANALYSIS OF FINANCIAL CONDITIONS AND RESULTS OF OPERATIONS — Capital Resources” in Item 7 in Part II of this Report.
A depository institution’s capital tier under the prompt corrective action regulations will depend upon how its capital levels compare with various relevant capital measures and the other factors established by the relevant regulations. Those regulations provide that a bank will be:
| • | “well capitalized” if it has a total risk-based capital ratio of 10.0% or greater, a Tier 1 risk-based capital ratio of 6.0% or greater, and a leverage ratio of 5.0% or greater, and is not subject to any order or written directive by any such regulatory authority to meet and maintain a specific capital level for any capital measure; |
| • | “adequately capitalized” if it has a total risk-based capital ratio of 8.0% or greater, a Tier 1 risk-based capital ratio of 4.0% or greater, and a leverage ratio of 4.0% or greater and is not “well capitalized”; |
| • | “undercapitalized” if it has a total risk-based capital ratio that is less than 8.0%, a Tier 1 risk-based capital ratio of less than 4.0% or a leverage ratio of less than 4.0%; |
| • | “significantly undercapitalized” if it has a total risk-based capital ratio of less than 6.0%, a Tier 1 risk-based capital ratio of less than 3.0% or a leverage ratio of less than 3.0%; and |
| • | “critically undercapitalized” if its tangible equity is equal to or less than 2.0% of average quarterly tangible assets. |
If a bank that is classified as a well-capitalized institution is determined (after notice and opportunity for hearing), by its federal regulatory agency to be in an unsafe or unsound condition or to be engaging in an unsafe or unsound practice, that agency may, under certain circumstances, reclassify the bank as adequately capitalized. If a bank has been classified as adequately capitalized or undercapitalized, its federal regulatory agency may nevertheless require it to comply with bank supervisory provisions and restrictions that would apply to a bank in the next lower capital classification, if that regulatory agency has obtained supervisory information regarding the bank (other than with respect to its capital levels) that raises safety or soundness concerns. However, a significantly undercapitalized bank may not be treated by its regulatory agency as critically undercapitalized.
The FDIA generally prohibits a bank from making any capital distributions (including payments of dividends) or paying any management fee to its parent holding company if the bank would thereafter be “undercapitalized.” “Undercapitalized” banks are subject to growth limitations and are required to submit a capital restoration plan. The federal regulatory agency for such a bank may not accept its capital restoration plan unless it determines, among other things, that the plan is based on realistic assumptions and is likely to succeed in restoring the bank’s capital. In addition, for a capital restoration plan to be acceptable, the bank’s parent holding company must guarantee that the bank will comply with its capital restoration plan. The bank holding company also is required to provide appropriate assurances of performance. Under such a guarantee and assurance of performance, if the bank fails to comply with its capital restoration plan, the parent holding company may become subject to liability for such failure in an amount up to the lesser of (i) 5.0% of the its bank subsidiary’s total assets at the time it became undercapitalized, and (ii) the amount which is necessary (or would have been necessary) to bring the bank into compliance with all applicable capital standards as of the time it failed to comply with the plan.
17
Table of Contents
If a bank fails to submit an acceptable capital restoration plan, it will be treated as if it is “significantly undercapitalized.” In that event, the bank’s federal regulatory agency may impose a number of additional requirements and restrictions on the bank, including orders or requirements (i) to sell sufficient voting stock to become “adequately capitalized,” (ii) to reduce its total assets, and (iii) cease the receipt of deposits from correspondent banks. “Critically undercapitalized” institutions are subject to the appointment of a receiver or conservator.
The following table sets forth, as of December 31, 2010, the regulatory capital ratios of the Company (on a consolidated basis) and the Bank (on a stand-alone basis) and compares those capital ratios to the federally established capital requirements that must be met for a bank holding company or a bank to be deemed “adequately capitalized” or “well capitalized” under the prompt corrective action regulations that are described above:
| At December 31, 2010 |
Actual | To Be Classified for Regulatory Purposes As | ||||||||||
| Adequately Capitalized | Well Capitalized | |||||||||||
| Total Capital to Risk Weighted Assets |
||||||||||||
| Company |
11.3 | % | At least 8.0 | % | N/A | |||||||
| Bank |
10.9 | % | At least 8.0 | % | At least 10.0 | % | ||||||
| Tier I Capital to Risk Weighted Assets |
||||||||||||
| Company |
8.8 | % | At least 4.0 | % | N/A | |||||||
| Bank |
9.6 | % | At least 4.0 | % | At least 6.0 | % | ||||||
| Tier I Capital to Average Assets |
||||||||||||
| Company |
6.7 | % | At least 4.0 | % | N/A | |||||||
| Bank |
7.4 | % | At least 4.0 | % | At least 5.0 | % | ||||||
As the above table indicates, at December 31, 2010 the Company (on a consolidated basis) and the Bank (on a stand-alone basis) exceeded the capital ratios required for classification as well-capitalized institutions under federally mandated capital standards and federally established prompt corrective action regulations.
Basel and Basel II Capital Requirements
The current risk-based capital guidelines which apply to the Company and the Bank are based upon the 1988 capital accord of the International Basel Committee on Banking Supervision, a committee of central banks and bank supervisors/regulators from the major industrialized countries that develops broad policy guidelines for use by each country’s supervisors in determining the supervisory policies they apply. A new international accord, referred to as Basel II, which emphasizes internal assessment of credit, market and operational risk; supervisory assessment and market discipline in determining minimum capital requirements, became mandatory for large or “core” international banks outside the U.S. in 2008 (total assets of $250 billion or more or consolidated foreign exposures of $10 billion or more); is optional for others, and if adopted, must first be complied with in a “parallel run” for two years along with the existing Basel I standards. In January 2009, the Basel Committee proposed to reconsider regulatory-capital standards, supervisory and risk-management requirements and additional disclosures in the final new accord in response to recent worldwide developments.
In December 2009, the Basel Committee on Banking Supervision issued a consultative document entitled “Strengthening the Resilience of the Banking Sector.” If adopted as proposed, this could increase significantly the aggregate equity that bank holding companies are required to hold by disqualifying certain instruments that previously have qualified as Tier 1 capital. In addition, it would increase the level of risk-weighted assets. The proposal could also increase the capital charges imposed on certain assets potentially making certain businesses more expensive to conduct. Regulatory agencies have not opined on the proposal for implementation.
FDIC Deposit Insurance
The FDIC is an independent federal agency that insures deposits, up to prescribed statutory limits, of federally insured banks and savings institutions in order to safeguard the safety and soundness of the banking and savings industries. The FDIC insures customer deposits through the Deposit Insurance Fund (the “DIF”) up to prescribed limits for each depositor. Pursuant to the Dodd-Frank Act, the maximum deposit insurance amount has been increased from $100,000 to $250,000. The DIF is funded primarily by FDIC assessments paid by each DIF member institution. The amount of each DIF member’s assessment is based on its relative risk of default as measured by regulatory capital ratios and other supervisory factors. Pursuant to the Federal Deposit Insurance Reform Act of 2005, the FDIC is authorized to set the reserve ratio for the DIF annually at between 1.15% and 1.50% of estimated insured deposits. The FDIC may increase or decrease the assessment rate schedule on a semi-annual basis. The Dodd-Frank Act increased the minimum reserve ratio (the ratio of the net worth of the DIF to estimated insured deposits) from 1.15% of estimated deposits to 1.35% of estimated deposits (or a comparable percentage of the asset-based assessment base described above). The Dodd-Frank Act requires the FDIC to offset the effect of the increase in the minimum reserve ratio when setting assessments for insured depository institutions with less than $10 billion in total consolidated assets, such as the Bank. The FDIC has until September 30, 2020 to achieve the new minimum reserve ratio of 1.35%.
18
Table of Contents
On February 27, 2009, the FDIC adopted a rule modifying the risk-based assessment system and setting new initial base assessment rates effective April 1, 2009. Rates range from a minimum of 12 cents per $100 of domestic deposits for well-managed, well-capitalized institutions with the highest credit ratings, to 45 cents per $100 for those institutions posing the most risk to the DIF. Risk-based adjustments to the initial assessment rate may lower the rate to 7 cents per $100 of domestic deposits for well-managed, well-capitalized banks with the highest credit ratings, or may raise the rate to 77.5 cents per $100 for depository institutions posing the most risk to the DIF. On May 22, 2009, the FDIC adopted a final rule imposing a 5 basis point special assessment on each insured depository institution’s assets minus Tier 1 capital as of June 30, 2009. The amount of the special assessment for any institution was limited to 10 basis points times the institution’s assessment base for the second quarter 2009. On September 29, 2009, the FDIC increased the annual assessment rates uniformly by 3 basis points beginning in 2011. On November 17, 2009, the FDIC amended its regulations to require insured institutions to prepay their estimated quarterly risk-based assessments for the fourth quarter of 2009, and for all of 2010, 2011, and 2012. On its own initiative, the FDIC exempted certain institutions from the prepayment requirement and the Bank was notified in the fourth quarter of 2009 that it had been granted such an exemption.
The Dodd-Frank Act requires changes to a number of components of the FDIC insurance assessment, with an implementation date of April 1, 2011. The changes amend the current methodology used to determine the assessments paid by institutions with assets greater than $10 billion, including changing the assessment base from deposits to total average assets less Tier 1 capital. Additionally, the FDIC has developed a scorecard approach to determine a separate assessment rate for each institution with assets greater than $10 billion. These changes will have no impact to the Bank.
Additionally, all FDIC-insured institutions are required to pay assessments to the FDIC to fund interest payments on bonds issued by the Financing Corporation (“FICO”), an agency of the Federal government established to recapitalize the predecessor to the DIF. The FICO assessment rates, which are determined quarterly, averaged 0.0113% of insured deposits in fiscal 2010. These assessments will continue until the FICO bonds mature in 2017.
Those banks electing to participate in the FDIC’s Temporary Liquidity Guarantee Program will become subject to an additional temporary assessment on deposits in excess of $250,000 in certain transaction accounts and additionally for assessments from 50 basis points to 100 basis points per annum depending on the initial maturity of the debt.
The FDIC may terminate a depository institution’s deposit insurance upon a finding that the institution’s financial condition is unsafe or unsound or that the institution has engaged in unsafe or unsound practices that pose a risk to the DIF or that may prejudice the interest of the bank’s depositors. Pursuant to California law, the termination of a California state chartered bank’s FDIC deposit insurance would result in the revocation of the bank’s charter, forcing it to cease conducting banking operations.
Community Reinvestment Act and Fair Lending Developments
The Bank is subject to fair lending requirements and the evaluation of its small business operations under the Community Reinvestment Act (“CRA”). That Act generally requires the federal banking agencies to evaluate the record of a bank in meeting the credit needs of its local communities, including those of low- and moderate-income neighborhoods in its service area. A bank may be subject to substantial penalties and corrective measures for a violation of fair lending laws. Federal banking agencies also may take compliance with fair lending laws into account when regulating and supervising other activities of a bank or its bank holding company.
A bank’s compliance with its CRA obligations is based on a performance-based evaluation system which determines the bank’s CRA ratings on the basis of its community lending and community development performance. When a bank holding company files an application for approval to acquire a bank or another bank holding company, the Federal Reserve Board will review the CRA assessment of each of the subsidiary banks of the applicant bank holding company, and a low CRA rating may be the basis for denying the application.
USA Patriot Act of 2001
In October 2001, the Uniting and Strengthening America by Providing Appropriate Tools Required to Intercept and Obstruct Terrorism (USA Patriot Act) of 2001 was enacted into law in response to the September 11, 2001 terrorist attacks. The USA Patriot Act was adopted to strengthen the ability of U.S. law enforcement and intelligence agencies to work cohesively to combat terrorism on a variety of fronts.
19
Table of Contents
Of particular relevance to banks and other federally insured depository institutions are the USA Patriot Act’s sweeping anti-money laundering and financial transparency provisions and various related implementing regulations that:
| • | establish due diligence requirements for financial institutions that administer, maintain, or manage private bank accounts and foreign correspondent accounts; |
| • | prohibits US institutions from providing correspondent accounts to foreign shell banks; |
| • | establish standards for verifying customer identification at account opening; |
| • | set rules to promote cooperation among financial institutions, regulatory agencies and law enforcement entities in identifying parties that may be involved in terrorism or money laundering; |
Under implementing regulations issued by the U.S. Treasury Department, banking institutions are required to incorporate a customer identification program into their written money laundering plans that includes procedures for:
| • | verifying the identity of any person seeking to open an account, to the extent reasonable and practicable; |
| • | maintaining records of the information used to verify the person’s identity; and |
| • | determining whether the person appears on any list of known or suspected terrorists or terrorist organizations. |
Consumer Laws
The Company and the Bank are subject to a broad range of federal and state consumer protection laws and regulations prohibiting unfair or fraudulent business practices, untrue or misleading advertising and unfair competition. Those laws and regulations include:
| • | The Home Ownership and Equity Protection Act of 1994, or HOEPA, which requires additional disclosures and consumer protections to borrowers designed to protect them against certain lending practices, such as practices deemed to constitute “predatory lending.” |
| • | Laws and regulations requiring banks to establish privacy policies which limit the disclosure of nonpublic information about consumers to nonaffiliated third parties. |
| • | The Fair Credit Reporting Act, as amended by the Fair and Accurate Credit Transactions Act, or the FACT Act, which requires banking institutions and financial services businesses to adopt practices and procedures designed to help deter identity theft, including developing appropriate fraud response programs, and provides consumers with greater control of their credit data. |
| • | The Truth in Lending Act, or TILA, which requires that credit terms be disclosed in a meaningful and consistent way so that consumers may compare credit terms more readily and knowledgeably. |
| • | The Equal Credit Opportunity Act, or ECOA which generally prohibits, in connection with any consumer or business credit transaction, discrimination on the basis of race, color, religion, national origin, sex, marital status, age (except in limited circumstances), or the fact that a borrower is receiving income from public assistance programs. |
| • | The Fair Housing Act, which regulates many lending practices, including making it unlawful for any lender to discriminate in its housing-related lending activities against any person because of race, color, religion, national origin, sex, handicap or familial status. |
| • | The Home Mortgage Disclosure Act, or HMDA, which includes a “fair lending” aspect that requires the collection and disclosure of data about applicant and borrower characteristics as a way of identifying possible discriminatory lending patterns and enforcing anti-discrimination statutes. |
| • | The Real Estate Settlement Procedures Act, or RESPA, which requires lenders to provide borrowers with disclosures regarding the nature and cost of real estate settlements and prohibits certain abusive practices, such as kickbacks. |
| • | The National Flood Insurance Act, or NFIA, which requires homes in flood-prone areas with mortgages from a federally regulated lender to have flood insurance. |
The Bank Holding Company Act of 1956, as amended, and the Change in Bank Control Act of 1978, as amended, together with regulations of the FRB, require that, depending on the particular circumstances, FRB approval must be obtained prior to any person or company acquiring “control” of a Federal Reserve member bank, such as the Bank, subject to exemptions for some transactions. Control is conclusively presumed to exist if an individual or company (i) acquires 25% or more of any class of voting securities of the
20
Table of Contents
bank or (ii) has the direct or indirect power to direct or cause the direction of the management and policies of the bank, whether through ownership of voting securities, by contract or otherwise; provided that no individual will be deemed to control a bank solely on account of being director, officer or employee of the bank. Control is presumed to exist if a person acquires 10% or more but less than 25% of any class of voting securities of a bank holding company with securities registered under Section 12 of the Exchange Act or if no other person will own a greater percentage of that class of voting securities immediately after the transaction.
Regulation W
The FRB has adopted Regulation W to comprehensively implement sections 23A and 23B of the Federal Reserve Act.
Sections 23A and 23B and Regulation W limit transactions between a bank and its affiliates and limit a bank’s ability to transfer to its affiliates the benefits arising from the bank’s access to insured deposits, the payment system and the discount window and other benefits of the Federal Reserve system. The statute and regulation impose quantitative and qualitative limits on the ability of a bank to extend credit to, or engage in certain other transactions with, an affiliate (and a non-affiliate if an affiliate benefits from the transaction). However, certain transactions that generally do not expose a bank to undue risk or abuse the safety net are exempted from coverage under Regulation W.
Historically, a subsidiary of a bank was not considered an affiliate for purposes of Sections 23A and 23B, since their activities were limited to activities permissible for the bank itself. However, the Gramm-Leach-Bliley Act authorized “financial subsidiaries” that may engage in activities not permissible for a bank. These financial subsidiaries are now considered affiliates. Certain transactions between a financial subsidiary and another affiliate of a bank are also covered by sections 23A and 23B and under Regulation W.
Regulatory Action by the FRB and DFI
As previously reported in a Current Report on Form 8-K dated August 31, 2010 and filed with the SEC, on August 31, 2010, the members of the respective Boards of Directors of the Company and the Bank entered into a Written Agreement (the “FRB Agreement”) with the Federal Reserve Bank of San Francisco (the “FRB”). On the same date, the Bank consented to the issuance of a Final Order (the “DFI Order”) by the DFI. The principal purposes of the Agreement and Order, which constitute formal supervisory actions by the FRB and the DFI, are to require us to adopt and implement formal plans and take certain actions, as well as to continue implementing measures that we previously adopted, to address the adverse consequences that the economic recession has had on the performance of our loan portfolio and our operating results and to increase our capital to strengthen our ability to weather any further adverse conditions that might arise if the hoped-for economic recovery does not materialize.
The FRB Agreement and DFI Order contain substantially similar provisions. They require the Boards of Directors of the Company and the Bank to prepare and submit written plans to the FRB and the DFI that address the following matters: (i) strengthening board oversight of the management operations of the Bank; (ii) strengthening credit risk management practices and improving credit administration policies and procedures; (iii) improving the Bank’s position with respect to problem assets; (i) maintaining adequate reserves for loan and lease losses in accordance with applicable supervisory guidelines; (v) improving the capital position of the Bank and, in the case of the FRB Agreement, the capital position of the Company; (vi) adopting and implementing a strategic plan and a budget for fiscal 2011; and (vii) submitting a funding contingency plan for the Bank that identifies available sources of liquidity and includes a plan for dealing with potential adverse economic and market conditions. In addition, the FRB Agreement and the DFI Order place restrictions on the Bank’s lending to borrowers who have loans that were criticized in an joint examination of the Bank conducted by the FRB and DFI earlier this year and requires the Bank to charge off or collect loans that were classified as “loss” in that examination (to the extent that the Bank has not already done so). The Bank is also prohibited from paying dividends to the Company without the prior approval of the DFI, and without the prior approval of the FRB the Company may not declare or pay cash dividends, repurchase any of its shares, make payments on its trust preferred securities or incur or guarantee any debt.
Under the FRB Agreement, the Company also must submit a capital plan to the FRB that will meet with its approval and then implement that plan. Under the DFI Order, the Bank was required to achieve a ratio of adjusted tangible shareholders’ equity to its tangible assets to 9.0% by January 31, 2011, by raising additional capital, generating earnings or reducing the Bank’s tangible assets (subject to a 15% limitation on such a reduction) or a combination thereof and, upon achieving that ratio, to thereafter maintain that ratio during the Term of the Order.
The DFI Order also states that if the Bank were to violate or fail to comply with the Order, the Bank could be deemed to be conducting business in an unsafe manner which could subject the Bank to further regulatory enforcement action.
The Company and the Bank already have made substantial progress with respect to several of these requirements and both the Board and management are committed to achieving all of the requirements on a timely basis. Among other things, in August 2010, we completed a private placement of its Series A Convertible Preferred Stock, raising gross proceeds of $12,655,000, of which $10,250,000 was contributed to the Bank to increase its equity capital.
Since the issuance of the DFI Order, we also have made a concerted effort to raise the additional capital needed to increase the Bank’s ratio of tangible equity-to-tangible assets to 9.0% by January 31, 2011, as required by the DFI Order. Among other things, we retained a nationally recognized investment banking firm to assist us in those efforts and we have engaged in substantive discussions with a number of institutional investors that have expressed an interest in making a capital investment in the Company and we are negotiations with some of them with respect to the terms of such a capital investment.
However, as previously reported, notwithstanding those efforts, which are continuing, we were not able to raise the capital needed to increase the Bank’s ratio of tangible equity-to-tangible assets to 9.0% by January 31, 2011, as required by the DFI Order. Nevertheless, the DFI has notified us that it will not take any action against the Bank at this time because the Bank has not, as yet, met that capital requirement. We understand that this decision was based on the progress we have made since August 31, 2010 in increasing the Bank’s capital ratio, improvements made in the Bank’s financial condition, including reductions in the Bank’s non-performing assets, and the Bank’s classification as a “well-capitalized” banking institution under federal bank regulatory guidelines and federally established prompt corrective action regulations.
We cannot, however, predict when or even if we will succeed in meeting the capital requirements of the DFI Order in the near term and the DFI is not precluded from taking enforcement action against the Bank if its financial condition were to worsen or if Bank failed to achieve further improvements in its capital ratio.
A copy of the FRB Agreement is attached as Exhibit 10.1, and a copy of the DFI Order is attached as Exhibit 10.2, to the Current Report on Form 8-K dated August 31, 2010. The foregoing summary of the FRB Agreement and the DFI Order is qualified in its entirety by reference to those Exhibits.
Employees
As of December 31, 2010, we employed 220 persons on a full-time equivalent basis. None of our employees are covered by a collective bargaining agreement. We believe relations with our employees are good.
Information Available on our Website
Our Internet address is www.pmbank.com. We make available on our website, free of charge, our filings made with the SEC electronically, including those on Form 10-K, Form 10-Q, and Form 8-K, and any amendments to those filings. Copies of these filings are available as soon as reasonably practicable after we have filed or furnished these documents to the SEC (at www.sec.gov).
21
Table of Contents
| ITEM 1A. | RISK FACTORS |
This Report contains forward-looking statements within the meaning of Section 27A of the Securities Act of 1933, as amended, and Section 21E of the Securities Exchange Act of 1934, as amended. Forward-looking statements discuss our expectations, beliefs or views regarding our future operations, future financial performance, or financial or other trends in our business or markets. Forward-looking statements can be identified by the fact that they do not relate strictly to historical or current facts. Often, they include the words “believe,” “expect,” “anticipate,” “intend,” “plan,” “estimate,” “project,” or words of similar meaning, or future or conditional verbs such as “will,” “would,” “should,” “could,” or “may.” Such forward-looking statements are based on current information and assumptions about future events over which we do not have control and our business is subject to a number of risks and uncertainties that could cause our financial condition or actual operating results in the future to differ significantly from our expected financial condition or operating results that are set forth in those forward-looking statements.
Those risks and uncertainties include, although they are not limited to, the following:
The United States is currently still in an economic recession that continues to adversely affect the banking and financial services industry in general, and our business and financial performance, in particular, and has created substantial uncertainties and risks for our business and future financial performance
The United States is still in an economic recession, which is reported to have begun at the end of 2007 and has created wide ranging consequences and difficulties for the banking and financial services industry, in particular, and the economy in general. The recession began with dramatic declines in the housing market, which resulted in decreasing home prices and increasing loan delinquencies and foreclosures that led to significant write-downs of the assets and an erosion of the capital of a large number of lending and other financial institutions. As a result, several very large and prominent banking and financial organizations, such as Merrill Lynch, Bear Stearns, Wachovia Bank and Washington Mutual had to seek merger partners to survive and others, such as Lehman Bros. and Indy Mac Bank, failed and went out of business, which led to concerns over the stability and viability of the financial markets. In an effort to preserve their capital and avoid increased losses, banks and other lending institutions severely tightened their credit standards and significantly reduced their lending activities, creating a credit crisis that has led to a contraction of the economy, significant increases in unemployment and significant reductions in business and consumer spending.
As a result, like many other banks, we experienced substantial increases in loan delinquencies and defaults, not only in our real estate, but also in our commercial loan portfolios that resulted in significant increases in loan losses in 2008, 2009 and 2010. Those loan losses, coupled with the prospect that economic and market conditions, including high unemployment rates and further declines in real estate values, are not likely to improve to any significant extent until at least the second half of 2011 or even the beginning of 2012, has led us (and many other banks) to significantly increase loan loss reserves by charges to income that contributed to the losses we incurred in 2008, 2009 and 2010.
As a result of these conditions and the prospect that economic and market conditions will not soon recover, we face a number of risks that could adversely affect our operating results and financial condition in the future, including the following:
| • | We could incur additional loan losses, and experience an increase in foreclosures of real properties collateralizing loans that we have made that would require us to set aside additional reserves for possible declines in the value of or the costs of maintaining those properties, which could adversely affect our results of operations and cause us to incur operating losses in 2011. |
| • | Due to the uncertainties about economic conditions in 2011, there is an increased risk that the judgments that we might make in estimating loan losses that may be inherent in our loan portfolio and in establishing loan loss reserves will prove to be incorrect, requiring us to set aside additional reserves that would adversely affect our results of operation, as occurred in 2008, 2009 and, to a lesser extent, in 2010. |
| • | Possible further declines in economic activity in the United States, generally, and in our markets, in particular, due to lack of business and consumer spending and high unemployment could result in reductions in loan demand and a further tightening of credit that would lead to reductions in our interest income, net interest income and margins. |
22
Table of Contents
| • | Adverse economic conditions, such as a continued tightening of available business and consumer credit and continued high unemployment, could lead customers to withdraw funds from their deposit accounts with us to meet their operating or living expenses, which could reduce our liquidity and, therefore, the funds we would have available for lending, as a result of which our interest income could decline, possibly significantly, and our costs of funds could increase, thereby adversely affecting our operating results and financial condition. |
| • | In response to the causes of the credit and foreclosure crises and the economic recession, the federal government may increase regulation of and impose new restrictions on banks and other financial institutions, which would increase our costs of doing business and limit our ability to pursue business and growth opportunities. |
| • | If we are unable to meaningfully reduce our loan losses in 2011, we could be subjected to the imposition, by our federal and state bank regulators, of additional restrictions on our operations that could adversely affect our operating results and a requirement to raise additional capital that could dilute our existing shareholders. See “ — Risks and Uncertainties Posed by the FRB Agreement and DFI Order,” in this section below. |
| • | We, as well as all other federally insured banks, may be required to pay significantly higher FDIC premiums to replenish the FDIC’s insurance fund, which would increase our operating expenses and could adversely affect our income. |
| • | There is no assurance that the enactment of the Dodd-Frank Act and the implementation of regulatory programs and initiatives which are designed to address these difficult market and economic conditions will prove to be successful in curtailing the recession and providing the stimulus and resources needed to improve the economy. In addition, the impact of this legislation and these regulatory initiatives on the financial markets is uncertain and if they fail to lead to improvements in economic and market conditions, the recession could worsen and thereby adversely affect our business, financial condition, results of operations, access to credit and the market value of our securities. |
We could incur losses on the loans we make
There has been a significant slowdown in the housing market and a significant increase in real estate loan foreclosures in portions of Los Angeles, Orange, Riverside and San Diego counties of California where a majority of our loan customers are based. This slowdown reflects declining prices and excess inventories of unsold homes and increases in unemployment and a resulting loss of confidence about the future among businesses and consumers that have combined to adversely affect business and consumer spending. These conditions have led to increased loan defaults in 2010. A continuing deterioration in the real estate market and a continuation or worsening of the economic recession could result in additional loan charge-offs and increases in the provisions for loan losses in the future, which could cause us to incur additional losses and have a material adverse effect on our operating results, financial condition and capital.
Risks and Uncertainties Posed by the FRB Agreement and the DFI Order
As previously reported in our Current Report on Form 8-K dated August 31, 2010, the members of the respective Boards of Directors of the Company and the Bank entered into a Written Agreement (the “Agreement”) with the Federal Reserve Bank of San Francisco (the “FRB”). On the same date, the Bank consented to the issuance of a Final Order (the “Order”) by the California Department of Financial Institutions (the “DFI”). See “Supervision and Regulation — Regulatory Action by the FRB and DFI” in Part I of this Report above. Set forth below is a description of material risks and uncertainties created by the FRB Agreement and DFI Order.
We are required to raise additional equity capital, but that capital may not be available on terms acceptable to us or at all. The DFI Order required us to increase the Bank’s ratio of tangible shareholder’s equity-to-total tangible assets to 9.0% by January 31, 2011. Although we have been able to increase its capital ratio, we were not able to meet this requirement by that date. Although the DFI informed us that it will not take any action against the Bank at this time because the Bank was unable to meet that capital requirement by the January 31, 2011 deadline, it still is necessary for us to raise additional capital to meet that requirement in the near term and we are continuing our efforts to do so. However, our ability to raise additional capital will depend on conditions in the capital markets, economic conditions and a number of other factors, many of which are outside our control, as well as our financial performance. Accordingly, there is no assurance that we will be able to raise additional capital in amounts sufficient to meet regulatory requirements on terms acceptable to us or otherwise. If we are unable to raise such additional capital, the DFI and the FRB could (i) require us to reduce the size of our loan portfolio by limiting the volume of new loans that we can make or by selling loans or other interest-earning assets as a means of increasing our capital ratios, or (ii) impose other restrictions on our business operations, either or both of which would adversely affect our results of operations and the market price of our shares.
Our shareholders may be diluted by the sale of additional shares of our common stock in the future. In order to raise the additional capital required by the DFI Order, it will be necessary for us to sell additional shares of stock at a time when the market prices of bank stocks, including our own, are at historic lows. As a result, the sale of additional shares is likely to be dilutive of the ownership that our existing shareholders have in the Company.
23
Table of Contents
The Company and the Bank are subject to additional regulatory oversight pursuant to the FRB Agreement and the DFI Order which may increase the costs of doing business and restrict our ability to grow our banking franchise. Under the terms of the FRB Agreement and DFI Order, the Company and the Bank are required to implement certain corrective and remedial measures within strict time frames. Among other things, we are required to maintain certain levels of liquidity and loan loss reserves, which could reduce our operating income. In addition, we are required to increase management oversight of our operations and we will be subject to more frequent regulatory examinations, which may increase our operating expenses. However, at the same time, we will be continuing our efforts to reduce our operating expenses in order to improve our results of operations, which could require cutbacks in staffing and the implementation of other measures, including possibly reducing the scope of our operations or the size of the Bank. As a consequence, the FRB Agreement and the DFI Order could have a material adverse effect on our business, financial condition, results of operations, cash flows or future prospects.
The Bank is restricted from paying dividends to us and we are restricted from paying dividends to our shareholders and from making payments on our trust preferred securities. The payment of dividends by the Bank to us is our primary source of funds for paying dividends to our shareholders and paying our financial obligations, which currently consist primarily of interest payments on our junior subordinated debentures (the “Debentures”). Pursuant to the FRB Agreement and DFI Order, the Bank may not pay cash dividends to us without the approval of the FRB and DFI and we may not pay cash dividends to our shareholders or interest on the Debentures without the prior approval of the FRB. As previously reported, we began to defer interest payments on the Debentures in mid-2010, when we were advised by the FRB that it would not approve further interest payments pending an improvement in our operating results and we cannot predict when the FRB will permit us to resume such payments. Although we are permitted to defer interest payments on the Debentures for up to 20 consecutive quarters, and we have sufficient cash to make the required interest payments on the Debentures, if we are not permitted by the FRB to pay the deferred interest and resume making interest payments by the end of that five year period, then we would be in default of our obligations under the Debentures, in which event the entire principal amount of and accrued but unpaid interest on the Debentures would become immediately due and payable.
Failure to satisfy the requirements of the FRB Agreement or the DFI Order could subject us to regulatory enforcement actions and additional restrictions on our business. There is no assurance that we will be able to meet the requirements of the FRB Agreement or the DFI Order. If we are unable to do so, the FRB and DFI could subject us to additional regulatory enforcement actions, which could include the assessment of civil money penalties on us and the Bank, as well as our respective directors, officers and other affiliated parties, and the imposition of further restrictions on our business, or even the termination of the Bank’s FDIC deposit insurance in the event we are unable to generate profits or we were to suffer a significant decline in our capital position.
24
Table of Contents
The enactment of the Dodd-Frank Act poses uncertainties for our business and is likely to increase our costs of doing business in the future.
On July 21, 2010, the President signed the Dodd-Frank Act into law. This legislation makes extensive changes to the laws regulating financial services firms and requires significant rule-making. In addition, the legislation mandates multiple studies, any of which may result in additional legislative or regulatory action. While the full effects of the legislation on us and our business cannot yet be determined, it is expected to result in higher compliance and other costs, reduced revenue or operations and higher capital and liquidity requirements, among other things, which could adversely affect our business and results of operations. See “Item 1. Business – Impact of Economic Conditions, Government Policies and Legislation on our Business.”
Additionally, the Dodd-Frank Act creates a new, independent federal agency called the Consumer Financial Protection Bureau, or the Bureau. The Bureau is granted rulemaking authority over several federal consumer financial protection laws and, in some instances, has the authority to examine and enforce compliance with these laws and regulations. In addition, the Federal Reserve will be adopting a rule addressing interchange fees for debit card transactions that is expected to lower fee income generated from this source. Although this rule technically only applies to institutions with assets in excess of $10 billion, it is expected that smaller institutions, such as the Bank, may also be impacted.
The Dodd-Frank Act also permits states to adopt consumer protection laws and standards that are more stringent than those adopted at the federal level and permits state attorneys general to, in certain circumstances, enforce compliance with both the state and federal laws and regulations.
Liquidity risk could impair our ability to fund operations and jeopardize our financial condition
Liquidity is essential to our business. An inability to raise funds through deposits, borrowings, the sale of loans and other sources could have a material adverse effect on our liquidity. Our access to funding sources in amounts adequate
25
Table of Contents
to finance our lending and other activities could be impaired by factors that affect us specifically or the financial services industry in general, including a decrease in the level of business activity due to the market downturn or the imposition of regulatory restrictions on our operations. Our ability to acquire deposits or borrow, or raise additional equity capital, could also be impaired by factors that are not specific to us, such as a continued severe disruption of the financial markets or negative views and expectations about the prospects for the financial services industry as a whole, particularly if the recent turmoil faced by banking organizations in the domestic and worldwide credit markets deteriorates.
We face intense competition from other banks and financial institutions that could hurt our business
We conduct our business operations in Southern California, where the banking business is highly competitive and is dominated by a relatively small number of large multi-state, as well as large in-state, banks with operations and offices covering wide geographical areas. We also compete with other financial service businesses, mutual fund companies, and securities brokerage and investment banking firms that offer competitive banking and financial products and services as well as products and services that we do not offer. The larger banks, and some of those other financial institutions, have greater resources that enable them to conduct extensive advertising campaigns and to shift resources to regions or activities of greater potential profitability. Some of these banks and institutions also have substantially more capital and higher lending limits that enable them to attract larger clients, and offer financial products and services that we are unable to offer, particularly with respect to attracting loans and deposits. Increased competition may prevent us (i) from achieving increases, or could even result in decreases, in our loan volume or deposit balances, or (ii) from increasing interest rates on loans or reducing interest rates we pay to attract or retain deposits, either or both of which could cause a decline in our interest income or an increase in our interest expense, that could lead to reductions in our net interest income and earnings.
Adverse changes in economic conditions in Southern California could disproportionately harm our business
The substantial majority of our customers and the properties securing a large proportion of our loans are located in Southern California. A continued downturn in economic conditions or the occurrence of natural disasters, such as earthquakes or fires, which are more common in Southern California than in other parts of the country, could harm our business by:
| • | reducing loan demand which, in turn, would lead to reduced net interest margins and net interest income; |
| • | adversely affecting the financial capability of borrowers to meet their loan obligations, which could result in increases in loan losses and require us to make additional provisions for possible loan losses, thereby adversely affecting our operating results; and |
| • | causing reductions in real property values that, due to our reliance on real property to secure many of our loans, could make it more difficult for us to prevent losses from being incurred on non-performing loans through the sale of such real properties. |
Our business is subject to interest rate risk and variations in interest rates may negatively affect our financial performance
A substantial portion of our income is derived from the differential or “spread” between the interest we earn on loans, securities and other interest-earning assets, and interest we pay on deposits, borrowings and other interest-bearing liabilities. Because of the differences in the maturities and repricing characteristics of our interest-earning assets and interest-bearing liabilities, changes in interest rates do not produce equivalent changes in interest income earned on interest-earning assets and interest paid on interest-bearing liabilities. Accordingly, fluctuations in interest rates could adversely affect our interest rate spread and, in turn, our profitability. In addition, loan origination volumes are affected by market interest rates. Rising interest rates, generally, are associated with a lower volume of loan originations while lower interest rates are usually associated with higher loan originations. Conversely, in rising interest rate environments, loan repayment rates may decline and in falling interest rate environments, loan repayment rates may increase. Also, in a rising interest rate environment, we may need to accelerate the pace of rate increases on our deposit accounts as compared to the pace of future increases in short-term market rates. Accordingly, changes in market interest rates could materially and adversely affect our net interest spread, asset quality and loan origination volume.
26
Table of Contents
Government regulations may impair our operations, restrict our growth or increase our operating costs
We are subject to extensive supervision and regulation by federal and state bank regulatory agencies. The primary objective of these agencies is to protect bank depositors and other customers and not shareholders, whose respective interests will often differ. The regulatory agencies have the legal authority to impose restrictions which they believe are needed to protect depositors and customers of banking institutions, even if those restrictions would adversely affect the ability of the banking institution to expand its business or pay cash dividends, or result in increases in its costs of doing business or hinder its ability to compete with financial services companies that are not regulated or banks or financial service organizations that are less regulated. Additionally, due to the complex and technical nature of many of the government regulations to which banking organizations are subject, inadvertent violations of those regulations may occur. In such an event, we would be required to correct or implement measures to prevent a recurrence of such violations. If more serious violations were to occur, the regulatory agencies could limit our activities or growth, fine us or ultimately put us out of business.
Premiums for federal deposit insurance will increase and may increase more.
The Federal Deposit Insurance Corporation uses the Deposit Insurance Fund to cover insured deposits in the event of a bank failure, and maintains the fund by assessing member banks an insurance premium. Recent failures have caused the DIF to fall below the minimum balance required by law, forcing the FDIC to consider action to rebuild the fund by raising the insurance premiums assessed member banks. Depending on the frequency and severity of bank failures, future increases in premiums or assessments could be significant and negatively affect our earnings.
The loss of key personnel could hurt our financial performance
Our success depends to a great extent on the continued availability of our existing management and, in particular, on Raymond E. Dellerba, our President and Chief Executive Officer. In addition to their skills and experience as bankers, our executive officers provide us with extensive community ties upon which our competitive strategy is partially based. As a result, the loss of the services of any of these officers could harm our ability to implement our business strategy or our future operating results.
Risks of our new residential mortgage lending business. During the quarter ended June 30, 2009, we commenced a new residential mortgage lending business pursuant to which we originate and purchase residential real estate mortgage loans that qualify for resale into the secondary mortgage market. The decision to commence that business was based on our belief that, beginning in 2009, there would be a substantial increase in the demand for conventional residential mortgage loans due to (i) the significant declines that have occurred in housing prices, particularly in Southern California, and (ii) the decreases in prevailing interest rates. In our view, these conditions have made home ownership more affordable for consumers with good credit histories who had previously been shut out of the residential real estate market primarily by the high prices of homes and increasing interest rates prior to mid-2008. However, the commencement of our new mortgage lending business poses a number of potentially significant risks that could adversely affect our business and future financial performance.
27
Table of Contents
Those risks include, among others: the strain that the commencement and growth of the new mortgage lending business will put on our cash and management resources; the risk that management’s time and efforts will be diverted from our existing banking business, which could hurt our operating results; the risk that our new mortgage lending business will not generate revenues in amounts sufficient to enable us to recover the substantial expenditures we have had to make to add experienced mortgage loan officers and administrators; the risk that our belief that the demand for residential mortgage loans will grow substantially will prove not to have been correct; and the risk that we will be unable to sell the mortgage loans we originate into the secondary mortgage market for amounts sufficient to cover the costs of that business if, for example, the interest rates prove to be volatile or the economic recession or ongoing credit crisis adversely affects the flow of funds into the secondary mortgage market. Accordingly, there is no assurance that our entry into the residential mortgage lending business will not hurt our earnings or cause us to incur losses in the future.
Expansion of our banking franchise might not achieve expected growth or increases in profitability and may adversely affect our operating results
We have grown substantially in the past eleven years by (i) opening new financial centers in population centers, (ii) offering new revenue generating products or services, such as the commencement, in the second quarter of 2009, of our mortgage banking operations, and (iii) adding banking professionals at our existing financial centers, with the objective of attracting additional customers including, in particular, small to medium size businesses, that will add to our profitability. We intend to continue that growth strategy. However, there is no assurance that we will continue to be successful in achieving our growth objectives. Implementation of this strategy will require us to incur expenses in establishing new financial centers or adding banking professionals, long before we are able to attract, and with no assurance that we will succeed in attracting, a sufficient number of new customers that will enable us to generate the revenues needed to increase our profitability. As a result, our financial performance could decline if we are unable to successfully implement our growth strategy.
Moreover, as a result of the losses we have incurred during the past three years, the need to dedicate more personnel to the management and reduction of non-performing loans, and our increased focus our raising additional capital and returning the Bank to profitability, we have had to significantly curtail our growth strategy and we cannot predict how long it will be before we will able to resume the full implementation of that strategy.
Our computer and network systems may be vulnerable to unforeseen problems and security risks
The computer systems and network infrastructure that we use to provide automated and internet banking services could be vulnerable to unforeseen problems. Our operations are dependent upon our ability to protect our computer equipment against damage from fire, power loss, telecommunications failure, earthquakes and similar catastrophic events and from security breaches. Any of those occurrences could result in damage to or a failure of our computer systems that could cause an interruption in our banking services and, therefore, harm our business, operating results and financial condition. Additionally, interruptions in service and security breaches that could result in the theft of confidential customer information could lead existing customers to terminate their banking relationships with us and could make it more difficult for us to attract new banking customers.
We are exposed to risk of environmental liabilities with respect to properties to which we take title
Due to the current economic recession, the resulting financial difficulties encountered by many borrowers and the declines in the market values and in the demand for real properties, during 2010 we had to initiate foreclosure proceedings with respect to and take title to an increased number of real properties that had collateralized loans which had become nonperforming. Moreover, if the economic recession worsens, we may have to foreclose and take title to additional real properties in 2011. As a result, we could become subject to environmental liabilities and incur costs, which could be substantial, with respect to these properties for property damage, personal injury, investigation and clean-up costs incurred in connection with environmental contamination at such properties. In addition, if we are the owner or former owner of a contaminated site, we may be subject to common law claims by third parties seeking damages and costs resulting from environmental contamination emanating from the site. If we become subject to significant environmental liabilities on costs, our business, financial condition, results of operations and prospects could be adversely affected.
Managing reputational risk is important to attracting and maintaining customers, investors and employees
Threats to our reputation can come from many sources, including adverse sentiment about financial institutions generally, unethical practices, employee misconduct, failure to deliver minimum standards of service or quality, compliance deficiencies, and questionable or fraudulent activities of our customers. We have policies and procedures in place to protect our reputation and promote ethical conduct, but these policies and procedures may not be fully effective. Negative publicity regarding our business, employees, or customers, with or without merit, may result in the loss of customers, investors and employees, costly litigation, a decline in revenues and increased governmental regulation.
The price of our common stock may be volatile or may decline
The trading price of our common stock may fluctuate widely as a result of a number of factors, many of which are outside our control. In addition, our stock price has been adversely affected by the losses we have incurred in the past two years and uncertainty as to how soon we will return to profitability. Moreover our stock price in the future could be adversely affected by other factors, some of which are outside of our control, including:
| • | actual or anticipated quarterly fluctuations in our operating results or financial condition; |
| • | failure to meet analysts’ revenue or earnings estimates; |
| • | the imposition of additional regulatory restrictions on our business and operations or an inability to meet regulatory requirements such as those contained in the FRB Agreement and DFI Order; |
| • | strategic actions by us or our competitors, such as acquisitions or restructurings; |
28
Table of Contents
| • | fluctuations in the stock price and operating results of our competitors; |
| • | general market conditions and, in particular, developments related to market conditions for the financial services industry; |
| • | proposed or newly adopted legislative or regulatory changes or developments; or |
| • | anticipated or pending investigations, proceedings or litigation that involve or affect us. |
The stock market and, in particular, the market for the securities of financial institutions, has experienced significant volatility as a result of (i) the financial difficulties and losses encountered by a number of very large and prominent banking institutions and the closure of numerous banks in California and elsewhere throughout the country, which has adversely affected the stock prices of banks generally, including those that have been able so far to weather the difficult economic and market conditions, and (ii) concerns and a lack of confidence among investors that economic and market conditions will improve. As a result of these conditions and the losses we have incurred in the past three years, the market price of our common stock has not only been volatile, but also has declined significantly during these years, as has been the case with a large number of other banks, including many of our competitors. In addition, the trading prices of our common stock are affected by a number of factors, including our financial condition, performance, creditworthiness and prospects, but some of which are outside of our control, such as economic conditions generally and changes in the confidence about economic conditions among businesses and consumers. Moreover, there is no assurance that we will not experience a further decline in our stock price during 2011, which could result in substantial losses for our shareholders and could lead to costly and disruptive securities litigation.
We may face other risks
From time to time, other risks can arise with respect to our business and/or financial results which we will report in our filings with the Securities and Exchange Commission.
For further discussion of risks that can affect our financial performance or financial condition, also see “Item 7. — Management’s Discussion and Analysis of Financial Condition and the Results of Operations” below in this Report.
Due to these and other possible uncertainties and risks, you are cautioned not to place undue reliance on the forward looking statements contained in this Report, which speak only as of the date of this Report. We also disclaim any obligation to update or revise forward-looking statements contained in this Report, except as may be required by law or by NASDAQ.
| ITEM 1B. | UNRESOLVED STAFF COMMENTS |
None.
29
Table of Contents
| ITEM 2. | PROPERTIES |
Set forth below is information regarding our headquarters office and our seven existing financial services centers. All of our offices are leased.
| Location |
Square Footage |
Lease Expiration Date |
||||||
| Headquarters Offices and Internet Banking Facility: |
||||||||
| Costa Mesa, California |
21,000 | May, 2016 | ||||||
| Mortgage Banking Division: |
||||||||
| Costa Mesa, California |
4,000 | June, 2012 | ||||||
| Financial Centers: |
||||||||
| Costa Mesa, California |
3,000 | June, 2016 | ||||||
| Newport Beach, California |
10,500 | June, 2011 | ||||||
| San Juan Capistrano, California |
4,200 | February, 2013 | ||||||
| Beverly Hills, California |
4,600 | June, 2011 | ||||||
| La Jolla, California |
3,800 | February, 2012 | ||||||
| La Habra, California |
6,000 | January, 2013 | ||||||
| Ontario, California |
5,000 | May, 2012 | ||||||
| ITEM 3. | LEGAL PROCEEDINGS |
James Laliberte, et al. vs. Pacific Mercantile Bank, filed in May 2003 in the California Superior Court for the County of Orange (Case No. 030007092). As previously reported, this lawsuit was initially filed as an individual action by two plaintiffs for alleged violations by the Bank of the Federal Truth in Lending Act (the “TILA”). The two plaintiffs subsequently amended their complaint on three occasions, between November 2003 and May 2005, seeking to convert their individual action into a class action suit and adding additional allegations and seeking rescission of all loans made to the members of the class and damages based on allegations of fraud in the inducement of certain loans, unfair business practices and violations of TILA. In each case, the Bank filed demurrers asserting that the plaintiffs had failed to establish a legal basis for any recovery and in each case the trial court sustained the Bank’s demurrers and dismissed the plaintiffs’ lawsuit, without prejudice. Plaintiffs subsequently appealed the trial court’s rulings. In January 2007, the appellate court, in a published decision, affirmed the trial court’s order dismissing the plaintiffs’ suit, finding that plaintiffs had no right to assert class-wide claims of rescission. Plaintiffs then appealed this decision to the U.S. Supreme Court which, in May 2007, denied plaintiffs’ petition for review, effectively sustaining the appellate court’s ruling.
Plaintiffs, abandoning their claims of fraud and unfair business practices on the part of the Bank, then filed a motion with the trial court for class certification limited to the TILA and certain related statutory claims. In January 2008 the trial court denied the motion for class certification, finding that plaintiffs had not shown evidence that there were common questions of law or fact to justify certifying a class and had been unable to introduce any admissible evidence establishing that any statutory violations had occurred during the relevant class period.
However, in April 2008, plaintiffs filed an appeal of the trial court’s denial of their motion for class certification on the claims under TILA and the related statutory claims. In April 2009 the appellate court issued an order certifying plaintiff’s class action with respect to the TILA claims and remanded the case back to the trial court for further proceedings.
In November 2010, without any admission of any of plaintiffs’ allegations or any wrongdoing on its part, the Bank entered into an agreement with the plaintiffs providing for settlement of all of the claims that were the subject of the class action suit, subject to the approval of the settlement terms by the trial court. The trial court granted final approval of the settlement on March 22, 2011.
The settlement agreement provides for the Bank to establish a settlement fund in the amount of $225,000 for payment to the members of the class in full settlement of the class action lawsuit. The settlement agreement further provides that any individual who was eligible to become a member of the class, but elected not to participate in the class action, had the right to receive a payment from the Bank in the same amount received by each of the members of the class, provided that the individual submitted a claim form to the Class Administrator and the claim was accepted by the Bank. A handful of claims were received, but all were rejected by the Bank. No claimant filed an appeal with the Court, so the final settlement amount approved by the court remains at $225,000.
The settlement agreement expressly provided for a complete release of all claims against the Bank arising out of the subject matter of the class action suit, except for certain individual claims of the named plaintiffs which were pending in a separate trial proceeding. The settlement also permitted plaintiffs to apply for an award of attorneys’ fees and costs. Plaintiffs filed such a motion, and on March 22, 2011, the trial court issued an order requiring the Bank to pay fees and costs in the aggregate amount of $738,200. Notice of this ruling was issued on March 25, 2011, and the Bank has a period of 60 days from that date to file an appeal of the trial court’s ruling; but has not yet decided whether to do so.
In March 2011, the named plaintiffs agreed to a stipulated settlement of and a complete release of their individual claims against the Bank in exchange for the payment to them of an aggregate of $76,000.
We had previously established reserves in case of an adverse result in the class action suit and, therefore, the settlement payment and attorneys’ fee award are not expected to materially affect our future operating results or our cash or capital resources.
Other Legal Actions. We are subject to legal actions that arise from time to time in the ordinary course of our business. Currently there are no such pending legal proceedings that we believe will have a material adverse effect on our financial condition or results of operations.
30
Table of Contents
EXECUTIVE OFFICERS OF THE REGISTRANT
Set forth below is information, as of March 24, 2010, regarding our principal executive officers:
| Name and Age |
Positions with Bancorp and the Bank | |
| Raymond E. Dellerba, 63 | President and Chief Executive Officer of the Company and the Bank | |
| Nancy Gray, 60 | Senior Executive Vice President and Chief Financial Officer of the Company | |
| Robert W. Bartlett, 64 | Senior Executive Vice President and Chief Operating Officer of the Bank |
There is no family relationship between the above-named officers.
Raymond E. Dellerba has served as President, Chief Executive Officer and a Director of the Company and the Bank since the dates of their inception, which were January 2000 and November 1998, respectively, pursuant to a multi-year employment agreement. From February 1993 to June 1997, Mr. Dellerba served as the President, Chief Operating Officer and director of Eldorado Bank, and as Executive Vice President and a Director of its parent company, Eldorado Bancorp. Mr. Dellerba has more than 30 years of experience as a banking executive, primarily in Southern California and in Arizona.
Nancy Gray, who is a certified public accountant, has been a Senior Executive Vice President and the Chief Financial Officer of the Company and the Bank since May 2002. From 1980 through 2001, Ms. Gray was Senior Vice President and Financial Executive of Bank of America in Southern California, Missouri, Georgia, and Texas.
Robert W. Bartlett, joined Pacific Mercantile Bank as its Senior Executive Vice President and Chief Operating Officer on October 31, 2008. In his banking career spanning some 34 years, Mr. Bartlett has held key senior management positions in Orange and Los Angeles County banks to include Commercial Banking Manager, Area Credit Administrator, Chief Credit Officer and Chief Operating Officer.
31
Table of Contents
PART II
| ITEM 5. | MARKET FOR REGISTRANT’S COMMON EQUITY, RELATED STOCKHOLDER MATTERS AND ISSUER REPURCHASES OF EQUITY SECURITIES |
Trading Market for the Company’s Shares
Our common stock is traded on the NASDAQ National Market under the symbol “PMBC.” The following table presents the high and low sales prices as reported on the NASDAQ National Market of our common stock for each of the calendar quarters indicated below:
| High | Low | |||||||
| Year Ended December 31, 2010 |
||||||||
| First Quarter |
$ | 3.15 | $ | 2.75 | ||||
| Second Quarter |
$ | 5.25 | $ | 2.73 | ||||
| Third Quarter |
$ | 3.93 | $ | 2.99 | ||||
| Fourth Quarter |
$ | 4.01 | $ | 2.90 | ||||
| Year Ended December 31, 2009 |
||||||||
| First Quarter |
$ | 5.35 | $ | 3.06 | ||||
| Second Quarter |
$ | 4.27 | $ | 3.20 | ||||
| Third Quarter |
$ | 4.12 | $ | 2.97 | ||||
| Fourth Quarter |
$ | 3.48 | $ | 2.89 | ||||
The high and low per share sale prices of our common stock on the NASDAQ National Market on March 25, 2011, were $4.29 and $4.21 per share, respectively and, as of that same date, there were approximately 149 holders of record of our common stock.
Stock Price Performance
The graph on the following page compares the stock performance of our common stock, in each of the years in the five year period ended December 31, 2010, with that of (i) the Russell Microcap Index, which is comprised of the smallest 1,000 members of the Russell 2000 and the next smallest 1,000 companies, by market cap, which include the Company, and (ii) an index, published by SNL Securities L.C. (“SNL”) and known as the SNL Western Bank Index, which is comprised of 59 banks and bank holding companies (including the Company), the shares of which are listed on NASDAQ or the New York Stock Exchange and most of which are based in California and the remainder of which are based in nine other western states, including Oregon, Washington and Nevada.
32
Table of Contents
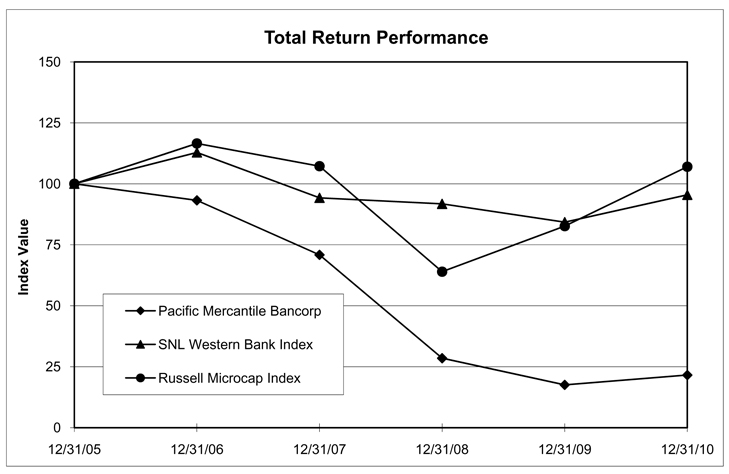
| Period Ending | ||||||||||||||||||||||||
| Index |
12/31/05 | 12/31/06 | 12/31/07 | 12/31/08 | 12/31/09 | 12/31/10 | ||||||||||||||||||
| Pacific Mercantile Bancorp |
100.00 | 93.21 | 70.87 | 28.49 | 17.56 | 21.57 | ||||||||||||||||||
| SNL Western Bank Index |
100.00 | 112.83 | 94.25 | 91.76 | 84.27 | 95.48 | ||||||||||||||||||
| Russell Microcap Index |
100.00 | 116.54 | 107.21 | 63.96 | 82.64 | 106.99 | ||||||||||||||||||
| (1) | The source of the above graph and chart is SNL Securities, L.C. (“SNL”). |
The Stock Performance Graph assumes that $100 was invested in the Company on December 31, 2005, and, at that same date, in the Russell Microcap Index and the SNL Western Bank Index and that any dividends paid in the indicated periods were reinvested. Shareholder returns shown in the Performance Graph are not necessarily indicative of future stock price performance.
Dividend Policy and Share Repurchase Programs
Our Board of Directors has followed the policy of retaining earnings to maintain capital and, thereby, support the growth of the Company’s banking franchise. On occasion, the Board also considered paying cash dividends out of cash generated in excess of those capital requirements and, in February 2008, the Board of Directors declared a cash dividend, in the amount of $0.10 per share of common stock, that was paid on March 14, 2008.
The Board also authorized share repurchase programs in June 2005 and in October 2008, when the Board concluded that, at the then prevailing market prices, the Company’s shares represented an attractive investment opportunity and, therefore, that share repurchases would be a good use of Company funds.
In the first quarter of 2009, the Board of Directors decided that the prudent course of action, in light of the economic recession, was to preserve cash and earnings to enhance the Bank’s capital position and to be in a position to take advantage of improved economic and market conditions in the future. In addition, in August 2010, both the Bank and the Company entered into a Written Agreement with the Federal Reserve Bank of San Francisco, their primary federal banking regulator (the “FRB”) and the California Department of Financial Institutions, the Bank’s state banking regulator (the “DFI”). The Written Agreement prohibits the payment of cash dividends and share repurchases without the approval of the FRB and the DFI. See “Item 1 – Business – Supervision and Regulation – Pacific Mercantile Bancorp — Regulatory Action Taken by the FRB and the DFI.” Accordingly, we do not expect to pay dividends or make share purchases at least for the foreseeable future.
33
Table of Contents
Restrictions on the Payment of Dividends
Cash dividends from the Bank represent the principal source of funds available to the Bancorp, which it might use to pay dividends or for other corporate purposes, such as expansion of its business. Therefore, government regulations, including the laws of the State of California, as they pertain to the payment of cash dividends by California state chartered banks, limit the amount of funds that the Bank would be permitted to dividend to the Bancorp. As a result, those laws also affect the ability of the Bancorp to pay cash dividends to our shareholders or fund other expenditures by the Bancorp in the future. In particular, under California law, cash dividends by a California state chartered bank may not exceed, in any calendar year, the lesser of (i) the sum of its net income for the year and its retained net income from the preceding two years (after deducting all dividends paid during the period), or (ii) the amount of its retained earnings.
Additionally, because the payment of cash dividends has the effect of reducing capital, the capital requirements imposed on bank holding companies and commercial banks often operate, as a practical matter, to preclude the payment, or limit the amount of, cash dividends that might otherwise be permitted by California law; and the federal bank regulatory agencies, as part of their supervisory powers, generally require insured banks to adopt dividend policies which limit the payment of cash dividends much more strictly than do applicable state laws. As previously discussed above, we are prohibited from paying cash dividends to shareholders without the prior approval of the FRB and the DFI and, accordingly, we do not expect to pay cash dividends for at least the foreseeable future.
Restrictions on Inter-Company Transactions
Section 23(a) of the Federal Reserve Act limits the amounts that a bank may loan to its bank holding company to an aggregate of no more than 10% of the bank subsidiary’s capital surplus and retained earnings and requires that such loans be secured by specified assets of the bank holding company - See “BUSINESS—Supervision and Regulation–Restrictions on Transactions between the Bank and the Company and its other Affiliates”. We do not have any present intention to obtain any borrowings from the Bank.
Equity Compensation Plans
Certain information, as of December 31, 2010, with respect to our equity compensation plans is set forth in Item 12, in Part III, of this Report.
Recent Sales of Unregistered Securities
As previously reported, in October 2009, the Company commenced a private offering of its Series A Convertible 10% Cumulative Preferred Stock (the “Series A Preferred Stock” or “Series A Shares”), at a price of $100 per Series A Share payable in cash. The offering was made, in reliance on Section 4(2) of and Regulation D under the Securities Act of 1933, as amended, to a limited number of accredited investors (as defined in Regulation D). The Company completed this private offering in August 2010, in which it sold a total of 126,550 Series A Shares, generating gross proceeds of $12,650,000. Of those Series A Shares, 80,500 were sold in 2009 and the remaining 46,050 were sold in 2010. Additional information regarding this private offering and the Series A Shares is contained in the Company’s Current Report on Form 8-K dated October 6, 2010 and in the Subsection of Item 7 of this Report entitled “Management’s Discussion and Analysis of Financial Condition and Results of Operations—Capital Resources”.
34
Table of Contents
| ITEM 6. | SELECTED CONSOLIDATED FINANCIAL DATA |
The selected statement of operations data for the fiscal years ended December 31, 2010, 2009 and 2008, the selected balance sheet data as of December 31, 2010 and 2009, and the selected financial ratios (other than tangible book value per share), that follow below were derived from our audited consolidated financial statements included in Item 8 of this Report. The selected financial data set forth below should be read with those audited consolidated financial statements, together with the notes thereto, and with Management’s Discussion and Analysis of Financial Condition and Results of Operations included in Item 7 of this Report. The selected statement of operations data for the years ended December 31, 2007 and 2006, the selected balance sheet data as of December 31, 2008, 2007 and 2006, and the selected financial ratios (other than tangible book value per share) for the periods prior to January 1, 2008 are derived from audited consolidated financial statements that are not included in this Report.
| Year Ended December 31, | ||||||||||||||||||||
| 2010 | 2009 | 2008 | 2007 | 2006 | ||||||||||||||||
| (Dollars in thousands except per share data) | ||||||||||||||||||||
| Selected Statement of Operations Data: |
||||||||||||||||||||
| Total interest income |
$ | 50,919 | $ | 51,644 | $ | 61,611 | $ | 70,058 | $ | 63,800 | ||||||||||
| Total interest expense |
18,081 | 29,883 | 34,498 | 38,617 | 31,418 | |||||||||||||||
| Net interest income |
32,838 | 21,761 | 27,113 | 31,441 | 32,382 | |||||||||||||||
| Provision for loan losses |
8,288 | 23,673 | 21,685 | 2,025 | 1,105 | |||||||||||||||
| Net interest income (loss) after provision for loan losses |
24,550 | (1,912 | ) | 5,428 | 29,416 | 31,277 | ||||||||||||||
| Noninterest income |
6,771 | 5,522 | 2,606 | 1,673 | 1,266 | |||||||||||||||
| Noninterest expense |
36,317 | 33,251 | 23,702 | 21,718 | 20,683 | |||||||||||||||
| Income (loss) before income taxes |
(4,996 | ) | (29,641 | ) | (15,668 | ) | 9,371 | 11,860 | ||||||||||||
| Income tax expense (benefit) |
8,958 | (12,333 | ) | (3,702 | ) | 3,601 | 4,739 | |||||||||||||
| Income (loss) from continuing operations |
(13,954 | ) | (17,308 | ) | (11,966 | ) | 5,770 | 7,121 | ||||||||||||
| (Loss) from discontinued operations, net of taxes |
— | — | — | — | (189 | ) | ||||||||||||||
| Net income (loss) |
$ | (13,954 | ) | $ | (17,308 | ) | $ | (11,966 | ) | $ | 5,770 | $ | 6,932 | |||||||
| Cumulative undeclared dividends on preferred stock |
(1,075 | ) | (61 | ) | — | — | — | |||||||||||||
| Net income (loss) available to common stockholders |
$ | (15,029 | ) | $ | (17,369 | ) | $ | (11,966 | ) | $ | 5,770 | $ | 6,932 | |||||||
| Per share data-basic: |
||||||||||||||||||||
| Income (loss) from continuing operations |
$ | (1.44 | ) | $ | (1.66 | ) | $ | (1.14 | ) | $ | 0.55 | $ | 0.70 | |||||||
| (Loss) from discontinued operations |
— | — | — | — | (0.02 | ) | ||||||||||||||
| Net income (loss) per share—basic |
$ | (1.44 | ) | $ | (1.66 | ) | $ | (1.14 | ) | $ | 0.55 | $ | 0.68 | |||||||
| Per share data-diluted: |
||||||||||||||||||||
| Income (loss) from continuing operations |
$ | (1.44 | ) | $ | (1.66 | ) | $ | (1.14 | ) | $ | 0.53 | $ | 0.66 | |||||||
| (Loss) from discontinued operations |
— | — | — | — | (0.02 | ) | ||||||||||||||
| Net income (loss) per share—diluted |
$ | (1.44 | ) | $ | (1.66 | ) | $ | (1.14 | ) | $ | 0.53 | $ | 0.64 | |||||||
| Weighted average shares outstanding |
||||||||||||||||||||
| Basic |
10,434,665 | 10,434,665 | 10,473,476 | 10,422,830 | 10,233,926 | |||||||||||||||
| Diluted |
10,434,665 | 10,434,665 | 10,473,476 | 10,855,160 | 10,829,775 | |||||||||||||||
| Dividends per share |
— | — | $ | 0.10 | — | — | ||||||||||||||
| December 31, | ||||||||||||||||||||
| 2010 | 2009 | 2008 | 2007 | 2006 | ||||||||||||||||
| (Dollars in thousands except for per share information) | ||||||||||||||||||||
| Selected Balance Sheet Data: |
||||||||||||||||||||
| Cash and cash equivalents(1) |
$ | 32,678 | $ | 141,651 | $ | 107,133 | $ | 53,732 | $ | 26,304 | ||||||||||
| Total loans(2) |
722,210 | 813,194 | 828,041 | 773,071 | 740,957 | |||||||||||||||
| Total assets |
1,015,870 | 1,200,636 | 1,164,059 | 1,077,023 | 1,042,529 | |||||||||||||||
| Total deposits |
816,226 | 960,438 | 821,686 | 746,663 | 717,793 | |||||||||||||||
| Junior subordinated debentures |
17,527 | 17,527 | 17,527 | 17,527 | 27,837 | |||||||||||||||
| Total shareholders’ equity |
63,416 | 74,472 | 84,232 | 96,862 | 87,926 | |||||||||||||||
| Tangible book value per share(3) |
$ | 5.55 | $ | 6.71 | $ | 8.08 | $ | 9.36 | $ | 8.81 | ||||||||||
| (1) | Cash and cash equivalents include cash and due from other banks and federal funds sold. |
| (2) | Net of allowance for loan losses and excluding mortgage loans held for sale. |
| (3) | Tangible book value per share is unaudited, does not include accumulated other comprehensive income (loss) which is included in shareholders’ equity, and assumes that the each share of Series A Preferred Stock was converted into 13.07 common shares. |
35
Table of Contents
| For the Year Ended December 31, | ||||||||||||||||||||
| 2010 | 2009 | 2008 | 2007 | 2006 | ||||||||||||||||
| (unaudited) | ||||||||||||||||||||
| Selected Financial Ratios: |
||||||||||||||||||||
| Return on average assets |
(1.20 | )% | (1.45 | )% | (1.06 | )% | 0.53 | % | 0.70 | % | ||||||||||
| Return on average equity |
(19.26 | )% | (20.13 | )% | (12.37 | )% | 6.25 | % | 8.52 | % | ||||||||||
| Ratio of average equity to average assets |
6.23 | % | 7.16 | % | 8.59 | % | 8.47 | % | 8.26 | % | ||||||||||
36
Table of Contents
| ITEM 7. | MANAGEMENT’S DISCUSSION AND ANALYSIS OF FINANCIAL CONDITION AND RESULTS OF OPERATIONS |
Overview
Forward Looking Statements
The following discussion contains statements (which are commonly referred to as “forward looking statements”) which discuss our beliefs or expectations about (i) operating trends in our markets and in economic conditions more generally, and (ii) our future financial performance and future financial condition. The consequences of those operating trends on our business and the realization of our expected future financial results, which are discussed in those forward looking statements, are subject to the uncertainties and risks that are described above in Item 1A of this Report under the caption “RISK FACTORS.” Due to those uncertainties and risks, with respect to the duration and effects of those operating trends and future events on our business, our future financial performance may differ, possibly significantly, from the performance that is currently expected as set forth in the forward looking statements. As a result, you should not place undue reliance on those forward looking statements. We disclaim any obligation to update or revise any of the forward looking statements, whether as a result of new information, future events or otherwise, except as may be required by applicable law or Nasdaq rules.
Background
The following discussion presents information about our consolidated results of operations, financial condition, liquidity and capital resources and should be read in conjunction with our consolidated financial statements and the notes thereto included in Item 8 of this Report.
Our principal operating subsidiary is Pacific Mercantile Bank (the “Bank”), which is a California state chartered bank and a member of the Federal Reserve System. The Bank accounts for substantially all of our consolidated revenues and income and assets and liabilities. Accordingly, the following discussion focuses primarily on the Bank’s operations and financial condition.
Overview of Fiscal 2010 Operating Results
The following table sets forth information comparing our results of operations for the fiscal year ended December 31, 2010 to our results of operations in the years ended December 31, 2009 and 2008.
| Year Ended December 31, | ||||||||||||||||||||
| 2010 | 2009 | 2008 | ||||||||||||||||||
| Amount | Percent Change from 2009 |
Amount | Percent Change from 2008 |
Amount | ||||||||||||||||
| (Dollars in thousands, except per share data) | ||||||||||||||||||||
| Interest income |
$ | 50,919 | (1.4 | )% | $ | 51,644 | (16.2 | )% | $ | 61,611 | ||||||||||
| Interest expense |
18,081 | (39.5 | )% | 29,883 | (13.4 | )% | 34,498 | |||||||||||||
| Net interest income |
32,838 | 50.9 | % | 21,761 | (19.7 | )% | 27,113 | |||||||||||||
| Provision for loan losses |
8,288 | (65.0 | )% | 23,673 | 9.2 | % | 21,685 | |||||||||||||
| Net interest income (expense) after provision for loan losses |
24,550 | (1,384.0 | )% | (1,912 | ) | (135.2 | %) | 5,428 | ||||||||||||
| Noninterest income |
6,771 | 22.6 | % | 5,522 | 111.9 | % | 2,606 | |||||||||||||
| Noninterest expense |
36,317 | 9.2 | % | 33,251 | 40.3 | % | 23,702 | |||||||||||||
| Income (loss) before income taxes |
(4,996 | ) | (83.1 | )% | (29,641 | ) | (89.2 | )% | (15,668 | ) | ||||||||||
| Income tax expense (benefit) |
8,958 | (172.6 | )% | (12,333 | ) | (233.1 | )% | (3,702 | ) | |||||||||||
| Net loss |
(13,954 | ) | 19.4 | % | (17,308 | ) | (44.6 | )% | (11,966 | ) | ||||||||||
| Per share data—diluted |
||||||||||||||||||||
| Net loss per share—diluted |
(1.44 | ) | 13.3 | % | (1.66 | ) | (45.7 | )% | (1.14 | ) | ||||||||||
| Weighted average number of diluted shares |
10,434,665 | (0.4 | ) | 10,434,665 | (0.4 | )% | 10,473,476 | |||||||||||||
37
Table of Contents
As the above table indicates, during the year ended December 31, 2010, we made substantial improvements in our operating results, in 2010, including:
| • | Increase in Net Interest Income. Net interest income increased by 51% to $32.8 million from $21.8 million in 2010 as compared to 2009. |
| • | Reductions in Provisions made for Loan Losses. We were able to reduce the provision we made for loan losses to $8.3 million, a decrease of $15.4 million, or 65%, in 2010 from $23.7 million in 2009, due primarily to declines in net loan charge-offs and in loan delinquencies and an increase in recoveries of previously charged off loans. Notwithstanding that reduction in the provision for loan losses in 2010, the ratio of the allowance for loan losses to total loans outstanding at December 31, 2010 was 2.44%, unchanged from the ratio at December 31, 2009. |
| • | Increase in Noninterest Income. Noninterest income increased in 2010 by $1.2 million, or 22.6%, to $6.8 million from $5.5 million in 2009, as our mortgage banking revenue increased to $3.7 million, or 308.0%, in 2010 from $917,000 in 2009 as a result of a substantial increase in the volume of mortgage loans originated and sold in the secondary market. That increase of mortgage banking revenues was partially offset, however, primarily by decreases in deposit and other fee income and in gains on sales of securities in 2010 as compared to 2009. |
| • | Increase in Noninterest Expense. Although noninterest expense increased by $3.1 million, or 9.2%, in 2010, as compared to 2009, that increase (i) was largely due to a 57% increase in FDIC insurance premiums and increases in expenses incurred in connection with foreclosed real estate and our the collection and foreclosure of non-performing loans, and (ii) was partially offset by reductions totaling approximately $700,000 in compensation expense, occupancy costs and data process expenses. As a result, the $3.1 million, or 9.2%, increase in noninterest expense in 2010 over 2009, represents a significant improvement over the $9.5 million, or 40.3%, increase in such expenses in 2009 as compared to 2008. In addition, due primarily to the increases in interest income and noninterest income, and the slowing in the growth of noninterest expense in 2010, our efficiency ratio improved to 91.7% in 2010 from 121.9% in 2009. |
| • | Decrease in Pre-Tax Loss. Due primarily to the increase in net interest income, the reduction in the provisions made for loan losses, and the increase in noninterest income, we reduced our pre-tax loss in 2010 by $24.6 million, or 83.1%, to $5 million in 2010, from a pre-tax loss of $29.6 million in 2009. |
| • | Increase in Taxes. In 2010 we recorded income tax expense of $9.1 million as compared to an income tax benefit of $12.3 million in 2009. The income tax expense recorded in 2010 was attributable to a charge recognized, in the third quarter of 2010, to substantially reduce the amount of the deferred tax asset, comprised primarily of tax credit and tax loss carryforwards that we had previously anticipated would be available to reduce our income tax expense in later years. See “Critical Accounting Policies—Deferred Tax Asset” below in this Item 7 of this Report. |
| • | Decline in Net Loss. As the table indicates, in 2010 we incurred a net loss of $14 million, or $1.44 per diluted share. However, $9.0 million of that net loss was attributable to the increase in the provision for income taxes and, even with that increase in income tax expense, our net loss in 2010 was $3.4 million, or 19.4%, lower than the net loss we incurred in 2009. |
Although we are disappointed by our bottom line results in 2010, we are encouraged by the increase achieved in our revenues in 2010 and, if economic conditions improve even modestly, we believe we can achieve a return to profitability in 2011.
38
Table of Contents
Set forth below are certain key financial performance ratios and other financial data for or at the end of the periods indicated:
| Year Ended December 31, | ||||||||||||
| 2010 | 2009 | 2008 | ||||||||||
| Return on average assets |
(1.20 | )% | (1.45 | )% | (1.06 | )% | ||||||
| Return on average shareholders’ equity |
(19.26 | )% | (20.13 | )% | (12.37 | )% | ||||||
| Ratio of average equity to average assets |
6.23 | % | 7.16 | % | 8.59 | % | ||||||
| Net interest margin(1) |
2.92 | % | 1.90 | % | 2.47 | % | ||||||
| (1) | Net interest income expressed as a percentage of total average interest earning assets. |
Changes in Financial Condition in 2010
Reduction in Real Estate Construction Lending. To reduce our exposure to the deteriorating conditions in the real estate markets, we began reducing the volume of real estate construction loans in the fourth quarter of 2007, while increasing the volume of commercial and business loans that we are making. As a result, in late 2007 we ceased making real estate construction loans and, as of December 31, 2010, such loans had declined to $3.0 million, or 0.5%, of the loans in our loan portfolio from $47 million, or 6.1%, at December 31, 2007.
Sale of Convertible Preferred Stock and Capital Ratios. Although we incurred a net loss of $14.0 million in 2010, the effect of that loss on our shareholders and tangible book value per share was partially offset by $4.6 million of equity capital that we raised during the first half of 2010 from the sale, in a private placement to a limited number of sophisticated investors, of Series A Convertible 10% Cumulative Preferred Stock (the “Series A Shares”). Those shares are convertible into common stock at a conversion price of $7.65 per share. Moreover, although shareholders equity declined by $11.1 million to $63.4 million at December 31, 2010, from $74.5 million at December 31, 2009, the ratio of our consolidated total capital-to-risk weighted assets, which is the principal federal regulatory measure of the financial strength of banking institutions, was 11.3%. As a result, we continued to be classified, under bank regulatory guidelines, as a “well-capitalized” banking institution, which is the highest of the capital standards established under federal banking regulations. See “Capital Resources” below in this Item 7.
Critical Accounting Policies
Our consolidated financial statements are prepared in accordance with generally accepted accounting principles in the United States (“GAAP”) and accounting practices in the banking industry. Certain of those accounting policies are considered critical accounting policies, because they require us to make estimates and assumptions regarding circumstances or trends that could materially affect the value of those assets, such as economic conditions or trends that could impact our ability to fully collect our loans or ultimately realize the carrying value of certain of our other assets. Those estimates and assumptions are made based on current information available to us regarding those economic conditions or trends or other circumstances. If changes were to occur in the events, trends or other circumstances on which our estimates or assumptions were based, or other unanticipated events were to occur that might affect our operations, we may be required under GAAP to adjust our earlier estimates and to reduce the carrying values of the affected assets on our balance sheet, generally by means of charges against income.
Our critical accounting policies relate to the determinations of our allowance for loan losses, the fair values of securities available for sale and with respect to the realizability, and hence the valuation, of our deferred tax asset.
Allowance for Loan Losses. Like virtually all banks and other financial institutions, we follow the practice of maintaining an allowance to provide for possible loan losses that occur from time to time as an incidental part of the banking business. The accounting policies and practices we follow in determining the sufficiency of that allowance require us to make judgments and assumptions about economic and market conditions and trends that can affect the ability of our borrowers to meet their loan payment obligations to us. In making those judgments, we use historical loss factors, adjusted for current economic and market conditions, other economic indicators and applicable bank regulatory guidelines, to determine losses inherent in our loan portfolio and the sufficiency of our allowance for loan losses. If unanticipated changes were to occur in those conditions or trends, or the financial condition of borrowers was to deteriorate, actual loan losses could be greater than those that had previously been predicted. In such events, or if there
39
Table of Contents
were changes to the loss factors or regulatory guidelines on which we had based our determinations regarding the sufficiency of the allowance, it could become necessary for us to increase the allowance for loan losses by means of a charge to income referred to in our financial statements as the “provision for loan losses.” Such an increase would reduce the carrying value of the loans on our balance sheet, and the additional provision for loan losses taken to increase that allowance would reduce our income in the period when it is determined that an increase in the allowance for loan losses is necessary. During the fourth quarter of 2008, federal bank regulatory agencies adopted new and more stringent guidelines and methodologies for identifying losses in bank loan portfolios and determining the sufficiency of loan loss reserves, as a result of the worsening of the economic recession and the prospects that conditions would not soon improve. We have been applying those new guidelines and methodologies since the fourth quarter of 2008. See the discussion in the subsections entitled “—Provision for Loan Losses” and “—Allowance for Loan Losses and Nonperforming Loans” below.
Fair Value of Securities Available for Sale. Under applicable accounting principles, we are required to recognize any unrealized loss on the securities we hold for sale. Such an unrealized loss occurs when the fair value of a security held for sale declines below the amortized cost of the security as recorded on our balance sheet. As a result, we make determinations, on a quarterly basis, of the fair values of such securities in order to determine if there are any unrealized losses in our portfolio of the securities we hold for sale. When there is an active market for a security, the determination of its fair value is based on market prices. In the case of securities for which there is not an active trading market, but which do trade from time to time, we rely primarily on quotes we obtain from third party vendors and securities brokers to determine the fair values of those securities. However, quotes are not always available for some securities and, in order to make determinations of fair value in those instances, it becomes necessary for us to make determinations of fair value based primarily on a variety of industry standard pricing methodologies such as discounted cash flow analyses, matrix pricing, and option adjusted spread models, as well as fundamental analysis of the creditworthiness of the obligors under those securities. These methodologies require us to make various assumptions relating to such matters as future prepayment speeds, yield, duration, Federal Reserve Board monetary policies and demand and supply for the individual securities. Consequently, if changes were to occur in market or other conditions on which those assumptions or judgments were based, it could become necessary for us to reduce the fair values of such securities, which would result in changes to accumulated other comprehensive income/(loss) on our balance sheet. Moreover, if we conclude that reductions in the fair values of any securities are other than temporary, it will be necessary for us to take an impairment loss directly to our statement of operations.
Utilization and Valuation of Deferred Income Tax Benefits. We record as a “deferred tax asset” on our balance sheet an amount equal to the tax credit and tax loss carryforwards and tax deductions (“tax benefits”) that we believe will be available to us to offset or reduce income taxes in future periods. Under applicable federal and state income tax laws and regulations, such tax benefits will expire if not used within specified periods of time. Accordingly, the ability to fully use our deferred tax asset to reduce income taxes in the future depends on the amount of taxable income that we generate during those time periods. At least once each year, or more frequently, if warranted, we make estimates of future taxable income that we believe we are likely to generate during those future periods. If we conclude, on the basis of those estimates and the amount of the tax benefits available to us, that it is more likely than not that we will be able to fully utilize those tax benefits prior to their expiration, we recognize the deferred tax asset in full on our balance sheet. On the other hand, if we conclude on the basis of those estimates and the amount of the tax benefits available to us that it has become more likely than not that we will be unable to utilize those tax benefits in full prior to their expiration, then, we would establish (or increase any existing) valuation allowance to reduce the deferred tax asset on our balance sheet to the amount with respect to which we believe it is still more likely, than not, that we will be able to use to offset or reduce taxes in the future. The establishment or an increase in that valuation allowance is implemented by recognizing a non-cash charge that would have the effect of increasing the provision, or reducing any credit, for income taxes that we would otherwise have recorded in our statements of operations. The determination of whether and the extent to which we will be able to utilize our deferred tax asset involves significant judgments and assumptions that are subject to period to period changes as a result of changes in tax laws, changes in market or economic conditions that could affect our operating results or variances between our actual operating results and our projected operating results, as well as other factors.
We conducted an assessment of the realizability of our deferred tax asset as of June 30, 2010. Based on that assessment and due, in part, to continued weakness in the economy and financial markets, we concluded that it had become more likely, than not, that we would be unable to utilize our remaining tax benefits comprising our deferred tax asset prior to their expiration. Therefore, we recorded an additional valuation allowance against our net deferred tax asset in the amount of $10.7 million by means of a non-cash charge to income tax expense in the quarter ended June 30, 2010 in the amount of $9.0 million. The provision for income taxes we have recorded in our statement of operations for the year ended December 31, 2010 is primarily attributable to that charge.
40
Table of Contents
Results of Operations
Net Interest Income
One of the principal determinants of a bank’s income is its net interest income, which is the difference between (i) the interest that a bank earns on loans, investment securities and other interest earning assets, on the one hand, and (ii) its interest expense, which consists primarily of the interest it must pay to attract and retain deposits and the interest that it pays on borrowings and other interest-bearing liabilities, on the other hand. A bank’s interest income and interest expense are, in turn, affected by a number of factors, some of which are outside of its control, including national and local economic conditions and the monetary policies of the Federal Reserve Board which affect interest rates, the demand for loans by prospective borrowers, the competition among banks and other lending institutions for loans and deposits and the ability of borrowers to meet their loan payment obligations. Net interest income, when expressed as a percentage of total average interest earning assets, is a banking organization’s “net interest margin.”
Fiscal 2010 Compared to Fiscal 2009. In fiscal 2010, our net interest income increased by $11 million, or 51%, to $32.8 million, from $21.8 million in fiscal 2009. That increase was primarily attributable to an $11.8 million, or 39.5%, decline in interest expense, which more than offset a $725,000, or 1%, decrease in interest income in 2010, as compared to 2009. The decline in interest expense was due primarily to continuing interest rate reductions implemented by the Federal Reserve Board, in response to the economic recession, which (i) enabled us to reduce the rates at which we paid interest on time deposits, and (ii) led to declines in the interest rates charged on our borrowings. As a result, the average rate of interest that we paid on our interest-bearing liabilities in 2010 declined to 1.98% from 3.22% in 2009. Also contributing, to a lesser extent, to the decline in interest expense was a $69 million reduction, during 2010, in average borrowings outstanding. The decline in interest income also was primarily attributable to the Federal Reserve Board’s reductions in interest rates, which reduced the yields that we were able to realize on our loans and investments in 2010 and more than offset the positive effect on interest income of a modest increase in the volume of loans outstanding during 2010.
Our net interest margin for fiscal 2010 increased to 2.92%, from 1.90% in fiscal 2009, because of the aforementioned decrease in interest expense, which was a result of (i) a decrease in the average interest rate paid on time deposits to 2.24% in 2010 from 3.49% in 2009, and (ii) a decrease in the average interest rate that we paid on our borrowings to 1.89% in 2010, from 3.89% in 2009.
Fiscal 2009 Compared to Fiscal 2008. In fiscal 2009, our net interest income decreased by $5.4 million, or 20%, to $21.8 million, from $27.1 million in fiscal 2008, primarily as a result of a $10 million, or 16.2%, decrease in interest income which was only partially offset by a $4.6 million, or 13.4%, decrease in interest expense. The decrease in interest income in 2009 over 2008 was due primarily to a decrease in the average interest rate earned (i) on loans to 5.63% in 2009 from 6.24% in 2008, and (ii) decrease in the yields on short-term investments to 0.32% in 2009 from 1.72% in 2008. Those decreases were primarily attributable to interest rate reductions implemented by the Federal Reserve Board during 2008, in response to the economic recession and credit crisis. Those reductions caused interest rates on loans and other interest earning assets to remain at historic lows throughout 2009.
The average interest rate on deposits and other interest-bearing liabilities declined to 3.22% in 2009 from 4.02% in 2008, primarily due to those same interest rate reductions by the Federal Reserve Board, which enabled us to reduce interest rates on deposits and benefit from reductions in interest rates on our borrowings and other interest bearing liabilities.
Our net interest margin for fiscal 2009 decreased to 1.90% in 2009 from 2.47% in fiscal 2008, because the decrease in interest income exceeded the decrease in interest expense in 2009 due primarily to the effects on our interest expense of (i) an increase in the volume of our deposits, and (ii) a change in the mix of our deposits to a higher proportion of time deposits, on which we pay higher rates of interest than on other deposits, and a lower proportion of non-interest bearing deposits.
41
Table of Contents
Information Regarding Average Assets and Average Liabilities
The following tables set forth information regarding our average balance sheet, yields on interest earning assets, interest expense on interest-bearing liabilities, the interest rate spread and the interest rate margin for the years ended December 31, 2010, 2009, and 2008. Average balances are calculated based on average daily balances.
| Year Ended December 31, | ||||||||||||||||||||||||
| 2010 | 2009 | |||||||||||||||||||||||
| Average Balance |
Interest Earned/ Paid |
Average Yield/ Rate |
Average Balance |
Interest Earned/ Paid |
Average Yield/ Rate |
|||||||||||||||||||
| (Dollars in thousands) | ||||||||||||||||||||||||
| Interest earning assets: |
||||||||||||||||||||||||
| Short-term investments(1) |
$ | 167,748 | $ | 468 | 0.28 | % | $ | 158,922 | $ | 501 | 0.32 | % | ||||||||||||
| Securities available for sale and stock (2) |
155,913 | 4,564 | 2.93 | % | 144,790 | 3,661 | 2.53 | % | ||||||||||||||||
| Loans (3) |
801,613 | 45,887 | 5.72 | % | 844,111 | 47,482 | 5.63 | % | ||||||||||||||||
| Total earning assets |
1,125,274 | 50,919 | 4.53 | % | 1,147,823 | 51,644 | 4.50 | % | ||||||||||||||||
| Noninterest earning assets |
36,762 | 38,701 | ||||||||||||||||||||||
| Total Assets |
$ | 1,162,036 | $ | 1,186,524 | ||||||||||||||||||||
| Interest-bearing liabilities: |
||||||||||||||||||||||||
| Interest-bearing checking accounts |
$ | 37,685 | 235 | 0.62 | % | $ | 28,136 | 222 | 0.79 | % | ||||||||||||||
| Money market and savings accounts |
134,863 | 1,506 | 1.12 | % | 108,583 | 1,332 | 1.23 | % | ||||||||||||||||
| Certificates of deposit |
614,850 | 13,742 | 2.24 | % | 594,885 | 20,762 | 3.49 | % | ||||||||||||||||
| Other borrowings |
109,609 | 2,076 | 1.89 | % | 178,455 | 6,944 | 3.89 | % | ||||||||||||||||
| Junior subordinated debentures |
17,682 | 522 | 2.95 | % | 17,682 | 623 | 3.52 | % | ||||||||||||||||
| Total interest-bearing liabilities |
914,689 | 18,081 | 1.98 | % | 927,741 | 29,883 | 3.22 | % | ||||||||||||||||
| Noninterest-bearing liabilities |
174,907 | 173,808 | ||||||||||||||||||||||
| Total Liabilities |
1,089,596 | 1,101,549 | ||||||||||||||||||||||
| Shareholders’ equity |
72,440 | 84,975 | ||||||||||||||||||||||
| Total Liabilities and Shareholders’ Equity |
$ | 1,162,036 | $ | 1,186,524 | ||||||||||||||||||||
| Net interest income |
$ | 32,838 | $ | 21,761 | ||||||||||||||||||||
| Interest rate spread |
2.55 | % | 1.28 | % | ||||||||||||||||||||
| Net interest margin |
2.92 | % | 1.90 | % | ||||||||||||||||||||
| (1) | Short-term investments consist of federal funds sold and interest bearing deposits that we maintain at other financial institutions. |
| (2) | Stock consists of Federal Home Loan Bank Stock and Federal Reserve Bank Stock. |
| (3) | Loans include the average balance of nonaccrual loans. |
42
Table of Contents
| Year Ended December 31, 2008 | ||||||||||||
| Average Balance | Interest Earned/ Paid | Average Yield/Rate | ||||||||||
| (Dollars in thousands) | ||||||||||||
| Interest earning assets: |
||||||||||||
| Short-term investments(1) |
$ | 53,753 | $ | 924 | 1.72 | % | ||||||
| Securities available for sale and stock(2) |
230,021 | 10,148 | 4.41 | % | ||||||||
| Loans (3) |
809,543 | 50,539 | 6.24 | % | ||||||||
| Total earning assets |
1,093,317 | 61,611 | 5.64 | % | ||||||||
| Noninterest earning assets |
33,321 | |||||||||||
| Total Assets |
$ | 1,126,638 | ||||||||||
| Interest-bearing liabilities: |
||||||||||||
| Interest-bearing checking accounts |
$ | 20,176 | 108 | 0.53 | % | |||||||
| Money market and savings accounts |
134,701 | 2,619 | 1.94 | % | ||||||||
| Certificates of deposit |
455,138 | 20,746 | 4.56 | % | ||||||||
| Other borrowings |
231,057 | 9,952 | 4.31 | % | ||||||||
| Junior subordinated debentures |
17,682 | 1,073 | 6.07 | % | ||||||||
| Total interest-bearing liabilities |
858,754 | 34,498 | 4.02 | % | ||||||||
| Noninterest-bearing liabilities |
171,127 | |||||||||||
| Total Liabilities |
1,029,881 | |||||||||||
| Shareholders’ equity |
96,757 | |||||||||||
| Total Liabilities and Shareholders’ Equity |
$ | 1,126,638 | ||||||||||
| Net interest income |
$ | 27,113 | ||||||||||
| Interest rate spread |
1.62 | % | ||||||||||
| Net interest margin |
2.47 | % | ||||||||||
| (1) | Short-term investments consist of federal funds sold and interest bearing deposits that we maintain at other financial institutions. |
| (2) | Stock consists of Federal Home Bank Stock and Federal Reserve Bank Stock. |
| (3) | Loans include the average balance of nonaccrual loans. |
43
Table of Contents
The following table sets forth changes in interest income, including loan fees, and interest paid in each of the years ended December 31, 2010, 2009 and 2008 and the extent to which those changes were attributable to changes in (i) the volumes of or in the rates of interest earned on interest-earning assets and (ii) the volumes of or in the rates of interest paid on our interest-bearing liabilities.
| 2010 Compared to 2009 Increase (decrease) due to Changes in |
2009 Compared to 2008 Increase (decrease) due to Changes in |
|||||||||||||||||||||||
| Volume | Rates | Total Increase (Decrease) |
Volume | Rates | Total Increase (Decrease) |
|||||||||||||||||||
| (Dollars in thousands) | ||||||||||||||||||||||||
| Interest income |
||||||||||||||||||||||||
| Short-term investments(1) |
$ | 27 | $ | (60 | ) | $ | (33 | ) | $ | 767 | $ | (1,190 | ) | $ | (423 | ) | ||||||||
| Securities available for sale and stock (2) |
296 | 607 | 903 | (3,014 | ) | (3,473 | ) | (6,487 | ) | |||||||||||||||
| Loans |
(2,422 | ) | 827 | (1,595 | ) | 2,094 | (5,151 | ) | (3,057 | ) | ||||||||||||||
| Total earning assets |
(2,099 | ) | 1,374 | (725 | ) | (153 | ) | (9,814 | ) | (9,967 | ) | |||||||||||||
| Interest expense |
||||||||||||||||||||||||
| Interest-bearing checking accounts |
66 | (53 | ) | 13 | 52 | 62 | 114 | |||||||||||||||||
| Money market and savings accounts |
304 | (130 | ) | 174 | (443 | ) | (844 | ) | (1,287 | ) | ||||||||||||||
| Certificates of deposit |
675 | (7,695 | ) | (7,020 | ) | 5,524 | (5,508 | ) | 16 | |||||||||||||||
| Borrowings |
(2,088 | ) | (2,779 | ) | (4,867 | ) | (2,112 | ) | (896 | ) | (3,008 | ) | ||||||||||||
| Junior subordinated debentures |
0 | (102 | ) | (102 | ) | 0 | (450 | ) | (450 | ) | ||||||||||||||
| Total interest-bearing liabilities |
(1,043 | ) | (10,759 | ) | (11,802 | ) | 3,021 | (7,636 | ) | (4,615 | ) | |||||||||||||
| Net interest income |
$ | (1,056 | ) | $ | 12,133 | $ | 11,077 | $ | (3,174 | ) | $ | (2,178 | ) | $ | (5,352 | ) | ||||||||
| (1) | Short-term investments consist of federal funds sold and interest bearing deposits with financial institutions. |
| (2) | Stock consists of Federal Reserve Bank stock and Federal Home Loan Bank stock. |
The above table indicates that the $11.1 million increase in net interest income in 2010 was primarily attributable to declines in interest rates on interest-bearing liabilities, which were only partially offset by decreases in interest rates on interest-earning assets. That table also indicates that the $5.4 million decrease in net interest income in 2009 was primarily attributable to declines in interest rates on our interest earning assets which more than offset rate related decreases in the interest we paid on interest-bearing liabilities.
Provision for Loan Losses
Like virtually all banks and other financial institutions, we follow the practice of maintaining an allowance to provide for possible loan losses that occur from time to time as an incidental part of the banking business. When it is determined that the payment in full of a loan has become unlikely, the carrying value of the loan is reduced (“written down”) to what management believes is its realizable value or, if it is determined that a loan no longer has any realizable value, the carrying value of the loan is written off in its entirety (a loan “charge-off”). Loan charge-offs and write-downs are charged against that allowance (the “Allowance for Loan Losses” or the “ALL”). The amount of the ALL is increased periodically (i) to replenish the ALL after it has been reduced due to loan write-downs and charge-offs, (ii) to reflect increases in the volume of outstanding loans, and (iii) to take account of changes in the risk of potential loan losses due to a deterioration in the condition of borrowers or in the value of property securing non–performing loans or adverse changes in economic conditions. See “—Financial Condition—Nonperforming Loans and the Allowance for Loan Losses” below in this Item 7. Increases in the ALL are made through a charge, recorded as an expense in the statement of operations, referred to as the “provision for loan losses.” Recoveries of loans previously charged-off are added back to the ALL and, therefore, have the effect of increasing the ALL and reducing the amount of the provision that might otherwise have had to be made to replenish or increase the ALL.
We employ economic models that are based on bank regulatory guidelines, industry standards and our own historical loan loss experience, as well as a number of more subjective qualitative factors, to determine both the sufficiency of the ALL and the amount of the provisions that need to be made for potential loan losses. However, those determinations involve judgments about trends in current economic conditions and other events that can affect the ability of borrowers to meet their loan obligations to us and a weighting among the quantitative and qualitative factors we consider in determining the amount of the ALL. Moreover, the duration and anticipated effects of prevailing
44
Table of Contents
economic conditions or trends can be uncertain and can be affected by number of risks and circumstances that are outside of our ability to control. See the discussion above in Item 1A of this Report under the caption “RISK FACTORS—We could incur losses on the loans we make” and the discussion below in this Item 7 under the caption “Financial Condition—Nonperforming Loans and the Allowance for Loan Losses”. If changes in economic or market conditions or unexpected subsequent events were to occur, or if changes were made to bank regulatory guidelines or industry standards that are used to assess the sufficiency of the ALL, it could become necessary to incur additional, and possibly significant, charges to increase the allowance for loan losses, which would have the effect of reducing our income or causing us to incur losses.
In addition, the FRB and the DFI, as an integral part of their examination processes, periodically review the adequacy of our ALL. These agencies may require us to make additional provisions for possible loan losses, over and above the provisions that we have already made, the effect of which would be to reduce our income or increase any losses we might incur.
In 2010, we were able to reduce the provisions that we made for loan losses to $8.3 million, a decrease of $15.4 million, or 65%, from the $23.7 million in provisions made in 2009. That decrease was due primarily to declines in net loan charge-offs and in loan delinquencies and, to a lesser extent, an increase in recoveries of previously charged off loans. Notwithstanding that reduction in the provision for loan losses in 2010, the ratio of the allowance for loan losses to total loans outstanding at December 31, 2010 was 2.44%, unchanged from the ratio at December 31, 2009.
The $23.7 million in provisions for loan losses in 2009 were made (i) to provide for increases in non-performing loans and net loan write-downs and charge-offs totaling nearly $18.8 million that were primarily the result of the economic recession, increases in unemployment, further declines in real property values and a tight credit market; and (ii) to increase the allowance for loan losses (after giving effect to those loan charge-offs and write-downs), to approximately $20.3 million at December 31, 2010 from $15.5 million at December 31, 2008.
45
Table of Contents
The following table sets forth the changes in the allowance for loan losses in the years ended December 31, 2010, 2009, 2008, 2007 and 2006.
| Year Ended December 31, | ||||||||||||||||||||
| 2010 | 2009 | 2008 | 2007 | 2006 | ||||||||||||||||
| (Dollars in thousands) | ||||||||||||||||||||
| Total gross loans outstanding at end of period (1) |
$ | 741,007 | $ | 834,079 | $ | 843,494 | $ | 779,197 | $ | 746,886 | ||||||||||
| Average total loans outstanding for the period (1) |
$ | 786,576 | $ | 833,550 | $ | 809,543 | $ | 744,589 | $ | 697,176 | ||||||||||
| Allowance for loan losses at beginning of period |
$ | 20,345 | $ | 15,453 | $ | 6,126 | $ | 5,929 | $ | 5,126 | ||||||||||
| Loans charged off |
||||||||||||||||||||
| Commercial loans (2) |
(11,473 | ) | (15,153 | ) | (4,591 | ) | (1,006 | ) | (102 | ) | ||||||||||
| Construction loans – single family |
(101 | ) | (1,508 | ) | (3,424 | ) | — | — | ||||||||||||
| Construction loans – other |
(548 | ) | (1,179 | ) | (2,680 | ) | — | — | ||||||||||||
| Commercial real estate loans |
(660 | ) | (81 | ) | (1,006 | ) | — | — | ||||||||||||
| Residential mortgage loans – single family |
(631 | ) | (949 | ) | (307 | ) | (696 | ) | (184 | ) | ||||||||||
| Consumer loans |
(152 | ) | (253 | ) | (311 | ) | (130 | ) | (31 | ) | ||||||||||
| Other loans |
— | (15 | ) | (119 | ) | — | — | |||||||||||||
| Total loans charged off |
(13,565 | ) | (19,138 | ) | (12,438 | ) | (1,832 | ) | (317 | ) | ||||||||||
| Loans recovery |
||||||||||||||||||||
| Commercial loans |
2,327 | 129 | 37 | — | — | |||||||||||||||
| Construction loans – single-family |
— | 197 | — | — | — | |||||||||||||||
| Construction loans – other |
4 | — | — | — | — | |||||||||||||||
| Commercial real estate loans |
345 | — | — | — | — | |||||||||||||||
| Residential mortgage loans – single family |
187 | — | — | — | — | |||||||||||||||
| Consumer loans |
170 | 3 | 3 | 4 | 15 | |||||||||||||||
| Other loans |
— | 28 | 40 | — | — | |||||||||||||||
| Total loans recovery |
3,033 | 357 | 80 | 4 | 15 | |||||||||||||||
| Net loans charged off |
(10,532 | ) | (18,781 | ) | (12,358 | ) | (1,828 | ) | (302 | ) | ||||||||||
| Provision for loan losses charged to operating expense |
8,288 | 23,673 | 21,685 | 2,025 | 1,105 | |||||||||||||||
| Allowance for loan losses at end of period |
$ | 18,101 | $ | 20,345 | $ | 15,453 | $ | 6,126 | $ | 5,929 | ||||||||||
| Allowance for loan losses as a percentage of average total loans |
2.30 | % | 2.44 | % | 1.91 | % | 0.82 | % | 0.85 | % | ||||||||||
| Allowance for loan losses as a percentage of total outstanding loans at end of period |
2.44 | % | 2.44 | % | 1.83 | % | 0.79 | % | 0.79 | % | ||||||||||
| Net charge-offs as a percentage of average total loans |
1.34 | % | 2.25 | % | 1.53 | % | 0.25 | % | 0.04 | % | ||||||||||
| Net charge-offs as a percentage of total loans outstanding at end of period |
1.42 | % | 2.25 | % | 1.47 | % | 0.23 | % | 0.04 | % | ||||||||||
| Net loans charged-off to allowance for loan losses |
58.18 | % | 92.31 | % | 79.97 | % | 29.84 | % | 5.09 | % | ||||||||||
| Net loans charged-off to provision for loan losses |
127.08 | % | 79.34 | % | 56.99 | % | 90.27 | % | 27.33 | % | ||||||||||
| (1) | Includes net deferred loan costs and excludes loans held for sale. |
| (2) | Approximately 44% of the commercial loan charge-offs in 2008 were attributable to loans made to commercial real estate related businesses or enterprises. |
46
Table of Contents
Noninterest Income
The following table identifies the components of and the percentage changes in noninterest income in the fiscal years ended December 31, 2010, 2009 and 2008, respectively:
| Year Ended December 31, | ||||||||||||||||||||
| 2010 | 2009 | 2008 | ||||||||||||||||||
| Amount | Percentage Change |
Amount | Percentage Change |
Amount | ||||||||||||||||
| (Dollars in thousands) | ||||||||||||||||||||
| Total other-than-temporary impairment of securities |
$ | (2,051 | ) | (147.4 | )% | $ | (829 | ) | 48.3 | % | $ | (1,603 | ) | |||||||
| Portion of (losses) gains recognized in other comprehensive loss |
(1,765 | ) | (350.7 | )% | 704 | N/M | — | |||||||||||||
| Net impairment loss recognized in earnings |
(286 | ) | (128.8 | )% | (125 | ) | 92.2 | % | (1,603 | ) | ||||||||||
| Service fees on deposits and other banking services |
1,207 | (18.8 | )% | 1,486 | 29.1 | % | 1,151 | |||||||||||||
| Mortgage banking (including net gains on sales of loans held for sale) |
3,741 | 308.0 | % | 917 | N/M | — | ||||||||||||||
| Net gains on sale of securities available for sale |
1,530 | (33.7 | )% | 2,308 | (1.6 | )% | 2,346 | |||||||||||||
| Net loss on sale of other real estate owned |
(64 | ) | 11.1 | % | (72 | ) | (80.0 | )% | (40 | ) | ||||||||||
| Other |
643 | (36.2 | )% | 1,008 | 34.0 | % | 752 | |||||||||||||
| Total noninterest income |
$ | 6,771 | 22.6 | % | $ | 5,522 | 111.9 | % | $ | 2,606 | ||||||||||
2010 Compared to 2009. In 2010, noninterest income increased by nearly $1.3 million, or 22.6%, to $6.8 million as compared to $5.5 million in 2009. That increase was primarily due to a $2.8 million, or 308.0%, increase in mortgage banking revenues, consisting of mortgage banking fees and proceeds from the sale of mortgage loans held for sale, that was attributable to the continuing growth of our mortgage banking business, which we commenced in May 2009. As the table indicates, that increase was partially offset by a $778,000, or 33.7% decrease in net gains on sale of securities available for sale.
2009 Compared to 2008. In 2009, noninterest income increased by $2.9 million, or 112%, to $5.5 million as compared to $2.6 million in 2008. That increase was due primarily to (i) a decrease of $1.5 million in net impairment losses on securities available for sale in 2009 as compared to 2008; (ii) the addition of $917,000 in mortgage banking fees and proceeds from sales of mortgage loans held for sale, which was attributable to our mortgage banking operations which we commenced in May 2009, and (iii) a $335,000 increase in transaction fees and service charges.
Noninterest Expense
The following table sets forth the principal components and the amounts of noninterest expense that we incurred in the years ended December 31, 2010, 2009 and 2008, respectively.
| Year Ended December 31, | ||||||||||||||||||||
| 2010 Amount |
Percent Change |
2009 Amount |
Percent Change |
2008 Amount |
||||||||||||||||
| (Dollars in thousands) | ||||||||||||||||||||
| Salaries and employee benefits |
$ | 15,345 | (3.2 | )% | $ | 15,845 | 24.1 | % | $ | 12,767 | ||||||||||
| Occupancy |
2,668 | (1.7 | )% | 2,713 | (1.0 | )% | 2,741 | |||||||||||||
| Equipment and depreciation |
1,277 | 0.7 | % | 1,268 | 18.2 | % | 1,073 | |||||||||||||
| Data processing |
684 | (16.1 | )% | 815 | 20.7 | % | 675 | |||||||||||||
| Customer expense |
309 | (14.6 | )% | 362 | (24.4 | )% | 479 | |||||||||||||
| FDIC insurance |
3,753 | 57.0 | % | 2,391 | 277.1 | % | 634 | |||||||||||||
| Other real estate owned expenses |
2,772 | 24.1 | % | 2,233 | 64.6 | % | 1,357 | |||||||||||||
| Professional fees |
5,302 | 16.7 | % | 4,545 | 282.9 | % | 1,187 | |||||||||||||
| Other operating expenses (1) |
4,207 | 36.6 | % | 3,079 | 10.4 | % | 2,789 | |||||||||||||
| Total non interest expense |
$ | 36,317 | 9.2 | % | $ | 33,251 | 40.3 | % | $ | 23,702 | ||||||||||
| (1) | Other operating expenses primarily consist of telephone, advertising, and investor relations, promotional, business development, and regulatory expenses, insurance premiums and correspondent bank fees. |
47
Table of Contents
2010 Compared to 2009. The $3.1 million, or 9.2%, increase in noninterest expense in 2010 was primarily attributable to (i) a $1.4 million, or 57%, increase in FDIC insurance premiums, due to the imposition by the FDIC of substantially higher insurance premiums on all federally insured depository institutions in order to replenish the bank deposit insurance fund which had been depleted by bank failures, (ii) a $539,000, or 24%, increase in expenses incurred in connection with real properties acquired from borrowers on or in lieu of foreclosures (typically referred to as “other real estate owned”), and (iii) a $757,000, or 17%, increase in professional fees, primarily incurred in collecting and foreclosing non-performing loans and restructurings loans for those borrowers who demonstrated an ability to meet their loan obligations on extended or modified terms. Those increases were partially offset by a $500,000 decrease in salaries and employee benefits resulting from expense reduction initiatives implemented in 2010.
2009 Compared to 2008. The increase in noninterest expense in 2009 was primarily attributable to (i) a $3.4 million increase in professional fees, primarily due to increased legal fees and costs incurred to manage our increased level of non-performing loans, which required us to initiate legal proceeding to recover amounts due us by defaulting borrowers, to foreclose real properties and other assets securing non-performing loans, and to implement loan restructurings for those borrowers who demonstrated to us an ability to meet their loan obligations on extended or modified terms; (ii) a $3.1 million increase in salaries and employee benefits due principally to the addition of mortgage banking personnel and loan administrators, (iii) a $1.8 million increase in FDIC insurance premiums, due to the imposition by the FDIC of substantially higher insurance premiums on all federally insured depository institutions in order to replenish the bank insurance fund which had been depleted by bank failures, and (iv) a $876,000 increase in 2009 in expenses incurred in connection with real properties acquired from borrowers on or in lieu of foreclosures.
A measure of our ability to control noninterest expense is our efficiency ratio, which is the ratio of noninterest expense to net revenue (net interest income plus noninterest income). As a general rule, a lower efficiency ratio indicates an ability to generate increased revenue without a commensurate increase in the staffing and equipment and third party services and, therefore, would be indicative of greater operational efficiencies. In 2010 our efficiency ratio improved to 91.7% from 121.9% in 2009, due primarily to an increase of $11 million, or 51% in our net interest income in 2010.
Expense Reduction Initiatives. In February 2010, we initiated a number of cost-cutting measures that were designed to improve the efficiency of our operations and reduce our noninterest expense. Those measures included a work force reduction, a freeze on salaries, elimination of a bonus program for 2010, and suspension of Company 401-K plan contributions, which contributed to the decreases in compensation expense, occupancy expense and data processing costs in 2010.
Income tax expense (benefit)
In 2010 we recorded a non-cash charge of $9.0 million to income tax expense in order to increase the valuation allowance to $10.7 million against our net deferred tax asset on our balance sheet. The increase in the valuation allowance was made as a result of an assessment of the realizability of our deferred tax asset as of June 30, 2010. Based on that assessment and due, in part, to continued weakness in the economy and financial markets, we concluded that it had become more likely, than not, that we would be unable to utilize our remaining tax benefits comprising our deferred tax asset prior to their expiration. See “— Critical Accounting Policies — Utilization and Valuation of Deferred Income Tax Benefits” above in this Item 7 of this Report.
48
Table of Contents
Financial Condition
Assets
Our total consolidated assets decreased by $185 million, or 3%, to $1.0 billion at December 31, 2010 from $1.2 billion at December 31, 2009, because cash and cash equivalents decreased during 2010 as a result of decreases in our deposits that were primarily attributable to our decision to allow higher priced time certificates of deposit to run-off, rather than seeking to renew them.
The following table sets forth the composition of our interest earning assets at:
| December 31, 2010 |
December 31, 2009 |
|||||||
| (Dollars in thousands) | ||||||||
| Interest-bearing deposits with financial institutions (1) |
$ | 32,678 | $ | 127,785 | ||||
| Interest-bearing time deposits with financial institutions |
2,078 | 9,800 | ||||||
| Federal Reserve Bank and Federal Home Loan Bank Stock, at cost |
12,820 | 14,091 | ||||||
| Securities available for sale, at fair value |
178,301 | 170,214 | ||||||
| Loans held for sale, at lower of cost or market |
12,469 | 7,572 | ||||||
| Loans (net of allowances of $18,101 and $20,345, respectively) |
722,210 | 813,194 | ||||||
| (1) | Includes interest-earning balances maintained at the Federal Reserve Bank of San Francisco. |
Investment Policy and Securities Available for Sale
Our investment policy is designed to provide for our liquidity needs and to generate a favorable return on investment without undue interest rate risk, credit risk or asset concentrations. Our investment policy:
| • | authorizes us to invest in obligations issued or fully guaranteed by the United States Government, certain federal agency obligations, time deposits issued by federally insured depository institutions, municipal securities and in federal funds sold; |
| • | provides that the weighted average maturities of U.S. Government obligations and federal agency securities cannot exceed 10 years and municipal obligations cannot exceed 25 years; |
| • | provides that time deposits that we maintain at other financial institutions must be placed with federally insured financial institutions, cannot exceed the maximum FDIC insured amount in any one institution and may not have a maturity exceeding 60 months; and |
| • | prohibits engaging in securities trading activities. |
49
Table of Contents
Securities Available for Sale. Securities that we intend to hold for an indefinite period of time, but which may be sold in response to changes in liquidity needs, in interest rates, or in prepayment risks or other similar factors, are classified as “securities available for sale”. Such securities are recorded on our balance sheet at their respective fair values and increases or decreases in those values are recorded as unrealized gains or losses, respectively, and are reported as Other Comprehensive Income (Loss) on our accompanying consolidated balance sheet, rather than included in or deducted from our earnings.
The following is a summary of the major components of securities available for sale and a comparison of the amortized cost, estimated fair values and the gross unrealized gains and losses attributable to those securities, as of December 31, 2010, 2009 and 2008:
| Amortized Cost | Gross Unrealized Gain |
Gross Unrealized Loss |
Estimated Fair Value |
|||||||||||||
| (Dollars in thousands) | ||||||||||||||||
| Securities available for sale at December 31, 2010: |
||||||||||||||||
| Mortgage-backed securities issued by US agencies |
166,421 | 24 | (2,009 | ) | 164,436 | |||||||||||
| Total government and agencies securities |
166,421 | 24 | (2,009 | ) | 164,436 | |||||||||||
| Municipal securities |
6,389 | — | (417 | ) | 5,972 | |||||||||||
| Non-agency collateralized mortgage obligations |
3,500 | 21 | (244 | ) | 3,277 | |||||||||||
| Asset backed securities |
2,493 | — | (2,122 | ) | 371 | |||||||||||
| Mutual fund |
4,245 | — | — | 4,245 | ||||||||||||
| Total securities available for sale |
$ | 183,048 | $ | 45 | $ | (4,792 | ) | $ | 178,301 | |||||||
| Securities available for sale at December 31, 2009: |
||||||||||||||||
| U.S. Treasury securities |
$ | 18,040 | $ | 11 | $ | — | $ | 18,051 | ||||||||
| Mortgage-backed securities issued by US agencies |
134,331 | 89 | (1,651 | ) | 132,769 | |||||||||||
| Total government and agencies securities |
152,371 | 100 | (1,651 | ) | 150,820 | |||||||||||
| Municipal securities |
10,545 | 13 | (431 | ) | 10,127 | |||||||||||
| Non-agency collateralized mortgage obligations |
7,094 | 10 | (1,069 | ) | 6,035 | |||||||||||
| Asset backed securities |
2,704 | — | (1,732 | ) | 972 | |||||||||||
| Mutual fund |
2,260 | — | — | 2,260 | ||||||||||||
| Total securities available for sale |
$ | 174,974 | $ | 123 | $ | (4,883 | ) | $ | 170,214 | |||||||
| Securities available for sale at December 31, 2008: |
||||||||||||||||
| U.S. Agencies/Mortgage backed securities |
$ | 126,065 | $ | 1,538 | $ | (471 | ) | $ | 127,132 | |||||||
| Collateralized mortgage obligations |
425 | 4 | — | 429 | ||||||||||||
| Total government and agencies securities |
126,490 | 1,542 | (471 | ) | 127,561 | |||||||||||
| Municipal securities |
22,895 | 90 | (1,523 | ) | 21,462 | |||||||||||
| Non-agency collateralized mortgage obligations |
10,278 | — | (1,340 | ) | 8,938 | |||||||||||
| Asset backed securities |
1,237 | — | — | 1,237 | ||||||||||||
| Mutual funds |
1,747 | — | — | 1,747 | ||||||||||||
| Total securities available for sale |
$ | 162,647 | $ | 1,632 | $ | (3,334 | ) | $ | 160,945 | |||||||
At December 31, 2010, U.S. Government and federal agency securities, consisting principally of mortgage backed securities and collateralized mortgage obligations with an aggregate fair market value of $54 million were pledged to secure Federal Home Loan Bank borrowings, repurchase agreements, local agency deposits and treasury, tax and loan accounts.
50
Table of Contents
The amortized cost, at December 31, 2010, of securities available for sale are shown in the table below by contractual maturities and historical prepayments based on the prior three months of principal payments. Expected maturities will differ from contractual maturities and historical prepayments, particularly with respect to collateralized mortgage obligations, because changes in interest rates will affect the timing and the extent of prepayments by borrowers.
| December 31, 2010 Maturing in |
||||||||||||||||||||||||||||||||||||||||
| One year or less |
Over one year through five years |
Over five years through ten years |
Over ten years |
Total | ||||||||||||||||||||||||||||||||||||
| Book Value |
Weighted Average Yield |
Book Value |
Weighted Average Yield |
Book Value |
Weighted Average Yield |
Book Value |
Weighted Average Yield |
Book Value |
Weighted Average Yield |
|||||||||||||||||||||||||||||||
| (Dollars in thousands) | ||||||||||||||||||||||||||||||||||||||||
| Securities available for sale: |
||||||||||||||||||||||||||||||||||||||||
| Mortgage-backed securities issued by U.S. Agencies |
10,920 | 2.27 | % | $ | 29,407 | 2.57 | % | $ | 26,598 | 2.77 | % | $ | 99,496 | 2.77 | % | 166,421 | 2.70 | % | ||||||||||||||||||||||
| Non-agency collateralized |
972 | 2.74 | % | — | — | 1,597 | 3.43 | % | 931 | 3.89 | % | 3,500 | 3.36 | % | ||||||||||||||||||||||||||
| Municipal securities |
— | — | — | — | 1,347 | 4.10 | % | 5,042 | 4.29 | % | 6,389 | 4.25 | % | |||||||||||||||||||||||||||
| Asset backed securities |
— | — | — | — | — | — | 2,493 | 0.00 | % | 2,493 | 0.00 | % | ||||||||||||||||||||||||||||
| Mutual funds |
— | — | 4,245 | 3.50 | % | — | — | — | — | 4,245 | 3.50 | % | ||||||||||||||||||||||||||||
| Total Securities Available for sale |
$ | 11,892 | 2.31 | % | $ | 33,652 | 2.69 | % | $ | 29,542 | 2.86 | % | $ | 107,962 | 2.79 | % | $ | 183,048 | 2.75 | % | ||||||||||||||||||||
The table below shows, as of December 31, 2010, the gross unrealized losses and fair values of our investments, aggregated by investment category and length of time that the individual securities have been in a continuous unrealized loss position.
| Securities With Unrealized Loss as of December 31, 2010 | ||||||||||||||||||||||||
| Less than 12 months | 12 months or more | Total | ||||||||||||||||||||||
| (Dollars In thousands) |
Fair Value | Unrealized Loss |
Fair Value | Unrealized Loss |
Fair Value | Unrealized Loss |
||||||||||||||||||
| Mortgage backed securities issued by U.S. Agencies |
$ | 154,856 | $ | (2,007 | ) | $ | 482 | $ | (2 | ) | $ | 155,338 | $ | (2,009 | ) | |||||||||
| Municipal securities |
5,552 | (367 | ) | 420 | (50 | ) | 5,972 | (417 | ) | |||||||||||||||
| Non-agency collateralized mortgage obligations |
— | — | 2,283 | (244 | ) | 2,283 | (244 | ) | ||||||||||||||||
| Asset-backed securities |
— | — | 371 | (2,122 | ) | 371 | (2,122 | ) | ||||||||||||||||
| Total temporarily impaired securities |
$ | 160,408 | $ | (2,374 | ) | $ | 3,556 | $ | (2,418 | ) | $ | 163,964 | $ | (4,792 | ) | |||||||||
Impairment exists when the fair value of the security is less than its cost. We perform a quarterly assessment of the securities that have an unrealized loss to determine whether the decline in fair value of those securities below their cost is other-than-temporary.
We adopted ASC 321-10 effective April 1, 2009 and, accordingly, we recognize other-than-temporary impairment for our available-for-sale debt securities. In accordance with ASC 321-10, when there are credit losses associated with an impaired debt security and (i) we do not have the intent to sell the security and (ii) it is more likely than not that we will not have to sell the security before recovery of its cost basis, then, we will separate the amount of impairment that is credit-related from the amount thereof related to non-credit factors. The credit-related impairment is recognized in the consolidated statements of operations. The non-credit-related impairment is recognized and reflected in Other Comprehensive Income.
Through the impairment assessment process, we determined that the investments discussed below were other-than-temporarily impaired (“OTTI”) at December 31, 2010. We recorded impairment credit losses in earnings on available for sale securities of $286,000 for the year ended December 31, 2010. The OTTI related to factors other than credit losses, in the aggregate amount of $2.2 million, was recognized as other comprehensive loss in our balance sheet.
51
Table of Contents
The table below presents the roll-forward of OTTIs where a portion related to other factors was recognized in other comprehensive loss for the year ended December 31, 2010:
| Gross Other- Than- Temporary Impairments |
Other-Than- Temporary Impairments Included in Other Comprehensive Loss |
Net
Other-Than- Temporary Impairments Included in Retained Earnings |
||||||||||
| (Dollars in thousands) | ||||||||||||
| Balance – December 31, 2008 |
$ | (1,603 | ) | $ | — | $ | (1,603 | ) | ||||
| Adoption of ASC 321-10 |
450 | (1,079 | ) | 1,529 | ||||||||
| Additions for credit losses on securities for which an OTTI was not previously recognized |
(1,418 | ) | (1,293 | ) | (125 | ) | ||||||
| Balance – December 31, 2009 |
(2,571 | ) | (2,372 | ) | (199 | ) | ||||||
| Additions for credit losses on securities for which an OTTI was not previously recognized |
(95 | ) | 191 | (286 | ) | |||||||
| Balance – December 31, 2010 |
$ | (2,666 | ) | $ | (2,181 | ) | $ | (485 | ) | |||
In determining the component of OTTI related to credit losses, we compare the amortized cost basis of each OTTI security to the present value of its expected cash flows, discounted using the effective interest rate implicit in the security at the date of acquisition.
As a part of our OTTI assessment process with respect to securities held for sale with unrealized losses, we consider available information about (i) the performance of the collateral underlying each such security, including credit enhancements, (ii) historical prepayment speeds; (iii) delinquency and default rates, (iv) loss severities, (v) the age or “vintage” of the security, and (iv) rating agency reports on the security. Significant judgments are required with respect to these and other factors in order to make a determination of the future cash flows that can be expected to be generated by the security.
Based on our OTTI assessment process, we determined that there were two different investment securities in our portfolio of securities held for sale that had become or were impaired as of December 31, 2010: An asset backed security, and a non-agency collateralized mortgage obligation (a “CMO”).
Asset-Backed Securities. At December 31, 2010, we had one asset backed security in our portfolio of investment securities available for sale. This security is a multi-class, cash flow collateralized bond obligation backed by a pool of trust preferred securities issued by a diversified pool of 56 issuers consisting of 45 U.S. depository institutions and 11 insurance companies at the time of the security’s issuance in November 2007. This security was part of a $363 million issuance. The security that we own (CUSIP 74042CAE8) is the mezzanine class B piece that floats with 3 month LIBOR +60 basis points and had a rating of Aa2/AA by Moody’s and Fitch at the time of issuance. We purchased $3.0 million face value of this security in November 2007 at a price of 95.21% for a total purchase price of $2,856,420.
As of December 31, 2010 the book value of this security was $2.5 million with a fair value of $371,000 for an approximate unrealized loss of $2.1 million. Currently, the security has a Ca rating from Moody’s and CC rating from Fitch and has experienced $42.5 million in defaults (12% of total current collateral) and $31.5 million in payment deferrals (9% of total current collateral) from issuance to December 31, 2010. The security did not pay its scheduled fourth quarter interest payment. The Company is not currently accruing interest on this security. The Company estimates that the security could experience another $75 million in defaults before it would not receive all of its contractual cash flows. This analysis is based on the following assumptions: future default rates of 2.2%, prepayment rates of 1% until maturity, and 15% recovery of future defaults. We have recognized impairment losses in earnings of $199,000, $24,000, and $1.6 million for the years ended December 31, 2010, December 31, 2009, and December 31, 2008.
Non Agency CMO. Through our impairment analysis, we identified one non-agency collateralized mortgage obligation security (a “CMO”) with respect to which we recognized OTTI at December 31, 2010. This CMO is a “Super Senior Support” bond, which was originated in 2005, was then rated AAA by Standard & Poor’s and Aa1 by Moody’s, and had a credit support of 2.5% of the total balance at issuance. As of December 31, 2010, the security was rated BBB and Caa3 by Standard and Poor’s and Moody’s, respectively, was determined to have a fair value of $871,000, as compared to an amortized cost of $931,000, resulting in an unrealized loss of approximately $60,000. The CMO is collateralized by a pool of one-to-four family, fully amortizing residential first mortgage loans that bear interest at a fixed rate for approximately five years, after which they bear interest at variable rates with annual resets.
52
Table of Contents
At December, 31, 2010, credit support underlying this CMO was approximately 5.6% and delinquencies 60 days and over totaled approximately 5.8%. Factors considered in determining that this security was impaired included the changes in the ratings of the security, the current level of subordination from other CMO classes, anticipated prepayment rates, cumulative default rates and the loss severity given a default. Based on our impairment assessment and analysis, we recorded an $87,000 impairment charge in our statement of operations in 2010 in respect of this security, because we concluded that the impairment was attributable to credit factors. The remaining unrealized loss on this security, of $60,000, was recognized as other comprehensive loss on our balance sheet, because we concluded that this loss was attributable to non-credit factors, such as external market conditions, the limited liquidity of the security and risks of potential additional declines in the housing market.
| Impairment Losses on OTTI Securities |
For the twelve months ended December 31 |
|||||||||||
| 2010 | 2009 | 2008 | ||||||||||
| Asset Backed Security |
$ | (199 | ) | $ | (24 | ) | $ | (1,603 | ) | |||
| Non Agency CMO |
(87 | ) | (101 | ) | — | |||||||
| $ | (286 | ) | $ | (125 | ) | $ | (1,603 | ) | ||||
We have made a determination that the remainder of our securities with respect to which there were unrealized losses as of December 31, 2010 are not other-than-temporarily impaired, because we have concluded that we have the ability to continue to hold those securities until their respective fair market values increase above their respective amortized costs or, if necessary, until their respective maturities. In reaching that conclusion we considered a number of factors and other information, which included: (i) the significance of each such security, (ii) the amount of the unrealized losses attributable to each such security, (iii) our liquidity position, (iv) the impact that retention of those securities could have on our capital position and (v) our evaluation of the expected future performance of these securities (based on the criteria discussed above).
Loans Held for Sale
We commenced a new mortgage banking business during the second quarter of 2009 to originate, primarily in Southern California, residential real estate mortgage loans that qualify for resale into the secondary mortgage markets. Our mortgage originations have been primarily for the financing of purchases of residential property and, to a lesser extent, refinancing of existing residential mortgage loans. In addition to conventional mortgage loans, we offer loan programs for low to moderate income families that qualify for mortgage assistance, such as the FHLB’s Wish Program, Homepath-financing on FNMA repossessed homes, and Southern California home Financing Authority and various mortgage assistance programs in counties and cities within our branch network. The following table reflects the quarterly activity, in thousands of dollars, of our mortgage loan operations.
As a general rule, most of the residential mortgage loans that we originate are sold in the secondary mortgage market within a period of 3 to 14 days following their origination.
| Year Ended December 31, |
Year Ended December 31, |
|||||||
| 2010 | 2009(1) | |||||||
| Single family mortgage loans funded |
$ | 217,050 | $ | 73,433 | ||||
| Single family mortgage loan sales |
202,902 | 67,780 | ||||||
| Loans held for sale, at lower of cost or market |
12,469 | 7,572 | ||||||
| (1) | Since we commenced our mortgage loan operations in the second quarter of 2009, the results shown for the twelve months ended December 31, 2009 are for a period of approximately eight months, rather than twelve months. |
53
Table of Contents
Loans held for sale are carried at the lower of cost or estimated fair value in the aggregate. Net unrealized losses on loans held for sale, if any, would be recognized through a valuation allowance established by a charge to income. As of December 31, 2010, the loans held for sale included $11.3 million of loans with interest rate lock commitments providing a hedge to interest rates and $1.1 million of loans pending investor commitments.
Loans
The following table sets forth the composition, by loan category, of our loan portfolio, excluding mortgage loans held for sale, at December 31, 2010, 2009, 2008, 2007 and 2006:
| At December 31, | ||||||||||||||||||||||||||||||||||||||||
| 2010 | 2009 | 2008 | 2007 | 2006 | ||||||||||||||||||||||||||||||||||||
| Amt | Percent | Amt | Percent | Amt | Percent | Amt | Percent | Amt | Percent | |||||||||||||||||||||||||||||||
| (Dollars in thousands) | ||||||||||||||||||||||||||||||||||||||||
| Commercial loans |
$ | 218,690 | 29.5 | % | $ | 290,406 | 34.8 | % | $ | 300,945 | 35.7 | % | $ | 269,887 | 34.6 | % | $ | 230,960 | 31.0 | % | ||||||||||||||||||||
| Commercial real estate loans – owner occupied |
178,085 | 24.0 | % | 179,682 | 21.5 | % | 174,169 | 20.6 | % | 163,949 | 21.0 | % | 128,632 | 17.2 | % | |||||||||||||||||||||||||
| Commercial real estate loans – all other |
136,505 | 18.4 | % | 135,152 | 16.2 | % | 127,528 | 15.1 | % | 108,866 | 14.0 | % | 125,851 | 16.8 | % | |||||||||||||||||||||||||
| Residential mortgage loans – multi-family |
84,553 | 11.4 | % | 101,961 | 12.2 | % | 100,971 | 12.0 | % | 92,440 | 11.9 | % | 98,678 | 13.2 | % | |||||||||||||||||||||||||
| Residential mortgage loans – single family |
72,442 | 9.8 | % | 67,023 | 8.0 | % | 65,127 | 7.7 | % | 64,718 | 8.3 | % | 76,117 | 10.2 | % | |||||||||||||||||||||||||
| Construction loans |
3,048 | 0.5 | % | 20,443 | 2.6 | % | 32,528 | 3.9 | % | 47,179 | 6.1 | % | 65,120 | 8.7 | % | |||||||||||||||||||||||||
| Land development loans |
29,667 | 4.0 | % | 30,042 | 3.6 | % | 33,283 | 3.9 | % | 25,800 | 3.3 | % | 16,733 | 2.2 | % | |||||||||||||||||||||||||
| Consumer loans |
18,017 | 2.4 | % | 9,370 | 1.1 | % | 9,173 | 1.1 | % | 6,456 | 0.8 | % | 5,401 | 0.7 | % | |||||||||||||||||||||||||
| Gross loans |
741,007 | 100.0 | % | 834,079 | 100.0 | % | 843,724 | 100.0 | % | 779,295 | 100.0 | % | 747,492 | 100.0 | % | |||||||||||||||||||||||||
| Deferred fee (income) costs, net |
(696 | ) | (540 | ) | (230 | ) | (98 | ) | (606 | ) | ||||||||||||||||||||||||||||||
| Allowance for loan losses |
(18,101 | ) | (20,345 | ) | (15,453 | ) | (6,126 | ) | (5,929 | ) | ||||||||||||||||||||||||||||||
| Loans, net |
$ | 722,210 | $ | 813,194 | $ | 828,041 | $ | 773,071 | $ | 740,957 | ||||||||||||||||||||||||||||||
Commercial loans are loans to businesses to finance capital purchases or improvements, or to provide cash flow for operations. Real estate and residential mortgage loans are loans secured by trust deeds on real properties, including commercial properties and single family and multi-family residences. Construction loans are interim loans to finance specific construction projects. Consumer loans include installment loans to consumers.
54
Table of Contents
The following tables set forth the maturity distribution of our loan portfolio (excluding single and multi-family residential mortgage loans and consumer loans) at December 31, 2010:
| December 31, 2010 | ||||||||||||||||
| One Year or Less |
Over One Year Through Five Years |
Over Five Years |
Total | |||||||||||||
| (Dollars in thousands) | ||||||||||||||||
| Real estate and construction loans(1) |
||||||||||||||||
| Floating rate |
$ | 58,127 | $ | 98,977 | $ | 2,619 | $ | 159,723 | ||||||||
| Fixed rate |
44,438 | 89,399 | 53,745 | 187,582 | ||||||||||||
| Commercial loans |
||||||||||||||||
| Floating rate |
16,811 | 225 | — | 17,036 | ||||||||||||
| Fixed rate |
130,440 | 52,478 | 18,736 | 201,654 | ||||||||||||
| Total |
$ | 249,816 | $ | 241,079 | $ | 75,100 | $ | 565,995 | ||||||||
| (1) | Does not include mortgage loans on single or multi-family residences or consumer loans, which totaled $157.0 million and $18.0 million, respectively, at December 31, 2010. |
Nonperforming Loans and Allowance for Loan Losses
Nonperforming Loans. Non-performing loans consist of (i) loans on non-accrual status because we have ceased accruing interest on those loans, which include loans restructured when there has not been a history of past performance on debt service in accordance with the contractual terms of the restructured loans, and (ii) loans 90 days or more past due and still accruing interest. Non-performing assets consist of non-performing loans and OREO, which consists of real properties which have been acquired by foreclosure or similar means and which management intends to offer for sale. Loans are placed on non-accrual status when, in the opinion of management, the full timely collection of principal or interest is in doubt. Generally, the accrual of interest is discontinued when principal or interest payments become more than 90 days past due, unless management believes the loan is adequately collateralized and the loan is in the process of collection. However, in certain instances, we may place a particular loan on non-accrual status earlier, depending upon the individual circumstances involved in loan’s delinquency. When a loan is placed on non-accrual status, previously accrued but unpaid interest is reversed against current income. Subsequent collections of unpaid amounts on such a loan are applied to reduce principal when received, except when the ultimate collectability of principal is probable, in which case interest payments are credited to income. Non-accrual loans may be restored to accrual status if and when principal and interest become current and full repayment is expected. Interest income is recognized on the accrual basis for impaired loans not meeting the criteria for non-accrual.
55
Table of Contents
The following table sets forth information regarding nonaccrual loans and other real estate owned which, together, comprise our nonperforming assets, as well as restructured loans, at December 31, 2010 and December 31, 2009:
| At December 31, 2010 | At December 31, 2009 | |||||||
| (Dollars in thousands) | ||||||||
| Nonaccrual loans: |
||||||||
| Commercial loans |
$ | 1,800 | $ | 17,150 | ||||
| Commercial real estate |
16,105 | 20,779 | ||||||
| Residential real estate |
1,832 | 1,358 | ||||||
| Construction and land development |
2,185 | 10,162 | ||||||
| Consumer loans |
129 | — | ||||||
| Total nonaccrual loans |
$ | 22,051 | $ | 49,449 | ||||
| Other real estate owned (OREO): |
||||||||
| Commercial loans |
$ | 3,989 | — | |||||
| Commercial real estate |
4,900 | — | ||||||
| Residential real estate |
7,093 | — | ||||||
| Construction and land development |
17,188 | 10,712 | ||||||
| Total other real estate owned |
33,170 | 10,712 | ||||||
| Total nonperforming assets |
$ | 55,221 | $ | 60,161 | ||||
| Restructured loans: |
||||||||
| Accruing loans |
1,187 | 1,243 | ||||||
| Nonaccruing loans (included in nonaccrual loans above) |
15,308 | 20,114 | ||||||
| Total restructured loans |
$ | 16,495 | $ | 21,357 | ||||
As the above table indicates, nonaccrual loans decreased $27.4 million, or 55.4%, from $49.4 million at December 31, 2009 to $22.1 million at December 31, 2010. The decrease was due to (i) our acquisition, by or in lieu of foreclosure, of properties which had collateralized loans placed on nonaccrual status and were held by the Bank as other real estate owned as of December 31, 2010, and (ii) a decrease in the volume of classified loans placed on nonaccrual status as a result of a modest improvement of economic conditions and a stabilization of our loan portfolio during 2010.
Total nonperforming assets decreased by $4.9 million, or 8.2%, to $55.2 million at December 31, 2010 from $60.2 million at December 31, 2009. In addition, restructured loans decreased by $4.9 million, or 22.8%, to $16.5 million at December 31, 2010 from $21.4 million at December 31, 2009.
We have allocated specific reserves within the allowance for loan losses to provide for losses we may incur on the loans that were classified as nonaccrual loans, and we have established specific reserves on the real properties classified as other real estate owned.
Information Regarding Impaired Loans. At December 31, 2010, there were $31.5 million of loans deemed impaired as compared to $57.4 million at December 31, 2009. We had an average investment in impaired loans for the year ended December 31, 2010 of $44.3 million as compared to $52.3 million for the year ended December 31, 2009. The interest that would have been earned during 2010 had the impaired loans in nonaccrual remained current in accordance with their original terms was $1.7 million.
The following table sets forth the amount of impaired loans for which there is a related allowance for loan losses determined in accordance with ASC 310-10 and the amount of that allowance and the amount of impaired loans for which there is no allowance for loan losses, at December 31, 2010 and December 31, 2009:
| December 31, 2010 | December 31, 2009 | |||||||||||||||||||||||
| Impaired Loans |
Loans | Reserves for Loan Losses |
% of Reserves to Loans |
Loans | Reserves for Loan Losses |
% of Reserves to Loans |
||||||||||||||||||
| (Dollars in thousands) | ||||||||||||||||||||||||
| Impaired loans with reserves |
$ | 25,598 | $ | 3,424 | 13.4 | % | $ | 28,237 | $ | 4,779 | 16.9 | % | ||||||||||||
| Impaired loans without reserves |
5,853 | — | — | 29,152 | — | — | ||||||||||||||||||
| Total impaired loans |
$ | 31,451 | $ | 3,424 | 10.9 | % | $ | 57,389 | $ | 4,779 | 8.3 | % | ||||||||||||
56
Table of Contents
Allowance for Loan Losses. The allowance for loan losses (the “Allowance”) at December 31, 2010 was $18.1 million, as compared to $20.3 million at December 31, 2009. As a percentage of total loans outstanding, the Allowance at December 31, 2010 was 2.44%, unchanged from the percentage of the loans outstanding at December 31, 2009.
The adequacy of the Allowance is determined through periodic evaluations of the loan portfolio and other factors that can reasonably be expected to affect the ability of borrowers to meet their loan obligations. Those factors are inherently subjective as the process for determining the adequacy of the Allowance involves some significant estimates and assumptions about such matters as (i) the amounts and timing of expected future cash flows of borrowers, (ii) the fair value of the collateral securing non-performing loans, (iii) estimates of losses that the Bank may incur on non-performing loans, which are determined on the basis of historical loss experience and industry loss factors and bank regulatory guidelines, which are subject to change, (iv) various qualitative factors. Since those factors are subject to changes in economic and other conditions and changes in regulatory guidelines or circumstances over which we have no control, the amount of the Allowance may prove in the future to be insufficient to cover all of the loan losses we might incur in the future and, therefore, it may become necessary for us to increase the Allowance from time to time to maintain its adequacy. Such increases are effectuated by means of a charge to income, referred to as the “provision for loan losses”, in our statement of our operations. See “— Results of Operations — Provision for Loan Losses, above in this Item 7.
The amount of the Allowance is first determined by assigning reserve ratios for all loans. All non-accrual loans and other loans classified as “special mention,” “substandard” or “doubtful” (“classified loans” or “classification categories”) are then assigned certain allocations according to type of loans, with greater reserve ratios or percentages applied to loans deemed to be of a higher risk. These ratios are determined based on prior loss history and industry guidelines and loss factors, by type of loan, adjusted for current economic factors.
On a quarterly basis, we utilize a classification migration model and individual loan review analysis tools as starting points for determining the adequacy of the Allowance. Our loss migration analysis tracks a certain number of quarters of loan loss history and industry loss factors to determine historical losses by classification category for each loan type, except certain loans (automobile, mortgage and credit cards), which are analyzed as homogeneous loan pools. These calculated loss factors are then applied to outstanding loan balances. We also conduct individual loan review analysis, as part of the Allowance allocation process, applying specific monitoring policies and procedures in analyzing the existing loan portfolios.
In determining whether and the extent to which we will make adjustments to our loan loss migration model for purposes of determining the Allowance, we also consider a number of qualitative factors that can affect the performance and the collectability of the loans in our loan portfolio. Such qualitative factors include:
| • | The effects of changes that we may make in our loan policies or underwriting standards on the quality of the loans and the risks in our loan portfolios; |
| • | Trends and changes in local, regional and national economic conditions, as well as changes in industry specific conditions, and any other reasonably foreseeable events that could affect the performance or the collectability of the loans in our loan portfolios; |
| • | Material changes that may occur in the mix or in the volume of the loans in our loan portfolios that could alter, whether positively or negatively, the risk profile of those portfolios; |
| • | Changes in management or loan personnel or other circumstances that could, either positively or negatively, impact the application of our loan underwriting standards, the monitoring of nonperforming loans or our loan collection efforts; |
| • | Changes in the concentration of risk in the loan portfolio; and |
| • | External factors that, in addition to economic conditions, can affect the ability of borrowers to meet their loan obligations, such as fires, earthquakes and terrorist attacks. |
57
Table of Contents
Determining the effects that these qualitative factors may have on the performance of our loan portfolios requires numerous judgments, assumptions and estimates about conditions, trends and events which may subsequently prove to have been incorrect due to circumstances outside of our control. Moreover, the effects of qualitative factors such as these on the performance of our loan portfolios are often difficult to quantify. As a result, we may sustain loan losses in any particular period that are sizable in relation to the Allowance or that may even exceed the Allowance.
In response to the economic recession, which has resulted in increased and relatively persistent high rates of unemployment, and the credit crisis that has led to a severe tightening in the availability of credit, preventing borrowers from refinancing their loans, we have (i) implemented more stringent loan underwriting standards, (ii) strengthened loan underwriting and approval processes and (iii) added personnel with experience in addressing problem assets.
58
Table of Contents
The following table compares the total amount of loans outstanding, and the allowance for loan losses, by loan category, in each case, in thousands of dollars, and certain related ratios, as of December 31, 2010 and December 31, 2009.
| December 31, 2010 |
December 31, 2009 |
Increase (Decrease) |
||||||||||
| (Dollars in thousands) | ||||||||||||
| Loan Categories: |
||||||||||||
| Commercial loans |
$ | 218,690 | $ | 290,406 | $ | (71,716 | ) | |||||
| Loans impaired(1) |
$ | 2,036 | $ | 20,910 | $ | (18,874 | ) | |||||
| Loans 90 days past due |
$ | 1,784 | $ | 13,158 | $ | (11,374 | ) | |||||
| Loans 30 days past due |
$ | 1,406 | $ | 1,127 | $ | 279 | ||||||
| Allowance for loan losses |
||||||||||||
| General component |
$ | 9,876 | $ | 9,050 | $ | 826 | ||||||
| Specific component(1) |
141 | 2,069 | (1,928 | ) | ||||||||
| Total allowance |
$ | 10,017 | $ | 11,119 | $ | (1,102 | ) | |||||
| Ratio of allowance to loan category |
4.58 | % | 3.83 | % | 0.75 | % | ||||||
| Real estate loans: |
$ | 399,143 | $ | 416,795 | $ | (17,652 | ) | |||||
| Loans impaired(1) |
$ | 24,021 | $ | 20,779 | $ | 3,242 | ||||||
| Loans 90 days past due |
$ | 1,111 | $ | 11,230 | $ | (10,119 | ) | |||||
| Loans 30 days past due |
$ | 10,197 | $ | 727 | $ | 9,470 | ||||||
| Allowance for loan losses |
||||||||||||
| General component |
$ | 3,196 | $ | 4,003 | $ | (807 | ) | |||||
| Specific component (1) |
3,155 | 1,965 | 1,190 | |||||||||
| Total allowance |
$ | 6,351 | $ | 5,968 | $ | 383 | ||||||
| Ratio of allowance to loan category |
1.59 | % | 1.43 | % | 0.16 | % | ||||||
| Construction loans and land development |
$ | 32,715 | $ | 50,485 | $ | (17,770 | ) | |||||
| Loans impaired(1) |
$ | 2,624 | $ | 13,830 | $ | (11,206 | ) | |||||
| Loans 90 days past due |
$ | 2,185 | $ | 5,373 | $ | (3,188 | ) | |||||
| Loans 30 days past due |
$ | — | $ | — | $ | — | ||||||
| Allowance for loan losses |
||||||||||||
| General component |
$ | 830 | $ | 1,702 | $ | (872 | ) | |||||
| Specific component(1) |
— | 477 | (477 | ) | ||||||||
| Total allowance |
$ | 830 | $ | 2,179 | $ | (1,349 | ) | |||||
| Ratio of allowance to loan category |
2.54 | % | 4.32 | % | (1.78 | )% | ||||||
| Consumer and single family mortgages |
$ | 90,459 | $ | 76,393 | $ | 14,066 | ||||||
| Loans impaired(1) |
$ | 2,473 | $ | 1,870 | 603 | |||||||
| Loans 90 days past due |
$ | 765 | $ | 87 | 678 | |||||||
| Loans 30 days past due |
$ | 432 | $ | 91 | 341 | |||||||
| Allowance for loan losses |
||||||||||||
| General component |
$ | 775 | $ | 811 | $ | (36 | ) | |||||
| Specific component(1) |
128 | 268 | (140 | ) | ||||||||
| Total allowance |
$ | 903 | $ | 1,079 | $ | (176 | ) | |||||
| Ratio of allowance to loan category |
1.00 | % | 1.41 | % | (0.41 | )% | ||||||
| Total loans outstanding |
$ | 741,007 | $ | 834,079 | $ | (93,072 | ) | |||||
| Loans impaired(1) |
$ | 31,154 | $ | 57,389 | $ | (26,235 | ) | |||||
| Loans 90 days past due |
$ | 5,845 | $ | 29,848 | $ | (24,003 | ) | |||||
| Loans 30 days past due |
$ | 12,035 | $ | 1,945 | $ | 10,090 | ||||||
| Allowance for loan losses |
||||||||||||
| General component |
$ | 14,677 | $ | 15,566 | $ | (889 | ) | |||||
| Specific component(1) |
3,424 | 4,779 | (1,355 | ) | ||||||||
| Total allowance |
$ | 18,101 | $ | 20,345 | $ | (2,244 | ) | |||||
| Ratio of allowance to total loans outstanding |
2.44 | % | 2.44 | % | 0.00 | % | ||||||
| (1) | Amounts in impaired loans and specific component include nonperforming delinquent loans. |
59
Table of Contents
Set forth below is a summary, in thousands of dollars, of the transactions in the allowance for loan losses for the years ended December 31, 2010 and December 31, 2009:
| Year Ended December 31, 2010 |
Year Ended December 31, 2009 |
|||||||
| (Dollars in thousands) | ||||||||
| Balance, beginning of year |
$ | 20,345 | $ | 15,453 | ||||
| Provision for loan losses |
8,288 | 23,673 | ||||||
| Recoveries on loans previously charged off |
3,033 | 357 | ||||||
| Charged off loans |
(13,565 | ) | (19,138 | ) | ||||
| Balance, end of year |
$ | 18,101 | $ | 20,345 | ||||
The table below compares loan delinquencies at December 31, 2010 to the loan delinquencies at December 31, 2009.
| December 31, | ||||||||
| 2010 | 2009 | |||||||
| (Dollars in thousands) | ||||||||
| Loans Delinquent: |
||||||||
| 90 days or more: |
||||||||
| Commercial loans |
$ | 1,784 | $ | 13,158 | ||||
| Commercial real estate |
1,111 | 10,550 | ||||||
| Residential mortgages |
636 | 767 | ||||||
| Construction and land development loans |
2,185 | 5,373 | ||||||
| Consumer loans |
129 | — | ||||||
| 5,845 | 29,848 | |||||||
| 30-89 days: |
||||||||
| Commercial loans |
1,406 | 1,127 | ||||||
| Commercial real estate |
10,197 | 726 | ||||||
| Residential mortgages |
432 | 92 | ||||||
| Construction and land development loans |
— | — | ||||||
| Consumer loans |
— | — | ||||||
| 12,035 | 1,945 | |||||||
| Total Past Due (1): |
$ | 17,880 | $ | 31,793 | ||||
| (1) | Past due balances include nonaccrual loans. |
As indicated above, loans 90 days or more delinquent declined by $24.0 million, or 80.4%, to $5.8 million at December 31, 2010, from $29.8 million at December 31, 2009. On the other hand, loans 30 to 89 days delinquent increased by $10.1 million, or 519%, to $12.0 million at December 31, 2010, from $1.9 million at December 31, 2009. Since the decrease in loans 90 days or more past due more than offset the increase in loans 30-89 days delinquent, total past due loans declined by $13.9 million, or 43.8%, to $17.9 million at December 31, 2010 from $31.8 million at December 31, 2009.
Deposits
Average Balances of and Average Interest Rates Paid on Deposits. Set forth below are the average amounts (in thousands) of, and the average rates paid on, deposits in each of 2010, 2009 and 2008:
| Year Ended December 31, | ||||||||||||||||||||||||
| 2010 | 2009 | 2008 | ||||||||||||||||||||||
| (Dollars in thousands) | Average Balance |
Average Rate |
Average Balance |
Average Rate |
Average Balance |
Average Rate |
||||||||||||||||||
| Noninterest bearing demand deposits |
$ | 167,357 | — | $ | 165,709 | — | $ | 158,501 | — | |||||||||||||||
| Interest-bearing checking accounts |
37,685 | 0.62 | % | 28,136 | 0.79 | % | 20,176 | 0.53 | % | |||||||||||||||
| Money market and savings deposits |
134,863 | 1.12 | % | 108,583 | 1.23 | % | 134,701 | 1.94 | % | |||||||||||||||
| Time deposits(1) |
614,850 | 2.24 | % | 594,885 | 3.49 | % | 454,339 | 4.56 | % | |||||||||||||||
| Total deposits |
$ | 954,755 | 1.62 | % | $ | 897,313 | 2.49 | % | $ | 767,717 | 3.05 | % | ||||||||||||
| (1) | Comprised of time certificates of deposit in denominations of less than and more than $100,000. |
60
Table of Contents
Deposit Totals. Total deposits increased by $57.4 million or 6.4% to $954.8 million at December 31, 2010 from $897.3 million at December 31, 2009. At December 31, 2010, noninterest-bearing deposits totaled $167.3 million, and 17.5% of total deposits, as compared to $165.7 million, and 18.5% of total deposits at December 31, 2009. Certificates of deposit in denominations of $100,000 or more, on which we pay higher rates of interest than on other deposits, aggregated $614.9 million, or 64.4%, of total deposits at December 31, 2010, as compared to $594.9 million, and 66.3%, of total deposits at December 31, 2009.
Set forth below is a maturity schedule of domestic time certificates of deposit outstanding at December 31, 2010 and December 31, 2009:
| December 31, 2010 | December 31, 2009 | |||||||||||||||
| Maturities | Certificates of Deposit Under $ 100,000 |
Certificates of Deposit $100,000 or more |
Certificates of Deposit Under $100,000 |
Certificates of Deposit $100,000 or more |
||||||||||||
| (Dollars in thousands) | ||||||||||||||||
| Three months or less |
$ | 41,474 | $ | 138,030 | $ | 62,713 | $ | 126,320 | ||||||||
| Over three and through six months |
12,502 | 33,177 | 19,713 | 52,062 | ||||||||||||
| Over six and through twelve months |
29,468 | 126,479 | 56,750 | 204,523 | ||||||||||||
| Over twelve months |
27,478 | 99,590 | 29,583 | 70,017 | ||||||||||||
| Total |
$ | 110,922 | $ | 397,276 | $ | 168,759 | $ | 452,922 | ||||||||
Liquidity
We actively manage our liquidity needs to ensure that sufficient funds are available to meet our needs for cash, including to fund new loans to and deposit withdrawals by our customers. We project the future sources and uses of funds and maintain liquid funds for unanticipated events. Our primary sources of cash include cash we have on deposit at other financial institutions, payments on loans, proceeds from the sale or maturity of securities, and from sales of residential mortgage loans, increases in deposits and increases in borrowings principally from the Federal Home Loan Bank. The primary uses of cash include funding new loans and making advances on existing lines of credit, purchasing investments, including securities available for sale, funding new residential mortgage loans, funding deposit withdrawals and paying operating expenses. We maintain funds in overnight federal funds and other short-term investments to provide for short-term liquidity needs. We also have obtained credit lines from the Federal Home Loan Bank and other financial institutions to meet any additional liquidity requirements.
Our liquid assets, which included cash and due from banks, federal funds sold, interest earning deposits with financial institutions and unpledged securities available for sale (excluding Federal Reserve Bank and Federal Home Loan Bank stock) totaled $153 million, which represented 15% of total assets, at December 31, 2010.
Cash Flow Used in Operating Activities. Although we incurred a net loss of $14 million in 2010, $10.1 million of that loss represented non-cash charges to the provision for income taxes to increase the valuation allowance for our deferred tax assets. See “Critical Accounting Policies – Deferred Tax Assets” above in this section of this Report. Due primarily to the use of $217 million of cash to originate new mortgage loans and $6 million of cash to fund net increases in other assets, which we funded primarily with $206 million of cash generated by sales of mortgage loans, operating activities used net cash of $12 million in 2010.
Cash Flow Provided by Investing Activities. Investing activities provided net cash of $72 million, primarily attributable to $243 million of proceeds from sales of securities available for sale and $65 million of loan repayments, partially offset by $281 million of purchases of securities available for sale.
Cash Flow Used by Financing Activities. In 2010, we used net cash of $169 million in financing activities, primarily to fund a $144 million decrease in deposits and a net decrease of $29 million in borrowings, partially offset by $4.6 million of proceeds from our private placement of Series A Shares, which was completed in August 2010.
Ratio of Loans to Deposits. The relationship between gross loans and total deposits can provide a useful measure of a bank’s liquidity. Since repayment of loans tends to be less predictable than the maturity of investments and other liquid resources, the higher the loan-to-deposit ratio the less liquid are our assets. On the other hand, since we realize greater yields on loans than we do on investments, a lower loan-to-deposit ratio can adversely affect interest income and earnings. As a result, our goal is to achieve a loan-to-deposit ratio that appropriately balances the requirements of liquidity and the need to generate a fair return on our assets. At December 31, 2010 and December 31, 2009, the loan-to-deposit ratios were 90% and 86%, respectively.
61
Table of Contents
Off Balance Sheet Arrangements
Loan Commitments and Standby Letters of Credit. In order to meet the financing needs of our customers in the normal course of business, we make commitments to extend credit and issue standby commercial letters of credit to or for our customers. At December 31, 2010 and 2009, we had outstanding commitments to fund loans totaling approximately $141 million and $184 million, respectively.
Commitments to extend credit and standby letters of credit generally have fixed expiration dates or other termination clauses and the customer may be required to pay a fee and meet other conditions in order to draw on those commitments or standby letters of credit. We expect, based on historical experience, that many of the commitments will expire without being drawn upon and, therefore, the total commitment amounts do not necessarily represent future cash requirements.
To varying degrees, commitments to extend credit involve elements of credit and interest rate risk for us that are in excess of the amounts recognized in our balance sheets. Our maximum exposure to credit loss in the event of nonperformance by the customers to whom such commitments are made could potentially be equal to the amount of those commitments. As a result, before making such a commitment to a customer, we evaluate the customer’s creditworthiness using the same underwriting standards that we would apply if we were approving loans to the customer. In addition, we often require the customer to secure its payment obligations for amounts drawn on such commitments with collateral such as accounts receivable, inventory, property, plant and equipment, income-producing commercial properties, residential properties and properties under construction. As a consequence, our exposure to credit and interest rate risk on such commitments is not different in character or amount than risks inherent in the outstanding loans in our loan portfolio.
Standby letters of credit are conditional commitments issued by the Bank to guarantee a payment obligation of a customer to a third party. The credit risk involved in issuing letters of credit is essentially the same as that involved in extending loan commitments to customers.
We believe that our cash and cash equivalent resources, together with available borrowings under our credit facilities, will be sufficient to enable us to meet any increases in demand for loans or in the utilization of outstanding loan commitments or standby letters of credit and any increase in deposit withdrawals that might occur in the foreseeable future.
Contractual Obligations
Borrowings. As of December 31, 2010, we had $68 million of outstanding short-term borrowings and $44 million of outstanding long-term borrowings that we had obtained from the Federal Home Loan Bank. The table below sets forth the amounts (in thousands of dollars) of, the interest rates we pay on, and the maturity dates of these Federal Home Loan Bank borrowings. These borrowings, along with the securities sold under agreements to repurchase, have a weighted-average annualized interest rate of 0.82%.
| Principal Amounts |
Interest Rate | Maturity Dates |
Principal Amounts | Interest Rate | Maturity Dates | |||||||||||||
| (Dollars in thousands) | (Dollars in thousands) | |||||||||||||||||
| $ | 10,000 | 0.29 | % | January 28, 2011 | $ | 10,000 | 1.07 | % | February 17, 2012 | |||||||||
| 14,000 | 0.28 | % | January 31, 2011 | 10,000 | 1.18 | % | February 23, 2012 | |||||||||||
| 10,000 | 0.28 | % | January 31, 2011 | 4,000 | 0.77 | % | August 9, 2012 | |||||||||||
| 6,000 | 0.44 | % | August 8, 2011 | 5,000 | 1.66 | % | November 26, 2012 | |||||||||||
| 14,000 | 0.69 | % | August 11, 2011 | 10,000 | 1.73 | % | February 19, 2013 | |||||||||||
| 5,000 | 0.69 | % | August 11, 2011 | 5,000 | 1.06 | % | August 9, 2013 | |||||||||||
| 9,000 | 1.08 | % | November 25, 2011 | |||||||||||||||
At December 31, 2010, U.S. Agency and mortgage backed securities, U.S. Government agency securities and collateralized mortgage obligations with an aggregate fair market value of $12.6 million and $178 million of residential mortgage and other real estate secured loans were pledged to secure these Federal Home Loan Bank borrowings, repurchase agreements, local agency deposits and treasury, tax and loan accounts.
62
Table of Contents
The highest amount of borrowings outstanding at any month end in 2010 consisted of $132 million of borrowings from the Federal Home Loan Bank and $11.8 million of overnight borrowings in the form of securities sold under repurchase agreements. By comparison, the highest amount of borrowings outstanding at any month end in 2009 consisted of $208 million of borrowings from the Federal Home Loan Bank and $13 million of overnight borrowings in the form of securities sold under repurchase agreements.
Junior Subordinated Debentures. Pursuant to rulings of the Federal Reserve Board, bank holding companies were permitted to issue long term subordinated debt instruments that, subject to certain conditions, would qualify as and, therefore, augment capital for regulatory purposes. At December 31, 2010, we had outstanding approximately $17.5 million principal amount of 30-year junior subordinated floating rate debentures (the “Debentures”), of which $16.8 million qualified as Tier 1 capital for regulatory purposes as of December 31, 2010. See discussion below under the subcaption “—Capital Resources-Regulatory Capital Requirements.”
Set forth below is certain information regarding the Debentures:
| Original Issue Dates: |
Principal Amount | Interest Rates | Maturity Dates | |||||||||
| September 2002 |
$ | 7,217 | Libor plus 3.40 | % | September 2032 | |||||||
| October 2004 |
10,310 | Libor plus 2.00 | % | October 2034 | ||||||||
| Total |
$ | 17,527 | ||||||||||
| (1) | Subject to the receipt of prior regulatory approval, we may redeem the Debentures, in whole or in part, without premium or penalty, at any time prior to maturity. |
Interest on the Debentures is payable quarterly. However, subject to certain conditions, we have the right to defer those interest payments for up to five years.
As previously reported, since July 2009 we have been required to obtain the prior approval of the Federal Reserve Bank of San Francisco to make interest payments on the Debentures. During the quarter ended June 30, 2010, we were advised by the Federal Reserve Bank that it would not approve the payments of interest on the Debentures scheduled to be made on June 24 and July 19, 2010. As a result, we exercised our right, pursuant to the terms of the Debentures, to defer those interest payments. In the fourth quarter of 2010 we were advised by the Federal Reserve Bank that it would not approve our payment of the next two interest payments scheduled to be made in December 2010 and January 2011, respectively. As a result we have deferred those interest payments as well. If we are unable to obtain Federal Reserve Bank approval to pay the interest payments that will become due in June 2011 and July 2011, then, it will be necessary for us to exercise our deferral rights with respect to those payments as well. Since we have the right, under the terms of the Debentures to defer interest payments for up to five years, the deferral of interest payments to date did not, and any deferral of the June and July 2011 interest payments will not, constitute a default under or with respect to the Debentures. Information regarding the FRB Agreement and the requirements and restrictions imposed on us by that Agreement is set forth above under the subcaption “—Supervision and Regulation in Part I of this Report under the caption “Regulatory Action by the FRB and DFI” and in the Section entitled “RISK FACTORS” contained in Item 1A of this Report.
Investment Policy and Securities Available for Sale
Our investment policy is designed to provide for our liquidity needs and to generate a favorable return on investments without undue interest rate risk, credit risk or asset concentrations.
Our investment policy:
| • | authorizes us to invest in obligations issued or fully guaranteed by the United States Government, certain federal agency obligations, time deposits issued by federally insured depository institutions, municipal securities and in federal funds sold; |
| • | provides that the aggregate weighted average life of U.S. Government obligations and federal agency securities exclusive of variable rate securities cannot, without approval by the Board of Directors, exceed 10 years and municipal obligations cannot exceed 25 years; |
63
Table of Contents
| • | provides that time deposits must be placed with federally insured financial institutions, cannot exceed the current federally insured amount in any one institution and may not have a maturity exceeding 60 months, unless that time deposit is matched to a liability instrument issued by the Bank; and |
| • | prohibits engaging in securities trading activities. |
Securities available for sale are those that we intend to hold for an indefinite period of time, but which may be sold in response to changes in liquidity needs, changes in interest rates, changes in prepayment risks or other similar factors. Such securities are recorded at fair value. Any unrealized gains and losses are reported as “Other Comprehensive Income (Loss)” rather than included in or deducted from earnings.
Other Contractual Obligations
Set forth below is information regarding our material contractual obligations as of December 31, 2010:
Operating Lease Obligations. We lease certain facilities and equipment under various non-cancelable operating leases, which include escalation clauses ranging between 3% and 5% per annum. Future minimum non-cancelable lease commitments were as follows at December 31, 2010:
| At December 31, 2010 | ||||
| (In thousands) | ||||
| 2011 |
$ | 2,048 | ||
| 2012 |
1,358 | |||
| 2013 |
879 | |||
| 2014 |
783 | |||
| 2015 |
777 | |||
| Thereafter |
324 | |||
| Total |
$ | 6,169 | ||
Maturing Time Certificates of Deposits. Set forth below is a maturity schedule, as of December 31, 2010, of time certificates of deposit of $100,000 or more:
| At December 31, 2010 | ||||
| (In thousands) | ||||
| 2011 |
$ | 310,101 | ||
| 2012 |
83,358 | |||
| 2013 |
2,883 | |||
| 2014 |
307 | |||
| 2015 and beyond |
628 | |||
| Total |
$ | 397,277 | ||
Capital Resources
Capital Regulatory Requirements Applicable to Banking Institutions.
Under federal banking regulations that apply to all United States based bank holding companies and federally insured banks, the Company (on a consolidated basis) and the Bank (on a stand-alone basis) must meet specific capital adequacy requirements that, for the most part, involve quantitative measures, primarily in terms of the ratios of their capital to their assets, liabilities, and certain off-balance sheet items, calculated under regulatory accounting practices. Under those regulations, which are based primarily on those quantitative measures, each bank holding company must meet a minimum capital ratio and each federally insured bank is determined by its primary federal bank regulatory agency to come within one of the following capital adequacy categories on the basis of its capital ratios.
| • | well capitalized |
| • | adequately capitalized |
64
Table of Contents
| • | undercapitalized |
| • | significantly undercapitalized; or |
| • | critically undercapitalized |
Certain qualitative assessments also are made by a banking institution’s primary federal regulatory agency that could lead the agency to determine that the banking institution should be assigned to a lower capital category than the one indicated by the quantitative measures used to assess the institution’s capital adequacy. At each successive lower capital category, a banking institution is subject to greater operating restrictions and increased regulatory supervision by its federal bank regulatory agency.
The following table sets forth the capital and capital ratios of the Company (on a consolidated basis) and the Bank (on a stand-alone basis) at December 31, 2010, as compared to the respective regulatory requirements applicable to them.
| Applicable Federal Regulatory Requirement | ||||||||||||||||||||||||
| Actual | To be Adequately Capitalized | To Be Well-Capitalized | ||||||||||||||||||||||
| Amount | Ratio | Amount | Ratio | Amount | Ratio | |||||||||||||||||||
| Total Capital to Risk Weighted Assets: |
||||||||||||||||||||||||
| Company |
$ | 95,293 | 11.3 | % | $ | 67,309 | At least 8.0 | % | N/A | N/A | ||||||||||||||
| Bank |
91,291 | 10.9 | % | 67,242 | At least 8.0 | % | $ | 84,053 | At least 10.0 | % | ||||||||||||||
| Tier 1 Capital to Risk Weighted Assets: |
||||||||||||||||||||||||
| Company |
$ | 73,895 | 8.8 | % | $ | 33,655 | At least 4.0 | % | N/A | N/A | ||||||||||||||
| Bank |
80,694 | 9.6 | % | 33,621 | At least 4.0 | % | $ | 50,432 | At least 6.0 | % | ||||||||||||||
| Tier 1 Capital to Average Assets: |
||||||||||||||||||||||||
| Company |
$ | 73,895 | 6.7 | % | $ | 43,973 | At least 4.0 | % | N/A | N/A | ||||||||||||||
| Bank |
80,694 | 7.4 | % | 43,919 | At least 4.0 | % | $ | 54,898 | At least 5.0 | % | ||||||||||||||
At December 31, 2010 the Bank (on a stand-alone basis) continued to qualify as a well-capitalized institution, and the Company continued to exceed the minimum required capital ratios, under the capital adequacy guidelines described above.
The consolidated total capital and Tier 1 capital of the Company, at December 31, 2010, includes an aggregate of $17.5 million principal amount of Junior Subordinated Debentures that we issued in 2002 and 2004. We contributed that amount to the Bank over the six year period ended December 31, 2009, thereby providing it with additional cash to fund the growth of its banking operations and, at the same time, to increase its total capital and Tier 1 capital.
Additional Capital Requirements under FRB Agreement and DFI Order.
On August 31, 2010, the members of the respective Boards of Directors of the Company and the Bank entered into the FRB Agreement and the Bank consented to the issuance of the DFI Order. The principal purposes of the FRB Agreement and the DFI Order, which constitute formal supervisory actions by the FRB and the DFI, are to require us to adopt and implement formal plans and take certain actions, as well as to continue implementing measures that we previously adopted, to address the adverse consequences that the economic recession has had on the performance of our loan portfolio and our operating results and to increase our capital to strengthen our ability to weather any further adverse conditions that might arise if the improvement in the economy does not materialize or remains sluggish.
The Agreement and Order contain substantially similar provisions. They require the Boards of Directors of the Company and the Bank to prepare and submit written plans to the FRB and the DFI that address a number of matters, including improving the Bank’s position with respect to problem assets, maintaining adequate reserves for loan and lease losses in accordance with applicable supervisory guidelines, and improving the capital position of the Bank and, in the case of the FRB Agreement, the capital position of the Company. The Bank is also prohibited from paying dividends to the Company without the prior approval of the DFI, and without the prior approval of the FRB the Company may not declare or pay cash dividends, repurchase any of its shares, make interest or principal payments on its Debentures or incur or guarantee any debt.
65
Table of Contents
The FRB Agreement also requires us to submit a capital plan to the FRB that will meet with its approval and then implement that plan. Under the Order, the Bank was required to achieve a ratio of adjusted tangible shareholders’ equity to its tangible assets to 9.0% by January 31, 2011, by raising additional capital, generating earnings or reducing the Bank’s tangible assets (subject to a 15% limitation on such a reduction) or a combination thereof and, upon achieving that ratio, to thereafter maintain that ratio during the Term of the Order.
The DFI Order also states that if we were to violate or fail to comply with the Order the Bank could be deemed to be conducting business in an unsafe manner which could subject the Bank to further regulatory enforcement action.
The Company and the Bank already have made substantial progress with respect to several of these requirements and both the Board and management are committed to achieving all of the requirements on a timely basis. Among other things, in August 2010, we completed a private placement of its Series A Convertible Preferred Stock, raising gross proceeds of $12,655,000, of which $10,250,000 was contributed to the Bank to increase its equity capital.
Since the issuance of the DFI Order, we also have made a concerted effort to raise the additional capital needed to increase the Bank’s ratio of tangible equity-to-tangible assets to 9.0% by January 31, 2011, as required by the DFI Order. Among other things, we retained a nationally recognized investment banking firm to assist us in those efforts and we have engaged in substantive discussions with a number of institutional investors that have expressed an interest in making a capital investment in the Company and we are in negotiations with some of them with respect to the terms of such a capital investment.
However, as previously reported, notwithstanding those efforts, which are continuing, we were not able to raise the capital needed to increase the Bank’s ratio of tangible equity-to-tangible assets to 9.0% by January 31, 2011, as required by the DFI Order. Nevertheless, the DFI has notified us that it will not take any action against the Bank at this time because the Bank has not, as yet, met that capital requirement. We understand that this decision was based on the progress we have made since August 31, 2010 in increasing the Bank’s capital ratio, improvements made in the Bank’s financial condition, including reductions in the Bank’s non-performing assets, and the Bank’s classification as a “well-capitalized” banking institution under federal bank regulatory guidelines and federally established prompt corrective action regulations.
We cannot, however, predict when or even if we will succeed in meeting the capital requirements of the DFI Order in the near term and the DFI is not precluded from taking enforcement action against the Bank if its financial condition were to worsen or if Bank failed to achieve further improvements in its capital ratio.
Additional information regarding the FRB Agreement and the DFI Order is set forth above in the Section entitled “Supervision and Regulation” in Part I of this Report, under the caption “Regulatory Action by the FRB and DFI”.
Sale of Series A Convertible 10% Cumulative Preferred Stock. As previously reported in a Current Report filed with the SEC on Form 8-K dated October 6, 2009, we commenced a private placement to a limited number of accredited investors (as defined in Regulation D under the Securities Act of 1933, as amended) of a new issue of Series A Convertible 10% Cumulative Preferred Stock (the “Series A Shares”), at $100 per Series A Share. We sold a total of 126,550 Series A Shares, raising gross proceeds of $12.655 million, in the private placement, which we concluded in August 2010. We have used those proceeds to make a $10 million capital contribution to the Bank to increase its equity capital and to provide it with cash to fund additional loans and other interest-earning assets and meet working capital requirements, and for general corporate purposes. Dividends accrue and accumulate on the Series A Shares at a rate of 10% per annum until paid and, at December 31, 2010, accumulated but unpaid dividends on the Series A Shares totaled $1,075,000. Moreover, until such dividends are paid, we may not pay any dividends on our common stock.
Each outstanding Series A Share is convertible at the option of its holder, at a conversion price of $7.65 per share, into 13.07 shares of our common stock (as the same may be adjusted pursuant to the anti-dilution provisions applicable to the Series A Shares). On the second anniversary of the original issue date of the Series A Shares (the “Automatic Conversion Date”), all Series A Shares then outstanding will automatically convert into common stock at the then conversion price, subject to the payment by the Company, in cash, of the accumulated, but unpaid, dividends on those Series A Shares. If, however, due to regulatory restrictions or for any other reason, we are unable to pay the accumulated, but unpaid dividends on the Automatic Conversion Date, in cash, then, the Automatic Conversion Date will be extended, and those Series A Shares will remain outstanding and will continue to accumulate dividends, until such time as we are able to pay such dividends in cash. A more detailed description of the rights, preferences and privileges of and restrictions on the Series A Shares is contained in the above-referenced Current Report on Form 8-K dated October 6, 2009, and the foregoing summary is qualified by reference to that description.
Although we have cash sufficient to pay the accumulated unpaid dividends on the Series A Shares (the “Series A Dividends”), which totaled $1,075,000 at December 31, 2010, the FRB Agreement requires us to obtain the prior approval of the Federal Reserve Bank to pay any of those dividends. We have been advised by the Federal Reserve Bank that it does not intend to approve the payment of any Series A Dividends at least until we significantly increase our capital and achieve a return to profitability. As a result, we expect that Series A Shares will continue to accrue dividends, at a rate of approximately $316,625 per quarter, for some time. Moreover, for accounting and public reporting purposes, accrued but unpaid Series A Dividends are recorded, and reduce the earnings or increase the loss allocable to common stockholders set forth, in the Company’s Statement of Operations. See our Consolidated Financial Statements in Item 8 of this Report below.
Dividend Policy and Share Repurchase Programs. Our Board of Directors has followed the policy of retaining earnings to maintain capital and, thereby, support the operations of the Bank. On occasion, the Board has considered paying cash dividends out of cash generated in excess of those capital requirements and, in February 2008, the Board of Directors declared a one-time cash dividend, in the amount of $0.10 per share of common stock, which was paid on March 14, 2008 to our shareholders.
The Board also authorized share repurchase programs, in June 2005 and in October 2008, when the Board concluded that, at prevailing market prices, the Company’s shares represented an attractive investment opportunity and, therefore, that share repurchases would be a good use of Company funds. No shares were purchased under this program in 2010 or 2009.
66
Table of Contents
In the first quarter of 2009, the Board of Directors decided that the prudent course of action, in light of the economic recession, was to preserve cash to enhance the Bank’s capital position and to be in a position to take advantage of improved economic and market conditions in the future. Moreover, the MOU entered into with the FRB and DFI in July 2009 and the FRB Agreement and DFI Order (which superseded the MOU) prohibit our payment of cash dividends and the making of share repurchases without the prior approval of those regulatory agencies. Accordingly, we do not expect to pay dividends or make share purchases at least for the foreseeable future.
67
Table of Contents
| ITEM 8. | FINANCIAL STATEMENTS |
INDEX TO CONSOLIDATED FINANCIAL STATEMENTS
68
Table of Contents
REPORT OF INDEPENDENT REGISTERED PUBLIC ACCOUNTING FIRM
Board of Directors and Shareholders
Pacific Mercantile Bancorp and subsidiaries
We have audited the accompanying consolidated statements of financial condition of Pacific Mercantile Bancorp (a California Corporation) and subsidiaries (collectively, the “Company”) as of December 31, 2010 and 2009, and the related consolidated statements of operations, shareholders’ equity and comprehensive loss, and cash flows for each of the three years in the period ended December 31, 2010. These financial statements are the responsibility of the Company’s management. Our responsibility is to express an opinion on these financial statements based on our audits.
We conducted our audits in accordance with the standards of the Public Company Accounting Oversight Board (United States). Those standards require that we plan and perform the audit to obtain reasonable assurance about whether the financial statements are free of material misstatement. The Company is not required to have, nor were we engaged to perform, an audit of its internal control over financial reporting. Our audits included consideration of internal control over financial reporting as a basis for designing audit procedures that are appropriate in the circumstances, but not for the purpose of expressing an opinion on the effectiveness of the Company’s internal control over financial reporting. Accordingly, we express no such opinion. An audit includes examining, on a test basis, evidence supporting the amounts and disclosures in the financial statements. An audit also includes assessing the accounting principles used and significant estimates made by management, as well as evaluating the overall financial statement presentation. We believe that our audits provide a reasonable basis for our opinion.
In our opinion, the financial statements referred to above present fairly, in all material respects, the consolidated financial position of Pacific Mercantile Bancorp and subsidiaries as of December 31, 2010 and 2009, and the consolidated results of their operations and their cash flows for each of the three years in the period ended December 31, 2010 in conformity with accounting principles generally accepted in the United States of America.
As more fully described in Notes 3 and 17 to the consolidated financial statements, in August 2010, the Company and its wholly owned subsidiary, Pacific Mercantile Bank, (the “Bank”) entered into a Written Agreement with its regulators. The Written Agreement includes certain requirements of the Company and the Bank which include (i) strengthening board oversight, (ii) improving the Bank’s position with respect to problem assets and maintaining adequate reserves for loan and lease losses, (iii) improving the Bank’s capital position, and (iv) improving the Bank’s earnings. The Company and the Bank have taken measures in 2010 towards complying with the provisions of the Written Agreement, however the Company and Bank cannot predict the future impact of the Written Agreement upon their business, financial condition or results of operations, and there can be no assurance when or if the Company and Bank will be in compliance with the Written Agreement, or whether the regulators will take further action against the Company or Bank. The accompanying financial statements do not reflect the impact of this uncertainty.
/s/ SQUAR, MILNER, PETERSON, MIRANDA & WILLIAMSON, LLP
Newport Beach, California
March 31, 2011
69
Table of Contents
PACIFIC MERCANTILE BANCORP AND SUBSIDIARIES
CONSOLIDATED STATEMENTS OF FINANCIAL CONDITION
(Dollars in thousands)
| December 31, | ||||||||
| 2010 | 2009 | |||||||
| ASSETS | ||||||||
| Cash and due from banks |
$ | 7,306 | $ | 13,866 | ||||
| Interest bearing deposits with financial institutions |
25,372 | 127,785 | ||||||
| Cash and cash equivalents |
32,678 | 141,651 | ||||||
| Interest-bearing time deposits with financial institutions |
2,078 | 9,800 | ||||||
| Federal Reserve Bank and Federal Home Loan Bank Stock, at cost |
12,820 | 14,091 | ||||||
| Securities available for sale, at fair value |
178,301 | 170,214 | ||||||
| Loans held for sale, at lower of cost or market |
12,469 | 7,572 | ||||||
| Loans (net of allowances of $18,101 and $20,345, respectively) |
722,210 | 813,194 | ||||||
| Investment in unconsolidated subsidiaries |
682 | 682 | ||||||
| Other real estate owned |
33,170 | 10,712 | ||||||
| Accrued interest receivable |
3,259 | 3,730 | ||||||
| Premises and equipment, net |
935 | 1,329 | ||||||
| Other assets |
17,268 | 27,661 | ||||||
| Total assets |
$ | 1,015,870 | $ | 1,200,636 | ||||
| LIABILITIES AND SHAREHOLDERS’ EQUITY | ||||||||
| Deposits: |
||||||||
| Noninterest-bearing |
$ | 144,079 | $ | 183,789 | ||||
| Interest-bearing |
672,147 | 776,649 | ||||||
| Total deposits |
816,226 | 960,438 | ||||||
| Borrowings |
112,000 | 141,003 | ||||||
| Accrued interest payable |
985 | 1,901 | ||||||
| Other liabilities |
5,716 | 5,295 | ||||||
| Junior subordinated debentures |
17,527 | 17,527 | ||||||
| Total liabilities |
952,454 | 1,126,164 | ||||||
| Commitments and contingencies (Note 15) |
— | — | ||||||
| Shareholders’ equity: |
||||||||
| Preferred stock, no par value, 2,000,000 shares authorized, 126,550 and 80,050 shares issued and outstanding at December 31, 2010 and December 31, 2009, respectively; liquidation preference $100 per share plus accumulated dividends at December 31, 2010 and December 31, 2009 |
12,655 | 8,050 | ||||||
| Common stock, no par value, 20,000,000 shares authorized, 10,434,665 shares issued and outstanding at December 31, 2010 and December 31, 2009 |
73,058 | 72,891 | ||||||
| Accumulated deficit |
(17,553 | ) | (3,599 | ) | ||||
| Accumulated other comprehensive loss |
(4,744 | ) | (2,870 | ) | ||||
| Total shareholders’ equity |
63,416 | 74,472 | ||||||
| Total liabilities and shareholders’ equity |
$ | 1,015,870 | $ | 1,200,636 | ||||
The accompanying notes are an integral part of these consolidated financial statements.
70
Table of Contents
PACIFIC MERCANTILE BANCORP AND SUBSIDIARIES
CONSOLIDATED STATEMENTS OF OPERATIONS
(Dollars in thousands, except for per share data)
| Year Ended December 31, | ||||||||||||
| 2010 | 2009 | 2008 | ||||||||||
| Interest income: |
||||||||||||
| Loans, including fees |
$ | 45,887 | $ | 47,482 | $ | 50,539 | ||||||
| Federal funds sold |
— | — | 839 | |||||||||
| Securities available for sale and stock |
4,564 | 3,661 | 10,148 | |||||||||
| Interest-bearing deposits with financial institutions |
468 | 501 | 85 | |||||||||
| Total interest income |
50,919 | 51,644 | 61,611 | |||||||||
| Interest expense: |
||||||||||||
| Deposits |
15,483 | 22,316 | 23,473 | |||||||||
| Borrowings |
2,598 | 7,567 | 11,025 | |||||||||
| Total interest expense |
18,081 | 29,883 | 34,498 | |||||||||
| Net interest income |
32,838 | 21,761 | 27,113 | |||||||||
| Provision for loan losses |
8,288 | 23,673 | 21,685 | |||||||||
| Net interest income (expense) after provision for loan losses |
24,550 | (1,912 | ) | 5,428 | ||||||||
| Noninterest income |
||||||||||||
| Total other-than-temporary impairment of securities |
(2,051 | ) | (829 | ) | (1,603 | ) | ||||||
| Portion of (losses) gains recognized in other comprehensive loss |
(1,765 | ) | 704 | — | ||||||||
| Net impairment loss recognized in earnings |
(286 | ) | (125 | ) | (1,603 | ) | ||||||
| Service fees on deposits and other banking services |
1,207 | 1,486 | 1,151 | |||||||||
| Mortgage banking (including net gains on sales of loans held for sale) |
3,741 | 917 | — | |||||||||
| Net gains on sale of securities available for sale |
1,530 | 2,308 | 2,346 | |||||||||
| Net loss on sale of other real estate owned |
(64 | ) | (72 | ) | (40 | ) | ||||||
| Other |
643 | 1,008 | 752 | |||||||||
| Total noninterest income |
6,771 | 5,522 | 2,606 | |||||||||
| Noninterest expense |
||||||||||||
| Salaries and employee benefits |
15,345 | 15,845 | 12,767 | |||||||||
| Occupancy |
2,668 | 2,713 | 2,741 | |||||||||
| Equipment and depreciation |
1,277 | 1,268 | 1,073 | |||||||||
| Data processing |
684 | 815 | 675 | |||||||||
| Customer expense |
309 | 362 | 479 | |||||||||
| FDIC expense |
3,753 | 2,391 | 634 | |||||||||
| Other real estate owned expense |
2,772 | 2,233 | 1,357 | |||||||||
| Professional Fees |
5,302 | 4,545 | 1,187 | |||||||||
| Other operating expense |
4,207 | 3,079 | 2,789 | |||||||||
| Total noninterest expense |
36,317 | 33,251 | 23,702 | |||||||||
| Loss before income taxes |
(4,996 | ) | (29,641 | ) | (15,668 | ) | ||||||
| Income tax provision (benefit) |
8,958 | (12,333 | ) | (3,702 | ) | |||||||
| Net loss |
(13,954 | ) | (17,308 | ) | (11,966 | ) | ||||||
| Cumulative undeclared dividends on preferred stock |
(1,075 | ) | (61 | ) | — | |||||||
| Net loss available to common stockholders |
$ | (15,029 | ) | $ | (17,369 | ) | $ | (11,966 | ) | |||
| Loss per common share: |
||||||||||||
| Basic |
$ | (1.44 | ) | $ | (1.66 | ) | $ | (1.14 | ) | |||
| Diluted |
$ | (1.44 | ) | $ | (1.66 | ) | $ | (1.14 | ) | |||
| Dividends paid per share |
$ | — | $ | — | $ | 0.10 | ||||||
| Weighted average number of common shares outstanding: |
||||||||||||
| Basic |
10,434,665 | 10,434,665 | 10,473,476 | |||||||||
| Diluted |
10,434,665 | 10,434,665 | 10,473,476 | |||||||||
The accompanying notes are an integral part of these consolidated financial statements.
71
Table of Contents
PACIFIC MERCANTILE BANCORP AND SUBSIDIARIES
CONSOLIDATED STATEMENT OF SHAREHOLDERS’ EQUITY AND COMPREHENSIVE LOSS
(Shares and dollars in thousands)
For the Three Years Ended December 31, 2010
| Preferred stock | Common stock | Retained earnings (accumulated deficit) |
Accumulated other comprehensive income (loss) |
Total | ||||||||||||||||||||||||
| Number of shares |
Amount | Number of shares |
Amount | |||||||||||||||||||||||||
| Balance at January 1, 2008 |
— | — | 10,492 | $ | 72,381 | $ | 25,846 | $ | (1,365 | ) | $ | 96,862 | ||||||||||||||||
| Dividend paid |
— | — | — | — | (1,049 | ) | — | (1,049 | ) | |||||||||||||||||||
| Exercise of stock options, net |
— | — | 26 | — | — | — | — | |||||||||||||||||||||
| Stock based compensation expense |
— | — | — | 635 | — | — | 635 | |||||||||||||||||||||
| Stock option income tax benefits |
— | — | — | 93 | — | — | 93 | |||||||||||||||||||||
| Stock buyback |
— | — | (83 | ) | (517 | ) | — | — | (517 | ) | ||||||||||||||||||
| Comprehensive loss: |
||||||||||||||||||||||||||||
| Net loss |
— | — | — | — | (11,966 | ) | — | (11,966 | ) | |||||||||||||||||||
| Change in unrealized gain on securities held for sale, net of taxes |
— | — | — | — | — | 127 | 127 | |||||||||||||||||||||
| Change in unrealized expense on supplemental executive retirement plan, net of taxes |
— | — | — | — | — | 47 | 47 | |||||||||||||||||||||
| Total comprehensive loss |
— | — | — | — | — | — | (11,792 | ) | ||||||||||||||||||||
| Balance at December 31, 2008 |
— | — | 10,435 | 72,592 | 12,831 | (1,191 | ) | 84,232 | ||||||||||||||||||||
| Cumulative effect of adoption of accounting principle (1) |
— | — | — | — | 878 | (878 | ) | — | ||||||||||||||||||||
| Issuances of Series A Cumulative Preferred Stock |
81 | 8,050 | — | — | — | — | 8,050 | |||||||||||||||||||||
| Stock based compensation expense |
— | — | — | 299 | — | — | 299 | |||||||||||||||||||||
| Comprehensive loss: |
||||||||||||||||||||||||||||
| Net loss |
— | — | — | — | (17,308 | ) | — | (17,308 | ) | |||||||||||||||||||
| Change in unrealized gain on securities held for sale, net of taxes |
— | — | — | — | — | (922 | ) | (922 | ) | |||||||||||||||||||
| Change in unrealized expense on supplemental executive retirement plan, net of taxes |
— | — | — | — | — | 121 | 121 | |||||||||||||||||||||
| Total comprehensive loss |
— | — | — | — | — | — | (18,109 | ) | ||||||||||||||||||||
| Balance at December 31, 2009 |
81 | 8,050 | 10,435 | 72,891 | (3,599 | ) | (2,870 | ) | 74,472 | |||||||||||||||||||
| Issuances of Series A Cumulative Preferred Stock |
46 | 4,605 | — | — | — | — | 4,605 | |||||||||||||||||||||
| Stock based compensation expense |
— | — | — | 167 | — | — | 167 | |||||||||||||||||||||
| Comprehensive loss: |
||||||||||||||||||||||||||||
| Net loss |
— | — | — | — | (13,954 | ) | — | (13,954 | ) | |||||||||||||||||||
| Change in unrealized gain on securities held for sale, net of taxes |
— | — | — | — | — | (1,946 | ) | (1,946 | ) | |||||||||||||||||||
| Change in unrealized expense on supplemental executive retirement plan, net of taxes |
— | — | — | — | — | 72 | 72 | |||||||||||||||||||||
| Total comprehensive loss |
— | — | — | — | — | — | (15,828 | ) | ||||||||||||||||||||
| Balance at December 31, 2010 |
127 | $ | 12,655 | 10,435 | $ | 73,058 | $ | (17,553 | ) | $ | (4,744 | ) | $ | 63,416 | ||||||||||||||
| (1) | Impact on prior period of adopting ASC 320-10, Recognition and Presentation of Other-Than-Temporary Impairments (see Note 5). |
The accompanying notes are an integral part of these consolidated financial statements.
72
Table of Contents
PACIFIC MERCANTILE BANCORP AND SUBSIDIARIES
CONSOLIDATED STATEMENTS OF CASH FLOWS
(Dollars in thousands)
| Year Ended December 31, | ||||||||||||
| 2010 | 2009 | 2008 | ||||||||||
| Cash Flows From Operating Activities: |
||||||||||||
| Net loss |
$ | (13,954 | ) | $ | (17,308 | ) | $ | (11,966 | ) | |||
| Adjustments to reconcile net loss to net cash (used in) provided by operating activities: |
||||||||||||
| Depreciation and amortization |
504 | 492 | 609 | |||||||||
| Provision for loan losses |
8,288 | 23,673 | 21,685 | |||||||||
| Net amortization of premium on securities |
611 | 1,449 | 246 | |||||||||
| Net gains on sales of securities available for sale |
(1,530 | ) | (2,308 | ) | (2,346 | ) | ||||||
| Net gains on sales of mortgage loans held for sale |
(3,108 | ) | (905 | ) | — | |||||||
| Proceeds from sales of mortgage loans held for sale |
205,732 | 67,780 | — | |||||||||
| Originations and purchases of mortgage loan held for sale |
(217,050 | ) | (73,433 | ) | — | |||||||
| Mark to market adjustment of loans held for sale |
— | 228 | — | |||||||||
| Decrease (increase) in current income taxes receivable |
980 | (4,190 | ) | (3,643 | ) | |||||||
| Other than temporary impairment on securities available for sale |
286 | 125 | 1,603 | |||||||||
| Net amortization of deferred fees and unearned income on loans |
(616 | ) | (253 | ) | 84 | |||||||
| Net loss on sales of other real estate owned |
64 | 72 | 40 | |||||||||
| Write downs of other real estate owned |
1,874 | 1,529 | 1,002 | |||||||||
| Stock-based compensation expense |
167 | 299 | 635 | |||||||||
| Capitalized cost of other real estate owned |
(1,877 | ) | (2,352 | ) | — | |||||||
| Changes in operating assets and liabilities: |
||||||||||||
| Net decrease in accrued interest receivable |
471 | 104 | 597 | |||||||||
| Net (decrease) increase in other assets |
(6,254 | ) | 650 | (897 | ) | |||||||
| Net decrease (increase) in deferred taxes |
10,012 | (5,964 | ) | (2,069 | ) | |||||||
| Net (decrease) in accrued interest payable |
(916 | ) | (949 | ) | (190 | ) | ||||||
| Net increase (decrease) in other liabilities |
4,189 | 1,495 | (29 | ) | ||||||||
| Net cash (used in) provided by operating activities |
(12,127 | ) | (9,766 | ) | 5,361 | |||||||
| Cash Flows From Investing Activities: |
||||||||||||
| Net decrease (increase) in interest-bearing time deposits with financial institutions |
7,722 | (9,602 | ) | — | ||||||||
| Maturities of and principal payments received for securities available for sale and other stock |
32,000 | 56,928 | 37,125 | |||||||||
| Purchase of securities available for sale and other stock |
(280,992 | ) | (261,092 | ) | (168,790 | ) | ||||||
| Proceeds from sale of securities available for sale and other stock |
242,822 | 210,452 | 172,710 | |||||||||
| Proceeds from sale of other real estate owned |
5,750 | 8,861 | 943 | |||||||||
| Net decrease (increase) in loans |
64,572 | (14,629 | ) | (92,307 | ) | |||||||
| Purchases of premises and equipment |
(110 | ) | (681 | ) | (131 | ) | ||||||
| Net cash provided by (used in) investing activities |
71,764 | (9,763 | ) | (50,450 | ) | |||||||
| Cash Flows From Financing Activities: |
||||||||||||
| Net (decrease) increase in deposits |
(144,212 | ) | 138,752 | 75,023 | ||||||||
| Proceeds from issuances of Series A Cumulative Preferred Stock |
4,605 | 8,050 | — | |||||||||
| Cash dividend paid |
— | — | (1,049 | ) | ||||||||
| Tax benefits from exercise of stock options |
— | — | 93 | |||||||||
| Net cash paid for share buyback |
— | — | (517 | ) | ||||||||
| Net increase (decrease) in borrowings |
(29,003 | ) | (92,755 | ) | 24,940 | |||||||
| Net cash (used in) provided by financing activities |
(168,610 | ) | 54,047 | 98,490 | ||||||||
The accompanying notes are an integral part of these consolidated financial statements.
73
Table of Contents
PACIFIC MERCANTILE BANCORP AND SUBSIDIARIES
CONSOLIDATED STATEMENTS OF CASH FLOWS—continued
(Dollars in thousands)
| Year Ended December 31, | ||||||||||||
| 2010 | 2009 | 2008 | ||||||||||
| Net (decrease) increase in cash and cash equivalents |
(108,973 | ) | 34,518 | 53,401 | ||||||||
| Cash and Cash Equivalents, beginning of year |
141,651 | 107,133 | 53,732 | |||||||||
| Cash and Cash Equivalents, end of year |
$ | 32,678 | $ | 141,651 | $ | 107,133 | ||||||
| Supplementary Cash Flow Information: |
||||||||||||
| Cash paid for interest on deposits and other borrowings |
$ | 19,802 | $ | 30,688 | $ | 34,688 | ||||||
| Cash paid for income taxes |
— | — | $ | 1,820 | ||||||||
| Non-Cash Investing Activities: |
||||||||||||
| Net decrease in net unrealized losses and prior year service cost on supplemental employee retirement plan, net of tax |
$ | 72 | $ | 121 | $ | 47 | ||||||
| Net (decrease) increase in net unrealized gains and losses on securities held for sale, net of income tax |
$ | (1,946 | ) | $ | (1,800 | ) | $ | 127 | ||||
| Transfer into other real estate owned |
$ | 28,269 | $ | 4,814 | $ | 15,568 | ||||||
| Transfer of loans held for sale to loans held for investment |
$ | — | $ | 5,800 | $ | — | ||||||
| Securities sold and not settled |
$ | — | $ | — | $ | (16,796 | ) | |||||
| Mark to market loss adjustment of equity securities |
$ | 5 | $ | 10 | $ | 4 | ||||||
The accompanying notes are an integral part of these consolidated financial statements.
74
Table of Contents
PACIFIC MERCANTILE BANCORP AND SUBSIDIARIES
NOTES TO CONSOLIDATED FINANCIAL STATEMENTS
1. Nature of Business
Organization
Pacific Mercantile Bancorp (“PMBC”) is a bank holding company which, through its wholly owned subsidiary, Pacific Mercantile Bank (the “Bank”) is engaged in the commercial banking and retail mortgage business in Southern California. PMBC is registered as a one bank holding company under the United States Bank Holding Company Act of 1956, as amended. The Bank is chartered by the California Department of Financial Institutions (the “DFI”) and is a member of the Federal Reserve Bank of San Francisco (“FRB”). In addition, the deposit accounts of the Bank’s customers are insured by the Federal Deposit Insurance Corporation (“FDIC”) up to the maximum amount allowed by law. PMBC and the Bank, together, shall sometimes be referred to in this report as the “Company” or as “we”, “us” or “our”.
Substantially all of our operations are conducted and substantially all our assets are owned by the Bank, which accounts for substantially all of our consolidated revenues and expenses, and earnings. The Bank provides a full range of banking services to small and medium-size businesses, professionals and the general public in Orange, Los Angeles, San Bernardino and San Diego Counties of California and is subject to competition from other banks and financial institutions and from financial services organizations conducting operations in those same markets.
During 2002, we organized three business trusts, under the names Pacific Mercantile Capital Trust I, PMB Capital Trust I, and PMB Statutory Trust III, respectively, to facilitate our issuance of $5.155 million, $5.155 million and $7.217 million, respectively, principal amount of junior subordinated debentures, all with maturity dates in 2032. In October 2004, we organized PMB Capital Trust III to facilitate our issuance of an additional $10.310 million principal amount of junior subordinated debentures, with a maturity date in 2034. In accordance with applicable accounting standards, the financial statements of these trusts are not included in the Company’s consolidated financial statements. See Note 2: “Significant Accounting Policies — Principles of Consolidation” below.
In July 2007, we redeemed the $5.155 million principal amount of junior subordinated debentures issued in conjunction with the organization of Pacific Mercantile Capital Trust I and in August 2007, we redeemed the $5.155 million principal amount of junior subordinated debentures issued in conjunction with the organization of PMB Capital Trust I. Those trusts were dissolved as a result of those redemptions.
2. Significant Accounting Policies
The accompanying consolidated financial statements have been prepared in accordance with the instructions to Form 10–K and in accordance with generally accepted accounting principles, in effect in the United States (“GAAP”), on a basis consistent with prior periods.
Use of Estimates
The preparation of the financial statements in conformity with generally accepted accounting principles requires management to make certain estimates and assumptions that could affect the reported amounts of certain of our assets, liabilities, and contingencies at the date of the financial statements and the reported amounts of our revenues and expenses during the reporting periods. Those estimates related primarily to our determinations of the allowance for loan losses, the fair value of securities available for sale, loans held for sale and the valuation of our deferred tax assets. If circumstances or financial trends on which those estimates were based were to change in the future or there were to occur any currently unanticipated events affecting the amounts of those estimates, our future financial position or results of operations could differ, possibly materially, from those expected at the current time.
75
Table of Contents
PACIFIC MERCANTILE BANCORP AND SUBSIDIARIES
NOTES TO CONSOLIDATED FINANCIAL STATEMENTS—(Continued)
Principles of Consolidation
The consolidated financial statements for the years ended December 31, 2010, 2009 and 2008, include the accounts of PMBC and its wholly owned subsidiary, Pacific Mercantile Bank. All significant intercompany balances and transactions were eliminated in the consolidation.
Cash and Cash Equivalents
For purposes of the statements of cash flow, cash and cash equivalents consist of cash due from banks and federal funds sold. Generally, federal funds are sold for a one-day period. As of December 31, 2010 and 2009 the Bank maintained required reserves with the Federal Reserve Bank of San Francisco of approximately $477,000 and $2.1 million, respectively, which are included in cash and due from banks in the accompanying Consolidated Statements of Financial Condition.
Interest-Bearing Deposits with Financial Institutions
Interest-bearing deposits with financial institutions mature within one year or have no stated maturity date and are carried at cost.
Securities Available for Sale
Securities available for sale are those that management intends to hold for an indefinite period of time, but which may be sold in response to changes in liquidity needs, changes in interest rates, changes in prepayment risks and other similar factors. The securities are recorded at fair value, with unrealized gains and losses excluded from earnings and reported as other comprehensive income or loss net of taxes. Purchased premiums and discounts are recognized as interest income using the interest method over the term of these securities. Gains and losses on the sale of securities are recorded on the trade date and are determined using the specific identification method.
Declines in the fair value of securities below their cost that are other than temporary are reflected in earnings as realized losses. In determining other-than-temporary losses, management considers many factors, including: (1) the length of time and the extent to which the fair value has been less than cost, (2) the financial condition and near-term prospects of the issuer, (3) whether the market decline was affected by macroeconomic conditions, and (4) whether the entity has the intent to sell the debt security or more likely than not will be required to sell the debt security before its anticipated recovery. The assessment of whether other-than-temporary decline exists involves a high degree of subjectivity and judgment and is based on the information available to management at the time such determinations are made.
Federal Home Loan Bank Stock and Federal Reserve Bank Stock
The Bank’s investment in the Federal Home Loan Bank stock and Federal Reserve Bank stock represents equity interests in the Federal Home Loan Bank and the Federal Reserve Bank, respectively. The investments are recorded at cost.
Loans Held for Sale
The Bank commenced a new mortgage banking business during the second quarter of 2009 to originate residential real estate mortgage loans that qualify for resale into the secondary mortgage markets. For the year ended December 31, 2010, the Bank originated approximately $217.1 million of conventional and FHA/VA single-family mortgages, sold approximately $202.9 million of those loans in the secondary mortgage market and $7.9 million of such loans were recorded to the loan portfolio as held for investment. The Company does not believe the activity in this business during 2010 is material for segment disclosure purposes.
Loans classified as loans held for sale are carried at the lower of cost or estimated fair value in the aggregate. Net unrealized losses on loans held for sale, if any, would be recognized through a valuation allowance established by a charge to income. Gains and losses on loan sales are determined using the specific identification method.
76
Table of Contents
PACIFIC MERCANTILE BANCORP AND SUBSIDIARIES
NOTES TO CONSOLIDATED FINANCIAL STATEMENTS—(Continued)
Accounting for Derivative Instruments and Interest Rate Lock Commitments
The Company does not utilize derivative instruments for hedging the fair value or interest rate exposures within its mortgage banking business. In this business, the Company enters into commitments to originate mortgage loans whereby the interest rate on the loan is set prior to funding (interest rate lock commitments or “IRLCs”). IRLCs on mortgage loan funding commitments for mortgage loans that are intended to be sold are considered to be derivative instruments under GAAP and are recorded at fair value on the balance sheet with the change in fair value between reporting periods recorded to operations.
Unlike most other derivative instruments, there is no active market for the mortgage loan commitments that can be used to determine their fair value. The Company has developed a method for estimating the fair value by calculating the change in market value from a commitment date to a measurement date based upon changes in applicable interest rates during the period, adjusted for a fallout factor (loans committed to funding that ultimately do not fund). At December 31, 2010, the Company’s IRLC’s were insignificant to the Company’s financial position or results of operations.
Loans and Allowance for Loan Losses
Loans that management has the intent and ability to hold for the foreseeable future or until maturity or pay-off, are stated at principal amounts outstanding, net of unearned income. Interest is accrued daily as earned, except where reasonable doubt exists as to collectability of the loan. A loan with principal or interest that is 90 days or more past due based on the contractual payment due dates is placed on nonaccrual status in which case accrual of interest is discontinued, except that management may elect to continue the accrual of interest when the estimated net realizable value of collateral securing the loan is expected to be sufficient to enable us to recover both principal and accrued interest balances and those balances are in the process of collection. Generally, interest payments received on nonaccrual loans are applied to principal. Once all principal has been received, any additional interest payments are recognized as interest income on a cash basis. A loan is generally classified as impaired when, in management’s opinion, the principal or interest will not be collectible in accordance with the contractual terms of the loan agreement.
An allowance for loan losses is established by means of a provision for loan losses that is charged against income. If management concludes that the collection, in full, of the carrying amount of a loan has become unlikely, the loan, or the portion thereof that is believed to be uncollectible, is charged against the allowance for loan losses. We carefully monitor changing economic conditions, the loan portfolio by category, the financial condition of borrowers and the history of the performance of the portfolio in determining the adequacy of the allowance for loan losses. Additionally, as the volume of loans increases, additional provisions for loan losses may be required to maintain the allowance at levels deemed adequate. Moreover, if economic conditions were to deteriorate, causing the risk of loan losses to increase, it would become necessary to increase the allowance to an even greater extent, which would necessitate additional charges to income. The Company also evaluates the unfunded portion of loan commitments and establishes a loss reserve in other liabilities through a charge against noninterest expense in connection with such unfunded loan commitments. The loss reserve for unfunded loan commitments was $249,000 at December 31, 2010 and 2009, respectively.
The allowance for loan losses is based on estimates and ultimate loan losses may vary from the current estimates. These estimates are reviewed periodically and, as adjustments become necessary, they are recorded in earnings in the periods in which they become known. We believe that the allowance for loan losses was adequate as of December 31, 2010 and 2009. In addition, the FRB and the DFI, as an integral part of their examination processes, periodically review the allowance for loan losses for adequacy. These agencies may require us to recognize additions to the allowance based on their judgments in light of the information available at the time of their examinations.
We also evaluate loans for impairment, where principal and interest is not expected to be collected in accordance with the contractual terms of the loan. We measure and reserve for impairment on a loan-by-loan basis using either the present value of expected future cash flows discounted at the loan’s effective interest rate, or the fair value of the collateral if the loan is collateral dependent. We exclude smaller, homogeneous loans, such as consumer installment loans and lines of credit, from these impairment calculations. Also, loans that experience insignificant payment delays or shortfalls are generally not considered impaired.
77
Table of Contents
PACIFIC MERCANTILE BANCORP AND SUBSIDIARIES
NOTES TO CONSOLIDATED FINANCIAL STATEMENTS—(Continued)
Loan Origination Fees and Costs
All loan origination fees and related direct costs are deferred and amortized to interest income as an adjustment to yield over the respective lives of the loans using the effective interest method, except for loans that are revolving or short-term in nature for which the straight line method is used, which approximates the interest method.
Investment in Unconsolidated Subsidiaries
Investment in unconsolidated subsidiaries are stated at cost. The unconsolidated subsidiaries are comprised of two grantor trusts established in 2002 and 2004, respectively, in connection with our issuance of subordinated debentures in each of those years. See Note 9 “– Borrowings and Contractual Obligations – Junior Subordinated Debentures”.
Other Real Estate Owned
Other real estate owned (“OREO”), represents real properties acquired by us through foreclosure or in lieu of foreclosure in satisfaction of loans. OREO is recorded on the balance sheet at fair value less selling costs at the time of acquisition. Loan balances in excess of fair value less selling costs are charged to the allowance for loan losses. Any subsequent operating expenses or income, reduction in estimated fair values and gains or losses on disposition of such properties are charged or credited to current operations. The carrying amount of other real estate owned at December 31 2010 and 2009, was $33.6 million and $10.7 million, respectively.
Restricted Stock Investments
The Bank, as a member of the Federal Home Loan Bank System, is required to maintain an investment in capital stock of the Federal Home Loan Bank of San Francisco (“FHLB”) in varying amounts based on asset size and on amounts borrowed from the FHLB. Because no ready market exists for this stock and it has no quoted market value, the Bank’s investment in this stock is carried at cost.
The Bank also maintains an investment in capital stock of the Federal Reserve Bank. Because no ready market exists for these stocks and they have no quoted market values, the Bank’s investment in these stocks is carried at cost.
Premises and Equipment
Premises and equipment are stated at cost, less accumulated depreciation and amortization which are charged to expense on a straight-line basis over the estimated useful lives of the assets or, in the case of leasehold improvements, over the term of the leases, whichever is shorter. For income tax purposes, accelerated depreciation methods are used. Maintenance and repairs are charged directly to expense as incurred. Improvements to premises and equipment that extend the useful lives of the assets are capitalized.
When assets are disposed of, the applicable costs and accumulated depreciation thereon are removed from the accounts and any resulting gain or loss is included in current operations. Rates of depreciation and amortization are based on the following estimated useful lives:
| Furniture and equipment | Three to seven years | |
| Leasehold improvements | Lesser of the lease term or estimated useful life |
Income Taxes
Deferred income taxes and liabilities are determined using the asset and liability method. Under this method, the net deferred tax asset or liability is determined based on the tax effects of the temporary differences between the book and tax basis of the various balance sheet assets and liabilities and gives current recognition to changes in tax rates and laws.
78
Table of Contents
PACIFIC MERCANTILE BANCORP AND SUBSIDIARIES
NOTES TO CONSOLIDATED FINANCIAL STATEMENTS—(Continued)
Earnings (Loss) Per Share
Basic income (loss) per share for any fiscal period is computed by dividing net income (loss) available to common shareholders for such period by the weighted average number of common shares outstanding during that period. Fully diluted income (loss) per share reflects the potential dilution that could have occurred assuming all outstanding options or warrants to purchase our shares of common stock, at exercise prices that were less than the market price of our shares, were exercised into common stock, thereby increasing the number of shares outstanding during the period determined using the treasury method. Accumulated undeclared dividends on our preferred stock are not recorded in the accompanying consolidated statement of operations, however are included for purposes of computing earnings (loss) per share available to common shareholders.
Stock Option Plans
The Company follows the Financial Accounting Standards Board (“FASB”) Accounting Standards Codification (“ASC”) 718-10, “Share-Based Payment”, which requires entities that grant stock options or other equity compensation awards to employees to recognize the fair value of those options and shares as compensation cost over their requisite service (vesting) periods in their financial statements. Since stock-based compensation that is recognized in the statements of operations is to be determined based on the equity compensation awards that we expect will ultimately vest, that compensation expense has been reduced for estimated forfeitures of unvested options that typically occur due to terminations of employment of optionees and recognized on a straight-line basis over the requisite service period for the entire award. Forfeitures are required to be estimated at the time of grant and revised, if necessary, in subsequent periods if actual forfeitures differ from those estimates. For purposes of the determination of stock-based compensation expense for the year ended December 31, 2010, we estimated no forfeitures of options granted to members of the Board of Directors and forfeitures of 7.9% with respect to the remaining unvested options.
Comprehensive Income (Loss)
Accounting principles generally require that recognized revenue, expenses, gains and losses be included in net income. However, certain changes in assets and liabilities, such as unrealized gains and losses on securities available for sale, are reported as a separate component of the equity section of the balance sheet net of income taxes, and such items, along with net income, are components of comprehensive income (loss).
The components of other comprehensive income (loss) and related tax effects are as follows:
| (Dollars in thousands) |
Year Ended December 31, | |||||||||||
| 2010 | 2009 | 2008 | ||||||||||
| Unrealized holding (losses) gains arising during period from securities available for sale |
$ | (1,231 | ) | $ | (6,844 | ) | $ | (530 | ) | |||
| Reclassification adjustment for gains included in income |
1,530 | 2,308 | 2,346 | |||||||||
| Reclassification adjustment for other than temporary impairment |
(286 | ) | 1,478 | (1,603 | ) | |||||||
| Net unrealized holding (loss) gains |
13 | (3,058 | ) | 213 | ||||||||
| Net unrealized supplemental executive plan expense |
121 | 205 | 79 | |||||||||
| Tax effect |
(2,008 | ) | 1,174 | (118 | ) | |||||||
| Other comprehensive (loss) gain |
$ | (1,874 | ) | $ | (1,679 | ) | $ | 174 | ||||
79
Table of Contents
PACIFIC MERCANTILE BANCORP AND SUBSIDIARIES
NOTES TO CONSOLIDATED FINANCIAL STATEMENTS—(Continued)
The components of accumulated other comprehensive income (loss) included in stockholders’ equity are as follows:
| (Dollars in thousands) |
As of December 31, | |||||||
| 2010 | 2009 | |||||||
| Net unrealized holding loss on securities available for sale |
$ | (4,747 | ) | $ | (4,760 | ) | ||
| Net unrealized supplemental executive plan expense |
3 | (117 | ) | |||||
| Tax effect |
— | 2,007 | ||||||
| Accumulated other comprehensive loss |
$ | (4,744 | ) | $ | (2,870 | ) | ||
Recent Accounting Pronouncements
In January 2010, the FASB issued Accounting Standards Update 2010-06 (“ASU 2010-06”), an update of ASC 820-10, Fair Value Measurements and Disclosures, which now requires new disclosures that expand on activity included in the three fair value levels, as defined in ASC 820-10. ASU 2010-06 also provides amendments to ASC 820-10 in that a reporting entity should provide fair value measurement disclosures for each class of assets and liabilities, and provide disclosures about the valuation techniques and inputs used to measure fair value for both recurring and nonrecurring fair value measurements. Those disclosures are required for fair value measurements that fall in either Level 2 or Level 3. New disclosures and clarifications of existing disclosures are effective for interim and annual reporting periods beginning after December 15, 2009, except for certain Level 3 roll forward disclosures, which are effective for fiscal years beginning after December 15, 2010. We adopted the former disclosures and clarifications (those effective after December 15, 2009) as of January 1, 2010, and they did not have a material effect on our financial statements.
In July 2010, the FASB issued guidance that requires enhanced disclosures surrounding the credit characteristics of Company’s loan portfolio. Under the new guidance, the Company is required to disclose its accounting policies, the methods it uses to determine the components of the allowance for credit losses, and qualitative and quantitative information about the credit risk inherent in the loan portfolio, including additional information on certain types of loan modifications. For the Company, the new disclosures became effective for the 2010 annual report. For additional information, see Note 6. The adoption of this guidance only affects the Company’s disclosures of financing receivables and not its consolidated balance sheets or results of operations. In January 2011, the FASB issued guidance that deferred the effective date of certain disclosures in this guidance regarding troubled debt restructurings (“TDR”), pending resolution on the FASB’s project to amend the scope of TDR guidance.
3. Regulatory Actions
On August 31, 2010, the members of the respective Boards of Directors of the Company and the Bank entered into a Written Agreement (the “Agreement”) with the Federal Reserve Bank of San Francisco (the “FRB”). On the same date, the Bank consented to the issuance of a Final Order (the “Order”) by the California Department of Financial Institutions (the “DFI”). The principal purposes of the Agreement and Order, which constitute formal supervisory actions by the FRB and the DFI, are to require us to adopt and implement formal plans and take certain actions, as well as to continue to implement other measures that we previously adopted, to address the adverse consequences that the economic recession has had on the performance of our loan portfolio and our operating results, to improve our operating results and to increase our capital to strengthen our ability to weather any further adverse conditions that might arise if the hoped-for improvement in the economy does not materialize.
80
Table of Contents
PACIFIC MERCANTILE BANCORP AND SUBSIDIARIES
NOTES TO CONSOLIDATED FINANCIAL STATEMENTS—(Continued)
The Agreement and Order contain substantially similar provisions. They required the Boards of Directors of the Company and the Bank to prepare and submit written plans to the FRB and the DFI that address the following matters: (i) strengthening board oversight of the management operations of the Bank; (ii) strengthening credit risk management practices; (iii) improving credit administration policies and procedures; (iv) improving the Bank’s position with respect to problem assets; (v) maintaining adequate reserves for loan and lease losses in accordance with applicable supervisory guidelines; (vi) improving the capital position of the Bank and, in the case of the FRB Agreement, the capital position of the Company; (vii) improving the Bank’s earnings through the formulation, adoption and implementation of a strategic plan and a budget for fiscal 2011; and (viii) submitting a satisfactory funding contingency plan for the Bank that identifies available sources of liquidity and includes a plan for dealing with adverse economic and market conditions. The Bank is also prohibited from paying dividends to the Company without the prior approval of the DFI, and the Company may not declare or pay cash dividends, repurchase any of its shares, make payments on its trust preferred securities or incur or guarantee any debt, without the prior approval of the FRB.
Under the Agreement, the Company also must submit a capital plan to the FRB that will meet with its approval and then implement that plan. Under the Order, the Bank was required to achieve a ratio of adjusted tangible shareholders’ equity to its tangible assets to 9.0% by January 31, 2011, by raising additional capital, generating earnings or reducing the Bank’s tangible assets (subject to a 15% limitation on such a reduction) or a combination thereof and, upon achieving that ratio, to thereafter maintain that ratio during the Term of the Order.
We have taken steps to meet the requirements of the FRB Agreement and the DFI Order, including the submission of a capital plan to the FRB in March, 2011. In addition, we are actively exploring alternatives and are working to raise additional capital to meet the capital requirements of the DFI Order. However, despite those efforts, we were not able to raise a sufficient amount of additional capital to enable the Bank to achieve the required ratio of 9.0% by January 31, 2011. Nevertheless, in January, 2011 the DFI notified us that it will not take any action against the Bank at this time. We understand that this decision was based on the progress we have made since August 31, 2010 in increasing the capital ratio, which was 7.6% at January 31, 2011, and improvements that have been achieved in the Bank’s financial condition, including reductions in the Bank’s non-performing assets. Moreover, the Bank continues to be classified, under federal bank regulatory guidelines and federally established prompt corrective action regulations, as a “well-capitalized” banking institution.
However, we cannot predict when or even if we will succeed in meeting the capital requirements of the DFI Order in the near term and the DFI is not precluded from taking enforcement action against the Bank if its financial condition were to worsen or if the Bank failed to achieve further improvements in its capital ratio. Moreover, even if we succeed in raising additional capital, doing so may be dilutive of the share ownership of our existing shareholders. See “Risk Factors” in Item 1A of Part II of this Report below.
4. Interest-Bearing Deposits and Interest-Bearing Time Deposits with Financial Institutions
At December 31, 2010, the Company had $25.4 million in interest bearing deposits at other financial institutions, as compared to $127.8 million at December 31, 2009. The weighted average percentage yields on these deposits were 0.26% at December 31, 2010, and 0.25% at December 31, 2009. Interest bearing deposits with financial institutions can be withdrawn by the Company on demand and are considered cash equivalents for purposes of the consolidated statements of cash flows.
At December 31, 2010, we had $2.1 million of interest-bearing time deposits at other financial institutions, which are scheduled to mature within one year or have no stated maturity date. By comparison, as of December 31, 2009, time deposits at other financial institutions totaled $9.8 million. The weighted average percentage yields on these deposits were 0.69% and 0.62% at December 31, 2010 and 2009, respectively.
81
Table of Contents
PACIFIC MERCANTILE BANCORP AND SUBSIDIARIES
NOTES TO CONSOLIDATED FINANCIAL STATEMENTS—(Continued)
5. Securities Available For Sale
The following are summaries of the major components of securities available for sale and a comparison of amortized cost, estimated fair market values, and gross unrealized gains and losses at December 31, 2010 and 2009:
| December 31, 2010 | December 31, 2009 | |||||||||||||||||||||||||||||||
| Amortized Cost |
Gross Unrealized | Fair Value | Amortized Cost |
Gross Unrealized | Fair Value | |||||||||||||||||||||||||||
| Gain | Loss | Gain | Loss | |||||||||||||||||||||||||||||
| (Dollars in thousands) | ||||||||||||||||||||||||||||||||
| Securities Available for Sale |
||||||||||||||||||||||||||||||||
| U.S. Treasury securities |
$ | — | $ | — | $ | — | $ | — | $ | 18,040 | $ | 11 | $ | — | $ | 18,051 | ||||||||||||||||
| Mortgage backed securities issued by U.S. Agencies(1) |
166,421 | 24 | (2,009 | ) | 164,436 | 134,331 | 89 | (1,651 | ) | 132,769 | ||||||||||||||||||||||
| Total government and agencies securities |
166,421 | 24 | (2,009 | ) | 164,436 | 152,371 | 100 | (1,651 | ) | 150,820 | ||||||||||||||||||||||
| Municipal securities |
6,389 | — | (417 | ) | 5,972 | 10,545 | 13 | (431 | ) | 10,127 | ||||||||||||||||||||||
| Collateralized mortgage obligations issued by non agency(1) |
3,500 | 21 | (244 | ) | 3,277 | 7,094 | 10 | (1,069 | ) | 6,035 | ||||||||||||||||||||||
| Asset backed securities(2) |
2,493 | — | (2,122 | ) | 371 | 2,704 | — | (1,732 | ) | 972 | ||||||||||||||||||||||
| Mutual funds(3) |
4,245 | — | — | 4,245 | 2,260 | — | — | 2,260 | ||||||||||||||||||||||||
| Total Securities Available for Sale |
$ | 183,048 | $ | 45 | $ | (4,792 | ) | $ | 178,301 | $ | 174,974 | $ | 123 | $ | (4,883 | ) | $ | 170,214 | ||||||||||||||
| (1) | Secured by closed-end first lien 1-4 family residential mortgages. |
| (2) | Comprised of a security that represents an interest in a pool of trust preferred securities issued by U.S.-based banks and insurance companies |
| (3) | Consists primarily of mutual fund investments in closed-end first lien 1-4 family residential mortgages. |
At December 31, 2010 and 2009, U.S. agencies/mortgage backed securities and collateralized mortgage obligations with an aggregate fair market value of $13 million and $87 million, respectively, were pledged to secure Federal Home Loan Bank borrowings, repurchase agreements, local agency deposits and Treasury, tax and loan accounts.
The amortized cost and estimated fair values of securities available for sale at December 31, 2010 and December 31, 2009, are shown in the table below by contractual maturities and historical prepayments based on the prior twelve months of principal payments. Expected maturities will differ from contractual maturities and historical prepayments, particularly with respect to collateralized mortgage obligations, primarily because prepayment rates are affected by changes in conditions in the interest rate market and, therefore, future prepayment rates may differ from historical prepayment rates.
| At December 31, 2010 Maturing in | ||||||||||||||||||||
| (Dollars in thousands) |
One year or less |
Over one year through five years |
Over five years through ten years |
Over ten Years |
Total | |||||||||||||||
| Securities available for sale, amortized cost |
$ | 11,892 | $ | 33,652 | $ | 29,542 | $ | 107,962 | $ | 183,048 | ||||||||||
| Securities available for sale, estimated fair value |
11,813 | 33,334 | 28,939 | 104,215 | 178,301 | |||||||||||||||
| Weighted average yield |
2.31 | % | 2.69 | % | 2.86 | % | 2.79 | % | 2.75 | % | ||||||||||
| At December 31, 2009 Maturing in | ||||||||||||||||||||
| (Dollars in thousands) |
One year or less |
Over one year through five years |
Over five years through ten years |
Over ten Years |
Total | |||||||||||||||
| Securities available for sale, amortized cost |
$ | 29,819 | $ | 40,075 | $ | 36,000 | $ | 69,080 | $ | 174,974 | ||||||||||
| Securities available for sale, estimated fair value |
29,497 | 38,696 | 35,505 | 66,516 | 170,214 | |||||||||||||||
| Weighted average yield |
1.63 | % | 3.58 | % | 3.58 | % | 3.49 | % | 3.21 | % | ||||||||||
82
Table of Contents
PACIFIC MERCANTILE BANCORP AND SUBSIDIARIES
NOTES TO CONSOLIDATED FINANCIAL STATEMENTS—(Continued)
The Company recognized net gains on sales of securities available for sale of $1.5 million on sale proceeds of $243 million during the year ended December 31, 2010 and $2.3 million, net of $1.6 million of taxes, on sale proceeds of $210 million, during the year ended December 31, 2009.
The table below shows, as of December 31, 2010, the gross unrealized losses and fair values of our investments, in thousands of dollars, aggregated by investment category and length of time that the individual securities have been in a continuous unrealized loss position.
| Securities with Unrealized Loss at December 31, 2010 | ||||||||||||||||||||||||
| Less than 12 months | 12 months or more | Total | ||||||||||||||||||||||
| Fair Value | Unrealized Loss |
Fair Value | Unrealized Loss |
Fair Value | Unrealized Loss |
|||||||||||||||||||
| Mortgage backed securities issued by U.S. Agencies |
$ | 154,856 | $ | (2,007 | ) | $ | 482 | $ | (2 | ) | $ | 155,338 | $ | (2,009 | ) | |||||||||
| Municipal securities |
5,552 | (367 | ) | 420 | (50 | ) | 5,972 | (417 | ) | |||||||||||||||
| Non-agency collateralized mortgage obligations |
— | — | 2,283 | (244 | ) | 2,283 | (244 | ) | ||||||||||||||||
| Asset backed securities |
— | — | 372 | (2,122 | ) | 372 | (2,122 | ) | ||||||||||||||||
| Total temporarily impaired securities |
$ | 160,408 | $ | (2,374 | ) | $ | 3,557 | $ | (2,418 | ) | $ | 163,965 | $ | (4,792 | ) | |||||||||
We regularly monitor investments for significant declines in fair value. We have determined that declines in the fair values of these investments below their respective amortized costs, as set forth in the table above, are temporary because (i) those declines were due to interest rate changes and not to a deterioration in the creditworthiness of the issuers of those investment securities, and (ii) we have the ability to hold those securities until there is a recovery in their values or until their maturity.
The table below shows, as of December 31, 2009, the gross unrealized losses and fair values of our investments, in thousands of dollars aggregated by investment category and length of time that the individual securities have been in a continuous unrealized loss position.
| (Dollars In thousands) |
Securities With Unrealized Loss as of December 31, 2009 | |||||||||||||||||||||||
| Less than 12 months | 12 months or more | Total | ||||||||||||||||||||||
| Fair Value | Unrealized Loss |
Fair Value | Unrealized Loss |
Fair Value | Unrealized Loss |
|||||||||||||||||||
| Mortgage backed securities issued by U.S. Agencies |
$ | 118,720 | $ | (1,609 | ) | $ | 2,792 | $ | (42 | ) | $ | 121,512 | $ | (1,651 | ) | |||||||||
| Municipal securities |
4,938 | (107 | ) | 3,940 | (324 | ) | 8,878 | (431 | ) | |||||||||||||||
| Non-agency collateralized mortgage obligations |
— | — | 3,487 | (1,069 | ) | 3,487 | (1,069 | ) | ||||||||||||||||
| Asset-backed securities |
— | — | 972 | (1,732 | ) | 972 | (1,732 | ) | ||||||||||||||||
| Total temporarily impaired securities |
$ | 123,658 | $ | (1,716 | ) | $ | 11,191 | $ | (3,167 | ) | $ | 134,849 | $ | (4,883 | ) | |||||||||
Impairment exists when the fair value of the security declines below it amortized cost. We perform a quarterly assessment of the securities that have an unrealized loss to determine whether the decline in fair value is other-than-temporary.
Effective April 1, 2009 we adopted ASC 320-10 and, as a result, we recognize other-than-temporary impairments (“OTTI”) for our available-for-sale debt securities in accordance with ASC 320-10. Therefore, when there are credit losses associated with an impaired debt security, but we have no intention to sell, and it is more likely than not that we will not have to sell, the security before recovery of its cost basis, we will separate the amount of impairment between the amount that is credit related and the amount that is related to non-credit factors. Credit-related impairments are recognized in net gain on the sale of securities in our consolidated statements of operations. Any non-credit-related impairments are recognized and reflected in other comprehensive income (loss).
Through the impairment assessment process, we determined that the available-for-sale securities discussed below were other-than-temporarily impaired at December 31, 2010. We recorded in our consolidated statements of operations for the year ended December 31, 2010 impairment credit losses of $286,000 on available-for-sale securities. The OTTI related to factors other than credit losses, in the aggregate amount of $2.2 million, was recognized as other comprehensive loss in our balance sheet.
83
Table of Contents
PACIFIC MERCANTILE BANCORP AND SUBSIDIARIES
NOTES TO CONSOLIDATED FINANCIAL STATEMENTS—(Continued)
Certain of the other-than-temporary impairments (“OTTI”) amounts were related to credit losses and recognized as a charge to income in our statement of operations, with the remainder recognized in other comprehensive loss. The table below presents a roll-forward of OTTI where a portion attributable to non-credit related factors was recognized in other comprehensive loss for the year ended December 31, 2010:
| Gross
Other- Than- Temporary Impairments |
Other-Than- Temporary Impairments Included in Other Comprehensive Loss |
Net
Other-Than- Temporary Impairments Included in Retained Earnings |
||||||||||
| (Dollars in thousands) | ||||||||||||
| Balance – December 31, 2008 |
$ | (1,603 | ) | $ | — | $ | (1,603 | ) | ||||
| Adoption of ASC 321-10 |
450 | (1,079 | ) | 1,529 | ||||||||
| Additions for credit losses on securities for which an OTTI was not previously recognized |
(1,418 | ) | (1,293 | ) | (125 | ) | ||||||
| Balance – December 31, 2009 |
(2,571 | ) | (2,372 | ) | (199 | ) | ||||||
| Changes for credit losses on securities for which an OTTI was not previously recognized |
(95 | ) | 191 | (286 | ) | |||||||
| Balance – December 31, 2010 |
$ | (2,666 | ) | $ | (2,181 | ) | $ | (485 | ) | |||
In determining the component of OTTI related to credit losses, we compare the amortized cost basis of each OTTI security to the present value of its expected cash flows, discounted using the effective interest rate implicit in the security at the date of acquisition.
As a part of our OTTI assessment process with respect to securities held for sale with unrealized losses, we consider available information about (i) the performance of the collateral underlying each such security, including credit enhancements, (ii) historical prepayment speeds, (iii) delinquency and default rates, (iv) loss severities, (v) the age or “vintage” of the security, and, (vi) rating agency reports on the security. Significant judgments are required with respect to these and other factors in order to make a determination of the future cash flows that can be expected to be generated by the security.
Based on our OTTI assessment process, we determined that there were two different investment securities in our portfolio of securities held for sale that had become or were impaired as of December 31, 2010: An asset backed security and a non-agency collateralized mortgage obligation (“CMO”).
Asset-Backed Securities. At December 31, 2010, we had one asset backed security in our portfolio of investment securities available for sale. This security is a multi-class, cash flow collateralized bond obligation backed by a pool of trust preferred securities issued by a diversified pool of 56 issuers consisting of 45 U.S. depository institutions and 11 insurance companies at the time of the security’s issuance in November 2007. This security was part of a $363 million issuance. The security that we own (CUSIP 74042CAE8) is the mezzanine class B piece security with a variable interest rate of 3 month LIBOR +60 basis points and had a rating of Aa2/AA by Moody’s and Fitch at the time of issuance. We purchased $3.0 million face value of this security in November 2007 at a price of 95.21% for a total purchase price of $2,856,420.
As of December 31, 2010 the face value of this security was $2.5 million with a fair value of $371,000 for an approximate unrealized loss of $2.1 million. Currently, the security has a Ca rating from Moody’s and CC rating from Fitch and has experienced $42.5 million in defaults (12% of total current collateral) and $31.5 million in payment deferrals (9% of total current collateral) from issuance to December 31, 2010. The security did not pay its scheduled fourth quarter interest payment. The Company is not currently accruing interest on this security. The Company estimates that the security could experience another $75 million in defaults before it would not receive all of its contractual cash flows. This analysis is based on the following assumptions: future default rates of 2.2%, prepayment rates of 1% until maturity, and 15% recovery of future defaults. We have recognized impairment losses in earnings of $199,000, $24,000, and $1.6 million for the years ended December 31, 2010, December 31, 2009, and December 31, 2008.
Non Agency CMO. Through our impairment analysis, we identified one non-agency collateralized mortgage obligation security (a “CMO”) with respect to which we recognized OTTI at December 31, 2010. This CMO is a “Super Senior Support” bond, which was originated in 2005, was then rated AAA by Standard & Poor’s and Aa1 by Moody’s, and had a credit support of 2.5% of the total balance at issuance. As of December 31, 2010, the security was rated BBB and Caa3 by Standard and Poor’s and Moody’s, respectively, and was determined to have a fair value of $871,000, as compared to an amortized cost of $931,000, resulting in an unrealized loss of approximately $60,000. The CMO is collateralized by a pool of one-to-four family, fully amortizing residential first mortgage loans that bear interest at a fixed rate for approximately five years, after which they bear interest at variable rates with annual resets.
84
Table of Contents
PACIFIC MERCANTILE BANCORP AND SUBSIDIARIES
NOTES TO CONSOLIDATED FINANCIAL STATEMENTS—(Continued)
At December, 31, 2010, credit support underlying this CMO was approximately 5.6% and delinquencies that were 60 days or over totaled approximately 5.8%. Factors considered in determining that this security was impaired included the changes in the ratings of the security, the current level of subordination from other CMO classes, anticipated prepayment rates, cumulative default rates and the loss severity given a default. Based on our impairment assessment and analysis, we recorded an $87,000 impairment charge in our statement of operations in 2010 in respect of this security, because we concluded that the impairment was attributable to credit factors. The remaining unrealized loss on this security, of $60,000, was recognized as an other comprehensive loss on our balance sheet, because we concluded that this loss was attributable to non-credit factors, such as external market conditions, the limited liquidity of the security and risks of potential additional declines in the housing market.
| Impairment Losses on OTTI Securities |
For the Year Ended December 31, |
|||||||||||
| 2010 | 2009 | 2008 | ||||||||||
| Impairment Losses on OTTI Securities |
||||||||||||
| Asset Backed Security |
$ | (199 | ) | $ | (24 | ) | $ | (1,603 | ) | |||
| Non Agency CMO |
(87 | ) | (101 | ) | — | |||||||
| $ | (286 | ) | $ | (125 | ) | $ | (1,603 | ) | ||||
We have made a determination that the remainder of our securities with respect to which there were unrealized losses as of December 31, 2010 are not other-than-temporarily impaired, because we have concluded that we have the ability to continue to hold those securities until their respective fair market values increase above their respective amortized costs or, if necessary, until their respective maturities. In reaching that conclusion we considered a number of factors and other information, which included: (i) the significance of each such security, (ii) the amount of the unrealized losses attributable to each such security, (iii) our liquidity position, (iv) the impact that retention of those securities could have on our capital position and (v) our evaluation of the expected future performance of these securities (based on the criteria discussed above).
6. Loans and Allowance for Loan Losses
The loan portfolio consisted of the following at:
| December 31, 2010 | December 31, 2009 | |||||||||||||||
| Amount | Percent | Amount | Percent | |||||||||||||
| (Dollars in thousands) | ||||||||||||||||
| Commercial loans |
$ | 218,690 | 29.5 | % | $ | 290,406 | 34.8 | % | ||||||||
| Commercial real estate loans – owner occupied |
178,085 | 24.0 | % | 179,682 | 21.5 | % | ||||||||||
| Commercial real estate loans – all other |
136,505 | 18.4 | % | 135,152 | 16.2 | % | ||||||||||
| Residential mortgage loans – multi-family |
84,553 | 11.4 | % | 101,961 | 12.2 | % | ||||||||||
| Residential mortgage loans – single family |
72,442 | 9.8 | % | 67,023 | 8.0 | % | ||||||||||
| Construction loans |
3,048 | 0.5 | % | 20,443 | 2.6 | % | ||||||||||
| Land development loans |
29,667 | 4.0 | % | 30,042 | 3.6 | % | ||||||||||
| Consumer loans |
18,017 | 2.4 | % | 9,370 | 1.1 | % | ||||||||||
| Gross loans |
741,007 | 100.0 | % | 834,079 | 100.0 | % | ||||||||||
| Deferred fee (income) costs, net |
(696 | ) | (540 | ) | ||||||||||||
| Allowance for loan losses |
(18,101 | ) | (20,345 | ) | ||||||||||||
| Loans, net |
$ | 722,210 | $ | 813,194 | ||||||||||||
At December 31, 2010 and 2009, real estate loans of approximately $211 million and $192 million, respectively, were pledged to secure borrowings obtained from the Federal Home Loan Bank.
85
Table of Contents
PACIFIC MERCANTILE BANCORP AND SUBSIDIARIES
NOTES TO CONSOLIDATED FINANCIAL STATEMENTS—(Continued)
Allowance for Loan Losses
The allowance for loan losses is management’s estimate of credit losses inherent in the loan portfolio at the balance sheet date. We employ economic models that are based on bank regulatory guidelines, industry standards and our own historical loan loss experience, as well as a number of more subjective qualitative factors, to determine both the sufficiency of the allowance for loan losses and the amount of the provisions that are required to be made for potential loan losses.
The allowance for loan losses is first determined by assigning reserve ratios for all loans. All non-accrual loans and other loans classified as “special mention,” “substandard” or “doubtful” (“classified loans” or “classification categories”) are then assigned certain allocations according to type of loans, with greater reserve ratios or percentages applied to loans deemed to be of a higher risk. These ratios are determined based on prior loss history and industry guidelines and loss factors, by type of loan, adjusted for current economic and other qualitative factors.
On a quarterly basis, we utilize a classification migration model and individual loan review analysis tools as starting points for determining the adequacy of the allowance for loan losses. Our loss migration analysis tracks a certain number of quarters of loan loss history and industry loss factors to determine historical losses by classification category for each loan type, except certain loans (automobile, mortgage and credit cards), which are analyzed as homogeneous loan pools. These calculated loss factors are then applied to outstanding loan balances. We also conduct individual loan review analysis, as part of the allowance for loan losses allocation process, applying specific monitoring policies and procedures in analyzing the existing loan portfolios.
Set forth below is a summary of the Company’s activity in the allowance for loan losses during the years ended:
| December 31, | ||||||||||||
| 2010 | 2009 | 2008 | ||||||||||
| (Dollars in thousands) | ||||||||||||
| Balance, beginning of year |
$ | 20,345 | $ | 15,453 | $ | 6,126 | ||||||
| Provision for loan losses |
8,288 | 23,673 | 21,685 | |||||||||
| Recoveries on loans previously charged off |
3,033 | 357 | 80 | |||||||||
| Charged off loans |
(13,565 | ) | (19,138 | ) | (12,438 | ) | ||||||
| Balance, end of year |
$ | 18,101 | $ | 20,345 | $ | 15,453 | ||||||
86
Table of Contents
PACIFIC MERCANTILE BANCORP AND SUBSIDIARIES
NOTES TO CONSOLIDATED FINANCIAL STATEMENTS—(Continued)
Set forth below is information regarding loan balances and the related allowance for loan losses, by portfolio type, for the years ended December 31, 2010 and 2009.
| Commercial | Real Estate | Construction and Land Development |
Consumer and Single Family Mortgages |
Total | ||||||||||||||||
| (Dollars in thousands) | ||||||||||||||||||||
| 2010 |
||||||||||||||||||||
| Allowance for loan losses: | ||||||||||||||||||||
| Balance at beginning of year |
$ | 11,119 | $ | 5,968 | $ | 2,179 | $ | 1,079 | $ | 20,345 | ||||||||||
| Charge offs |
(11,473 | ) | (660 | ) | (649 | ) | (783 | ) | (13,565 | ) | ||||||||||
| Recoveries |
2,327 | 345 | 4 | 357 | 3,033 | |||||||||||||||
| Provision |
8,044 | 698 | (704 | ) | 250 | 8,288 | ||||||||||||||
| Balance at end of year |
$ | 10,017 | $ | 6,351 | $ | 830 | $ | 903 | $ | 18,101 | ||||||||||
| Allowance balance at end of year related to: |
||||||||||||||||||||
| Loans individually evaluated for impairment |
$ | 141 | $ | 3,155 | $ | — | $ | 128 | $ | 3,424 | ||||||||||
| Loans collectively evaluated for impairment |
$ | 9,876 | $ | 3,196 | $ | 830 | $ | 775 | $ | 14,677 | ||||||||||
| Loans balance at end of year: |
||||||||||||||||||||
| Loans individually evaluated for impairment |
$ | 2,036 | $ | 24,318 | $ | 2,624 | $ | 2,473 | $ | 31,451 | ||||||||||
| Loans collectively evaluated for impairment |
216,654 | 374,825 | 30,091 | 87,986 | 709,556 | |||||||||||||||
| Ending Balance |
$ | 218,690 | $ | 399,143 | $ | 32,715 | $ | 90,459 | $ | 741,007 | ||||||||||
| 2009 |
||||||||||||||||||||
| Allowance for loan losses: |
||||||||||||||||||||
| Balance at beginning of year |
$ | 7,534 | $ | 4,368 | $ | 2,586 | $ | 965 | $ | 15,453 | ||||||||||
| Charge offs |
(15,153 | ) | (81 | ) | (2,687 | ) | (1,217 | ) | (19,138 | ) | ||||||||||
| Recoveries |
129 | — | 197 | 31 | 357 | |||||||||||||||
| Provision |
18,609 | 1,681 | 2,083 | 1,300 | 23,673 | |||||||||||||||
| Balance at end of year |
$ | 11,119 | $ | 5,968 | $ | 2,179 | $ | 1,079 | $ | 20,345 | ||||||||||
| Allowance balance at end of year related to: |
||||||||||||||||||||
| Loans individually evaluated for impairment |
$ | 2,069 | $ | 1,965 | $ | 477 | $ | 268 | $ | 4,779 | ||||||||||
| Loans collectively evaluated for impairment |
$ | 9,050 | $ | 4,003 | $ | 1,702 | $ | 811 | $ | 15,566 | ||||||||||
| Loans balance at end of year: |
||||||||||||||||||||
| Loans individually evaluated for impairment |
$ | 20,910 | $ | 20,779 | $ | 13,830 | $ | 1,870 | $ | 57,389 | ||||||||||
| Loans collectively evaluated for impairment |
269,496 | 396,016 | 36,655 | 74,523 | 776,690 | |||||||||||||||
| Ending Balance |
$ | 290,406 | $ | 416,795 | $ | 50,485 | $ | 76,393 | $ | 834,079 | ||||||||||
87
Table of Contents
PACIFIC MERCANTILE BANCORP AND SUBSIDIARIES
NOTES TO CONSOLIDATED FINANCIAL STATEMENTS—(Continued)
Credit Quality
The quality of the loans in the Company’s loan portfolio is assessed as a function of net credit losses, levels of nonperforming assets and delinquencies, as defined by the Company. These factors are an important part of the Company’s overall credit risk management process and its evaluation of the adequacy of the allowance for loan losses.
The following table provides a summary of the delinquency status of the Bank’s loans by portfolio type:
| 30-59 Days Past Due |
60-89 Days Past Due |
90 Days
and Greater |
Total Past Due |
Current | Total Loans Outstanding |
Loans >90 Days and Accruing |
||||||||||||||||||||||
| (Dollars in thousands) | ||||||||||||||||||||||||||||
| 2010 |
||||||||||||||||||||||||||||
| Commercial loans |
$ | 782 | $ | 624 | $ | 1,784 | $ | 3,190 | $ | 215,500 | $ | 218,690 | $ | 250 | ||||||||||||||
| Commercial real estate loans – owner-occupied |
— | — | — | — | 178,085 | 178,085 | — | |||||||||||||||||||||
| Commercial real estate loans – all other |
9,958 | 239 | 1,111 | 11,308 | 125,197 | 136,505 | — | |||||||||||||||||||||
| Residential mortgage loans – multi-family |
— | — | — | — | 84,553 | 84,553 | — | |||||||||||||||||||||
| Residential mortgage loans – single family |
432 | — | 636 | 1,068 | 71,374 | 72,442 | — | |||||||||||||||||||||
| Construction loans |
— | — | 2,185 | 2,185 | 863 | 3,048 | — | |||||||||||||||||||||
| Land development loans |
— | — | — | — | 29,667 | 29,667 | — | |||||||||||||||||||||
| Consumer loans |
— | — | 129 | 129 | 17,888 | 18,017 | — | |||||||||||||||||||||
| Total |
$ | 11,172 | $ | 863 | $ | 5,845 | $ | 17,880 | $ | 723,127 | $ | 741,007 | $ | 250 | ||||||||||||||
| 2009 |
||||||||||||||||||||||||||||
| Commercial loans |
$ | 398 | $ | 729 | $ | 13,158 | $ | 14,285 | $ | 276,121 | $ | 290,406 | $ | 26 | ||||||||||||||
| Commercial real estate loans – owner occupied |
— | — | 9,059 | 9,059 | 170,623 | 179,682 | — | |||||||||||||||||||||
| Commercial real estate loans – all other |
— | 726 | 1,491 | 2,217 | 132,935 | 135,152 | 353 | |||||||||||||||||||||
| Residential mortgage loans – multi-family |
— | 92 | 767 | 859 | 101,102 | 101,961 | — | |||||||||||||||||||||
| Residential mortgage loans – single family |
— | — | 5,373 | 5,373 | 61,650 | 67,023 | — | |||||||||||||||||||||
| Construction loans |
— | — | — | — | 20,443 | 20,443 | — | |||||||||||||||||||||
| Land development loans |
— | — | — | — | 30,042 | 30,042 | — | |||||||||||||||||||||
| Consumer loans |
— | — | — | — | 9,370 | 9,370 | — | |||||||||||||||||||||
| Total |
$ | 398 | $ | 1,547 | $ | 29,848 | $ | 31,793 | $ | 802,286 | $ | 834,079 | $ | 379 | ||||||||||||||
88
Table of Contents
PACIFIC MERCANTILE BANCORP AND SUBSIDIARIES
NOTES TO CONSOLIDATED FINANCIAL STATEMENTS—(Continued)
Generally, the accrual of interest on a loan is discontinued when principal or interest payments become more than 90 days past due, unless management believes the loan is adequately collateralized and it is in the process of collection. However, in certain instances, when a loan is placed on non-accrual status, previously accrued but unpaid interest is reversed against current income. Subsequent collections of cash are applied as principal reductions when received, except when the ultimate collectability of principal is probable, in which case interest payments are credited to income. Non-accrual loans may be restored to accrual status when principal and interest become current and full repayment is expected. The following table provides information as of December 31, 2010 and 2009, with respect to loans on nonaccrual status, by portfolio type:
| December 31, | ||||||||
| 2010 | 2009 | |||||||
| (Dollars in thousands) | ||||||||
| Nonaccrual loans: |
||||||||
| Commercial loans |
$ | 1,800 | $ | 17,150 | ||||
| Commercial real estate loans – owner occupied |
297 | 9,059 | ||||||
| Commercial real estate loans – all other |
15,808 | 11,720 | ||||||
| Residential mortgage loans – multi family |
— | — | ||||||
| Residential mortgage loans – single family |
1,832 | 1,358 | ||||||
| Construction loans |
2,185 | — | ||||||
| Land development loans |
— | 10,162 | ||||||
| Consumer loans |
129 | — | ||||||
| Total |
$ | 22,051 | $ | 49,449 | ||||
89
Table of Contents
PACIFIC MERCANTILE BANCORP AND SUBSIDIARIES
NOTES TO CONSOLIDATED FINANCIAL STATEMENTS—(Continued)
The Company classifies its loan portfolios using internal credit quality ratings, as discussed above under Allowance for Loan Losses. The following table provides a summary of loans by portfolio type and the Company’s internal credit quality ratings as of December 31, 2010 and 2009.
| December 31, | ||||||||||||
| 2010 | 2009 | Increase (Decrease) |
||||||||||
| (Dollars in thousands) | ||||||||||||
| Pass: |
||||||||||||
| Commercial loans |
$ | 187,054 | $ | 222,278 | $ | (35,224 | ) | |||||
| Commercial real estate loans – owner occupied |
162,330 | 166,493 | (4,163 | ) | ||||||||
| Commercial real estate loans – all other |
112,093 | 109,337 | 2,756 | |||||||||
| Residential mortgage loans – multi family |
81,482 | 88,849 | (7,367 | ) | ||||||||
| Residential mortgage loans – single family |
70,171 | 64,103 | 6,068 | |||||||||
| Construction loans |
863 | 3,708 | (2,845 | ) | ||||||||
| Land development loans |
24,028 | 21,647 | 2,381 | |||||||||
| Consumer loans |
17,847 | 8,958 | 8,889 | |||||||||
| Total pass loans |
$ | 655,868 | $ | 685,373 | $ | (29,505 | ) | |||||
| Special Mention: |
||||||||||||
| Commercial loans |
$ | 9,748 | $ | 16,744 | $ | (6,996 | ) | |||||
| Commercial real estate loans – owner occupied |
456 | 4,130 | (3,674 | ) | ||||||||
| Commercial real estate loans – all other |
— | 11,774 | (11,774 | ) | ||||||||
| Residential mortgage loans – multi family |
1,974 | 13,112 | (11,138 | ) | ||||||||
| Residential mortgage loans – single family |
— | 1,212 | (1,212 | ) | ||||||||
| Construction loans |
— | 5,006 | (5,006 | ) | ||||||||
| Land development loans |
5,639 | 4,792 | 847 | |||||||||
| Consumer loans |
41 | 125 | (84 | ) | ||||||||
| Total special mention loans |
$ | 17,858 | $ | 56,895 | $ | (39,037 | ) | |||||
| Substandard: |
||||||||||||
| Commercial loans |
$ | 21,887 | $ | 38,964 | $ | (17,077 | ) | |||||
| Commercial real estate loans – owner occupied |
15,299 | 9,059 | 6,240 | |||||||||
| Commercial real estate loans – all other |
24,412 | 14,041 | 10,371 | |||||||||
| Residential mortgage loans – multi family |
1,097 | — | 1,097 | |||||||||
| Residential mortgage loans – single family |
2,271 | 1,708 | 563 | |||||||||
| Construction loans |
2,185 | 10,395 | (8,210 | ) | ||||||||
| Land development loans |
— | 3,603 | (3,603 | ) | ||||||||
| Consumer loans |
— | 49 | (49 | ) | ||||||||
| Total substandard loans |
$ | 67,151 | $ | 77,819 | $ | (10,668 | ) | |||||
| Doubtful: |
||||||||||||
| Commercial loans |
$ | 1 | $ | 12,420 | $ | (12,419 | ) | |||||
| Commercial real estate loans – owner occupied |
— | — | — | |||||||||
| Commercial real estate loans – all other |
— | — | — | |||||||||
| Residential mortgage loans – multi family |
— | — | — | |||||||||
| Residential mortgage loans – single family |
— | — | — | |||||||||
| Construction loans |
— | 1,334 | (1,334 | ) | ||||||||
| Land development loans |
— | — | — | |||||||||
| Consumer loans |
129 | 238 | (109 | ) | ||||||||
| Total doubtful loans |
$ | 130 | $ | 13,992 | $ | (13,862 | ) | |||||
| Total Outstanding Loans, gross: |
$ | 741,007 | $ | 834,079 | $ | (93,072 | ) | |||||
90
Table of Contents
PACIFIC MERCANTILE BANCORP AND SUBSIDIARIES
NOTES TO CONSOLIDATED FINANCIAL STATEMENTS—(Continued)
Impaired Loans
A loan is generally classified as impaired and placed on nonaccrual status when, in management’s opinion, the principal or interest will not be collectible in accordance with the contractual terms of the loan agreement. The Company measures and reserves for impairment on a loan-by-loan basis, using either the present value of expected future cash flows discounted at the loan’s effective interest rate, or the fair value of the collateral if the loan is collateral dependent.
The following table sets forth information regarding nonaccrual loans and restructured loans, at December 31, 2010 and December 31, 2009:
| December 31, | ||||||||
| 2010 | 2009 | |||||||
| (Dollars in thousands) | ||||||||
| Impaired loans: |
||||||||
| Nonaccruing loans |
$ | 6,743 | $ | 28,092 | ||||
| Nonaccruing restructured loans |
15,308 | 21,357 | ||||||
| Accruing restructured loans |
1,187 | 1,243 | ||||||
| Accruing impaired loans |
8,213 | 6,697 | ||||||
| Total impaired loans |
$ | 31,451 | $ | 57,389 | ||||
| Impaired loans less than 90 days delinquent and included in total impaired loans |
$ | 25,856 | $ | 27,408 | ||||
91
Table of Contents
PACIFIC MERCANTILE BANCORP AND SUBSIDIARIES
NOTES TO CONSOLIDATED FINANCIAL STATEMENTS—(Continued)
The table below contains additional information with respect to impaired loans, by portfolio type, for the years ended December 31, 2010 and 2009:
| Recorded Investment |
Unpaid Principal Balance |
Related Allowance (a) |
Average Recorded Investment |
Interest Income Recognized |
||||||||||||||||
| (Dollars in thousands) | ||||||||||||||||||||
| 2010 With no related allowance recorded: |
||||||||||||||||||||
| Commercial loans |
$ | 1,752 | $ | 3,125 | $ | — | $ | 4,202 | $ | 18 | ||||||||||
| Commercial real estate loans – owner occupied |
297 | 960 | — | 1,948 | — | |||||||||||||||
| Commercial real estate loans – all other |
1,349 | 1,382 | — | 3,630 | — | |||||||||||||||
| Residential mortgage loans – multi-family |
— | — | — | 1,525 | — | |||||||||||||||
| Residential mortgage loans – single family |
1,887 | 2,134 | — | 1,477 | 14 | |||||||||||||||
| Construction loans |
2,185 | 2,215 | — | 2,992 | — | |||||||||||||||
| Land development loans |
439 | 439 | — | 3,782 | — | |||||||||||||||
| Consumer loans |
129 | 238 | — | 123 | 26 | |||||||||||||||
| 2010 With an allowance recorded: |
||||||||||||||||||||
| Commercial loans |
$ | 284 | $ | 787 | $ | 141 | $ | 4,921 | $ | — | ||||||||||
| Commercial real estate loans – owner occupied |
— | — | — | 1,150 | — | |||||||||||||||
| Commercial real estate loans – all other |
22,672 | 23,978 | 3,155 | 13,664 | — | |||||||||||||||
| Residential mortgage loans – multi-family |
— | — | — | — | — | |||||||||||||||
| Residential mortgage loans – single family |
457 | 461 | 128 | 537 | — | |||||||||||||||
| Construction loans |
— | — | — | 1,185 | — | |||||||||||||||
| Land development loans |
— | — | — | 1,071 | — | |||||||||||||||
| Consumer loans |
— | — | — | 59 | — | |||||||||||||||
| Total: |
||||||||||||||||||||
| Commercial loans |
$ | 2,036 | $ | 3,912 | $ | 141 | $ | 9,123 | $ | 18 | ||||||||||
| Commercial real estate loans – owner occupied |
297 | 960 | — | 3,098 | — | |||||||||||||||
| Commercial real estate loans – all other |
24,021 | 25,360 | 3,155 | 17,294 | — | |||||||||||||||
| Residential mortgage loans – multi-family |
— | — | — | 1,525 | — | |||||||||||||||
| Residential mortgage loans – single family |
2,344 | 2,595 | 128 | 2,014 | 14 | |||||||||||||||
| Construction loans |
2,185 | 2,215 | — | 4,177 | — | |||||||||||||||
| Land development loans |
439 | 439 | — | 4,853 | — | |||||||||||||||
| Consumer loans |
129 | 238 | — | 182 | 26 | |||||||||||||||
| 2009 With no related allowance recorded: |
||||||||||||||||||||
| Commercial loans |
$ | 14,726 | $ | 22,007 | $ | — | $ | 10,702 | $ | 204 | ||||||||||
| Commercial real estate loans – owner occupied |
5,559 | 5,583 | — | 5,730 | — | |||||||||||||||
| Commercial real estate loans – all other |
1,139 | 1,138 | — | 3,467 | — | |||||||||||||||
| Residential mortgage loans – multi-family |
— | — | — | 568 | — | |||||||||||||||
| Residential mortgage loans – single family |
512 | 512 | — | 451 | 21 | |||||||||||||||
| Construction loans |
3,549 | 4,228 | — | 7,251 | — | |||||||||||||||
| Land development loans |
3,668 | 3,667 | — | 1,216 | 177 | |||||||||||||||
| Consumer loans |
— | 248 | — | — | — | |||||||||||||||
| 2009 With an allowance recorded: |
||||||||||||||||||||
| Commercial loans |
$ | 6,184 | $ | 6,891 | $ | 2,069 | $ | 9,102 | $ | 46 | ||||||||||
| Commercial real estate loans – owner occupied |
3,500 | 3,500 | 131 | 875 | — | |||||||||||||||
| Commercial real estate loans – all other |
10,581 | 11,013 | 1,834 | 6,062 | — | |||||||||||||||
| Residential mortgage loans – multi-family |
— | — | — | — | — | |||||||||||||||
| Residential mortgage loans – single family |
1,358 | 1,377 | 268 | 797 | — | |||||||||||||||
| Construction loans |
6,613 | 7,956 | 477 | 5,102 | — | |||||||||||||||
| Land development loans |
— | — | — | 976 | — | |||||||||||||||
| Consumer loans |
— | — | — | 10 | — | |||||||||||||||
| Total: |
||||||||||||||||||||
| Commercial loans |
$ | 20,910 | $ | 28,898 | $ | 2,069 | $ | 19,804 | $ | 250 | ||||||||||
| Commercial real estate loans – owner occupied |
9,059 | 9,083 | 131 | 6,605 | — | |||||||||||||||
| Commercial real estate loans – all other |
11,720 | 12,151 | 1,834 | 9,529 | — | |||||||||||||||
| Residential mortgage loans – multi-family |
— | — | — | 568 | — | |||||||||||||||
| Residential mortgage loans – single family |
1,870 | 1,889 | 268 | 1,248 | 21 | |||||||||||||||
| Construction loans |
10,162 | 12,184 | 477 | 12,353 | — | |||||||||||||||
| Land development loans |
3,668 | 3,667 | — | 2,192 | 177 | |||||||||||||||
| Consumer loans |
— | 248 | — | 10 | — | |||||||||||||||
| (a) | When the discounted cash flows, collateral value or market price equals or exceeds the recorded investment in the loan, then the loan does not require an allowance. This typically occurs when the impaired loans have been partially charged-off and/or there have been interest payments received and applied to the loan balance. |
92
Table of Contents
PACIFIC MERCANTILE BANCORP AND SUBSIDIARIES
NOTES TO CONSOLIDATED FINANCIAL STATEMENTS—(Continued)
The allowance for loan losses at December 31, 2010 included $3.4 million of reserves for $31.5 million in impaired loans as compared to $4.8 million of reserves for $57.4 million of impaired loans at December 31, 2009. At December 31, 2010 and December 31, 2009 there were impaired loans of $5.9 million and $29.2 million, respectively, for which no specific reserves were allocated because payment of those loans was, in management’s judgment, sufficiently collateralized.
We had average investments in impaired loans of $44.3 million and $52.3 million at December 31, 2010 and December 31, 2009, respectively. The interest that would have been earned had the impaired loans remained current in accordance with their original terms was $1.7 million in 2010 and $2.7 million in 2009.
7. Premises and Equipment
The major classes of premises and equipment are as follows:
| (Dollars in thousands) |
December 31, | |||||||
| 2010 | 2009 | |||||||
| Furniture and equipment |
$ | 6,835 | $ | 6,726 | ||||
| Leasehold improvements |
1,761 | 1,760 | ||||||
| 8,596 | 8,486 | |||||||
| Accumulated depreciation and amortization |
(7,661 | ) | (7,157 | ) | ||||
| Total |
$ | 935 | $ | 1,329 | ||||
The amount of depreciation and amortization included in operating expense was $504,000, $492,000 and $609,000 for the years ended December 31, 2010, 2009 and 2008, respectively.
8. Deposits
The aggregate amount of time deposits in denominations of $100,000 or more at December 31, 2010 and 2009 were $397 million and $453 million, respectively.
The scheduled maturities of time certificates of deposit of $100,000 or more at December 31, 2010 were as follows:
| At December 31, 2010 | ||||
| (Dollars in thousands) | ||||
| 2011 |
$ | 310,101 | ||
| 2012 |
83,358 | |||
| 2013 |
2,883 | |||
| 2014 |
307 | |||
| 2015 and beyond |
628 | |||
| Total |
$ | 397,277 | ||
9. Borrowings and Contractual Obligations
Borrowings consisted of the following:
| December 31, | ||||||||
| 2010 | 2009 | |||||||
| (Dollars in thousands) | ||||||||
| Securities sold under agreements to repurchase |
$ | — | $ | 3 | ||||
| Federal Home Loan advances—short-term |
68,000 | 127,000 | ||||||
| Federal Home Loan advances—long-term |
44,000 | 14,000 | ||||||
| $ | 112,000 | $ | 141,003 | |||||
Securities sold under agreements to repurchase, which are classified as secured borrowings and mature within one day from the transaction date, are reflected at the amount of cash received in connection with the transaction.
93
Table of Contents
PACIFIC MERCANTILE BANCORP AND SUBSIDIARIES
NOTES TO CONSOLIDATED FINANCIAL STATEMENTS—(Continued)
Borrowings. As of December 31, 2010, we had $68 million of outstanding short-term borrowings and $44 million of outstanding long-term borrowings that we had obtained from the Federal Home Loan Bank. The table below sets forth the amounts (in thousands of dollars) of, the interest rates we pay on, and the maturity dates of these Federal Home Loan Bank borrowings. These borrowings, along with the securities sold under agreements to repurchase, have a weighted-average annualized interest rate of 0.82%.
| Principal Amounts | Interest Rate | Maturity Dates | Principal Amounts | Interest Rate | Maturity Dates | |||||||||||||
| (Dollars in thousands) | ||||||||||||||||||
| $ | 10,000 | 0.29 | % | January 28, 2011 | $ | 10,000 | 1.07 | % | February 17, 2012 | |||||||||
| 14,000 | 0.28 | % | January 31, 2011 | 10,000 | 1.18 | % | February 23, 2012 | |||||||||||
| 10,000 | 0.28 | % | January 31, 2011 | 4,000 | 0.77 | % | August 9, 2012 | |||||||||||
| 6,000 | 0.44 | % | August 8, 2011 | 5,000 | 1.66 | % | November 26, 2012 | |||||||||||
| 14,000 | 0.69 | % | August 11, 2011 | 10,000 | 1.73 | % | February 19, 2013 | |||||||||||
| 5,000 | 0.69 | % | August 11, 2011 | 5,000 | 1.06 | % | August 9, 2013 | |||||||||||
| 9,000 | 1.08 | % | November 25, 2011 | |||||||||||||||
At December 31, 2010, U.S. Agency and Mortgage Backed securities, U.S. Government agency securities, collateralized mortgage obligations with an aggregate fair market value of $12.6 million, and $178 million of residential mortgage and other real estate secured loans were pledged to secure these Federal Home Loan Bank borrowings, repurchase agreements, local agency deposits, and treasury, tax and loan accounts.
As of December 31, 2010, we had unused borrowing capacity of $59.9 million with the Federal Home Loan Bank. The highest amount of borrowings outstanding at any month end during the year ended December 31, 2010 consisted of $132 million of borrowings from the Federal Home Loan Bank and $11.8 million of overnight borrowings in the form of securities sold under repurchase agreements.
As of December 31, 2009, we had $127 million of outstanding short-term borrowings and $14 million of outstanding long-term borrowings that we had obtained from the Federal Home Loan Bank. These borrowings, along with the securities sold under agreements to repurchase, had a weighted-average annualized interest rate of 3.65%.
As of December 31, 2009 we had unused borrowing capacity of $39.5 million with the Federal Home Loan Bank. The highest amount of borrowings outstanding at any month-end during the year ended December 31, 2009 consisted of $208 million of borrowings from the Federal Home Loan Bank and $13.4 million of overnight borrowings in the form of securities sold under repurchase agreements.
These Federal Home Loan Bank borrowings were obtained in accordance with the Company’s asset/liability management objective to reduce the Company’s exposure to interest rate fluctuations.
Junior Subordinated Debentures. In 2002, we formed subsidiary grantor trusts to sell and issue to institutional investors a total of approximately $17.5 million principal amount of floating junior trust preferred securities (“trust preferred securities”). In October 2004, the Company established another grantor trust that sold an additional $10.3 million of trust preferred securities to an institutional investor. The Company received the net proceeds from the sale of the trust preferred securities in exchange for our issuance to the grantor trusts, of a total $27.5 million principal amount of our junior subordinated floating rate debentures (the “Debentures”). The payment terms of the Debentures mirror those of the trust preferred securities and the payments that we make of interest and principal on the Debentures are used by the grantor trusts to make the payments that come due to the holders of the trust preferred securities pursuant to the terms of those securities. The Debentures also were pledged by the grantor trusts as security for the payment obligations of the grantor trusts under the trust preferred securities.
During the year ended December 31, 2007, we voluntarily redeemed, at par, $10.3 million principal amount of the Debentures, and the corresponding trust preferred securities, that we issued in 2002.
94
Table of Contents
PACIFIC MERCANTILE BANCORP AND SUBSIDIARIES
NOTES TO CONSOLIDATED FINANCIAL STATEMENTS—(Continued)
Set forth below are the respective principal amounts, in thousands of dollars, and certain other information regarding the terms of the Debentures that remained outstanding as of December 31, 2010 and 2009:
| Original Issue Dates |
Principal Amount | Interest Rate(1) | Maturity Dates | |||||||||
| (In thousands) | ||||||||||||
| September 2002 |
$ | 7,217 | LIBOR plus 3.40 | % | September 2032 | |||||||
| October 2004 |
10,310 | LIBOR plus 2.00 | % | October 2034 | ||||||||
| Total |
$ | 17,527 | ||||||||||
| (1) | Interest rate resets quarterly. |
These Debentures require quarterly interest payments, which are used to make quarterly distributions required to be paid on the corresponding trust preferred securities. Subject to certain conditions, we have the right, at our discretion, to defer those interest payments, and the corresponding distributions on the trust preferred securities, for up to five years. Exercise of this deferral right does not constitute a default of our obligations to pay the interest on the Debentures or the corresponding distributions that are payable on the trust preferred securities.
As previously reported, since July 2009 we have been required to obtain the prior approval of the Federal Reserve Bank of San Francisco to make interest payments on the Debentures. During the quarter ended June 30, 2010, we were advised by the Federal Reserve Bank that it would not approve the payments of interest on the Debentures scheduled to be made on June 24 and July 19, 2010. As a result, we exercised our right, pursuant to the terms of the Debentures, to defer those interest payments. In the fourth quarter of 2010 we were advised by the Federal Reserve Bank that it would not approve our payment of the next two interest payments scheduled to be made in December 2010 and January 2011, respectively. As a result we have deferred those interest payments as well. If we are unable to obtain Federal Reserve Bank approval to pay the interest payments that will become due in June 2011 and July 2011, then, it will be necessary for us to exercise our deferral rights with respect to those payments as well. Since we have the right, under the terms of the Debentures to defer interest payments for up to five years, the deferral of interest payments to date did not, and any deferral of the June and July 2011 interest payments will not, constitute a default under or with respect to the Debentures. Information regarding the FRB Agreement and the requirements and restrictions imposed on us by that Agreement is set forth below under the subcaption “—Supervision and Regulation in Part I of this Report under the caption “Regulatory Action by the FRB and DFI” and in the Section entitled “RISK FACTORS” contained in Item 1A of this Report.
Under the Federal Reserve Board rulings, the borrowings evidenced by the Debentures, which are subordinated to all of our other borrowings that are outstanding or which we may obtain in the future, are eligible (subject to certain dollar limitations) to qualify and, at December 31, 2010 and 2009, $16.8 million of those Debentures qualified as Tier I capital, for regulatory purposes. See discussion below under the subcaption “—Regulatory Capital Requirements.”
10. Transactions with Board of Directors
The Directors of the Company and the Bank, and certain of the businesses with which they are associated, conduct banking transactions with the Company in the ordinary course of business. All loans and commitments to loan included in such transactions are made in accordance with applicable laws and on substantially the same terms, including interest rates and collateral, as those prevailing at the same time for comparable transactions with persons of similar creditworthiness that were not affiliated with the Company, and did not present any undue risk of collectability.
The following is a summary of loan transactions with the Board of Directors of the Company and certain of their associated businesses:
| Year Ended December 31, |
||||||||
| 2010(1) | 2009(1) | |||||||
| (Dollars in thousands) | ||||||||
| Beginning balance |
$ | 5,805 | $ | 5,898 | ||||
| New loans granted |
5,535 | 3,067 | ||||||
| Principal repayments |
(1,928 | ) | (3,160 | ) | ||||
| Ending balance |
$ | 9,412 | $ | 5,805 | ||||
| (1) | Includes loans made to executive officers who are not also directors totaling $56 thousand and $61 thousand in 2010 and 2009, respectively. |
Deposits by Board of Directors and executive officers held by the Bank were $1.0 and $1.1 million at December 31, 2010 and 2009, respectively.
95
Table of Contents
PACIFIC MERCANTILE BANCORP AND SUBSIDIARIES
NOTES TO CONSOLIDATED FINANCIAL STATEMENTS—(Continued)
11. Income Taxes
The components of income tax expense (benefit) consisted of the following for the years ended December 31:
| (Dollars in thousands) |
2010 | 2009 | 2008 | |||||||||
| Current taxes: |
||||||||||||
| Federal |
$ | 257 | $ | (7,933 | ) | $ | (1,679 | ) | ||||
| State |
2 | 110 | 47 | |||||||||
| Total current taxes |
259 | (7,823 | ) | (1,632 | ) | |||||||
| (Dollars in thousands) |
2010 | 2009 | 2008 | |||||||||
| Deferred taxes: |
||||||||||||
| Federal |
3,971 | (1,308 | ) | (983 | ) | |||||||
| State |
4,728 | (3,202 | ) | (1,087 | ) | |||||||
| Total deferred taxes |
8,699 | (4,510 | ) | (2,070 | ) | |||||||
| Total income tax (benefit) expense |
$ | 8,958 | $ | (12,333 | ) | $ | (3,702 | ) | ||||
The components of our net deferred tax asset are as follows at:
| (Dollars in thousands) |
December 31, | |||||||
| 2010 | 2009 | |||||||
| Deferred tax assets |
||||||||
| Allowance for loan losses |
$ | 7,521 | $ | 8,467 | ||||
| Other than temporary impairment on securities |
46 | 46 | ||||||
| Capital loss |
180 | 180 | ||||||
| Deferred compensation |
954 | 807 | ||||||
| Deferred capitalized costs |
— | — | ||||||
| Charitable contributions |
40 | 27 | ||||||
| Other accrued expenses |
1,045 | 563 | ||||||
| Reserve for unfunded commitments |
102 | 102 | ||||||
| State taxes |
(7 | ) | 1 | |||||
| State taxes net operating loss carry forward |
4,047 | 1,925 | ||||||
| Stock based compensation |
515 | 515 | ||||||
| Depreciation and amortization |
292 | 300 | ||||||
| Unrealized losses on securities and deferred compensation |
1,952 | 2,007 | ||||||
| Total deferred tax assets |
16,687 | 14,940 | ||||||
| Deferred tax liabilities |
||||||||
| Deferred loan origination costs |
286 | (99 | ) | |||||
| Total deferred tax liabilities |
286 | (99 | ) | |||||
| Valuation allowance |
(16,020 | ) | (3,180 | ) | ||||
| Total net deferred tax assets |
$ | 953 | $ | 11,661 | ||||
The reasons for the differences between the statutory federal income tax rate and the effective tax rates are summarized as follows:
| Year Ended December 31, | ||||||||||||
| 2010 | 2009 | 2008 | ||||||||||
| Federal income tax based on statutory rate |
(34.0 | )% | (34.0 | )% | (34.0 | )% | ||||||
| State franchise tax net of federal income tax benefit |
(7.5 | ) | (7.5 | ) | (7.7 | ) | ||||||
| Permanent differences |
(4.7 | ) | (0.7 | ) | (1.3 | ) | ||||||
| Other |
1.0 | 0.5 | 0.3 | |||||||||
| Valuation allowance |
255.2 | 0.0 | 19.1 | |||||||||
| Total income (benefits) tax expense |
210.0 | % | (41.7 | )% | (23.6 | )% | ||||||
96
Table of Contents
PACIFIC MERCANTILE BANCORP AND SUBSIDIARIES
NOTES TO CONSOLIDATED FINANCIAL STATEMENTS—(Continued)
We recognize deferred tax assets and liabilities for the future tax consequences related to differences between the financial statement carrying amounts of existing assets and liabilities and their respective tax bases, and for tax credits. Our deferred tax assets, which are comprised primarily of tax credit and tax loss carryforwards and tax deductions (“tax benefits”), net of a valuation allowance, totaled $953,000 and $11.7 million as of December 31, 2010 and December 31, 2009, respectively. We evaluate our deferred tax assets for recoverability using a consistent approach which considers the relative impact of negative and positive evidence, including our historical profitability and projections of future taxable income, the amount of which can affect our ability to utilize the tax benefits comprising the deferred tax assets to reduce taxes in the future. We are required to establish a valuation allowance for deferred tax assets and record a charge to income if we determine, based on available evidence at the time the determination is made, that it is more likely than not that some portion or all of such tax benefits will not be realized. In evaluating the need for a valuation allowance, we estimate future taxable income based on management-approved business plans and ongoing tax planning strategies. This process involves significant assumptions and judgments that are subject to change from period to period based on changes in tax laws or variances between our projected operating performance and our actual results, as well as other factors. Because of the effect of future deductions that are not contingent upon the generation of future taxable income and certain tax planning opportunities, the Company is not reliant solely upon the generation of future taxable income to realize all of its net deferred tax assets.
We conducted an assessment of the recoverability of our deferred tax assets as of June 30, 2010. Based on that assessment and due, in part, to continued weakness in the economy and financial markets and the losses we had incurred in 2009 and the first half of 2010, we concluded that it had become more likely, than not, that we would be unable to utilize our remaining tax benefits comprising our deferred tax asset prior to their expiration. Therefore, we recorded an valuation allowance against our net deferred tax asset in the amount of $10.7 million by means of a non-cash charge to income tax expense in the quarter ended June 30, 2010. The provision for income taxes we have recorded in our statement of operations for the year ended December 31, 2010 is primarily attributable to that charge.
We file income tax returns with the U.S. federal government and the state of California. As of December 31, 2010, we were subject to examination by the Internal Revenue Service with respect to our U.S. federal tax returns for the 2007 to 2009 tax years. As of December 31, 2010, we were subject to examination by the Franchise Tax Board for California state income tax return for the 2009. We do not believe there will be any material adverse changes in our unrecognized tax benefits over the next 12 months.
Net operating losses (“NOLs”) on U.S. federal income tax returns for tax years 2009 and 2010 may be carried back five years and forward twenty years. We filed an amended prior year U.S. federal tax return for the tax year 2009 and to carryback the U.S. federal NOLs for five years. NOLs on our California state income tax returns for tax year 2008 and 2009 may be carried forward twenty years. However, the state of California has suspended net operating carryover deductions for 2008 and 2009, although corporate taxpayers were permitted to compute and carryover their NOLs during that suspension period. Beginning in 2011, California taxpayers may carryback losses for two years and carryforward for twenty years, which will conform to the U.S. tax laws by 2013. We expect (although no assurance can be given) that we will generate taxable income in future years to offset the California NOL generated in 2010.
Our policy is to recognize interest and penalties accrued on any unrecognized tax benefits as a component of tax expense. We did not have any accrued interest or penalties associated with any unrecognized tax benefits, and no interest expense was recognized during the years ended 2010 and 2009. Our effective tax rate differs from the federal statutory rate primarily due to tax free income on municipal bonds and certain non-deductible expenses recognized for financial reporting purposes and state taxes.
12. Stock-Based Employee Compensation Plans
At the Company’s 2010 Annual Meeting, held on May 25, 2010, our shareholders approved a 2010 Equity Incentive Plan (the “2010 Plan”), which provides for the grant of equity incentives, consisting of options, restricted shares and stock appreciation rights (“SARs”) to officers, other key employees and directors of the Company and the Bank. The 2010 Plan sets aside, for the grant or awarding of such equity incentives, 400,000 share of our common stock, plus an additional 158,211 shares of common stock which was equal to the total of the shares that were then available for the grant of equity incentives under our shareholder-approved 2008 and 2004 Plans (the “Previously Approved Plans”). At the same time, those 158,211 shares ceased to be issuable under the Previously Approved Plans. As a result, upon approval of the 2010 Plan by our shareholders, a total of 558,211 shares were available for the grant or awarding of equity incentives under the that Plan.
97
Table of Contents
PACIFIC MERCANTILE BANCORP AND SUBSIDIARIES
NOTES TO CONSOLIDATED FINANCIAL STATEMENTS—(Continued)
12. Stock-Based Employee Compensation Plans (Cont-)
Options to purchase a total of 1,143,844 shares of our common stock granted under the Previously Approved Plans were outstanding on the date the 2010 Plan was adopted. Those Plans had provided that, if any of the outstanding options were to expire or otherwise terminate, rather than being exercised, the shares that had been subject to those options would become available for the grant of new options under those Plans. However, the 2010 Plan provides that if any of the outstanding options granted under the Previously Approved Plans expire or are terminated for any reason, then, the number of shares that would become available for grants or awards of equity incentives under the 2010 Plan would be increased by an equivalent number of shares, instead of becoming available for new equity incentive grants under the Previously Approved Plans. Assuming that all of the options that were outstanding under the Previously Approved Plans on the date the 2010 Plan was adopted were to expire or be cancelled, then the maximum number of shares that could be issued pursuant to equity incentives under the 2010 Plan would be 1,704,555 shares.
Stock options entitle the recipients to purchase common stock at a price per share that may not be less than 100% of the fair market value of the Company’s shares on the respective grant dates of the stock options. Restricted shares may be granted at such purchase prices and on such other terms, including restrictions and Company repurchase rights, as are fixed by the Compensation Committee at the time rights to purchase such restricted shares are granted. SARs entitle the recipient to receive a cash payment in an amount equal to the difference between the fair market value of the Company’s shares on the date of vesting and a “base price” (which, in most cases, will be equal to fair market value of the Company’s shares on the date of grant), subject to the right of the Company to make such payment in shares of its common stock at their then fair market value. Options, restricted shares and SARs may vest immediately or in installments over various periods generally ranging up to five years, subject to the recipient’s continued employment or service or the achievement of specified performance goals, as determined by the Compensation Committee at the time it grants or awards the options, the restricted shares or the SARs. Stock options and SARs may be granted for terms of up to 10 years after the date of grant, but will terminate sooner upon or shortly after a termination of service occurring prior to the expiration of the term of the option or SAR. The Company will become entitled to repurchase any unvested restricted shares, at the same price that was paid for the shares by the recipient, in the event of a termination of employment or service of the holder of such shares or if any performance goals specified in the award are not satisfied. To date, the Company has not granted any restricted shares or any SARs.
Under ASC 718-10, we are required to recognize, in our financial statements, the fair value of the options or any restricted shares that we grant as compensation cost over their respective service periods.
The fair values of the options that were outstanding at December 31, 2010 under the 2010 Plan or the Previously Approved Plans were estimated as of their respective dates of grant using the Black-Scholes option-pricing model. The table below summarizes the weighted average assumptions used to determine the fair values of the options granted during the following periods:
| Twelve Months Ended December 31, |
||||||||||||
| Assumptions with respect to: |
2010 | 2009 | 2008 | |||||||||
| Expected volatility |
34 | % | 34 | % | 29 | % | ||||||
| Risk-free interest rate |
2.48 | % | 2.48 | % | 3.23 | % | ||||||
| Expected dividends |
0.26 | % | 0.26 | % | 0.31 | % | ||||||
| Expected term (years) |
6.9 | 6.9 | 6.9 | |||||||||
| Weighted average fair value of options granted during period |
$ | 1.26 | $ | 1.38 | $ | 1.52 | ||||||
98
Table of Contents
PACIFIC MERCANTILE BANCORP AND SUBSIDIARIES
NOTES TO CONSOLIDATED FINANCIAL STATEMENTS—(Continued)
The following tables summarize the stock option activity under the Company’s 2010 Plan and previously approved Plans, which are collectively referred as the “Plans” during the years ended December 31, 2010, 2009 and 2008, respectively.
| Number of Shares |
Weighted- Average Exercise Price Per Share |
Number of Shares |
Weighted- Average Exercise Price Per Share |
Number of Shares |
Weighted- Average Exercise Price Per Share |
|||||||||||||||||||
| 2010 | 2009 | 2008 | ||||||||||||||||||||||
| Outstanding – January 1, |
1,162,744 | $ | 9.51 | 1,137,244 | $ | 9.31 | 1,133,139 | $ | 9.82 | |||||||||||||||
| Granted |
410,122 | 3.24 | 68,500 | 3.55 | 135,000 | 4.27 | ||||||||||||||||||
| Exercised (1) |
— | — | — | — | (66,062 | ) | 5.23 | |||||||||||||||||
| Forfeited/Canceled |
(395,224 | ) | 7.06 | (43,000 | ) | 10.87 | (64,833 | ) | 11.96 | |||||||||||||||
| Outstanding – December 31, |
1,177,642 | 7.57 | 1,162,744 | 8.93 | 1,137,244 | 9.31 | ||||||||||||||||||
| Options Exercisable – December 31, |
716,162 | $ | 10.04 | 955,709 | $ | 9.51 | 903,828 | $ | 9.44 | |||||||||||||||
| (1) | 26,194 shares issued based on a cashless exercise of 66,062 stock options |
There were no options exercised during either of the years ended December 31, 2010 and December 31, 2009. The fair values of vested options at December 31, 2010, 2009, and 2008, were $244,000, 313,000 and $611,000, respectively.
The following table provides additional information regarding the vested and unvested options that were outstanding at December 31, 2010.
| Options Outstanding as of December 31, 2010 |
Options Exercisable as of December 31, 2010(1) |
|||||||||||||||||||||||
| Vested | Unvested | Weighted Average Exercise Price |
Weighted Average Remaining Contractual Life (Years) |
Shares | Weighted Average Exercise Price |
|||||||||||||||||||
| $ 2.97 – $5.99 |
95,002 | 442,620 | $ | 3.36 | 9.20 | 95,002 | $ | 3.41 | ||||||||||||||||
| $ 6.00 – $9.99 |
180,877 | 7,200 | 7.60 | 1.13 | 180,877 | 7.63 | ||||||||||||||||||
| $10.00 – $12.99 |
311,100 | — | 11.23 | 3.13 | 311,100 | 11.23 | ||||||||||||||||||
| $13.00 – $17.99 |
113,283 | 8,060 | 15.09 | 4.64 | 113,283 | 15.07 | ||||||||||||||||||
| $18.00 – $18.84 |
15,900 | 3,600 | 18.06 | 5.09 | 15,900 | 18.08 | ||||||||||||||||||
| 716,162 | 461,480 | 7.57 | 5.77 | 716,162 | 10.04 | |||||||||||||||||||
| (1) | The weighted average remaining contractual life of the options that were exercisable as of December 31, 2010 was 3.55 years. |
The aggregate intrinsic values of options that were outstanding and exercisable under the Plans at December 31, 2010, and 2009, were $39,000 and $1,400, respectively.
A summary of the status of the unvested options as of December 31, 2010, and changes in the number of shares subject to and in the weighted average grant date fair values of the unvested options during the year ended December 31, 2010, are set forth in the following table.
| Number of Shares Subject to Options |
Weighted Average Grant Date Fair Value |
|||||||
| Unvested at December 31, 2009 |
207,032 | $ | 2.36 | |||||
| Granted |
410,122 | 1.26 | ||||||
| Vested |
(106,174 | ) | 2.30 | |||||
| Forfeited/Cancelled |
(49,500 | ) | 2.14 | |||||
| Unvested at December 31, 2010 |
461,480 | $ | 1.43 | |||||
99
Table of Contents
PACIFIC MERCANTILE BANCORP AND SUBSIDIARIES
NOTES TO CONSOLIDATED FINANCIAL STATEMENTS—(Continued)
The aggregate amounts of stock based compensation expense recognized in our consolidated statements of operations for the years ended December 31, 2010, 2009 and 2008 were $167,000, $176,000 and $374,000 respectively, in each case net of taxes. At December 31, 2010, the weighted average period over which nonvested awards were expected to be recognized was 1.56 years.
The following table sets forth the compensation expense which was expected to be recognized during the periods presented below in respect of non-vested stock options outstanding at December 31, 2010:
| Estimated Stock Based Compensation Expense |
||||
| (In thousands) | ||||
| For the years ending December 31, |
||||
| 2011 |
$ | 242 | ||
| 2012 |
204 | |||
| 2013 |
121 | |||
| 2014 |
13 | |||
| 2015 |
8 | |||
| $ | 588 | |||
13. Earnings Per Share (“EPS”)
Basic EPS excludes dilution and is computed by dividing net income or loss available to common shareholders by the weighted average number of common shares outstanding for the period. Diluted EPS reflects the potential dilution that could occur if stock options or other contracts to issue common stock were exercised or converted to common stock that would then share in our earnings. For the years ended December 31, 2010, 2009 and 2008 outstanding options to purchase 1,177,642, 1,162,744 and 1,137,244 shares, respectively, were not considered in computing diluted earnings (loss) per common share because they were antidilutive.
The following table shows how we computed basic and diluted EPS for the years ended December 31, 2010, 2009 and 2008.
| (In thousands, except per share data) |
For the twelve months ended December 31, | |||||||||||
| 2010 | 2009 | 2008 | ||||||||||
| Net loss |
$ | (13,954 | ) | $ | (17,308 | ) | $ | (11,966 | ) | |||
| Accumulated undeclared dividend on preferred stock |
(1,075 | ) | (61 | ) | — | |||||||
| Net loss available for common shareholders (A) |
$ | (15,029 | ) | $ | (17,369 | ) | $ | (11,966 | ) | |||
| Weighted average outstanding shares of common stock (B) |
10,435 | 10,435 | 10,473 | |||||||||
| Dilutive effect of employee stock options and warrants |
— | — | — | |||||||||
| Common stock and common stock equivalents (C) |
10,435 | 10,435 | 10,473 | |||||||||
| Loss per common share: |
||||||||||||
| Basic (A/B) |
$ | (1.44 | ) | $ | (1.66 | ) | $ | (1.14 | ) | |||
| Diluted (A/C) |
$ | (1.44 | ) | $ | (1.66 | ) | $ | (1.14 | ) | |||
14. Shareholders’ Equity
Preferred stock. In October 2010, we commenced a private offering to a limited number of accredited investors of shares of a newly authorized series of preferred stock, designated as the Company’s Series A Convertible 10% Cumulative Preferred Stock (the “Series A Shares”), at a price of $100.00 per Series A Share. We sold a total of 126,550 Series A Shares in that private offering, raising a total of $12,655,000 million (before offering expenses). Cash dividends on the Series A Shares are payable if, as and when declared by the Board of Directors out of funds legally available therefore at a rate equal to 10% of the issue price per annum of the Series A Shares and, if not paid, will accrue and accumulate until paid. Unless and until any accrued but unpaid dividends on the Series A Shares have been paid, no dividends may be paid on the Company’s outstanding common stock (other than stock dividends payable in shares of common stock). Each Series A Share is convertible, at a price of $7.65 per common share, into 13.07 shares of the Company’s common stock at any time at the election of the holder. That conversion price is subject certain anti-
100
Table of Contents
PACIFIC MERCANTILE BANCORP AND SUBSIDIARIES
NOTES TO CONSOLIDATED FINANCIAL STATEMENTS—(Continued)
dilution adjustments; however, the conversion price may not be adjusted (i) below $7.55 per common share (except as a result of any stock dividends, stock splits and the like of the Company’s outstanding common stock) or (ii) to a conversion price that would cause the aggregate number of common shares into which the Series A Shares are convertible to exceed 2,076,498 shares. The outstanding Series A Shares will automatically convert into shares of our common stock on November 27, 2011 (the “Mandatory Conversion Date”) at the conversion price then in effect, but only if any accrued but unpaid dividends on those Series A Shares are paid on or before that Date. It the Company cannot for any reason pay the accrued but unpaid dividends on the Mandatory Conversion Date, then, the Series A Shares will remain outstanding and will continue to accrue dividends until, and the Mandatory Conversion Date will be extended to, the date on which the Company pays all accrued but unpaid interests on the Shares.
The Written Agreement entered into by the Company with the FRB in August 2010 (see Note 3 above) requires us to obtain the prior approval of the FRB to pay cash dividends on any shares of our stock, including the Series A Shares. Based on discussions with the FRB, we do not expect to be able to obtain its approval to pay any dividends on the Series A Shares until at least such time as the Company is able to raise additional capital and return to probability. As a result, as of December 31, 2010 accrued but unpaid dividends on the Series A Shares totaled $1,075,000. Moreover, if we are unable to obtain FRB approval to pay the accrued but unpaid dividends on the Series A Shares on or before the Mandatory Conversion Date, the Series A Shares will not automatically convert into common stock and will, instead, remain outstanding and dividends will continue to accrue on the Series A Shares until such time as we are able to pay all of such accrued but unpaid dividends. Any holder of Series A Shares may voluntarily convert his or her Series A Shares into common stock prior to the Mandatory Conversion Date (as the same may be extended), but in that event he or she would have to forfeit all of the unpaid dividends that have accrued on the Series A Shares being converted.
In the event the Company were to be dissolved and liquidated, each holder of Series A Shares will be entitled to receive an amount equal to the price paid for those Shares, plus all accrued but unpaid dividends (out of assets legally available for such purpose), before any distributions may be made to the holders of our common stock or any other securities of the Company that are junior to the Series A Shares.
The affirmative vote of the holders of a majority of the outstanding Series A Shares (voting as a single class) is required before the Company may (i) alter the rights, preferences or privileges of the Series A Shares in a manner that will adversely affect the holders thereof to a material extent, (ii) change the authorized number of Series A Shares, (iii) authorize or issue a new class or series of preferred stock that would rank senior to the Series A Shares, and (iv) may not redeem or repurchase any outstanding shares of the Company’s common stock, subject to certain limited exceptions. In addition, the holders of Series A Shares are entitled to vote, on an as-converted basis, with the holders of the Company’s common stock (voting together as a single class) on all matters on which common stockholders are entitled to vote. The Company does not have any obligation to register the Series A Shares or any of the common stock issued upon the conversion thereof for resale under the Securities Act of 1933 or any state securities laws.
The Series A Shares do not have a maturity date and are not redeemable at any time by either the holders or the Company.
Payment of Cash Dividends by the Company. A California corporation, like the Company, is permitted under applicable California laws, to pay cash dividends to its shareholders (i) in amounts up to its retained earnings or (ii) if, after payment of the dividends, its tangible consolidated assets were at least 1.25 times its consolidated liabilities (exclusive of certain deferred liabilities) and its current assets were at least equal to its current liabilities. However, as described in Note 3 above and earlier in this Note, the FRB Written Agreement prohibits the Company from paying any cash dividends to any of its preferred or common shareholders without the prior approval of the FRB.
Payment of Dividends by the Bank to the Company. Generally, the principal source of cash available to a bank holding company are dividends from its bank subsidiaries. Under California law, the Board of Directors of the Bank may declare and pay cash dividends to the Company, which is its sole shareholder, subject to the restriction that the amount available for the payment of cash dividends may not exceed the lesser of (i) the Bank’s retained earnings or (ii) its net income for its last three fiscal years (less the amount of any dividends paid made during such period). Cash dividends to shareholders in excess of that amount may be made only with the prior approval of the California Commissioner of Financial Institutions (“Commissioner”). If the Commissioner finds that the shareholders’ equity of the Bank is not adequate, or that the payment by the Bank of cash dividends to the Company would be unsafe or unsound for the Bank, the Commissioner can order the Bank not to pay such dividends.
101
Table of Contents
PACIFIC MERCANTILE BANCORP AND SUBSIDIARIES
NOTES TO CONSOLIDATED FINANCIAL STATEMENTS—(Continued)
The ability of the Bank to pay dividends is further restricted under the Federal Deposit Insurance Corporation Improvement Act of 1991 which prohibits an FDIC-insured bank from paying dividends if, after making such payment, the bank would fail to meet any of its minimum capital requirements. Under the Financial Institutions Supervisory Act and Federal Financial Institutions Reform, Recovery and Enforcement Act of 1989, federal banking regulators also have authority to prohibit FDIC-insured financial institutions from engaging in business practices which are considered to be unsafe or unsound. Under the authority of this Act, federal bank regulatory agencies, as part of their supervisory powers, generally require FDIC insured banks to adopt dividend policies which limit the payment of cash dividends much more strictly than do applicable state laws and, therefore, it is unlikely that the Bank would ever be permitted pay dividends in amounts that might otherwise, as a technical matter, be permitted under California law.
Moreover, in August 2010, the DFI issued an Order (the “DFI Order”) which, among other things, prohibits the Bank from paying any cash dividends without the DFI’s prior approval, even if the payment of such dividends would otherwise be permitted under California law. As a result, it is not expected that the Bank will be permitted to pay cash dividends for the foreseeable future. See Note 3 above for additional information regarding the DFI Order.
Stock Repurchase Program. In July 2005, the Company’s Board of Directors approved a share repurchase program, which authorized the Company to purchase up to two percent (2%), or approximately 200,000, of its outstanding common shares. That program provides for share repurchases to be made in the open market or in private transactions, in accordance with applicable Securities and Exchange Commission rules, when opportunities become available to purchase shares at prices believed to be attractive. The Company is under no obligation to repurchase any shares under the share repurchase program and the timing, actual number and value of shares that are repurchased by the Company under this program will depend on a number of factors, including the Company’s future financial performance and available cash resources, competing uses for its corporate funds, prevailing market prices of its common stock and the number of shares that become available for sale at prices that the Company believes are attractive, as well as any regulatory requirements applicable to the Company. A total of 148,978 shares of its common stock were purchased in the open market for an aggregate purchase price of approximately $1.4 million, which results in an average per share price of $9.30.
In October 2008, the Company’s Board of Directors approved a share repurchase program (the “2008 Share Repurchase Plan”) which authorized (but did not require) the Company to purchase up to $2 million of its shares of common stock. However, no shares were repurchased under the 2008 Share Repurchase Plan. The restrictions on the payment of cash dividends by the Company under the FRB Agreement also prohibit the Company from repurchasing any of its shares without the prior approval of the FRB. As a result, it is not expected that the Company will be permitted to repurchase its shares for the foreseeable future. See Note 3 above and the discussion above in this Note 14 for additional information regarding the FRB Agreement.
15. Commitments and Contingencies
The Company leases certain facilities and equipment under various non-cancelable operating leases, which generally include 3% to 5% escalation clauses in the lease agreements. Rent expense for the years ended December 31, 2010, 2009 and 2008 was $2.4 million, $2.4 million, and $2.4 million, respectively. Sublease income for the year ended December 31, 2010, December 31, 2009 and December 31, 2008 was $0, $15,000 and $28,000, respectively.
Future minimum non-cancelable lease commitments were as follows at December 31, 2010:
| (Dollars in thousands) | ||||
| 2011 |
$ | 2,048 | ||
| 2012 |
1,358 | |||
| 2013 |
879 | |||
| 2014 |
783 | |||
| 2015 |
777 | |||
| Thereafter |
324 | |||
| Total |
$ | 6,169 | ||
102
Table of Contents
PACIFIC MERCANTILE BANCORP AND SUBSIDIARIES
NOTES TO CONSOLIDATED FINANCIAL STATEMENTS—(Continued)
To meet the financing needs of our customers in the normal course of business, the Company is party to financial instruments with off-balance sheet risk. These financial instruments include commitments to extend credit and standby letters of credit. These commitments involve, to varying degrees, elements of credit and interest rate risk in excess of the amount recognized in the consolidated financial statements. At December 31, 2010 and 2009, the Company was committed to fund certain loans including letters of credit amounting to approximately $145 million and $184 million, respectively. The contractual amounts of credit-related financial instruments such as commitments to extend credit, credit-card arrangements, and letters of credit represent the amounts of potential accounting loss should the contracts be fully drawn upon, the customers default, and the value of any existing collateral become worthless.
The Company uses the same credit policies in making commitments to extend credit and conditional obligations as it does for on-balance sheet instruments. Commitments generally have fixed expiration dates; however, since many of the commitments are expected to expire without being drawn upon, the total commitment amounts do not necessarily represent future cash requirements. The Company evaluates each customer’s creditworthiness on a case-by-case basis. The amount of collateral obtained, if deemed necessary by the Company, upon extension of credit is based on management’s credit evaluation of the customer. Collateral held varies, but may include accounts receivable, inventory, property, plant and equipment, residential real estate and income-producing commercial properties.
The Company is subject to legal actions normally associated with financial institutions. At December 31, 2010 and 2009, the Company did not have any pending legal proceedings that were expected to be material to its consolidated financial condition or results of operations.
The Company is required to purchase stock in the Federal Reserve Bank in an amount equal to 6% of its capital, one-half of which must be paid currently with the balance due upon request.
The Bank is a member of the FHLB and therefore, is required to purchase FHLB stock in an amount equal to the lesser of 1% of the Bank’s real estate loans that are secured by residential properties, or 5% of total advances.
James Laliberte, et al. vs. Pacific Mercantile Bank, filed in May 2003 in the California Superior Court for the County of Orange (Case No. 030007092). As previously reported, this lawsuit was initially filed as an individual action by two plaintiffs for alleged violations by the Bank of the Federal Truth in Lending Act (the “TILA”). The two plaintiffs subsequently amended their complaint on three occasions, between November 2003 and May 2005, seeking to convert their individual action into a class action suit and adding additional allegations and seeking rescission of all loans made to the members of the class and damages based on allegations of fraud in the inducement of certain loans, unfair business practices and violations of TILA. In each case, the Bank filed demurrers asserting that the plaintiffs had failed to establish a legal basis for any recovery and in each case the trial court sustained the Bank’s demurrers and dismissed the plaintiffs’ lawsuit, without prejudice. Plaintiffs subsequently appealed the trial court’s rulings. In January 2007, the appellate court, in a published decision, affirmed the trial court’s order dismissing the plaintiffs’ suit, finding that plaintiffs had no right to assert class-wide claims of rescission. Plaintiffs then appealed this decision to the U.S. Supreme Court which, in May 2007, denied plaintiffs’ petition for review, effectively sustaining the appellate court’s ruling.
Plaintiffs, abandoning their claims of fraud and unfair business practices on the part of the Bank, then filed a motion with the trial court for class certification limited to the TILA and certain related statutory claims. In January 2008 the trial court denied the motion for class certification, finding that plaintiffs had not shown evidence that there were common questions of law or fact to justify certifying a class and had been unable to introduce any admissible evidence establishing that any statutory violations had occurred during the relevant class period.
However, in April 2008, plaintiffs filed an appeal of the trial court’s denial of their motion for class certification on the claims under TILA and the related statutory claims. In April 2009 the appellate court issued an order certifying plaintiff’s class action with respect to the TILA claims and remanded the case back to the trial court for further proceedings.
In November 2010, without any admission of any of plaintiffs’ allegations and any wrongdoing on its part, the Bank entered into an agreement with the plaintiffs providing for settlement of all of the claims that were the subject of the class action suit, subject to the approval of the settlement terms by the trial court. The trial court granted final approval of the settlement of the class action claims on March 22, 2010.
The settlement agreement provides for the Bank to establish a settlement fund in the amount of $225,000 for payment to the members of the class in settlement of the class action lawsuit. The settlement agreement further provides that any individual who was eligible to become a member of the class, but elected not to participate in the class action, had the right to receive a payment from the Bank in the same amount received by each of the members of the class, provided that the individual submitted a claim form to the Class Administrator and the claim was accepted by the Bank. A handful of claims were received, but all were rejected by the Bank. No claimant filed an appeal with the Court, so the final settlement amount approved by the court is $225,000.
The Settlement Agreement expressly provides for a complete release of all claims against the Bank arising out of the subject matter of the class action suit, except for individual claims of the named plaintiffs which were pending in a separate trial proceeding and any right of the plaintiffs to recover their attorneys fees in connection with the class action suit. The settlement also permitted plaintiffs to apply for an award of attorneys’ fees and costs. Plaintiffs filed such a motion, and on March 22, 2011, the trial court issued an order granting fees and costs in the aggregate amount of $738,216.09. Notice of the ruling was issued on March 25, 2011, and the Bank has a period of 60 days from that date to file an appeal of the trial court’s ruling; but has not yet decided whether to do so.
In March 2011, the named plaintiffs agreed to a stipulated settlement of and a complete release of their individual claims against the Bank in exchange for the payment to them of an aggregate of $76,000.
We had previously established reserves against the possibility of an adverse result in the class action suit and, therefore, the settlement payment and attorneys’ fee award are not expected to materially affect our future operating results or our cash or capital resources.
Other Legal Actions. We are subject to legal actions that arise from time to time in the ordinary course of our business. Currently there are no such pending legal proceedings that we believe will have a material adverse effect on our financial condition or results of operations.
103
Table of Contents
PACIFIC MERCANTILE BANCORP AND SUBSIDIARIES
NOTES TO CONSOLIDATED FINANCIAL STATEMENTS—(Continued)
16. Employee Benefit Plans
The Company has a 401(k) plan that covers substantially all full-time employees. That plan permits voluntary contributions by employees, a portion of which are matched by the Company. The Company’s expenses relating to its contributions to the 401(k) plan for the years ended December 31, 2010, 2009 and 2008 were $79,000, $464,000 and $368,000, respectively.
In January 2001 the Bank established an unfunded Supplemental Retirement Plan (“SERP”) for its President and CEO, Raymond E. Dellerba. The SERP was amended and restated in April 2006 to comply with the requirements of new Section 409A of Internal Revenue Code. The SERP provides that, subject to meeting certain vesting requirements described below, upon reaching age 65 Mr. Dellerba will become entitled to receive 180 equal successive monthly retirement payments, each in an amount equal to 60% of his average monthly base salary during the three years immediately preceding the date of his retirement or other termination of his employment (his “normal retirement benefit”). Mr. Dellerba’s right to receive that normal retirement benefit vests monthly during the term of his employment at a rate equal to 1.5 monthly retirement payments for each month of service with the Bank.
The Company follows FASB ASC 715-30-35, which requires us to recognize in our balance sheet the funded status of any post-retirement plans that we maintain and to recognize, in other comprehensive income, changes in funded status of any such plans in any year in which changes occur.
The changes in the projected benefit obligation of other benefits under the Plan during 2010, 2009 and 2008, its funded status at December 31, 2010, 2009 and 2008, and the amounts recognized in the balance sheet at December 31, 2010 and December 31, 2009, were as follows:
| At December 31, | ||||||||||||
| 2010 | 2009 | 2008 | ||||||||||
| (Dollars in thousands) | ||||||||||||
| Change in benefit obligation: |
||||||||||||
| Benefit obligation at beginning of period |
$ | 2,077 | $ | 1,922 | $ | 1,628 | ||||||
| Service cost |
192 | 185 | 185 | |||||||||
| Interest cost |
137 | 123 | 109 | |||||||||
| Participant contributions |
— | — | — | |||||||||
| Plan amendments |
— | — | — | |||||||||
| Combination/divestiture/curtailment/settlement/termination |
— | — | — | |||||||||
| Actuarial loss/(gain) |
(91 | ) | (153 | ) | — | |||||||
| (Benefits paid) |
— | — | — | |||||||||
| Benefit obligation at end of period |
$ | 2,315 | $ | 2,077 | $ | 1,922 | ||||||
| Funded status: |
— | — | — | |||||||||
| Amounts recognized in the Statement of Financial Condition |
||||||||||||
| Unfunded accrued SERP liability—current |
$ | — | $ | — | $ | — | ||||||
| Unfunded accrued SERP liability—noncurrent |
(2,315 | ) | (2,077 | ) | (1,922 | ) | ||||||
| Total unfunded accrued SERP liability |
$ | (2,315 | ) | $ | (2,077 | ) | $ | (1,922 | ) | |||
| Net amount recognized in accumulated other comprehensive income |
||||||||||||
| Prior service cost/(benefit) |
$ | 31 | $ | 46 | $ | 62 | ||||||
| Net actuarial loss/(gain) |
(35 | ) | 71 | 260 | ||||||||
| Total net amount recognized in accumulated other comprehensive income |
$ | (4 | ) | $ | 117 | $ | 322 | |||||
| Accumulated benefit obligation |
$ | 2,225 | $ | 1,808 | $ | 1,411 | ||||||
| Components of net periodic SERP cost YTD: |
||||||||||||
| Service cost |
$ | 192 | $ | 185 | $ | 185 | ||||||
| Interest cost |
137 | 123 | 109 | |||||||||
| Expected return on plan assets |
— | — | — | |||||||||
| Amortization of prior service cost/(benefit) |
15 | 15 | 15 | |||||||||
| Amortization of net actuarial loss/(gain) |
15 | 37 | 64 | |||||||||
| Net periodic SERP cost |
$ | 359 | $ | 360 | $ | 373 | ||||||
| Recognized in other comprehensive income YTD: |
||||||||||||
| Prior service cost/(benefit) |
$ | — | $ | — | $ | — | ||||||
| Net actuarial loss/(gain) |
(91 | ) | (153 | ) | — | |||||||
| Amortization of prior service cost/(benefit) |
(15 | ) | (15 | ) | (15 | ) | ||||||
| Amortization of net actuarial loss/(gain) |
(15 | ) | (37 | ) | (64 | ) | ||||||
| Total recognized year to date in other comprehensive income |
$ | (121 | ) | $ | (205 | ) | $ | (79 | ) | |||
| Assumptions as of December 31,: |
||||||||||||
| Assumed discount rate |
6.25 | % | 6.25 | % | 6.25 | % | ||||||
| Rate of compensation increase |
4.00 | % | 4.00 | % | 4.00 | % | ||||||
104
Table of Contents
PACIFIC MERCANTILE BANCORP AND SUBSIDIARIES
NOTES TO CONSOLIDATED FINANCIAL STATEMENTS—(Continued)
As of December 31, 2010, $906,000 benefits are expected to be paid in the next five years and a total of $2.8 million of benefits are expected to be paid from year 2016 to year 2021. $367,000 is expected to be recognized in net periodic benefit cost in 2011.
17. Regulatory Matters and Capital/Operating Plans
The Company and the Bank are subject to various regulatory capital requirements administered by the federal and state banking agencies. A failure to meet minimum capital requirements is likely to lead to the imposition, by federal and state regulators, of (i) certain requirements, such as an order requiring additional capital to be raised, and (ii) operational restrictions that could have a direct and material adverse effect on operating results. Under capital adequacy guidelines and the regulatory framework for prompt corrective action, the Company and the Bank must meet specific capital guidelines that involve quantitative measures of assets, liabilities, and certain off-balance sheet items as calculated under regulatory accounting practices. The capital amounts and classifications are also subject to qualitative judgments by the regulators about components, risk weightings, and other factors. Also, as mentioned in Note 3, as a result of the Written Agreement issued in August, 2010, the Company is taking actions designed to maintain capital and return the Company to profitability, including, among others, strategy planning and budgeting, and capital and profit planning.
Quantitative measures established by regulation to ensure capital adequacy require the Company and Bank to maintain minimum amounts and ratios (set forth in the following table) of total and Tier I capital (as defined in the regulations) to risk-weighted assets (as defined), and of Tier I capital (as defined) to average assets (as defined). Management believes that, as of December 31, 2010, the Company and the Bank met all capital adequacy requirements to which they are subject and have not been notified by any regulatory agency that would require the Company or the Bank to maintain additional capital.
As of December 31, 2010, based on the applicable capital adequacy regulations, the Company and the Bank are categorized as “well capitalized” under the regulatory framework for prompt corrective action. To be categorized as “well capitalized,” the Company and the Bank must maintain minimum total risk-based, Tier I risk-based and Tier I leverage ratios as set forth in the following tables.
| Applicable Federal Regulatory Requirement | ||||||||||||||||||||||||
| Actual | For Capital Adequacy Purposes |
To
be Categorized As Well Capitalized |
||||||||||||||||||||||
| Amount | Ratio | Amount | Ratio | Amount | Ratio | |||||||||||||||||||
| (Dollars in thousands) | ||||||||||||||||||||||||
| Total Capital to Risk Weighted Assets: |
||||||||||||||||||||||||
| Company |
$ | 95,293 | 11.3 | % | $ | 67,309 | At least 8.0 | % | N/A | N/A | ||||||||||||||
| Bank |
91,291 | 10.9 | % | 67,242 | At least 8.0 | % | $ | 84,053 | At least 10.0 | % | ||||||||||||||
| Tier 1 Capital to Risk Weighted Assets: |
||||||||||||||||||||||||
| Company |
$ | 73,895 | 8.8 | % | $ | 33,655 | At least 4.0 | % | N/A | N/A | ||||||||||||||
| Bank |
80,694 | 9.6 | % | 33,621 | At least 4.0 | % | $ | 50,432 | At least 6.0 | % | ||||||||||||||
| Tier 1 Capital to Average Assets: |
||||||||||||||||||||||||
| Company |
$ | 73,895 | 6.7 | % | $ | 43,973 | At least 4.0 | % | N/A | N/A | ||||||||||||||
| Bank |
80,694 | 7.4 | % | 43,919 | At least 4.0 | % | $ | 54,898 | At least 5.0 | % | ||||||||||||||
105
Table of Contents
PACIFIC MERCANTILE BANCORP AND SUBSIDIARIES
NOTES TO CONSOLIDATED FINANCIAL STATEMENTS—(Continued)
The actual capital amounts and ratios of the Company and the Bank at December 31, 2009 are presented in the following table:
| Applicable Federal Regulatory Requirement | ||||||||||||||||||||||||
| Actual | For Capital Adequacy Purposes |
To be Categorized As Well Capitalized |
||||||||||||||||||||||
| Amount | Ratio | Amount | Ratio | Amount | Ratio | |||||||||||||||||||
| (Dollars in thousands) | ||||||||||||||||||||||||
| Total Capital to Risk Weighted Assets: |
||||||||||||||||||||||||
| Company |
$ | 105,579 | 11.7 | % | $ | 72,173 | At least 8.0 | % | N/A | N/A | ||||||||||||||
| Bank |
98,911 | 11.0 | % | 72,043 | At least 8.0 | % | $ | 90,054 | At least 10.0 | % | ||||||||||||||
| Tier I Capital to Risk Weighted Assets: |
||||||||||||||||||||||||
| Company |
$ | 94,187 | 10.4 | % | $ | 36,087 | At least 4.0 | % | N/A | N/A | ||||||||||||||
| Bank |
87,539 | 9.7 | % | 36,022 | At least 4.0 | % | $ | 54,033 | At least 6.0 | % | ||||||||||||||
| Tier I Capital to Average Assets: |
||||||||||||||||||||||||
| Company |
$ | 94,187 | 8.1 | % | $ | 46,370 | At least 4.0 | % | N/A | N/A | ||||||||||||||
| Bank |
87,539 | 7.6 | % | 46,236 | At least 4.0 | % | $ | 57,795 | At least 5.0 | % | ||||||||||||||
There are no conditions or events that management believes have changed the Company’s or the Bank’s classification as well-capitalized since December 31, 2010.
18. Parent Company Only Information
Condensed Statements of Financial Condition
(Dollars in thousands)
| December 31, | ||||||||
| 2010 | 2009 | |||||||
| Assets |
||||||||
| Due from banks and interest-bearing deposits with financial institutions |
$ | 5,247 | $ | 7,273 | ||||
| Investment in subsidiaries |
74,636 | 83,249 | ||||||
| Securities available for sale, at fair value |
— | — | ||||||
| Loans (net of allowance of $0 and $0, respectively) |
50 | 50 | ||||||
| Other assets |
1,459 | 1,552 | ||||||
| Total assets |
$ | 81,392 | $ | 92,124 | ||||
| Liabilities and shareholders’ equity |
||||||||
| Liabilities |
$ | 449 | $ | 125 | ||||
| Subordinated debentures |
17,527 | 17,527 | ||||||
| Shareholders’ equity |
63,416 | 74,472 | ||||||
| Total liabilities and shareholders’ equity |
$ | 81,392 | $ | 92,124 | ||||
Condensed Statements of Operations
(Dollars in thousands)
| Year Ended December 31, | ||||||||||||
| 2010 | 2009 | 2008 | ||||||||||
| Interest income |
$ | 113 | $ | 392 | $ | 1,010 | ||||||
| Interest expense |
(522 | ) | (623 | ) | (1,073 | ) | ||||||
| Other expenses |
(1,738 | ) | (264 | ) | (341 | ) | ||||||
| Equity in undistributed earnings of subsidiaries |
(11,807 | ) | (16,813 | ) | (11,562 | ) | ||||||
| Net loss |
$ | (13,954 | ) | $ | (17,308 | ) | $ | (11,966 | ) | |||
106
Table of Contents
PACIFIC MERCANTILE BANCORP AND SUBSIDIARIES
NOTES TO CONSOLIDATED FINANCIAL STATEMENTS—(Continued)
Condensed Statements of Cash Flows
(Dollars in thousands)
| Year Ended December 31, | ||||||||||||
| 2010 | 2009 | 2008 | ||||||||||
| Cash Flows from Operating Activities: |
||||||||||||
| Net loss |
$ | (13,954 | ) | $ | (17,308 | ) | $ | (11,966 | ) | |||
| Adjustments to reconcile net income to net cash provided by (used in) operating activities: |
||||||||||||
| Net amortization of premium on securities |
— | — | — | |||||||||
| Net decrease (increase) in accrued interest receivable |
— | 22 | (17 | ) | ||||||||
| Net (increase) decrease in other assets |
(310 | ) | (343 | ) | 14 | |||||||
| Net increase (decrease) in deferred taxes |
1,087 | (333 | ) | (371 | ) | |||||||
| Stock-based compensation expense |
167 | 299 | 635 | |||||||||
| Undistributed losses of subsidiary |
11,807 | 16,813 | 11,569 | |||||||||
| Net increase (decrease) in interest payable |
395 | (91 | ) | (21 | ) | |||||||
| Net (decrease) increase in other liabilities |
(73 | ) | 72 | — | ||||||||
| Net cash used in operating activities |
(881 | ) | (869 | ) | (157 | ) | ||||||
| Cash Flows from Investing Activities: |
||||||||||||
| Net decrease (increase) in loans |
— | 8,994 | (5,217 | ) | ||||||||
| Principal payments received for investment security available for sale |
— | 45 | 20 | |||||||||
| Net cash provided by (used in) investing activities |
— | 9,039 | (5,197 | ) | ||||||||
| Cash Flows from Financing Activities: |
||||||||||||
| Cash dividends paid |
— | — | (1,049 | ) | ||||||||
| Proceeds from sale of preferred stock |
4,605 | 8,050 | — | |||||||||
| Tax Benefit from exercise of stock options |
— | — | 93 | |||||||||
| Share buyback |
— | — | (517 | ) | ||||||||
| Capital contribution to subsidiaries |
(5,750 | ) | (20,500 | ) | (5,625 | ) | ||||||
| Net cash used in financing activities |
(1,145 | ) | (12,450 | ) | (7,098 | ) | ||||||
| Net decrease in cash and cash equivalents |
(2,026 | ) | (4,280 | ) | (12,452 | ) | ||||||
| Cash and Cash Equivalents, beginning of period |
7,273 | 11,553 | 24,005 | |||||||||
| Cash and Cash Equivalents, end of period |
$ | 5,247 | $ | 7,273 | $ | 11,553 | ||||||
19. Fair Value Measurements
Fair Value Hierarchy. Under ASC 820-10, we group assets and liabilities at fair value in three levels, based on the markets in which the assets and liabilities are traded and the reliability of the assumptions used to determine fair value. These levels are:
| Level 1 | Valuation is based upon quoted prices for identical instruments traded in active markets. | |
| Level 2 | Valuation is based upon quoted prices for similar instruments in active markets, quoted prices for identical or similar instruments in markets that are not active, and model-based valuation techniques for which all significant assumptions are observable in the market. | |
| Level 3 | Valuation is generated from model-based techniques that use at least one significant assumption not observable in the market. These unobservable assumptions reflect estimates of assumptions that market participants would use in pricing the asset or liability. Valuation techniques include use of option pricing models, discounted cash flow models and similar techniques. | |
107
Table of Contents
PACIFIC MERCANTILE BANCORP AND SUBSIDIARIES
NOTES TO CONSOLIDATED FINANCIAL STATEMENTS—(Continued)
19. Fair Value Measurements (Cont-)
The following is a description of valuation methodologies used for assets and liabilities recorded at fair value.
Assets Measured at Fair Value on a Recurring Basis
Investment Securities Available for Sale. Investment securities available-for-sale are recorded at fair value on a recurring basis. Fair value measurement is based upon quoted prices, if available. If quoted prices are not available, fair values are measured using independent pricing models or other model-based valuation techniques such as the present value of future cash flows, adjusted for the security’s credit rating, prepayment assumptions and other factors such as credit loss assumptions. Level 1 investments securities include those traded on an active exchange, such as the New York Stock Exchange, U.S. Treasury securities that are traded by dealers or brokers in active over-the- counter markets and money market funds. Level 2 investment securities include mortgage-backed securities issued by government sponsored entities, municipal bonds and corporate debt securities. Securities classified as Level 3 include asset-backed securities in less liquid markets.
The following table shows the recorded amounts of assets measured at fair value on a recurring basis.
| At December 31, 2010 (Dollars in thousands) |
||||||||||||||||
| Total | Level 1 | Level 2 | Level 3 | |||||||||||||
| Assets at Fair Value on a Recurring Basis: |
||||||||||||||||
| Investment securities available for sale |
$ | 178,301 | $ | 4,250 | $ | 172,808 | $ | 1,243 | ||||||||
The changes in Level 3 assets measured at fair value on a recurring basis are summarized in the following table:
| Investment Securities Available for Sale (Dollars in thousands) |
||||
| Balance of recurring Level 3 instruments at January 1, 2010 |
$ | 4,103 | ||
| Total gains or losses (realized/unrealized): |
||||
| Included in earnings-realized |
— | |||
| Included in earnings-unrealized (1) |
(286 | ) | ||
| Included in other comprehensive income |
2,181 | |||
| Purchases, sales, issuances and settlements, net |
— | |||
| Transfers in and/or out of Level 3 |
(4,755 | ) | ||
| Balance of Level 3 assets at December 31, 2010 |
$ | 1,243 | ||
| (1) | Amount reported as an other than temporary impairment loss in the noninterest income portion of the income statement |
Assets Recorded at Fair Value on a Nonrecurring Basis
The Company may be required, from time to time, to measure certain assets at fair value on a nonrecurring basis in accordance with U.S. generally accepted accounting principles. These include assets that are measured at the lower of cost or market or that were recognized at a fair value below cost at the end of the period.
108
Table of Contents
PACIFIC MERCANTILE BANCORP AND SUBSIDIARIES
NOTES TO CONSOLIDATED FINANCIAL STATEMENTS—(Continued)
19. Fair Value Measurements (Cont-)
Impaired Loans. ASC 820-10 applies to loans measured for impairment in accordance with ASC 310-10, Accounting by Creditors for Impairment of a Loan, including impaired loans measured at an observable market price (if available), and at the fair value of the loan’s collateral (if the loan is collateral dependent). The fair value of an impaired loan is estimated using one of several methods, including collateral value, market value of similar debt, enterprise value, liquidation value and discounted cash flows. Those impaired loans not requiring an allowance for possible losses represent loans for which the fair value of the expected repayments or collateral exceed the recorded investments in such loans. When the fair value of the collateral is based on an observable market price or a current appraised value, we record the impaired loan at Level 2. When an appraised value is not available or management determines the fair value of the collateral is further impaired below the appraised value and there is no observable market price, we record the impaired loan at Level 3.
Foreclosed Assets. Foreclosed assets are adjusted to fair value, less estimated costs to sell, at the time the loans are transferred to foreclosed assets. Subsequently, foreclosed assets are carried at the lower of carrying value or fair value less estimated costs to sell. Fair value is determined based upon independent market prices, appraised values of the collateral or management’s estimation of the value of the collateral. When the fair value of the collateral is based on an observable market price or a current appraised value, we record the foreclosed asset at Level 2. When an appraised value is not available or management determines the fair value of the collateral is further impaired below the appraised value and there is no observable market price, we record the foreclosed asset at Level 3.
Information regarding assets measured at fair value on a nonrecurring basis is set forth in the table below.
| At December 31, 2010 (in thousands) |
||||||||||||||||
| Total | Level 1 | Level 2 | Level 3 | |||||||||||||
| Assets at Fair Value: |
||||||||||||||||
| Loans |
$ | 23,238 | $ | — | $ | 3,792 | $ | 19,446 | ||||||||
| Loans held for sale |
12,469 | — | — | 12,469 | ||||||||||||
| Other assets(1) |
33,170 | — | 33,170 | — | ||||||||||||
| Total |
$ | 68,877 | $ | — | $ | 36,962 | $ | 31,915 | ||||||||
| (1) | Includes foreclosed assets |
There were no transfers in or out of level 3 measurements for nonrecurring items during the twelve months ended December 31, 2010.
We have elected to use fair value measurements to record fair value adjustments to certain assets and liabilities and to determine fair value disclosures. Securities available for sale are recorded at fair value on a recurring basis. Additionally, from time to time, we may be required to record at fair value other assets on a nonrecurring basis, such as loans held for investment and certain other assets. These nonrecurring fair value adjustments typically involve application of lower of cost or market accounting or write-downs of individual assets.
Fair value estimates are made at a discrete point in time based on relevant market information and other information about the financial instruments. Because no active market exists for a significant portion of our financial instruments, fair value estimates are based in large part on judgments we make primarily regarding current economic conditions, risk characteristics of various financial instruments, prepayment rates, and future expected loss experience. These estimates are subjective in nature and invariably involve some inherent uncertainties. Additionally unexpected changes in events or circumstances can occur that could require us to make changes to our assumptions and which, in turn, could significantly affect and require us to make changes to our previous estimates of fair value.
In addition, the fair value estimates are based on existing on and off-balance sheet financial instruments without attempting to estimate the value of existing and anticipated future customer relationships and the value of assets and liabilities that are not considered financial instruments, such as premises and equipment and other real estate owned.
109
Table of Contents
PACIFIC MERCANTILE BANCORP AND SUBSIDIARIES
NOTES TO CONSOLIDATED FINANCIAL STATEMENTS—(Continued)
19. Fair Value Measurements (Cont-)
The following methods and assumptions were used to estimate the fair value of financial instruments.
Cash and Cash Equivalents. The fair value of cash and cash equivalents approximates its carrying value.
Interest-Bearing Deposits with Financial Institutions. The fair values of interest-bearing deposits maturing within ninety days approximate their carrying values.
Investment Securities Available for Sale. Investment securities available-for-sale are recorded at fair value on a recurring basis. Fair value measurement is based upon quoted prices, if available. If quoted prices are not available, fair values are measured using independent pricing models or other model-based valuation techniques such as the present value of future cash flows, adjusted for the security’s credit rating, prepayment assumptions and other factors such as credit loss assumptions. Level 1 securities include those traded on an active exchange, such as the New York Stock Exchange, U.S. Treasury securities that are traded by dealers or brokers in active over-the-counter markets and money market funds. Level 2 securities include mortgage-backed securities issued by government sponsored entities, municipal bonds and corporate debt securities. Securities classified as level 3 include asset-backed securities in less liquid markets.
Federal Home Loan Bank and Federal Reserve Bank Stock. The Bank is a member of the Federal Home Loan Bank (the “FHLB”) and the Federal Reserve Bank of San Francisco (the “FRB”). As members, we are required to own stock of the FHLB and the FRB, the amount of which is based primarily on the level of our borrowings from those institutions. We also have the right to acquire additional shares of stock in either or both of the FHLB and the FRB; however, to date, we have not done so. The fair values of that stock are equal to their respective carrying amounts, are classified as restricted securities and are periodically evaluated for impairment based on our assessment of the ultimate recoverability of our investments in that stock. Any cash or stock dividends paid to us on such stock are reported as income.
Loans Held for Sale. Loans held for sale are carried at the lower of cost or market value. The fair value of loans held for sale is based on what secondary markets are currently offering for portfolios with similar characteristics. As such, the Company classifies loans subjected to nonrecurring fair value adjustments as Level 3. There were no fair value adjustments related to the $12.5 million of loans held for sale at December 31, 2010.
Loans. The fair value for loans with variable interest rates is the carrying amount. The fair value of fixed rate loans is derived by calculating the discounted value of future cash flows expected to be received by the various homogeneous categories of loans. All loans have been adjusted to reflect changes in credit risk.
Impaired Loans. ASC 820-10 applies to loans measured for impairment in accordance with ASC 310-10, “Accounting by Creditors for Impairment of a Loan”, including impaired loans measured at an observable market price (if available), and at the fair value of the loan’s collateral (if the loan is collateral dependent) less selling cost. The fair value of an impaired loan is estimated using one of several methods, including collateral value, market value of similar debt, enterprise value, liquidation value and discounted cash flows. Those impaired loans not requiring an allowance for possible losses represent loans for which the fair value of the expected repayments or collateral exceed the recorded investments in such loans. When the fair value of the collateral is based on an observable market price or a current appraised value, we record the impaired loan at nonrecurring Level 2. When an appraised value is not available, or management determines the fair value of the collateral is further impaired below the appraised value and there is no observable market price or a discounted cash flow has been used to determine the fair value, we record the impaired loan at nonrecurring Level 3.
Foreclosed Assets. Foreclosed assets are adjusted to the lower of cost or fair value, less estimated costs to sell, at the time the loans are transferred to foreclosed assets. Subsequently, foreclosed assets are carried at the lower of carrying value or fair value, less estimated costs to sell. Fair value is determined on the basis of independent market prices, appraised values of the collateral or management’s estimation of the value of the collateral. When the fair value of the collateral is based on an observable market price or a current appraised value, we record the foreclosed asset at nonrecurring Level 2. When an appraised value is not available or management determines the fair value of the collateral is further impaired below the appraised value and there is no observable market price, we record the foreclosed asset at nonrecurring Level 3.
110
Table of Contents
PACIFIC MERCANTILE BANCORP AND SUBSIDIARIES
NOTES TO CONSOLIDATED FINANCIAL STATEMENTS—(Continued)
19. Fair Value Measurements (Cont-)
Deposits. The fair value of demand deposits, savings deposits, and money market deposits is defined as the amounts payable on demand at quarter-end. The fair value of fixed maturity certificates of deposit is estimated based on the discounted value of the future cash flows expected to be paid on the deposits.
Borrowings. The fair value of borrowings is the carrying amount for those borrowings that mature on a daily basis. The fair value of term borrowings is derived by calculating the discounted value of future cash flows expected to be paid out by the Company.
Junior Subordinated Debentures. The fair value of the junior subordinated debentures is defined as the carrying amount. These securities are variable rate in nature and reprice quarterly.
Commitments to Extend Credit and Standby Letters of Credit. The fair value of commitments to extend credit and standby letters of credit, are based on fees currently charged to enter into similar agreements, taking into account the remaining terms of the agreements and the counterparties’ credit standing. These fees were not material in amount either at December 31, 2010, and 2009.
The estimated fair values and related carrying amounts of the Company’s financial instruments are as follows:
| December 31, | ||||||||||||||||
| 2010 | 2009 | |||||||||||||||
| Carrying Amount |
Estimated Fair Value |
Carrying Amount |
Estimated Fair Value |
|||||||||||||
| (Dollars in thousands) | ||||||||||||||||
| Financial Assets: |
||||||||||||||||
| Cash and cash equivalents |
$ | 32,678 | $ | 32,678 | $ | 141,651 | $ | 141,651 | ||||||||
| Interest-bearing deposits with financial institutions |
2,078 | 2,078 | 9,800 | 9,800 | ||||||||||||
| Federal Reserve Bank and Federal Home Loan Bank stock |
12,820 | 12,820 | 14,091 | 14,091 | ||||||||||||
| Securities available for sale |
178,301 | 178,301 | 170,214 | 170,214 | ||||||||||||
| Mortgage loans held for sale |
12,469 | 12,469 | 7,572 | 7,572 | ||||||||||||
| Loans, net |
722,210 | 712,878 | 813,194 | 807,707 | ||||||||||||
| Financial Liabilities: |
||||||||||||||||
| Noninterest bearing deposits |
144,079 | 144,079 | 183,789 | 183,789 | ||||||||||||
| Interest-bearing deposits |
672,147 | 674,264 | 776,649 | 779,924 | ||||||||||||
| Borrowings |
112,000 | 112,763 | 141,003 | 141,443 | ||||||||||||
| Junior subordinated debentures |
17,527 | 17,527 | 17,527 | 17,527 | ||||||||||||
20. Business Segment Information
During the periods presented, the Company only had one material reportable business segment, the commercial banking division.
111
Table of Contents
| ITEM 9. | CHANGES IN AND DISAGREEMENTS WITH ACCOUNTANTS ON ACCOUNTING AND FINANCIAL DISCLOSURES |
Change in Independent Registered Public Accounting Firm
As previously reported by us in a Current Report on Form 8-K dated June 17, 2009, effective on that date the Audit Committee of the Board of Directors (i) dismissed Grant Thornton, LLP (“Grant Thornton “) as the Company’s independent registered public accounting firm, and (ii) approved the appointment and engagement of Squar, Milner, Peterson, Miranda & Williamson, LLP (“Squar Milner”), as the Company’s new independent registered public accounting firm. That Current Report on Form 8-K was filed with the SEC on June 22, 2009.
During the period from January 1, 2007 to the date of the dismissal of Grant Thornton LLP (i) there had been no disagreements between us and Grant Thornton on any matter of accounting principles or practices, financial statement disclosure or auditing scope or procedures which, if not resolved to Grant Thornton’s satisfaction, would have caused it to make reference to the subject matter of the disagreement in connection with its reports and (ii) there were no reportable events as defined in Item 304(a)(1)(v) of Regulation S-K.
The audit reports of Grant Thornton on our consolidated financial statements for fiscal years ended December 31, 2008 and 2007 contained no adverse opinion or disclaimer of opinion, and were not qualified or modified as to uncertainty, audit scope or accounting principles.
We provided Grant Thornton with a copy of the disclosure regarding its dismissal that we included in the above referenced Current Report on Form 8-K and, at our request Grant Thornton furnished us with a letter addressed to the Securities and Exchange Commission stating whether it agreed with the statements that we made in that Current Report relating to Grant Thornton. A copy of Grant Thornton’s letter was attached as Exhibit 16.1 to that Report.
During the period from January 1, 2007 to June 17, 2009 (the date Squar Milner was engaged by us), neither the Company, nor anyone acting on its behalf, consulted with Squar Milner regarding (i) the application of accounting principles to a specified transaction, either completed or proposed, or the type of audit opinion that might be rendered on the Company’s financial statements, or (ii) any of the matters or events set forth in Item 304(a)(2)(ii) of Regulation S–K.
| ITEM 9A(T). | CONTROLS AND PROCEDURES |
Disclosure Controls and Procedures
We maintain disclosure controls and procedures that are designed to ensure that information required to be disclosed in our reports under the Securities Exchange Act of 1934, as amended (the “Exchange Act”) is recorded, processed, summarized and reported within the time periods specified in the rules and forms of the Securities and Exchange Commission (the “SEC”), and that such information is accumulated and communicated to our management, including our Chief Executive Officer and Chief Financial Officer, to allow timely decisions regarding required disclosure. In designing and evaluating our disclosure controls and procedures, our management recognized that any system of controls and procedures, no matter how well designed and operated, can provide only reasonable assurance of achieving the desired control objectives, as ours are designed to do, and management necessarily was required to apply its judgment in evaluating the cost-benefit relationship of possible controls and procedures.
As required by SEC rules, an evaluation was performed under the supervision and with the participation of our Chief Executive Officer and Chief Financial Officer of the effectiveness, as of December 31, 2010, of the Company’s disclosure controls and procedures (as defined in Rule 13a-15(e) under the Exchange Act). Based on that evaluation, our Chief Executive Officer and Chief Financial Officer concluded that, as of December 31, 2010, the Company’s disclosure controls and procedures were effective to provide reasonable assurance that information required to be disclosed in the reports that we file under the Exchange Act is recorded, processed, summarized and reported within the time periods specified in the SEC’s rules and forms and that such information is accumulated and communicated to management, including our Chief Executive Officer and Chief Financial Officer, to allow timely decisions regarding required disclosure.
112
Table of Contents
Internal Control Over Financial Reporting
Management’s Annual Report on Internal Control Over Financial Reporting
Management of Pacific Mercantile Bancorp is responsible for establishing and maintaining adequate internal control over financial reporting as defined in Rules 13a-15(f) and 15d-15(f) under the Securities Exchange Act of 1934. Our internal control over financial reporting is a process designed to provide reasonable assurance regarding the reliability of financial reporting and the preparation of financial statements for external purposes in accordance with accounting principles generally accepted in the United States of America. Internal control over financial reporting includes those written policies and procedures that:
| • | pertain to the maintenance of records that, in reasonable detail, accurately and fairly reflect the transactions and dispositions of our assets; |
| • | provide reasonable assurance that transactions are recorded as necessary to permit preparation of financial statements in accordance with accounting principles generally accepted in the United States of America; |
| • | provide reasonable assurance that our receipts and expenditures are being made only in accordance with authorization of our management and board of directors; and |
| • | provide reasonable assurance regarding prevention or timely detection of unauthorized acquisition, use or disposition of assets that could have a material effect on our consolidated financial statements. |
Internal control over financial reporting includes the controls themselves, monitoring and internal auditing practices and actions taken to correct deficiencies as identified. Because of its inherent limitations, internal control over financial reporting may not prevent or detect misstatements. Also, projections of any evaluation of effectiveness to future periods are subject to the risks that controls may become inadequate because of changes in conditions or because the degree of compliance with the policies or procedures may deteriorate.
Management’s Assessment of Internal Control over Financial Reporting
Our management assessed the effectiveness of the Company’s internal control over financial reporting as of December 31, 2010, based on criteria for effective internal control over financial reporting described in “Internal Control – Integrated Framework” issued by the Committee of Sponsoring Organizations of the Treadway Commission. Management’s assessment included an evaluation of the design and the testing of the operational effectiveness of the Company’s internal control over financial reporting. Management reviewed the results of its assessment with the Audit Committee of our Board of Directors.
Based on that assessment, management determined that, as of December 31, 2010, Pacific Mercantile Bancorp maintained effective internal control over financial reporting.
The foregoing report on internal control over financial reporting shall not be deemed “filed” for purposes of Section 18 of the Exchange Act or otherwise subject to the liabilities of that section.
Section 989G of the Dodd-Frank Act, signed into law in July 2010, permanently exempts smaller reporting companies, such as the Company, and other non-accelerated filers, from Section 404(b) of the Sarbanes-Oxley Act requiring SEC reporting companies to obtain and include in their annual reports on Form 10-K, an attestation report from their independent registered accountants with respect to the effectiveness of their internal control over financial reporting. As a result, no such attestation report is included in this Annual Report.
Changes in Internal Control Over Financial Reporting
There were no changes in our internal control over financial reporting during the quarter ended December 31, 2010 that have materially affected, or are reasonably likely to materially affect, our internal control over financial reporting.
113
Table of Contents
| ITEM 9B. | OTHER INFORMATION |
None.
PART III
| ITEM 10. | DIRECTORS, EXECUTIVE OFFICERS AND CORPORATE GOVERNANCE |
The information required by this Item 10 is hereby incorporated by reference to Pacific Mercantile Bancorp’s definitive proxy statement, expected to be filed with the SEC on or before April 30, 2011.
| ITEM 11. | EXECUTIVE COMPENSATION |
The information required by this Item 11 is hereby incorporated by reference to Pacific Mercantile Bancorp’s definitive proxy statement, expected to be filed with the SEC on or before April 30, 2011.
| ITEM 12. | SECURITY OWNERSHIP OF CERTAIN BENEFICIAL OWNERS AND MANAGEMENT AND RELATED STOCKHOLDER MATTERS |
Except for the information below regarding our equity compensation plans, the information required by Item 12 is incorporated herein by reference from our definitive proxy statement expected to be filed with the SEC on or before April 30, 2011.
The following table provides information relating to our equity compensation plans as of December 31, 2010:
| Column A | Column B | Column C | ||||||||||
| Number of Securities to be Issued on Exercise of Outstanding Options |
Weighted Average Exercise Price of Outstanding Options |
Number of Securities Remaining Available for Future Issuance under Equity Compensation Plans (Excluding Securities Reflected in Column A |
||||||||||
| Equity compensation plans approved by stockholders |
||||||||||||
| Stock option and incentive plans |
1,177,642 | $ | 7.57 | 526,913 | ||||||||
| Equity compensation plans not approved by stockholders |
— | — | — | |||||||||
| 1,177,642 | $ | 7.57 | 526,913 | |||||||||
| ITEM 13. | CERTAIN RELATIONSHIPS AND RELATED TRANSACTIONS, AND DIRECTOR INDEPENDENCE |
The information required by this Item 13 is hereby incorporated by reference to Pacific Mercantile Bancorp’s definitive proxy statement expected to be filed with the SEC on or before April 30, 2011.
| ITEM 14. | PRINCIPAL ACCOUNTANT FEES AND SERVICES |
The information required by this Item 14 is hereby incorporated by reference to Pacific Mercantile Bancorp’s definitive proxy statement expected to be filed with the SEC on or before April 30, 2011.
114
Table of Contents
PART IV
| ITEM 15. | EXHIBITS AND FINANCIAL STATEMENT SCHEDULES |
The following documents are filed as part of this Report:
| (1) | Financial Statements. The Consolidated Financial Statements of Pacific Mercantile Bancorp: See Index to Financial Statements on Page 68 of this Annual Report. |
| (2) | Financial Statement Schedules. No financial statement schedules are included in this Annual Report as such schedules are not required or the information that would be included in such schedules is not material or is otherwise furnished. |
| (3) | Exhibits. See Index to Exhibits, elsewhere in this Report, for a list and description of (i) exhibits previously filed by the Company with the Commission and (ii) the exhibits being filed with this Report. |
115
Table of Contents
Pursuant to the requirements of Section 13 or 15(d) of the Securities Exchange Act of 1934, the registrant has duly caused this report to be signed on its behalf by the undersigned, thereunto duly authorized, on the 31st day of March 2011.
| PACIFIC MERCANTILE BANCORP | ||
| By: | /S/ RAYMOND E. DELLERBA | |
| Raymond E. Dellerba | ||
| President and Chief Executive Officer | ||
POWER OF ATTORNEY
Each person whose signature appears below hereby appoints Raymond E. Dellerba, and Nancy Gray, and each of them individually, to act severally as his or her attorneys-in-fact and agent, with full power and authority, including the power of substitution and resubstitution, to sign and file on his or her behalf and in each capacity stated below, all amendments and/or supplements to this Annual Report on Form 10-K, which amendments or supplements may make changes and additions to this Report as such attorneys-in-fact, or any of them, may deem necessary or appropriate.
Pursuant to the requirements of the Securities Exchange Act of 1934, this Report on Form 10-K has been signed below by the following persons in their respective capacities and on the date or dates indicated below.
| /S/ RAYMOND E. DELLERBA Raymond E. Dellerba |
President, Chief Executive Officer and Director (Principal Executive Officer) |
March 31, 2011 | ||
| /S/ NANCY A. GRAY Nancy A. Gray |
Senior Executive Vice President and Chief Financial Officer (Principal Financial and Principal Accounting Officer) | March 31, 2011 | ||
| /S/ GEORGE H. WELLS George H. Wells |
Chairman of the Board and Director | March 31, 2011 | ||
| /S/ GEORGE L. ARGYROS George L. Argyros |
Director |
March 31, 2011 | ||
| /S/ WARREN T. FINLEY Warren T. Finley |
Director | March 31, 2011 | ||
| /S/ ANDREW M. PHILLIPS Andrew M. Phillips |
Director |
March 31, 2011 | ||
| /s/ GORDON C. RAUSSER, PhD Gordon C. Rausser, PhD |
Director |
March 31, 2011 | ||
| /S/ MATTHEW F. SCHAFNITZ Matthew F. Schafnitz |
Director | March 31, 2011 | ||
| /S/ JOHN THOMAS, M.D. John Thomas, M.D |
Director | March 31, 2011 | ||
| /S/ GARY M. WILLIAMS Gary M. Williams |
Director | March 31, 2011 | ||
S-1
Table of Contents
EXHIBIT INDEX
| Exhibit No. |
Description of Exhibit | |
| 3.1 | Articles of Incorporation of Pacific Mercantile Bancorp(1) | |
| 3.2 | Certificate of Determination of Rights, Preferences, Privileges and Restrictions of Series A Convertible 10% Cumulative Preferred Stock of Pacific Mercantile Bancorp. (Incorporated by reference to Exhibit 3.1 to the Current Report on Form 8-K dated October 6, 2009.) | |
| 3.3 | Pacific Mercantile Bancorp Bylaws, Amended and Restated as of December 17, 2008. (Incorporated by reference to the same numbered exhibit to the Company’s Current Report on Form 8-K dated December 18, 2008.) | |
| 4.1 | Specimen form of Pacific Mercantile Bancorp Common Stock Certificate(1) | |
| 10.8 | Standard Internet Banking System Licensing Agreement, dated as of January 29, 1999, between Q-UP Systems and Pacific Mercantile Bank(1) | |
| 10.9 | ODFI—Originator Agreement for Automated Clearing House Entries, dated as of February 16, 1999, between eFunds Corporation and Pacific Mercantile Bank(2) | |
| 10.10 | Agreement, dated September 15, 1998, between Fiserv Solutions, Inc. and Pacific Mercantile Bank(1) | |
| 10.13 | Commercial Office Building Lease dated February 26, 2001 between Metro Point 13580, Lot Three, a California limited partnership, and Pacific Mercantile Bank. (Incorporated by reference to the same numbered exhibit to the Company’s Annual Report on Form 10-K for the year ended December 31, 2000.) | |
| 10.16 | Office Space Lease dated March 9, 2001 between California State Teachers Retirement System and Pacific Mercantile Bank(3) | |
| 10.17 | Assignment & Assumption of Office Space Lease, dated April 1, 2003, between First National Bank and Pacific Mercantile Bank(4) | |
| 10.18 | Office Space Lease, dated Sept. 14, 2003, between Leonard & Gerald Katz and Pacific Mercantile Bank(5) | |
| 10.19 | Pacific Mercantile Bancorp 2004 Stock Incentive Plan (Incorporated by reference to the same numbered exhibit to the Company’s Annual Report on Form 10-K for the year ended December 31, 2006.) | |
| 10.20 | Employment Agreement between Pacific Mercantile Bank and Raymond E. Dellerba, as amended and restated effective as of January 1, 2007.(6) | |
| 10.21 | Supplemental Retirement Plan established by Pacific Mercantile Bank for Raymond E. Dellerba, as restated for purposes of Section 409A of the Internal Revenue Code as of April 6, 2007.(6) | |
| 10.22 | Pacific Mercantile Bancorp 2008 Equity Incentive Plan. (Incorporated by reference to Appendix A to the Company’s 2008 Definitive Proxy Statement filed with the Commission on April 18, 2008.) | |
| 10.23 | Form of Investment Agreement entered into by the Company with purchasers of its Series A Convertible 10% Cumulative Preferred Stock. (Incorporated by reference to Exhibit 10.1 to the Current Report on Form 8-K dated October 6, 2009.) | |
| 10.24 | Written Agreement dated August 31, 2010 between the Federal Reserve Bank of San Francisco and Pacific Mercantile Bancorp and Pacific Mercantile Bank. (Incorporated by reference to Exhibit 10.1 to the Current Report on Form 8-K dated August 31, 2010.) | |
| 10.25 | Final Order dated August 31, 2010 issued by the California Department of Financial Institutions to Pacific Mercantile Bank. (Incorporated by reference to Exhibit 10.2 to the Current Report on Form 8-K dated August 31, 2010.) | |
| 21 | Subsidiaries of the Company | |
| 23.1 | Consent of Squar, Milner, Peterson, Miranda & Williamson, LLP, Independent Registered Public Accounting Firm | |
| 24.1 | Power of Attorney (contained on the Signature Page of Annual Report) | |
| 31.1 | Certification of Chief Executive Officer pursuant to Section 302 of the Sarbanes-Oxley Act of 2004 | |
| 31.2 | Certification of Chief Financial Officer pursuant to Section 302 of the Sarbanes-Oxley Act of 2004 | |
| 32.1 | Certification of Chief Executive Officer pursuant to Section 906 of the Sarbanes-Oxley Act of 2004 | |
| 32.2 | Certification of Chief Financial Officer pursuant to Section 906 of the Sarbanes-Oxley Act of 2004 | |
E-1
Table of Contents
| (1) | Incorporated by reference to the same numbered exhibit to the Company’s Registration Statement (No. 333-33452) on Form S-1 filed with the Commission on June 14, 2000 (the “S-1 Registration Statement”). |
| (2) | Incorporated by reference to the Exhibit 10.8 to the above referenced S-1 Registration Statement. |
| (3) | Incorporated by reference to Exhibit 10.11 to Registration Statement on Form S-2 (No. 333-110377) filed with the Commission on November 10, 2003 (the “S-2 Registration Statement”). |
| (4) | Incorporated by reference to Exhibit 10.12 to the above referenced S-2 Registration Statement. |
| (5) | Incorporated by reference to Exhibit 10.13 to the above referenced S-2 Registration Statement. |
| (6) | Incorporated by reference to Exhibits 10.1 and 10.2, respectively, to a Current Report on Form 8-K dated April 6, 2007. |
E-2