Attached files
| file | filename |
|---|---|
| EX-99.2 - EX-99.2 - Public Storage | d166816dex992.htm |
| 8-K - 8-K - Public Storage | d166816d8k.htm |

Strategic Acquisition of ezStorage April 2021 Exhibit 99.1
Forward Looking Statements All statements in this presentation, other than statements of historical fact, are “forward-looking statements” within the meaning of Section 27A of the Securities Act of 1933 and Section 21E of the Securities Exchange Act of 1934. All forward-looking statements speak only as of the date of this presentation. These forward-looking statements involve known and unknown risks and uncertainties, which may cause Public Storage’s actual results and performance to be materially different from those expressed or implied in the forward-looking statements. Factors and risks that may impact future results and performance are described from time to time in Public Storage’s filings with the Securities and Exchange Commission, including in Item 1A, “Risk Factors” in Public Storage’s Annual Report on Form 10-K for the fiscal year ended December 31, 2020. These risks include, but are not limited to, the following: general risks associated with the ownership and operation of real estate, including changes in demand, risk related to development, expansion and acquisition of self-storage facilities, potential liability for environmental contamination, natural disasters and adverse changes in laws and regulations governing property tax, real estate and zoning; risks associated with economic downturns in the national and local markets in which we operate; risks associated with the COVID-19 pandemic (the “COVID Pandemic”) or similar events, including negative economic impacts which could reduce the demand for our facilities or increase tenant delinquencies and regulatory actions to close or limit access to our facilities, limit our ability to set rents or limit our ability to collect rent or evict delinquent tenants; the risk that there could be an out-migration of population from our markets which would reduce demand for our facilities; risks related to increased reliance on Google as a customer acquisition channel; risks associated with international operations including, but not limited to, unfavorable foreign currency rate fluctuations and changes in tax laws; the impact of the legal and regulatory environment, as well as national, state and local laws and regulations including, without limitation, those governing environmental issues, taxes, our tenant reinsurance business, and labor; risks due to ballot initiatives or other actions that could remove the protections of Proposition 13 with respect to our real estate and result in substantial increases in our assessed values and property tax bills in California; changes in United States federal or state tax laws related to the taxation of real estate investment trusts (“REITs”) and other corporations; security breaches or a failure of our networks, systems or technology could adversely impact our operations or our business, customer and employee relationships or result in fraudulent payments; risks associated with the self-insurance of certain business risks; and delays and cost overruns on our projects to develop new facilities or expand our existing facilities. Public Storage disclaims any obligation to update publicly or otherwise revise any forward-looking statements, whether as a result of new information, new estimates, or other factors, events or circumstances after the date of this presentation, except where required by law. Non-GAAP Measures This document contains non-GAAP measures, including EBITDA. Non-GAAP measures should not be considered as an alternative to, or more meaningful than, net income (determined in accordance with GAAP) or other GAAP financial measures, as an indicator of financial performance and is not an alternative to, or more meaningful than, cash flow from operating activities (determined in accordance with GAAP) as a measure of liquidity. Non-GAAP measures have limitations as they do not include all items of income and expense that affect operations and, accordingly, should always be considered as supplemental financial results to those presented in accordance with GAAP. In addition, other REITs may compute these measures differently, so comparisons among REITs may not be helpful. Computation of NOI Net operating income or “NOI” is a non-GAAP financial measure that excludes the impact of depreciation and amortization expense, which is based upon historical real estate costs and assumes that building values diminish ratably over time, while we believe that real estate values fluctuate due to market conditions. See our Form 10-K filed with the SEC and our other Exchange Act periodic reports filed with the SEC for reconciliation of NOI to our net income as computed in accordance with GAAP. Additional Information Public Storage has an effective registration statement (including a prospectus) with the SEC relating to offerings of its securities. Before you invest in any offering, you should read the prospectus in that registration statement and other documents Public Storage has filed with the SEC for more complete information about Public Storage and any such offering. You may get these documents for free by visiting EDGAR on the SEC Web site at www.sec.gov. Alternatively, Public Storage will arrange to send such information if you request it by calling toll-free (800) 421-2856. Disclaimer
$1.8 billion ezStorage acquisition will enhance Public Storage’s portfolio scale, quality, and growth Portfolio expands our leading Washington DC, Virginia, and Maryland footprint by nearly 60% Transaction is immediately accretive to NOI and FFO 3.6% nominal cap rate based on historical NOI at 86% occupancy1 4.0% - 4.4% nominal yield expected by year two of Public Storage ownership2 NOI growth and expansion opportunity will provide additional yield beyond year two Transaction benefits enabled by Public Storage’s unique scale, operating platform, development capabilities, and growth-oriented balance sheet Transaction Highlights Landmark Portfolio Accelerating Growth Portfolio of 48 high-quality properties comprising 4.2 million net rentable square feet Properties clustered within desirable, supply-constrained, and superior rent growth submarkets 65% of properties are in high-barrier-to-entry submarkets 8 properties provide opportunity to increase portfolio square footage by 10% by 2023 at 10% stabilized yields Excellent Property Quality Since 2015, Public Storage has funded growth with unsecured debt and free cash flow ezStorage acquisition will be funded with unsecured debt Pro forma leverage of 4.1x debt and preferred equity to EBITDA positions the company for further growth Financing Source: Company filings and ezStorage Purchase price yield based on actual NOI annualized and average occupancy achieved by ezStorage during the fourth quarter of 2020 Purchase price yield based on Direct NOI per Public Storage’s forward-looking underwriting
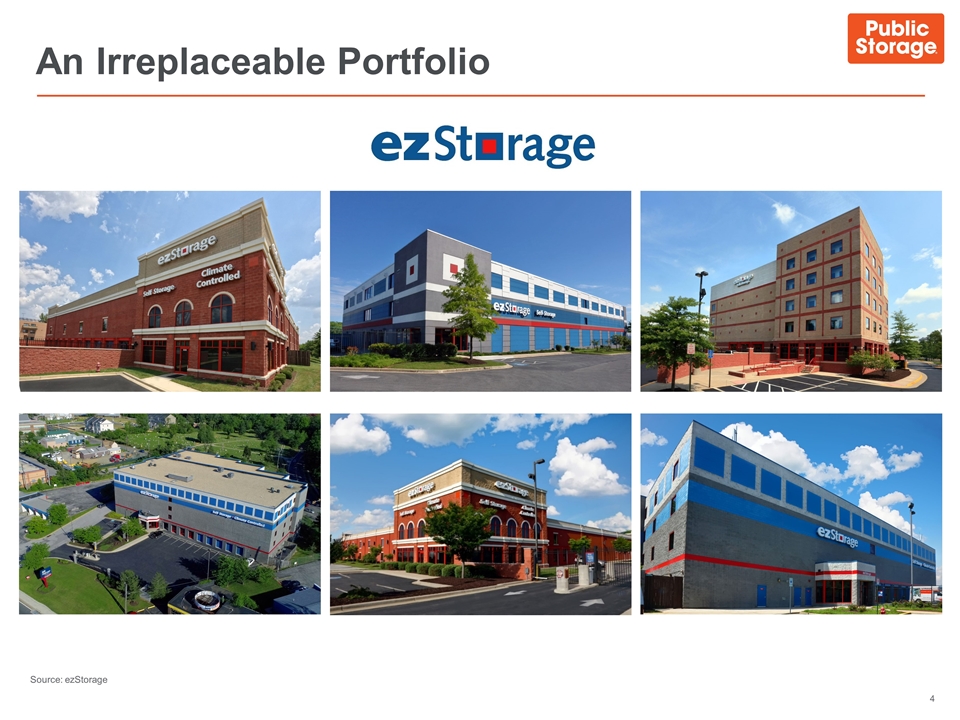
An Irreplaceable Portfolio Source: ezStorage
Complementary to existing Public Storage locations while adding higher barrier submarkets Strong Strategic Merit Source: Company filings and ezStorage ezStorage Strong demographic demand drivers High barriers to entry for new development Submarkets Scale efficiencies and future value creation through development expansion 2nd to Public Storage in local market presence Expansion opportunity within the portfolio Scale Benefits to Public Storage Quality enhancement to existing Mid-Atlantic portfolio One of the highest quality portfolios in the U.S. Quality Immediate NOI and earnings accretion coupled with in-house development execution Commands premium rents and rent growth Rent, occupancy, tenant insurance, cell tower, and solar power income provide upside potential Expansions will increase square footage by 10% Income & Growth
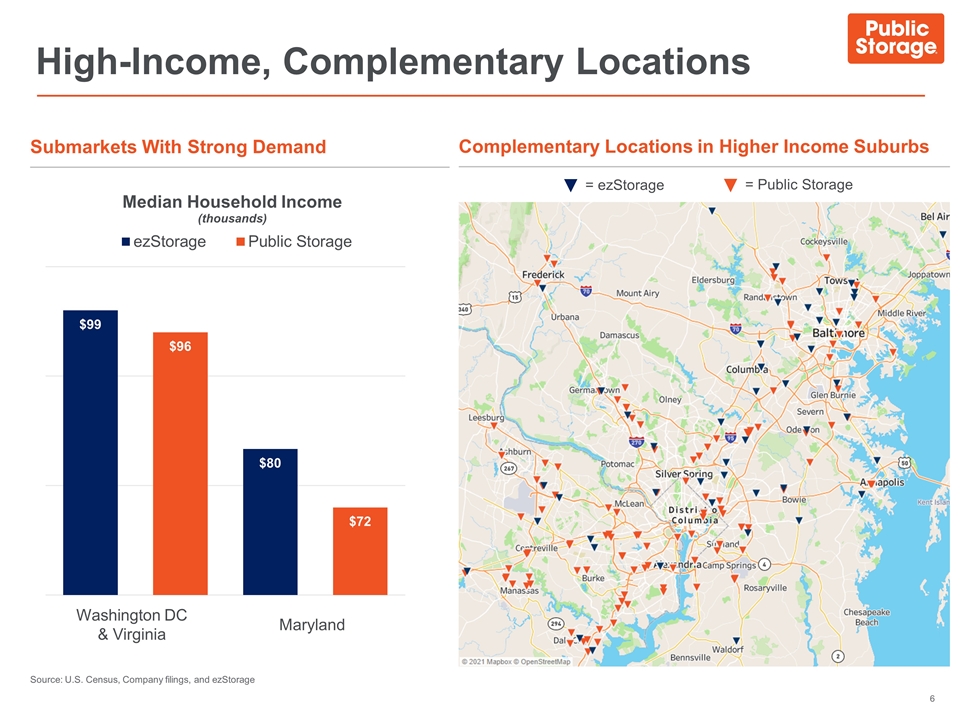
= ezStorage High-Income, Complementary Locations Source: U.S. Census, Company filings, and ezStorage = Public Storage Washington DC & Virginia Maryland Submarkets With Strong Demand Complementary Locations in Higher Income Suburbs
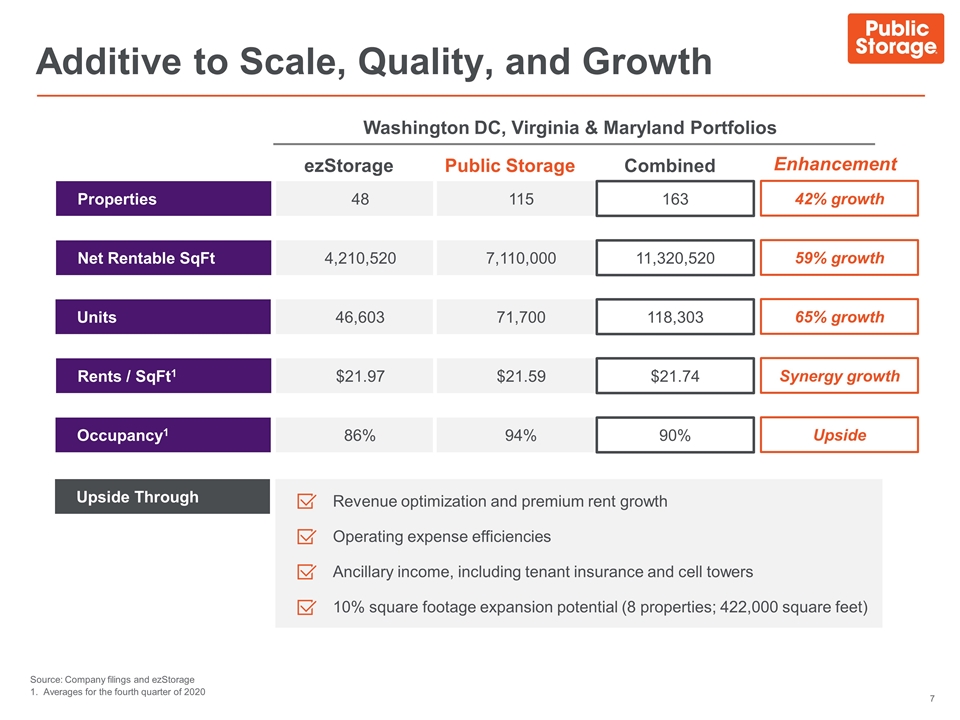
Revenue optimization and premium rent growth Operating expense efficiencies Ancillary income, including tenant insurance and cell towers 10% square footage expansion potential (8 properties; 422,000 square feet) Additive to Scale, Quality, and Growth Source: Company filings and ezStorage 1. Averages for the fourth quarter of 2020 48 Properties 4,210,520 Net Rentable SqFt $21.97 Rents / SqFt1 86% Occupancy1 46,603 Units ezStorage Public Storage 115 7,110,000 71,700 $21.59 94% 163 11,320,520 118,303 $21.74 90% Combined Upside Through Washington DC, Virginia & Maryland Portfolios Enhancement 42% growth 59% growth 65% growth Synergy growth Upside
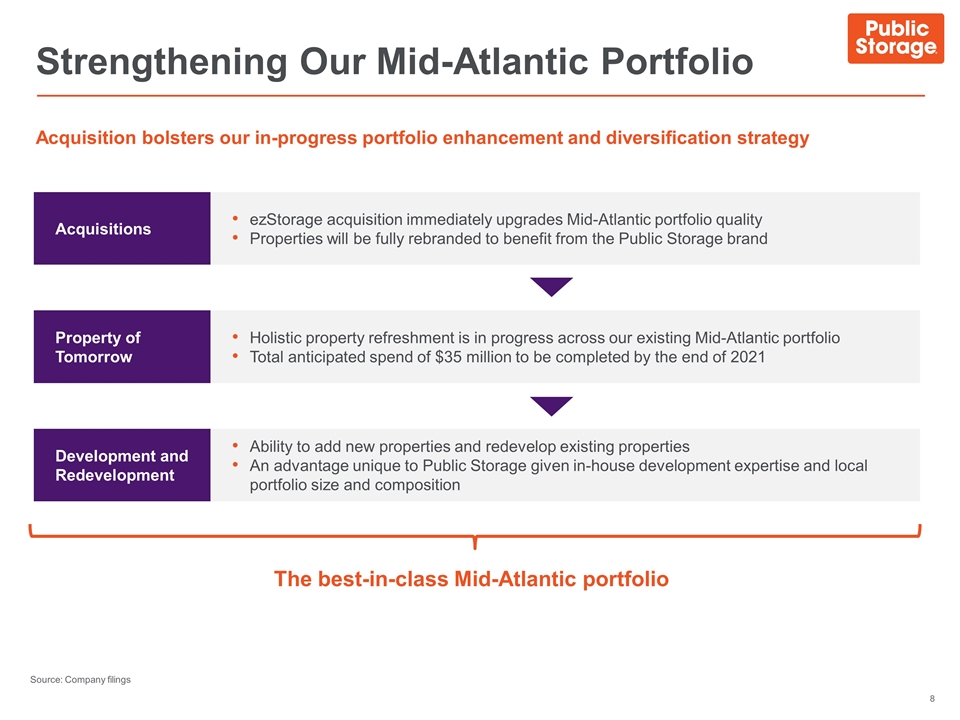
Strengthening Our Mid-Atlantic Portfolio Source: Company filings Acquisition bolsters our in-progress portfolio enhancement and diversification strategy ezStorage acquisition immediately upgrades Mid-Atlantic portfolio quality Properties will be fully rebranded to benefit from the Public Storage brand Acquisitions Holistic property refreshment is in progress across our existing Mid-Atlantic portfolio Total anticipated spend of $35 million to be completed by the end of 2021 Property of Tomorrow Ability to add new properties and redevelop existing properties An advantage unique to Public Storage given in-house development expertise and local portfolio size and composition Development and Redevelopment The best-in-class Mid-Atlantic portfolio
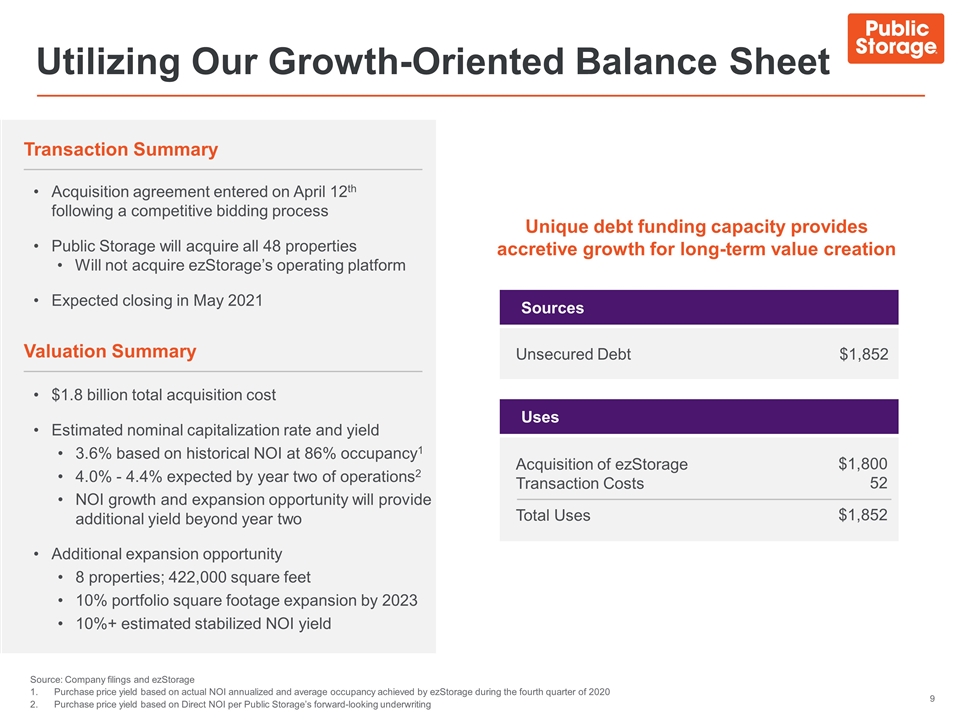
Utilizing Our Growth-Oriented Balance Sheet Transaction Summary Acquisition agreement entered on April 12th following a competitive bidding process Public Storage will acquire all 48 properties Will not acquire ezStorage’s operating platform Expected closing in May 2021 Valuation Summary $1.8 billion total acquisition cost Estimated nominal capitalization rate and yield 3.6% based on historical NOI at 86% occupancy1 4.0% - 4.4% expected by year two of operations2 NOI growth and expansion opportunity will provide additional yield beyond year two Additional expansion opportunity 8 properties; 422,000 square feet 10% portfolio square footage expansion by 2023 10%+ estimated stabilized NOI yield Unsecured Debt Sources $1,852 Acquisition of ezStorage Transaction Costs Total Uses Uses $1,800 52 $1,852 Unique debt funding capacity provides accretive growth for long-term value creation Source: Company filings and ezStorage Purchase price yield based on actual NOI annualized and average occupancy achieved by ezStorage during the fourth quarter of 2020 Purchase price yield based on Direct NOI per Public Storage’s forward-looking underwriting
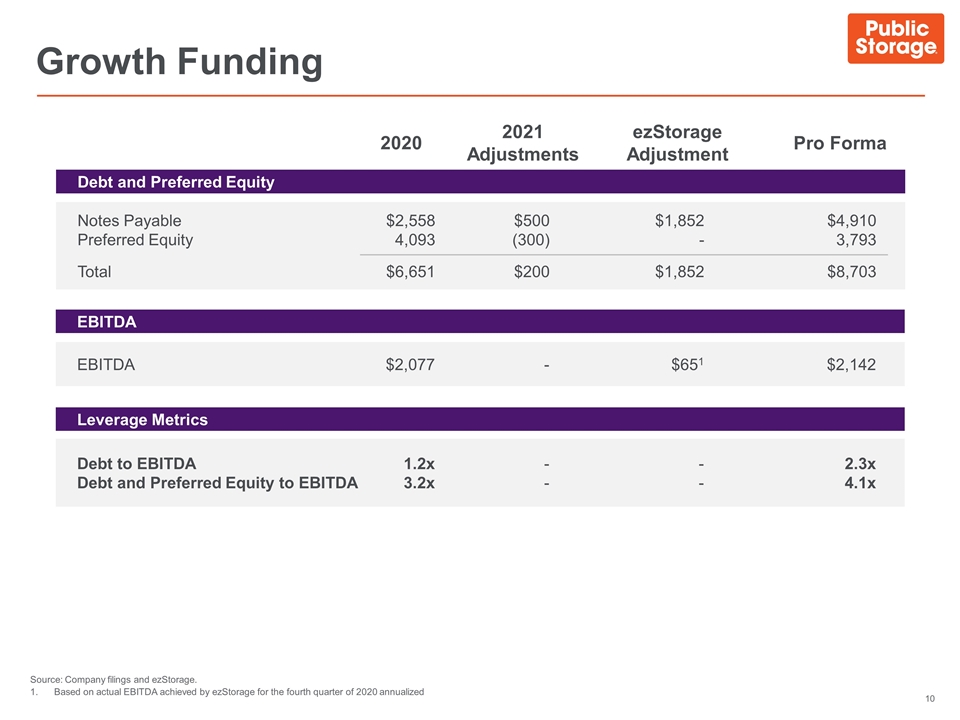
Growth Funding Source: Company filings and ezStorage. Based on actual EBITDA achieved by ezStorage for the fourth quarter of 2020 annualized Notes Payable Preferred Equity Total Debt and Preferred Equity 2020 ezStorage Adjustment Pro Forma $2,558 4,093 $6,651 $1,852 - $1,852 $4,910 3,793 $8,703 EBITDA EBITDA $2,077 $651 $2,142 Leverage Metrics Debt to EBITDA Debt and Preferred Equity to EBITDA 1.2x 3.2x - - 2.3x 4.1x 2021 Adjustments $500 (300) $200 - - -
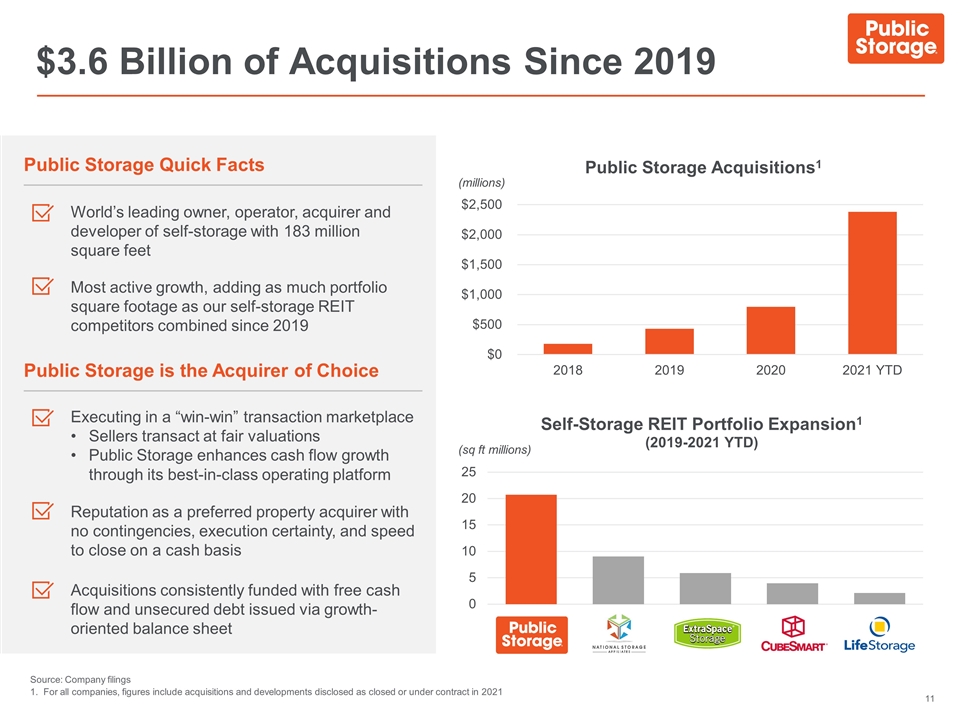
$3.6 Billion of Acquisitions Since 2019 Source: Company filings 1. For all companies, figures include acquisitions and developments disclosed as closed or under contract in 2021 (millions) Public Storage Quick Facts (sq ft millions) World’s leading owner, operator, acquirer and developer of self-storage with 183 million square feet Most active growth, adding as much portfolio square footage as our self-storage REIT competitors combined since 2019 Public Storage is the Acquirer of Choice Executing in a “win-win” transaction marketplace Sellers transact at fair valuations Public Storage enhances cash flow growth through its best-in-class operating platform Reputation as a preferred property acquirer with no contingencies, execution certainty, and speed to close on a cash basis Acquisitions consistently funded with free cash flow and unsecured debt issued via growth-oriented balance sheet
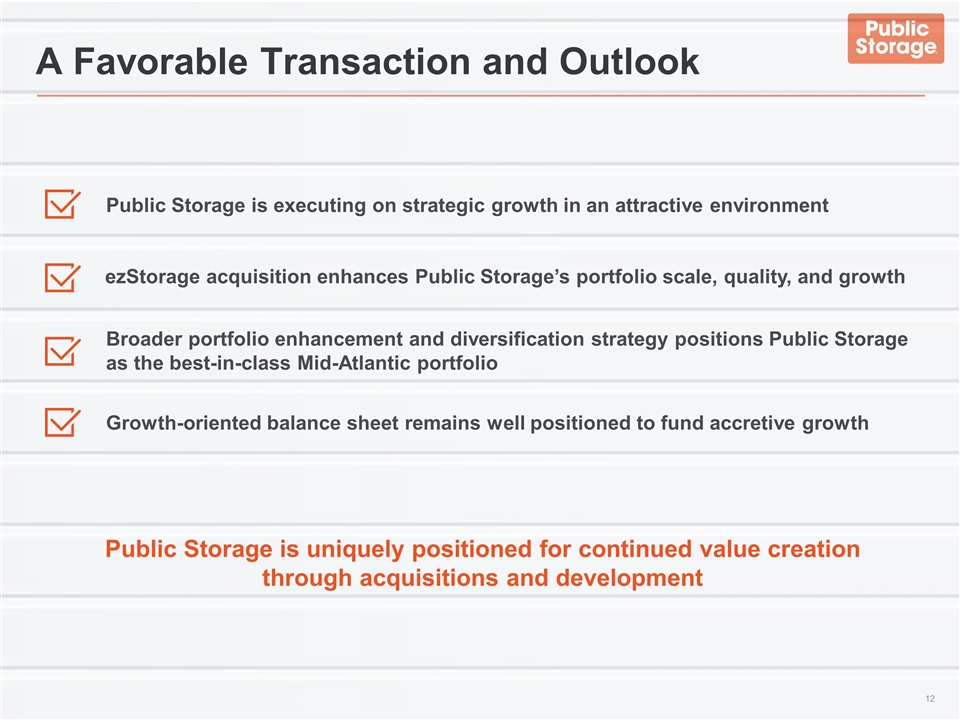
A Favorable Transaction and Outlook Public Storage is executing on strategic growth in an attractive environment ezStorage acquisition enhances Public Storage’s portfolio scale, quality, and growth Growth-oriented balance sheet remains well positioned to fund accretive growth Broader portfolio enhancement and diversification strategy positions Public Storage as the best-in-class Mid-Atlantic portfolio Public Storage is uniquely positioned for continued value creation through acquisitions and development
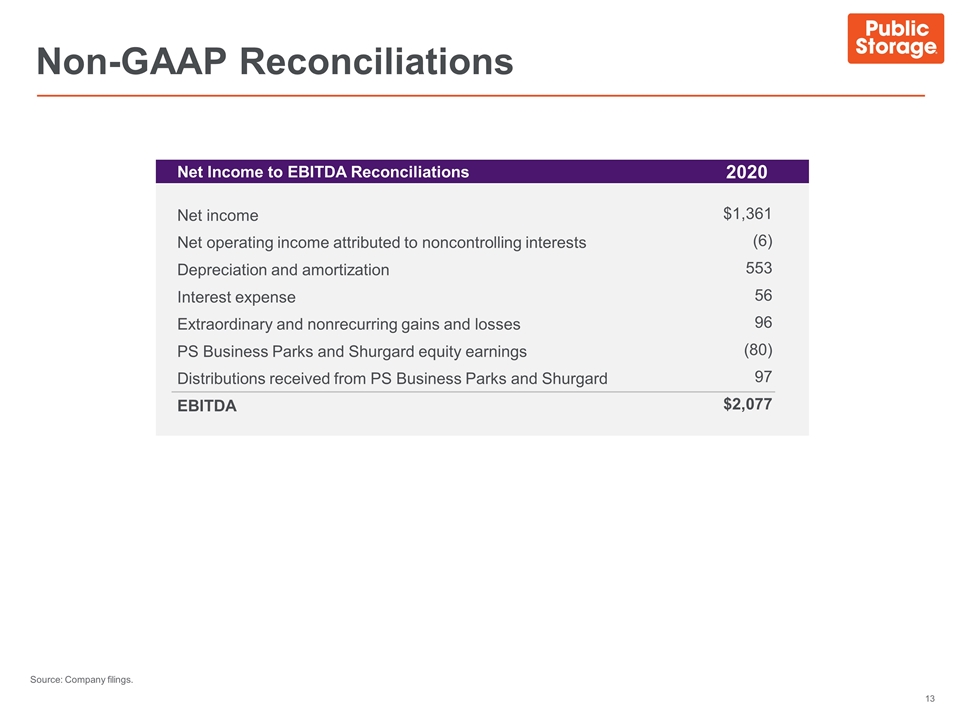
Non-GAAP Reconciliations Net income Net operating income attributed to noncontrolling interests Depreciation and amortization Interest expense Extraordinary and nonrecurring gains and losses PS Business Parks and Shurgard equity earnings Distributions received from PS Business Parks and Shurgard EBITDA Net Income to EBITDA Reconciliations 2020 $1,361 (6) 553 56 96 (80) 97 $2,077 Source: Company filings.
