Attached files
| file | filename |
|---|---|
| EX-99.4 - INVESTOR DAY PRESENTATION (DOHERTY) - QUEST DIAGNOSTICS INC | ss194018_ex9904.htm |
| EX-99.3 - INVESTOR DAY PRESENTATION (DAVIS) - QUEST DIAGNOSTICS INC | ss194018_ex9903.htm |
| EX-99.2 - INVESTOR DAY PRESENTATION (RUSCKOWSKI) - QUEST DIAGNOSTICS INC | ss194018_ex9902.htm |
| EX-99.1 - PRESS RELEASE - QUEST DIAGNOSTICS INC | ss194018_ex9901.htm |
| 8-K - CURRENT REPORT - QUEST DIAGNOSTICS INC | ss194018_8k.htm |
Exhibit 99.5

Quest by the Numbers Mark Guinan Executive Vice President and Chief Financial Officer
SAFE HARBOR DISCLOSURE The statements in the following presentations which are not historical facts may be forward - looking statements . Readers are cautioned not to place undue reliance on forward - looking statements, which speak only as of the date that they are made and which reflect management’s current estimates, projections, expectations or beliefs and which involve risks and uncertainties that could cause actual results and outcomes to be materially different . Risks and uncertainties that may affect the future results of the company include, but are not limited to, impacts of the COVID - 19 pandemic and measures taken in response, adverse results from pending or future government investigations, lawsuits or private actions, the competitive environment, the complexity of billing, reimbursement and revenue recognition for clinical laboratory testing, changes in government regulations, changing relationships with customers, payers, suppliers or strategic partners and other factors discussed in the company's most recently filed Annual Report on Form 10 - K and in any of the company's subsequently filed Quarterly Reports on Form 10 - Q and Current Reports on Form 8 - K, including those discussed in the “Business,” “Risk Factors,” “Cautionary Factors that May Affect Future Results” and “Management’s Discussion and Analysis of Financial Condition and Results of Operations” sections of those reports . The Company continues to believe that the impact of the COVID - 19 pandemic on future operating results, cash flows and/or its financial condition will be primarily driven by : the pandemic’s severity and duration ; healthcare insurer, government and client payer reimbursement rates for COVID - 19 molecular tests ; the pandemic’s impact on the U . S . healthcare system and the U . S . economy ; and the timing, scope and effectiveness of federal, state and local governmental responses to the pandemic which are drivers beyond the Company’s knowledge and control .
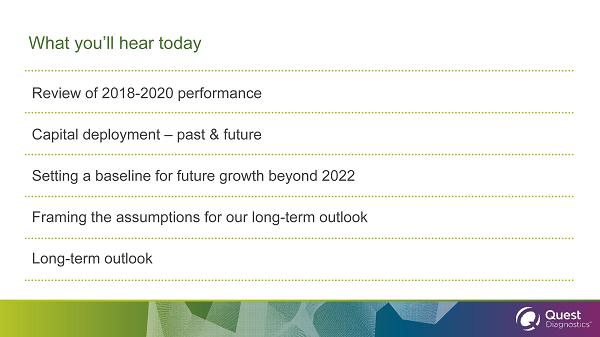
What you’ll hear today Review of 2018 - 2020 performance Capital deployment – past & future Setting a baseline for future growth beyond 2022 Framing the assumptions for our long - term outlook Long - term outlook
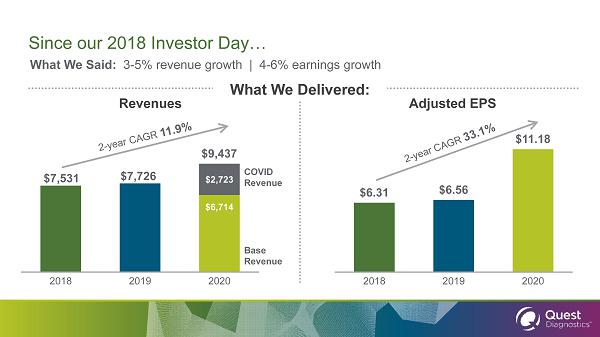
What We Said: 3 - 5% revenue growth | 4 - 6% earnings growth Since our 2018 Investor Day… $7,531 $7,726 $6,714 $2,723 2018 2019 2020 $6.31 $6.56 $11.18 2018 2019 2020 Revenues Adjusted EPS What We Delivered: $9,437 Base Revenue COVID Revenue
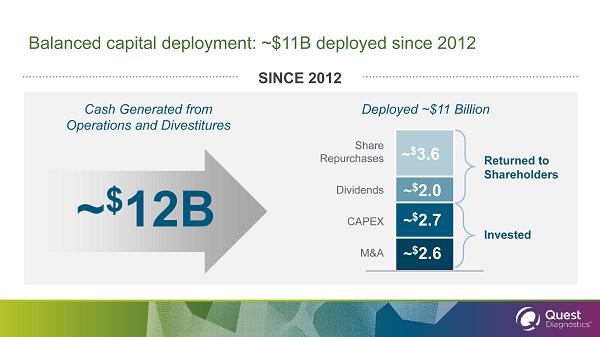
Balanced capital deployment: ~$11B deployed since 2012 ~ $ 2.0 CAPEX Cash Generated from Operations and Divestitures ~ $ 2.6 ~ $ 2.7 ~ $ 3.6 M&A Dividends Share Repurchases Deployed ~$11 Billion Returned to Shareholders Invested SINCE 2012 ~ $ 12B
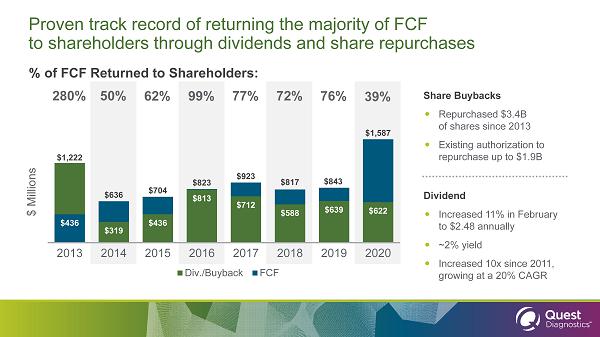
Proven track record of returning the majority of FCF to shareholders through dividends and share repurchases Share Buybacks Repurchased $3.4B of shares since 2013 Existing authorization to repurchase up to $1.9B Dividend Increased 11% in February to $2.48 annually ~2% yield Increased 10x since 2011, growing at a 20% CAGR $436 $319 $436 $813 $712 $588 $639 $622 $1,222 $636 $704 $823 $923 $817 $843 $1,587 2013 2014 2015 2016 2017 2018 2019 2020 Div./Buyback FCF % of FCF Returned to Shareholders: 50% 62% 99% 280% 77% 72% $ Millions 76% 39%
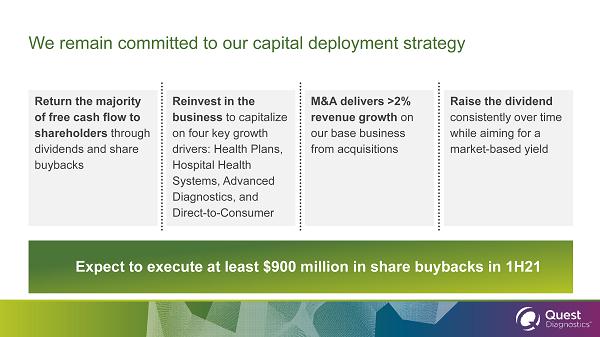
Return the majority of free cash flow to shareholders through dividends and share buybacks M&A delivers >2% revenue growth on our base business from acquisitions Reinvest in the business to capitalize on four key growth drivers: Health Plans, Hospital Health Systems, Advanced Diagnostics, and Direct - to - Consumer Raise the dividend consistently over time while aiming for a market - based yield Expect to execute at least $900 million in share buybacks in 1H21 We remain committed to our capital deployment strategy
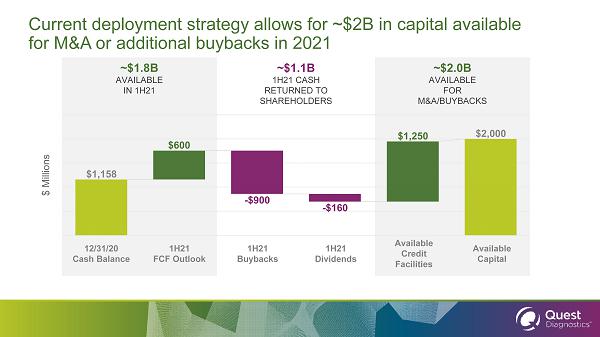
Current deployment strategy allows for ~$2B in capital available for M&A or additional buybacks in 2021 ~$2.0B AVAILABLE FOR M&A/BUYBACKS ~$1.1B 1H21 CASH RETURNED TO SHAREHOLDERS ~$1.8B AVAILABLE IN 1H21 Available Credit Facilities 12/31/20 Cash Balance 1H21 FCF Outlook 1H21 Buybacks 1H21 Dividends Available Capital

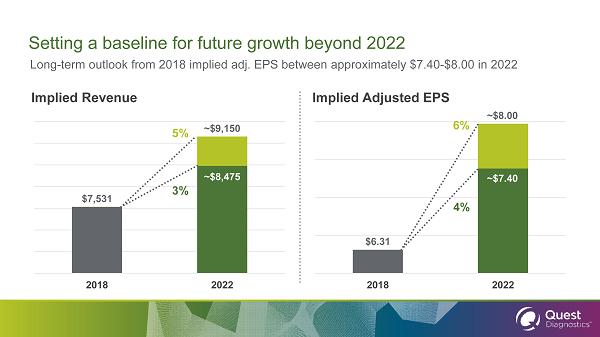
Setting a baseline for future growth beyond 2022 Long - term outlook from 2018 implied adj. EPS between approximately $7.40 - $8.00 in 2022 Implied Revenue Implied Adjusted EPS 2018 2022 2018 2022 3% 5% 4% 6% $7,531 ~$9,150 $6.31 ~$8.00 ~$8,475 ~$7.40
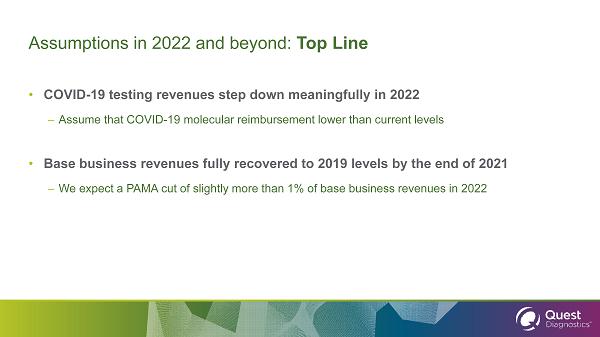
Assumptions in 2022 and beyond: Top Line • COVID - 19 testing revenues step down meaningfully in 2022 – Assume that COVID - 19 molecular reimbursement lower than current levels • Base business revenues fully recovered to 2019 levels by the end of 2021 – We expect a PAMA cut of slightly more than 1% of base business revenues in 2022
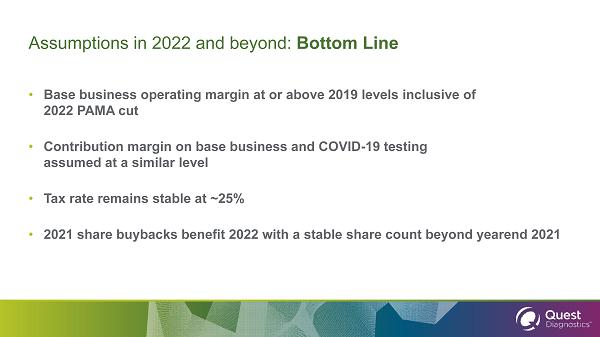
Assumptions in 2022 and beyond: Bottom Line • Base business operating margin at or above 2019 levels inclusive of 2022 PAMA cut • Contribution margin on base business and COVID - 19 testing assumed at a similar level • Tax rate remains stable at ~25% • 2021 share buybacks benefit 2022 with a stable share count beyond yearend 2021
Setting a baseline for future growth beyond 2022 Long - term outlook from 2018 implied adj. EPS between approximately $7.40 - $8.00 in 2022 Implied Revenue Implied Adjusted EPS 2018 2022 2018 2022 3% 5% 4% 6% $7,531 ~$9,150 $6.31 ~$8.00 ~$8,475 ~$7.40
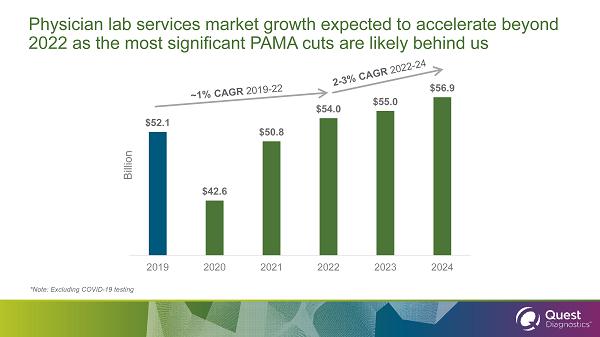
*Note: Excluding COVID - 19 testing Physician lab services market growth expected to accelerate beyond 2022 as the most significant PAMA cuts are likely behind us $52.1 $42.6 $50.8 $54.0 $55.0 $56.9 2019 2020 2021 2022 2023 2024 Billion
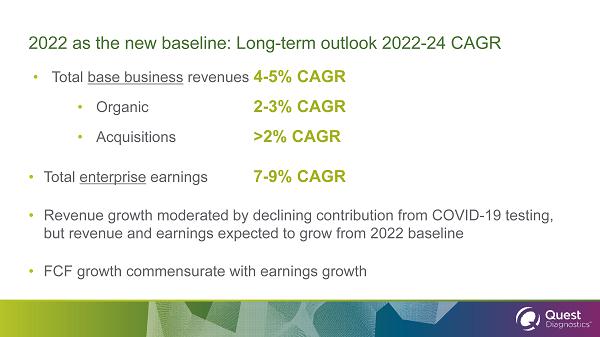
2022 as the new baseline: Long - term outlook 2022 - 24 CAGR • Total base business revenues 4 - 5% CAGR • Organic 2 - 3% CAGR • Acquisitions >2% CAGR • Total enterprise earnings 7 - 9% CAGR • Revenue growth moderated by declining contribution from COVID - 19 testing, but revenue and earnings expected to grow from 2022 baseline • FCF growth commensurate with earnings growth
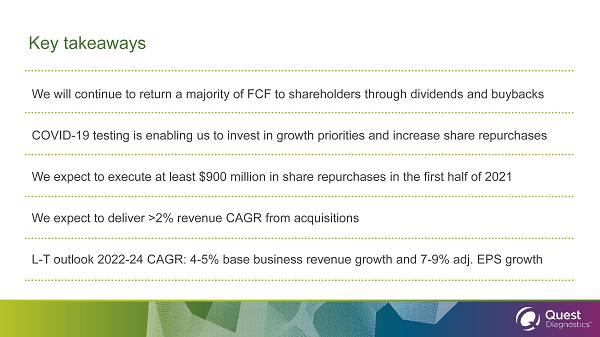
Key takeaways We will continue to return a majority of FCF to shareholders through dividends and buybacks COVID - 19 testing is enabling us to invest in growth priorities and increase share repurchases We expect to execute at least $900 million in share repurchases in the first half of 2021 We expect to deliver >2% revenue CAGR from acquisitions L - T outlook 2022 - 24 CAGR: 4 - 5% base business revenue growth and 7 - 9% adj. EPS growth
Appendix Non - GAAP Reconciliations
Note on Non - GAAP Financial Measures The non-GAAP measures for (i) adjusted diluted EPS from continuing operations, (ii) free cash flow and (iii) contribution margin are presented because management believes those measures are useful adjuncts to measures under the accounting principles generally accepted in the United States (“GAAP”). As used in this presentation the term (i) “adjusted” refers to non-GAAP measures that exclude special items such as restructuring and integration charges, certain financial impacts resulting from the COVID-19 pandemic, amortization expense, excess tax benefit associated with stock-based compensation, a gain on remeasurement of an equity interest, costs associated with donations, contributions and other financial support through Quest for Health Equity, the company's recently announced initiative with the Quest Diagnostics Foundation to reduce health disparities in underserved communities, the gain on the sale and leaseback of a property, and other items; (ii) “free cash flow” refers to operating cash flows less capital expenditures and (iii) “contribution margin” refers to: (a) revenues less direct incremental costs related to such revenues, divided by: (b) such revenues. The company has provided compound annual growth rate projections of 7 - 9% for adjusted diluted EPS and free cash flow, which are non - GAAP measures. The company is unable to present a reconciliation of these non - GAAP measures to the most comparable GAAP measure due to the inherent uncertainty and variability in the nature and amount of special items referenced above. Non - GAAP measures should not be considered as an alternative to the corresponding measures determined under GAAP. Management may use these non - GAAP measures to evaluate our performance period over period and relative to competitors, to analyze the underlying trends in our business, to establish operational budgets and forecasts and for incenti ve compensation purposes. We believe that these non - GAAP measures are useful to investors and analysts to evaluate our performance period over period and relative to competitors, as well as to analyze the underlying trends in our business and t o a ssess our performance. The following tables reconcile reported GAAP measures to non - GAAP measures.
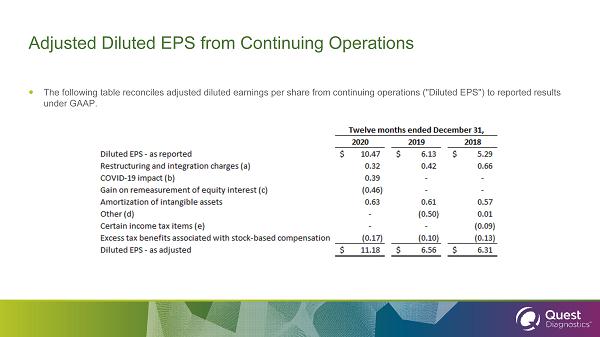
Adjusted Diluted EPS from Continuing Operations The following table reconciles adjusted diluted earnings per share from continuing operations ("Diluted EPS") to reported res ult s under GAAP.
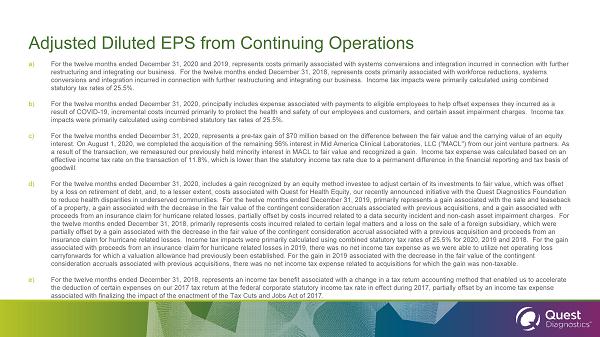
Adjusted Diluted EPS from Continuing Operations a) For the twelve months ended December 31, 2020 and 2019, represents costs primarily associated with systems conversions and in teg ration incurred in connection with further restructuring and integrating our business. For the twelve months ended December 31, 2018, represents costs primarily associate d with workforce reductions, systems conversions and integration incurred in connection with further restructuring and integrating our business. Income tax impacts were primarily calculated using combined statutory tax rates of 25.5%. b) For the twelve months ended December 31, 2020, principally includes expense associated with payments to eligible employees to he lp offset expenses they incurred as a result of COVID - 19, incremental costs incurred primarily to protect the health and safety of our employees and customers, and ce rtain asset impairment charges. Income tax impacts were primarily calculated using combined statutory tax rates of 25.5%. c) For the twelve months ended December 31, 2020, represents a pre - tax gain of $70 million based on the difference between the fair value and the carrying value of an equity interest. On August 1, 2020, we completed the acquisition of the remaining 56% interest in Mid America Clinical Laboratories, LL C ("MACL") from our joint venture partners. As a result of the transaction, we remeasured our previously held minority interest in MACL to fair value and recognized a gain. I ncome tax expense was calculated based on an effective income tax rate on the transaction of 11.8%, which is lower than the statutory income tax rate due to a permanent d iff erence in the financial reporting and tax basis of goodwill. d) For the twelve months ended December 31, 2020, includes a gain recognized by an equity method investee to adjust certain of its investments to fair value, which was offset by a loss on retirement of debt, and, to a lesser extent, costs associated with Quest for Health Equity, our recently announc ed initiative with the Quest Diagnostics Foundation to reduce health disparities in underserved communities. For the twelve months ended December 31, 2019, primarily represents a gain associated with the sale and leaseback of a property, a gain associated with the decrease in the fair value of the contingent consideration accruals associated with pr evious acquisitions, and a gain associated with proceeds from an insurance claim for hurricane related losses, partially offset by costs incurred related to a data security inc ident and non - cash asset impairment charges. For the twelve months ended December 31, 2018, primarily represents costs incurred related to certain legal matters and a loss on th e sale of a foreign subsidiary, which were partially offset by a gain associated with the decrease in the fair value of the contingent consideration accrual associated wit h a previous acquisition and proceeds from an insurance claim for hurricane related losses. Income tax impacts were primarily calculated using combined statutory tax rates o f 25.5% for 2020, 2019 and 2018. For the gain associated with proceeds from an insurance claim for hurricane related losses in 2019, there was no net income tax expense as we were able to utilize net operating loss carryforwards for which a valuation allowance had previously been established. For the gain in 2019 associated with the decre ase in the fair value of the contingent consideration accruals associated with previous acquisitions, there was no net income tax expense related to acquisitions for wh ich the gain was non - taxable. e) For the twelve months ended December 31, 2018, represents an income tax benefit associated with a change in a tax return acco unt ing method that enabled us to accelerate the deduction of certain expenses on our 2017 tax return at the federal corporate statutory income tax rate in effect during 201 7, partially offset by an income tax expense associated with finalizing the impact of the enactment of the Tax Cuts and Jobs Act of 2017.
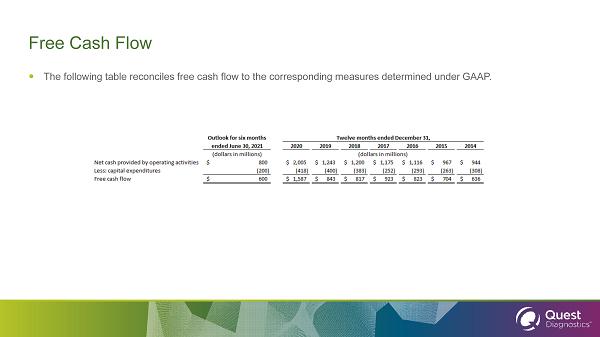
Free Cash Flow The following table reconciles free cash flow to the corresponding measures determined under GAAP.