Attached files
| file | filename |
|---|---|
| EX-99.2 - WSFS FINANCIAL CORP | e21110_ex99-2.htm |
| 8-K - WSFS FINANCIAL CORP | e21110_wsfs-8k.htm |
Exhibit 99.1

• The Premier Bank and Wealth Management Franchise in the Mid - Atlantic Region • March 10, 2021

2 2 Disclaimer Important Additional Information will be Filed with the SEC: This presentation does not constitute an offer to sell or the solicitation of an offer to buy any securities or a solicitatio n of any vote or approval with respect to the proposed acquisition by WSFS Financial Corporation (“WSFS”) of Bryn Mawr Bank Cor por ation (“Bryn Mawr” or “BMBC”). No offer of securities shall be made except by means of a prospectus meeting the requirements of the Se curities Act of 1933, as amended, and no offer to sell or solicitation of an offer to buy shall be made in any jurisdiction i n w hich such offer, solicitation or sale would be unlawful prior to registration or qualification under the securities laws of any such jurisdict ion . In connection with the proposed transaction, WSFS will file with the U.S. Securities and Exchange Commission (the “SEC”) a Re gi stration Statement on Form S - 4 that will include a joint proxy statement of WSFS and Bryn Mawr and a prospectus of WSFS (the “Joint Proxy/Prospectus”), and each of WSFS and Bryn Mawr may file with the SEC other relevant documents concerning the propo sed transaction. The definitive Joint Proxy/Prospectus will be mailed to stockholders of WSFS and Bryn Mawr. STOCKHOLDERS ARE URG ED TO READ THE REGISTRATION STATEMENT AND THE JOINT PROXY/PROSPECTUS REGARDING THE PROPOSED TRANSACTION CAREFULLY AND IN THEIR ENTIRETY WHE N THEY BECOME AVAILABLE AND ANY OTHER RELEVANT DOCUMENTS FILED WITH THE SEC BY WSFS AND BRYN MAWR, AS WELL AS ANY AMENDMENTS OR SUPPLEMENTS TO THOSE DOCUMENTS, BECAUSE THEY WILL CONTAIN IMPORTANT INFORMATION ABOUT WSFS, BRYN MA WR AND THE PROPOSED TRANSACTION. Free copies of the Registration Statement and the Joint Proxy/Prospectus, as well as other filings containing information abo ut WSFS and Bryn Mawr, may be obtained at the SEC’s website (http://www.sec.gov) when they are filed. You will also be able to obtain these documents, when they are filed, free of charge, by directing a request to WSFS Financial Corporation, WSFS Bank Cen ter, 500 Delaware Avenue, Wilmington, Delaware 19801 or by directing a request to Bryn Mawr Bank Corporation, 801 Lancaster A ven ue, Bryn Mawr, Pennsylvania 19010. Participants in the Solicitation: WSFS, Bryn Mawr and certain of their respective directors and executive officers may be deemed to be participants in the soli cit ation of proxies from the stockholders of WSFS or Bryn Mawr in respect of the proposed transaction. Information about WSFS’s directors and executive officers is available in its proxy statement for its 2020 annual meeting of stockholders, which was f ile d with the SEC on March 23, 2020, and other documents filed by WSFS with the SEC. Information regarding Bryn Mawr’s directors and executive officers is available in its proxy statement for its 2020 annual meeting of stockholders, which was filed with the SEC on March 6, 2020, and other documents filed by Bryn Mawr with the SEC. Information regarding the persons who may, under the rules of the SEC, be de em ed participants in the proxy solicitation and a description of their direct and indirect interests, by security holdings or otherwise, will be c ont ained in the Joint Proxy/Prospectus and other relevant materials to be filed with the SEC when they become available. Free co pie s of this document may be obtained as described in the preceding paragraph. Forward Looking Statements: This presentation contains estimates, predictions, opinions, projections and other “forward - looking statements” as that phrase i s defined in the Private Securities Litigation Reform Act of 1995. Forward - looking statements include, without limitation, statements relating to the impact WSFS and Bryn Mawr expect their proposed merger to have on the combined entity’s operations , f inancial condition, and financial results, and WSFS’s and Bryn Mawr’s expectations about their ability to successfully integrate their respective businesses and the amount of cost savings and overall operational efficiencies WSFS and Bryn Mawr expect to realize as a resu lt of the proposed acquisition. The forward - looking statements also include predications or expectations of future business or fina ncial performance as well as goals and objectives for future operations, financial and business trends, business prospects, and management's outlo ok or expectations for earnings, revenues, expenses, capital levels, liquidity levels, asset quality or other future financial o r b usiness performance, strategies or expectations. The words “believe,” “intend,” “expect,” “anticipate,” “strategy,” “plan,” “estimate,” “approxima tel y,” “target,” “project,” “propose,” “possible,” “potential,” “should” and similar expressions, among others, generally identi fy forward - looking statements. Such forward - looking statements are based on various assumptions (many of which are beyond the control of WSFS and B ryn Mawr) and are subject to risks and uncertainties (which change over time) and other factors which could cause actual resu lts to differ materially from those currently anticipated. Such risks and uncertainties include, but are not limited to, the possibility th at the proposed acquisition does not close when expected or at all because required regulatory, stockholder or other approvals a nd other conditions to closing are not received or satisfied on a timely basis or at all; the delay in or failure to close for any other reason; changes in WSF S’s share price before closing; the outcome of any legal proceedings that may be instituted against WSFS or Bryn Mawr; the oc cur rence of any event, change or other circumstance that could give rise to the right of one or both parties to terminate the merger agreement providing fo r t he merger; the risk that the businesses of WSFS and Bryn Mawr will not be integrated successfully; the possibility that the c ost savings and any synergies or other anticipated benefits from the proposed acquisition may not be fully realized or may take longer to realize th an expected; disruption from the proposed acquisition making it more difficult to maintain relationships with employees, cust ome rs or other parties with whom WSFS or Bryn Mawr have business relationships; diversion of management time on merger - related issues; risks relating t o the potential dilutive effect of the shares of WSFS common stock to be issued in the proposed transaction; the reaction to the proposed transaction of the companies’ customers, employees and counterparties; uncertainty as to the extent of the duration, scope, a nd impacts of the COVID - 19 pandemic on WSFS, Bryn Mawr and the proposed transaction; and other factors, many of which are beyond th e control of WSFS and Bryn Mawr. We refer you to the “Risk Factors” and “Management’s Discussion and Analysis of Financial Condition and R esu lts of Operations” sections of WSFS’s Annual Report on Form 10 - K for the year ended December 31, 2020, Bryn Mawr’s Annual Report on Form 10 - K for the year ended December 31, 2020 and any updates to those risk factors set forth in WSFS’s and Bryn Mawr’s Quarterly Reports on Form 10 - Q, Current Reports on Form 8 - K and other filings, which have been filed by WSFS and Bryn Mawr with the SEC and are available on the SEC’s website at www.sec.gov. All forward - looking statements, expressed or implied, included herein are expressly qualifi ed in their entirety by the cautionary statements contained or referred to herein. The actual results or developments anticip ate d may not be realized or, even if substantially realized, they may not have the expected consequences to or effects on WSFS, Bryn Mawr or their res pec tive businesses or operations. We caution readers not to place undue reliance on any such forward - looking statements, which spea k only as of the date on which they are made. Neither WSFS nor Bryn Mawr undertakes any obligation, and specifically declines any obligation, to revise or update any forward - looking statements, whether as a result of new information, future developments or otherwise, excep t as specifically required by law. Non - GAAP Financial Measures: This presentation contains financial measures determined by methods other than in accordance with accounting principles gener all y accepted in the United States (“GAAP”). This non - GAAP data should be considered in addition to results prepared in accordance with GAAP, and is not a substitute for, or superior to, GAAP results. For more information, see the Appendix.

3 Combination of Two High - Performing Franchises 3 Building Scale – Combines two high - performing franchises into the preeminent, locally - headquartered bank in the Greater Philadelphia and Delaware Region Premier Wealth Management Franchise – Creates the region’s largest bank - affiliated wealth management business; 6 th largest 3 among full - service banks under $100 billion in assets nationwide Accelerates Delivery and Talent Transformation – Greater scale to leverage existing investments and enhance long - term initiatives Substantial Cost Synergies – Branch and office optimization, reduction in administrative costs, and overlapping media market opportunities $3.55B Market Cap 2 $12.6B Net Loans $43B AUM / AUA 4 $19.8B Assets $16.2B Total Deposits 29% Core Fee % 1 Amounts are pro forma as of December 31, 2020; core fee revenue percentage is a non - GAAP financial measure for the year ended D ecember 31, 2020, see appendix for reconciliation to GAAP 2 Market capitalization is as of market close on March 9, 2021 3 Ranked by gross revenue from fiduciary activities for FY2020; Source: S&P Global Market Intelligence 4 Assets under management (AUM) and Assets under administration (AUA) 5 Peer group includes 53 public banks nationwide with assets between $10B and $30B based on publicly available 2022 consensus e st imates Combined Franchise Metrics 1 High - Performing Financials – Continued top - quintile ROA of 1.30% 5 with significant upside performance not included in the transaction model

4 Strengthens our unique market position between the larger out - of - market banks and smaller community banks in the 4 th largest depository MSA in the country 1 1 FDIC and S&P Global Market Intelligence. Market Share data excludes brokered deposits, credit unions, and non - traditional banks (e.g., credit card companies); as of June 30, 2020. Philadelphia - Camden - Wilmington MSA (includes Cecil County, MD) Strong Market Position, Poised for Organic Growth Philadelphia - Wilmington - Camden MSA Deposits¹ Net DepositsMarket ($M) Share 1 Wells Fargo $35,311 16.7% 2 TD Bank $32,871 15.6% 3 Bank of America $22,412 10.6% 4 PNC Bank $20,752 9.8% 5 Citizens Bank $19,346 9.2% - PRO FORMA $13,761 6.5% 6 M & T Bank $10,891 5.2% 7 WSFS $9,680 4.6% 8 Santander Bank $6,966 3.3% 9 Truist Bank $5,852 2.8% 10 Univest Bank and Trust $4,317 2.0% 11 BMT $4,081 1.9% Market Total $211,002 Rank
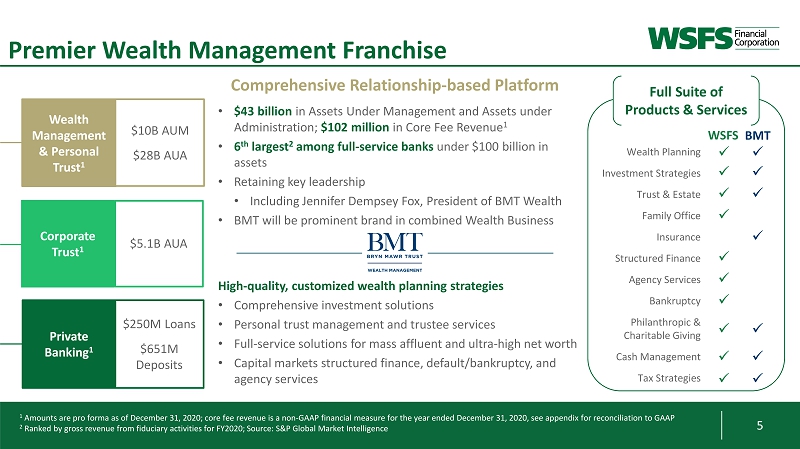
5 Wealth Planning Investment Strategies Trust & Estate Family Office Insurance Structured Finance Agency Services Bankruptcy Philanthropic & Charitable Giving Cash Management Tax Strategies Premier Wealth Management Franchise 5 Comprehensive Relationship - based Platform • $43 billion in Assets Under Management and Assets under Administration; $102 million in Core Fee Revenue 1 • 6 th largest 2 among full - service banks under $100 billion in assets • Retaining key leadership • Including Jennifer Dempsey Fox, President of BMT Wealth • BMT will be prominent brand in combined Wealth Business $5.1B AUA Corporate Trust 1 $10B AUM $28B AUA Wealth Management & Personal Trust 1 $250M Loans $651M Deposits Private Banking 1 1 Amounts are pro forma as of December 31, 2020; core fee revenue is a non - GAAP financial measure for the year ended December 31, 2020, see appendix for reconciliation to GAAP 2 Ranked by gross revenue from fiduciary activities for FY2020; Source: S&P Global Market Intelligence x x x x x x x WSFS Full Suite of Products & Services x x x x x x BMT x High - quality, customized wealth planning strategies • Comprehensive investment solutions • Personal trust management and trustee services • Full - service solutions for mass affluent and ultra - high net worth • Capital markets structured finance, default/bankruptcy, and agency services x x x

6 6 Summary of Transaction Terms Structure • BMBC to merge with and into WSFS • 100% stock consideration Implied Transaction Value • Implied value of $48.55 per share • Aggregate transaction value of $976.4 million • Market premium of 16.0% 1 Exchange Ratio and Ownership • Fixed exchange of 0.90 shares of WSFS common stock for each share of BMBC common stock outstanding • Implied BMBC ownership of approximately 27% Financial Impact² • Strong EPS accretion of 6.7% in Year 1; 13.4% Year 2 • 6.1% TBV Dilution; Earn - back of 3.2 years or 2.8 years excluding Wealth Customer list intangible • Internal Rate of Return of 18% Governance • BMBC CEO, Frank Leto, and two BMBC Directors (TBD) to join the WSFS Board of Directors • Key BMBC management to support WSFS in ensuring a successful integration and client continuity Approvals and Closing • Customary regulatory and stockholder approvals for both WSFS and BMBC • Anticipated closing in early fourth quarter of 2021 Community • Additional $2 million grant to WSFS Foundation to support underserved communities as part of its mission 1 Based on WSFS and BMTC 20 - day trailing average as of market close on March 9, 2021 2 Includes full phase - in of cost savings and full impact of one - time merger expense for illustrative purposes. Includes the estim ated impact of purchase accounting and the inclusion of the CECL ‘double count’, see appendix for more information

7 CET1 Ratio at Closing 11.63% Total Capital Ratio 14.15% ACL Coverage 2.26% • $127 million of pre - tax one - time merger related expenses • Approximately $73 million of annual cost savings • Represents approximately 45% of BMBC operating expenses, based on current consensus street estimates • 65% realized Year 1, 100% realized Year 2 • Expected reduction in total branch count by approximately 30% • Day 1 Balance Sheet marks detailed on slide 15 • No ACL Reserve releases assumed • Significant revenue synergies are not included in the transaction model 7 Compelling and Attractive Pro Forma Financial Impact 1 Includes full impact of one - time merger expenses; pro forma at closing, including the estimated impact of purchase accounting an d the inclusion of the CECL ‘double count’, see appendix for more information 2 Based on market close price as of March 9, 2021 3 Based on WSFS and BMTC 20 - day trailing average as of market close on March 9, 2021 Key Synergies & Assumptions 6.1% TBV Share Dilution 1 3.2yrs TBV Earn - back 1 18.0% IRR Key Financial Metrics Additional Metrics Earn - back 1 of 2.8 years excluding Wealth Customer list intangible resulting from significant AUM/AUA and strong revenue generation 13.4% Year 2 EPS Accretion 6.7% Year 1 EPS Accretion Capital Positions Price/TBV 229% 2 Price/2022 EPS 16.8X 2 Market Premium 16.0% 3 Transaction Price

8 8 Continued Sustainable High Performance 2022E ROATCE 1 Peer group includes 53 public banks nationwide with assets between $10B and $30B based on publicly available 2022 consensus e sti mates. WSFS financial data is pro forma for current transaction and illustratively assumes 100% phase - in of cost savings in 2022, Year 1 of the transaction Source: S&P Global Market Intelligence 31.3% 21.6% Peer Median 1.3% 1.0% Peer Median 15.04% 11.6% Peer Median Combined Franchise Results in a Top - quintile Performance Among National Peers 1 2022E Fee Revenue % 2022E ROAA

9 Cash Connect 17% Mortgage 15% Wealth 41% Banking 27% Mortgage 10% Wealth 66% Banking 24% Cash Connect 24% Mortgage 18% Wealth 29% Banking 29% Net Interest Income 71% Core Fee Revenue 29% Net Interest Income 64% Core Fee Revenue 36% Net Interest Income 73% Core Fee Revenue 27% Resilient and Diversified Core Fee Revenue 9 1 Amounts are pro forma as of December 31, 2020; core fee revenue is a non - GAAP financial measure for the year ended December 31, 2020, see appendix for reconciliation to GAAP Core Net Revenue 1 Core Fee Revenue 1 $635M $223M $858M $169M $80M $249M WSFS – FY 2020 BMT – FY 2020 PRO FORMA – FY 2020 20+ Discrete lines of business and products

10 C&I 37% CRE 27% Construction 7% PPP 6% Residential 12% Consumer 11% Noninterest DDA 30% Interest DDA 22% Money Market & Savings 36% Time 9% Other 3% Noninterest DDA 29% Interest DDA 22% Money Market & Savings 37% Time 10% Other 2% $11.9B C&I 38% CRE 23% Construction 8% PPP 8% Residential 10% Consumer 13% C&I 32% CRE 40% Construction 4% Residential 18% Consumer 6% Noninterest DDA 32% Interest DDA 20% Money Market & Savings 33% Time 8% Other 7% WSFS – FY 2020 BMT – FY 2020 PRO FORMA – FY 2020 10 $9.2B $3.6B $12.9B $4.4B $16.2B 1 Loan yield is on the average balance for the year ended December 31, 2020 2 C&I includes Owner Occupied and Small Business; Consumer includes HELOCs 3 Deposit cost is on the average balance for the quarter ended December 31, 2020; excludes brokered deposits Loan Yield 1 Loan Composition 2 Deposit Cost 3 Deposit Composition 5.03% 4.16% 4.78% 0.16% 0.20% 54% low/no - cost Customer deposits Relationship - Based Loan and Deposit Franchise 0.21%

11 Delivering Diversified Growth and Long - Term Value 11 1 Per Bloomberg; closing price as of March 1, 2021; Total return defined as stock appreciation inclusive of reinvestment of div id ends into new shares Source: S&P Global Market Intelligence Total Shareholder Returns 1 Proven Track Record of Successful and Value - added Integrations 1 Year 5 Year 10 Year WSFS 56.6% 74.9% 291.1% KBW Bank 23.2% 105.6% 174.9% SNL U.S. Bank > $10B 14.8% 87.7% 141.2% NASDAQ Bank 28.5% 87.1% 195.3% Assets

12 Credit Quality 12 Due Diligence Process 1 Office, Retail, Hotel, and Food Services • Relationships Reviews • Key Talent • Investment Performance • Fiduciary roles • Systems and Platforms • Compliance x Comprehensive due diligence coordinated and led by key executives from WSFS and BMT x Full engagement of external counsel, financial advisors, and consultants x Key focus areas: Wealth, Credit Quality, Operations, Risk, Compliance, Legal, Regulatory, and Technology • Reviewed risk framework, credit policies, committee materials, loan files, and pro forma concentration limits • Assessment of credit performance trends including credit migration, delinquencies, and losses • Significant review of loan portfolio • 54% of total commercial loans • 85% of COVID - 19 impacted loans 1 • 95% of Criticized/Classified loans Wealth Operations and Risk • Information Technology • Cybersecurity • Operational Risk • Human Capital • Financial Systems • Balance Sheet, Liquidity, and Capital • Third Party Risk Management • Regulatory and Compliance • Internal Audit and Legal • Physical Premises and Security

Appendix 13

14 Selected Portfolios as of December 31, 2020 14 WSFS BMT PRO FORMA Hotel Retail CRE Office CRE Food Services $525 million 6.2% of portfolio 1 $668 million 7.9% of portfolio 1 $521 million 6.2% of portfolio 1 $183 million 2.2% of portfolio 1 Retail Trade $261 million 3.1% of portfolio 1 $84 million 2.3% of portfolio $332 million 9.1% of portfolio $207 million 5.7% of portfolio $32 million 0.9% of portfolio $65 million 1.8% of portfolio $609 million 5.0% of portfolio 1 $1 billion 8.3% of portfolio 1 $728 million 6.0% of portfolio 1 $215 million 1.8% of portfolio 1 $326 million 2.7% of portfolio 1 1 Portfolio values are gross loans excluding PPP as of December 31, 2020 • Average Hotel loan is $3.2M • Diverse mix of hotel flags and traffic type • Average Retail loan is $1.4M • No enclosed malls • Average Office loan is $1.6M • No loan modifications within portfolio • Average Food loan is ~$300K • Average Retail Trade loan is ~$300K

15 15 Key Transaction Assumptions (Model Details) Loan Marks and Estimated CECL Impact • Gross credit mark - down of $72.4 million pre - tax or 1.95% of BMBC total loans at close • Loan interest rate mark - up of $41.1 million pre - tax • Non - PCD CECL reserve of $41.8 million established day 2 through provision expense (represents “double count” of the non - PCD credit mark) • Loan interest rate mark and non - PCD credit mark amortized / accreted over expected loan maturity periods • Combined ACL Coverage Ratio of 2.26% Other Fair Value Adjustments • Customer list intangible of $67.5 million, amortized over 15 years • Fixed asset (corporate real estate) write - up of $10.5 million, amortized over 30 years • Core deposit intangible of $5.0 million, amortized over 10 years • Time deposit write - up of $3.5 million, accreted over 3 years • Wholesale borrowings write - up of $7.1 million, accreted over 13 years Other Adjustments • $89 million in Trust Preferred securities to be recognized as Tier 2 Capital related to the Collins Amendment • $6 million pre - tax benefit from balance sheet repositioning and optimization • $2 million in estimated annual pre - tax loss of revenue related to the Durbin Amendment • Assumes a tax rate of 25% on pro forma adjustments; 24.8% combined effective tax rate • Assumes WSFS pauses planned share repurchases during the period prior to transaction close • No ACL Reserve releases modeled • Revenue synergies identified but not included in model

16 16 Key Transaction Assumptions (Continued) Loan Mark & CECL Other Fair Value Adjustments Tangible Book Value Reconciliation $Millions Aggregrate Per Share WSFS Projected TBV 9/30/2021 $1,202.8 $26.90 Equity Consideration 976.4 Share Buyback Pause 140.3 Additional Intangibles Created (527.0) Seller One-Time Costs (10.5) Buyer One-Time Costs (87.4) CECL Reserve (31.4) Pro Forma TBV $1,663.2 $25.25 Dilution -6.1%

17 17 Estimated Earnings Per Share Impact – Year 1 ($Millions, except per share values) Pro Forma WSFS' Consensus Net Income Estimate $154 BMT's Consensus Net Income Estimate $58 WSFS Consensus EPS Estimate $3.56 BMT Consensus EPS Estimate $2.90 After-Tax Transaction Adjustments: Cost Savings $32 Intangible Amortization (4) Reversal of BMT Existing Intangible Amortization 2 Net Purchase Accounting, Repositioning, Durbin and Tax Adjustments 3 Pro Forma Net Income to Common $245 Pro Forma Average Diluted Shares (millions) 64.5 WSFS Pro Forma EPS $3.80 Accretion ($) $0.24 Accretion (%) 6.7% Accretion (%) - Cost Savings Fully Phased-in 14.6% Year 1

18 TCE Ratio 11.87% 11.29% 11.63% WSFS 12/31/2020 BMBC 12/31/2020 Pro Forma at Close 18 Capital Overview – Holding Company Tier 1 Common Ratio Total Capital Ratio Tier 1 Ratio Leverage Ratio 6.5% Well Capitalized 13.76% 15.55% 14.15% WSFS 12/31/2020 BMBC 12/31/2020 Pro Forma at Close 12.50% 11.86% 11.63% WSFS 12/31/2020 BMBC 12/31/2020 Pro Forma at Close 9.76% 9.04% 8.86% WSFS 12/31/2020 BMBC 12/31/2020 Pro Forma at Close Tangible Common Equity 1 8.96% 8.09% 8.91% WSFS 12/31/2020 BMBC 12/31/2020 Pro Forma at Close $1,234 $424 $1,663 WSFS 12/31/2020 BMBC 12/31/2020 Pro Forma at Close 10% Well Capitalized 8% Well Capitalized 5% Well Capitalized 1 Amounts in millions

19 19 Non - GAAP Financial Information • Core fee revenue is a non - GAAP measure that adjusts noninterest income as determined in accordance with GAAP to exclude the impact of securities gains and realized/unrealized gains on equity investments; • Core net revenue is a non - GAAP measure that is determined by adding core net interest income (which is the same as GAAP net interest income) plus core fee revenue; • Tangible common equity is a non - GAAP measure and is defined as total average stockholders’ equity less goodwill, other intangible assets; • Return on average tangible common equity (ROATCE) is a non - GAAP measure and is defined as net income allocable to common stockholders divided by tangible common equity This presentation contains financial measures determined by methods other than in accordance with accounting principles generally accepted in the United States (GAAP). This presentation may include the following non - GAAP measures:

20 20 Non - GAAP Financial Information (dollars in thousands, except per share data) Net interest income (GAAP) $ 465,955 $ 143,787 $ 609,742 Core net interest income (non-GAAP) $ 465,955 $ 143,787 $ 609,742 Noninterest income (GAAP) $ 201,025 $ 81,971 $ 282,996 Less: Securities gains Less: Unrealized gains on equity investments, net Less: Realized gain on sale of equity investment, net Less: Gain on sale of PPP Loans - Less: BMT Inv Advisors wind-down costs (2,207) Less: Gain on sale of buildings Core fee revenue (non-GAAP) $ 169,136 $ 79,472 $ 248,608 Core net revenue (non-GAAP) $ 635,091 $ 223,259 $ 858,350 Fee revenue as a percentage of total net revenue 30.1% 36.3% 31.7% Core fee revenue as a percentage of total core net revenue 2,411 9,076 26.6% 761 22,052 22,052 29.0% - 35.6% WSFS BMT Combined - - 9,076 761 Twelve Months Ended December 31, 2020 2,295 (dollars in thousands, except per share data) Wealth Management Segment Noninterest income (GAAP) $ 49,541 $ 50,571 $ 100,112 Less: BMT Inv Advisors wind-down costs - (2,207) (2,207) Core fee revenue (non-GAAP) $ 49,541 $ 52,778 $ 102,319 WSFS BMT Combined Twelve Months Ended December 31, 2020 (dollars in thousands, except per share data) Calculation of return on average tangible common equity: GAAP net income attributable $ 114,774 $ 32,573 $ 147,347 Plus: Tax effected amortization of intangible assets Net tangible income (non-GAAP) $ 123,255 $ 35,391 $ 158,646 Average stockholders' equity of WSFS Less: average goodwill and intangible assets 563,126 201,389 764,515 Less: average Noncontrolling interest - (725) (725) Net average tangible common equity Twelve Months Ended WSFS 1,836,115$ 1,272,989$ December 31, 2020 2,818 8,481 610,521$ 409,857$ 11,299 2,446,636$ 1,682,846$ BMT Combined