Attached files
| file | filename |
|---|---|
| EX-32 - EX-32 - WSFS FINANCIAL CORP | d92227dex32.htm |
| EX-21 - EX-21 - WSFS FINANCIAL CORP | d92227dex21.htm |
| EX-23 - EX-23 - WSFS FINANCIAL CORP | d92227dex23.htm |
| EX-31.2 - EX-31.2 - WSFS FINANCIAL CORP | d92227dex312.htm |
| EX-31.1 - EX-31.1 - WSFS FINANCIAL CORP | d92227dex311.htm |
Table of Contents
UNITED STATES
SECURITIES AND EXCHANGE COMMISSION
Washington, D.C. 20549
FORM 10-K
(Mark One)
| x | ANNUAL REPORT PURSUANT TO SECTION 13 OR 15(d) OF THE SECURITIES EXCHANGE ACT OF 1934 |
For the fiscal year ended December 31, 2015
OR
| ¨ | TRANSITION REPORT PURSUANT TO SECTION 13 OR 15(d) OF THE SECURITIES EXCHANGE ACT OF 1934 |
For the transition period from to
Commission file number 001-35638
WSFS FINANCIAL CORPORATION
(Exact Name of Registrant as Specified in its Charter)
| Delaware | 22-2866913 | |
| (State or other Jurisdiction of Incorporation or Organization) |
(I.R.S. Employer Identification No.) |
| 500 Delaware Avenue, Wilmington, Delaware |
19801 | |
| (Address of Principal Executive Offices) | (Zip Code) |
Registrant’s Telephone Number, Including Area Code: (302) 792-6000
Securities registered pursuant to Section 12(b) of the Act:
| Title of Each Class |
Name of Each Exchange on Which Registered | |
| Common Stock, $0.01 par value 6.25% Senior Notes Due 2019 |
The NASDAQ Stock Market LLC |
Securities registered pursuant to Section 12(g) of the Act: None
Indicate by check if the registrant is a well-known seasoned issuer as defined in Rule 405 of the Securities Act. YES x NO ¨
Indicate by check if the registrant is not required to file reports pursuant to Section 13 or Section 15(d) of the Exchange Act. YES ¨ NO x
Indicate by check mark whether the registrant (1) has filed all reports required to be filed by Section 13 or 15(d) of the Securities Exchange Act of 1934 during the preceding twelve months (or for such shorter period that the registrant was required to file such reports), and (2) has been subject to such filing requirements for the past 90 days. YES x NO ¨
Indicate by check mark whether the registrant has submitted electronically and posted on its corporate Web site, if any, every Interactive Data File required to be submitted and posted pursuant to Rule 405 of Regulation S-T (§232.405 of this chapter) during the preceding 12 months (or for such shorter period that the registrant was required to submit and post such files). Yes x No ¨
Indicate by check mark if disclosure of delinquent filers pursuant to Item 405 of Regulation S-K is not contained herein, and will not be contained, to the best of registrant’s knowledge, in definitive proxy or information statements incorporated by reference in Part III of this Form 10-K or any amendment to this Form 10-K. ¨
Indicate by check mark whether the registrant is a large accelerated filer, an accelerated filer, a non-accelerated filer or a smaller reporting company. See definitions of “large accelerated filer,” “accelerated filer” and “smaller reporting company” in Rule 12b-2 of the Exchange Act.
| Large accelerated filer | x | Accelerated filer | ¨ | |||
| Non-accelerated filer | ¨ | Smaller reporting company | ¨ | |||
Indicate by check mark whether the registrant is a shell company (as defined in Exchange Act Rule 12b-2). Yes ¨ No x
The aggregate market value of the voting stock held by nonaffiliates of the registrant, based on the closing price of the registrant’s common stock as quoted on NASDAQ as of June 30, 2015 was $749,298,186. For purposes of this calculation only, affiliates are deemed to be directors, executive officers and beneficial owners of greater than 10% of the outstanding shares.
As of February 19, 2016, there were issued and outstanding 29,686,400 Shares of the registrant’s common stock.
DOCUMENTS INCORPORATED BY REFERENCE
Portions of the Registrant’s Proxy Statement for the Annual Meeting of Stockholders to be held on April 28, 2016 are incorporated by reference in Part III hereof.
Table of Contents
TABLE OF CONTENTS
| Page | ||||||
| Part I | ||||||
| Item 1. | 3 | |||||
| Item 1A. | 23 | |||||
| Item 1B. | 34 | |||||
| Item 2. | 34 | |||||
| Item 3. | 34 | |||||
| Item 4. | 34 | |||||
| Part II | ||||||
| Item 5. | Market for Registrant’s Common Equity, Related Stockholder Matters and Issuer Purchases of Equity Securities | 35 | ||||
| Item 6. | 37 | |||||
| Item 7. | Management’s Discussion and Analysis of Financial Condition and Results of Operations |
38 | ||||
| Item 7A. | 54 | |||||
| Item 8. | 56 | |||||
| Item 9. | Changes in and Disagreements with Accountants on Accounting and Financial Disclosure |
117 | ||||
| Item 9A. | 117 | |||||
| Item 9B. | 120 | |||||
| Part III | ||||||
| Item 10. | 120 | |||||
| Item 11. | 120 | |||||
| Item 12. | Security Ownership of Certain Beneficial Owners and Management and Related Stockholder Matters | 120 | ||||
| Item 13. | Certain Relationships and Related Transactions and Director Independence |
121 | ||||
| Item 14. | 121 | |||||
| Part IV | ||||||
| Item 15. | 121 | |||||
| 124 | ||||||
Table of Contents
FORWARD-LOOKING STATEMENTS
This Annual Report on Form 10-K, and exhibits thereto, contains estimates, predictions, opinions, projections and other “forward-looking statements” as that phrase is defined in the Private Securities Litigation Reform Act of 1995. Such statements include, without limitation, references to the Company’s predictions or expectations of future business or financial performance as well as its goals and objectives for future operations, financial and business trends, business prospects, and management’s outlook or expectations for earnings, revenues, expenses, capital levels, liquidity levels, asset quality or other future financial or business performance, strategies or expectations. Such forward-looking statements are based on various assumptions (some of which may be beyond the Company’s control) and are subject to risks and uncertainties (which change over time) and other factors which could cause actual results to differ materially from those currently anticipated. Such risks and uncertainties include, but are not limited to:
| • | those related to difficult market conditions and unfavorable economic trends in the United States generally, and particularly in the markets in which the Company operates and in which its loans are concentrated, including the effects of declines in housing markets, an increase in unemployment levels and slowdowns in economic growth; |
| • | the Company’s level of nonperforming assets and the costs associated with resolving problem loans including litigation and other costs; |
| • | changes in market interest rates, which may increase funding costs and reduce earning asset yields and thus reduce margin; |
| • | the impact of changes in interest rates and the credit quality and strength of underlying collateral and the effect of such changes on the market value of the Company’s investment securities portfolio; |
| • | the credit risk associated with the substantial amount of commercial real estate, construction and land development, and commercial and industrial loans in our loan portfolio; |
| • | the extensive federal and state regulation, supervision and examination governing almost every aspect of the Company’s operations including the changes in regulations affecting financial institutions, including the Dodd-Frank Wall Street Reform and Consumer Protection Act and the rules and regulations issued in accordance with this statute and potential expenses associated with complying with such regulations; |
| • | possible additional loan losses and impairment of the collectability of loans; |
| • | the Company’s ability to comply with applicable capital and liquidity requirements (including the finalized Basel III capital standards), including our ability to generate liquidity internally or raise capital on favorable terms; |
| • | possible changes in trade, monetary and fiscal policies, laws and regulations and other activities of governments, agencies, and similar organizations; |
| • | any impairment of the Company’s goodwill or other intangible assets; |
| • | failure of the financial and operational controls of the Company’s Cash Connect division; |
| • | conditions in the financial markets that may limit the Company’s access to additional funding to meet its liquidity needs; |
| • | the success of the Company’s growth plans, including the successful integration of past and future acquisitions; |
| • | the Company’s ability to complete the pending merger with Penn Liberty Financial Corporation (Penn Liberty) on the terms and conditions proposed which are subject to a number of conditions, risks and uncertainties including receipt of regulatory approvals and satisfaction of other closing conditions to the merger (including approval by Penn Liberty shareholders), delay in closing the merger, difficulties and delays in integrating the Penn Liberty business or fully realizing cost savings and other benefits of the merger, business disruption following the merger, Penn Liberty’s customer acceptance of the Company’s products and services and related customer disintermediation; |
| • | negative perceptions or publicity with respect to the Company’s trust and wealth management business; |
1
Table of Contents
| • | system failure or cybersecurity breaches of the Company’s network security; |
| • | the Company’s ability to recruit and retain key employees; |
| • | the effects of problems encountered by other financial institutions that adversely affect the Company or the banking industry generally; |
| • | the effects of weather and natural disasters such as floods, droughts, wind, tornadoes and hurricanes as well as effects from geopolitical instability and man-made disasters including terrorist attacks; |
| • | possible changes in the speed of loan prepayments by the Company’s customers and loan origination or sales volumes; |
| • | possible acceleration of prepayments of mortgage-backed securities due to low interest rates, and the related acceleration of premium amortization on prepayments on mortgage-backed securities due to low interest rates; |
| • | regulatory limits on the Company’s ability to receive dividends from its subsidiaries and pay dividends to its shareholders; |
| • | the effects of any reputational, credit, interest rate, market, operational, legal, liquidity, regulatory and compliance risk resulting from developments related to any of the risks discussed above; |
| • | the costs associated with resolving any problem loans, litigation and other risks and uncertainties, including those discussed in other documents filed by the Company with the Securities and Exchange Commission from time to time. |
Such risks and uncertainties may be discussed herein, including under the heading “Risk Factors,” and in other documents filed by the Company with the Securities and Exchange Commission. Forward looking statements are as of the date they are made, and the Company does not undertake to update any forward-looking statement, whether written or oral, that may be made from time to time by or on behalf of the Company.
2
Table of Contents
OUR BUSINESS
WSFS Financial Corporation (the Company, our Company, we, our or us) is parent to Wilmington Savings Fund Society, FSB (WSFS Bank or the Bank), the seventh oldest bank and trust company in the United States continuously operating under the same name. At $5.6 billion in assets and $13.2 billion in fiduciary assets, WSFS Bank is also the largest bank and trust company headquartered in Delaware and the Delaware Valley. WSFS Bank has been in operation for 184 years. In addition to its focus on stellar customer service, the Bank has continued to fuel growth and remain a leader in our community. We are a relationship-focused, locally-managed, banking institution. For the tenth consecutive year, our Associates (what we call our employees) ranked us a “Top Workplace” in Delaware and for the fifth year in a row the readers of the Delaware News Journal voted us the “Top Bank” in the state. We state our mission simply: “We Stand for Service.” Our strategy of “Engaged Associates delivering Stellar Service growing Customer Advocates and value for our Owners” focuses on exceeding customer expectations, delivering stellar service and building customer advocacy through highly-trained, relationship-oriented, friendly, knowledgeable and empowered Associates.
Our core banking business is commercial lending funded by customer-generated deposits. We have built a $3.1 billion commercial loan portfolio by recruiting the best seasoned commercial lenders in our markets and offering the high level of service and flexibility typically associated with a community bank. We fund this business primarily with deposits generated through commercial relationships and retail deposits. We service our customers primarily from our 63 offices located in Delaware (44), Pennsylvania (17), Virginia (1) and Nevada (1) and through our website at www.wsfsbank.com. We also offer a broad variety of consumer loan products, retail securities and insurance brokerage services through our retail branches and mortgage and title services through those branches and through Pennsylvania based WSFS Mortgage/Array Financial. WSFS Mortgage/Array Financial is a mortgage banking company and abstract and title company specializing in a variety of residential mortgage and refinancing solutions.
Our Wealth Management segment provides a broad array of fiduciary, investment management, credit and deposit products to clients through four businesses. WSFS Wealth Investments provides insurance and brokerage products primarily to our retail banking clients. Cypress is a registered investment advisor with $637.8 million in assets under management. Cypress’ primary market segment is high net worth individuals and offers a ‘balanced’ investment style focused on preservation of capital and providing for current income. Christiana Trust, with $12.58 billion in assets under management and administration, provides fiduciary and investment services to personal trust clients, and trustee, agency, bankruptcy administration, custodial and commercial domicile services to corporate and institutional clients. WSFS Private Banking serves high net worth clients by delivering credit and deposit products and partnering with other business units to deliver investment management and fiduciary products and services.
Our Cash Connect segment is a leading provider of ATM Vault Cash and related services in the United States. Cash Connect manages $581 million in vault cash in over 16,000 non-bank ATMs nationwide. It also provides online reporting and ATM cash management, predictive cash ordering, armored carrier management, ATM processing, equipment sales and deposit safe cash logistics. Cash Connect also operates 467 ATMs for WSFS Bank. This is, by far, the largest branded ATM network in Delaware. Cash Connect is an innovator for our company and has various additional products and services in development.
WSFS POINTS OF DIFFERENTIATION
While all banks offer similar products and services, we believe that WSFS, through its service model, has set itself apart from other banks in our market and the industry in general. In addition, community banks such as WSFS have been able to distinguish themselves from large national or international banks that fail to provide their customers with the service levels, responsiveness and local decision making customers prefer. The following factors summarize what we believe are our points of differentiation:
Building Associate Engagement and Customer Advocacy
Our business model is built on a concept called Human Sigma, which we have implemented in our strategy of “Engaged Associates delivering Stellar Service growing Customer Advocates and value for our Owners”. The Human
3
Table of Contents
Sigma model, identified by Gallup, Inc., begins with Associates who have taken ownership of their jobs and therefore perform at a higher level. We invest significantly in recruitment, training, development and talent management because our Associates are the cornerstone of our business model. This strategy motivates Associates and unleashes innovation and productivity to engage our most valuable asset, our Customers, by providing them with Stellar Service experiences. As a result, we build Customer Advocates, or Customers who have developed an emotional attachment to the Bank. Research studies continue to show a direct link between Associate engagement, customer advocacy and a company’s financial performance. Our success with this strategy creates a virtuous cycle, further building an environment of engagement and advocacy.
Surveys conducted for us by Gallup, Inc. indicate:
| • | Our Associate Engagement scores consistently rank in the top decile of companies polled. In 2015 our engagement ratio was 14:1, which means there were 14 engaged Associates for every disengaged Associate. This compares to a 2.6:1 ratio in 2003 and a national average of 1.53:1. |
| • | Our customer advocacy scores rank in the top quartile of all companies. In 2015, 42% of our customers ranked us a “five” out of “five,” strongly agreeing with the statement “I can’t imagine a world without WSFS” and 67% of our customers ranked us a “five” out of “five,” strongly agreeing with the statement “WSFS is the perfect bank for me.” |
By fostering a culture of engaged and empowered Associates, we believe we have become the employer and bank of choice in our market. In 2015, for the tenth year in a row, we were recognized by The Wilmington News Journal as a “Top Work Place” for large corporations in the State of Delaware. Also in 2015, and for the fifth consecutive year, a News Journal survey of its readers also ranked us the “Top Bank” in Delaware, indicating the strength of our focus on customer service.
Community Banking Model
Our size and community banking model play a key role in our success. Our approach to business combines a service-oriented culture with a strong complement of products and services, all aimed at meeting the needs of our retail and business Customers. We believe the essence of being a community bank means that we are:
| • | Small enough to offer Customers responsive, personalized service and direct access to decision makers. |
| • | Large enough to provide all the products and services needed by our target market customers. |
4
Table of Contents
As the financial services industry has consolidated, many independent banks have been acquired by national companies that have centralized their decision-making authority away from their customers and focused their mass-marketing on a regional or even national customer base. We believe this trend has frustrated smaller business owners who have become accustomed to dealing directly with their bank’s senior executives and discouraged retail customers who often experience deteriorating levels of service in branches and other service outlets. Additionally, it frustrates bank employees who are no longer empowered to provide good and timely service to their customers.
WSFS Bank offers:
| • | One primary point of contact. Each of our relationship managers is responsible for understanding his or her Customers’ needs and bringing together the right resources in the Bank to meet those needs. |
| • | A customized approach to our Customers. We believe this gives us an advantage over our competitors who are too large or centralized to offer customized products or services. |
| • | Products and services that our Customers value. This includes a broad array of banking, cash management and trust and trust and wealth management products, as well as a legal lending limit high enough to meet the credit needs of our Customers, especially as they grow. |
| • | Rapid response and a company that is easy to do business with. Our customers tell us this is an important differentiator from larger, in-market competitors. |
Strong Market Demographics
Delaware is situated in the middle of the Washington, DC—New York corridor which includes the urban markets of Philadelphia and Baltimore. The state benefits from this urban concentration as well as from a unique political, legal, tax and business environment. Delaware’s rate of unemployment, median household income and rate of population growth all compare favorably to national averages.
| (Most recent available statistics) | Delaware |
National Average |
||||||
| Unemployment (For December 2015) (1) |
5.0 | % | 5.0 | % | ||||
| Median Household Income (2010-2014) (2) |
$ | 60,231 | $ | 53,482 | ||||
| Population Growth (2010-2015) (2) |
5.3 | % | 4.1 | % | ||||
| (1) | Bureau of Labor Statistics, Economy at a Glance |
| (2) | U.S. Census Bureau, State & County Quick Facts |
Balance Sheet Management
We put a great deal of focus on actively managing our balance sheet. This manifests itself in:
| • | Prudent capital levels. Maintaining prudent capital levels is key to our operating philosophy. At December 31, 2015 our tangible capital ratio was 8.84% and all regulatory capital levels for WSFS Bank reflected a meaningful cushion above well-capitalized levels. At December 31, 2015, WSFS Bank’s common equity Tier 1 capital ratio was 12.31% and $274.2 million in excess of the 6.5% “well-capitalized” level under the banking agencies’ prompt corrective action framework, Tier 1 capital ratio was 12.31% and $298 million in excess of the 8.0% “well-capitalized” level, and the Bank’s total risk-based capital ratio was 13.11%, or $147 million above the “well-capitalized” level of 10.00%. |
| • | Disciplined Lending. We maintain discipline in our lending with a particular focus on portfolio diversification and granularity. Diversification includes limits on loans to one borrower as well as industry and product concentrations. We supplement this portfolio diversification with a disciplined underwriting process and the benefit of knowing our customers. We have also taken a proactive approach to identifying trends in our local economy and have responded to areas of concern. As a result we improved all criticized, classified and nonperforming loans to 17.7% of Tier 1 capital plus Allowance for Loan Losses (ALLL) at December 31, 2015 from 21.5% at December 31, 2014. |
5
Table of Contents
| • | Focus on credit quality. We seek to control credit risk in our investment portfolio and use this portion of our balance sheet primarily to help us manage liquidity and interest rate risk, while providing marginal income and tax relief. Our philosophy and pre-purchase due diligence has allowed us to avoid the significant investment write-downs taken by many of our bank peers during the recent economic downturn (only $86,000 of other-than-temporary impairment charges recorded during this economic cycle). |
| • | Asset Strategies. We have created an investment portfolio that is in line with the Board’s approved risk appetite and we believe the portfolio contains minimal risks due to our exclusion of non-Agency (Private label) MBS and other asset-backed securities. We also believe that our thorough due diligence is effective in mitigating the credit risk associated with municipal securities that we have added. Further, our portfolio is highly liquid given our large amount of Agency MBS. |
Disciplined Capital Management
We understand that our capital (or stockholders’ equity) belongs to our stockholders. They have entrusted this capital to us with the expectation that it will earn an appropriate return relative to the risk we take. Mindful of this balance, we prudently, but aggressively, manage our capital.
Strong Performance Expectations and Alignment with Stockholder Priorities
We are focused on high-performing, long-term financial goals. We define “high-performing” as the top quintile of a relevant peer group in return on assets (ROA), return on tangible common equity (ROTCE) and EPS growth. Management incentives are, in large part, based on driving performance in these areas. More details on management incentive plans will be included in the proxy statement for our 2016 annual meeting of stockholders.
During 2015, our performance reflected continued progress on our path towards becoming a sustainably high performing company. In 2015, WSFS reported ROA of 1.05% and core and sustainable ROA, a non-GAAP calculation, stood at 1.24% in the final quarter of 2015. This exceeded our goal of at least a 1.20% core and sustainable ROA set in early 2013 as part of our 2013-2015 Strategic Plan.
Growth
We have achieved success over the long term in lending and deposit gathering, growing the Wealth Management segment’s assets under administration and growing Cash Connect’s customer base and customer cross-sell. Our success has been the result of a focused strategy that provides service, responsiveness and careful execution in a consolidating marketplace. We plan to continue to grow by:
| • | Developing talented, service-minded Associates. We have successfully recruited Associates with strong ties to, and the passion to serve, their communities to enhance our service in existing markets and to provide a strong start in new communities. We also focus efforts on developing talent and leadership from our current Associate base to better equip those Associates for their jobs and prepare them for leadership roles at WSFS. |
| • | Embracing the Human Sigma concept. We are committed to building Associate Engagement and Customer Advocacy as a way to differentiate ourselves and grow our franchise. |
| • | Building fee income through investment in and growth of our Wealth Management and Cash Connect (ATM services) segments. |
| • | Continuing strong growth in commercial lending by: |
| • | Offering local decision-making by seasoned banking professionals. |
| • | Executing our community banking model that combines Stellar Service with the banking products and services our business customers’ demand. |
| • | Adding seasoned lending professionals that have helped us win customers in our Delaware and southeastern Pennsylvania markets. |
6
Table of Contents
| • | Aggressively growing deposits. We have energized our retail branch strategy by combining Stellar Service with an expanded and updated branch network. We plan to continue to grow deposits by: |
| • | Offering products through an expanded and updated branch network. |
| • | Providing a Stellar Service experience to our Customers. |
| • | Further expanding our commercial Customer relationships with deposit and cash management products. |
| • | Finding creative ways to build deposit market share such as targeted marketing programs. |
| • | Selectively opening new branches, including in preferred southeastern Pennsylvania locations. |
| • | Seeking strategic acquisitions. In 2014 we acquired First Wyoming Financial Corporation and its wholly-owned banking subsidiary, First National Bank of Wyoming (DE) (First Wyoming). On October 9, 2015, we completed the acquisition of Alliance Bancorp Inc. of Pennsylvania (Alliance) and its wholly-owned banking subsidiary Alliance Bank. Alliance was a locally-managed institution with eight branch locations headquartered in Broomall, PA. On November 23, 2015, we signed a definitive agreement to acquire Penn Liberty Financial Corp. and its wholly-owned subsidiary, Penn Liberty which we expect to close in the third quarter of 2016. Penn Liberty Bank headquartered in Wayne, Pennsylvania was founded by experienced Pennsylvania bankers in 2004 to serve the local community by offering a wide array of financial products and services to small and mid-size businesses, professional real estate developers and investors, and retail customers throughout the western suburban Philadelphia marketplace. Penn Liberty reported $704 million in assets, $510 million in loans and $621 million in deposits as of December 31, 2015 and serves its customers from 11 offices in the demographically robust Chester and Montgomery Counties. Over the next several years we expect our growth will be approximately 80% organic and 20% through acquisitions, although each year’s growth will reflect the opportunities available to us at the time. |
Innovation
Our organization is committed to product and service innovation as a means to drive growth and to stay ahead of changing customer demands and emerging competition. Our organization has a focus on developing a strong “culture of innovation” that solicits, captures, prioritizes, and executes innovation initiatives, from product creation to process improvements. We intend to leverage technology and innovation to grow our business and to successfully execute on our strategy.
Values
Our values address integrity, service, accountability, transparency, honesty, growth and desire to improve. They are the core of our culture, they make us who we are and we live them every day.
At WSFS we:
| • | Do the right thing. |
| • | Serve others. |
| • | Are open and candid. |
| • | Grow and improve. |
Results
Our focus on these points of differentiation has allowed us to grow our core franchise and build value for our stockholders. Since 2010, our commercial loans have grown from $2.0 billion to $3.1 billion, a strong 9% compound annual growth rate (CAGR). Over the same period, customer funding has grown from $2.6 billion to $3.9 billion, an 8% CAGR. More importantly, over the last decade, stockholder value has increased at a far greater rate than our banking peers. An investment of $100 in WSFS stock in 2005 would be worth $175 at December 31, 2015. By comparison, $100 invested in the Nasdaq Bank Index in 2005 would be worth $117 at December 31, 2015.
7
Table of Contents
SUBSIDIARIES
The Company has two consolidated direct subsidiaries, WSFS Bank and Cypress Capital Management, LLC (Cypress) and one unconsolidated subsidiary, WSFS Capital Trust III (the Trust).
WSFS Bank has three wholly owned subsidiaries, WSFS Wealth Investments, 1832 Holdings, Inc. and Monarch Entity Services, LLC (Monarch). WSFS Wealth Investments markets various third-party investment and insurance products such as single-premium annuities, whole life policies and securities, primarily through our retail banking system and directly to the public. 1832 Holdings, Inc. was formed to hold certain debt and equity investment securities. Monarch offers commercial domicile services which include providing employees, directors, sublease of office facilities and registered agent services in Delaware and Nevada.
Cypress is a Wilmington-based registered investment advisor servicing high net-worth individuals and institutions and has approximately $638 million in assets under management at December 31, 2015.
The Trust is our unconsolidated subsidiary, and was formed in 2005 to issue $67.0 million aggregate principal amount of Pooled Floating Rate Capital Securities.
SEGMENT INFORMATION
For financial reporting purposes, our business has three reporting segments: WSFS Bank, Cash Connect, and Wealth Management. The WSFS Bank segment provides loans and other financial products to commercial and retail customers. Cash Connect provides ATM vault cash and cash logistics services through strategic partnerships with several of the largest network, manufacturers and service providers in the ATM industry. The Wealth Management segment provides a broad array of fiduciary, investment management, credit and deposit products to clients.
Segment financial information for the years ended December 31, 2015, 2014 and 2013 is provided in Note 20 to the Consolidated Financial Statements in this report.
DISTRIBUTION OF ASSETS, LIABILITIES AND STOCKHOLDERS’ EQUITY
Condensed average balance sheets for each of the last three years and analyses of net interest income and changes in net interest income due to changes in volume and rate are presented in “Results of Operations” included in the section entitled “Management’s Discussion and Analysis of Financial Condition and Results of Operations.”
CREDIT EXTENSION ACTIVITIES
Over the past several years we have focused on growing the more profitable segments of our loan portfolio. Our current portfolio lending activity is concentrated on lending to small- to mid-sized businesses in the mid-Atlantic region of the United States, primarily in Delaware, contiguous counties in Pennsylvania, Maryland and New Jersey, as well as in northern Virginia. Since 2011, our total commercial loans have increased by $960.9 million, or 44% and accounted for approximately 85% of our loan portfolio in 2015, compared to 81% in 2011. Based on current market conditions, we expect our focus on growing C&I loans and other relationship-based commercial loans to continue during the remainder of 2016 and beyond.
8
Table of Contents
The following table shows the composition of our loan portfolio at year-end for the last five years.
| At December 31, | ||||||||||||||||||||||||||||||||||||||||
| (In Thousands) | 2015 | 2014 | 2013 | 2012 | 2011 | |||||||||||||||||||||||||||||||||||
| Amount | Percent | Amount | Percent | Amount | Percent | Amount | Percent | Amount | Percent | |||||||||||||||||||||||||||||||
| Types of Loans |
||||||||||||||||||||||||||||||||||||||||
| Commercial real estate: |
||||||||||||||||||||||||||||||||||||||||
| Commercial mortgage |
$ | 966,698 | 25.9 | % | $ | 805,459 | 25.5 | % | $ | 725,193 | 25.0 | % | $ | 631,365 | 23.2 | % | $ | 626,739 | 23.1 | % | ||||||||||||||||||||
| Construction |
245,773 | 6.6 | 142,497 | 4.5 | 106,074 | 3.6 | 133,375 | 4.9 | 106,268 | 3.9 | ||||||||||||||||||||||||||||||
|
|
|
|
|
|
|
|
|
|
|
|
|
|
|
|
|
|
|
|
|
|||||||||||||||||||||
| Total commercial real estate |
1,212,471 | 32.5 | 947,956 | 30.0 | 831,267 | 28.6 | 764,740 | 28.1 | 733,007 | 27.0 | ||||||||||||||||||||||||||||||
| Commercial (1) |
1,061,597 | 28.5 | 920,072 | 29.1 | 810,882 | 27.9 | 704,491 | 25.9 | 1,460,812 | 53.9 | ||||||||||||||||||||||||||||||
| Commercial – owner occupied (1) |
880,643 | 23.6 | 788,598 | 25.0 | 786,360 | 27.1 | 770,581 | 28.3 | — | — | ||||||||||||||||||||||||||||||
|
|
|
|
|
|
|
|
|
|
|
|
|
|
|
|
|
|
|
|
|
|||||||||||||||||||||
| Total commercial loans |
3,154,711 | 84.6 | 2,656,626 | 84.1 | 2,428,509 | 83.6 | 2,239,812 | 82.3 | 2,193,819 | 80.9 | ||||||||||||||||||||||||||||||
| Consumer loans: |
||||||||||||||||||||||||||||||||||||||||
| Residential real estate |
259,679 | 7.0 | 218,329 | 6.9 | 221,520 | 7.6 | 243,627 | 8.9 | 274,105 | 10.5 | ||||||||||||||||||||||||||||||
| Consumer |
360,249 | 9.6 | 327,543 | 10.4 | 302,234 | 10.4 | 289,001 | 10.6 | 290,979 | 10.7 | ||||||||||||||||||||||||||||||
|
|
|
|
|
|
|
|
|
|
|
|
|
|
|
|
|
|
|
|
|
|||||||||||||||||||||
| Total consumer loans |
619,928 | 16.6 | 545,872 | 17.3 | 523,754 | 18.0 | 532,628 | 19.5 | 565,084 | 21.2 | ||||||||||||||||||||||||||||||
|
|
|
|
|
|
|
|
|
|
|
|
|
|
|
|
|
|
|
|
|
|||||||||||||||||||||
| Gross loans |
3,774,639 | 101.2 | 3,202,498 | 101.4 | 2,952,263 | 101.6 | 2,772,440 | 101.8 | 2,758,903 | 102.1 | ||||||||||||||||||||||||||||||
| Less: |
||||||||||||||||||||||||||||||||||||||||
| Deferred fees (unearned income) |
8,500 | 0.2 | 6,420 | 0.2 | 6,043 | 0.2 | 4,602 | 0.2 | 3,234 | 0.1 | ||||||||||||||||||||||||||||||
| Allowance for loan losses |
37,089 | 1.0 | 39,426 | 1.2 | 41,244 | 1.4 | 43,922 | 1.6 | 53,080 | 2.0 | ||||||||||||||||||||||||||||||
|
|
|
|
|
|
|
|
|
|
|
|
|
|
|
|
|
|
|
|
|
|||||||||||||||||||||
| Net loans (2) |
$ | 3,729,050 | 100.0 | % | $ | 3,156,652 | 100.0 | % | $ | 2,904,976 | 100.0 | % | $ | 2,723,916 | 100.0 | % | $ | 2,702,589 | 100.0 | % | ||||||||||||||||||||
|
|
|
|
|
|
|
|
|
|
|
|
|
|
|
|
|
|
|
|
|
|||||||||||||||||||||
| (1) | Prior to 2012, owner occupied commercial loans were included in commercial loan balances. |
| (2) | Excludes $41,807; $28,508; $31,491; $12,758 and $10,185 of residential mortgage loans held-for-sale at December 31, 2015, 2014, 2013, 2012, and 2011, respectively. |
The following table shows the remaining time until our loans mature. The first table details the total loan portfolio by type of loan. The second table details the total loan portfolio by those with fixed interest rates and those with adjustable interest rates. The tables show loans by remaining contractual maturity. Loans may be pre-paid, so the actual maturity may be earlier than the contractual maturity. Prepayments tend to be highly dependent upon the interest rate environment. Loans having no stated maturity or repayment schedule are reported in the Less than One Year category.
| (In Thousands) | Less than One Year |
One to Five Years |
Over Five Years |
Total | ||||||||||||
| Commercial mortgage loans |
$ | 122,909 | $ | 473,454 | $ | 370,335 | $ | 966,698 | ||||||||
| Construction loans |
89,203 | 96,421 | 60,149 | 245,773 | ||||||||||||
| Commercial loans |
308,929 | 417,121 | 335,547 | 1,061,597 | ||||||||||||
| Commercial owner occupied loans |
92,673 | 270,648 | 517,322 | 880,643 | ||||||||||||
| Residential real estate loans (1) |
2,815 | 4,311 | 252,553 | 259,679 | ||||||||||||
| Consumer loans |
29,666 | 39,009 | 291,574 | 360,249 | ||||||||||||
|
|
|
|
|
|
|
|
|
|||||||||
| $ | 646,195 | $ | 1,300,964 | $ | 1,827,480 | $ | 3,774,639 | |||||||||
|
|
|
|
|
|
|
|
|
|||||||||
| Rate sensitivity: |
||||||||||||||||
| Fixed |
$ | 78,704 | $ | 593,346 | $ | 700,331 | $ | 1,372,381 | ||||||||
| Adjustable (2) |
567,491 | 707,618 | 1,127,149 | 2,402,258 | ||||||||||||
|
|
|
|
|
|
|
|
|
|||||||||
| Gross loans |
$ | 646,195 | $ | 1,300,964 | $ | 1,827,480 | $ | 3,774,639 | ||||||||
|
|
|
|
|
|
|
|
|
|||||||||
| (1) | Excludes loans held-for-sale. |
| (2) | Includes hybrid adjustable-rate mortgages. |
Commercial Real Estate, Owner Occupied Commercial, Construction and Commercial Lending
Pursuant to section 5(c) of the Home Owners’ Loan Act (HOLA), federal savings banks are generally permitted to invest up to 400% of their total regulatory capital in nonresidential real estate loans and up to 20% of their assets in commercial loans. As a federal savings bank that was formerly chartered as a Delaware savings bank, the Bank has certain additional lending authority.
9
Table of Contents
Commercial, owner occupied commercial, commercial mortgage and construction loans have higher levels of risk than residential mortgage lending. These loans typically involve larger loan balances concentrated with single borrowers or groups of related borrowers. In addition, the payment experience on loans secured by income-producing properties is typically dependent on the successful operation of the related real estate project and may be more subject to adverse conditions in the commercial real estate market or in the general economy than residential mortgage loans. The majority of our commercial and commercial real estate loans are concentrated in Delaware, southeastern Pennsylvania (Chester and Delaware counties) and nearby areas.
We offer commercial real estate mortgage loans on multi-family properties and on other commercial real estate. Generally, loan-to-value ratios for these loans do not exceed 80% of appraised value at origination.
Our commercial mortgage portfolio was $966.7 million at December 31, 2015. Generally, this portfolio is diversified by property type, with no type representing more than 30% of the portfolio. The largest type is retail-related (shopping centers, malls and other retail) with balances of $272.2 million. The average loan size of a loan in the commercial mortgage portfolio is $597,248 and only nine loans are greater than $8.0 million, with no loans greater than $18.0 million.
We offer commercial construction loans to developers. In some cases these loans are made as “construction/permanent” loans, which provides for disbursement of loan funds during construction with automatic conversion to mini-permanent loans (one — five years) upon completion of construction. These construction loans are short-term, usually not exceeding two years, with interest rates indexed to our WSFS prime rate, the “Wall Street” prime rate or London InterBank Offered Rate (LIBOR), in most cases, and are adjusted periodically as these rates change. The loan appraisal process includes the same evaluation criteria as required for permanent mortgage loans, but also takes into consideration: completed plans, specifications, comparables and cost estimates. Prior to approval of each loan, these criteria are used as a basis to determine the appraised value of the subject property when completed. Our policy requires that all appraisals be reviewed independently from our commercial business development staff. At origination, the loan-to-value ratios for construction loans generally do not exceed 75%. The initial interest rate on the permanent portion of the financing is determined by the prevailing market rate at the time of conversion to the permanent loan. At December 31, 2015, $392.6 million was committed for construction loans, of which $243.5 million was outstanding. Residential construction and land development (CLD) represented $88.0 million, or 2%, of the loan portfolio and 14% of Tier 1 capital (Tier 1 + ALLL). Our commercial CLD portfolio was $66.6 million, or 2%, of total loans, and our “land hold” loans, which are land loans not currently being developed, were $41.4 million, or 1%, of total loans, at December 31, 2015.
Commercial and industrial and owner occupied commercial loans make up the remainder of our commercial portfolio and include loans for working capital, financing equipment and real estate acquisitions, business expansion and other business purposes. These loans generally range in amounts of up to $30.0 million (with a few relationships exceeding this level) with an average loan balance in the portfolio of $293,322 and terms ranging from less than one year to ten years. The loans generally carry variable interest rates indexed to our WSFS prime rate, “Wall Street” prime rate or LIBOR. As of December 31, 2015, our commercial and industrial and owner occupied commercial loan portfolios were $1.9 billion and represented 51% of our total loan portfolio. These loans are diversified by industry, with no industry representing more than 13% of the portfolio.
Federal law limits the Bank’s extensions of credit to any one borrower to 15% of our unimpaired capital (approximately $87.1 million), and an additional 10% if the additional extensions of credit are secured by readily marketable collateral. Extensions of credit include outstanding loans as well as contractual commitments to advance funds, such as standby letters of credit. At December 31, 2015, no borrower had collective (relationship) total extensions of credit exceeding these legal lending limits. Only three commercial relationships, when all loans related to the relationship are combined, reach total extensions of credit in excess of $30.0 million.
Residential Real Estate Lending
Generally, we originate residential first mortgage loans with loan-to-value ratios of up to 80% and require private mortgage insurance for up to 35% of the mortgage amount for mortgage loans with loan-to-value ratios exceeding 80%.
10
Table of Contents
We do not have any significant concentrations of such insurance with any one insurer. On a very limited basis, we have originated or purchased loans with loan-to-value ratios exceeding 80% without a private mortgage insurance requirement. At December 31, 2015, the balance of all such loans was approximately $1.9 million.
Generally, our residential mortgage loans are underwritten and documented in accordance with standard underwriting criteria published by the FHLMC and other secondary market participants to assure maximum eligibility for subsequent sale in the secondary market. Typically, we sell only those loans originated specifically with the intention to sell on a “flow” basis.
To protect the propriety of our liens, we require title insurance be obtained. We also require fire, extended coverage casualty and flood insurance (where applicable) for properties securing residential loans. All properties securing our residential loans are appraised by independent, licensed and certified appraisers and are subject to review in accordance with our standards.
The majority of our adjustable-rate, residential real estate loans have interest rates that adjust yearly after an initial period. The change in rate for the first adjustment date could be higher than the typical limited rate change of two percentage points at each subsequent adjustment date. Adjustments are generally based upon a margin (currently 2.75% for U.S. Treasury index; 2.5% for LIBOR index) over the weekly average yield on U.S. Treasury securities adjusted to a constant maturity, as published by the Board of Governors of the Federal Reserve System (the Federal Reserve).
Usually, the maximum rate on these loans is six percent above the initial interest rate. We underwrite adjustable-rate loans under standards consistent with private mortgage insurance and secondary market underwriting criteria. We do not originate adjustable-rate mortgages with payment limitations that could produce negative amortization.
The adjustable-rate mortgage loans in our loan portfolio help mitigate the risk related to our exposure to changes in interest rates. However, there are unquantifiable credit risks resulting from potential increased costs to the borrower as a result of re-pricing adjustable-rate mortgage loans. During periods of rising interest rates, the risk of default on adjustable-rate mortgage loans may increase due to the upward adjustment of interest costs to the borrower. Further, although adjustable-rate mortgage loans allow us to increase the sensitivity of our asset base to changes in interest rates, the extent of this interest sensitivity is limited by the periodic and lifetime interest rate adjustment limitations. Accordingly, there can be no assurance that yields on our adjustable-rate mortgages will adjust sufficiently to compensate for increases to our cost of funds during periods of extreme interest rate increases.
The original contractual loan payment period for residential loans is normally 10 to 30 years. Because borrowers may refinance or prepay their loans without penalty, these loans tend to remain outstanding for a substantially shorter period of time. First mortgage loans customarily include “due-on-sale” clauses. This provision gives us the right to declare a loan immediately due and payable in the event the borrower sells or otherwise disposes of the real property subject to the mortgage. We enforce due-on-sale clauses through foreclosure and other legal proceedings to the extent available under applicable laws.
In general, loans are sold without recourse except for the repurchase right arising from standard contract provisions covering violation of representations and warranties or, under certain investor contracts, a default by the borrower on the first payment. We also have limited recourse exposure under certain investor contracts in the event a borrower prepays a loan in total within a specified period after sale, typically 120 days. The recourse is limited to a pro rata portion of the premium paid by the investor for that loan, less any prepayment penalty collectible from the borrower. There was one repurchase in 2015 totaling $385,000, two repurchases totaling $354,000 in 2014 and no repurchases in 2013.
Consumer Lending
Our primary consumer credit products (excluding first mortgage loans) are home equity lines of credit and equity-secured installment loans. At December 31, 2015, home equity lines of credit outstanding totaled $228.5 million and equity-secured installment loans totaled $89.7 million. In total, these product lines represented 88.3% of total consumer
11
Table of Contents
loans. Some home equity products grant a borrower credit availability of up to 100% of the appraised value (net of any senior mortgages) of their residence. However, typically maximum loan to value (LTV) limits are 89% for primary residences and 75% for all other properties. At December 31, 2015, we had $329.1 million in total commitments for home equity lines of credit. Home equity lines of credit offer customers potential Federal income tax advantages, the convenience of checkbook and debit card access, revolving credit features for a portion of the life of the loan and typically are more attractive in a low interest rate environment. Home equity lines of credit expose us to the risk that falling collateral values may leave us inadequately secured. The risk on installment products like home equity loans is mitigated as they amortize over time.
The following table shows our consumer loans at year-end, for the last five years.
| At December 31, | ||||||||||||||||||||||||||||||||||||||||
| 2015 | 2014 | 2013 | 2012 | 2011 | ||||||||||||||||||||||||||||||||||||
| (In Thousands) | Amount | Percent of Total Consumer Loans |
Amount | Percent of Total Consumer Loans |
Amount | Percent of Total Consumer Loans |
Amount | Percent of Total Consumer Loans |
Amount | Percent of Total Consumer Loans |
||||||||||||||||||||||||||||||
| Equity secured installment loans |
$ | 89,696 | 24.9 | % | $ | 73,011 | 22.3 | % | $ | 69,230 | 22.9 | % | $ | 59,091 | 20.4 | % | $ | 74,721 | 25.7 | % | ||||||||||||||||||||
| Home equity lines of credit |
228,512 | 63.4 | 218,652 | 66.8 | 193,255 | 63.9 | 195,936 | 67.8 | 192,917 | 66.3 | ||||||||||||||||||||||||||||||
| Personal loans |
17,604 | 4.9 | 16,082 | 4.9 | 16,397 | 5.4 | 12,408 | 4.3 | 7,192 | 2.5 | ||||||||||||||||||||||||||||||
| Unsecured lines of credit |
9,244 | 2.6 | 9,415 | 2.9 | 13,147 | 4.4 | 9,197 | 3.2 | 8,378 | 2.9 | ||||||||||||||||||||||||||||||
| Other |
15,193 | 4.2 | 10,383 | 3.1 | 10,205 | 3.4 | 12,369 | 4.3 | 7,771 | 2.6 | ||||||||||||||||||||||||||||||
|
|
|
|
|
|
|
|
|
|
|
|
|
|
|
|
|
|
|
|
|
|||||||||||||||||||||
| Total consumer loans |
$ | 360,249 | 100.0 | % | $ | 327,543 | 100.0 | % | $ | 302,234 | 100.0 | % | $ | 289,001 | 100.0 | % | $ | 290,979 | 100.0 | % | ||||||||||||||||||||
|
|
|
|
|
|
|
|
|
|
|
|
|
|
|
|
|
|
|
|
|
|||||||||||||||||||||
Loan Originations, Purchases and Sales
We engage in traditional lending activities primarily in Delaware, southeastern Pennsylvania, and contiguous areas of neighboring states. As a federal savings bank, however, we may originate, purchase and sell loans throughout the United States. We have purchased limited amounts of loans from outside our normal lending area when such purchases are deemed appropriate. We originate fixed-rate and adjustable-rate residential real estate loans through our banking offices.
During 2015 we originated $434.6 million of residential real estate loans. This compares to originations of $316.1 million in 2014. From time to time, we have purchased whole loans and loan participations in accordance with our ongoing asset and liability management objectives. There were no such purchases in either 2015 or 2014. Residential real estate loan sales totaled $286.2 million in 2015 and $201.8 million in 2014. We sell certain newly originated mortgage loans in the secondary market as a means of generating fee income to control the interest rate sensitivity of our balance sheet and to manage overall balance sheet mix. We hold certain fixed-rate mortgage loans for investment, consistent with our current asset/liability management strategies.
At December 31, 2015, we serviced approximately $106.5 million of residential mortgage loans for others, compared to $125.2 million at December 31, 2014. We also serviced residential mortgage loans for our own portfolio totaling $306.3 million and $218.3 million at December 31, 2015 and 2014, respectively.
Our consumer lending activity is conducted mainly through our branch offices and referrals from other parts of our business. We originate a variety of consumer credit products including home improvement loans, home equity lines of credit, automobile loans, unsecured lines of credit and other secured and unsecured personal installment loans.
We offer government-insured reverse mortgages to our customers. Our activity has been limited to acting as a correspondent originator for these loans. During 2015 we originated and sold $2.8 million in reverse mortgages compared to $1.8 million during 2014.
We originate commercial real estate and commercial loans through our commercial lending division. Commercial loans are made for working capital, financing equipment acquisitions, business expansion and other business purposes. During 2015 we originated $1.1 billion of commercial and commercial real estate loans compared to $925.6 million in 2014. To reduce our exposure on certain types of these loans, and/or to maintain relationships within internal lending
12
Table of Contents
limits, at times we will sell a portion of our commercial loan portfolio, typically through loan participations. Commercial loan sales totaled $22.6 million and $39.9 million in 2015 and 2014, respectively. These amounts represent gross contract amounts and do not necessarily reflect amounts outstanding on those loans. We also periodically buy participations from other banks. Commercial loan participation purchases totaled $66.1 million and $35.2 million in 2015 and 2014, respectively.
Any significant modification or additional exposure to one borrowing relationship exceeding $3.5 million must be approved by the Senior Management Loan Committee (SLC). The Executive Committee of the Board of Directors reviews the minutes of the SLC meetings. The Executive Committee also approves new credit exposures exceeding $10 million and new credit exposures in excess of $5 million for customers with higher risk profiles, larger existing relationship exposures, or multiple policy exceptions. Depending upon their experience and management position, individual officers of the Bank have the authority to approve smaller loan amounts. Our credit policy includes a $30 million “House Limit” to any one borrowing relationship. In rare circumstances, we will approve exceptions to the “House Limit”. Our policy allows for only 15 such relationships with an aggregate exposure of 10% of Tier I Capital plus ALLL. Currently, we have three relationships exceeding this limit. At December 31, 2015, the aggregate exposure over “House Limit” totaled 3.2% of Tier I Capital plus ALLL. Those three relationships were approved to exceed the “House Limit” because the credit profile was deemed strong, or because of a long relationship history with the borrower(s).
Fee Income from Lending Activities
We earn fee income from lending activities, including fees for originating loans, servicing loans and selling loans and loan participations. We also receive fee income for making commitments to originate construction, residential and commercial real estate loans. Additionally, we collect fees related to existing loans which include prepayment charges, late charges, assumption fees and swap fees. In addition, as part of the loan application process, the borrower may pay us for out-of-pocket costs to review the application, whether or not the loan is closed.
Most loan fees are not recognized in our Consolidated Statements of Operations immediately, but are deferred as adjustments to yield in accordance with GAAP, and are reflected in interest income over the expected life of the loan. Those fees represented interest income of $4.7 million, $3.1 million, and $2.5 million during 2015, 2014, and 2013, respectively. Loan fee income was mainly due to fee accretion on new and existing loans (including the acceleration of the accretion on loans that paid early), loan growth and prepayment penalties. The overall increase in loan fee income was the result of the growth in certain loan categories and higher prepayments during 2015.
LOAN LOSS EXPERIENCE, PROBLEM ASSETS AND DELINQUENCIES
Our results of operations can be negatively impacted by nonperforming assets, which include nonaccruing loans, nonperforming real estate investments, assets acquired through foreclosure and restructured loans. Nonaccruing loans are those on which the accrual of interest has ceased. Loans are placed on nonaccrual status immediately if, in our opinion, collection is doubtful, or when principal or interest is past due 90 days and collateral is insufficient to cover principal and interest payments. Interest accrued, but not collected at the date a loan is placed on nonaccrual status, is reversed and charged against interest income. In addition, the accretion of net deferred loan fees is suspended when a loan is placed on nonaccrual status. Subsequent cash receipts are applied either to the outstanding principal balance or recorded as interest income, depending on our assessment of the ultimate collectability of principal and interest.
We endeavor to manage our portfolio to identify problem loans as promptly as possible and take immediate actions to minimize losses. To accomplish this, our Loan Administration and Risk Management Department monitors the asset quality of our loans and investments in real estate portfolios and reports such information to the Credit Policy, Audit and Executive Committees of the Board of Directors and the Bank’s Controller’s Department.
SOURCES OF FUNDS
We manage our liquidity risk and funding needs through our Treasury function and our Asset/Liability Committee. Historically, we have had success in growing our loan portfolio. For example, during the year ended December 31, 2015, net loan growth resulted in the use of $285.7 million in cash, as compared to $86.6 during 2014. The loan growth in 2015
13
Table of Contents
was spread across all loan categories and was driven by the Alliance acquisition in the fourth quarter of 2015 and our continued strong organic growth in lending. We expect this trend to continue during 2016. As a result of increased deposit growth, our loan-to-total customer funding ratio at December 31, 2015 was 97%, better than our 2015 strategic goal of 101%. We have significant experience managing our funding needs through both borrowings and deposit growth.
As a financial institution, we and the Bank have access to several sources of funding. Among these are:
| • | Net income |
| • | Retail deposit programs |
| • | Loan repayments |
| • | FHLB borrowings |
| • | Repurchase agreements |
| • | Federal Discount Window access |
| • | Brokered deposits |
Our branch expansion and renovation program has been focused on expanding our retail footprint in Delaware and southeastern Pennsylvania and attracting new customers in part to provide additional deposit growth. However, in recent years we have purposefully reduced reliance on higher-cost, typically single-service certificate of deposit (CD) accounts. Core customer deposit growth (deposits excluding CDs) was strong, equaling $311.5 million during 2015, an 11% increase over 2014.
Deposits
WSFS Bank is the largest independent full-service bank and trust institution headquartered and operating in Delaware. The Bank primarily attracts deposits through its retail branch offices and loan production offices, in Delaware’s New Castle, Sussex and Kent Counties, as well as nearby southeastern Pennsylvania.
The Bank offers various deposit products to our customers, including savings accounts, demand deposits, interest-bearing demand deposits, money market deposit accounts and certificates of deposit. In addition, the Bank accepts “jumbo” certificates of deposit with balances in excess of $100,000 from individuals, businesses and municipalities in Delaware.
The following table shows the maturities of certificates of deposit of $100,000 or more as of December 31, 2015:
| (In Thousands) | December 31, | |||
| Maturity Period |
2015 | |||
| Less than 3 months |
$ | 76,288 | ||
| Over 3 months to 6 months |
36,617 | |||
| Over 6 months to 12 months |
67,848 | |||
| Over 12 months |
73,260 | |||
|
|
|
|||
| $ | 254,013 | |||
|
|
|
|||
Federal Home Loan Bank Advances
As a member of the FHLB, we are able to obtain FHLB advances. At December 31, 2015, we had $669.5 million in FHLB advances with a weighted average rate of 0.50%. Outstanding advances from the FHLB had rates ranging from 0.42% to 1.23% at December 31, 2015. Pursuant to collateral agreements with the FHLB, the advances are secured by qualifying first mortgage loans, qualifying fixed-income securities, FHLB stock and an interest-bearing demand deposit account with the FHLB. We are required to purchase and hold shares of capital stock in the FHLB in an amount at least equal to 4.00% of our borrowings from it, plus 0.10% of our member asset value. As of December 31, 2015, our FHLB stock investment totaled $30.5 million.
14
Table of Contents
We received $2.2 million in dividends from the FHLB during 2015. For additional information regarding FHLB stock, see Note 11 to the Consolidated Financial Statements.
Trust Preferred Borrowings
In 2005, the Trust issued $67.0 million aggregate principal amount of Pooled Floating Rate Securities at a variable interest rate of 177 basis points over the three-month LIBOR rate. These securities are callable and have a maturity date of June 1, 2035.
Federal Funds Purchased and Securities Sold Under Agreements to Repurchase
During 2015 and 2014, we purchased federal funds as a short-term funding source. At December 31, 2015, we had purchased $128.2 million in federal funds at an average rate of 0.45%, compared to $103.2 million in federal funds at a rate of 0.29% at December 31, 2014.
As of December 31, 2015, we no longer had securities under agreements to repurchase as a funding source. At December 31, 2014, we had $25.0 million of securities sold under agreements to repurchase with a fixed rate of 2.98% and a scheduled maturity of January 1, 2015. The underlying securities were MBS with a book value of $35.9 million as of December 31, 2014.
Senior Debt
In 2012 we issued and sold $55.0 million in aggregate principal amount of 6.25% Senior Notes due 2019 (Senior Debt). The Senior Debt is unsecured and ranks equally with all of our other present and future unsecured, unsubordinated obligations. The Senior Debt is effectively subordinated to our secured indebtedness and structurally subordinated to the indebtedness of our subsidiaries. Interest payments on the Senior Debt are due quarterly in arrears on March 1, June 1, September 1 and December 1 of each year. At our option, the Senior Debt is callable, in whole or in part, after five years at a price equal to the outstanding principal amount to be redeemed plus accrued and unpaid interest. The Senior Debt matures on September 1, 2019.
PERSONNEL
As of December 31, 2015, we had 947 full-time equivalent Associates (employees). Our Associates are not represented by a collective bargaining unit. We believe our relationship with our Associates is very good, as evidenced by our being named a “Top Workplace” by an independent survey of our Associates for the last ten years.
REGULATION
Overview
The Company and the Bank are subject to extensive federal and state banking laws, regulations, and policies that are intended primarily for the protection of depositors. The Deposit Insurance Fund of the Federal Deposit Insurance Corporation (FDIC) and the banking system as a whole, are not for the protection of our other creditors and stockholders. The Office of the Comptroller of the Currency (OCC) is the Bank’s primary regulator and the Federal Reserve is the Company’s primary regulator.
The statutes enforced by, and regulations and policies of, these agencies affect most aspects of our business, including prescribing permissible types of activities and investments, the amount of required capital and reserves, requirements for branch offices, the permissible scope of our activities and various other requirements.
The Bank’s deposits are insured by the FDIC to the fullest extent allowed by law. As an insurer of bank deposits, the FDIC promulgates regulations, conducts examinations, requires the filing of reports and generally supervises the operations of all institutions to which it provides deposit insurance.
15
Table of Contents
Financial Reform Legislation
Proposals to change the laws and regulations governing the banking industry are frequently introduced in Congress, in the state legislatures and by various bank regulatory agencies.
In 2010, the President signed into law the Dodd-Frank Act. This Act imposed new restrictions and an expanded framework of regulatory oversight for financial institutions and their holding companies, including depository institutions. The new law also established the Consumer Financial Protection Bureau as an independent agency within the Federal Reserve. The following discussion summarizes significant aspects of the new law that may affect us. Certain significant regulations under the Dodd-Frank Act have not been finalized and therefore we cannot yet determine the full impact on our business and operations.
The following aspects of the Dodd-Frank Act, among others, are related to the operations of our Bank:
| • | The Office of Thrift Supervision, formerly the primary regulator of federal savings associations and savings and loan holding companies, was merged into the OCC and the Federal Reserve and the federal savings association charter has been preserved under OCC jurisdiction. |
| • | The Consumer Financial Protection Bureau has been established within the Federal Reserve, empowered to exercise broad regulatory, supervisory and enforcement authority with respect to both new and existing consumer financial protection laws. Depository institutions of less than $10 billion in total assets, like our Bank, are subject to the supervision and enforcement of their primary federal banking regulator with respect to the federal consumer financial protection laws. |
| • | The prohibition on payment of interest on demand deposits has been repealed. |
| • | Federal preemption of state laws applied to federal savings associations has been amended. Now, state law is preempted with respect to federal savings associations to the same extent such laws would be preempted with respect to a national bank. A state consumer financial law is preempted whenever it has a discriminatory intent or effect on a federal savings association compared to state-chartered institutions; prevents or significantly interferes with a federal savings association’s federal powers; or it is preempted by a federal law other than the National Bank Act. The OCC must make a preemption determination on a case-by-case basis with respect to a particular state consumer financial law or other state law with substantively equivalent terms. In addition, state consumer financial laws are no longer preempted with respect to the activities of a federal savings association’s subsidiaries. |
| • | Deposit insurance coverage has been permanently increased to $250,000 per depositor per insured depository institution. |
| • | The deposit insurance assessment base has been changed to equal a depository institution’s total consolidated assets minus the sum of its average tangible equity during the assessment period. |
| • | The minimum reserve ratio of the Deposit Insurance Fund increased to 1.35% of estimated annual insured deposits or assessment base. However, the FDIC was directed to offset the effect of the increased reserve ratio for insured depository institutions with total consolidated assets of less than $10 billion. |
The following aspects of the Dodd-Frank Act, among others, are related to the operations of the Company:
| • | Supervisory authority over savings and loan holding companies has been transferred to the Federal Reserve. |
| • | Leverage capital requirements and risk-based capital requirements applicable to depository institutions and bank holding companies have been extended to savings and loan holding companies following a five year grace period. |
| • | The Federal Deposit Insurance Act (FDIA) was amended to direct federal regulators to require depository institution holding companies to serve as a source of strength for their depository institution subsidiaries. |
16
Table of Contents
| • | The Federal Reserve can require a grandfathered unitary savings and loan holding company that conducts commercial or manufacturing activities or other nonfinancial activities in addition to financial activities to conduct all or part of its financial activities in an intermediate savings and loan holding company. The Federal Reserve is required to promulgate rules setting forth the criteria for when a grandfathered unitary savings and loan holding company would be required to establish an intermediate holding company, but to date it has not yet proposed any such rules. |
| • | Public companies are required to provide their shareholders with a nonbinding vote (i) at least once every three years on the compensation paid to executives, and (ii) at least once every six years on whether they should have such “say on pay” vote every one, two or three years. |
| • | Additional provisions, including some not specifically aimed at savings associations and savings and loan holding companies, nonetheless may have an impact on us. |
Some of these provisions have the consequence of increasing our expenses, decreasing our revenues, and changing the activities in which we choose to engage. We expect that the Dodd-Frank Act will continue to increase our operating and compliance costs. Specific impacts of the Dodd-Frank Act on our current activities or new financial activities will become evident in the future, and our financial performance and the markets in which we operate will continue to depend on the manner in which the relevant agencies develop and implement the required rules and the reaction of market participants to these regulatory developments. Some aspects of the Dodd-Frank Act continue to be subject to rulemaking and will take effect over several years, making it difficult to anticipate the overall financial impact on us, our customers, or the financial industry in general.
RECENT LEGISLATION
Basel III
In 2013, the Federal banking agencies approved the final rules implementing the Basel Committee on Banking Supervision (BCBS) capital guidelines for U.S. banking organizations. Under the final rules as of January 2015, minimum requirements increased for both the quantity and quality of capital maintained by the Company and the Bank. The rules included a new common equity Tier 1 capital to risk-weighted assets minimum ratio of 4.5%, raised the minimum ratio of Tier 1 capital to risk-weighted assets from 4.0% to 6.0%, required a minimum ratio of total capital to risk-weighted assets of 8.0%, and required a minimum Tier 1 leverage ratio of 4.0%. The final rule also established a new capital conservation buffer, comprised of common equity Tier 1 capital, above the regulatory minimum capital requirements. This capital conservation buffer will be phased-in beginning January 1, 2016 at 0.625% of risk-weighted assets and increase each subsequent year by an additional 0.625% until reaching its final level of 2.5% on January 1, 2019. The final rules also revised the standards for an insured depository institution to be “well-capitalized” under the banking agencies’ prompt corrective action framework, requiring a common equity Tier 1 capital ratio of 6.5%, Tier 1 capital ratio of 8.0% and total capital ratio of 10.0%, while leaving unchanged the existing 5.0% leverage ratio requirement. Strict eligibility criteria for regulatory capital instruments were also implemented under the final rules. Newly issued trust preferred securities and cumulative perpetual preferred stock may no longer be included in Tier 1 capital. However, for depository institution holding companies of less than $15 billion in total consolidated assets, such as the Company, most outstanding trust preferred securities and other non-qualifying securities issued prior to May 19, 2010 are permanently grandfathered to be included in Tier 1 capital (up to a limit of 25% of Tier 1 capital, excluding non-qualifying capital instruments).
The phase-in period for the final rules began for us on January 1, 2015, with full compliance with all of the final rule’s requirements phased in over a multi-year schedule and should be fully phased-in by January 1, 2019. As of December 31, 2015, WSFS Bank was “well-capitalized” under the capital rules.
In October 2014, the BCBS published Basel III: The Net Stable Funding Ratio. The NSFR is a significant component of Basel III as it requires banking organizations to maintain a stable funding position in relation to their on- and off-balance sheet activities over a one year horizon. It is being implemented to reduce the likelihood that disruptions to a banking organization’s normal source of funding will not significantly erode its liquidity position. This requirement will become effective January 1, 2018. The BCBS’ NSFR applies to internationally active banking organizations, but may also be applied to other banking organizations. The U.S. banking regulators have not yet proposed a rule implementing the
17
Table of Contents
NSFR, and as such, it is not known whether the NSFR will apply to banking organizations of our size and profile in the U.S. We are mindful of this and other potential risk management and reporting requirements. Management will continue to monitor any additional developments and their potential impact to our liquidity requirements.
Debit Card Interchange Fees
The Federal Reserve has issued rules under the Electronic Funds Transfer Act, as amended by the Dodd-Frank Act, to limit interchange fees that an issuer may receive or charge for an electronic debit card transaction. Under the rules, the maximum permissible interchange fee that an issuer may receive for an electronic debit transaction is the sum of 21 cents per transaction and five basis points multiplied by the value of the transaction. In addition, the rules allow for an upward adjustment of no more than one cent to an issuer’s debit card interchange fee if the issuer develops and implements policies and procedures reasonably designed to achieve the fraud-prevention standards set out in the rule.
In accordance with the statute, issuers that, together with their affiliates, have assets of less than $10.0 billion on the annual measurement date (December 31), such as the Bank, are exempt from the debit card interchange fee standards.
Regulation of the Company
General
The Company is a registered savings and loan holding company and is subject to the regulation, examination, supervision and reporting requirements of the Federal Reserve.
The Company is also a public company subject to the reporting requirements of the SEC. Certain reports that we file with or furnish to the SEC, including Annual Reports on Form 10-K, Quarterly Reports on Form 10-Q, Current Reports on Form 8-K, and all amendments to those reports, are available free of charge on the investor relations page of our website at www.wsfsbank.com by following the link, “About WSFS” followed by “Investor Relations”. The information on our website is not incorporated by reference in this Annual Report on Form 10-K.
Sarbanes-Oxley Act of 2002
In July 2002, Congress enacted the Sarbanes-Oxley Act of 2002, which addresses, among other issues, corporate governance, auditing and accounting, executive compensation, and enhanced and timely disclosure of corporate information. Section 404 of the Sarbanes-Oxley Act, and regulations adopted by the SEC, require us to include in our Annual Reports on Form 10-K a report stating management’s responsibility to establish and maintain adequate internal controls over financial reporting and management’s conclusion on the effectiveness of the internal controls at year end. Additionally, our independent registered public accounting firm is required to attest to and report on management’s evaluation of internal control over financial reporting.
Restrictions on Acquisitions
Federal law generally prohibits a savings and loan holding company, without prior regulatory approval, from acquiring direct or indirect control of all, or substantially all, of the assets of any other savings association or savings and loan holding company, or more than 5% of the voting shares of a savings association or savings and loan holding company. These provisions also prohibit, among other things, any director or officer of a savings and loan holding company, or any individual who owns or controls more than 25% of the voting shares of such holding company, from acquiring control of any savings association that is not a subsidiary of such savings and loan holding company, unless the acquisition is approved by the Federal Reserve.
The Company is a grandfathered unitary thrift holding company. Should we lose that status, we will be constrained in our ability to acquire companies or business lines that engage in non-banking activities, and may be required to divest any companies that we already own that engage in non-banking activities.
18
Table of Contents
Safe and Sound Banking Practices
Savings and loan holding companies and their non-bank subsidiaries are prohibited from engaging in activities that represent unsafe and unsound banking practices or constitute violations of laws or regulations. For example, for bank holding companies, the Federal Reserve’s Regulation Y requires a holding company to give the Federal Reserve Board prior notice of any redemption or repurchase of its own equity securities if the consideration to be paid, together with the consideration paid for any repurchases in the preceding year, is equal to 10% or more of the company’s consolidated net worth. The Federal Reserve may oppose the transaction if it believes the transaction would constitute an unsafe or unsound practice or would violate any law or regulation. As another example, a holding company could not impair its subsidiary bank’s soundness by causing it to make funds available to non-banking subsidiaries or their customers if the Federal Reserve believed it not prudent to do so. The Federal Reserve may apply same or similar standards to savings and loan holding companies. The Federal Reserve can assess civil money penalties on a party for activities conducted on a knowing or reckless basis, if those activities caused more than a minimal loss to an institution or pecuniary gain to the party. The penalties can be as high as $425,000 for each day the activity continues.
Source of Strength
In accordance with FDIA, the Company is expected to act as a source of financial and managerial strength to the Bank. Under this policy, the holding company is expected to commit resources to support its bank subsidiary, including at times when the holding company may not be in a financial position to provide it.
The Dodd-Frank Act added additional guidance regarding the source of strength doctrine and has directed the regulatory agencies to promulgate regulations to revise the capital requirements for holding companies to a level that is not less than those applicable to insured depository institutions.
Dividends
The principal source of the Company’s cash is from dividends from the Bank. Our earnings and activities are affected by federal, state and local laws and regulations. For example, these include limitations on the ability of the Bank to pay dividends to the holding company and our ability to pay dividends to our stockholders. It is the policy of the Federal Reserve that holding companies should pay cash dividends on common stock only out of income available over the past year and only if prospective earnings retention is consistent with the organization’s expected future capital needs and current and prospective financial condition. The policy provides that holding companies should not maintain a level of cash dividends that undermines the holding company’s ability to serve as a source of strength to its banking subsidiary. Consistent with this policy, a banking organization should have comprehensive policies on dividend payments that clearly articulate the organization’s objectives and approaches for maintaining a strong capital position and achieving the objectives of the Federal Reserve’s policy statement.
In 2009, the Federal Reserve issued a supervisory letter providing greater clarity to its policy statement on the payment of dividends by holding companies. In this letter, the Federal Reserve stated that when a holding company’s board of directors is considering the payment of dividends, it should consider, among other things, the following factors: (i) overall asset quality, potential need to increase reserves and write down assets, and concentrations of credit; (ii) potential for unanticipated losses and declines in asset values; (iii) implicit and explicit liquidity and credit commitments, including off-balance sheet and contingent liabilities; (iv) quality and level of current and prospective earnings, including earnings capacity under a number of plausible economic scenarios; (v) current and prospective cash flow and liquidity; (vi) ability to serve as an ongoing source of financial and managerial strength to depository institution subsidiaries insured by the FDIC, including the extent of double leverage and the condition of subsidiary depository institutions; (vii) other risks that affect the holding company’s financial condition and are not fully captured in regulatory capital calculations; (viii) level, composition, and quality of capital; and (ix) ability to raise additional equity capital in prevailing market and economic conditions (the Dividend Factors). It is particularly important for a holding company’s board of directors to ensure that the dividend level is prudent relative to the organization’s financial position and is not based on overly optimistic earnings scenarios. In addition, a holding company’s board of directors should strongly consider, after careful analysis of the Dividend Factors, reducing, deferring, or eliminating dividends when the quantity
19
Table of Contents
and quality of the holding company’s earnings have declined or the holding company is experiencing other financial problems, or when the macroeconomic outlook for the holding company’s primary profit centers has deteriorated. The Federal Reserve further stated that, as a general matter, a holding company should eliminate, defer or significantly reduce its distributions if: (i) its net income available to shareholders for the past four quarters, net of dividends previously paid during that period, is not sufficient to fully fund the dividends, (ii) its prospective rate of earnings retention is not consistent with its capital needs and overall current and prospective financial condition, or (iii) it will not meet, or is in danger of not meeting, its minimum regulatory capital adequacy ratios. Failure to do so could result in a supervisory finding that the holding company is operating in an unsafe and unsound manner.
Additionally, as discussed above, the Federal Reserve possesses enforcement powers over savings and loan holding companies and their non-bank subsidiaries to prevent or remedy actions that represent unsafe or unsound practices, or violations of applicable statutes and regulations. Among these powers is the ability to proscribe the payment of dividends by bank and savings and loan holding companies.
Cypress
Cypress is a registered investment advisor under the Investment Advisers Act of 1940, as amended, and as such is supervised by the SEC. The Investment Advisers Act imposes numerous obligations on registered investment advisers, including record-keeping, operational and marketing requirements, disclosure obligations and prohibitions on fraudulent activities. The SEC is authorized to institute proceedings and impose sanctions for violations of the Investment Advisers Act, ranging from fines and censure to termination of an investment adviser’s registration. Investment advisers also are subject to certain state securities laws and regulations. Noncompliance with the Investment Advisers Act or other federal and state securities laws and regulations could result in investigations, sanctions, disgorgement, fines and reputational damage.
Regulation of WSFS Bank
General
As a federally chartered savings institution the Bank is subject to regulation, examination and supervision by the OCC. The lending activities and other investments of the Bank must comply with various federal regulatory requirements. The OCC periodically examines the Bank for compliance with regulatory requirements. The FDIC also has the authority to conduct special examinations of the Bank. The Bank must file reports with the OCC describing its activities and financial condition. The Bank is also subject to certain reserve requirements promulgated by the Federal Reserve.
Transactions with Affiliates; Tying Arrangements
The Bank is subject to certain restrictions in its dealings with us and our affiliates. Transactions between savings associations and any affiliate are governed by Sections 23A and 23B of the Federal Reserve Act, with additional limitations found in Section 11 of the Home Owners’ Loan Act. An affiliate of a savings association, generally, is any company or entity which controls or is under common control with the savings association or any subsidiary of the savings association that is commonly controlled by an affiliate or a bank or savings association. In a holding company context, the parent holding company of a savings association (such as the Company) and any companies which are controlled by such parent holding company are affiliates of the savings association. Generally, Sections 23A and 23B (i) limit the extent to which the savings institution or its subsidiaries may engage in “covered transactions” with any one affiliate to an amount equal to 10% of such institution’s capital stock and surplus, and limit the aggregate of all such transactions with all affiliates to an amount equal to 20% of such capital stock and surplus and (ii) require that all such transactions be on terms substantially the same, or at least as favorable, to the institution or subsidiary as those that would be provided to a non-affiliate. The term “covered transaction” includes the making of loans to the affiliate, purchase of assets from the affiliate, issuance of a guarantee on behalf of the affiliate and several other types of transactions. In addition to the restrictions imposed by Sections 23A and 23B, the Home Owners’ Loan Act also prohibits a savings association from (i) lending or otherwise extending credit to an affiliate that engages in any activity impermissible for bank holding companies, or (ii) purchasing or investing in any stocks, bonds, debentures, notes or similar obligations of any affiliate, except for the purchase of shares of a subsidiary.
20
Table of Contents
Regulatory Capital Requirements
Under revised capital regulations effective January 1, 2015 for the Bank, savings institutions must maintain “tangible” capital equal to 1.5% of average total assets, common equity Tier 1 equal to 4.5% of risk-weighted assets, Tier 1 capital equal to 6% of risk-weighted assets, total capital (a combination of Tier 1 and Tier 2 capital) equal to 8% of risk-weighted assets, and a leverage ratio of Tier 1 capital to average total consolidated assets equal to 4%. The OCC’s revised prompt corrective action regulations require that in order to be “well capitalized”, a savings association must have a common equity Tier 1 capital ratio of 6.5%, Tier 1 capital ratio of 8.0%, total capital ratio of 10.0%, and 5.0% leverage ratio, and not be subject to any written agreement, order or capital directive, or prompt corrective action directive issued by the OCC. In addition, the prompt corrective action regulations impose certain restrictions on savings associations that have a total risk-based capital ratio that is less than 8.0%, a ratio of Tier 1 capital to risk-weighted assets of less than 6.0% or a ratio of common Tier 1 capital to risk-weighted assets of less than 5.0%.
The revised capital rules define common equity Tier 1 capital as predominantly comprised of common stock instruments (including retained earnings), related surplus, certain minority interests in the equity accounts of fully consolidated subsidiaries (subject to certain limitations), less certain intangible assets and, subject to certain limitations, mortgage and non-mortgage servicing rights and deferred tax assets. Additional Tier 1 capital includes noncumulative perpetual preferred stock and related surplus, and certain minority interests in the equity accounts of fully consolidated subsidiaries not included in common equity Tier 1 capital (subject to certain limitations). Tier 2 capital includes subordinated debt with a minimum original maturity of five years, related surplus, certain minority interests in in the equity accounts of fully consolidated subsidiaries not included in Tier 1 capital (subject to certain limitations), and limited amounts of a bank’s allowance for loan and lease losses (ALLL). Tangible capital is given the same definition as Tier 1 capital. The capital rules require that common equity Tier 1 capital be reduced by an amount equal to a savings institution’s debt and equity investments in “non-includable” subsidiaries engaged in activities not permissible to national banks, other than subsidiaries engaged in activities undertaken as agent for customers or in mortgage banking activities and subsidiary depository institutions or their holding companies.
The risk weights assigned by the risk-based capital regulation range from 0% for cash, U.S. government securities, and certain other assets, 50% for qualifying residential mortgage exposures, 100% for corporate exposures and non-qualifying mortgage loans and certain other assets, to over 100% for certain past-due exposures and equity exposures.
At December 31, 2015, the Bank was in compliance with the minimum common equity Tier 1 capital, Tier 1 capital, total capital, tangible capital and leverage capital requirements.
The Company is subject to similar minimum capital requirements as the Bank, except that the Company is not subject to a tangible capital ratio. As of December 31, 2015, the Company was in compliance with the minimum common equity Tier 1 capital, Tier 1 capital, total capital, and leverage capital requirements. For the Company to be “well capitalized,” the Bank must be well-capitalized and the Company must not be subject to any written agreement, order, capital directive, or prompt corrective action directive issued by the Federal Reserve to meet and maintain a specific capital level for any capital measure. As of December 31, 2015, the Company met all the requirements to be deemed well-capitalized.
Dividend Restrictions
OCC regulations govern capital distributions by savings institutions, which include cash dividends, stock repurchases and other transactions charged to the capital account of a savings institution to make capital distributions. A savings institution must file an application for OCC approval of the capital distribution if either (1) the total capital distributions for the applicable calendar year (including the proposed capital distribution) exceed the sum of the institution’s net income for that year to date plus the institution’s retained net income for the preceding two years, (2) the institution would not be at least adequately capitalized following the distribution, (3) the distribution would violate any applicable statute, regulation, agreement or OCC-imposed condition, or (4) the institution is not eligible for expedited treatment of its filings. If an application is not required to be filed, savings institutions that are a subsidiary of a savings and loan holding company, such as the Bank (as well as certain other institutions) must still file a notice with the OCC at least 30 days before the board of directors declares a dividend or approves a capital distribution.
21
Table of Contents
An institution that either before or after a proposed capital distribution fails to meet its then-applicable minimum capital requirement may not make any capital distributions without the prior written approval of the OCC. In addition, the OCC may prohibit a proposed capital distribution, which would otherwise be permitted by OCC regulations, if the OCC determines that such distribution would constitute an unsafe or unsound practice.
Under federal law, an insured depository institution may not make any capital distribution if the capital distribution would cause the institution to become undercapitalized or if it is already undercapitalized. In addition, federal regulators have the authority to restrict or prohibit the payment of dividends for safety and soundness reasons. The FDIC also prohibits an insured depository institution from paying dividends on its capital stock or interest on its capital notes or debentures (if such interest is required to be paid only out of net profits) or distributing any of its capital assets while it remains in default in the payment of any assessment due the FDIC. The Bank is currently not in default in any assessment payment to the FDIC.
Insurance of Deposit Accounts
The Bank’s deposits are insured to the maximum extent permitted by the Deposit Insurance Fund. As insurer, the FDIC is authorized to conduct examinations of, and to require reporting by, insured institutions. It also may prohibit any insured institution from engaging in any activity determined by regulation or order to pose a serious threat to the FDIC. The FDIC also has the authority to initiate enforcement actions against savings institutions, after giving the OCC an opportunity to take such action.
Pursuant to the Dodd-Frank Act, the FDIA was amended to increase the maximum deposit insurance amount per depositor per depository institution from $100,000 to $250,000.
The FDIC has adopted a risk-based premium system that provides for quarterly assessments. In addition, all institutions with deposits insured by the FDIC are required to pay assessments to fund interest payments on bonds issued by the Financing Corporation, a mixed-ownership government corporation established to recapitalize the predecessor to the Deposit Insurance Fund. These assessments will continue until the Financing Corporation bonds mature in 2019.
In 2011, the FDIC issued a final rule to implement changes to its assessment base used to determine risk-based premiums for insured depository institutions as required under the Dodd-Frank Act and also changed the risk-based pricing system necessitated by changes to the assessment base. These changes took effect for the quarter beginning April 1, 2011. Under the revised system, the assessment base was changed to equal average consolidated total assets less average tangible equity. Institutions other than large and highly complex institutions are placed in one of four risk categories.
The FDIC assessment rates range from approximately 5 basis points to 45 basis points (depending on applicable adjustments for unsecured debt and brokered deposits) until such time as the FDIC’s reserve ratio equals 1.15%. Once the FDIC’s reserve ratio reaches 1.15% and the reserve ratio for the immediately prior assessment period is less than 2.0%, the applicable assessment rates may range from 3 basis points to 30 basis points (subject to applicable adjustments for unsecured debt and brokered deposits). If the prior assessment period is equal to or greater than 2.0% and less than 2.5%, the assessment rates may range from 2 basis points to 28 basis points and if the prior assessment period is greater than 2.5%, the assessment rates may range from 1 basis point to 25 basis points. The minimum reserve ratio of the Deposit Insurance Fund has increased to 1.35% of estimated annual insured deposits or assessment base, however, the FDIC is directed to “offset the effect” of the increased reserve ratio for insured depository institutions with total consolidated assets of less than $10 billion.
Future changes in insurance premiums could have an adverse effect on the operating expenses and results of operations and we cannot predict what insurance assessment rates will be in the future.
The FDIC may terminate the deposit insurance of any insured depository institution, including us, if it determines after a hearing that the institution has engaged or is engaging in unsafe or unsound practices, is in an unsafe or unsound condition to continue operations, or has violated any applicable law, regulation, order or any condition imposed by an agreement with the FDIC. It also may suspend deposit insurance temporarily during the hearing process for the permanent
22
Table of Contents
termination of insurance, if the institution has no tangible capital. Management is not aware of any existing circumstances that would result in termination of our deposit insurance.
Federal Reserve System
Pursuant to regulations of the Federal Reserve, a savings institution must maintain reserves against its transaction accounts. During 2015, no reserves were required to be maintained on the first $14.5 million of transaction accounts, reserves of 3% were required to be maintained against the next $89.1 million of transaction accounts and a reserve of 10% was required to be maintained against all remaining transaction accounts. These percentages are subject to adjustment by the Federal Reserve. Because required reserves must be maintained in the form of vault cash or in a non-interest bearing account at a Federal Reserve Bank, the effect of the reserve requirement may reduce the amount of an institution’s interest-earning assets.
CEO pay ratio disclosure
On August 5, 2015, the SEC adopted a new rule requiring public companies to disclose the CEO’s annual total compensation, the annual total compensation of the company’s median employee and the ratio of these two amounts in certain SEC filings that require executive compensation information. With certain exceptions, registrants must comply with this rule for the first fiscal year beginning on or after January 1, 2017.
As a financial services organization, we are subject to a number of risks inherent in our transactions and present in the business decisions we make. Described below are the primary risks and uncertainties that if realized could have a material and adverse effect on our business, financial condition, results of operations or cash flows, and our access to liquidity. The risks and uncertainties described below are not the only risks we face.
We have identified our major risk categories as: market risk, credit risk, capital and liquidity risk, compliance risk, operational risk, strategic risk, reputational risk and model risk. These risk factors and other risks we may face are discussed in more detail in other sections of this report. You should carefully consider the following risks, in addition to the other information in this report, before deciding to invest in our securities.
Risks Related to WSFS
1. Market Risk
Difficult market conditions and unfavorable economic trends could adversely affect our industry and our business.
We are exposed to downturns in the Delaware, mid-Atlantic and overall U.S. economy and housing markets. While certain economic conditions in the United States have shown signs of improvement in recent years, economic growth has been slow and uneven as consumers continue to recover from previously high unemployment rates, lower housing values, concerns about the level of U.S. government debt and fiscal actions that may be taken to address this, as well as economic and political conditions in the global markets. Unfavorable economic trends, sustained high unemployment, and declines in real estate values can cause a reduction in the availability of commercial credit and can negatively impact the credit performance of commercial and consumer loans, resulting in increased write-downs. These negative trends can cause economic pressure on consumers and businesses and diminish confidence in the financial markets, which may adversely affect our business, financial condition, results of operations and ability to access capital. A worsening of these conditions, such as a recession or economic slowdown, would likely exacerbate the adverse effects of these difficult market conditions on us and others in the financial services industry. In particular, we may face the following risks in connection with these events:
| • | An increase in the number of customers unable to repay their loans in accordance with the original terms, which could result in a higher level of loan losses and provision for loan losses; |
23
Table of Contents
| • | Impaired ability to assess the creditworthiness of customers as the models and approaches we use to select, manage and underwrite our customers become less predictive of future performance; |
| • | Impaired ability to estimate the losses inherent in our credit exposure as the process we use to make such estimates requires difficult, subjective and complex judgments based on forecasts of economic or market conditions that might impair the ability of our customers to repay their loans, and this estimating process becomes less accurate and thus less reliable as economic conditions worsen; |
| • | Increases in foreclosures, delinquencies and customer bankruptcies, as well as more restricted access to commercial credit; |
| • | Impaired ability to access the capital markets or otherwise obtain needed funding on attractive terms or at all; |
| • | Changes in the regulatory environment, including regulations promulgated or to be promulgated under the Dodd-Frank Act, also could influence recognition of loan losses and our allowance for loan losses; |
| • | Downward pressure on our stock price; and |
| • | Increased competition due to intensified consolidation of the financial services industry. |
Changes in interest rates and other factors beyond our control could have an adverse impact on our earnings.
Our operating income and net income depend to a significant extent on our net interest margin, which is the difference between the interest yields we receive on loans, securities and other interest-earning assets and the interest rates we pay on interest-bearing deposits and other liabilities. Net interest margin is affected by changes in market interest rates, because different types of assets and liabilities may react differently, and at different times, to market interest rate changes. When interest-bearing liabilities mature or reprice more quickly than interest-earning assets in a period, an increase in market rates of interest could reduce net interest income. Similarly, when interest-earning assets mature or reprice more quickly than interest-bearing liabilities, falling interest rates could reduce net interest income. These rates are highly sensitive to many factors beyond our control, including competition, general economic conditions and monetary and fiscal policies of various governmental regulatory agencies, including the Federal Reserve.
We attempt to manage our risk from changes in market interest rates by adjusting the rates, maturity, repricing, and balances of our different types of interest-earning assets and interest-bearing liabilities, but interest rate risk management techniques are not exact. As a result, a rapid increase or decrease in interest rates could have an adverse effect on our net interest margin and results of operations. The results of our interest rate sensitivity simulation models depend upon a number of assumptions which may prove to be inaccurate. There can be no assurance that we will be able to successfully manage our interest rate risk. In addition, increases in market interest rates and/or adverse changes in the local residential real estate market, the general economy or consumer confidence would likely have a significant adverse impact on our non-interest income, as a result of reduced demand for residential mortgage loans that we pre-sell.
The market value of our investment securities portfolio may be impacted by the level of interest rates and the credit quality and strength of the underlying collateral.
As of December 31, 2015, we owned investment securities classified as available-for-sale with an aggregate historical cost of $724.1 million and an estimated fair value of $721.0 million. Future changes in interest rates may reduce the market value of these and other securities.
Our net interest income varies as a result of changes in interest rates as well as changes in interest rates across the yield curve. When interest rates are low, borrowers have an incentive to refinance into mortgages with longer initial fixed rate periods and fixed rate mortgages, causing our securities to experience faster prepayments. Increases in prepayments on our portfolio will cause our premium amortization to accelerate, lowering the yield on such assets. If this happens, we could experience a decrease in interest income, which may negatively impact our results of operations and financial position.
24
Table of Contents
In addition, our securities portfolio is subject to risk as a result of our exposure to the credit quality and strength of the issuers of the securities or the collateral backing such securities. Any decrease in the value of the underlying collateral will likely decrease the overall value of our securities, affecting equity and possibly impacting earnings.
The soundness of other financial institutions could adversely affect us.
Our ability to engage in routine funding transactions could be adversely affected by the actions and commercial soundness of other financial institutions. Defaults by, or even rumors or questions about, one or more financial services institutions, or the financial services industry generally, have led to market-wide liquidity problems and could lead to losses or defaults by us or by other institutions. Such events could materially and adversely affect our results of operations.
2. Credit Risk
Significant increases of nonperforming assets from the current level, or greater than anticipated costs to resolve these credits, will have an adverse effect on our earnings.
Our nonperforming assets (which consist of nonaccrual loans, assets acquired through foreclosure and troubled debt restructurings), totaled $39.9 million at December 31, 2015. Our nonperforming assets adversely affect our net income in various ways. We do not record interest income on nonaccrual loans and assets acquired through foreclosure. We must establish an allowance for loan losses which reserves for losses inherent in the loan portfolio that are both probable and reasonably estimable. From time to time, we also write down the value of properties in our portfolio of assets acquired through foreclosure to reflect changing market values. Additionally, there are legal fees associated with the resolution of problem assets as well as carrying costs such as taxes, insurance and maintenance related to assets acquired through foreclosure. The resolution of nonperforming assets requires the active involvement of management, which can distract management from daily operations and other income producing activities. Finally, if our estimate of the allowance for loan losses is inadequate, we will have to increase the allowance for loan losses accordingly, which will have an adverse effect on our earnings. Significant increases in the level of our nonperforming assets from the current level, or greater than anticipated costs to resolve these credits, will have an adverse effect on our earnings.
Our loan portfolio includes a substantial amount of commercial real estate, construction and land development and commercial and industrial loans. The credit risk related to these types of loans is greater than the risk related to residential loans.
Our commercial loan portfolio, which includes commercial and industrial loans, commercial real estate loans and construction and land development loans, totaled $3.14 billion at December 31, 2015, comprising 83% of net loans. Commercial real estate loans generally carry larger loan balances and involve a greater degree of risk of nonpayment or late payment than home equity loans or residential mortgage loans. Any significant failure to pay or late payments by our customers would adversely affect our earnings. The increased credit risk associated with these types of loans is a result of several factors, including the concentration of principal in a limited number of loans and borrowers, the larger size of loan balances, and the potential that adverse changes in general economic conditions can adversely affect income-producing properties. A portion of our commercial real estate, construction and land development and commercial and industrial loan portfolios includes a balloon payment feature. A number of factors may affect a borrower’s ability to make or refinance a balloon payment, including the financial condition of the borrower, the prevailing local economic conditions and the prevailing interest rate environment.
Furthermore, commercial and industrial loans secured by owner-occupied properties are dependent upon the successful operation of the borrower’s business. If the operating company suffers difficulties, including reduction in sales volume and/or profitability, the borrower’s ability to repay the loan may be impaired. Loans secured by properties where repayment is dependent upon payment of rent by third party tenants or the sale of the property may be impacted by loss of tenants, lower lease rates needed to attract new tenants or the inability to sell a completed project in a timely fashion and at a profit.
25
Table of Contents
Concentration of loans in our primary markets may increase our risk.
Our success depends primarily on the general economic conditions and housing markets in the State of Delaware, southeastern Pennsylvania and northern Virginia, as a large portion of our loans are made to customers in these markets. This makes us vulnerable to a downturn in the local economy and real estate markets in these areas. Declines in real estate valuations in these markets would lower the value of the collateral securing those loans, which could cause us to realize losses in the event of increased foreclosures. Local economic conditions have a significant impact on the ability of borrowers to repay loans as well as our ability to originate new loans. In addition, weakening in general economic conditions such as inflation, recession, unemployment, natural disasters or other factors beyond our control could negatively affect demand for loans, the performance of our borrowers and our financial results.
If our allowance for loan losses is not sufficient to cover actual loan losses, our earnings will decrease.
We make various assumptions and judgments about the collectability of the loans in our portfolio, including the creditworthiness of our borrowers and the value of the real estate and other assets serving as collateral for the repayment of many of our loans. In determining the amount of the allowance for loan losses, we review our loans and our loss and delinquency experience, and we evaluate economic conditions. If our assumptions are incorrect, our allowance for loan losses may not be sufficient to cover probable or incurred losses in our loan portfolio, resulting in unanticipated losses and additions to our allowance for loan losses. While we believe that our allowance for loan losses was adequate at December 31, 2015, there is no assurance that it will be sufficient to cover future loan losses, especially if there is a significant deterioration in economic conditions. Material additions to our allowance could materially decrease our net income.
3. Capital and Liquidity Risk
Our inability to grow deposits in the future could materially adversely affect our liquidity and ability to grow our business.
A key part of our future growth strategy is to grow deposits. The market for deposits is highly competitive, with intense competition in attracting and retaining deposits. We compete on the basis of the rates we pay on deposits, features and benefits of our products, the quality of our customer service and the competitiveness of our digital banking capabilities. Our ability to originate and maintain deposits is also highly dependent on the strength of the Bank and the perceptions of customers and others of our business practices and our financial health. Adverse perceptions regarding our reputation could lead to difficulties in attracting and retaining deposits accounts. Negative public opinion could result from actual or alleged conduct in a number of areas, including lending practices, regulatory compliance, inadequate protection of customer information or sales and marketing activities, and from actions taken by regulators or others in response to such conduct.
The demand for the deposit products we offer may also be reduced due to a variety of factors, such as demographic patterns, changes in customer preferences, reductions in consumers’ disposable income, regulatory actions that decrease customer access to particular products or the availability of competing products. Competition from other financial services firms and others that use deposit funding products may affect deposit renewal rates, costs or availability. Changes we make to the rates offered on our deposit products may affect our profitability and liquidity.
The FDIA prohibits an insured bank from accepting brokered deposits or offering interest rates on any deposits significantly higher than the prevailing rate in the bank’s normal market area or nationally (depending upon where the deposits are solicited), unless it is “well capitalized,” or it is “adequately capitalized” and receives a waiver from the FDIC. A bank that is “adequately capitalized” and accepts brokered deposits under a waiver from the FDIC may not pay an interest rate on any deposit in excess of 75 basis points over certain prevailing market rates. There are no such restrictions under the FDIA on a bank that is “well capitalized” and at December 31, 2015, the Bank met or exceeded all applicable requirements to be deemed “well capitalized” for purposes of the FDIA. However, there can be no assurance that the Bank will continue to meet those requirements. Limitations on the Bank’s ability to accept brokered deposits for any reason (including regulatory limitations on the amount of brokered deposits in total or as a percentage of total assets)
26
Table of Contents
in the future could materially adversely impact our funding costs and liquidity. Any limitation on the interest rates the Bank can pay on deposits could competitively disadvantage us in attracting and retaining deposits and have a material adverse effect on our business.
We could experience an unexpected inability to obtain needed liquidity.
Liquidity is essential to our business, as we use cash to fund loans and investments, other interest-earning assets and deposit withdrawals that occur in the ordinary course of our business. We also are required by federal and state regulatory authorities to maintain adequate levels of capital to support our operations. Our principal sources of liquidity include customer deposits, FHLB borrowings, brokered certificates of deposit, sales of loans, repayments to the Bank from borrowers and paydowns and sales of investment securities. Our ability to obtain funds from these sources could become limited, or our costs to obtain such funds could increase, due to a variety of factors, including changes in our financial performance or, the imposition of regulatory restrictions on us, adverse developments in the capital markets, including weakening economic conditions or negative views and expectations about the prospects for the financial services industry as a whole. If our ability to obtain necessary funding is limited or the costs of such funding increase, our ability to meet our obligations or grow our banking business would be adversely affected and our financial condition and results of operations could be harmed.
Restrictions on our subsidiaries’ ability to pay dividends to us could negatively affect our liquidity and ability to pay dividends.
We are a separate and distinct legal entity from our subsidiaries, including the Bank. We receive substantially all of our revenue from dividends from our subsidiaries. These dividends are the principal source of funds to pay dividends on our common stock and interest and principal on our debt. Various federal and/or state laws and regulations limit the amount of dividends that our Bank and certain of our nonbank subsidiaries may pay us. Also, our right to participate in a distribution of assets upon a subsidiary’s liquidation or reorganization is subject to the prior claims of the subsidiary’s creditors. Limitations on our subsidiaries to pay dividends to us could have a material adverse effect on our liquidity and on our ability to pay dividends on common stock. Additionally, if our subsidiaries’ earnings are not sufficient to make dividend payments to us while maintaining adequate capital levels; we may not be able to make dividend payments to our common stockholders.
4. Compliance Risk
We are subject to extensive regulation which could have an adverse effect on our operations.
We are subject to extensive federal and state regulation, supervision and examination governing almost all aspects of our operations. The laws and regulations governing our business are intended primarily to protect depositors, our customers, the public, the FDIC’s Deposit Insurance Fund, and the banking system as a whole, and not our shareholders or holders of our debt. Since July 21, 2011, the Federal Reserve has been the primary federal regulator for the Company and the OCC has been the Bank’s primary regulator. The banking laws, regulations and policies applicable to us govern a variety of matters, including certain debt obligations, changes in control, maintenance of adequate capital, and general business operations, including permissible types, amounts and terms of loans and investments, the amount of reserves held against deposits, restrictions on dividends, establishment of new offices and the maximum interest rate that may be charged by law. In addition, federal and state banking regulators have broad authority to supervise our banking business, including the authority to prohibit activities that represent unsafe or unsound banking practices or constitute violations of statute, rule, regulation or administrative order. Failure to appropriately comply with any such laws, regulations or regulatory policies could result in sanctions by regulatory agencies, civil money penalties or damage to our reputation, all of which could adversely affect our business, results of operations, financial condition or prospects.
We are subject to changes in federal and state banking statutes, regulations and governmental policies, and their interpretation or implementation. Regulations affecting banks and other financial institutions in particular are undergoing continuous review and frequently change and the ultimate effect of such changes cannot be predicted. Regulations and laws may be modified at any time, and new legislation may be enacted that will affect us. Any changes in any federal and state law, as well as regulations and governmental policies could affect us in substantial and unpredictable ways, including ways that may adversely affect our business, results of operations, financial condition or prospects.
27
Table of Contents
Some of the regulatory changes mandated by the Dodd Frank Act have increased our expenses, decreased our revenues and changed the activities in which we choose to engage. Some of these and other provisions of the Dodd-Frank Act remain subject to regulatory rulemaking and implementation, the effects of which are not yet known. We may be forced to invest significant management attention and resources to make any necessary changes related to the Dodd-Frank Act and any regulations promulgated thereunder, which may adversely affect our business, results of operations, financial condition or prospects. We cannot predict the specific impact and long-term effects the Dodd-Frank Act and the regulations promulgated thereunder will have on our financial performance, the markets in which we operate and the financial industry generally.
In addition to changes resulting from the Dodd-Frank Act, in July 2013, the Federal Reserve, FDIC and the OCC approved final rules (Final Capital Rules) implementing revised capital rules to reflect the requirements of the Dodd-Frank Act and the Basel III international capital standards. Under the Final Capital Rules, minimum requirements have increased both the quantity and quality of capital held by the Company. The rules include a new common equity Tier 1 capital to risk-weighted assets minimum ratio of 4.5%, raise the minimum ratio of Tier 1 capital to risk-weighted assets from 4.0% to 6.0%, require a minimum ratio of total capital to risk-weighted assets of 8.0%, and require a minimum Tier 1 leverage ratio of 4.0%. The Final Capital Rules also establish a new capital conservation buffer, comprised of common equity Tier 1 capital, is also established above the regulatory minimum capital requirements. This capital conservation buffer will be phased in beginning January 1, 2016 at 0.625% of risk-weighted assets and increase each subsequent year by an additional 0.625% until reaching its final level of 2.5% on January 1, 2019. Strict eligibility criteria for regulatory capital instruments were also implemented under the Final Capital Rules. The Final Capital Rules became applicable to us beginning on January 1, 2015 with conservation buffers phasing in over the subsequent 5 years.
We face a risk of noncompliance and enforcement action with the Bank Secrecy Act and other anti-money laundering statutes and regulations.
The Bank Secrecy Act, the USA PATRIOT Act of 2001, and other laws and regulations require financial institutions, among other duties, to institute and maintain an effective anti-money laundering program and file suspicious activity and currency transaction reports when appropriate. They also mandate that we are ultimately responsible to ensure our third party vendors adhere to the same laws and regulations. In addition to other bank regulatory agencies, the Federal Financial Crimes Enforcement Network of the Department of the Treasury is authorized to impose significant civil money penalties for violations of those requirements and has recently engaged in coordinated enforcement efforts with the state and federal banking regulators, as well as the U.S. Department of Justice, Consumer Financial Protection Bureau, Drug Enforcement Administration, and Internal Revenue Service.
We are also subject to increased scrutiny of compliance with the rules enforced by the Office of Foreign Assets Control of the Department of the Treasury regarding, among other things, the prohibition of transacting business with, and the need to freeze assets of, certain persons and organizations identified as a threat to the national security, foreign policy or economy of the United States. If our policies, procedures and systems or those of our third party vendors are deemed deficient, we would be subject to liability, including fines and regulatory actions, which may include restrictions on our ability to pay dividends and the necessity to obtain regulatory approvals to proceed with certain aspects of our business plan, including any acquisition plans. Any of these results could have a material adverse effect on our business, financial condition, results of operations and future prospects.
We are subject to numerous laws designed to protect consumers, including the Community Reinvestment Act and fair lending laws, and failure to comply with these laws could lead to a wide variety of sanctions.
The Community Reinvestment Act, the Equal Credit Opportunity Act, the Fair Housing Act and other fair lending laws and regulations impose community investment and nondiscriminatory lending requirements on financial institutions. The Consumer Financial Protection Bureau, the Department of Justice and other federal agencies are responsible for enforcing these laws and regulations. A successful regulatory challenge to an institution’s performance under the Community Reinvestment Act or fair lending laws and regulations could result in a wide variety of sanctions, including damages and civil money penalties, injunctive relief, restrictions on mergers and acquisitions activity, restrictions on
28
Table of Contents
expansion, and restrictions on entering new business lines. Private parties may also have the ability to challenge an institution’s performance under fair lending laws in private class action litigation. Such actions could have a material adverse effect on our business, financial condition, results of operations and future prospects.
The fiscal, monetary and regulatory policies of the federal government and its agencies could have a material adverse effect on our results of operations.
The Federal Reserve regulates the supply of money and credit in the United States. Its policies determine in large part the cost of funds for lending and investing and the return earned on those loans and investments, both of which affect our net interest margin. Its policies can also adversely affect borrowers, potentially increasing the risk that they may fail to repay their loans. Changes in Federal Reserve policies and our regulatory environment generally are beyond our control, and we are unable to predict what changes may occur or the manner in which any future changes may affect our business, financial condition and results of operation.
If we fail to comply with legal standards, we could incur liability to our clients or lose clients, which could negatively affect our earnings.
Managing or servicing assets with reasonable prudence in accordance with the terms of governing documents and applicable laws is important to client satisfaction, which in turn is important to the earnings and growth of our investment businesses. Failure to comply with these standards, adequately manage these risks or manage the differing interests often involved in the exercise of fiduciary responsibilities could also result in liability.
5. Operational Risk
Impairment of goodwill and/or intangible assets could require charges to earnings, which could negatively impact our results of operations.
Goodwill and other intangible assets arise when a business is purchased for an amount greater than the net fair value of its identifiable assets. We have recognized goodwill as an asset on the balance sheet in connection with several recent acquisitions. At December 31, 2015, we had $95.3 million of goodwill and intangible assets. We evaluate goodwill and intangibles for impairment at least annually by comparing fair value to carrying amount. Although we have determined that goodwill and other intangible assets were not impaired during 2015, a significant and sustained decline in our stock price and market capitalization, a significant decline in our expected future cash flows, a significant adverse change in the business climate, slower growth rates or other factors could result in impairment of goodwill or other intangible assets. Any future write-down of the goodwill or intangible assets could result in a material charge to earnings.
Our results of operations and financial condition could be materially adversely affected if our Cash Connect division’s established policies, procedures and controls are inadequate to prevent a misappropriation of funds, or if a misappropriation of funds is not insured or not fully covered through insurance.
The profitability of our Cash Connect segment depends to a large degree on its ability to accurately and efficiently distribute, track, and settle large amounts of cash to its customers’ ATMs which, in turn, depends on the successful implementation and monitoring of a comprehensive series of financial and operational controls that are designed to help prevent, detect, and recover any potential loss of funds. These controls require the implementation and maintenance of complex proprietary software, the ability to track and monitor an extensive network of armored car companies, and the ability to settle large amounts of electronic funds transfers (EFT) from various ATM networks. There is a risk that those associated with armored car companies, ATM networks and processors, ATM operators, or other parties may misappropriate funds belonging to Cash Connect. Cash Connect has experienced such occurrences in the past. If our Cash Connect division’s established policies, procedures and controls are inadequate, or not properly executed to prevent or detect a misappropriation of funds, or if a misappropriation of funds is not insured or not fully covered through any insurance maintained by us, our results of operations or financial condition could be materially affected.
29
Table of Contents
Our risk management processes and procedures may not be effective in mitigating our risks.
Our risk management processes and procedures seek to appropriately balance risk and return and mitigate risks. We have established processes and procedures intended to identify, measure, monitor and control the types of risk to which we are subject, including credit risk, market risk, liquidity risk, strategic risk and operational risk. Credit risk is the risk of loss that arises when an obligor fails to meet the terms of an obligation. We are exposed to both customer credit risk, from our loans, and institutional credit risk, principally from our various business partners and counterparties. Market risk is the risk of loss due to changes in external market factors such as interest rates. Liquidity risk is the risk that financial condition or overall safety and soundness are adversely affected by an inability, or perceived inability, to meet obligations and support business growth. Strategic risk is the risk from changes in the business environment, improper implementation of decisions or inadequate responsiveness to changes in the business environment. Operational risk is the risk of loss arising from inadequate or failed processes, people or systems, external events (i.e., natural disasters) or compliance, reputational or legal matters and includes those risks as they relate directly to the Company as well as to third parties with whom we contract or otherwise do business.
We seek to monitor and control our risk exposure through a framework that includes our risk appetite statement, enterprise risk assessment process, risk policies, procedures and controls, reporting requirements, credit risk culture and governance structure. Management of our risks in some cases depends upon the use of analytical and/or forecasting models. If the models that we use to manage these risks are ineffective at predicting future losses or are otherwise inadequate, we may incur unexpected losses or otherwise be adversely affected. In addition, the information we use in managing our credit and other risk may be inaccurate or incomplete as a result of error or fraud, both of which may be difficult to detect and avoid. There may also be risks that exist, or that develop in the future, that we have not appropriately anticipated, identified or mitigated including when processes are changed or new products and services are introduced. If our risk management framework does not effectively identify and control our risks, we could suffer unexpected losses or be adversely affected, and that could have a material adverse effect on our business, results of operations and financial condition.
Litigation or legal proceedings could expose us to significant liabilities and damage our reputation.
From time to time we have and may become party to various litigation claims and legal proceedings. Management evaluates these claims and proceedings to assess the likelihood of unfavorable outcomes and estimates, if possible, the amount of potential losses. We may establish a reserve, as appropriate, based upon our assessments and estimates in accordance with accounting policies. We base our assessments, estimates and disclosures on the information available to us at the time and rely on the judgment of our management with respect to those assessments, estimates and disclosures. Litigation and legal proceedings may result in the incurrence of significant liabilities, including payment of damages, fees and expenses related to the litigation, and/or penalties and fines. Further, actual outcomes or losses may differ materially from assessments and estimates, which could adversely affect our reputation, financial condition and results of operations.
System failure or cybersecurity breaches of our network security could subject us to increased operating costs as well as litigation and other potential losses.
Failures in, or breaches of, our computer systems and network infrastructure, or those of our third party vendors or other service providers, including as a result of cyber-attacks, could disrupt our business, result in the disclosure or misuse of confidential or proprietary information, damage our reputation, increase our costs and cause losses. Our operations are dependent upon our ability to protect our computer equipment against damage from fire, power loss, telecommunications failure or a similar catastrophic event. Any damage or failure that causes an interruption in our operations could have an adverse effect on our financial condition and results of operations. In addition, our operations are dependent upon our ability to protect the computer systems and network infrastructure utilized by us, including our Internet banking activities, against damage from physical break-ins, cybersecurity breaches and other disruptive problems caused by the Internet or other users. Cybersecurity breaches and other disruptions would jeopardize the security of information stored in and transmitted through our computer systems and network infrastructure, which may result in significant liability to us and damage to our reputation, and may discourage current and potential customers from using our Internet banking services. As customer, public and regulatory expectations regarding operational and information security have increased, we have
30
Table of Contents
added additional security measures to our computer systems and network infrastructure to mitigate the possibility of cybersecurity breaches, including firewalls and penetration testing. We continue to investigate cost effective measures as well as insurance protection; however, any mitigation activities may not prevent or detect future potential losses from system failures or cybersecurity breaches.
In the normal course of business, we collect, process, and retain sensitive and confidential information regarding our customers. Although we devote significant resources and management focus to ensuring the integrity of our systems through information security and business continuity programs, our facilities and systems, and those of our third-party service providers, are vulnerable to external or internal security breaches, acts of vandalism, computer viruses, misplaced or lost data, programming or human errors, or other similar events. We and our third-party service providers have experienced all of these events in the past and expect to continue to experience them in the future. These events could interrupt our business or operations, result in significant legal and financial exposure, supervisory liability, damage to our reputation, loss of customers and business or a loss of confidence in the security of our systems, products and services. Although the impact to date from these events has not had a material adverse effect on us, we cannot be sure this will be the case in the future. Any of these occurrences could have a material adverse effect on our financial condition and results of operations.
Information security risks for financial institutions like us have increased recently in part because of new technologies, the use of the internet and telecommunications technologies (including mobile devices) to conduct financial and other business transactions and the increased sophistication and activities of organized crime, perpetrators of fraud, hackers, terrorists and others. In addition to cyber-attacks or other security breaches involving the theft of sensitive and confidential information, hackers recently have engaged in attacks against large financial institutions that are designed to disrupt key business services, such as consumer-facing web sites. We are not able to anticipate or implement effective preventive measures against all security breaches of these types, especially because the techniques used change frequently and because attacks can originate from a wide variety of sources. We employ detection and response mechanisms designed to contain and mitigate security incidents, but early detection may be thwarted by sophisticated attacks and malware designed to avoid detection.
Errors, breakdowns in controls or other mistakes in the provision of services to clients or in carrying out transactions for our own account can subject us to liability, result in losses or negatively affect our earnings in other ways.
In our asset servicing, investment management, fiduciary administration and other business activities, we effect or process transactions for clients and for us that involve very large amounts of money. Failure to properly manage or mitigate operational risks can have adverse consequences, and increased volatility in the financial markets may increase the magnitude of resulting losses. Given the high volume of transactions we process, errors that affect earnings may be repeated or compounded before they are discovered and corrected.
Our business may be adversely impacted by litigation and regulatory enforcement.
Our businesses involve the risk that clients or others may sue us, claiming that we have failed to perform under a contract or otherwise failed to carry out a duty perceived to be owed to them. Our trust, custody and investment management businesses are particularly subject to this risk. This risk may be heightened during periods when credit, equity or other financial markets are deteriorating in value or are particularly volatile, or when clients or investors are experiencing losses. In addition, as a publicly-held company, we are subject to the risk of claims under the federal securities laws, and volatility in our stock price and those of other financial institutions increases this risk. Actions brought against us may result in injunctions, settlements, damages, fines or penalties, which could have a material adverse effect on our financial condition or results of operations or require changes to our business. Even if we defend ourselves successfully, the cost of litigation is often substantial, and public reports regarding claims made against us may cause damage to our reputation among existing and prospective clients or negatively impact the confidence of counterparties, rating agencies and stockholders, consequently negatively affecting our earnings. In the ordinary course of our business, we also are subject to various regulatory, governmental and enforcement inquiries, investigations and subpoenas. These may be directed generally to participants in the businesses in which we are involved or may be specifically directed at us. In enforcement matters, claims for disgorgement, the imposition of civil and criminal penalties and the imposition of other remedial sanctions are possible.
31
Table of Contents
6. Strategic Risk
Our business strategy includes significant investment in growth plans, and our financial condition and results of operations could be negatively affected if we fail to grow or fail to manage our growth and investment in infrastructure effectively.
We are pursuing a significant growth strategy for our business. Our growth initiatives have required us to recruit experienced personnel to assist in such initiatives. The failure to retain such personnel would place significant limitations on our ability to successfully execute our growth strategy. In addition, as we expand our lending beyond our current market areas, we could incur additional risk related to those new market areas. We may not be able to expand our market presence in our existing market areas or successfully enter new markets.
A weak economy, low demand and competition for credit may impact our ability to successfully execute our growth plan and adversely affect our business, financial condition, results of operations, reputation and growth prospects. While we believe we have the executive management resources and internal systems in place to successfully manage our future growth, there can be no assurance growth opportunities will be available or that we will successfully manage our growth.
We regularly evaluate potential acquisitions and expansion opportunities. If appropriate opportunities present themselves, we expect to engage in selected acquisitions or other business growth initiatives or undertakings. We may not successfully identify appropriate opportunities, may not be able to negotiate or finance such activities and such activities, if undertaken, may not be successful.
We have in the past and may in the future pursue acquisitions, which may disrupt our business and adversely affect our operating results, and we may fail to realize all of the anticipated benefits of any such acquisition.
We have historically pursued acquisitions, and may seek acquisitions in the future. We may not be able to successfully identify suitable candidates, negotiate appropriate acquisition terms, complete proposed acquisitions, successfully integrate acquired businesses into the existing operations, or expand into new markets. Once integrated, acquired operations may not achieve levels of revenues, profitability, or productivity comparable with those achieved by our existing operations, or otherwise perform as expected.
Acquisitions involve numerous risks, including difficulties in the integration of the operations, technologies, services and products of the acquired companies, and the diversion of management’s attention from other business concerns. We may not properly ascertain all such risks prior to an acquisition or prior to such a risk impacting us while integrating an acquired company. As a result, difficulties encountered with acquisitions could have a material adverse effect on our business, financial condition, and results of operations.
Furthermore, we must generally receive federal regulatory approval before we can acquire a bank or bank holding company. In determining whether to approve a proposed bank acquisition, federal bank regulators will consider, among other factors, the effect of the acquisition on competition, financial condition, future prospects, including current and projected capital levels, the competence, experience, and integrity of management, compliance with laws and regulations, the convenience and needs of the communities to be served, including the acquiring institution’s record of compliance under the Community Reinvestment Act, and the effectiveness of the acquiring institution in combating money laundering activities. In addition, we cannot be certain when or if, or on what terms and conditions, any required regulatory approvals will be granted. Consequently, we may not obtain regulatory approval for a proposed acquisition on acceptable terms or at all, in which case we would not be able to complete the acquisition despite the time and expenses invested in pursuing it.
We originate, sell, service and invest in reverse mortgages, which subjects us to additional risks that could have a material adverse effect on our business, reputation, liquidity, financial condition and results of operations.
We originate, sell, service and invest in reverse mortgages. The reverse mortgage business is subject to substantial risks, including market, credit, interest rate, liquidity, operational, reputational and legal risks. Generally, a reverse mortgage is a loan available to seniors aged 62 or older that allows homeowners to borrow money against the value of their home. No repayment of the mortgage is required until the borrower dies, moves out of the home or the home is sold.
32
Table of Contents
A decline in the demand for reverse mortgages may reduce the number of reverse mortgages we originate, and adversely affect our ability to sell reverse mortgages in the secondary market. Although foreclosures involving reverse mortgages generally occur less frequently than forward mortgages, loan defaults on reverse mortgages leading to foreclosures may occur if borrowers fail to maintain their property or fail to pay taxes or home insurance premiums. A general increase in foreclosure rates may adversely impact how reverse mortgages are perceived by potential customers and thus reduce demand for reverse mortgages. Finally, we could become subject to negative headline risk in the event that loan defaults on reverse mortgages lead to foreclosures or evictions of elderly homeowners. All of the above factors could have a material adverse effect on our business, reputation, liquidity, financial condition and results of operations.
Key employees may be difficult to retain.
Our Associates are our most important resource and, in many areas of the financial services industry, competition for qualified personnel is intense. We invest significantly in recruitment, training, development and talent management as our Associates are the cornerstone of our model. If we were unable to continue to attract and retain qualified key employees to support the various functions of our businesses, our performance, including our competitive position, could be materially adversely affected. As economic conditions improve, we may face increased difficulty in retaining top performers and critical skilled employees. If key personnel were to leave us and equally knowledgeable or skilled personnel are unavailable within the Company or could not be sourced in the market, our ability to manage our business may be hindered or impaired.
7. Reputational Risk
Damage to our reputation could significantly harm our businesses.
Our ability to attract and retain customers, clients, investors, and highly-skilled management and employees is affected by our reputation. Public perception of the financial services industry has declined as a result of the recent economic downturn and related government response. We face increased public and regulatory scrutiny resulting from the financial crisis and economic downturn. Significant harm to our reputation can also arise from other sources, including employee misconduct, actual or perceived unethical behavior, litigation or regulatory outcomes, failing to deliver minimum or required standards of service and quality, compliance failures, disclosure of confidential information, significant or numerous failures, interruptions or breaches of our information systems, and the activities of our clients, customers and counterparties, including vendors. Actions by the financial services industry generally or by certain members or individuals in the industry may have a significant adverse effect on our reputation. We could also suffer significant reputational harm if we fail to properly identify and manage potential conflicts of interest. Management of potential conflicts of interests has become increasingly complex as we expand our business activities through more numerous transactions, obligations and interests with and among our clients. The actual or perceived failure to adequately address conflicts of interest could affect the willingness of clients to deal with us, which could adversely affect our businesses.
Our Wealth Management segment is subject to a number of risks, including reputational risk.
Our Wealth Management segment derives the majority of its revenue from noninterest income which consists of trust, investment and other servicing fees. Success in this business segment is highly dependent on reputation. Our ability to attract trust and wealth management clients is highly dependent upon external perceptions of this division’s level of service, trustworthiness, business practices and financial condition. Negative perceptions or publicity regarding these matters could damage the division’s and our reputation among existing customers and corporate clients, which could make it difficult for the Wealth Management segment to attract new clients and maintain existing ones. Adverse developments with respect to the financial services industry may also, by association, negatively impact the segment’s or our reputation, or result in greater regulatory or legislative scrutiny or litigation against us. Although we monitor
developments for areas of potential risk to the division’s and our reputation and brand, negative perceptions or publicity could materially and adversely impact both revenue and net income.
33
Table of Contents
8. Model Risk
The quantitative models we use to manage certain accounting and risk management functions may not be effective, which may cause material adverse effects on our results of operations and financial condition.
We use quantitative models to help manage certain aspects of our business and to assist with certain business decisions, including estimating probable loan losses, measuring the fair value of financial instruments when reliable market prices are unavailable and estimating the effects of changing interest rates and other market measures on our financial condition and results of operations. Our modeling methodologies rely on many assumptions, historical analyses and correlations. These assumptions may be incorrect, particularly in times of market distress, and the historical correlations on which we rely may no longer be relevant. Additionally, as businesses and markets evolve, our measurements may not accurately reflect this evolution. Even if the underlying assumptions and historical correlations used in our models are adequate, our models may be deficient due to errors in computer code, bad data, misuse of data, or the use of a model for a purpose outside the scope of the model’s design.
As a result, our models may not capture or fully express the risks we face, may suggest that we have sufficient capitalization when we do not, or may lead us to misjudge the business and economic environment in which we will operate. If our models fail to produce reliable results on an ongoing basis, we may not make appropriate risk management or other business or financial decisions. Furthermore, strategies that we employ to manage and govern the risks associated with our use of models may not be effective or fully reliable, and as a result, we may realize losses or other lapses.
Banking regulators continue to focus on the models used by banks and bank holding companies in their businesses. The failure or inadequacy of a model may result in increased regulatory scrutiny on us or may result in an enforcement action or proceeding against us by one of our regulators.
ITEM 1B. UNRESOLVED STAFF COMMENTS
None.
Our headquarters are located in 500 Delaware Ave., Wilmington, Delaware where we lease 87,819 square feet of space. At December 31, 2015, we conducted our business through 51 full-service branches located in Delaware and southeastern Pennsylvania. Eight of our branches were owned while all other facilities were leased.
In addition to our branch network, we lease office space for four loan production offices located in Delaware, southeastern Pennsylvania and Virginia and we lease seven other facilities in Delaware, southeastern Pennsylvania and Nevada to house operational activities, Cash Connect and Wealth Management. At December 31, 2015, our premises and equipment had a net book value of $39.6 million. All of these properties are generally in good condition and are appropriate for their intended use.
While these facilities are adequate to meet our current needs, available space is limited and additional facilities may be required to support future expansion. However, there are no current plans to lease, purchase or construct additional administrative facilities.
For additional detail regarding our properties and equipment, see Note 8 to our Consolidated Financial Statements.
For information regarding to legal proceedings, see Note 23 to the Consolidated Financial Statements.
ITEM 4. MINE SAFETY DISCLOSURES
Not applicable
34
Table of Contents
ITEM 5. MARKET FOR REGISTRANT’S COMMON EQUITY, RELATED STOCKHOLDER MATTERS AND ISSUER PURCHASES OF EQUITY SECURITIES
Market for Registrant’s Common Equity and Related Stockholder Matters
Our Common Stock is traded on the NASDAQ Global Select Market under the symbol “WSFS”. At December 31, 2015, we had 1,030 registered common stockholders of record. The following table sets forth the range of high and low sales prices for the Common Stock for each full quarterly period within the two most recent fiscal years as well as the quarterly dividends paid.
The closing market price of our Common Stock at December 31, 2015 was $32.36.
| Stock Price Range | ||||||||||||||||
| Low | High | Dividends | ||||||||||||||
| 2015 |
4th | $ | 27.51 | $ | 35.42 | $ | 0.06 | |||||||||
| 3rd | 26.26 | 29.44 | 0.05 | |||||||||||||
| 2nd | 23.59 | 27.98 | 0.05 | |||||||||||||
| 1st | 24.34 | 26.67 | 0.05 | |||||||||||||
|
|
|
|||||||||||||||
| $ | 0.21 | |||||||||||||||
|
|
|
|||||||||||||||
| 2014 |
4th | $ | 23.38 | $ | 26.66 | $ | 0.05 | |||||||||
| 3rd | 22.41 | 25.65 | 0.04 | |||||||||||||
| 2nd | 21.25 | 24.73 | 0.04 | |||||||||||||
| 1st | 22.44 | 26.11 | 0.04 | |||||||||||||
|
|
|
|||||||||||||||
| $ | 0.17 | |||||||||||||||
|
|
|
|||||||||||||||
Share Repurchases:
Commencing in November, 2015, the Company’s Board of Directors approved authorizations to purchase, in the aggregate, up to 1,492,661 shares of Common Stock.
The following table provides information regarding our purchases of Common Stock during the fourth quarter of 2015.
| Total Number of Shares Purchased |
Average Price Paid Per Share |
Total Number of Shares Purchased as Part of Publicly Announced Programs |
Maximum Number of Shares that May Yet Be Purchased Under the Programs |
|||||||||||||
| December 1, 2015 - December 31, 2015 |
100,000 | $ | 33.80 | 100,000 | 1,400,565 | |||||||||||
|
|
|
|
|
|
|
|||||||||||
| Total |
100,000 | $ | 33.80 | 100,000 | ||||||||||||
|
|
|
|
|
|
|
|||||||||||
35
Table of Contents
COMPARATIVE STOCK PERFORMANCE GRAPH
The graph and table which follow show the cumulative total return on our Common Stock over the last five years compared with the cumulative total return of the Dow Jones Total Market Index and the Nasdaq Bank Index over the same period as obtained from Bloomberg L.P. Cumulative total return on our Common Stock or the indices equals the total increase in value since December 31, 2010, assuming reinvestment of all dividends paid into the Common Stock or the index, respectively. The graph and table were prepared assuming $100 was invested on December 31, 2010 in our Common Stock and in each of the indices. There can be no assurance that our future stock performance will be the same or similar to the historical stock performance shown in the graph below. We neither make nor endorse any predictions as to stock performance.
CUMULATIVE TOTAL SHAREHOLDER RETURN
COMPARED WITH PERFORMANCE OF SELECTED INDEXES
December 31, 2010 through December 31, 2015
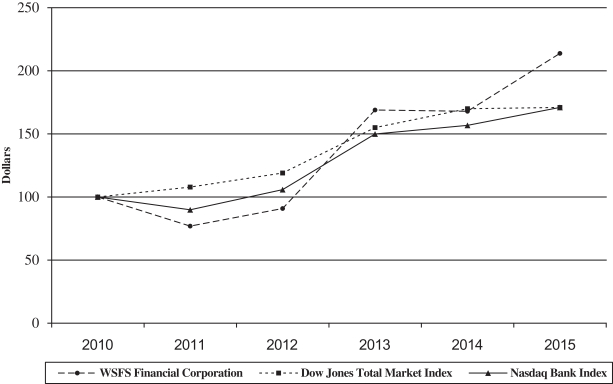
| December 31, 2010 through December 31, 2015 Cumulative Total Return |
||||||||||||||||||||||||
| 2010 | 2011 | 2012 | 2013 | 2014 | 2015 | |||||||||||||||||||
| WSFS Financial Corporation |
$ | 100 | $ | 77 | $ | 91 | $ | 169 | $ | 168 | $ | 214 | ||||||||||||
| Dow Jones Total Market Index |
100 | 108 | 119 | 155 | 170 | 171 | ||||||||||||||||||
| Nasdaq Bank Index |
100 | 90 | 106 | 150 | 157 | 171 | ||||||||||||||||||
36
Table of Contents
ITEM 6. SELECTED FINANCIAL DATA
| (In Thousands, Except Per Share and Branch Data) | 2015 | 2014 | 2013 | 2012 | 2011 | |||||||||||||||
| At December 31, |
||||||||||||||||||||
| Total assets |
$ | 5,585,962 | $ | 4,853,320 | $ | 4,515,763 | $ | 4,375,148 | $ | 4,289,008 | ||||||||||
| Net loans (1) (5) |
3,770,857 | 3,185,159 | 2,936,467 | 2,736,674 | 2,712,774 | |||||||||||||||
| Reverse mortgages |
24,284 | 29,298 | 37,328 | 19,229 | 15,722 | |||||||||||||||
| Investment securities (2) |
886,891 | 866,292 | 817,115 | 900,839 | 856,071 | |||||||||||||||
| Other investments |
30,709 | 23,412 | 36,201 | 31,796 | 35,765 | |||||||||||||||
| Total deposits |
4,016,566 | 3,649,235 | 3,186,942 | 3,274,963 | 3,135,304 | |||||||||||||||
| Borrowings (3) |
812,200 | 545,764 | 759,830 | 515,255 | 656,609 | |||||||||||||||
| Trust preferred borrowings |
67,011 | 67,011 | 67,011 | 67,011 | 67,011 | |||||||||||||||
| Senior Debt |
55,000 | 55,000 | 55,000 | 55,000 | — | |||||||||||||||
| Stockholders’ equity |
580,471 | 489,051 | 383,050 | 421,054 | 392,133 | |||||||||||||||
| Number of full-service branches |
51 | 43 | 39 | 41 | 40 | |||||||||||||||
| For the Year Ended December 31, |
||||||||||||||||||||
| Interest income |
$ | 182,576 | $ | 160,337 | $ | 146,922 | $ | 150,287 | $ | 158,642 | ||||||||||
| Interest expense |
15,776 | 15,830 | 15,334 | 23,288 | 32,605 | |||||||||||||||
|
|
|
|
|
|
|
|
|
|
|
|||||||||||
| Net interest income |
166,800 | 144,507 | 131,588 | 126,999 | 126,037 | |||||||||||||||
| Noninterest income |
88,255 | 78,278 | 80,151 | 86,693 | 63,588 | |||||||||||||||
| Noninterest expenses |
163,459 | 146,645 | 131,755 | 133,345 | 127,476 | |||||||||||||||
| Provision for loan losses |
7,790 | 3,580 | 7,172 | 32,053 | 27,996 | |||||||||||||||
| Provision for income taxes |
30,273 | 18,803 | 25,930 | 16,984 | 11,475 | |||||||||||||||
| Net Income |
53,533 | 53,757 | 46,882 | 31,311 | 22,677 | |||||||||||||||
| Dividends on preferred stock and accretion of discount |
— | — | 1,633 | 2,770 | 2,770 | |||||||||||||||
| Net income allocable to common stockholders |
53,533 | 53,757 | 45,249 | 28,541 | 19,907 | |||||||||||||||
| Earnings per share allocable to common stockholders: |
||||||||||||||||||||
| Basic |
1.88 | 1.98 | 1.71 | 1.09 | 0.77 | |||||||||||||||
| Diluted |
1.85 | 1.93 | 1.69 | 1.08 | 0.76 | |||||||||||||||
| Interest rate spread |
3.79 | % | 3.62 | % | 3.51 | % | 3.39 | % | 3.49 | % | ||||||||||
| Net interest margin |
3.87 | 3.68 | 3.56 | 3.46 | 3.60 | |||||||||||||||
| Efficiency ratio |
63.52 | 65.76 | 62.42 | 62.19 | 66.85 | |||||||||||||||
| Noninterest income as a percentage of total revenue (4) |
34.29 | 34.82 | 37.64 | 40.43 | 33.34 | |||||||||||||||
| Return on average assets |
1.05 | 1.17 | 1.07 | 0.73 | 0.56 | |||||||||||||||
| Return on average equity |
10.24 | 12.21 | 11.60 | 7.66 | 5.96 | |||||||||||||||
| Return on tangible common equity |
12.06 | 13.80 | 13.60 | 9.15 | 7.03 | |||||||||||||||
| Average equity to average assets |
10.31 | 10.33 | 8.62 | 9.58 | 9.34 | |||||||||||||||
| Tangible equity to assets |
8.84 | 9.00 | 7.69 | 8.93 | 8.41 | |||||||||||||||
| Tangible common equity to assets |
8.84 | 9.00 | 7.69 | 7.72 | 7.18 | |||||||||||||||
| Ratio of nonperforming assets to total assets |
0.71 | 1.08 | 1.06 | 1.43 | 2.14 | |||||||||||||||
| Ratio of allowance for loan losses to total gross loans |
0.98 | 1.23 | 1.40 | 1.58 | 1.92 | |||||||||||||||
| Ratio of allowances for loan losses to nonaccruing loans |
175 | 164 | 133 | 92 | 75 | |||||||||||||||
| Ratio of charge-offs to average gross loans |
0.29 | 0.18 | 0.33 | 1.49 | 1.32 | |||||||||||||||
| (1) | Includes loans held-for-sale. |
| (2) | Includes securities available-for-sale, held-to-maturity, and trading. |
| (3) | Borrowings consist of FHLB advances, securities sold under agreement to repurchase and other borrowed funds. |
| (4) | Computed on a fully tax-equivalent basis. |
| (5) | Net of unearned income. |
37
Table of Contents
ITEM 7. MANAGEMENT’S DISCUSSION AND ANALYSIS OF FINANCIAL CONDITION AND RESULTS OF OPERATIONS
OVERVIEW
We are a thrift holding company headquartered in Wilmington, Delaware. Substantially all of our assets are held by our subsidiary, WSFS Bank, the seventh oldest bank continuously operating under the same name in the United States. At nearly $5.6 billion in assets and $13.2 billion in fiduciary assets, WSFS Bank is also the largest bank and trust company headquartered in Delaware and the Delaware Valley. As a federal savings bank, which was formerly chartered as a state mutual savings bank, the Bank enjoys broader fiduciary powers than most other financial institutions. A fixture in the community, the Bank has been in operation for more than 184 years. In addition to its focus on stellar customer service, the Bank has continued to fuel growth and remains a leader in our community. We are a relationship-focused, locally-managed, banking institution. We state our mission simply: “We Stand for Service.” Our strategy of “Engaged Associates delivering Stellar Service growing Customer Advocates and value for our Owners” focuses on exceeding customer expectations, delivering stellar service and building customer advocacy through highly-trained, relationship-oriented, friendly, knowledgeable and empowered Associates.
Our core banking business is commercial lending funded by customer-generated deposits. We have built a $3.1 billion commercial loan portfolio by recruiting the best seasoned commercial lenders in our markets and by offering the high level of service and flexibility typically associated with a community bank. We fund this business primarily with deposits generated through commercial relationships and retail deposits. We service our customers primarily from our 63 offices located in Delaware (44), Pennsylvania (17), Virginia (1) and Nevada (1) and through our website at www.wsfsbank.com. We also offer a broad variety of consumer loan products, retail securities and insurance brokerage services through our retail branches and mortgage and title services through those branches and through Pennsylvania-based WSFS Mortgage/Array Financial.
WSFS Mortgage/Array Financial is a mortgage banking and abstract and title company specializing in a variety of residential mortgage and refinancing solutions.
On October 9, 2015 we completed the acquisition of Alliance Bancorp, Inc. of Pennsylvania (Alliance) and its wholly owned subsidiary, Alliance Bank, headquartered in Broomall, Pennsylvania. We expect this acquisition to build our market share, expand our customer base and enhance our fee income. The results of Alliance’s operations are included in our Consolidated Financial Statements since the date of the acquisition.
Our Cash Connect segment manages $581 million in vault cash in over 16,000 non-bank ATMs nationwide and provides related services such as, online reporting and ATM cash management, predictive cash ordering, armored carrier management, ATM processing equipment sales and deposit safe cash logistics. Cash Connect also operates 467 ATMs for the Bank, which has, by far, the largest branded ATM network in Delaware.
As a provider of ATM Vault Cash to the U.S. ATM industry, Cash Connect is exposed to substantial operational risk, including theft of cash from ATMs, armored vehicles, or armored carrier terminals, as well as general risk of accounting errors or fraud. This risk is managed through a series of financial controls, automated tracking and settlement systems, contracts, and other risk mitigation strategies, including both loss prevention and loss recovery strategies. Throughout its 15-year history, Cash Connect periodically has been exposed to theft from armored courier companies and consistently has been able to recover any losses through its risk management strategies.
The Wealth Management segment provides a broad array of fiduciary, investment management, credit and deposit products to clients through four businesses. WSFS Wealth Investments provides insurance and brokerage products primarily to our retail banking clients. Cypress Capital Management, LLC (Cypress) is a registered investment advisor with $637.8 million in assets under management. Cypress’ primary market segment is high net worth individuals, offering a ‘balanced’ investment style focused on preservation of capital and current income. Christiana Trust, with $12.58 billion in assets under administration, provides fiduciary and investment services to personal trust clients, and trustee, agency, bankruptcy administration, custodial and commercial domicile services to corporate and institutional clients. WSFS
38
Table of Contents
Private Banking serves high net worth clients by delivering credit and deposit products and partnering with other business units to deliver investment management and fiduciary products and services.
The company has two consolidated subsidiaries, WSFS Bank and Cypress, and one unconsolidated subsidiary, WSFS Capital Trust III (the Trust). WSFS Bank has three wholly owned subsidiaries, WSFS Wealth Investments, 1832 Holdings, Inc. and Monarch Entity Services, LLC (Monarch).
RESULTS OF OPERATIONS
We recorded net income of $53.5 million, or $1.85 per share for the year ended December 31, 2015 a $224,000 decrease compared to $53.8 million, or $1.93 per share for the year ended December 31, 2014. Results for 2014 included a one-time tax benefit of $6.7 million, or $0.24 per share and $3.6 million (pre-tax), or $0.08 per share, less in corporate development expenses. Earnings for 2015 were impacted by a significant increase in net interest income driven by both organic growth and the acquisition of Alliance in October 2015. Additionally, our Trust and Wealth Management business and Mortgage banking business continued to see significant growth over the prior year. Offsetting the growth in interest income was an increase to the provision for loan losses of $4.2 million for the full year 2015 compared to the full year 2014 driven by one large C&I credit that had a net charge-off of $5.7 million during 2015. Lastly, we saw an increase of $16.9 million in our operating expenses during the year, reflecting growth in ongoing operating costs from our recent acquisition of Alliance and the investment in the related infrastructure and staffing costs to support our growth.
We recorded net income of $53.8 million for the year ended December 31, 2014, a $6.9 million or 15% increase compared to $46.9 million for the year ended December 31, 2013. Income allocable to common stockholders was $53.8 million, or $1.93 per diluted common share for the year ended December 31, 2014, compared to income allocable to common shareholders of $45.2 million, or $1.69 per diluted common share (a 14.2% increase in diluted EPS) for the year ended December 31, 2013. Earnings for 2014 were impacted by a significant increase in net interest income driven by both organic growth and the acquisition of FNBW completed during 2014. Earnings also benefited from a one-time tax benefit of approximately $6.7 million due to the legal call of our reverse mortgage trust bonds. Also favorably impacting earnings for 2014 was the provision for loan losses of $3.6 million for the full year 2014, a $3.6 million decrease from the full year 2013. Additionally, our Trust and Wealth Management business grew significantly over the prior year. Partially offsetting these increases was a decrease in noninterest income driven by a one-time reverse mortgage consolidation gain recognized in 2013 and lower securities gains in 2014. Lastly, we saw an increase in our operating expenses during 2014. Similar to the year-over-year increase in 2015, the growth in operating costs was from two acquisitions (FNBW and Array/Arrow), organic hiring of additional revenue-generating professionals, investment in the related infrastructure and staffing costs to support these activities and additional compliance personnel.
Net Interest Income
Net interest income increased $22.3 million, or 15%, to $166.8 million in 2015 while net interest margin increased 19 basis points to 3.87% in 2015 compared to 3.68% in 2014. The increase in net interest income was due to positive performance in our portfolio of purchased loans and improvement in our balance sheet mix, as well as strong organic and acquisition growth.
Net interest income increased $12.9 million, or 10%, to $144.5 million in 2014, while net interest margin increased 12 basis points to 3.68% in 2014 compared to 3.56% in 2013. The annual increase in both net interest income and net interest margin occurred despite yield curve and competitive pressures, and was primarily due to growth, including the FNBW acquisition, improved balance sheet mix and continued focus on pricing discipline.
The following table provides certain information regarding changes in net interest income attributable to changes in the volumes of interest-earning assets and interest-bearing liabilities and changes in the rates for the periods indicated. For each category of interest-earning assets and interest-bearing liabilities, information is provided on the changes that are attributable to: (i) changes in volume (change in volume multiplied by prior year rate); (ii) changes in rates (change in rate multiplied by prior year volume on each category); and (iii) net change (the sum of the change in volume and the change in rate). Changes due to the combination of rate and volume changes (changes in volume multiplied by changes in rate) are allocated proportionately between changes in rate and changes in volume.
39
Table of Contents
| Year Ended December 31, |
2015 vs. 2014 | 2014 vs. 2013 | ||||||||||||||||||||||
| (In Thousands) | Volume | Yield/Rate | Net | Volume | Yield/Rate | Net | ||||||||||||||||||
| Interest Income: |
||||||||||||||||||||||||
| Commercial real estate loans |
$ | 4,909 | $ | 2,429 | $ | 7,338 | $ | 3,945 | $ | (1,669 | ) | $ | 2,276 | |||||||||||
| Residential real estate loans |
422 | 368 | 790 | (589 | ) | (475 | ) | (1,064 | ) | |||||||||||||||
| Commercial loans (1) |
9,429 | 1,274 | 10,703 | 5,925 | (315 | ) | 5,610 | |||||||||||||||||
| Consumer loans |
1,043 | (123 | ) | 920 | 1,323 | (650 | ) | 673 | ||||||||||||||||
| Loans held for sale |
628 | (206 | ) | 422 | 100 | 315 | 415 | |||||||||||||||||
| Mortgage-backed securities |
636 | 25 | 661 | (296 | ) | 973 | 677 | |||||||||||||||||
| Investment securities (2) |
290 | 98 | 388 | 759 | 834 | 1,593 | ||||||||||||||||||
| Reverse mortgages |
(1,147 | ) | 1,317 | 170 | 947 | 1,315 | 2,262 | |||||||||||||||||
| FHLB Stock and deposits in other banks |
(20 | ) | 867 | 847 | 149 | 824 | 973 | |||||||||||||||||
|
|
|
|
|
|
|
|
|
|
|
|
|
|||||||||||||
| Favorable (unfavorable) |
16,190 | 6,049 | 22,239 | 12,263 | 1,152 | 13,415 | ||||||||||||||||||
|
|
|
|
|
|
|
|
|
|
|
|
|
|||||||||||||
| Interest expense: |
||||||||||||||||||||||||
| Deposits: |
||||||||||||||||||||||||
| Interest-bearing demand |
52 | 2 | 54 | 71 | 11 | 82 | ||||||||||||||||||
| Money market |
365 | 623 | 988 | 22 | 337 | 359 | ||||||||||||||||||
| Savings |
8 | 48 | 56 | 5 | 8 | 13 | ||||||||||||||||||
| Customer time deposits |
158 | (1,159 | ) | (1,001 | ) | (568 | ) | (85 | ) | (653 | ) | |||||||||||||
| Brokered certificates of deposits |
(95 | ) | 13 | (82 | ) | 156 | 13 | 169 | ||||||||||||||||
| FHLB advances |
87 | 494 | 581 | 89 | 464 | 553 | ||||||||||||||||||
| Trust Preferred borrowings |
(35 | ) | 96 | 61 | — | (21 | ) | (21 | ) | |||||||||||||||
| Reverse mortgage bonds payable |
— | — | — | (21 | ) | 21 | — | |||||||||||||||||
| Senior debt |
— | — | — | — | (5 | ) | (5 | ) | ||||||||||||||||
| Other borrowed funds |
(710 | ) | (1 | ) | (711 | ) | (1 | ) | — | (1 | ) | |||||||||||||
|
|
|
|
|
|
|
|
|
|
|
|
|
|||||||||||||
| (Favorable) unfavorable |
(170 | ) | 116 | (54 | ) | (247 | ) | 743 | 496 | |||||||||||||||
|
|
|
|
|
|
|
|
|
|
|
|
|
|||||||||||||
| Net change, as reported |
$ | 16,360 | $ | 5,933 | $ | 22,293 | $ | 12,510 | $ | 409 | $ | 12,919 | ||||||||||||
|
|
|
|
|
|
|
|
|
|
|
|
|
|||||||||||||
| (1) | The tax-equivalent income adjustment is related to commercial loans. |
| (2) | The tax-equivalent income adjustment is related to municipal securities. |
The increase in net interest income attributable to yield for commercial real estate loans and commercial loans in 2015 when compared to 2014 was primarily the result of positive performance on purchased loans, including one large commercial mortgage pay-off. The increase in net interest income attributable to yield for reverse mortgages was primarily due to loan maturities and pay-offs. Net interest income from FHLB Stock increased in 2015 when compared to 2014 primarily due to a special one-time dividend payment of $808,000 during 2015. The decrease in net interest expense attributable to yield for customer time deposits in 2015 when compared to 2014 was the result of allowing older, higher-rate time deposits to run-off as a part of net interest margin management.
In 2014 when compared to 2013, interest income attributable to yield on mortgage-backed securities and investment securities increased due to sales of lower yielding mortgage-back securities and the purchase of higher yielding municipal bonds. Further, interest income attributable to yield on reverse mortgages increased due to loan maturities and pay-offs, and interest income on FHLB Stock increased due to higher dividends. These increases were partially offset by a decrease in net interest income attributable to yield on our loan portfolios held for investment primarily due to a continued competitive loan pricing environment.
40
Table of Contents
The following table provides information regarding the average balances of, and yields/rates on, interest-earning assets and interest-bearing liabilities during the periods indicated:
| Year Ended December 31, |
2015 | 2014 | 2013 | |||||||||||||||||||||||||||||||||
| (In Thousands) |
Average Balance |
Interest & Dividends |
Yield/ Rate (1) |
Average Balance |
Interest & Dividends |
Yield/ Rate (1) |
Average Balance |
Interest & Dividends |
Yield/ Rate (1) |
|||||||||||||||||||||||||||
| Assets: |
||||||||||||||||||||||||||||||||||||
| Interest-earning assets: |
||||||||||||||||||||||||||||||||||||
| Loans: (2) |
||||||||||||||||||||||||||||||||||||
| Commercial real estate loans |
$ | 1,057,662 | $ | 52,189 | 4.93 | % | $ | 878,627 | $ | 40,922 | 4.66 | % | $ | 797,384 | $ | 37,842 | 4.75 | % | ||||||||||||||||||
| Residential real estate loans |
262,291 | 10,645 | 4.06 | 241,261 | 9,434 | 3.91 | 235,803 | 9,492 | 4.03 | |||||||||||||||||||||||||||
| Commercial loans |
1,765,540 | 79,349 | 4.47 | 1,636,843 | 72,575 | 4.40 | 1,519,320 | 67,768 | 4.43 | |||||||||||||||||||||||||||
| Consumer loans |
337,146 | 15,037 | 4.46 | 314,010 | 14,117 | 4.50 | 288,658 | 13,445 | 4.66 | |||||||||||||||||||||||||||
| Loans Held For Sale |
— | — | — | — | — | — | 18,922 | 591 | 3.12 | |||||||||||||||||||||||||||
|
|
|
|
|
|
|
|
|
|
|
|
|
|||||||||||||||||||||||||
| Total loans |
3,422,639 | 157,220 | 4.61 | 3,070,741 | 137,048 | 4.46 | 2,860,087 | 129,138 | 4.52 | |||||||||||||||||||||||||||
| Mortgage-backed securities (3) |
727,999 | 14,173 | 1.95 | 695,306 | 13,511 | 1.94 | 711,443 | 12,834 | 1.80 | |||||||||||||||||||||||||||
| Investment securities (3) |
161,865 | 3,672 | 3.29 | 150,419 | 3,285 | 3.21 | 95,795 | 1,692 | 2.50 | |||||||||||||||||||||||||||
| Reverse mortgage related assets |
26,473 | 5,299 | 20.02 | 33,087 | 5,129 | 15.50 | 25,777 | 2,867 | 11.12 | |||||||||||||||||||||||||||
| Other interest-earning assets |
29,247 | 2,212 | 7.56 | 32,232 | 1,364 | 4.23 | 34,516 | 391 | 1.13 | |||||||||||||||||||||||||||
|
|
|
|
|
|
|
|
|
|
|
|
|
|||||||||||||||||||||||||
| Total interest-earning assets |
4,368,223 | 182,576 | 4.23 | 3,981,785 | 160,337 | 4.08 | 3,727,618 | 146,922 | 3.97 | |||||||||||||||||||||||||||
|
|
|
|
|
|
|
|
|
|
|
|
|
|||||||||||||||||||||||||
| Allowance for loan losses |
(39,269 | ) | (41,298 | ) | (43,014 | ) | ||||||||||||||||||||||||||||||
| Cash and due from banks |
89,269 | 81,390 | 81,301 | |||||||||||||||||||||||||||||||||
| Cash in non-owned ATMs |
412,582 | 370,789 | 411,988 | |||||||||||||||||||||||||||||||||
| Bank owned life insurance |
79,833 | 67,548 | 63,012 | |||||||||||||||||||||||||||||||||
| Other noninterest-earning assets |
164,734 | 139,478 | 124,484 | |||||||||||||||||||||||||||||||||
|
|
|
|
|
|
|
|||||||||||||||||||||||||||||||
| Total assets |
$ | 5,075,372 | $ | 4,599,692 | $ | 4,365,389 | ||||||||||||||||||||||||||||||
|
|
|
|
|
|
|
|||||||||||||||||||||||||||||||
| Liabilities and Stockholders’ Equity: |
||||||||||||||||||||||||||||||||||||
| Interest-bearing liabilities: |
||||||||||||||||||||||||||||||||||||
| Interest-bearing deposits: |
||||||||||||||||||||||||||||||||||||
| Interest-bearing demand |
$ | 695,890 | $ | 666 | 0.10 | % | $ | 642,046 | $ | 611 | 0.10 | % | $ | 566,848 | $ | 529 | 0.09 | % | ||||||||||||||||||
| Money market |
966,589 | 2,469 | 0.26 | 794,292 | 1,482 | 0.19 | 779,023 | 1,123 | 0.14 | |||||||||||||||||||||||||||
| Savings |
414,484 | 288 | 0.07 | 400,759 | 231 | 0.06 | 391,047 | 217 | 0.06 | |||||||||||||||||||||||||||
| Customer time deposits |
472,921 | 3,056 | 0.65 | 472,512 | 4,059 | 0.86 | 530,496 | 4,712 | 0.89 | |||||||||||||||||||||||||||
|
|
|
|
|
|
|
|
|
|
|
|
|
|||||||||||||||||||||||||
| Total interest-bearing customer deposits |
2,549,884 | 6,479 | 0.25 | 2,309,609 | 6,383 | 0.28 | 2,267,414 | 6,581 | 0.29 | |||||||||||||||||||||||||||
| Brokered deposits |
195,454 | 687 | 0.35 | 222,567 | 768 | 0.35 | 177,396 | 599 | 0.34 | |||||||||||||||||||||||||||
|
|
|
|
|
|
|
|
|
|
|
|
|
|||||||||||||||||||||||||
| Total interest-bearing deposits |
2,745,338 | 7,166 | 0.26 | 2,532,176 | 7,151 | 0.28 | 2,444,810 | 7,180 | 0.29 | |||||||||||||||||||||||||||
| FHLB advances |
621,024 | 3,008 | 0.48 | 600,172 | 2,427 | 0.40 | 573,989 | 1,874 | 0.32 | |||||||||||||||||||||||||||
| Trust preferred borrowings |
67,011 | 1,362 | 2.00 | 67,011 | 1,321 | 1.94 | 67,011 | 1,342 | 1.98 | |||||||||||||||||||||||||||
| Reverse mortgage bonds payable |
— | — | — | — | — | — | 6,757 | 60 | 0.88 | |||||||||||||||||||||||||||
| Senior debt |
55,000 | 3,766 | 6.85 | 55,000 | 3,766 | 6.85 | 55,000 | 3,771 | 6.86 | |||||||||||||||||||||||||||
| Other borrowed funds (4) |
134,517 | 474 | 0.35 | 150,174 | 1,165 | 0.78 | 143,131 | 1,107 | 0.77 | |||||||||||||||||||||||||||
|
|
|
|
|
|
|
|
|
|
|
|
|
|||||||||||||||||||||||||
| Total interest-bearing liabilities |
3,622,890 | 15,776 | 0.44 | 3,404,533 | 15,830 | 0.46 | 3,290,698 | 15,334 | 0.47 | |||||||||||||||||||||||||||
|
|
|
|
|
|
|
|
|
|
|
|
|
|||||||||||||||||||||||||
| Noninterest-bearing demand deposits |
884,897 | 718,989 | 638,397 | |||||||||||||||||||||||||||||||||
| Other noninterest-bearing liabilities |
44,660 | 35,897 | 32,265 | |||||||||||||||||||||||||||||||||
| Stockholders’ equity |
522,925 | 440,273 | 404,029 | |||||||||||||||||||||||||||||||||
|
|
|
|
|
|
|
|||||||||||||||||||||||||||||||
| Total liabilities and stockholders’ equity |
$ | 5,075,372 | $ | 4,599,692 | $ | 4,365,389 | ||||||||||||||||||||||||||||||
|
|
|
|
|
|
|
|||||||||||||||||||||||||||||||
| Excess of interest-earning assets over interest-bearing liabilities |
$ | 745,333 | $ | 577,252 | $ | 436,920 | ||||||||||||||||||||||||||||||
|
|
|
|
|
|
|
|||||||||||||||||||||||||||||||
| Net interest and dividend income |
$ | 166,800 | $ | 144,507 | $ | 131,588 | ||||||||||||||||||||||||||||||
|
|
|
|
|
|
|
|||||||||||||||||||||||||||||||
| Interest rate spread |
3.79 | % | 3.62 | % | 3.51 | % | ||||||||||||||||||||||||||||||
|
|
|
|
|
|
|
|||||||||||||||||||||||||||||||
| Net interest margin | 3.87 | % | 3.68 | % | 3.56 | % | ||||||||||||||||||||||||||||||
|
|
|
|
|
|
|
|||||||||||||||||||||||||||||||
See “Notes”
| (1) | Weighted average yields have been computed on a tax-equivalent basis using a 35% effective tax rate. |
| (2) | Average balances include nonperforming loans and are net of unearned income. |
41
Table of Contents
| (3) | Includes securities available-for-sale at fair value. |
| (4) | Includes federal funds purchased and securities sold under agreement to repurchase. |
Provision for Loan Losses
We maintain an allowance for loan losses at an appropriate level based on our assessment of estimable and probable losses in the loan portfolio, which we evaluate in accordance with applicable accounting principles, as discussed further in “Nonperforming Assets”. Our evaluation is based upon a review of the portfolio and requires significant, complex and difficult judgments. For the year ended December 31, 2015 we recorded a provision for loan losses of $7.8 million compared to $3.6 million in 2014 and $7.2 million in 2013. The increase was primarily due to a $9.1 million C&I problem loan relationship previously classified as an accruing TDR, which was moved to nonaccruing status during the second quarter of 2015 and resulted in an incremental increase in the provision for loan losses of $3.8 million during 2015.
Noninterest (Fee) Income
Fee income increased $10.0 million to $88.3 million in 2015 from $78.3 million in 2014. Excluding the non-routine and other one-time items listed in the table below, noninterest income increased $9.6 million, or 12%, to $86.8 million in 2015 from $77.2 million in 2014. This increase reflected both strong organic and acquisition growth.
| Twelve months ended | ||||||||||||
| (In Thousands) | December 31, 2015 |
December 31, 2014 |
December 31, 2013 |
|||||||||
| Noninterest income (GAAP) |
$ | 88,255 | $ | 78,278 | $ | 80,151 | ||||||
| Less: Securities gains, net |
(1,478 | ) | (1,037 | ) | (3,516 | ) | ||||||
| Reverse mortgage consolidation gain (1) |
— | — | (3,801 | ) | ||||||||
|
|
|
|
|
|
|
|||||||
| Adjusted noninterest income (non-GAAP) |
$ | 86,777 | $ | 77,241 | $ | 72,834 | ||||||
|
|
|
|
|
|
|
|||||||
| (1) | During the third quarter of 2013, we obtained the right to execute a clean-up call on the underlying collateral for our pool of reverse mortgages. A non-routine gain resulted from this transaction. |
Wealth management income grew $4.5 million, or 26%, in 2015 compared to 2014 reflecting growth in several business lines, with particular strength in bankruptcy administration, trustee securitization appointments and retail brokerage services. Mortgage banking activities increased $1.9 million or 48% when compared to 2014 reflecting strong growth provided by WSFS Mortgage. Credit/debit card and ATM fees increased $1.6 million, or 7%, in 2015 compared to 2014 reflecting organic growth and new product offerings. Lastly, deposit service charges decreased slightly compared to 2014 due to changes in the regulatory environment and customer behavior.
Wealth management income grew $1.8 million, or 11.8%, in 2014 compared to 2013, reflecting the continued expansion of the corporate and personal trust business lines as well as an increase in Private Banking jumbo mortgage products provided by the WSFS Mortgage/Array Financial asset purchase. Mortgage banking activities, deposit service charges and credit/debit card and ATM fees remained essentially flat in 2014 compared to 2013. Deposit service charges ended the year down slightly compared to the prior year due to ongoing changes in customer behavior combined with the impact of several data breaches merchants had with card activation and uses.
42
Table of Contents
Noninterest Expenses
Noninterest expense in 2015 increased $16.9 million to $163.5 million from $146.6 million in 2014. Excluding the non-routine and other one-time items listed in the table below, noninterest expense increased $12.6 million, or 9%, to $155.2 million in 2015 from $142.6 million in 2014.
| Twelve months ended | ||||||||||||
| (In Thousands) | December 31, 2015 |
December 31, 2014 |
December 31, 2013 |
|||||||||
| Noninterest expenses (GAAP) |
$ | 163,459 | $ | 146,645 | $ | 131,755 | ||||||
| Less: Debt extinguishment costs |
(651 | ) | — | — | ||||||||
| Corporate development costs (1) |
(7,620 | ) | (4,031 | ) | (717 | ) | ||||||
|
|
|
|
|
|
|
|||||||
| Adjusted noninterest expenses (non-GAAP) |
$ | 155,188 | $ | 142,614 | $ | 131,038 | ||||||
|
|
|
|
|
|
|
|||||||
| (1) | Corporate development costs were largely attributable to professional fees related to the 2013 calling and consolidating of the equity tranche SASCO of a 2002 reverse mortgage trust transaction, the WSFS Mortgage/Array Financial, formerly known as Array/Arrow, asset purchase that closed during the third quarter of 2013, the acquisition of First Wyoming Financial Corporation that closed during the third quarter of 2014, and the acquisition of Alliance Bancorp, Inc. that closed during the fourth quarter of 2015. |
The $12.6 million increase in noninterest expense in 2015 was primarily the result of increased compensation expense tied to organic and acquisition growth as well as improved core performance. Also contributing to the increase were increased operating costs to support the infrastructure from our significant organic and acquisition growth, and the ongoing operating costs from the addition of the Alliance franchise which closed in early October 2015.
In 2014 the acquisition of FNBW and the WSFS Mortgage/Array Financial asset purchase drove corporate development costs to increase by $3.3 million while the additional staff associated with these transactions and organic hiring of revenue generating professionals increased salaries, benefits and other compensation by $5.5 million. In addition, we invested in the related infrastructure and staffing to support these activities while also hiring additional compliance personnel. We also incurred an additional $2.8 million increase in professional fees related to short-lived projects that are not expected to re-occur at the same levels after 2014. Further, we recorded a $565,000 (pretax) adjustment in benefit expense for its post-retirement health plan obligations due to changes in assumptions and longer life expectancies in updated mortality tables.
Income Taxes
We recorded $30.3 million of tax expense for the year ended December 31, 2015 compared to tax expense of $18.8 million and $25.9 million for the years ended December 31, 2014 and 2013, respectively. In 2013, we recorded a deferred tax asset and corresponding valuation allowance in connection with the consolidation of the reverse mortgage trust. During early 2014, this valuation allowance was removed and the consolidation resulted in a $6.7 million tax benefit in 2014. Excluding this item, the effective tax rate for the year ended December 31, 2014 was 35.2%. The effective tax rates for the years ended December 31, 2015, 2014 and 2013 were 36.1%, 25.9%, and 35.6%, respectively. Volatility in effective tax rates is impacted by the level of pretax income or loss, combined with the amount of tax-free income as well as the effects of unrecognized tax benefits. The provision for income taxes includes federal, state and local income taxes that are currently payable or deferred because of temporary differences between the financial reporting basis and the tax reporting basis of the assets and liabilities. For additional information see Note 15 to the Consolidated Financial Statements.
SEGMENT INFORMATION
For financial reporting purposes, our business has three reporting segments: WSFS Bank, Cash Connect, and Wealth Management. The WSFS Bank segment provides loans and other financial products to commercial and retail customers. Cash Connect provides turnkey ATM services through strategic partnerships with several of the largest network, manufacturers and service providers in the ATM industry. The Wealth Management segment provides a broad array of fiduciary, investment management, credit and deposit products to clients.
43
Table of Contents
The WSFS Bank segment income before taxes grew $10.2 million or 19%, in 2015 compared to 2014 due primarily to an increase in external net interest income reflecting positive performance in our portfolio of purchased loans, improvement in our balance sheet mix, as well as strong organic and acquisition growth. The increase in net interest income was partially offset by an increase in external operating expenses driven by increased compensation expense tied to organic and acquisition growth as well as improved core performance. Also contributing to the increase in operating expenses were increased costs to support the infrastructure from the segment’s significant organic and acquisition growth.
The WSFS Bank segment income before taxes decreased $1.7 million, or 3%, in 2014 compared to 2013 due primarily to higher non-routine gains of $6.3 million in 2013 from the sale of securities and the execution of a clean-up call on the underlying collateral for our pool of reverse mortgages, as well as the impact of increased non-routine corporate development expenses of $3.3 million in 2014, largely related to our acquisition of FNBW. External net interest income increased $12.8 million in 2014, or 10%, reflecting both organic and acquisition growth, improvement in our balance sheet mix, as well as additional income from reverse mortgage related assets. Excluding the impact of the aforementioned gains in 2013, noninterest income increased slightly, or 1%, year-over-year. These increases were partially offset by an increase in external operating expenses driven by organic and acquisition growth.
The Cash Connect segment income before taxes grew $486,000, or 7%, in 2015 compared to 2014 due primarily to a $2.7 million, or 11%, increase in external fee income reflecting growth of the segment through continued market penetration of its core business offerings of ATM vault cash and related total cash management services. The increase in fee income was partially offset by a $1.8 million, or 12%, increase in external operating expenses reflecting investments in new products and infrastructure to support growth. During 2015, Cash Connect introduced “WSFS Mobile Cash”, which allows customers to securely withdraw cash from ATMs by using our WSFS Mobile Bank App, and launched a new smart safe service that allows merchants to place their cash into a smart safe which communicates the amount of cash deposited to Cash Connect.
The Cash Connect segment income before taxes decreased $485,000, or 6%, in 2014 compared to 2013 mainly due to a $2.5 million, or 19%, increase in external noninterest expenses to support growth and new product introductions. The increase in noninterest expenses was mostly offset by a $2.0 million increase in external noninterest income reflecting growth of the segment through organic growth and new product offerings.
The Wealth Management segment income before taxes grew $552,000, or 5%, in 2015 compared to 2014. External fee income grew $4.7 million, or 26%, reflecting growth in several business lines, with particular strength in bankruptcy administration, trustee securitization appointments and retail brokerage services. The growth in fee income was offset by an increase in external operating expenses primarily due to increased legal and consulting fees and higher compensation expense to support the significant growth and volume-related commissions and transaction charges. Total net interest income increased $1.1 million, or 10%, when compared to 2014, due primarily to growth in Private Banking and the partnership with WSFS Mortgage/Array Financial in the delivery of mortgage products to Private Banking clients.
The Wealth Management segment income before taxes grew $2.0 million, or 20%, in 2014 compared to 2013, reflecting the continued expansion of the corporate and personal trust business lines as well as an increase in Private Banking jumbo mortgage products provided by the WSFS Mortgage/Array Financial acquisition in 2013.
Segment financial information for the years ended December 31, 2015, 2014 and 2013 is provided in Note 20 to the Consolidated Financial Statements in this report.
FINANCIAL CONDITION
Our total assets increased $732.6 million, or 15%, to $5.59 billion as of December 31, 2015, compared to $4.85 billion as of December 31, 2014. Included in this increase was a $572.4 million, or 18%, increase in net loans which was nearly equally split between the $291.1 million in net loans from the Alliance acquisition and $281.3 million of organic loan growth during 2015.
44
Table of Contents
Total liabilities increased $641.2 million during the year to $5.01 billion at December 31, 2015. This increase was primarily the result of an increase in total customer deposits of $397.6 which includes $339.3 million in customer deposits from the Alliance acquisition. FHLB advances also increased $263.6 million due to the aforementioned loan growth and the expected outflow of temporary trust-related money market deposits in early 2015.
Cash in non-owned ATMs
During 2015, cash managed by Cash Connect in non-owned ATM’s increased $63.7 million, or 15%, to $477.9 million. At December 31, 2015, Cash Connect serviced over 16,000 ATMs as well as 467 WSFS-owned ATMs to serve customers in our markets.
Investment Securities, available-for-sale
Investment securities, available-for-sale decreased $19.1 million to $721.0 million during 2015. This was due to a $20.0 million decrease in mortgage-backed securities as a result of ongoing portfolio management.
Investment Securities, held-to-maturity
Investment securities, held-to-maturity increased $39.7 million to $165.9 million during 2015. This increase was mainly in our portfolio of municipal bonds which reflects our recent investment strategy of reducing our investments in mortgage-backed securities and increasing our investment in tax-exempt securities.
At December 31, 2014, 257 municipal securities with a fair value of $340.3 million were transferred from available-for-sale to held-to-maturity. The reclassification was permitted as the Company has appropriately determined the ability and intent to hold these securities as an investment until maturity.
Loans held-for-sale
Loans held-for-sale are recorded at their fair value and increased $13.3 million to $41.8 million primarily due to growth in our mortgage banking business.
Loans, net
Net loans increased $572.4 million, or 18%, during 2015. Loan growth included commercial and industrial loan increases of $233.6 million, or 14%, commercial real estate increases of $160.1 million or 20%, and construction increases of $102.8 million, or 73%. This loan growth included $291.1 million in acquired loans from the Alliance acquisition in the fourth quarter of 2015.
Reverse Mortgage Related Assets
Reverse mortgage related assets include reverse mortgage loans, SASCO 2002-RMI’s Class “O” certificates and the BBB-related tranche of this reverse mortgage security. For additional information on these reverse mortgage related assets, see Note 7 to our Consolidated Financial Statements.
Goodwill and Intangibles
Goodwill and intangibles increased $37.7 million during 2015. Due to the acquisition of Alliance in 2015, we recorded goodwill of $36.4 million and other intangible assets of $3.1 million. For additional information on goodwill and intangibles, see Note 9 to our Consolidated Financial Statements.
Customer Deposits
Customer deposits increased $397.6 million, or 11%, during 2015 to $3.86 billion. Core deposit relationships increased $311.5 million, or 11% and customer time deposits increased $86.0 million, or 17%. Included in customer deposit growth was $339.3 million from the Alliance acquisition in the fourth quarter of 2015.
45
Table of Contents
The table below depicts the changes in customer deposits during the last three years:
| Year Ended December 31, | ||||||||||||
| (In Millions) | 2015 | 2014 | 2013 | |||||||||
| Beginning balance |
$ | 3,462 | $ | 3,018 | $ | 3,104 | ||||||
| Interest credited |
7 | 7 | 5 | |||||||||
| Deposit inflows (outflows), net |
391 | 437 | (91 | ) | ||||||||
|
|
|
|
|
|
|
|||||||
| Ending balance |
$ | 3,860 | $ | 3,462 | $ | 3,018 | ||||||
|
|
|
|
|
|
|
|||||||
Borrowings and Brokered Deposits
Borrowings and brokered deposits increased by $236.2 million during 2015. Included in the increase was a $263.6 million increase in FHLB advances due to loan growth and the expected outflow of temporary trust-related money market deposits in early 2015. Partially offsetting this increase was the decrease of $30.2 million in brokered deposits.
Stockholders’ Equity
Stockholders’ equity increased $91.4 million, or 19%, to $580.5 million at December 31, 2015 compared to $489.1 million at December 31, 2014. Capital in excess of par value increased $54.9 million, mostly due to stock issued in conjunction with the Alliance acquisition. Retained earnings increased $47.5 million, or 9%, to $570.6 million during 2015, primarily as a result of earnings from the year less dividends paid. Partially offsetting these increases, treasury stock decreased $23.0 million, also related to shares issued for the Alliance acquisition which was partially offset by stock repurchases of $2.6 million. Additionally, other comprehensive income decreased $2.8 million, mainly due to interest-rate related reductions in the value of the available-for-sale investment portfolio.
ASSET/LIABILITY MANAGEMENT
Our primary asset/liability management goal is to optimize long term net interest income opportunities within the constraints of managing interest rate risk, ensuring adequate liquidity and funding and maintaining a strong capital base.
In general, interest rate risk is mitigated by closely matching the maturities or repricing periods of interest-sensitive assets and liabilities to ensure a favorable interest rate spread. We regularly review our interest-rate sensitivity, and use a variety of strategies as needed to adjust that sensitivity within acceptable tolerance ranges established by management and the Board of Directors. Changing the relative proportions of fixed-rate and adjustable-rate assets and liabilities is one of our primary strategies to accomplish this objective.
The matching of assets and liabilities may be analyzed using a number of methods including by examining the extent to which such assets and liabilities are “interest-rate sensitive” and by monitoring our interest-sensitivity gap. An interest-sensitivity gap is considered positive when the amount of interest-rate sensitive assets exceeds the amount of interest-rate sensitive liabilities repricing within a defined period, and is considered negative when the amount of interest-rate sensitive liabilities exceeds the amount of interest-rate sensitive assets repricing within a defined period.
For additional information related to interest rate sensitivity, see Item 7A. Quantitative and Qualitative Disclosures About Market Risk.
46
Table of Contents
The repricing and maturities of our interest-rate sensitive assets and interest-rate sensitive liabilities at December 31, 2015 are shown in the following table:
| (In Thousands) | Less than One Year |
One to Five Years |
Over Five Years |
Total | ||||||||||||
| Interest-rate sensitive assets: |
||||||||||||||||
| Commercial loans (2)(3) |
$ | 1,415,071 | $ | 363,099 | $ | 142,905 | $ | 1,921,075 | ||||||||
| Real estate loans (1) (2) |
1,020,103 | 318,598 | 133,449 | 1,472,150 | ||||||||||||
| Mortgage-backed securities |
107,998 | 338,798 | 243,319 | 690,115 | ||||||||||||
| Consumer loans (2) |
269,427 | 58,426 | 32,396 | 360,249 | ||||||||||||
| Investment securities |
36,765 | 84,454 | 106,336 | 227,555 | ||||||||||||
| Loans held-for-sale (2) |
41,807 | — | — | 41,807 | ||||||||||||
| Reverse mortgage loans |
1,356 | 11,651 | 11,277 | 24,284 | ||||||||||||
|
|
|
|
|
|
|
|
|
|||||||||
| Total Assets |
2,892,527 | 1,175,026 | 669,682 | 4,737,235 | ||||||||||||
|
|
|
|
|
|
|
|
|
|||||||||
| Interest-rate sensitive liabilities: |
||||||||||||||||
| Money market and interest-bearing demand deposits |
1,312,268 | — | 562,401 | 1,874,669 | ||||||||||||
| FHLB advances |
597,400 | 72,114 | — | 669,514 | ||||||||||||
| Savings accounts |
219,959 | — | 219,959 | 439,918 | ||||||||||||
| Retail certificates of deposit |
162,796 | 166,808 | 3,396 | 333,000 | ||||||||||||
| Brokered certificates of deposit |
156,042 | 688 | — | 156,730 | ||||||||||||
| Other borrowed funds |
128,200 | — | — | 128,200 | ||||||||||||
| Jumbo certificates of deposit |
139,633 | 113,711 | 667 | 254,011 | ||||||||||||
| Trust preferred securities |
67,011 | — | — | 67,011 | ||||||||||||
| Senior notes |
— | 55,000 | — | 55,000 | ||||||||||||
|
|
|
|
|
|
|
|
|
|||||||||
| Total Liabilities |
2,783,309 | 408,321 | 786,423 | 3,978,053 | ||||||||||||
|
|
|
|
|
|
|
|
|
|||||||||
| Excess (deficiency) of interest-rate sensitive assets over interest-rate liabilities (“interest-rate sensitive gap”) |
$ | 109,218 | $ | 766,705 | $ | (116,741 | ) | $ | 759,182 | |||||||
|
|
|
|
|
|
|
|
|
|||||||||
| One-year interest-rate sensitive assets/interest-rate sensitive liabilities |
103.92 | % | ||||||||||||||
| One-year interest-rate sensitive gap as a percent of total assets |
1.96 | % | ||||||||||||||
| (1) | Includes commercial mortgage, construction, and residential mortgage loans |
| (2) | Loan balances exclude nonaccruing loans, deferred fees and costs |
| (3) | Assumes two-thirds of loans in process are variable and will reprice within one-year |
Generally, during a period of rising interest rates, a positive gap would result in an increase in net interest income while a negative gap would adversely affect net interest income. Conversely, during a period of falling rates, a positive gap would result in a decrease in net interest income while a negative gap would augment net interest income. However, the interest-sensitivity table does not provide a comprehensive representation of the impact of interest rate changes on net interest income. Each category of assets or liabilities will not be affected equally or simultaneously by changes in the general level of interest rates. Even assets and liabilities which contractually reprice within the rate period may not reprice at the same price, at the same time or with the same frequency. It is also important to consider that the table represents a specific point in time. Variations can occur as we adjust our interest-sensitivity position throughout the year.
To provide a more accurate position of our one-year gap, certain deposit classifications are based on the interest-rate sensitive attributes and not on the contractual repricing characteristics of these deposits. For the purpose of this analysis, we estimate, based on historical trends of our deposit accounts, that 75% of our money market deposits, 50% of our interest-bearing demand deposits and 50% of our savings deposits are sensitive to interest rate changes. Accordingly, these interest-sensitive portions are classified in the “Less than One Year” category with the remainder in the “Over Five Years” category.
Deposit rates other than time deposit rates are variable. Changes in deposit rates are generally subject to local market conditions and our discretion and are not indexed to any particular rate.
47
Table of Contents
NONPERFORMING ASSETS
Nonperforming assets (NPAs) include nonaccruing loans, nonperforming real estate, assets acquired through foreclosure and restructured commercial, mortgage and home equity consumer debt. Nonaccruing loans are those on which the accrual of interest has ceased. Loans are placed on nonaccrual status immediately if, in the opinion of management, collection is doubtful, or when principal or interest is past due 90 days or more and the value of the collateral is insufficient to cover principal and interest. Interest accrued but not collected at the date a loan is placed on nonaccrual status is reversed and charged against interest income. In addition, the amortization of net deferred loan fees is suspended when a loan is placed on nonaccrual status. Subsequent cash receipts are applied either to the outstanding principal balance or recorded as interest income, depending on management’s assessment of the ultimate collectability of principal and interest. Past due loans are defined as loans contractually past due 90 days or more as to principal or interest payments but which remain in accrual status because they are considered well secured and in the process of collection.
The following table shows our nonperforming assets and past due loans at the dates indicated:
| (In Thousands) | ||||||||||||||||||||
| At December 31, |
2015 | 2014 | 2013 | 2012 | 2011 | |||||||||||||||
| Nonaccruing loans: |
||||||||||||||||||||
| Commercial |
$ | 5,328 | $ | 2,706 | $ | 4,305 | $ | 4,861 | $ | 23,080 | ||||||||||
| Owner-occupied commercial (1) |
1,091 | 2,475 | 5,197 | 14,001 | — | |||||||||||||||
| Commercial mortgages |
3,326 | 8,245 | 8,565 | 12,634 | 15,814 | |||||||||||||||
| Construction |
— | — | 1,158 | 1,547 | 22,124 | |||||||||||||||
| Residential mortgages |
7,287 | 7,068 | 8,432 | 9,989 | 9,057 | |||||||||||||||
| Consumer |
4,133 | 3,557 | 3,293 | 4,728 | 1,018 | |||||||||||||||
|
|
|
|
|
|
|
|
|
|
|
|||||||||||
| Total nonaccruing loans |
21,165 | 24,051 | 30,950 | 47,760 | 71,093 | |||||||||||||||
| Assets acquired through foreclosure |
5,080 | 5,734 | 4,532 | 4,622 | 11,695 | |||||||||||||||
| Restructured loans (2) |
13,647 | 22,600 | 12,332 | 10,093 | 8,887 | |||||||||||||||
|
|
|
|
|
|
|
|
|
|
|
|||||||||||
| Total nonperforming assets (NPAs) |
$ | 39,892 | $ | 52,385 | $ | 47,814 | $ | 62,475 | $ | 91,675 | ||||||||||
|
|
|
|
|
|
|
|
|
|
|
|||||||||||
| Past due loans: |
||||||||||||||||||||
| Residential mortgages |
$ | 251 | $ | — | $ | 533 | $ | 786 | $ | 887 | ||||||||||
| Commercial and commercial mortgages |
17,529 | — | — | — | 78 | |||||||||||||||
| Consumer |
252 | — | — | — | — | |||||||||||||||
|
|
|
|
|
|
|
|
|
|
|
|||||||||||
| Total past due loans |
$ | 18,032 | $ | — | $ | 533 | $ | 786 | $ | 965 | ||||||||||
|
|
|
|
|
|
|
|
|
|
|
|||||||||||
| Ratio of nonaccruing loans to total loans (3) |
0.56 | % | 0.75 | % | 1.05 | % | 1.73 | % | 2.58 | % | ||||||||||
| Ratio of allowance for loan losses to gross loans (3) |
0.98 | 1.23 | 1.40 | 1.58 | 1.92 | |||||||||||||||
| Ratio of NPA to total assets |
0.71 | 1.08 | 1.06 | 1.43 | 2.14 | |||||||||||||||
| Ratio of NPA (excluding accruing TDR) to total assets |
0.47 | 0.61 | 0.79 | 1.20 | 1.93 | |||||||||||||||
| Ratio of loan loss allowance to nonaccruing loans |
175.27 | 163.93 | 133.26 | 91.96 | 74.66 | |||||||||||||||
| (1) | Prior to 2012, owner-occupied commercial loans were included in commercial loans. |
| (2) | Accruing loans only. Nonaccruing TDRs are included in their respective categories of nonaccruing loans. |
| (3) | Total loans exclude loans held-for-sale. |
Nonperforming assets decreased $12.5 million between December 31, 2014 and December 31, 2015. As a result, nonperforming assets, as a percentage of total assets, decreased from 1.08% at December 31, 2014 to 0.71% at December 31, 2015. This reduction is primarily due to a charge-off of $5.7 million from one relationship, as well as a payoff of one relationship of $3.1 million. Acquisition activity added a number of non-performing assets, but payoffs, charge-offs and REO sales, in addition to those mentioned above, more than offset these additions.
The balance of loans accruing but 90 days or greater past due, at December 31, 2015 increased by approximately $18 million compared to December 31, 2014. One commercial relationship accounted for $17.5 million of this $18 million increase. The commercial relationship was a large retail business with highly seasonal cash flows, which has shown similar payment experience in prior years, and was brought current in early January 2016.
48
Table of Contents
The following table provides an analysis of the change in the balance of nonperforming assets during the last three years:
| Year Ended December 31, | ||||||||||||
| (In Thousands) |
2015 | 2014 | 2013 | |||||||||
| Beginning balance |
$ | 52,385 | $ | 47,814 | $ | 62,475 | ||||||
| Additions |
12,897 | 38,322 | 30,367 | |||||||||
| Collections |
(14,167 | ) | (25,111 | ) | (29,725 | ) | ||||||
| Transfers to accrual |
(95 | ) | (96 | ) | (1,702 | ) | ||||||
| Charge-offs/write-downs |
(11,128 | ) | (8,544 | ) | (13,601 | ) | ||||||
|
|
|
|
|
|
|
|||||||
| Ending balance |
$ | 39,892 | $ | 52,385 | $ | 47,814 | ||||||
|
|
|
|
|
|
|
|||||||
The timely identification of problem loans is a key element in our strategy to manage our loan portfolio. Timely identification enables us to take appropriate action and, accordingly, minimize losses. An asset review system established to monitor the asset quality of our loans and investments in real estate portfolios facilitates the identification of problem assets. In general, this system utilizes guidelines established by federal regulation.
At December 31, 2015, we did not have a material amount of loans not classified as non-accrual, 90 days past due or restructured where known information regarding possible credit problems caused us to have serious concerns about the borrower’s ability to comply with present loan repayment terms thereby resulting in a change of classification to non-accrual, 90 days past due or restructured.
As of December 31, 2015, we had $79.9 million of loans which, although performing at that date, required increased supervision and review. They may, depending on the economic environment and other factors, become nonperforming assets in future periods. The amount of such loans at December 31, 2014 was $67.4 million. The majority of these loans are secured by commercial real estate, with others being secured by residential real estate, inventory and receivables.
Allowance for Loan Losses
We maintain an allowance for loan losses and charge losses to this allowance when such losses are realized. We established our loan loss allowance in accordance with guidance provided in the Securities and Exchange Commission’s Staff Accounting Bulletin 102 (SAB 102). and FASB ASC 450, Contingencies (ASC 450). When we have reason to believe it is probable that we will not be able to collect all contractually due amounts of principal and interest, loans are evaluated for impairment on an individual basis and a specific allocation of the allowance is assigned in accordance with ASC 310-10. We also maintain an allowance for loan losses on acquired loans when: (i) there is deterioration in credit quality subsequent to acquisition for loans accounted for under ASC 310-30, and, (ii) for loans accounted for under ASC 310-20 the inherent losses in the loans exceed the remaining credit discount recorded at the time of acquisition. The determination of the allowance for loan losses requires significant judgment reflecting our best estimate of impairment related to specifically identified impaired loans as well as probable loan losses in the remaining loan portfolio. Our evaluation is based upon a continuing review of these portfolios. For additional information regarding the allowance for loan losses, see Note 6 to the Consolidated Financial Statements.
The allowance for loan losses of $37.1 million at December 31, 2015 decreased $2.3 million from $39.4 million at December 31, 2014 and decreased from $41.2 million at December 31, 2013. The allowance for loan losses to total gross loans ratio was 0.98% at December 31, 2015, compared to 1.23% at December 31, 2014 and 1.40% at December 31, 2013. The following points reflect the status of key credit quality metrics and the impact of acquired loans:
| • | Total problem loans (all criticized, classified, and non-performing loans) were 24.1% of Tier 1 Capital plus allowance for loan losses at December 31, 2015, compared to 26.2% at December 31, 2014 and 33.6% at December 31, 2013. |
| • | Nonperforming loans decreased to $21.2 million as of December 31, 2015 from $24.1 million as of December 31, 2014 and from $31.0 million as of December 31, 2013. |
49
Table of Contents
| • | Loans acquired with the Alliance acquisition were recorded at fair value. As a result, loans increased with no corresponding increase in the allowance. This served to lower the allowance for the loan losses to total gross loans. Excluding acquired loans, our allowance for loan losses to total gross loans was 1.11%. |
| • | Total loan delinquency increased to $43.7 million and was 1.17% of total loans as of December 31, 2015, compared to $17.5 million and 0.55% of total loans as of December 31, 2014 and $22.4 million and 0.76% of total loans as of December 31, 2013. |
| • | Net charge-offs were $10.1 million for the twelve months ended December 31, 2015 compared to $5.4 million for the twelve months ended December 31, 2014 and $9.9 million for the twelve months ended December 31, 2013. |
The table below represents a summary of changes in the allowance for loan losses during the periods indicated:
| (In Thousands) | ||||||||||||||||||||
| Year Ended December 31, |
2015 | 2014 | 2013 | 2012 | 2011 | |||||||||||||||
| Beginning balance |
$ | 39,426 | $ | 41,244 | $ | 43,922 | $ | 53,080 | $ | 60,339 | ||||||||||
| Provision for loan losses |
7,790 | 3,580 | 7,172 | 32,053 | 27,996 | |||||||||||||||
| Charge-offs: |
||||||||||||||||||||
| Commercial Mortgage |
1,135 | 425 | 1,915 | 6,517 | 7,446 | |||||||||||||||
| Construction |
146 | 88 | 1,749 | 10,820 | 11,602 | |||||||||||||||
| Commercial |
6,303 | 3,587 | 2,636 | 12,806 | 9,419 | |||||||||||||||
| Owner-occupied Commercial (1) |
738 | 1,085 | 1,225 | 5,076 | — | |||||||||||||||
| Residential real estate |
548 | 811 | 1,226 | 3,857 | 3,165 | |||||||||||||||
| Consumer |
2,555 | 1,982 | 3,905 | 5,613 | 5,332 | |||||||||||||||
| Overdrafts |
670 | 873 | 1,008 | 1,113 | 869 | |||||||||||||||
|
|
|
|
|
|
|
|
|
|
|
|||||||||||
| Total charge-offs (2) |
12,095 | 8,851 | 13,664 | 45,802 | 37,833 | |||||||||||||||
|
|
|
|
|
|
|
|
|
|
|
|||||||||||
| Recoveries: |
||||||||||||||||||||
| Commercial Mortgage |
222 | 202 | 685 | 405 | 334 | |||||||||||||||
| Construction |
185 | 242 | 989 | 1,761 | 582 | |||||||||||||||
| Commercial |
301 | 1,611 | 1,003 | 1,536 | 897 | |||||||||||||||
| Owner-occupied Commercial (1) |
77 | 249 | 128 | 13 | — | |||||||||||||||
| Residential real estate |
226 | 168 | 122 | 176 | 211 | |||||||||||||||
| Consumer |
680 | 528 | 483 | 337 | 206 | |||||||||||||||
| Overdrafts |
277 | 453 | 404 | 363 | 348 | |||||||||||||||
|
|
|
|
|
|
|
|
|
|
|
|||||||||||
| Total recoveries |
1,968 | 3,453 | 3,814 | 4,591 | 2,578 | |||||||||||||||
|
|
|
|
|
|
|
|
|
|
|
|||||||||||
| Net charge-offs |
10,127 | 5,398 | 9,850 | 41,211 | 35,255 | |||||||||||||||
|
|
|
|
|
|
|
|
|
|
|
|||||||||||
| Ending balance |
$ | 37,089 | $ | 39,426 | $ | 41,244 | $ | 43,922 | $ | 53,080 | ||||||||||
|
|
|
|
|
|
|
|
|
|
|
|||||||||||
| Net charge-offs to average gross loans outstanding, net of unearned income |
0.29 | % | 0.18 | % | 0.33 | % | 1.49 | % | 1.32 | % | ||||||||||
|
|
|
|
|
|
|
|
|
|
|
|||||||||||
| (1) | Prior to 2012, owner-occupied loans were included in commercial loan balances. |
| (2) | Total Charge-Offs for 2012 include $16.4 million related to our Asset Strategies completed during 2012. |
50
Table of Contents
The allowance for loan losses is allocated by major portfolio type. As these portfolios have seasoned, they have become a source of historical data in projecting delinquencies and loss exposure. However, such allocations are not a guarantee of when future losses may occur and/or the actual amount of losses. While we have allocated the allowance for loan losses by portfolio type in the following table, the entire reserve is available for any loan category to utilize. The allocation of the allowance for loan losses by portfolio type at the end of each of the last five years and the percentage of outstanding loans in each category to total gross loans outstanding at such dates is shown in the table below:
| At December 31, | ||||||||||||||||||||||||||||||||||||||||
| 2015 | 2014 | 2013 | 2012 | 2011 | ||||||||||||||||||||||||||||||||||||
| (In Thousands) | Amount | Percent | Amount | Percent | Amount | Percent | Amount | Percent | Amount | Percent | ||||||||||||||||||||||||||||||
| Commercial mortgage |
$ | 6,487 | 0.17 | $ | 7,266 | 0.23 | % | $ | 6,932 | 0.24 | % | $ | 8,079 | 0.29 | % | $ | 7,556 | 0.27 | % | |||||||||||||||||||||
| Construction |
3,521 | 0.09 | 2,596 | 0.08 | 3,326 | 0.11 | 6,456 | 0.24 | 4,074 | 0.15 | ||||||||||||||||||||||||||||||
| Commercial |
11,156 | 0.30 | 12,837 | 0.40 | 12,751 | 0.43 | 13,663 | 0.49 | 24,302 | 0.88 | ||||||||||||||||||||||||||||||
| Owner-Occupied Commercial (1) |
6,670 | 0.18 | 6,643 | 0.20 | 7,638 | 0.26 | 6,108 | 0.22 | — | — | ||||||||||||||||||||||||||||||
| Residential real estate |
2,281 | 0.06 | 2,523 | 0.08 | 3,078 | 0.10 | 3,124 | 0.11 | 6,544 | 0.24 | ||||||||||||||||||||||||||||||
| Consumer |
5,964 | 0.16 | 6,041 | 0.19 | 6,494 | 0.22 | 5,631 | 0.20 | 10,604 | 0.38 | ||||||||||||||||||||||||||||||
| Complexity Risk |
1,010 | 0.03 | 1,520 | 0.05 | 1,025 | 0.04 | 861 | 0.03 | — | — | ||||||||||||||||||||||||||||||
|
|
|
|
|
|
|
|
|
|
|
|
|
|
|
|
|
|
|
|
|
|||||||||||||||||||||
| Total |
$ | 37,089 | 0.99 | % | $ | 39,426 | 1.23 | % | $ | 41,244 | 1.40 | % | $ | 43,922 | 1.58 | % | $ | 53,080 | 1.92 | % | ||||||||||||||||||||
|
|
|
|
|
|
|
|
|
|
|
|
|
|
|
|
|
|
|
|
|
|||||||||||||||||||||
| (1) | Prior to 2012, owner-occupied commercial loans were included in commercial loan balances. |
CAPITAL RESOURCES
Under new guidelines issued by banking regulators to reflect the requirements of the Dodd-Frank Act and the Basel III international capital standards, beginning January 1, 2015, savings institutions such as WSFS Bank must maintain a minimum ratio of common equity Tier 1 capital to risk-weighted assets of 4.5%, a minimum ratio of Tier 1 capital to risk-weighted assets of 6.0%, a minimum ratio of total capital to risk-weighted assets of 8.0%, and a minimum Tier 1 leverage ratio of 4.0%. Failure to meet minimum capital requirements can initiate certain mandatory actions and possibly additional discretionary actions by regulators that, if undertaken, could have a direct material effect on our financial statements.
Regulators have established five capital tiers: well-capitalized, adequately-capitalized, under-capitalized, significantly under-capitalized, and critically under-capitalized. A depository institution’s capital tier depends upon its capital levels in relation to various relevant capital measures, which include leveraged and risk-based capital measures and certain other factors. Depository institutions that are not classified as well-capitalized are subject to various restrictions regarding capital distributions, payment of management fees, acceptance of brokered deposits and other operating activities. Under the Prompt Corrective Action framework of the Federal Deposit Insurance Corporation Act, institutions that are not classified as well-capitalized are subject to various restrictions regarding capital distributions, payment of management fees, acceptance of brokered deposits and other operating activities.
At December 31, 2015, WSFS Bank was in compliance with regulatory capital requirements and all of its regulatory ratios exceeded “well-capitalized” regulatory benchmarks. WSFS Bank’s December 31, 2015 common equity Tier 1 capital ratio of 12.31%, Tier 1 capital ratio of 12.31%, total capital ratio of 13.11% and Tier 1 leverage capital ratio of 10.88%, all remain substantially in excess of “well-capitalized” regulatory benchmarks, the highest regulatory capital rating. In addition, and not included in Bank capital, the holding company held $24.4 million in cash to support potential dividends, acquisitions and strategic growth plans.
The revised capital rules also establishes a new capital conservation buffer, comprised of common equity Tier 1 capital, above the regulatory minimum capital requirements. This capital conservation buffer will be phased in beginning January 1, 2016 at 0.625% of risk-weighted assets and increase each subsequent year by an additional 0.625% until reaching its final level of 2.5% on January 1, 2019. The revised capital rules also increase the risk-based measures for a savings institution to be considered “well capitalized” under the Prompt Corrective Action framework.
Since 1996, the Board of Directors has approved several stock repurchase programs to acquire common stock outstanding. In 2015 we repurchased 1,152,233 shares of common stock and in 2014 we repurchased 105,564 shares of
51
Table of Contents
common stock and acquired 243,699 common share equivalents. We held 26.2 million shares and 27.5 million shares of our common stock as treasury shares at December 31, 2015 and 2014, respectively. At December 31, 2015, we had 1,400,565 shares remaining under our current share repurchase authorization.
In 2009 we completed a private placement of stock to Peninsula Investment Partners, L.P. (Peninsula), pursuant to which the Company issued and sold 2,586,207 shares of common stock for a total purchase price of $25.0 million, and a 10-year warrant to purchase 387,930 shares of common stock at an exercise price of $9.67 per share. The warrant was immediately exercisable. Total proceeds of $25.0 million were allocated, based on the relative fair value of common stock and common stock warrants, to common stock for $23.5 million and common stock warrants for $1.5 million. During 2014, we entered into an agreement in which the Company repurchased the warrants for $6.3 million. We redeemed the preferred stock in 2013.
All share and per share information has been retroactively adjusted to reflect the Company’s three-for-one stock split in May 2015. See Note 1 of the Consolidated Financial Statements for additional information.
OFF BALANCE SHEET ARRANGEMENTS
We have no off balance sheet arrangements that have or are reasonably likely to have a material current or future effect on our financial condition, changes in financial condition, revenues or expenses, results of operations, liquidity, capital expenditures or capital resources. For a description of certain financial instruments to which we are party which expose us to certain credit risk not recognized in our financial statements, see Note 17 to the Consolidated Financial Statements included in this report.
CONTRACTUAL OBLIGATIONS
At December 31, 2015, we had contractual obligations relating to operating leases, long-term debt, data processing and credit obligations. These obligations are summarized below. See Notes 8, 11 and 17 to the Consolidated Financial Statements for further discussion.
| (In Thousands) | Total | Less than One Year |
One to Three Years |
Three to Five Years |
Over 5 Years |
|||||||||||||||
| Operating lease obligations |
$ | 203,021 | $ | 9,178 | $ | 17,902 | $ | 17,891 | $ | 158,050 | ||||||||||
| Long-term debt obligations |
669,514 | 597,400 | 72,114 | — | — | |||||||||||||||
| Data processing contracts |
19,294 | 4,962 | 7,474 | 6,858 | — | |||||||||||||||
| Credit obligations |
959,621 | 959,621 | — | — | — | |||||||||||||||
|
|
|
|
|
|
|
|
|
|
|
|||||||||||
| Total |
$ | 1,851,450 | $ | 1,571,161 | $ | 97,490 | $ | 24,749 | $ | 158,050 | ||||||||||
|
|
|
|
|
|
|
|
|
|
|
|||||||||||
IMPACT OF INFLATION AND CHANGING PRICES
Our Consolidated Financial Statements have been prepared in accordance with GAAP, which require the measurement of financial position and operating results in terms of historical dollars without consideration of the changes in the relative purchasing power of money over time due to inflation. The impact of inflation is reflected in the increased costs of our operations. Unlike most industrial companies, nearly all of our assets and liabilities are monetary. As a result, interest rates have a greater impact on our performance than do the effects of general levels of inflation. Interest rates do not necessarily move in the same direction or the same extent as the price of goods and services.
CRITICAL ACCOUNTING POLICIES
The discussion and analysis of the financial condition and results of operations are based on the Consolidated Financial Statements, which are prepared in conformity with GAAP. The preparation of these Consolidated Financial Statements requires us to make estimates and assumptions affecting the reported amounts of assets, liabilities, revenue and expenses. We regularly evaluate these estimates and assumptions including those related to the allowance for loan losses,
52
Table of Contents
deferred taxes, fair value measurements, other-than-temporary impairment, goodwill and other intangible assets. We base our estimates on historical experience and various other factors and assumptions that are believed to be reasonable under the circumstances. These form the basis for making judgments on the carrying value of assets and liabilities that are not readily apparent from other sources. Actual results may differ from these estimates under different assumptions or conditions.
The following are critical accounting policies that involve more significant judgments and estimates. For additional information on these policies, see Note 1 to the Consolidated Financial Statements.
Allowance for Loan Losses
We maintained an allowance for loan losses (allowance) and charged losses to this allowance when such losses were realized. We established our allowance for loan losses in accordance with guidance provided in the SEC’s Staff Accounting Bulletin 102 (SAB 102) and FASB ASC 450, Contingencies (ASC 450). When we have reason to believe it is probable that it will not be able to collect all contractually due amounts of principal and interest loans are evaluated for impairment on an individual basis and a specific allocation of the allowance is assigned in accordance with ASC 310-10. We also maintained an allowance for loan losses on acquired loans when: (i) there was deterioration in credit quality subsequent to acquisition for loans accounted for under ASC 310-30, and (ii) the inherent losses in the loans exceed the remaining credit discount recorded at the time of acquisition for loans accounted for under ASC 310-20. We consider the determination of the allowance for loan losses to be critical because it requires significant judgment reflecting our best estimate of impairment related to specifically evaluated impaired loans as well as the inherent risk of loss for those in the remaining loan portfolio. Our evaluation is based upon a continuing review of the portfolio, with consideration given to evaluations resulting from examinations performed by regulatory authorities.
Investment in Reverse Mortgages
We account for our investment in reverse mortgages in accordance with the instructions provided by the staff of the Securities and Exchange Commission entitled “Accounting for Pools of Uninsured Residential Reverse Mortgage Contracts” which requires grouping the individual reverse mortgages into “pools” and recognizing income based on the estimated effective yield of the pool. We consider our accounting policies on our investment in reverse mortgages to be critical because when computing the effective yield we must project the cash inflows and outflows of the pool including actuarial projections of the life expectancy of the individual contract holder and changes in the collateral values of the residence. At each reporting date, a new economic forecast is made of the cash inflows and outflows of each pool of reverse mortgages; the effective yield of each pool is recomputed, and income is adjusted retroactively and prospectively to reflect the revised rate of return. Accordingly, because of this market-value based accounting the recorded value of reverse mortgage assets include significant risk associated with estimations and income recognition can vary significantly from reporting period to reporting period.
Deferred Taxes
We account for income taxes in accordance with Financial Accounting Standards Board (FASB) Accounting Standards Codification 740, Income Taxes (ASC 740), which requires the recording of deferred income taxes that reflect the net tax effects of temporary differences between the carrying amounts of assets and liabilities for financial reporting purposes and the amounts used for income tax purposes. We consider our accounting policies on deferred taxes to be critical because we regularly assess the need for valuation allowances on deferred income tax assets that may result from, among other things, limitations imposed by Internal Revenue Code and uncertainties, including the timing of settlement and realization of these differences. A valuation allowance was not required as of December 31, 2015. See Note 15, Taxes on Income to the Consolidated Financial Statements, for further discussion of the valuation allowance.
Fair Value Measurements
We adopted FASB ASC 820-10 Fair Value Measurements and Disclosures (ASC 820), which defines fair value, establishes a framework for measuring fair value under GAAP, and expands disclosures about fair value measurements.
53
Table of Contents
We consider our accounting policies related to fair value measurements to be critical because they are important to the portrayal of our financial condition and results, and they require our subjective and complex judgment as a result of the need to make estimates about the effects of matters that are inherently uncertain. See Note 18, Fair Value Disclosures to our Consolidated Financial Statements.
Goodwill and Other Intangible Assets
We account for goodwill and other intangible assets in accordance with FASB ASC 805, Business Combinations (ASC 805) and FASB ASC 350, Intangibles-Goodwill and Other (ASC 350). Intangible assets resulting from acquisitions under the purchase method of accounting consist of goodwill and other intangible assets. We consider our accounting policies on goodwill and other intangible assets to be critical because they require the Company to make significant judgments, particularly with respect to estimating the fair value of each reporting unit and when required, estimating the fair value of net assets. The estimates utilize historical data, cash flows, and market and industry data specific to each reporting unit as well as projected data. Industry and market data are used to develop material assumptions such as transaction multiples, required rates of return, control premiums, transaction costs and synergies of a transaction, and capitalization.
Goodwill is not amortized and is subject to at least annual assessments for impairment by applying a fair value based test. We review goodwill annually and again at any quarter-end if a material event occurs during the quarter that may affect goodwill. This review evaluates potential impairment by determining if our fair value has fallen below carrying value.
Other intangible assets consist mainly of core deposits and covenants not to compete obtained through acquisitions and are amortized over their estimated lives using the present value of the benefit of the core deposits and straight-line methods of amortization. Core deposit intangibles are evaluated for impairment when events or changes in circumstances indicate that the carrying amount may not be recoverable. See Notes 1 and 9 to our Consolidated Financial Statements for further discussion on Goodwill and Other Intangible Assets.
Recent Accounting Pronouncements
For information on Recent Accounting Pronouncements see Note 1 to our Consolidated Financial Statements
ITEM 7A. QUANTITATIVE AND QUALITATIVE DISCLOSURES ABOUT MARKET RISK
The matching of maturities or repricing periods of interest rate-sensitive assets and liabilities to promote a favorable interest rate spread and mitigate exposure to fluctuations in interest rates is our primary tool for achieving our asset/liability management strategies. We regularly review our interest-rate sensitivity and adjust the sensitivity within our acceptable tolerance ranges. At December 31, 2015 interest-earning assets exceeded interest-bearing liabilities that mature or reprice within one year (interest-sensitive gap) by approximately $109.2 million. Our interest-sensitive assets as a percentage of interest-sensitive liabilities within one-year increased from 101.2% at December 31, 2014 to 103.9% at December 31, 2015. Likewise, the one-year interest-sensitive gap as a percentage of total assets changed to 1.96% at December 31, 2015 from 0.63% at December 31, 2014. The change in sensitivity since December 31, 2014 was the result of the current interest rate environment and our continuing effort to effectively manage interest rate risk.
54
Table of Contents
Market risk is the risk of loss from adverse changes in market prices and rates. Our market risk arises primarily from interest rate risk inherent in our lending, investing and funding activities. To that end, we actively monitor and manage our interest rate risk exposure. The following table is the estimated impact of immediate changes in interest rates on our net interest margin and economic value of equity at the specified levels at December 31, 2015 and December 31, 2014.
| Change in Interest Rate (Basis Points) |
December 31, 2015 |
December 31, 2014 | ||||||
| % Change in Net Interest |
Economic Value of Equity (2) |
% Change in Net Interest |
Economic Value of Equity (2) | |||||
| 300 |
6% | 13.96% | 4% | 13.76% | ||||
| 200 |
3% | 13.99% | 2% | 13.81% | ||||
| 100 |
— % | 13.81% | -1% | 13.59% | ||||
|
— |
— % | 13.56% | — % | 13.37% | ||||
| -100 |
-1% | 12.72% | -2% | 12.51% | ||||
| -200(3) |
NMF | NMF | NMF | NMF | ||||
| -300(3) |
NMF | NMF | NMF | NMF | ||||
| (1) | The percentage difference between net interest income in a stable interest rate environment and net interest margin as projected under the various rate change environments. |
| (2) | The economic value of equity ratio in a stable interest rate environment and the economic value of equity projected under the various rate change environments. |
| (3) | Sensitivity indicated by a decrease of 200 and 300 basis points is deemed not meaningful (NMF) given the low absolute level of interest rates at that time. |
Our primary objective in managing interest rate risk is to minimize the adverse impact of changes in interest rates on net interest income and capital, while maximizing the yield/cost spread on our asset/liability structure. We rely primarily on our asset/liability structure to control interest rate risk.
We also engage in other business activities that are sensitive to changes in interest rates. For example, mortgage banking revenues and expenses can fluctuate with changing interest rates. These fluctuations are difficult to model and estimate.
55
Table of Contents
ITEM 8. FINANCIAL STATEMENTS AND SUPPLEMENTARY DATA
Report of Independent Registered Public Accounting Firm
The Board of Directors and Stockholders
WSFS Financial Corporation:
We have audited the accompanying consolidated statements of condition of WSFS Financial Corporation and subsidiaries as of December 31, 2015 and 2014, and the related consolidated statements of operations, comprehensive income, changes in stockholders’ equity, and cash flows for each of the years in the three-year period ended December 31, 2015. These consolidated financial statements are the responsibility of the Company’s management. Our responsibility is to express an opinion on these consolidated financial statements based on our audits.
We conducted our audits in accordance with the standards of the Public Company Accounting Oversight Board (United States). Those standards require that we plan and perform the audit to obtain reasonable assurance about whether the financial statements are free of material misstatement. An audit includes examining, on a test basis, evidence supporting the amounts and disclosures in the financial statements. An audit also includes assessing the accounting principles used and significant estimates made by management, as well as evaluating the overall financial statement presentation. We believe that our audits provide a reasonable basis for our opinion.
In our opinion, the consolidated financial statements referred to above present fairly, in all material respects, the financial position of WSFS Financial Corporation and subsidiaries as of December 31, 2015 and 2014, and the results of their operations and their cash flows for each of the years in the three-year period ended December 31, 2015, in conformity with U.S. generally accepted accounting principles.
We also have audited, in accordance with the standards of the Public Company Accounting Oversight Board (United States), WSFS Financial Corporation and subsidiaries’ internal control over financial reporting as of December 31, 2015, based on criteria established in Internal Control — Integrated Framework (2013) issued by the Committee of Sponsoring Organizations of the Treadway Commission (COSO), and our report dated February 29, 2016 expressed an unqualified opinion on the effectiveness of the Company’s internal control over financial reporting.
/s/ KPMG LLP
Philadelphia, Pennsylvania
February 29, 2016
56
Table of Contents
CONSOLIDATED STATEMENTS OF OPERATIONS
| Year Ended December 31, |
2015 | 2014 | 2013 | |||||||||
| (Dollars in Thousands, Except per Share Data) | ||||||||||||
| Interest Income |
||||||||||||
| Interest and fees on loans |
$ | 157,220 | $ | 137,048 | $ | 129,138 | ||||||
| Interest on mortgage-backed securities |
14,173 | 13,511 | 12,834 | |||||||||
| Interest and dividends on investment securities |
||||||||||||
| Taxable |
241 | 238 | 315 | |||||||||
| Tax-exempt |
3,431 | 3,047 | 1,377 | |||||||||
| Interest on reverse mortgage related assets |
5,299 | 5,129 | 2,867 | |||||||||
| Other interest income |
2,212 | 1,364 | 391 | |||||||||
|
|
|
|
|
|
|
|||||||
| 182,576 | 160,337 | 146,922 | ||||||||||
|
|
|
|
|
|
|
|||||||
| Interest Expense |
||||||||||||
| Interest on deposits |
7,165 | 7,151 | 7,180 | |||||||||
| Interest on Federal Home Loan Bank advances |
3,008 | 2,427 | 1,874 | |||||||||
| Interest on federal funds purchased and securities sold under agreements to repurchase |
360 | 1,051 | 994 | |||||||||
| Interest on trust preferred borrowings |
1,362 | 1,321 | 1,342 | |||||||||
| Interest on bonds payable |
— | 15 | 60 | |||||||||
| Interest on senior debt |
3,766 | 3,766 | 3,771 | |||||||||
| Interest on other borrowings |
115 | 99 | 113 | |||||||||
|
|
|
|
|
|
|
|||||||
| 15,776 | 15,830 | 15,334 | ||||||||||
|
|
|
|
|
|
|
|||||||
| Net interest income |
166,800 | 144,507 | 131,588 | |||||||||
| Provision for loan losses |
7,790 | 3,580 | 7,172 | |||||||||
|
|
|
|
|
|
|
|||||||
| Net interest income after provision for loan losses |
159,010 | 140,927 | 124,416 | |||||||||
|
|
|
|
|
|
|
|||||||
| Noninterest Income |
||||||||||||
| Credit/debit card and ATM income |
25,702 | 24,129 | 24,350 | |||||||||
| Deposit service charges |
16,684 | 17,071 | 17,208 | |||||||||
| Wealth management income |
21,884 | 17,364 | 15,528 | |||||||||
| Mortgage banking activities, net |
5,896 | 3,994 | 3,980 | |||||||||
| Reverse mortgage consolidation gain |
— | — | 3,801 | |||||||||
| Security gains, net |
1,478 | 1,037 | 3,516 | |||||||||
| Loan fee income |
1,834 | 1,921 | 1,959 | |||||||||
| Bank owned life insurance income |
776 | 700 | 270 | |||||||||
| Other income |
14,001 | 12,062 | 9,539 | |||||||||
|
|
|
|
|
|
|
|||||||
| 88,255 | 78,278 | 80,151 | ||||||||||
|
|
|
|
|
|
|
|||||||
| Noninterest Expense |
||||||||||||
| Salaries, benefits and other compensation |
83,908 | 76,387 | 70,866 | |||||||||
| Occupancy expense |
15,121 | 14,192 | 13,486 | |||||||||
| Equipment expense |
8,448 | 7,705 | 8,322 | |||||||||
| Data processing and operations expenses |
5,949 | 6,105 | 5,924 | |||||||||
| Professional fees |
7,737 | 6,797 | 4,016 | |||||||||
| FDIC expenses |
2,853 | 2,653 | 3,492 | |||||||||
| Loan workout and OREO expenses |
1,108 | 2,542 | 2,536 | |||||||||
| Marketing expense |
3,002 | 2,403 | 2,428 | |||||||||
| Corporate development costs |
7,620 | 4,031 | 717 | |||||||||
| Early extinguishment of debt costs |
651 | — | — | |||||||||
| Other operating expense |
27,062 | 23,830 | 19,968 | |||||||||
|
|
|
|
|
|
|
|||||||
| 163,459 | 146,645 | 131,755 | ||||||||||
|
|
|
|
|
|
|
|||||||
| Income before taxes |
83,806 | 72,560 | 72,812 | |||||||||
| Income tax provision |
30,273 | 18,803 | 25,930 | |||||||||
|
|
|
|
|
|
|
|||||||
| Net Income |
53,533 | 53,757 | 46,882 | |||||||||
| Dividends on preferred stock and accretion of discount |
— | — | 1,633 | |||||||||
|
|
|
|
|
|
|
|||||||
| Net income allocable to common stockholders |
$ | 53,533 | $ | 53,757 | $ | 45,249 | ||||||
|
|
|
|
|
|
|
|||||||
| Basic |
$ | 1.88 | $ | 1.98 | $ | 1.71 | ||||||
| Diluted |
$ | 1.85 | $ | 1.93 | $ | 1.69 | ||||||
The accompanying notes are an integral part of these Consolidated Financial Statements.
57
Table of Contents
CONSOLIDATED STATEMENTS OF COMPREHENSIVE INCOME
| 2015 | 2014 | 2013 | ||||||||||
| Net Income |
$ | 53,533 | $ | 53,757 | $ | 46,882 | ||||||
| Other comprehensive income: |
||||||||||||
| Net change in unrealized (losses) gains on investment securities available-for-sale |
||||||||||||
| Net unrealized (losses) gains arising during the period, net of tax (benefit) expense of ($868), $14,781, and ($19,478), respectively (1) |
(1,417 | ) | 24,118 | (32,057 | ) | |||||||
| Less: reclassification adjustment for net gains on sales realized in net income, net of tax expense of $562, $393, and $1,336, respectively |
(916 | ) | (643 | ) | (2,180 | ) | ||||||
|
|
|
|
|
|
|
|||||||
| Net change in securities held-to-maturity |
(2,333 | ) | 23,475 | (34,237 | ) | |||||||
| Amortization of unrealized gain on securities reclassified to held-to-maturity, net of tax (benefit) of $234, $0, and $0, respectively |
(412 | ) | — | — | ||||||||
|
|
|
|
|
|
|
|||||||
| Net change in unfunded pension liability |
(412 | ) | — | — | ||||||||
| Change in unfunded pension liability related to unrealized (loss) gain, prior service cost and transition obligation, net of tax (benefit) expense of ($37), $808, and $0, respectively |
(59 | ) | 1,319 | — | ||||||||
|
|
|
|
|
|
|
|||||||
| Total other comprehensive (loss) income |
(2,804 | ) | 24,794 | (34,237 | ) | |||||||
|
|
|
|
|
|
|
|||||||
| Total comprehensive income |
$ | 50,729 | $ | 78,551 | $ | 12,645 | ||||||
|
|
|
|
|
|
|
|||||||
| (1) | 2014 includes $3.6 million (net of tax expense of $2.2 million) of other comprehensive income related to the transfer of available-for-sale securities to held-to-maturity. |
The accompanying notes are an integral part of these Consolidated Financial Statements
58
Table of Contents
CONSOLIDATED STATEMENTS OF CONDITION
| Year Ended December 31, |
2015 | 2014 | ||||||
| (Dollars in Thousands, Except Per Share Data) | ||||||||
| Assets: |
||||||||
| Cash and due from banks |
$ | 83,065 | $ | 93,717 | ||||
| Cash in non-owned ATMs |
477,924 | 414,188 | ||||||
| Interest-bearing deposits in other banks |
190 | 134 | ||||||
|
|
|
|
|
|||||
| Total cash and cash equivalents |
561,179 | 508,039 | ||||||
| Investment securities, available-for-sale (book value $724,072 and $739,404 for 2015 and 2014, respectively) |
721,029 | 740,124 | ||||||
| Investment securities, held-to-maturity (fair value $167,743 and $126,171 for 2015 and 2014, respectively) |
165,862 | 126,168 | ||||||
| Loans held-for-sale at fair value |
41,807 | 28,508 | ||||||
| Loans, net of allowance for loan losses of $37,089 at December 31, 2015 and $39,426 at December 31, 2014 |
3,729,050 | 3,156,652 | ||||||
| Reverse mortgage related assets |
24,284 | 29,298 | ||||||
| Bank-owned life insurance |
90,208 | 76,509 | ||||||
| Stock in Federal Home Loan Bank of Pittsburgh, at cost |
30,519 | 23,278 | ||||||
| Assets acquired through foreclosure |
5,080 | 5,734 | ||||||
| Accrued interest receivable |
14,040 | 11,782 | ||||||
| Premises and equipment |
39,569 | 35,074 | ||||||
| Goodwill |
85,212 | 48,651 | ||||||
| Intangible assets |
10,083 | 8,942 | ||||||
| Other assets |
68,040 | 54,561 | ||||||
|
|
|
|
|
|||||
| Total assets |
$ | 5,585,962 | $ | 4,853,320 | ||||
|
|
|
|
|
|||||
| Liabilities and Stockholders’ Equity |
||||||||
| Liabilities: |
||||||||
| Deposits: |
||||||||
| Noninterest-bearing demand |
$ | 958,238 | $ | 804,678 | ||||
| Interest-bearing demand |
784,619 | 688,370 | ||||||
| Money market |
1,090,050 | 1,066,224 | ||||||
| Savings |
439,918 | 402,032 | ||||||
| Time |
333,000 | 253,302 | ||||||
| Jumbo certificates of deposit — customer |
254,011 | 247,671 | ||||||
|
|
|
|
|
|||||
| Total customer deposits |
3,859,836 | 3,462,277 | ||||||
| Brokered deposits |
156,730 | 186,958 | ||||||
|
|
|
|
|
|||||
| Total deposits |
4,016,566 | 3,649,235 | ||||||
| Federal funds purchased and securities sold under agreements to repurchase |
128,200 | 128,225 | ||||||
| Federal Home Loan Bank advances |
669,514 | 405,894 | ||||||
| Trust preferred borrowings |
67,011 | 67,011 | ||||||
| Senior debt |
55,000 | 55,000 | ||||||
| Other borrowed funds |
14,486 | 11,645 | ||||||
| Accrued interest payable |
801 | 1,004 | ||||||
| Other liabilities |
53,913 | 46,255 | ||||||
|
|
|
|
|
|||||
| Total liabilities |
5,005,491 | 4,364,269 | ||||||
|
|
|
|
|
|||||
| Stockholders’ Equity: |
||||||||
| Common stock $0.01 par value, 65,000,000 shares authorized; issued 55,945,245 at December 31, 2015 and 55,697,124 at December 31, 2014 |
560 | 557 | ||||||
| Capital in excess of par value |
256,435 | 201,130 | ||||||
| Accumulated other comprehensive income |
696 | 3,500 | ||||||
| Retained earnings |
570,630 | 523,099 | ||||||
| Treasury stock at cost, 26,182,401 shares at December 31, 2015 and 27,489,288 shares at December 31, 2014 |
(247,850 | ) | (239,235 | ) | ||||
|
|
|
|
|
|||||
| Total stockholders’ equity |
580,471 | 489,051 | ||||||
|
|
|
|
|
|||||
| Total liabilities and stockholders’ equity |
$ | 5,585,962 | $ | 4,853,320 | ||||
|
|
|
|
|
|||||
The accompanying notes are an integral part of these Consolidated Financial Statements.
59
Table of Contents
CONSOLIDATED STATEMENT OF CHANGES IN STOCKHOLDERS’ EQUITY
| Serial Preferred Stock |
Common Stock |
Capital in Excess of Par Value |
Accumulated Other Comprehensive (Loss) Income |
Retained Earnings |
Treasury Stock |
Total Stockholders’ Equity |
||||||||||||||||||||||
| (In Thousands, except per share amounts) |
||||||||||||||||||||||||||||
| Balance, December 31, 2012 |
$ | 1 | $ | 555 | $ | 222,607 | $ | 12,943 | $ | 433,228 | $ | (248,280 | ) | $ | 421,054 | |||||||||||||
| Net income |
— | — | — | — | 46,882 | — | 46,882 | |||||||||||||||||||||
| Other comprehensive loss |
— | — | — | (34,237 | ) | — | — | (34,237 | ) | |||||||||||||||||||
| Cash dividend, $0.16 per share |
— | — | — | — | (4,224 | ) | — | (4,224 | ) | |||||||||||||||||||
| Issuance of common stock including proceeds from exercise of common stock options |
— | 1 | 4,352 | — | — | — | 4,353 | |||||||||||||||||||||
| Stock-based compensation expense |
— | — | 2,938 | — | — | — | 2,938 | |||||||||||||||||||||
| Excess tax benefit from exercises of common stock options (1) |
— | — | 683 | — | — | — | 683 | |||||||||||||||||||||
| Preferred stock cash dividends |
— | — | — | — | (1,774 | ) | — | (1,774 | ) | |||||||||||||||||||
| Preferred stock discount accretion |
— | — | 150 | — | (150 | ) | — | — | ||||||||||||||||||||
| Redemption of preferred stock |
(1 | ) | — | (52,624 | ) | — | — | — | (52,625 | ) | ||||||||||||||||||
|
|
|
|
|
|
|
|
|
|
|
|
|
|
|
|||||||||||||||
| Balance, December 31, 2013 |
$ | — | $ | 556 | $ | 178,106 | $ | (21,294 | ) | $ | 473,962 | $ | (248,280 | ) | $ | 383,050 | ||||||||||||
|
|
|
|
|
|
|
|
|
|
|
|
|
|
|
|||||||||||||||
| Net income |
— | — | — | — | 53,757 | — | 53,757 | |||||||||||||||||||||
| Other comprehensive income |
— | — | — | 24,794 | — | — | 24,794 | |||||||||||||||||||||
| Cash dividend, $0.17 per share |
— | — | — | — | (4,620 | ) | — | (4,620 | ) | |||||||||||||||||||
| Issuance of common stock including proceeds from exercise of common stock options |
— | 1 | 3,612 | — | — | — | 3,613 | |||||||||||||||||||||
| Stock-based compensation expense |
— | — | 3,738 | — | — | — | 3,738 | |||||||||||||||||||||
| Excess tax benefit from exercises of common stock options (1) |
— | — | 797 | — | — | — | 797 | |||||||||||||||||||||
| Acquisition of FNBW |
— | — | 21,177 | — | — | 11,731 | 32,908 | |||||||||||||||||||||
| Repurchase of Warrant |
— | — | (6,300 | ) | — | — | — | (6,300 | ) | |||||||||||||||||||
| Repurchases of common stock, 105,564 shares |
— | — | — | — | — | (2,686 | ) | (2,686 | ) | |||||||||||||||||||
|
|
|
|
|
|
|
|
|
|
|
|
|
|
|
|||||||||||||||
| Balance, December 31, 2014 |
$ | — | $ | 557 | $ | 201,130 | $ | 3,500 | $ | 523,099 | $ | (239,235 | ) | $ | 489,051 | |||||||||||||
|
|
|
|
|
|
|
|
|
|
|
|
|
|
|
|||||||||||||||
| Net income |
— | — | — | — | 53,533 | — | 53,533 | |||||||||||||||||||||
| Other comprehensive loss |
— | — | — | (2,804 | ) | — | — | (2,804 | ) | |||||||||||||||||||
| Cash dividend, $0.21 per share |
— | — | — | — | (6,002 | ) | — | (6,002 | ) | |||||||||||||||||||
| Issuance of common stock including proceeds from exercise of common stock options |
— | 3 | 3,157 | — | — | — | 3,160 | |||||||||||||||||||||
| Stock-based compensation expense |
— | — | 2,957 | — | — | — | 2,957 | |||||||||||||||||||||
| Excess tax benefit from exercises of common stock options (1) |
— | — | 890 | — | — | — | 890 | |||||||||||||||||||||
| Acquisition of Alliance |
— | — | 48,301 | — | — | 23,044 | 71,345 | |||||||||||||||||||||
| Repurchase of common stock, 1,152,233 shares |
— | — | — | — | — | (31,659 | ) | (31,659 | ) | |||||||||||||||||||
|
|
|
|
|
|
|
|
|
|
|
|
|
|
|
|||||||||||||||
| Balance, December 31, 2015 |
$ | — | $ | 560 | $ | 256,435 | $ | 696 | $ | 570,630 | $ | (247,850 | ) | $ | 580,471 | |||||||||||||
|
|
|
|
|
|
|
|
|
|
|
|
|
|
|
|||||||||||||||
| (1) | Net of deferred tax adjustments for expired options. |
The accompanying notes are an integral part of these Consolidated Financial Statements
60
Table of Contents
CONSOLIDATED STATEMENT OF CASH FLOWS
| Year Ended December 31, |
2015 | 2014 | 2013 | |||||||||
| (In Thousands) | ||||||||||||
| Operating activities: |
||||||||||||
| Net income |
$ | 53,533 | $ | 53,757 | $ | 46,882 | ||||||
| Adjustments to reconcile net income to net cash provided by operating activities: |
||||||||||||
| Provision for loan losses |
7,790 | 3,580 | 7,172 | |||||||||
| Depreciation of premises and equipment |
6,333 | 5,951 | 6,007 | |||||||||
| Amortization of fees and discounts, net |
18,490 | 10,836 | 10,367 | |||||||||
| Amortization of intangible assets |
1,847 | 1,263 | 962 | |||||||||
| Increase in accrued interest receivable |
(1,334 | ) | (984 | ) | (1,146 | ) | ||||||
| Increase (decrease) in other assets |
(1,643 | ) | (1,455 | ) | 5,470 | |||||||
| Origination of loans held-for-sale |
(573,703 | ) | (230,841 | ) | (250,083 | ) | ||||||
| Proceeds from sales of loans held-for-sale |
563,588 | 235,908 | 254,135 | |||||||||
| Gain on mortgage banking activity, net |
(5,896 | ) | (3,994 | ) | (3,980 | ) | ||||||
| Gain on mark to market adjustment on trading securities |
— | — | 125 | |||||||||
| Gain on sale of securities, net |
(1,478 | ) | (1,037 | ) | (3,641 | ) | ||||||
| Reverse mortgage consolidation gain |
— | — | (3,801 | ) | ||||||||
| Stock-based compensation expense |
4,095 | 4,535 | 3,621 | |||||||||
| Excess tax benefits from share based payment arrangements |
(890 | ) | (797 | ) | (683 | ) | ||||||
| Decrease in accrued interest payable |
(203 | ) | (65 | ) | (261 | ) | ||||||
| Increase (decrease) in other liabilities |
6,502 | 2,054 | (12,465 | ) | ||||||||
| Loss on sale of assets acquired through foreclosure and valuation adjustments, net |
319 | 144 | 868 | |||||||||
| Increase in value of bank-owned life insurance |
(776 | ) | (700 | ) | (270 | ) | ||||||
| Deferred income tax expense (benefit) |
2,231 | (5,664 | ) | 755 | ||||||||
| Increase in capitalized interest, net |
(5,518 | ) | (5,435 | ) | (2,653 | ) | ||||||
|
|
|
|
|
|
|
|||||||
| Net cash provided by operating activities |
73,287 | 67,056 | 57,381 | |||||||||
|
|
|
|
|
|
|
|||||||
| Investing activities: |
||||||||||||
| Maturities and calls of investment securities |
5,551 | 4,572 | 770 | |||||||||
| Sales of investment securities available for sale |
192,933 | 229,515 | 274,070 | |||||||||
| Purchases of investment securities available for sale |
(277,963 | ) | (286,915 | ) | (335,584 | ) | ||||||
| Repayments of investment securities available for sale |
100,485 | 79,006 | 90,041 | |||||||||
| Purchases of investment securities held-to-maturity |
(48,184 | ) | (1,295 | ) | — | |||||||
| Repayments on reverse mortgages |
11,393 | 14,677 | 4,929 | |||||||||
| Disbursements for reverse mortgages |
(861 | ) | (1,212 | ) | (391 | ) | ||||||
| Cash received in consolidation of reverse mortgage securitization trust |
— | — | 5,833 | |||||||||
| Investment in non-marketable securities |
(3,589 | ) | — | — | ||||||||
| Net Cash for Business Combinations |
40,863 | 8,660 | (4,029 | ) | ||||||||
| Net increase in loans |
(285,694 | ) | (86,618 | ) | (207,043 | ) | ||||||
| Net (increase) decrease in stock of Federal Home Loan Bank of Pittsburgh |
(7,241 | ) | 12,591 | (4,704 | ) | |||||||
| Sales of assets acquired through foreclosure, net |
4,828 | 5,191 | 6,511 | |||||||||
| Investment in premises and equipment, net |
(8,362 | ) | (4,736 | ) | (2,863 | ) | ||||||
|
|
|
|
|
|
|
|||||||
| Net cash used for investing activities |
(275,841 | ) | (26,564 | ) | (172,460 | ) | ||||||
|
|
|
|
|
|
|
|||||||
(continued on next page)
61
Table of Contents
CONSOLIDATED STATEMENT OF CASH FLOWS (continued)
| Year Ended December 31, |
2015 | 2014 | 2013 | |||||||||
| (In Thousands) | ||||||||||||
| Financing Activities: |
||||||||||||
| Net increase (decrease) in demand and savings deposits |
$ | 159,587 | $ | 226,400 | $ | 63,498 | ||||||
| (Decrease) in time deposits |
(103,710 | ) | (23,906 | ) | (153,113 | ) | ||||||
| (Decrease) increase in brokered deposits |
(30,228 | ) | 18,231 | (1,914 | ) | |||||||
| Increase (decrease) in loan payable |
61 | (370 | ) | (698 | ) | |||||||
| Repayment of securities sold under agreement to repurchase |
(25,000 | ) | — | — | ||||||||
| Repayment of reverse mortgage trust bonds payable |
— | (21,990 | ) | (4,349 | ) | |||||||
| Receipts from federal funds purchased and securities sold under agreement to repurchase |
31,887,100 | 25,741,826 | 21,291,625 | |||||||||
| Repayments of federal funds purchased and securities sold under agreement to repurchase |
(31,862,125 | ) | (25,710,601 | ) | (21,304,625 | ) | ||||||
| Receipts from FHLB advances |
63,310,841 | 78,831,426 | 48,790,848 | |||||||||
| Repayments of FHLB advances |
(63,047,221 | ) | (79,068,675 | ) | (48,529,067 | ) | ||||||
| Dividends paid |
(6,002 | ) | (4,644 | ) | (5,998 | ) | ||||||
| Issuance of common stock and exercise of common stock options |
3,160 | 3,613 | 4,353 | |||||||||
| Redemption of preferred stock |
— | — | (52,625 | ) | ||||||||
| Repurchase of common stock warrants |
— | (6,300 | ) | — | ||||||||
| Buy back of common stock |
(31,659 | ) | (2,686 | ) | — | |||||||
| Excess tax benefits from share-based payment arrangements |
890 | 797 | 683 | |||||||||
|
|
|
|
|
|
|
|||||||
| Net cash provided (used for) by financing activities |
255,694 | (16,879 | ) | 98,618 | ||||||||
|
|
|
|
|
|
|
|||||||
| Increase (decrease) in cash and cash equivalents |
53,140 | 23,613 | (16,461 | ) | ||||||||
| Cash and cash equivalents at beginning of year |
508,039 | 484,426 | 500,887 | |||||||||
|
|
|
|
|
|
|
|||||||
| Cash and cash equivalents at end of year |
$ | 561,179 | $ | 508,039 | $ | 484,426 | ||||||
|
|
|
|
|
|
|
|||||||
| Supplemental Disclosure of Cash Flow Information: |
||||||||||||
| Cash paid in interest during the year |
$ | 15,978 | $ | 15,664 | $ | 15,696 | ||||||
| Cash paid for income taxes, net |
23,404 | 23,688 | 21,868 | |||||||||
| Loans transferred to assets acquired through foreclosure |
3,725 | 4,896 | 7,289 | |||||||||
| Loans transferred to portfolio from held-for-sale at fair value |
(1,499 | ) | 2,418 | 9,131 | ||||||||
| Net change in accumulated other comprehensive income (loss) |
(2,804 | ) | 24,794 | (34,237 | ) | |||||||
| Fair value of assets acquired, net of cash received |
340,238 | 244,836 | 12,817 | |||||||||
| Fair value of liabilities assumed |
346,181 | 236,886 | 10,127 | |||||||||
| Fair value of assets consolidated |
— | — | 41,397 | |||||||||
| Fair value of liabilities consolidated |
— | — | 26,339 | |||||||||
| Reissuance of treasury stock for acquisitions, net |
71,345 | 32,908 | — | |||||||||
| Investment securities transferred from available-for-sale to held-to-maturity |
— | 124,873 | — | |||||||||
| Non-cash goodwill adjustments, net |
136 | 46 | (160 | ) | ||||||||
The accompanying notes are an integral part of these Consolidated Financial Statements
62
Table of Contents
NOTES TO CONSOLIDATED FINANCIAL STATEMENTS
1. SUMMARY OF SIGNIFICANT ACCOUNTING POLICIES
The acronyms and abbreviations identified below are used in the Notes to Consolidated Financial Statements as well as in the Management’s Discussion and Analysis of Financial Condition and Results of Operations. You may find it helpful to refer back to this page as you read this report.
| Allowance or ALLL: Allowance for loan losses |
Federal Reserve: Board of Governors of the Federal | |
| Alliance: Alliance Bancorp, Inc. of Pennsylvania |
Reserve System | |
| ASC: Accounting standard codification |
Monarch: Monarch Entity Services, LLC | |
| Associate: Employee |
FHLB: Federal Home Loan Bank | |
| ASU: Accounting standard update |
FHLMC: Federal Home Loan Mortgage Corporation | |
| BCBS: Basel Committee on Banking Supervision |
GAAP: U.S. Generally Accepted Accounting Principles | |
| C&I: Commercial & Industrial (loans) |
GNMA: Government National Mortgage Association | |
| CMO: Collateralized mortgage obligation |
GSE: U.S. Government and government | |
| Cypress: Cypress Capital Management, LLC |
SEC: Securities and Exchange Commission | |
| Dodd-Frank Act: Dodd-Frank Wall Street Reform |
sponsored enterprises | |
| and Consumer Protection Act of 2010 |
NSFR: Net stable funding ratio | |
| DTA: Deferred tax asset |
MBS: Mortgage-backed securities | |
| EPS: Earnings per share |
OCC: Office of the Comptroller of the Currency | |
| Exchange Act: Securities Exchange Act of 1934 |
OREO: Other real estate owned | |
| FASB: Financial Accounting Standards Board |
OTTI: Other-than-temporary impairment | |
| FDIC: Federal Deposit Insurance Corporation |
TDR: Troubled debt restructuring | |
| FNMA: Federal National Mortgage Association
|
Organization
WSFS Financial Corporation (the Company or as a consolidated institution, we, our or us) is a savings and loan holding company organized under the laws of the State of Delaware. Our principal wholly-owned subsidiary, Wilmington Savings Fund Society, FSB (WSFS Bank or the Bank), is a federal savings bank organized under the laws of the United States which, at December 31, 2015, served customers primarily from our 63 offices located in Delaware (44), Pennsylvania (17), Virginia (1), and Nevada (1) and through our website at www.wsfsbank.com.
In preparing the Consolidated Financial Statements, we are required to make estimates and assumptions that affect the reported amounts of assets, liabilities, revenues and expenses. Although our estimates contemplate current conditions and how we expect them to change in the future, it is reasonably possible that actual conditions in 2016 could be worse than anticipated in those estimates, which could materially affect our results of operations and financial condition. Amounts subject to significant estimates are items such as the allowance for loan losses and reserves for lending related commitments, goodwill, intangible assets, post-retirement benefit obligations, the fair value of financial instruments, reverse mortgage related assets, income taxes and OTTI. Among other effects, changes to such estimates could result in future impairments of investment securities, goodwill and intangible assets and establishment of the allowance and lending related commitments as well as increased post-retirement benefits expense.
Basis of Presentation
Our Consolidated Financial Statements include the accounts of the parent company and its wholly-owned subsidiaries, WSFS Bank and Cypress. We also have one unconsolidated affiliate, WSFS Capital Trust III (the Trust). WSFS Bank has three wholly-owned subsidiaries, WSFS Wealth Investments, 1832 Holdings, Inc. and Monarch.
WSFS Wealth Investments markets various third-party insurance and securities products to Bank customers through the Bank’s retail banking system. 1832 Holdings, Inc. was formed to hold certain debt and equity investment securities. Monarch provides commercial domicile services which include providing employees, directors, subleases and registered agent services in Delaware and Nevada.
63
Table of Contents
Cypress was formed to provide asset management products and services. As a Wilmington-based investment advisory firm servicing high net worth individuals and institutions, it has approximately $638 million in assets under management at December 31, 2015, compared to approximately $661 million at December 31, 2014.
WSFS Capital Trust III (the Trust) is our unconsolidated subsidiary, and was formed in 2005 to issue $67.0 million aggregate principal amount of Pooled Floating Rate Capital Securities. The proceeds from this issue were used to fund the redemption of $51.5 million of Floating Rate WSFS Capital Trust I Preferred Securities (formerly, WSFS Capital Trust I). WSFS Capital Trust I invested all of the proceeds from the sale of the Pooled Floating Rate Capital Securities in our Junior Subordinated Debentures.
Whenever necessary, reclassifications have been made to the prior years’ Consolidated Financial Statements to conform to the current year’s presentation. All significant intercompany transactions were eliminated in consolidation.
Common Stock Split
In March 2015, the Company’s Board of Directors adopted an amendment to the Company’s Certificate of Incorporation, to increase the number of shares of common stock the Company is authorized to issue from 20,000,000, par value $0.01 to 65,000,000, par value $0.01. This amendment to the Company’s Certificate of Incorporation was approved by the Company’s stockholders at the 2015 Annual Meeting held on April 30, 2015.
In May 2015, the Company effected a three-for-one stock split in the form of a stock dividend to shareholders of record as of May 4, 2015. All share and per share information has been retroactively adjusted to reflect the stock split. We retroactively adjusted stockholders’ equity to reflect the stock split by reclassifying an amount equal to the par value, $0.01, of the additional shares arising from the split from capital in excess of par value to common stock, resulting in no net impact to stockholders’ equity on our Consolidated Statements of Condition.
Cash and Cash Equivalents
For purposes of reporting cash flows, cash and cash equivalents include cash, cash in non-owned ATMs, amounts due from banks, federal funds sold and securities purchased under agreements to resell.
Debt and Equity Securities
Investments in equity securities that have a readily determinable fair value and investments in debt securities are classified into three categories and accounted for as follows:
| • | Debt securities with the positive intention to hold to maturity are classified as “held-to-maturity” and reported at amortized cost. |
| • | Debt and equity securities purchased with the intention of selling them in the near future are classified as “trading securities” and reported at fair value, with unrealized gains and losses included in earnings. |
| • | Debt and equity securities not classified in either of the above are classified as “available-for-sale securities” and reported at fair value, with unrealized gains and losses excluded from earnings and reported, net of tax, as a separate component of stockholders’ equity. |
Debt and equity securities include MBS, municipal bonds, U.S. Government and agency securities and certain equity securities. Premiums and discounts on debt and equity securities, held-to-maturity and available-for-sale, are recognized in interest income using a level yield method over the period to expected maturity. The fair value of debt and equity securities is primarily obtained from third-party pricing services. Implicit in the valuation are estimated prepayments based on historical and current market conditions.
64
Table of Contents
We follow ASC 320-10-55 “Investments—Debt and Equity Securities” that provides guidance related to accounting for recognition of other-than-temporary impairment for debt securities and expands disclosure requirements for other-than-temporarily impaired debt and equity securities. When we conclude an investment security is OTTI, a loss for the difference between the investment security’s carrying value and its fair value may be recognized as a reduction to non-interest income in the Consolidated Statements of Operations. For an investment in a debt security, if we intend to sell the investment security or it is more likely than not that we will be required to sell it before recovery, an OTTI write-down is recognized in earnings equal to the entire difference between the security’s amortized cost basis and its fair value. If we do not intend to sell the investment security and conclude that it is not more likely than not we will be required to sell the security before recovering the carrying value, which may be maturity, the OTTI charge is separated into “credit” and “other” components. The “other” component of the OTTI is included in other comprehensive income/loss, net of the tax effect, and the “credit” component of the OTTI is included as a reduction to non-interest income in the Consolidated Statements of Operations. We are required to use our judgment to determine impairment in certain circumstances. The specific identification method is used to determine realized gains and losses on sales of investment and mortgage-backed securities. All sales are made without recourse.
For additional detail regarding debt and equity securities, see Note 3 to the Consolidated Financial Statements.
Reverse Mortgage Loans
We account for our investment in reverse mortgages in accordance with the instructions provided by the staff of the SEC entitled “Accounting for Pools of Uninsured Residential Reverse Mortgage Contracts,” which requires grouping the individual reverse mortgages into “pools” based on similar characteristics and recognizing income based on the estimated effective yield of the pools. In computing the effective yield, we must project the cash inflows and outflows of the pool including actuarial projections of the life expectancy of the individual contract holder and changes in the collateral value of the residence. At each reporting date, a new economic forecast is made of the cash inflows and outflows of each pool of reverse mortgages. The effective yield of each pool is recomputed and income is adjusted to reflect the revised rate of return. Because of this highly specialized accounting, the recorded value of reverse mortgage assets can result in significant volatility associated with estimations. As a result, income recognition can vary significantly from reporting period to reporting period.
For additional detail regarding reverse mortgages, see Note 7 to the Consolidated Financial Statements.
Loans
Loans are stated net of deferred fees and costs. Interest income on loans is recognized using the level yield method. Loan origination fees, commitment fees and direct loan origination costs are deferred and recognized over the life of the related loans using a level yield method over the period to maturity.
A loan is impaired when, based on current information and events, it is probable we will be unable to collect all amounts due according to the contractual terms of the loan agreement. Impaired loans are measured based on the present value of expected future discounted cash flows, the market price of the loan or the fair value of the underlying collateral if the loan is collateral dependent. In addition, all loans restructured in a troubled debt restructuring are considered to be impaired. Impaired loans include loans within our commercial (investor and owner-occupied), commercial mortgage, commercial construction, residential mortgages and consumer portfolios. Our policy for recognition of interest income on impaired loans, excluding accruing loans, is the same as for nonaccrual loans discussed below.
In addition to originating loans, we occasionally acquire loans through mergers or loan purchase transactions. Some of these acquired loans may exhibit deteriorated credit quality that has occurred since origination and we may not expect to collect all contractual payments. Accounting for these purchased credit-impaired loans is done in accordance with ASC 310-30, Loans and Debt Securities Acquired with Deteriorated Credit Quality. The loans are initially recorded at fair value on the acquisition date, reflecting the present value of the amounts expected to be collected. Income recognition on these loans is based on a reasonable expectation about the timing and amount of cash flows to be collected. Acquired loans are evaluated for impairment on a quarterly basis with a complete updating of the estimated cash flows on a semi-annual basis and if a loan is determined to be impaired but considered collateral dependent, it will have no accretable yield.
65
Table of Contents
For additional detail regarding impaired loans, see Note 6 to the Consolidated Financial Statements and for additional detail regarding purchased credit impaired loans see Note 4 to the Consolidated Financial Statements.
Past Due and Nonaccrual Loans
Past due loans are defined as loans contractually past due 90 days or more as to principal or interest payments but which remain in accrual status because they are considered well secured and in the process of collection.
Nonaccruing loans are those on which the accrual of interest has ceased. Loans are placed on nonaccrual status immediately if, in the opinion of management, collection is doubtful, or when principal or interest is past due 90 days or more and the loan is not well secured and in the process of collection. Interest accrued but not collected at the date a loan is placed on nonaccrual status is reversed and charged against interest income. In addition, the amortization of net deferred loan fees is suspended when a loan is placed on nonaccrual status. Subsequent cash receipts are applied either to the outstanding principal balance or recorded as interest income, depending on management’s assessment of the ultimate collectability of principal and interest. Loans are returned to an accrual status when we assess that the borrower has the ability to make all principal and interest payments in accordance with the terms of the loan (i.e. including a consistent repayment record, generally six consecutive payments, has been demonstrated).
For additional detail regarding past due and nonaccrual loans, see Note 6 to the Consolidated Financial Statements.
Allowance for Loan Losses
We maintain an allowance for loan losses and charge losses to this allowance when such losses are realized. The determination of the allowance for loan losses requires significant judgment reflecting our best estimate of impairment related to specifically identified loans as well as probable loan losses in the remaining loan portfolio. Our evaluation is based upon a continuing review of these portfolios.
We have established the loan loss allowance in accordance with guidance provided by the SEC’s Staff Accounting Bulletin 102 (SAB 102) and FASB ASC 450, Contingencies (ASC 450). When we have reason to believe it is probable that it will not be able to collect all contractually due amounts of principal and interest loans are evaluated for impairment on an individual basis and a specific allocation of the allowance is assigned in accordance with ASC 310-10. We also maintain an allowance for loan losses on acquired loans when: (i) there is deterioration in credit quality subsequent to acquisition for loans accounted for under ASC 310-30 and (ii) the inherent losses in the loans exceed the remaining credit discount recorded at the time of acquisition for loans accounted for under ASC 310-20. Our methodology for assessing the appropriateness of the allowance consists of several key elements which include: a specific allowance for identified impaired loans, an allowance for pools of homogeneous loans, adjustments for qualitative and environmental factors and an allowance for model estimation and complexity risk. Impairment of troubled debt restructurings are measured at the present value of estimated future cash flows using the loan’s effective rate at inception or the fair value of the underlying collateral if the loan is collateral dependent. Troubled debt restructures consist of concessions granted to borrowers facing financial difficulty.
For additional detail regarding the allowance for loan losses and the provision for loan losses, see Note 6 to the Consolidated Financial Statements.
Loans Held-for-Sale
Loans held-for-sale are carried at their fair value on a loan level.
Assets Acquired Through Foreclosure
Assets acquired through foreclosure are recorded at the lower of the recorded investment in the loans or their fair value less estimated disposal costs. Costs subsequently incurred to improve the assets are included in the carrying value provided that the resultant carrying value does not exceed fair value less estimated disposal costs. Costs relating to
66
Table of Contents
holding or disposing of the assets are charged to expense in the current period. We write-down the value of the assets when declines in fair value below the carrying value are identified. Loan workout and OREO expenses include costs of holding and operating the assets, net gains or losses on sales of the assets and provisions for losses to reduce such assets to fair value less estimated disposal costs. During 2015, we recorded $276,000 in charges (including write-downs and net losses on sales of assets) related to assets acquired through foreclosure (REO). These charges were $672,000 and $592,000 for the years ended December 31, 2014 and 2013, respectively. As of December 31, 2015 we had $5.7 million in residential real estate in process of foreclosure.
For additional detail regarding assets acquired through foreclosure, see Note 6 to the Consolidated Financial Statements.
Premises and Equipment
Premises and equipment is stated at cost less accumulated depreciation and amortization. Costs of major replacements, improvements and additions are capitalized. Depreciation expense is computed on a straight-line basis over the estimated useful lives of the assets or, for leasehold improvements, over the effective life of the related lease if less than the estimated useful life. In general, computer equipment, furniture and equipment and building renovations are depreciated over three, five and ten years, respectively.
For additional detail regarding the provision for premises and equipment, see Note 8 to the Consolidated Financial Statements.
Goodwill and Other Intangible Assets
In accordance with FASB ASC 805, Business Combinations (ASC 805) and FASB ASC 350, Intangibles-Goodwill and Other (ASC 350), all assets and liabilities acquired in purchase acquisitions, including goodwill, indefinite-lived intangibles and other intangibles are recorded at fair value. ASU 2015-16, Simplifying the Accounting for Measurement-Period Accounting (ASU 2015-16), was adopted to transition our measurement period from December 31 to October 31 for goodwill and other intangible assets in 2015. The change was made to more closely align the impairment testing date with our long-range planning and forecasting process. We believe the change in our impairment testing date did not delay, accelerate or avoid an impairment charge.
We consider our accounting policies related to goodwill and other intangible assets to be critical because the assumptions or judgment used in determining the fair value of assets and liabilities acquired in past acquisitions are subjective and complex. As a result, changes in these assumptions or judgment could have a significant impact on our financial condition or results of operations.
For additional information regarding our goodwill and other intangible assets, see Notes 2 & 9 to the Consolidated Financial Statements.
Federal Funds Purchased and Securities Sold Under Agreements to Repurchase
We enter into sales of securities under agreements to repurchase. Securities sold under agreements to repurchase are treated as financings, with the obligation to repurchase securities sold reflected as a liability in the Consolidated Statement of Condition. The securities underlying the agreements are assets. Generally, federal funds are purchased for periods ranging up to 90 days.
For additional detail regarding the Federal funds purchased and sold under agreements to repurchase, see Note 11 to the Consolidated Financial Statements.
Loss Contingency for Unfunded Commitments
We maintain a loss contingency accrual for probable losses related to unfunded commitments. The determination of the loss contingency for unfunded commitments requires significant judgment reflecting management’s best estimate of probable losses related to unfunded commitments.
67
Table of Contents
For additional detail regarding loss contingency and unfunded commitments, see Note 11 to the Consolidated Financial Statements.
Income Taxes
The provision for income taxes includes federal, state and local income taxes currently payable and those deferred because of temporary differences between the financial statement basis and tax basis of assets and liabilities.
We account for income taxes in accordance with FASB ASC 740, Income Taxes (ASC 740). ASC 740 requires the recording of deferred income taxes that reflect the net tax effects of temporary differences between the carrying amounts of assets and liabilities for financial reporting purposes and the amounts used for income tax purposes. It prescribes a recognition threshold and a measurement attribute for the financial statement recognition and measurement of tax positions taken or expected to be taken in a tax return. Benefits from tax positions are recognized in the financial statements only when it is more-likely-than-not that the tax position will be sustained upon examination by the appropriate taxing authority that would have full knowledge of all relevant information. A tax position that meets the more-likely-than-not recognition threshold is measured at the largest amount of benefit that is greater than 50% likely of being realized upon ultimate settlement. Tax positions that previously failed to meet the more-likely-than-not recognition threshold are recognized in the first subsequent financial reporting period in which that threshold is met. Previously recognized tax positions that no longer meet the more-likely-than-not recognition threshold are derecognized in the first subsequent financial reporting period in which that threshold is no longer met. ASC 740 also provides guidance on the accounting for and disclosure of unrecognized tax benefits, interest and penalties.
For additional detail regarding income taxes, see Note 15 to the Consolidated Financial Statements.
Stock-Based Compensation
Stock-based compensation is accounted for in accordance with FASB ASC 718, Stock Compensation. Compensation expense relating to all share-based payments is recognized on a straight-line basis, over the applicable vesting period.
For additional detail regarding stock-based compensation, see Note 16 to the Consolidated Financial Statements.
Earnings Per Share
The following table shows the computation of basic and diluted earnings per share:
| (In Thousands, Except Per share Data) | 2015 | 2014 | 2013 | |||||||||
| Numerator: |
||||||||||||
| Net income allocable to common shareholders |
$ | 53,533 | $ | 53,757 | $ | 45,249 | ||||||
|
|
|
|
|
|
|
|||||||
| Denominator: |
||||||||||||
| Denominator for basic earnings per share - weighted average shares |
28,435 | 27,218 | 26,453 | |||||||||
| Effect of dilutive employee stock options, restricted stock and warrants |
508 | 690 | 377 | |||||||||
|
|
|
|
|
|
|
|||||||
| Denominator for diluted earnings per share - adjusted weighted average shares and assumed exercised |
28,943 | 27,908 | 26,830 | |||||||||
|
|
|
|
|
|
|
|||||||
| Earnings per share: |
||||||||||||
| Basic: |
||||||||||||
| Net income allocable to common shareholders |
$ | 1.88 | $ | 1.98 | $ | 1.71 | ||||||
|
|
|
|
|
|
|
|||||||
| Diluted: |
||||||||||||
| Net income allocable to common shareholders |
$ | 1.85 | $ | 1.93 | $ | 1.69 | ||||||
|
|
|
|
|
|
|
|||||||
| Outstanding common stock equivalents having no dilutive effect |
83 | 127 | 1,324 | |||||||||
68
Table of Contents
RECENT ACCOUNTING PRONOUNCEMENTS
Accounting Guidance Adopted in 2015
In September 2015, the FASB issued ASU No. 2015-16, Business Combinations (Topic 805): Simplifying the Accounting for Measurement-Period Adjustments. The amendment in this update eliminates the requirement for an acquirer to retroactively adjust the financial statements for measurement-period adjustments that occur in periods after a business combination is consummated. This ASU is effective for public business entities for annual periods, including interim periods within those annual periods, beginning after December 15, 2015. Early adoption is permitted therefore, we elected to early adopt this guidance during 2015. The adoption of this accounting guidance did not have a material impact on the Company’s Consolidated Statements of Operations or Consolidated Statements of Condition.
In August 2014, the FASB issued ASU No. 2014-14, Receivables-Troubled Debt Restructurings by Creditors (Subtopic 310-40): Classification of Certain Government-Guaranteed Mortgage Loans upon Foreclosure (a consensus of the FASB Emerging Issues Task Force). The objective of this guidance is to reduce diversity in practice related to how creditors classify government-guaranteed mortgage loans, including Federal Housing Administration or Veterans Affairs guaranteed loans, upon foreclosure. Some creditors reclassify those loans to real estate consistent with other foreclosed loans that do not have guarantees; others reclassify the loans to other receivables. The amendments in this guidance require that a mortgage loan be derecognized and that a separate other receivable be recognized upon foreclosure if the following conditions are met: (1) the loan has a government guarantee that is not separable from the loan before foreclosure; (2) at the time of foreclosure, the creditor has the intent to convey the real estate property to the guarantor and make a claim on the guarantee, and the creditor has the ability to recover under that claim; and (3) at the time of foreclosure, any amount of the claim that is determined on the basis of the fair value of the real estate is fixed. Upon foreclosure, the separate other receivable should be measured based on the amount of the loan balance (principal and interest) expected to be recovered from the guarantor. The adoption of this accounting guidance did not have a material effect on the Company’s Consolidated Statements of Operations or Consolidated Statements of Condition.
In June 2014, the FASB issued ASU No. 2014-11, Repurchase-to-Maturity Transactions, Repurchase Financings, and Disclosures. This guidance aligns the accounting for repurchase-to-maturity transactions and repurchase agreements executed as repurchase financings with the accounting for other typical repurchase agreements. Going forward, these transactions would all be accounted for as secured borrowings. It eliminates sale accounting for repurchase-to-maturity transactions and supersedes the guidance under which a transfer of a financial asset and a contemporaneous repurchase financing could be accounted for as a forward agreement, which has resulted in outcomes referred to as off-balance-sheet accounting. The amendments in the ASU require a new disclosure for transactions economically similar to repurchase agreements in which the transferor retains substantially all of the exposure to the economic return on the transferred financial assets throughout the term of the transaction. The amendments in the ASU also require expanded disclosures about the nature of collateral pledged in repurchase agreements and similar transactions accounted for as secured borrowings. The amendments in this ASU are effective for public companies for the first interim or annual period beginning after December 15, 2014. In addition, for public companies, the disclosure for certain transactions accounted for as a sale is effective for the first interim or annual reporting periods beginning on or after December 15, 2014, and the disclosure for transactions accounted for as secured borrowings is required to be presented for annual reporting periods beginning after December 15, 2014, and interim periods beginning after March 15, 2015. The adoption of this accounting guidance did not have a material effect on the Company’s Consolidated Statements of Operations or Consolidated Statements of Condition.
In January 2014, the FASB issued ASU No. 2014-04, Reclassification of Residential Real Estate Collateralized Consumer Mortgage Loans upon Foreclosure (ASU 2014-04). The objective of this guidance is to clarify when an in substance repossession or foreclosure occurs. ASU No. 2014-04 states that an in substance repossession or foreclosure occurs, and a creditor is considered to have received physical possession of residential real estate property collateralizing a consumer mortgage loan, upon either (1) the creditor obtaining legal title to the residential real estate property upon completion of a foreclosure or (2) the borrower conveying all interest in the residential real estate property to the creditor to satisfy that loan through completion of a deed in lieu of foreclosure or through a similar legal agreement. Additionally, ASU No. 2014-04 requires interim and annual disclosure of both (1) the amount of foreclosed residential real estate property held by the creditor and (2) the recorded investment in consumer mortgage loans collateralized by residential real
69
Table of Contents
estate property that are in the process of foreclosure according to local requirements of the applicable jurisdiction. The adoption of this accounting guidance did not have a material effect on the Company’s Consolidated Statements of Operations or Consolidated Statements of Condition.
In January 2014, the FASB, issued ASU No. 2014-01, Investments — Equity Method and Joint Ventures (Topic 323) — Accounting for Investments in Qualified Affordable Housing Projects (a consensus of the FASB Emerging Issues Task Force). This ASU permits an entity to make an accounting policy election to account for its investment in qualified affordable housing projects using the proportional amortization method if certain conditions are met. Under the proportionate amortization method, an entity amortizes the initial cost of the investment in proportion to the tax credits and other tax benefits received and recognizes the net investment performance in the income statement as a component of income tax expense (benefit). A reporting entity that uses the effective yield or other method to account for its investments in qualified affordable housing projects before the date of adoption may continue to apply such method to those preexisting investments. The adoption did not have a material effect on the Company’s Consolidated Statements of Operations or Consolidated Statements of Condition. For additional discussion on the adoption of this guidance refer to the Income Taxes section of Management’s Discussion and Analysis of Financial Condition and Results of Operations.
Accounting Guidance Pending Adoption at December 31, 2015
In June 2014, the FASB issued ASU 2014-12, Accounting for Share-Based Payments When the Terms of an Award Provide That a Performance Target Could Be Achieved after the Requisite Service Period. The standard update resolves the diverse accounting treatment for these share-based payments by requiring that a performance target that affects vesting and that could be achieved after the requisite service period is treated as a performance condition. The requisite service period ends when the employee can cease rendering service and still be eligible to vest in the award if the performance target is achieved. ASU 2014-12 will be effective for interim and annual reporting periods beginning after December 15, 2015. Early adoption is permitted. ASU 2014-12 may be adopted either prospectively for share-based payment awards granted or modified on or after the effective date, or retrospectively, using a modified retrospective approach. The modified retrospective approach applies to share-based payment awards outstanding as of the beginning of the earliest annual period presented in the financial statements at adoption, and to all new or modified awards thereafter. The Company does not expect the application of this guidance to have a material impact on the Company’s Consolidated Statements of Operations or Consolidated Statements of Condition.
In May 2014, the FASB issued ASU No. 2014-09, Revenue from Contracts with Customers (Topic 606). This ASU supersedes the revenue recognition requirements in ASC 605, Revenue Recognition. ASU No. 2014-9 will require an entity to recognize revenue when it transfers promised goods or services to customers using a five-step model that requires entities to exercise judgment when considering the terms of the contracts. In August 2015, the FASB issued ASU No. 2015-14, Revenue from Contracts with Customers (Topic 606): Deferral of the Effective Date. This amendment defers the effective date of ASU 2014-09 by one year to financial statements issued for fiscal years beginning after December 15, 2017. Early adoption is permitted only as of annual reporting periods beginning after December 15, 2016. The standard permits the use of either the retrospective or retrospectively with the cumulative effect transition method. The Company does not expect the application of this guidance to have a material impact on the Company’s Consolidated Statements of Operations or Consolidated Statements of Condition.
In April 2015, the FASB issued ASU No. 2015-03, Interest- Imputation of Interest (Subtopic 835-30) Simplifying the Presentation of Debt Issuance Costs. The amendments in this update require that debt issuance costs related to a recognized debt liability be presented in the balance sheet as a direct deduction from the carrying amount of that debt liability, consistent with debt discounts. The recognition and measurement guidance for debt issuance costs are not affected by this amendment. This guidance is effective for interim and annual reporting periods beginning after December 15, 2015. Early adoption is permitted. ASU No. 2015-03 should be applied on a retrospective basis. The Company does not expect the application of this guidance to have a material impact on the Company’s Consolidated Statements of Operations or Consolidated Statements of Condition.
In February 2015, the FASB issued ASU No. 2015-02, Consolidation (Topic 810): Amendments to the Consolidation Analysis. This guidance provides an additional requirement for a limited partnership or similar entity to qualify as a voting
70
Table of Contents
interest entity and also amends the criteria for consolidating such an entity. In addition, it amends the criteria for evaluating fees paid to a decision maker or service provider as a variable interest and amends the criteria for evaluating the effect of fee arrangements and related parties on a VIE primary beneficiary determination. This guidance is effective for interim and annual reporting periods beginning after December 15, 2015. Early adoption is permitted. ASU No. 2015-02 requires entities to use a retrospective or a modified retrospective approach (recording a cumulative-effect adjustment to equity as of the beginning of the fiscal year). The Company does not expect the application of this guidance to have a material impact on the Company’s Consolidated Statements of Operations or Consolidated Statements of Condition.
In January 2016, the FASB issued ASU No. 2016-01, Financial Instruments – Overall (Subtopic 825-10), Recognition and Measurement of Financial Assets and Financial Liabilities. This amendment provides that equity investments will be measured at fair value with changes in fair value recognized in net income. When fair value is not readily determinable an entity may elect to measure the equity investment at cost, minus impairment, plus or minus any change in the investment’s observable price. For financial liabilities that are measured at fair value, the amendment requires an entity to present separately, in other comprehensive income, any change in fair value resulting from a change in instrument specific credit risk. ASU 2016-01 will be effective for fiscal years beginning after December 15, 2017, including interim periods within those fiscal years. Early adoption is permitted. Entities may apply this guidance on a prospective or retrospective basis. The Company does not expect the application of this guidance to have a material impact on the Company’s Consolidated Statements of Operations or Consolidated Statements of Condition.
In February 2016, the FASB issued ASU No. 2016-02, Leases (Topic 842). This ASU revises the accounting related to lessee accounting. Under the new guidance, lessees will be required to recognize a lease liability and a right-of-use asset for all leases. The new lease guidance also simplified the accounting for sale and leaseback transactions primarily because lessees must recognize lease assets and lease liabilities. ASU 2016-02 is effective for the first interim period within annual periods beginning after December 15, 2018, with early adoption permitted. The standard is required to be adopted using the modified retrospective transition approach for leases existing at, or entered into after, the beginning of the earliest comparative period presented in the financial statements. The Company’s management is currently evaluating the impact of adopting ASU 2016-02 on the Company’s consolidated financial statements.
2. BUSINESS COMBINATIONS
Penn Liberty Financial Corporation
On November 23, 2015, we along with Penn Liberty Financial Corporation (Penn Liberty) announced the signing of a definitive agreement and plan of reorganization whereby we would acquire Penn Liberty. Upon the closing of the transaction, Penn Liberty will merge into the Company and Penn Liberty Bank will merge into WSFS Bank. Penn Liberty is a locally managed institution with eleven branch locations headquartered in Wayne, Pennsylvania. It reported $704 million in assets, $510 million in loans and $621 million in deposits as of December 31, 2015. We expect this acquisition to build our market share, expand our customer base and enhance our fee income. The total transaction is valued at approximately $101 million and is expected to close early in the third quarter of 2016, subject to approval by the shareholders of Penn Liberty, regulatory approvals and other customary closing conditions.
Alliance Bancorp, Inc. of Pennsylvania
On October 9, 2015 we completed the acquisition of Alliance and its wholly owned subsidiary, Alliance Bank, headquartered in Broomall, Pennsylvania. At that time Alliance merged into the Company and Alliance Bank merged into WSFS Bank. In accordance with the terms of the Agreement and Plan of Merger, dated March 2, 2015, holders of shares of Alliance common stock received, in aggregate, $26.6 million in cash and 2,459,120 shares of WSFS common stock. The transaction was valued at $97.9 million based on WSFS’ October 9, 2015 closing share price of $29.01 as quoted on NASDAQ. The results of the combined entity’s operations are included in our Consolidated Financial Statements since the date of the acquisition.
The acquisition of Alliance was accounted for as a business combination using the acquisition method of accounting and, accordingly, assets acquired, liabilities assumed and consideration paid were recorded at their estimated fair values as of the acquisition date. The fair values are preliminary estimates and are subject to adjustment during the one year measurement period after the acquisition. The excess of consideration paid over the preliminary fair value of net assets acquired was recorded as goodwill in the amount of $36.4 million, which will not be amortizable and is not deductible for
71
Table of Contents
tax purposes. The Company allocated the total balance of goodwill to its WSFS Bank segment. The Company also recorded $2.6 million in core deposit intangibles which are being amortized over ten years using the straight-line depreciation method and $511,000 for non-compete covenants which are being amortized between six and eighteen months.
In connection with the merger, the consideration paid and the fair value of identifiable assets acquired and liabilities assumed, as of the date of acquisition, are summarized in the following table:
| (In Thousands) | Fair Value | |||
| Consideration Paid: |
||||
| Common shares issued (2,459,120) |
$ | 71,345 | ||
| Cash paid to Alliance stockholders |
26,576 | |||
|
|
|
|||
| Value of consideration |
97,921 | |||
| Assets acquired: |
||||
| Cash and due from banks |
67,439 | |||
| Investment securities |
3,002 | |||
| Loans |
307,695 | |||
| Premises and equipment |
2,685 | |||
| Deferred income taxes |
7,544 | |||
| Bank owned life insurance |
12,923 | |||
| Core deposit intangible |
2,635 | |||
| Other real estate owned |
768 | |||
| Other assets |
2,986 | |||
|
|
|
|||
| Total assets |
407,677 | |||
| Liabilities assumed: |
||||
| Deposits |
341,682 | |||
| Other borrowings |
2,826 | |||
| Other liabilities |
1,673 | |||
|
|
|
|||
| Total liabilities |
346,181 | |||
| Net assets acquired: |
61,496 | |||
|
|
|
|||
| Goodwill resulting from acquisition of Alliance |
$ | 36,425 | ||
|
|
|
|||
In many cases, the fair values of assets acquired and liabilities assumed were determined by estimating the cash flows expected to result from those assets and liabilities and discounting them at appropriate market rates.
Acquired loans were recorded at their fair value as of the acquisition date. The fair value was based on a discounted cash flow methodology that uses assumptions as to credit risk, default rates, collateral values, loss severity, along with estimated prepayment rates. Non-impaired acquired loans had a gross contractual balance of $294.1 million and a fair value of $284.9 million. Loans that had deteriorated in credit quality since their origination, and for which it was probable that all contractual cash flows would not be received, were accounted for in accordance with ASC 310-30 “Loans and Debt Securities Acquired with Deteriorated Credit Quality”. The gross contractual balance of the impaired loans was $24.6 million with a fair value of $22.8 million. For additional information regarding acquired impaired loans, see Note 4 to the Consolidated Financial Statements.
The Company acquired Alliance’s investment portfolio with a fair value of $3.0 million. The fair value of the investment portfolio was determined to be equal to book value as it consisted of only one security which matured in November 2015.
The Company recorded a deferred income tax asset (DTA) of $7.5 million related to tax attributes of Alliance along with the effects of fair value adjustments resulting from acquisition accounting for the combination.
The fair value of savings and transaction deposit accounts acquired was assumed to approximate their carrying value as these accounts have no stated maturity and are payable on demand. Certificates of deposit accounts were valued by comparing the contractual cost of the portfolio to an identical portfolio bearing current market rates. The portfolio was segregated into pools based on remaining maturity. For each pool, the projected cash flows from maturing certificates were then calculated based on contractual rates and prevailing market rates. The valuation adjustment for each pool is
72
Table of Contents
equal to the present value of the difference of these two cash flows, discounted at the assumed market rate for a certificate with a corresponding maturity. The valuation adjustment of $1.4 million will be accreted or amortized to interest expense over the remaining maturities of the respective pools.
The other borrowings were sweep repos and their carrying amount at October 9, 2015 is a reasonable estimate of their fair value.
Direct costs related to the acquisition were expensed as incurred. During the twelve months ended December 31, 2015, the Company incurred $6.9 million in integration expenses, including $3.4 million in salary and benefits, $1.9 million in professional fees, $792,000 in marketing expense and $458,000 in data processing expense.
First Wyoming Financial Corporation
On September 5, 2014, the Company completed the merger of First Wyoming Financial Corporation (FNBW) into the Company and the merger of FNBW’s wholly-owned subsidiary, The First National Bank of Wyoming into the Bank. In accordance with the terms of the Agreement and Plan of Merger, dated November 25, 2013, holders of shares of FNBW common stock received, in aggregate, $32.0 million in cash and 1,357,983 shares (adjusted for our 3-for-1 stock split) of WSFS common stock. The transaction was valued at $64.9 million based on WSFS’ September 5, 2014 closing share price of $24.23 (adjusted for our 3-for-1 stock split) as quoted on NASDAQ. The results of the combined entity’s operations are included in our Consolidated Financial Statements since the date of the acquisition.
The acquisition of FNBW was accounted for as a business combination using the acquisition method of accounting and, accordingly, assets acquired, liabilities assumed and consideration paid were recorded at their estimated fair values as of the acquisition date. The excess of consideration paid over the preliminary fair value of net assets acquired was recorded as goodwill in the amount of $16.5 million, which will not be amortizable and is not deductible for tax purposes. The Company allocated the total balance of goodwill to its WSFS Bank segment. The Company also recorded $3.2 million in core deposit intangibles which are being amortized over ten years using an accelerated depreciation method.
In connection with the merger, the consideration paid and the fair value of identifiable assets acquired and liabilities assumed, as of the date of acquisition, are summarized in the following table:
| (In Thousands) | Fair Value | |||
| Consideration Paid: |
||||
| Common shares issued (1,357,983) |
$ | 32,908 | ||
| Cash paid to FNBW stockholders |
32,028 | |||
|
|
|
|||
| Value of consideration |
64,936 | |||
| Assets acquired: |
||||
| Cash and due from banks |
40,605 | |||
| Investment securities |
41,822 | |||
| Loans |
175,895 | |||
| Premises and equipment |
1,611 | |||
| Deferred income taxes |
3,216 | |||
| Bank owned life insurance |
12,576 | |||
| Core deposit intangible |
3,240 | |||
| Other Real Estate Owned |
1,593 | |||
| Other assets |
4,659 | |||
|
|
|
|||
| Total assets |
285,217 | |||
| Liabilities assumed: |
||||
| Deposits |
228,844 | |||
| FHLB advances |
5,052 | |||
| Other liabilities |
2,891 | |||
|
|
|
|||
| Total liabilities |
236,787 | |||
| Net assets acquired: |
48,430 | |||
|
|
|
|||
| Goodwill resulting from acquisition of FNBW: |
$ | 16,506 | ||
|
|
|
|||
73
Table of Contents
The following table details the changes to goodwill:
| Fair Value | ||||
| Goodwill resulting from the acquisition of FNBW reported as of September 30, 2014 |
$ | 16,370 | ||
| Effects of adjustments to: |
||||
| Assets |
236 | |||
| Liabilities |
(100 | ) | ||
| Final purchase price |
— | |||
|
|
|
|||
| Adjusted goodwill resulting from the acquisition of FNBW as of December 31, 2015 |
$ | 16,506 | ||
|
|
|
|||
3. INVESTMENT SECURITIES
The following tables detail the amortized cost and the estimated fair value of our available-for-sale and held-to-maturity investment securities:
| (In Thousands) | Amortized Cost |
Gross Unrealized Gains |
Gross Unrealized Losses |
Fair Value | ||||||||||||
| Available-for-sale securities: | ||||||||||||||||
| December 31, 2015 | ||||||||||||||||
| GSE |
$ | 31,041 | $ | — | $ | 127 | $ | 30,914 | ||||||||
| CMO |
253,189 | 713 | 2,414 | 251,488 | ||||||||||||
| FNMA MBS |
320,105 | 1,081 | 2,715 | 318,471 | ||||||||||||
| FHLMC MBS |
99,350 | 405 | 313 | 99,442 | ||||||||||||
| GNMA MBS |
20,387 | 420 | 93 | 20,714 | ||||||||||||
|
|
|
|
|
|
|
|
|
|||||||||
| $ | 724,072 | $ | 2,619 | $ | 5,662 | $ | 721,029 | |||||||||
|
|
|
|
|
|
|
|
|
|||||||||
| (In Thousands) | Amortized Cost |
Gross Unrealized Gains |
Gross Unrealized Losses |
Fair Value | ||||||||||||
| Available-for-sale securities: | ||||||||||||||||
| December 31, 2014 | ||||||||||||||||
| GSE |
$ | 30,020 | $ | 14 | $ | 74 | $ | 29,960 | ||||||||
| CMO |
193,672 | 874 | 1,614 | 192,932 | ||||||||||||
| FNMA MBS |
291,606 | 2,053 | 1,106 | 292,553 | ||||||||||||
| FHLMC MBS |
146,742 | 672 | 532 | 146,882 | ||||||||||||
| GNMA MBS |
77,364 | 701 | 268 | 77,797 | ||||||||||||
|
|
|
|
|
|
|
|
|
|||||||||
| $ | 739,404 | $ | 4,314 | $ | 3,594 | $ | 740,124 | |||||||||
|
|
|
|
|
|
|
|
|
|||||||||
| (In Thousands) | Amortized Cost |
Gross Unrealized Gains |
Gross Unrealized Losses |
Fair Value | ||||||||||||
| Held-to-Maturity Securities (a) | ||||||||||||||||
| December 31, 2015 |
||||||||||||||||
| State and political subdivisions |
$ | 165,862 | $ | 1,943 | $ | 62 | $ | 167,743 | ||||||||
|
|
|
|
|
|
|
|
|
|||||||||
| (In Thousands) | Amortized Cost |
Gross Unrealized Gains |
Gross Unrealized Losses |
Fair Value | ||||||||||||
| Held-to-Maturity Securities (a) | ||||||||||||||||
| December 31, 2014 |
||||||||||||||||
| State and political subdivisions |
$ | 126,168 | $ | 3 | $ | — | $ | 126,171 | ||||||||
|
|
|
|
|
|
|
|
|
|||||||||
| (a) | Held-to-maturity securities transferred from available-for-sale are included in held-to-maturity at fair value at the time of transfer. The amortized cost of held-to-maturity securities included net unrealized gains of $2.9 million and $3.6 million at December 31, 2015 and December 31, 2014, respectively, related to securities transferred, which are offset in Accumulated Other Comprehensive Income, net of tax. |
74
Table of Contents
The scheduled maturities of investment securities at December 31, 2015 and December 31, 2014 were as follows:
| Available-for-Sale | ||||||||
| (In Thousands) |
Amortized Cost |
Fair Value | ||||||
| 2015 (1) |
||||||||
| Within one year |
$ | 3,997 | $ | 3,995 | ||||
| After one year but within five years |
30,009 | 29,840 | ||||||
| After five years but within ten years |
218,023 | 215,018 | ||||||
| After ten years |
472,043 | 472,176 | ||||||
|
|
|
|
|
|||||
| $ | 724,072 | $ | 721,029 | |||||
|
|
|
|
|
|||||
| 2014 (1) |
||||||||
| Within one year |
$ | 10,000 | $ | 10,014 | ||||
| After one year but within five years |
20,020 | 19,946 | ||||||
| After five years but within ten years |
134,453 | 133,395 | ||||||
| After ten years |
574,931 | 576,769 | ||||||
|
|
|
|
|
|||||
| $ | 739,404 | $ | 740,124 | |||||
|
|
|
|
|
|||||
| Held-to-Maturity | ||||||||
| (In Thousands) | Amortized Cost |
Fair Value | ||||||
| 2015 (1) |
||||||||
| Within one year |
$ | 1,486 | $ | 1,488 | ||||
| After one year but within five years |
3,465 | 3,456 | ||||||
| After five years but within ten years |
7,939 | 8,045 | ||||||
| After ten years |
152,972 | 154,754 | ||||||
|
|
|
|
|
|||||
| $ | 165,862 | $ | 167,743 | |||||
|
|
|
|
|
|||||
| 2014 (1) |
||||||||
| Within one year |
$ | 3,608 | $ | 3,608 | ||||
| After one year but within five years |
6,217 | 6,217 | ||||||
| After five years but within ten years |
9,733 | 9,736 | ||||||
| After ten years |
106,610 | 106,610 | ||||||
|
|
|
|
|
|||||
| $ | 126,168 | $ | 126,171 | |||||
|
|
|
|
|
|||||
| (1) | Actual maturities could differ from contractual maturities. |
MBS have expected maturities that differ from their contractual maturities. These differences arise because borrowers have the right to call or prepay obligations with or without a prepayment penalty.
Investment securities with fair market values aggregating $457.0 million, $470.4 million and $447.7 million were pledged as collateral for retail customer repurchase agreements, municipal deposits, and other obligations as of December 31, 2015, 2014 and 2013, respectively. From time to time, investment securities are also pledged as collateral for FHLB borrowings. There were no FHLB pledged investment securities at December 31, 2015, 2014 or 2013.
During 2015, we sold $192.8 million of investment securities categorized as available-for-sale for net gains of $1.5 million, of which $1.5 million was gain and $1,000 was losses. In 2014, we sold $227.7 million investment securities categorized as available-for-sale for net gains of $1.0 million, of which $1.1 million was gain and $60,000 was losses. The cost basis of all investment securities sales is based on the specific identification method.
As of December 31, 2015, our investment securities portfolio had remaining unamortized premiums of $18.3 million and $306,000 of unaccreted discounts.
75
Table of Contents
For these investment securities with unrealized losses, the table below shows our gross unrealized losses and fair value by investment category and length of time that individual securities were in a continuous unrealized loss position at December 31, 2015.
| Duration of Unrealized Loss Position | ||||||||||||||||||||||||
| Less than 12 months | 12 months or longer | Total | ||||||||||||||||||||||
| (In Thousands) Available-for-sale securities: |
Fair Value |
Unrealized Loss |
Fair Value |
Unrealized Loss |
Fair Value |
Unrealized Loss |
||||||||||||||||||
| GSE |
$ | 30,914 | $ | 127 | $ | — | $ | — | $ | 30,914 | $ | 127 | ||||||||||||
| CMO |
139,486 | 1,703 | 26,536 | 711 | 166,022 | 2,414 | ||||||||||||||||||
| FNMA MBS |
214,465 | 2,715 | — | — | 214,465 | 2,715 | ||||||||||||||||||
| FHLMC MBS |
41,791 | 136 | 4,025 | 177 | 45,816 | 313 | ||||||||||||||||||
| GNMA MBS |
4,073 | 29 | 2,377 | 64 | 6,450 | 93 | ||||||||||||||||||
|
|
|
|
|
|
|
|
|
|
|
|
|
|||||||||||||
| Total temporarily impaired investments |
$ | 430,729 | $ | 4,710 | $ | 32,938 | $ | 952 | $ | 463,667 | $ | 5,662 | ||||||||||||
|
|
|
|
|
|
|
|
|
|
|
|
|
|||||||||||||
| Less than 12 months | 12 months or longer | Total | ||||||||||||||||||||||
| (In Thousands) Held-to-maturity |
Fair Value |
Unrealized Loss |
Fair Value |
Unrealized Loss |
Fair Value |
Unrealized Loss |
||||||||||||||||||
| State and political subdivisions |
$ | 9,845 | $ | 62 | $ | — | $ | — | $ | 9,845 | $ | 62 | ||||||||||||
|
|
|
|
|
|
|
|
|
|
|
|
|
|||||||||||||
| Total temporarily impaired investments |
$ | 9,845 | $ | 62 | $ | — | $ | — | $ | 9,845 | $ | 62 | ||||||||||||
|
|
|
|
|
|
|
|
|
|
|
|
|
|||||||||||||
For these investment securities with unrealized losses, the table below shows our gross unrealized losses and fair value by investment category and length of time that individual securities were in a continuous unrealized loss position at December 31, 2014.
| Less than 12 months | 12 months or longer | Total | ||||||||||||||||||||||
| (In Thousands) | Fair | Unrealized | Fair | Unrealized | Fair | Unrealized | ||||||||||||||||||
| Available-for-sale securities: |
Value | Loss | Value | Loss | Value | Loss | ||||||||||||||||||
| GSE |
$ | 19,945 | $ | 74 | $ | — | $ | — | $ | 19,945 | $ | 74 | ||||||||||||
| CMO |
15,492 | 108 | 61,630 | 1,506 | 77,122 | 1,614 | ||||||||||||||||||
| FNMA MBS |
— | — | 103,207 | 1,106 | 103,207 | 1,106 | ||||||||||||||||||
| FHLMC MBS |
23,901 | 54 | 58,267 | 478 | 82,168 | 532 | ||||||||||||||||||
| GNMA MBS |
— | — | 48,312 | 268 | 48,312 | 268 | ||||||||||||||||||
|
|
|
|
|
|
|
|
|
|
|
|
|
|||||||||||||
| Total temporarily impaired investments |
$ | 59,338 | $ | 236 | $ | 271,416 | $ | 3,358 | $ | 330,754 | $ | 3,594 | ||||||||||||
|
|
|
|
|
|
|
|
|
|
|
|
|
|||||||||||||
There were no held-to-maturity securities in an unrealized loss position as of December 31, 2014.
At December 31, 2015, we owned investment securities totaling $473.5 million in which the amortized cost basis exceeded fair value. Total unrealized losses on these securities were $5.7 million at December 31, 2015. The temporary impairment is the result of changes in market interest rates subsequent to the purchase of the securities. Our investment portfolio is reviewed each quarter for indications of other than temporary impairment. This review includes analyzing the length of time and the extent to which the fair value has been lower than the amortized cost, the financial condition and near-term prospects of the issuer, including any specific events which may influence the operations of the issuer and our intent and ability to hold the investment for a period of time sufficient to allow for full recovery of the unrealized loss. We evaluate our intent and ability to hold securities based upon our investment strategy for the particular type of security and our cash flow needs, liquidity position, capital adequacy and interest rate risk position. In addition, we do not have the intent to sell, nor is it more likely-than-not we will be required to sell these securities before we are able to recover the amortized cost basis.
76
Table of Contents
All securities, with the exception of one, were AA- rated or better at the time of purchase and remained investment grade at December 31, 2015. All securities were evaluated for OTTI at December 31, 2015 and 2014. The result of this evaluation showed no OTTI as of December 31, 2015 or 2014. The weighted average duration of MBS was 4.7 years at December 31, 2015.
4. ACQUIRED CREDIT IMPAIRED LOANS
On October 9, 2015, we acquired $24.6 million of credit impaired loans from an acquisition with Alliance. Loans that have deteriorated in credit quality since their origination, and for which it is probable that all contractual cash flows will not be received, are accounted for in accordance with FASB ASC 310-30, Loans and Debt Securities Acquired with Deteriorated Credit Quality (ASC 310-30). Under ASC 310-30, acquired loans are generally considered accruing and performing as the loans accrete interest income over the estimated life of the loan when expected cash flows are reasonably estimable. Accordingly, acquired impaired loans that are contractually past due are still considered to be accruing and performing as long as the estimated cash flows are expected to be received. If the timing and amount of cash flows is not reasonably estimable, the loans may be classified as nonaccrual loans and interest income may be recognized on a cash basis or as a reduction of the principal amount outstanding. At December 31, 2015, there were two acquired loans from Alliance accounted for under FASB ASC 310-20, Nonrefundable Fees and Other Costs (ASC 310-20) classified as nonaccrual loans with a carrying value of $86,000. Credit deterioration evident in the loans was included in the determination of the fair value of the loans at the acquisition date. Updates to expected cash flows for acquired impaired loans accounted for under ASC 310-30 has resulted in a provision for loan loss of $132,000 due to the amount and timing of expected cash flows decrease compared to those originally estimated at acquisition.
The following table details the loans acquired through the Alliance merger on October 9, 2015 that are accounted for in accordance with FASB ASC 310-30.
| (In Thousands) |
October 9, 2015 | |||
| Contractually required principal and interest at acquisition* |
$ | 27,469 | ||
| Contractual cash flows not expected to be collected (nonaccretable difference) |
2,377 | |||
|
|
|
|||
| Expected cash flows at acquisition |
25,092 | |||
| Interest component of expected cash flows (accretable yield) |
2,334 | |||
|
|
|
|||
| Fair value of acquired loans accounted for under FASB ASC 310-30 |
$ | 22,758 | ||
|
|
|
|||
| * | The difference between $27.4 and $24.6 in Note 2 is contractual interest to be received |
On September 5, 2014, $24.2 million of impaired loans were acquired from FNBW. At December 31, 2015, there were six FNBW acquired loans accounted for under ASC 310-20 classified as nonaccrual loans with a carrying value of $302,000.
The following table details the loans acquired through the FNBW merger on September 5, 2014 that are accounted for in accordance with FASB ASC 310-30.
| (In Thousands) |
September 5, 2014 | |||
| Contractually required principal and interest at acquisition* |
$ | 27,086 | ||
| Contractual cash flows not expected to be collected (nonaccretable difference) |
7,956 | |||
|
|
|
|||
| Expected cash flows at acquisition |
19,130 | |||
| Interest component of expected cash flows (accretable yield) |
1,790 | |||
|
|
|
|||
| Fair value of acquired loans accounted for under FASB ASC 310-30 |
$ | 17,340 | ||
|
|
|
|||
| * | The difference between $27.1 and $24.2 in Note 2 is contractual interest to be received |
77
Table of Contents
The following is the outstanding principal balance and carrying amounts for all acquired credit impaired loans for which the company applies ASC 310-30 as of December 31, 2015 and 2014:
| (In Thousands) |
December 31, 2015 | December 31, 2014 | ||||||
| Outstanding principal balance |
$ | 38,067 | $ | 22,752 | ||||
| Carrying amount |
32,568 | 15,893 | ||||||
| Allowance for loan losses |
132 | — | ||||||
The following table presents the changes in accretable yield on all acquired credit impaired loans for the years indicated:
| Accretable Yield |
||||
| Balance as of September 5, 2014 |
$ | 1,790 | ||
| Accretion |
(250 | ) | ||
| Reclassification from nonaccretable difference |
— | |||
| Additions/adjustments |
(42 | ) | ||
| Disposals |
— | |||
|
|
|
|||
| Ending balance as of December 31, 2014 |
$ | 1,498 | ||
| Addition from Alliance acquisition |
2,334 | |||
| Accretion |
(1,405 | ) | ||
| Reclassification from nonaccretable difference |
3,054 | |||
| Additions/adjustments |
(714 | ) | ||
| Disposals |
(3 | ) | ||
|
|
|
|||
| Ending balance as of December 31, 2015 |
$ | 4,764 | ||
|
|
|
|||
5. LOANS
The following table details our loan portfolio by category:
| December 31, |
2015 | 2014 | ||||||
| (In Thousands) | ||||||||
| Commercial and industrial |
$ | 1,061,597 | $ | 920,072 | ||||
| Owner-occupied commercial |
880,643 | 788,598 | ||||||
| Commercial mortgages |
966,698 | 805,459 | ||||||
| Construction |
245,773 | 142,497 | ||||||
| Residential |
259,679 | 218,329 | ||||||
| Consumer |
360,249 | 327,543 | ||||||
|
|
|
|
|
|||||
| 3,774,639 | 3,202,498 | |||||||
|
|
|
|
|
|||||
| Less: |
||||||||
| Deferred fees, net |
8,500 | 6,420 | ||||||
| Allowance for loan losses |
37,089 | 39,426 | ||||||
|
|
|
|
|
|||||
| Net loans |
$ | 3,729,050 | $ | 3,156,652 | ||||
|
|
|
|
|
|||||
Nonaccruing loans aggregated $21.2 million, $24.1 million and $31.0 million at December 31, 2015, 2014 and 2013, respectively. If interest on all such loans had been recorded in accordance with contractual terms, net interest income would have increased by $946,000 in 2015, $800,000 in 2014, and $1.0 million in 2013.
The total amounts of loans serviced for others were $130.0 million, $153.3 million and $229.8 million at December 31, 2015, 2014 and 2013, respectively, which consisted of residential first mortgage loans and reverse mortgage loans. We received fees from the servicing of loans of $309,000, $285,000 and $342,000 during 2015, 2014 and 2013, respectively.
78
Table of Contents
We record mortgage-servicing rights on our mortgage loan-servicing portfolio. Mortgage servicing rights represent the present value of the future net servicing fees from servicing mortgage loans we acquire or originate. The value of these servicing rights was $481,000 and $321,000 at December 31, 2015 and 2014, respectively. Mortgage loans serviced for others are not included in loans in the accompanying Consolidated Statements of Condition. Changes in the value of these servicing rights resulted in net losses of $160,000 and $98,000 during 2015 and 2014, respectively. Revenues from originating, marketing and servicing mortgage loans as well as valuation adjustments related to capitalized mortgage servicing rights are included in mortgage banking activities, net in the Consolidated Statements of Operations.
Accrued interest receivable on loans outstanding was $10.4 million and $8.5 million at December 31, 2015 and 2014, respectively.
6. ALLOWANCE FOR LOAN LOSSES AND CREDIT QUALITY INFORMATION
We maintain an allowance for loan losses and charge losses to this allowance when such losses are realized. We established our allowance for loan losses in accordance with guidance provided in the SEC’s Staff Accounting Bulletin 102 (SAB 102) and FASB ASC 450, Contingencies (ASC 450). When we have reason to believe it is probable that we will not be able to collect all contractually due amounts of principal and interest, loans are evaluated for impairment on an individual basis and a specific allocation of the allowance is assigned in accordance with ASC 310-10. We also maintain an allowance for loan losses on acquired loans when: (i) for loans accounted for under ASC 310-30, there is deterioration in credit quality subsequent to acquisition and (ii) for loans accounted for under ASC 310-20, the inherent losses in the loans exceed the remaining credit discount recorded at the time of acquisition. The determination of the allowance for loan losses requires significant judgment reflecting our best estimate of impairment related to specifically identified impaired loans as well as probable loan losses in the remaining loan portfolio. Our evaluation is based upon a continuing review of these portfolios. The following are included in our allowance for loan losses:
| • | Specific reserves for impaired loans |
| • | An allowance for each pool of homogenous loans based on historical loss experience |
| • | Adjustments for qualitative and environmental factors allocated to pools of homogenous loans |
| • | Allowance for model estimation and complexity risk |
When it is probable that the Bank will be unable to collect all amounts due (interest and principal) in accordance with the contractual terms of the loan agreement, it assigns a specific reserve to that loan, if necessary. Unless loans are well-secured and collection is imminent, loans greater than 90 days past due are deemed impaired and their respective reserves are generally charged-off once the loss has been confirmed. Estimated specific reserves are based on collateral values, estimates of future cash flows or market valuations. We charge loans off when they are deemed to be uncollectible. During the twelve months ended December 31, 2015, net charge-offs totaled $10.1 million or 0.29% of average loans, compared to $5.4 million, or 0.18% of average loans annualized, during the twelve months ended December 31, 2014. A significant portion of the net charge-offs in 2015 was the result of one $9.1 million substandard C&I relationship previously classified as an accruing TDR that was placed in nonaccrual status during the second quarter of 2015. This relationship included net charge-offs of $5.7 million during the twelve months ending December 31, 2015.
Allowances for pooled homogeneous loans, that are not deemed impaired, are based on historical net loss experience. Estimated losses for pooled portfolios are determined differently for commercial loan pools and retail loan pools. Commercial loans are pooled into the following segments: commercial, owner-occupied, commercial real estate and construction. Each pool is further segmented by internally assessed risk ratings. Loan losses for commercial loans are estimated by determining the probability of default and expected loss severity upon default. During the twelve months ended December 31, 2015, we increased the look-back period to 20 quarters from 16 quarters used at December 31, 2015 and prior periods. This change in the look-back period resulted in an increase of $1.3 million to the total allowance at December 31, 2015.
Loss severity upon default is calculated as the actual loan losses (net of recoveries) on impaired loans in their respective pool during the same time frame. Retail loans are pooled into the following segments: residential mortgage,
79
Table of Contents
consumer secured and consumer unsecured loans. Pooled reserves for retail loans are calculated based solely on average net loss rates over the same 20 quarter look-back period.
Qualitative adjustment factors consider various current internal and external conditions which are allocated among loan types and take into consideration the following:
| • | Current underwriting policies, staff, and portfolio mix |
| • | Internal trends of delinquency, nonaccrual and criticized loans by segment |
| • | Risk rating accuracy, control and regulatory assessments/environment |
| • | General economic conditions — locally and nationally |
| • | Market trends impacting collateral values |
| • | A competitive environment as it could impact loan structure and underwriting |
The above factors are based on their relative standing compared to the period in which historic losses are used in core reserve estimates and current directional trends. Qualitative factors in our model can add or subtract to core reserves. Continued economic improvement and continued refinement of the quantitative model have driven an overall reduction in qualitative factors during the period.
The allowance methodology uses a loss emergence period (LEP), which is the period of time between an event that triggers the probability of a loss and the confirmation of the loss. We estimate the commercial LEP to be eight quarters as of December 31, 2015. Further, our residential mortgage and consumer LEP remained at four quarters as of December 31, 2015. We evaluate LEP quarterly for reasonableness and complete a detailed historical analysis of our commercial LEP at least annually.
The final component of the allowance for loan losses is a reserve for model estimation and complexity risk. The calculation of this reserve is generally quantitative; however, qualitative estimates of valuations and risk assessment, and methodology judgments are necessary in order to capture factors not already included in other components in our allowance for loan losses methodology. We review the qualitative estimates of valuation factors quarterly and management uses its judgment to make adjustments based on current trends.
Our loan officers and risk managers meet at least quarterly to discuss and review the conditions and risks associated with individual problem loans. In addition, various regulatory agencies periodically review our loan ratings and allowance for loan losses and the Bank’s internal loan review department performs loan reviews.
The following tables provide an analysis of the allowance for loan losses and loan balances as of and for the year ended December 31, 2015 and December 31, 2014:
| (In Thousands) | Commercial | Owner- Occupied Commercial |
Commercial Mortgages |
Construction | Residential | Consumer | Complexity Risk (1) |
Total | ||||||||||||||||||||||||
| Twelve months ended December 31, 2015 |
|
|||||||||||||||||||||||||||||||
| Allowance for loan losses |
||||||||||||||||||||||||||||||||
| Beginning balance |
$ | 12,837 | $ | 6,643 | $ | 7,266 | $ | 2,596 | $ | 2,523 | $ | 6,041 | $ | 1,520 | $ | 39,426 | ||||||||||||||||
| Charge-offs |
(6,303 | ) | (738 | ) | (1,135 | ) | (146 | ) | (548 | ) | (3,225 | ) | — | (12,095 | ) | |||||||||||||||||
| Recoveries |
301 | 77 | 222 | 185 | 226 | 957 | — | 1,968 | ||||||||||||||||||||||||
| Provision (credit) for loan losses |
4,241 | 665 | (67 | ) | 852 | 76 | 2,183 | (510 | ) | 7,440 | ||||||||||||||||||||||
| Provision for acquired loans |
80 | 23 | 201 | 34 | 4 | 8 | — | 350 | ||||||||||||||||||||||||
|
|
|
|
|
|
|
|
|
|
|
|
|
|
|
|
|
|||||||||||||||||
| Ending balance |
$ | 11,156 | $ | 6,670 | $ | 6,487 | $ | 3,521 | $ | 2,281 | $ | 5,964 | $ | 1,010 | $ | 37,089 | ||||||||||||||||
|
|
|
|
|
|
|
|
|
|
|
|
|
|
|
|
|
|||||||||||||||||
| Period-end allowance allocated to: |
||||||||||||||||||||||||||||||||
| Loans individually evaluated for impairment |
$ | 1,164 | $ | — | $ | — | $ | 211 | $ | 918 | $ | 199 | $ | — | $ | 2,492 | ||||||||||||||||
| Loans collectively evaluated for impairment |
9,988 | 6,648 | 6,384 | 3,310 | 1,360 | 5,765 | 1,010 | 34,465 | ||||||||||||||||||||||||
| Acquired loans evaluated for impairment |
4 | 22 | 103 | — | 3 | — | — | 132 | ||||||||||||||||||||||||
|
|
|
|
|
|
|
|
|
|
|
|
|
|
|
|
|
|||||||||||||||||
| Ending balance |
$ | 11,156 | $ | 6,670 | $ | 6,487 | $ | 3,521 | $ | 2,281 | $ | 5,964 | $ | 1,010 | $ | 37,089 | ||||||||||||||||
|
|
|
|
|
|
|
|
|
|
|
|
|
|
|
|
|
|||||||||||||||||
80
Table of Contents
| (In Thousands) | Commercial | Owner- Occupied Commercial |
Commercial Mortgages |
Construction | Residential | Consumer | Complexity Risk (1) |
Total | ||||||||||||||||||||||||
| Period-end loan balances evaluated for: |
||||||||||||||||||||||||||||||||
| Loans individually evaluated for impairment |
$ | 5,680 | $ | 1,090 | $ | 3,411 | $ | 1,419 | $ | 15,548 | $ | 7,664 | $ | — | $ | 34,812 | ||||||||||||||||
| Loans collectively evaluated for impairment |
930,346 | 820,911 | 869,359 | 213,801 | 166,252 | 335,323 | — | 3,335,992 | ||||||||||||||||||||||||
| Acquired nonimpaired loans |
112,586 | 53,954 | 83,415 | 27,009 | 76,929 | 17,255 | — | 371,148 | ||||||||||||||||||||||||
| Acquired impaired loans |
12,985 | 4,688 | 10,513 | 3,544 | 950 | 7 | — | 32,687 | ||||||||||||||||||||||||
|
|
|
|
|
|
|
|
|
|
|
|
|
|
|
|
|
|||||||||||||||||
| Ending balance |
$ | 1,061,597 | $ | 880,643 | $ | 966,698 | $ | 245,773 | $ | 259,679 | $ | 360,249 | $ | — | $ | 3,774,639 | (3) | |||||||||||||||
|
|
|
|
|
|
|
|
|
|
|
|
|
|
|
|
|
|||||||||||||||||
| (In Thousands) | Commercial | Owner- Occupied Commercial |
Commercial Mortgages |
Construction | Residential | Consumer | Complexity Risk (1) |
Total | ||||||||||||||||||||||||
| Twelve months ended December 31, 2014 |
||||||||||||||||||||||||||||||||
| Allowance for loan losses |
||||||||||||||||||||||||||||||||
| Beginning balance |
$ | 12,751 | $ | 7,638 | $ | 6,932 | $ | 3,326 | $ | 3,078 | $ | 6,494 | $ | 1,025 | $ | 41,244 | ||||||||||||||||
| Charge-offs |
(3,587 | ) | (1,085 | ) | (425 | ) | (88 | ) | (811 | ) | (2,855 | ) | — | (8,851 | ) | |||||||||||||||||
| Recoveries |
1,611 | 249 | 202 | 242 | 168 | 981 | — | 3,453 | ||||||||||||||||||||||||
| Provision (credit) for loan losses |
2,062 | (159 | ) | 557 | (884 | ) | 88 | 1,421 | 495 | 3,580 | ||||||||||||||||||||||
|
|
|
|
|
|
|
|
|
|
|
|
|
|
|
|
|
|||||||||||||||||
| Ending balance |
$ | 12,837 | $ | 6,643 | $ | 7,266 | $ | 2,596 | $ | 2,523 | $ | 6,041 | $ | 1,520 | $ | 39,426 | ||||||||||||||||
|
|
|
|
|
|
|
|
|
|
|
|
|
|
|
|
|
|||||||||||||||||
| Period-end allowance allocated to: |
||||||||||||||||||||||||||||||||
| Loans individually evaluated for impairment |
$ | 3,034 | $ | 609 | $ | 319 | $ | 334 | $ | 790 | $ | 231 | $ | — | $ | 5,317 | ||||||||||||||||
| Loans collectively evaluated for impairment |
9,803 | 6,034 | 6,947 | 2,262 | 1,733 | 5,810 | 1,520 | 34,109 | ||||||||||||||||||||||||
|
|
|
|
|
|
|
|
|
|
|
|
|
|
|
|
|
|||||||||||||||||
| Ending balance |
$ | 12,837 | $ | 6,643 | $ | 7,266 | $ | 2,596 | $ | 2,523 | $ | 6,041 | $ | 1,520 | $ | 39,426 | ||||||||||||||||
|
|
|
|
|
|
|
|
|
|
|
|
|
|
|
|
|
|||||||||||||||||
| Period-end loan balances evaluated for: |
||||||||||||||||||||||||||||||||
| Loans individually evaluated for impairment |
$ | 12,381 | $ | 2,474 | $ | 8,335 | $ | 1,419 | $ | 15,666 | $ | 6,376 | $ | — | $ | 46,651 | (2) | |||||||||||||||
| Loans collectively evaluated for impairment |
872,398 | 743,680 | 753,451 | 127,324 | 184,788 | 312,539 | — | 2,994,180 | ||||||||||||||||||||||||
| Acquired nonimpaired loans |
32,024 | 40,180 | 37,697 | 9,891 | 17,363 | 8,619 | 145,774 | |||||||||||||||||||||||||
| Acquired impaired loans |
3,269 | 2,264 | 5,976 | 3,863 | 512 | 9 | 15,893 | |||||||||||||||||||||||||
|
|
|
|
|
|
|
|
|
|
|
|
|
|
|
|
|
|||||||||||||||||
| Ending balance |
$ | 920,072 | $ | 788,598 | $ | 805,459 | $ | 142,497 | $ | 218,329 | $ | 327,543 | $ | — | $ | 3,202,498 | (3) | |||||||||||||||
|
|
|
|
|
|
|
|
|
|
|
|
|
|
|
|
|
|||||||||||||||||
| (1) | Represents the portion of the allowance for loan losses established to account for the inherent complexity and uncertainty of estimates. |
| (2) | The difference between this amount and nonaccruing loans represents accruing troubled debt restructured loans which are considered to be impaired loans of $13.6 million at December 31, 2015 and $22.6 million as of December 31, 2014. |
| (3) | Ending loan balances do not include deferred costs. |
Nonaccrual and Past Due Loans
Nonaccruing loans are those loans on which the accrual of interest has ceased. We discontinue accrual of interest on originated loans after payments become more than 90 days past due or earlier if we do not expect the full collection of principal and interest in accordance with the terms of the loan agreement. Interest accrued but not collected at the date a loan is placed on nonaccrual status is reversed and charged against interest income. In addition, the accretion of net deferred loan fees is suspended when a loan is placed on nonaccrual status. Subsequent cash receipts are applied either to the outstanding principal balance or recorded as interest income, depending on our assessment of the ultimate collectability of principal and interest. Loans greater than 90 days past due and still accruing are defined as loans contractually past due 90 days or more as to principal or interest payments, but remain in accrual status because they are considered well secured and in process of collection.
81
Table of Contents
The following tables show our nonaccrual and past due loans at the dates indicated:
| At Dec. 31, 2015 |
30–59 Days Past Due and Still Accruing |
60–89 Days Past Due and Still Accruing |
Greater Than 90 Days Past Due and Still Accruing |
Total Past Due And Still Accruing |
Accruing Current Balances |
Acquired Impaired Loans |
Nonaccrual Loans |
Total Loans |
||||||||||||||||||||||||
| (In Thousands) | ||||||||||||||||||||||||||||||||
| Commercial |
$ | 1,686 | $ | 270 | $ | 12,355 | $ | 14,311 | $ | 1,028,973 | $ | 12,985 | $ | 5,328 | $ | 1,061,597 | ||||||||||||||||
| Owner-occupied commercial |
713 | 217 | 4,886 | 5,816 | 869,048 | 4,688 | 1,091 | 880,643 | ||||||||||||||||||||||||
| Commercial mortgages |
141 | 4 | 288 | 433 | 952,426 | 10,513 | 3,326 | 966,698 | ||||||||||||||||||||||||
| Construction |
— | — | — | — | 242,229 | 3,544 | — | 245,773 | ||||||||||||||||||||||||
| Residential |
5,263 | 621 | 251 | 6,135 | 245,307 | 950 | 7,287 | 259,679 | ||||||||||||||||||||||||
| Consumer |
1,222 | 36 | 252 | 1,510 | 354,599 | 7 | 4,133 | 360,249 | ||||||||||||||||||||||||
|
|
|
|
|
|
|
|
|
|
|
|
|
|
|
|
|
|||||||||||||||||
| Total (1) |
$ | 9,025 | $ | 1,148 | $ | 18,032 | $ | 28,205 | $ | 3,692,582 | $ | 32,687 | $ | 21,165 | $ | 3,774,639 | ||||||||||||||||
|
|
|
|
|
|
|
|
|
|
|
|
|
|
|
|
|
|||||||||||||||||
| % of Total Loans |
0.24 | % | 0.03 | % | 0.48 | % | 0.75 | % | 97.83 | % | 0.86 | % | 0.56 | % | 100.00 | % | ||||||||||||||||
|
|
|
|
|
|
|
|
|
|
|
|
|
|
|
|
|
|||||||||||||||||
| (1) | Balances in table above includes $371.1 million in acquired non-impaired loans. |
| At Dec. 31, 2014 |
30–59 Days Past Due and Still Accruing |
60–89 Days Past Due and Still Accruing |
Greater Than 90 Days Past Due and Still Accruing |
Total Past Due And Still Accruing |
Accruing Current Balances |
Acquired Impaired Loans |
Nonaccrual Loans |
Total Loans | ||||||||||||||||||||||||
| (In Thousands) | ||||||||||||||||||||||||||||||||
| Commercial |
$ | 715 | $ | — | $ | — | $ | 715 | $ | 913,382 | $ | 3,269 | $ | 2,706 | $ | 920,072 | ||||||||||||||||
| Owner-occupied commercial |
393 | — | — | 393 | 783,466 | 2,264 | 2,475 | 788,598 | ||||||||||||||||||||||||
| Commercial mortgages |
203 | — | — | 203 | 791,035 | 5,976 | 8,245 | 805,459 | ||||||||||||||||||||||||
| Construction |
— | — | — | — | 138,634 | 3,863 | — | 142,497 | ||||||||||||||||||||||||
| Residential |
3,879 | 604 | — | 4,483 | 206,266 | 512 | 7,068 | 218,329 | ||||||||||||||||||||||||
| Consumer |
1,241 | 342 | 4 | 1,587 | 322,390 | 9 | 3,557 | 327,543 | ||||||||||||||||||||||||
|
|
|
|
|
|
|
|
|
|
|
|
|
|
|
|
|
|||||||||||||||||
| Total (1) |
$ | 6,431 | $ | 946 | $ | 4 | $ | 7,381 | $ | 3,155,173 | $ | 15,893 | $ | 24,051 | $ | 3,202,498 | ||||||||||||||||
|
|
|
|
|
|
|
|
|
|
|
|
|
|
|
|
|
|||||||||||||||||
| % of Total Loans |
0.20 | % | 0.03 | % | 0.00 | % | 0.23 | % | 98.52 | % | 0.50 | % | 0.75 | % | 100.00 | % | ||||||||||||||||
|
|
|
|
|
|
|
|
|
|
|
|
|
|
|
|
|
|||||||||||||||||
| (1) | Balances in table above includes $145.8 million in acquired non-impaired loans. |
Impaired Loans
Loans for which it is probable we will not collect all principal and interest due according to contractual terms, which is assessed based on the credit characteristics of the loan and/or payment status, are measured for impairment in accordance with the provisions of SAB 102 and FASB ASC 310, Receivables (ASC 310). The amount of impairment is required to be measured using one of three methods: (1) the present value of expected future cash flows discounted at the loan’s effective interest rate; (2) the fair value of collateral, if the loan is collateral dependent or (3) the loan’s observable market price. If the measure of the impaired loan is less than the recorded investment in the loan, a related allowance is allocated for the impairment.
The following tables provide an analysis of our impaired loans at December 31, 2015 and December 31, 2014:
| 2015 (In Thousands) |
Ending Loan Balances |
Loans with No Related Reserve (1) |
Loan with Related Reserve |
Related Reserve |
Contractual Principal Balance |
Average Loan Balances |
||||||||||||||||||
| Commercial |
$ | 6,137 | $ | 951 | $ | 5,186 | $ | 1,168 | $ | 20,206 | $ | 9,391 | ||||||||||||
| Owner-occupied commercial |
2,127 | 1,090 | 1,037 | 22 | 2,947 | 2,111 | ||||||||||||||||||
| Commercial mortgages |
4,652 | 3,410 | 1,242 | 103 | 11,826 | 7,540 | ||||||||||||||||||
| Construction |
1,419 | — | 1,419 | 211 | 1,419 | 1,448 | ||||||||||||||||||
| Residential |
15,710 | 9,034 | 6,676 | 920 | 18,655 | 15,264 | ||||||||||||||||||
| Consumer |
7,665 | 6,498 | 1,167 | 200 | 9,353 | 6,801 | ||||||||||||||||||
|
|
|
|
|
|
|
|
|
|
|
|
|
|||||||||||||
| Total (2) |
$ | 37,710 | $ | 20,983 | $ | 16,727 | $ | 2,624 | $ | 64,406 | $ | 42,555 | ||||||||||||
|
|
|
|
|
|
|
|
|
|
|
|
|
|||||||||||||
82
Table of Contents
| 2014 (In Thousands) |
Ending Loan Balances |
Loans with No Related Reserve (1) |
Loan with Related Reserve |
Related Reserve |
Contractual Principal Balance |
Average Loan Balances |
||||||||||||||||||
| Commercial |
$ | 12,381 | $ | 580 | $ | 11,801 | $ | 3,034 | $ | 20,924 | $ | 5,952 | ||||||||||||
| Owner-occupied commercial |
2,474 | 1,865 | 609 | 609 | 3,708 | 4,461 | ||||||||||||||||||
| Commercial mortgages |
8,335 | 4,732 | 3,603 | 319 | 14,383 | 11,005 | ||||||||||||||||||
| Construction |
1,419 | — | 1,419 | 334 | 1,419 | 1,013 | ||||||||||||||||||
| Residential |
15,666 | 7,068 | 8,598 | 790 | 18,967 | 17,296 | ||||||||||||||||||
| Consumer |
6,376 | 3,557 | 2,819 | 231 | 7,162 | 5,902 | ||||||||||||||||||
|
|
|
|
|
|
|
|
|
|
|
|
|
|||||||||||||
| Total |
$ | 46,651 | $ | 17,802 | $ | 28,849 | $ | 5,317 | $ | 66,563 | $ | 45,629 | ||||||||||||
|
|
|
|
|
|
|
|
|
|
|
|
|
|||||||||||||
| (1) | Reflects loan balances at or written down to their remaining book balance. |
| (2) | The above includes acquired impaired loans totaling $2.9 million in the ending loan balance and $3.5 million in the contractual principal balance. |
Interest income of $1.6 million and $1.8 million was recognized on impaired loans during 2015 and 2014 respectively.
As of December 31, 2015, there were 32 residential loans and 3 commercial loans in the process of foreclosure. The total outstanding balance on the loans was $5.0 million and $675,000, respectively. As of December 31, 2014, there were 36 residential loans and 12 commercial loans in the process of foreclosure. The total outstanding balance on the loans was $4.4 million and $1.1 million, respectively.
Reserves On Acquired Nonimpaired Loans
In accordance with FASB ASC 310, Receivables, loans acquired by the Bank through its merger with FNBW and Alliance are required to be reflected on the balance sheet at their fair values as opposed to their book values on the date of acquisition. Therefore, on the date of acquisition establishing an allowance for acquired loans is prohibited. After the acquisition date the bank performs a separate allowance analysis on a quarterly basis to determine if an allowance for loan loss is necessary. Should the credit risk calculated exceed the purchased loan portfolio’s remaining credit mark, additional reserves will be added to the Bank’s allowance. When a purchased loan becomes impaired after its acquisition, it is evaluated as part of the Bank’s reserve analysis and a specific reserve is established to be included in the Bank’s allowance.
Credit Quality Indicators
Below is a description of each of our risk ratings for all commercial loans:
Pass. These borrowers presently show no current or potential problems and their loans are considered fully collectible.
Special Mention. Borrowers have potential weaknesses that deserve management’s close attention. Borrowers in this category may be experiencing adverse operating trends, for example, declining revenues or margins, high leverage, tight liquidity, or increasing inventory without increasing sales. These adverse trends can have a potential negative effect on the borrower’s repayment capacity. These assets are not adversely classified and do not expose the Bank to significant risk that would warrant a more severe rating. Borrowers in this category may also be experiencing significant management problems, pending litigation, or other structural credit weaknesses.
Substandard. Borrowers have well-defined weaknesses that require extensive oversight by management. Borrowers in this category may exhibit one or more of the following: inadequate debt service coverage, unprofitable operations, insufficient liquidity, high leverage, and weak or inadequate capitalization. Relationships in this category are not adequately protected by the sound financial worth and paying capacity of the obligor or the collateral pledged on the loan, if any. The distinct possibility exists that the Bank will sustain some loss if the deficiencies are not corrected.
Doubtful. Borrowers have well-defined weaknesses inherent in the Substandard category with the added characteristic that the possibility of loss is extremely high. Current circumstances in the credit relationship make collection or liquidation in
83
Table of Contents
full highly questionable. A doubtful asset has some pending event that may strengthen the asset that defers the loss classification. Such impending events include: perfecting liens on additional collateral, obtaining collateral valuations, an acquisition or liquidation preceding, proposed merger, or refinancing plan.
Loss. Borrowers are uncollectible or of such negligible value that continuance as a bankable asset is not supportable. This classification does not mean that the asset has absolutely no recovery or salvage value, but rather that it is not practical to defer writing off this asset even though partial recovery may be recognized sometime in the future.
Residential and Consumer Loans
The residential and consumer loan portfolios are monitored on an ongoing basis using delinquency information and loan type as credit quality indicators. These credit quality indicators are assessed in the aggregate in these relatively homogeneous portfolios. Loans greater than 90 days past due are generally considered nonperforming and placed on nonaccrual status.
The following tables provide an analysis of loans by portfolio segment based on the credit quality indicators used to determine the Allowance at December 31:
Commercial Credit Exposure
| Total Commercial(1) | ||||||||||||||||||||||||||||||||||||||||||||||||
| Commercial | Owner-Occupied Commercial |
Commercial Mortgages |
Construction | 2015 | 2014 | |||||||||||||||||||||||||||||||||||||||||||
| (In Thousands) | 2015 | 2014 | 2015 | 2014 | 2015 | 2014 | 2015 | 2014 | Amount | % | Amount | % | ||||||||||||||||||||||||||||||||||||
| Risk Rating: | ||||||||||||||||||||||||||||||||||||||||||||||||
| Special mention |
$ | 5,620 | $ | 4,744 | $ | 9,535 | $ | 6,989 | $ | 12,323 | $ | 9,065 | $ | — | $ | — | $ | 27,478 | $ | 20,798 | ||||||||||||||||||||||||||||
| Substandard: |
||||||||||||||||||||||||||||||||||||||||||||||||
| Accrual |
33,883 | 42,377 | 22,901 | 14,436 | 2,547 | 9,167 | 8,296 | 1,085 | 67,627 | 67,065 | ||||||||||||||||||||||||||||||||||||||
| Nonaccrual |
4,164 | 1,225 | 1,090 | 1,865 | 3,326 | 7,927 | — | — | 8,580 | 11,017 | ||||||||||||||||||||||||||||||||||||||
| Doubtful/nonaccrual |
1,164 | 3,034 | — | 609 | — | 319 | — | 334 | 1,164 | 4,296 | ||||||||||||||||||||||||||||||||||||||
|
|
|
|
|
|
|
|
|
|
|
|
|
|
|
|
|
|
|
|
|
|||||||||||||||||||||||||||||
| Total special mention and substandard |
44,831 | 51,380 | 33,526 | 23,899 | 18,196 | 26,478 | 8,296 | 1,419 | 104,849 | 3 | % | 103,176 | 4 | % | ||||||||||||||||||||||||||||||||||
| Acquired impaired loans |
12,985 | 3,269 | 4,688 | 2,264 | 10,513 | 5,976 | 3,544 | 3,863 | 31,730 | 1 | % | 15,372 | 1 | % | ||||||||||||||||||||||||||||||||||
| Pass |
1,003,781 | 865,423 | 842,429 | 762,435 | 937,989 | 773,005 | 233,933 | 137,215 | 3,018,132 | 96 | % | 2,538,078 | 95 | % | ||||||||||||||||||||||||||||||||||
|
|
|
|
|
|
|
|
|
|
|
|
|
|
|
|
|
|
|
|
|
|
|
|
|
|||||||||||||||||||||||||
| Total |
$ | 1,061,597 | $ | 920,072 | $ | 880,643 | $ | 788,598 | $ | 966,698 | $ | 805,459 | $ | 245,773 | $ | 142,497 | $ | 3,154,711 | 100 | % | $ | 2,656,626 | 100 | % | ||||||||||||||||||||||||
|
|
|
|
|
|
|
|
|
|
|
|
|
|
|
|
|
|
|
|
|
|
|
|
|
|||||||||||||||||||||||||
| (1) | Table includes $ 277.0 million in acquired non-impaired loans at December 31, 2015 and $119.8 million at December 31, 2014. |
Consumer Credit Exposure
| Total Residential and Consumer(2) | ||||||||||||||||||||||||||||||||
| Residential | Consumer | 2015 | 2014 | |||||||||||||||||||||||||||||
| (In Thousands) | 2015 | 2014 | 2015 | 2014 | Amount | Percent | Amount | Percent | ||||||||||||||||||||||||
| Nonperforming(1) |
$ | 15,548 | $ | 15,666 | $ | 7,664 | $ | 6,376 | $ | 23,212 | 4 | % | $ | 22,042 | 4 | % | ||||||||||||||||
| Acquired impaired loans |
950 | 512 | 7 | 9 | 957 | — | % | 521 | — | % | ||||||||||||||||||||||
| Performing |
243,181 | 202,151 | 352,578 | 321,158 | 595,759 | 96 | % | 523,309 | 96 | % | ||||||||||||||||||||||
|
|
|
|
|
|
|
|
|
|
|
|
|
|
|
|
|
|||||||||||||||||
| Total |
$ | 259,679 | $ | 218,329 | $ | 360,249 | $ | 327,543 | $ | 619,928 | 100 | % | $ | 545,872 | 100 | % | ||||||||||||||||
|
|
|
|
|
|
|
|
|
|
|
|
|
|
|
|
|
|||||||||||||||||
| (1) | Includes $13.6 million as of December 31, 2015 and $11.4 million as of December 31, 2014 of troubled debt restructured mortgages and home equity installment loans that are performing in accordance with the loans modified terms and are accruing interest. |
| (2) | Total includes acquired non-impaired loans of $94.2 million at December 31, 2015 and $26.0 million at December 31, 2014. |
Troubled Debt Restructurings (TDR)
The balance of TDRs at December 31, 2015 and December 31, 2014 was $24.6 million and $36.2 million, respectively. The balances at December 31, 2015 include approximately $11.0 million of TDRs in nonaccrual status and $13.6 million of TDRs in accrual status compared to $13.6 million of TDRs in nonaccrual status and $22.6 million of
84
Table of Contents
TDRs in accrual status at December 31, 2014. Approximately $2.1 million and $4.2 million in related reserves have been established for these loans at December 31, 2015 and December 31, 2014, respectively.
A modification is classified as a TDR if both of the following exist: (1) the borrower is experiencing financial difficulty and (2) the Bank has granted a concession to the borrower. Many aspects of the borrower’s financial situation are assessed when determining whether they are experiencing financial difficulty. Concessions may include the reduction of an interest rate at a rate lower than current market rate for a new loan with similar risk, extension of the maturity date, reduction of accrued interest, or principal forgiveness. The assessments of whether a borrower is experiencing (or is likely to experience) financial difficulty and whether a concession has been granted is subjective in nature and management’s judgment is required when determining whether a modification is a TDR.
During 2015, the terms of 33 loans were modified in TDRs. Twenty-two modifications were for consumer loans in which nine were discharged bankruptcies, seven were maturity date extensions, five were HELOC conversion, and one was a rate reduction. Ten were residential mortgages in which three were discharged bankruptcies, three were maturity date extensions, two were forbearance agreements, one was a rate reduction, and one was a credit exception for refinance. One commercial loan received a maturity date extension. Our concessions on restructured loans typically consist of forbearance agreements, reduction in interest rates or extensions of maturities. Principal balances are generally not forgiven by us when a loan is modified as a TDR. Nonaccruing restructured loans remain in nonaccrual status until there has been a period of sustained repayment performance, typically six months, and repayment is reasonably assured.
The following table presents loans identified as TDRs during the twelve months ended December 31, 2015 and December 31, 2014:
| (In Thousands) |
Twelve Months Ended December 31, 2015 |
Twelve Months Ended December 31, 2014 |
||||||
| Commercial |
$ | — | $ | 9,356 | ||||
| Owner Occupied Commercial |
577 | — | ||||||
| Commercial mortgages |
— | 3,430 | ||||||
| Construction |
— | 1,419 | ||||||
| Residential |
895 | 2,062 | ||||||
| Consumer |
1,615 | 1,612 | ||||||
|
|
|
|
|
|||||
| $ | 3,087 | $ | 17,879 | |||||
|
|
|
|
|
|||||
The TDRs set forth in the table above increased our allowance for loan losses by $18,000 through allocation of a related reserve, and resulted in charge-offs of $166,000 during the twelve months ended December 31, 2015. For the twelve months ended December 31, 2014, the TDRs set forth in the table above increased our allowance for loan losses by $2.2 million through allocation of a related reserve, and resulted in charge-offs of $54,000.
7. REVERSE MORTGAGE LOANS
Reverse mortgage loans are contracts in which a homeowner borrows against the equity in his/her home and receives cash in one lump sum payment, a line of credit, fixed monthly payments for either a specific term or for as long as the homeowner lives in the home, or a combination of these options. Since reverse mortgages are nonrecourse obligations, the loan repayments are generally limited to the sale proceeds of the borrower’s residence and the mortgage balance consists of cash advanced, interest compounded over the life of the loan and some may include a premium which represents a portion of the shared appreciation in the home’s value, if any, or a percentage of the value of the residence.
In July 2011, we purchased 100% of SASCO 2002-RM1’s Class “O” certificates, representing equity ownership of a reverse mortgage securitization trust, for $2.5 million. This securitization was created in 2002 through the purchase of reverse mortgage loans owned by us, as well as an additional lender. As part of this securitization we retained the BBB rated tranche of this securitization and held this instrument as a trading asset.
85
Table of Contents
During the third quarter of 2013, we obtained the right to execute a clean-up call on the underlying collateral. This event led us to consolidate the assets and liabilities of the securitization trust, SASCO 2002 RM-1, on our Consolidated Statement of Condition in accordance with ASC 810, Consolidation as of December 31, 2013. As a result of consolidation of the reverse mortgage trust in 2013, a DTA was recorded at that time. However, because the reverse mortgage trust was not able to be consolidated for income tax purposes, a full valuation allowance was also recorded at that time on the DTA due to the uncertainty of realizing this benefit. On January 27, 2014, WSFS completed the legal call of the reverse mortgage trust bonds and the redemption of the trust’s preferred stockholders, eliminating this uncertainty since the reverse mortgage trust’s assets have now been combined with the Bank’s for tax purposes. As a result, WSFS removed the valuation allowance, and recorded a tax benefit of approximately $6.7 million during 2014.
Our investment in reverse mortgages totaled $24.3 million at December 31, 2015. The portfolio consists of 93 loans with an average borrowers’ age of 94 years old and there is currently significant overcollateralization in the portfolio, as the realizable collateral value (the lower of collectible principal and interest, or appraised value and annual broker price opinion of the home) of $46.8 million exceeds the outstanding book balance at December 31, 2015. Broker price opinions are updated at least annually. Additional broker price opinions are obtained when our quarterly review indicates that a home’s value has increased or decreased by at least 50% during any given period.
The carrying value of the reverse mortgages is calculated using a proprietary model that uses the income approach as described in FASB ASC 820-10, Fair Value Measurements and Disclosure (ASC 820-10). The model is a present value cash flow model which describes the components of a present value measurement. The model incorporates the projected cash flows of the loans (includes payouts and collections) and then discounts these cash flows using the effective yield required on the life of the portfolio to reduce the net investment to zero at the time the final reverse mortgage contract is liquidated. The inputs to the model reflect our expectations of what other market participants would use in pricing this asset in a current transaction and therefore is consistent with ASC 820 that requires an exit price methodology for determining fair value.
To determine the carrying value of these reverse mortgages as of December 31, 2015, we used the proprietary model described above and actual cash flow information to estimate future cash flows. There are three main drivers of cash flows; 1) move-out rates, 2) house price appreciation (HPA) forecasts, and 3) internal rate of return.
| 1) | Move-out rates – We used the actuarial estimates of contract termination provided in the United States Mortality Rates Period Life Table, 2010, published by the Office of the Actuary – Social Security in 2014, adjusted for expected prepayments and relocations which we adopted during 2014. |
| 2) | House Price Appreciation – We utilize house price forecasts from various market sources. Based on this information, we forecasted a 2.5% increase in housing prices during 2016 and a 2.0% increase in the following year and thereafter. We believe this forecast continues to be appropriate given the nature of reverse mortgage collateral and historical under-performance to the broad housing market. Annually, during the fourth quarter, current collateral values are updated through broker price opinions. |
| 3) | Internal Rate of Return – As of December 31, 2015, the internal rate of return (IRR) of 19.06% was the effective yield required on the life of the portfolio to reduce the net investment to zero at the time the final reverse mortgage contract is liquidated. |
As of December 31, 2015, the Company’s actuarially estimated cash payments to reverse mortgagors are as follows:
| Year Ending | ||||
| 2016 |
$ | 594 | ||
| 2017 |
475 | |||
| 2018 |
376 | |||
| 2019 |
294 | |||
| 2020 |
228 | |||
| Years 2021 – 2025 |
529 | |||
| Years 2026 – 2030 |
106 | |||
| Years 2031 – 2035 |
15 | |||
| Thereafter |
2 | |||
|
|
|
|||
| Total |
$ | 2,619 | ||
|
|
|
|||
86
Table of Contents
| This | table does not take into consideration cash inflow including payments from mortgagors or payoffs based on contractual terms. |
The amount of the contract value that would be forfeited if we were not to make cash payments to reverse mortgagors in the future is $5.4 million.
The future cash flows depend on the HPA assumptions. If the future changes in collateral value were assumed to be zero, income would decrease by $731,000 for the quarter ended December 31, 2015 with an IRR of 18.07%. If the future changes in collateral value were assumed to be reduced by 1%, income would decrease by $337,000 with an IRR of 18.60%.
The net present value of the projected cash flows depends on the IRR used. If the IRR increased by 1%, the net present value would increase by $876,000. If the IRR decreased by 1%, the net present value would decrease by $855,000.
8. PREMISES AND EQUIPMENT
Land, office buildings, leasehold improvements and furniture and equipment, at cost, are summarized by major classifications:
| December 31, |
2015 | 2014 | ||||||
| (In Thousands) |
||||||||
| Land |
$ | 2,325 | $ | 2,052 | ||||
| Buildings |
6,878 | 4,791 | ||||||
| Leasehold improvements |
37,123 | 35,925 | ||||||
| Furniture and equipment |
31,824 | 24,644 | ||||||
|
|
|
|
|
|||||
| 78,150 | 67,412 | |||||||
| Less: |
||||||||
| Accumulated depreciation |
38,581 | 32,338 | ||||||
|
|
|
|
|
|||||
| $ | 39,569 | $ | 35,074 | |||||
|
|
|
|
|
|||||
Depreciation expense is computed on a straight-line basis over the estimated useful life of the asset. Leasehold improvements are amortized over the term of the lease or the estimated useful life, whichever is shorter. In general, computer equipment, furniture and equipment and building renovations are expensed over three, five and ten years, respectively.
We occupy certain premises including some with renewal options and operate certain equipment under noncancelable leases with terms ranging primarily from 1 to 25 years. These leases are accounted for as operating leases. Accordingly, lease costs are expensed as incurred in accordance with FASB ASC 840-20 Operating Leases. Rent expense was $9.9 million in 2015, $9.5 million in 2014 and $9.1 million in 2013. Future minimum cash payments under these leases at December 31, 2015 are as follows:
| (In Thousands) |
||||
| 2016 |
$ | 9,178 | ||
| 2017 |
8,971 | |||
| 2018 |
8,931 | |||
| 2019 |
8,923 | |||
| 2020 |
8,968 | |||
| Thereafter |
158,050 | |||
|
|
|
|||
| Total future minimum lease payments |
$ | 203,021 | ||
|
|
|
|||
87
Table of Contents
9. GOODWILL AND INTANGIBLE ASSETS
In accordance with FASB ASC 805, Business Combinations (ASC 805) and FASB ASC 350, Intangibles—Goodwill and Other (ASC 350), all assets and liabilities acquired in purchase acquisitions, including goodwill, indefinite-lived intangibles and other intangibles are recorded at fair value.
The fair value of acquired assets and liabilities, including the resulting goodwill, was based either on quoted market prices or provided by other third-party sources, when available. When third-party information was not available we made good-faith estimates primarily through the use of internal cash flow modeling techniques. The assumptions used in the cash flow modeling are subjective and susceptible to significant changes.
Goodwill and other intangible assets with indefinite useful lives are tested for impairment at least annually and charged to results of operations in periods in which the recorded value is more than the estimated fair value. Intangible assets that have finite useful lives will continue to be amortized over their useful lives and are periodically evaluated for impairment. Goodwill totaled $85.2 million at December 31, 2015 and $48.7 million at December 31, 2014. The majority of this goodwill, or $80.1 million, is in the WSFS Bank segment and is the result of a branch acquisition in 2008, the acquisition of Christiana Bank and Trust (CB&T) during 2010, the purchase of Array and Arrow during 2013, the purchase of FNBW in 2014, and the purchase of Alliance Bank in 2015. The Trust and Wealth Management segment also recorded goodwill as a result of the acquisition of CB&T.
ASC 350, Intangibles—Goodwill and Other (Topic 350), states that an entity is not required to calculate the fair value of a reporting unit unless the entity determines that it is more likely than not that its fair value is less than its carrying amount. Therefore, before the first step of the existing guidance, the entity has the option to first assess qualitative factors to determine whether the existence of events or circumstances leads to a determination that the fair value of goodwill is less than carrying value. The qualitative assessment includes adverse events or circumstances identified that could negatively affect the reporting units’ fair value as well as positive and mitigating events. If, after assessing the totality of events or circumstances, an entity determines it is not more likely than not that the fair value of a reporting unit is less than its carrying amount, then performing the two-step process is unnecessary. The entity has the option to bypass the qualitative assessment step for any reporting unit in any period and proceed directly to the first step of the existing two-step process. The entity can resume performing the qualitative assessment in any subsequent period.
When required, the goodwill impairment test involves a two-step process. The first test is done by comparing the reporting unit’s aggregate fair value to its carrying value. Absent other indicators of impairment, if the aggregate fair value exceeds the carrying value, goodwill is not considered impaired and no additional analysis is necessary. If the carrying value of the reporting unit were to exceed the aggregate fair value, a second test would be performed to measure the amount of impairment loss, if any. To measure any impairment loss, the implied fair value would be determined in the same manner as if the reporting unit were being acquired in a business combination. If the implied fair value of goodwill is less than the recorded goodwill, an impairment charge would be recorded for the difference.
Fair value may be determined using market prices, comparison to similar assets, market multiples, discounted cash flow analyses and other variables. Estimated cash flows extend five years into the future and, by their nature, are difficult to estimate over such an extended period of time. Factors that may significantly affect estimates include, but are not limited to, balance sheet growth assumptions, credit losses in our investment and loan portfolios, competitive pressures in our market area, changes in customer base and customer product preferences, changes in revenue growth trends, cost structure, changes in discount rates, conditions in the banking sector, and general economic variables.
In accordance with ASU 2015-16 we elected to change our measurement period from December 31 to October 31. As of October 31, 2015, we completed the step one test of the analysis to determine potential goodwill impairment of the WSFS Bank and Trust and Wealth Management segments. The valuation incorporated a market-based analysis and indicated the fair values of our WSFS Bank and Trust and Wealth Management segments were above their carrying amounts. Therefore, in accordance with FASB ASC 350-20-35-6, the second step of the analysis was not required.
As of December 31, 2015, we had three operating segments, WSFS Bank, Cash Connect, and Trust & Wealth Management. Our operating segments may contain one or more reporting units depending on economic characteristics,
88
Table of Contents
products and customers. At the time we acquire a business, we allocate goodwill to the reporting unit where it will reside based on its relative fair value. Should we have significant business reorganization, we may reallocate the goodwill. For additional information on management reporting, see Note 20 to the Consolidated Financial Statements and Note 2 for additional information on the Goodwill that was recorded during 2015.
The following table shows the allocation of goodwill to our reportable operating segments for purposes of goodwill impairment testing:
| (In Thousands) |
WSFS Bank |
Cash Connect |
Wealth Management |
Consolidated Company |
||||||||||||
| December 31, 2013 |
$ | 27,101 | $ | — | $ | 5,134 | $ | 32,235 | ||||||||
| Changes in Goodwill |
46 | — | — | 46 | ||||||||||||
| Goodwill from business combinations |
16,370 | — | — | 16,370 | ||||||||||||
|
|
|
|
|
|
|
|
|
|||||||||
| December 31, 2014 |
43,517 | — | 5,134 | 48,651 | ||||||||||||
| Changes in Goodwill |
136 | — | — | 136 | ||||||||||||
| Goodwill from business combinations |
36,425 | — | — | 36,425 | ||||||||||||
|
|
|
|
|
|
|
|
|
|||||||||
| December 31, 2015 |
$ | 80,078 | $ | — | $ | 5,134 | $ | 85,212 | ||||||||
|
|
|
|
|
|
|
|
|
|||||||||
The adjustments made to goodwill during 2015, reflect a change in the fair value of the loans acquired, accrued expenses, bank-owned life insurance, computer equipment, deferred federal income taxes, and OREO properties during the measurement period for the FNBW acquisition. The fair value of acquired assets and liabilities from FNBW is now considered final.
FASB ASC 350, also requires that an acquired intangible asset be separately recognized if the benefit of the intangible asset is obtained through contractual or other legal rights, or if the asset can be sold, transferred, licensed, rented or exchanged, regardless of the acquirer’s intent to do so. During 2015, we recorded intangible assets of $3.1 million due to the acquisition of Alliance Bank. During 2014, we recorded intangible assets of $3.2 million due to the acquisition of FNBW. See Note 2 to the Consolidated Financial Statements for additional information. The following table summarizes other intangible assets:
| (In Thousands) |
Gross Intangible Assets |
Accumulated Amortization |
Net Intangible Assets |
|||||||||
| December 31, 2015 |
||||||||||||
| Core deposits |
$ | 10,246 | $ | (4,512 | ) | $ | 5,734 | |||||
| CB&T intangible |
3,142 | (1,181 | ) | 1,961 | ||||||||
| Array and Arrow intangibles |
2,353 | (847 | ) | 1,506 | ||||||||
| Mortgage servicing rights |
1,430 | (949 | ) | 481 | ||||||||
| Alliance intangible |
511 | (110 | ) | 401 | ||||||||
|
|
|
|
|
|
|
|||||||
| Total other intangible assets |
$ | 17,682 | $ | (7,599 | ) | $ | 10,083 | |||||
|
|
|
|
|
|
|
|||||||
| December 31, 2014 |
||||||||||||
| Core deposits |
$ | 7,610 | $ | (3,321 | ) | $ | 4,289 | |||||
| CB&T intangible |
3,142 | (985 | ) | 2,157 | ||||||||
| Array and Arrow intangibles |
2,353 | (497 | ) | 1,856 | ||||||||
| Mortgage servicing rights |
1,455 | (815 | ) | 640 | ||||||||
|
|
|
|
|
|
|
|||||||
| Total other intangible assets |
$ | 14,560 | $ | (5,618 | ) | $ | 8,942 | |||||
|
|
|
|
|
|
|
|||||||
Core deposits are amortized over their expected lives using the present value of the benefit of the core deposits and either accelerated or straight-line methods of amortization. We recognized amortization expense on other intangible assets of $2.0 million, $1.3 million, and $1.0 million for the years ended December 31, 2015, 2014, and 2013, respectively.
89
Table of Contents
The following presents the estimated amortization expense of intangibles:
| (In Thousands) |
Amortization of Intangibles |
|||
| 2016 |
$ | 2,010 | ||
| 2017 |
1,549 | |||
| 2018 |
1,400 | |||
| 2019 |
1,238 | |||
| 2020 |
992 | |||
| Thereafter |
2,894 | |||
|
|
|
|||
| Total |
$ | 10,083 | ||
|
|
|
|||
At December 31, 2015, goodwill and other intangible assets were not considered impaired. Changing economic conditions that may adversely affect our performance and stock price could result in impairment, which could adversely affect earnings in the future.
10. DEPOSITS
The following is a summary of deposits by category, including a summary of the remaining time to maturity for time deposits:
| December 31, |
2015 | 2014 | ||||||
| (In Thousands) | ||||||||
| Money market and demand: |
||||||||
| Noninterest-bearing demand |
$ | 958,238 | $ | 804,678 | ||||
| Interest-bearing demand |
784,619 | 688,370 | ||||||
| Money market |
1,090,050 | 1,066,224 | ||||||
|
|
|
|
|
|||||
| Total money market and demand |
2,832,907 | 2,559,272 | ||||||
|
|
|
|
|
|||||
| Savings |
439,918 | 402,032 | ||||||
|
|
|
|
|
|||||
| Customer certificates of deposit by maturity: |
||||||||
| Less than one year |
200,893 | 188,922 | ||||||
| One year to two years |
79,760 | 36,108 | ||||||
| Two years to three years |
25,256 | 16,741 | ||||||
| Three years to four years |
9,642 | 6,468 | ||||||
| Over four years |
17,449 | 5,063 | ||||||
|
|
|
|
|
|||||
| Total customer time certificates |
333,000 | 253,302 | ||||||
|
|
|
|
|
|||||
| Jumbo certificates of deposit (greater than $100,000), by maturity: |
||||||||
| Less than one year |
180,753 | 206,370 | ||||||
| One year to two years |
44,776 | 23,621 | ||||||
| Two years to three years |
15,256 | 10,117 | ||||||
| Three years to four years |
6,685 | 3,896 | ||||||
| Over four years |
6,541 | 3,667 | ||||||
|
|
|
|
|
|||||
| Total jumbo certificates of deposit |
254,011 | 247,671 | ||||||
|
|
|
|
|
|||||
| Total customer deposits |
3,859,836 | 3,462,277 | ||||||
|
|
|
|
|
|||||
| Brokered deposits less than one year |
156,730 | 186,958 | ||||||
|
|
|
|
|
|||||
| Total deposits |
$ | 4,016,566 | $ | 3,649,235 | ||||
|
|
|
|
|
90
Table of Contents
Interest expense on deposits by category follows:
| (In Thousands) |
||||||||||||
| Year Ended December 31, |
2015 | 2014 | 2013 | |||||||||
| Interest-bearing demand |
$ | 666 | $ | 611 | $ | 529 | ||||||
| Money market |
2,466 | 1,478 | 1,123 | |||||||||
| Savings |
289 | 234 | 217 | |||||||||
| Time deposits |
3,057 | 4,060 | 4,712 | |||||||||
|
|
|
|
|
|
|
|||||||
| Total customer interest expense |
6,478 | 6,383 | 6,581 | |||||||||
|
|
|
|
|
|
|
|||||||
| Brokered deposits |
687 | 768 | 599 | |||||||||
|
|
|
|
|
|
|
|||||||
| Total interest expense on deposits |
$ | 7,165 | $ | 7,151 | $ | 7,180 | ||||||
|
|
|
|
|
|
|
|||||||
11. BORROWED FUNDS
The following is a summary of borrowed funds by type:
| At or for the twelve months ended: | Balance at End of Period |
Weighted Average Interest Rate |
Maximum Outstanding at Month End During the Period |
Average Amount Outstanding During the Year |
Weighted Average Interest Rate During the Year |
|||||||||||||||
| December 31, 2015 |
(Dollars in Thousands) | |||||||||||||||||||
| FHLB advances |
$ | 669,514 | 0.50 | % | $ | 740,681 | $ | 621,024 | 0.48 | % | ||||||||||
| Federal funds purchased and securities sold under agreements to repurchase |
128,200 | 0.45 | 135,550 | 119,290 | 0.30 | |||||||||||||||
| Trust preferred borrowings |
67,011 | 2.15 | 67,011 | 67,011 | 2.03 | |||||||||||||||
| Senior Debt |
55,000 | 6.25 | 55,000 | 55,000 | 6.85 | |||||||||||||||
| Other borrowed funds |
14,486 | 0.09 | 16,808 | 15,227 | 0.09 | |||||||||||||||
| December 31, 2014 |
||||||||||||||||||||
| FHLB advances |
$ | 405,894 | 0.52 | % | $ | 758,400 | $ | 600,172 | 0.40 | % | ||||||||||
| Federal funds purchased and securities sold under agreements to repurchase |
128,225 | 0.29 | 134,875 | 128,319 | 0.29 | |||||||||||||||
| Trust preferred borrowings |
67,011 | 1.97 | 67,011 | 67,011 | 1.97 | |||||||||||||||
| Senior Debt |
55,000 | 6.25 | 55,000 | 55,000 | 6.85 | |||||||||||||||
| Reverse mortgage trust bonds payable |
— | — | — | 1,627 | 0.97 | |||||||||||||||
| Other borrowed funds |
11,645 | 0.08 | 27,088 | 20,228 | 0.09 | |||||||||||||||
Federal Home Loan Bank Advances
Advances from the FHLB with rates ranging from 0.42% to 1.23% at December 31, 2015 are due as follows:
| (In Thousands) |
Amount | Weighted Average Rate |
||||||
| 2016 |
$ | 597,400 | 0.47 | % | ||||
| 2017 |
33,315 | 0.96 | ||||||
| 2018 |
38,799 | 1.10 | ||||||
|
|
|
|||||||
| $ | 669,514 | 0.50 | ||||||
|
|
|
|||||||
Pursuant to collateral agreements with the FHLB, advances are secured by qualifying loan collateral, qualifying fixed-income securities, FHLB stock and an interest-bearing demand deposit account with the FHLB.
91
Table of Contents
As a member of the FHLB, we are required to purchase and hold shares of capital stock in the FHLB in an amount at least equal to 0.10% of our member asset value plus 4.00% of advances outstanding. We were in compliance with this requirement with a stock investment in FHLB of $30.5 million at December 31, 2015 and $23.3 million as of December 31, 2014. This stock is carried on the accompanying Consolidated Statements of Condition at cost, which approximates liquidation value.
The increase in FHLB stock was due to the increase in FHLB Advances outstanding. We received dividends on our stock investment in FHLB of $2.2 million and $1.4 million for the years ended December 31, 2015 and 2014, respectively. For additional information regarding FHLB Stock, see Note 18 to the Consolidated Financial Statements.
Federal Funds Purchased and Securities Sold Under Agreements to Repurchase
During 2015 and 2014, we purchased federal funds as a short-term funding source. At December 31, 2015, we had purchased $128.2 million in federal funds at an average rate of 0.45%. At December 31, 2014, we had purchased $103.2 million in federal funds at an average rate of 0.29%.
We had no securities sold under agreements to repurchase at December 31, 2015. Securities sold under agreements to repurchase with the corresponding carrying and fair values of the underlying securities at December 31, 2014 were due as follows:
| Borrowing Amount |
Rate | Collateral | ||||||||||||||||||
| (In Thousands) | Carrying Value |
Fair Value |
Accrued Interest |
|||||||||||||||||
| 2014 |
||||||||||||||||||||
| Over 90 days |
$ | 25,000 | 2.98 | % | $ | 35,886 | $ | 35,549 | $ | 64 | ||||||||||
|
|
|
|
|
|
|
|
|
|||||||||||||
Trust Preferred Borrowings
In 2005, we issued $67.0 million of aggregate principal amount of Pooled Floating Rate Securities at a variable interest rate of 177 basis points over the three-month LIBOR rate. These securities are callable and have a maturity date of June 1, 2035.
Senior Debt
In 2012, we issued and sold $55.0 million in aggregate principal amount of 6.25% Senior Notes due 2019 (the Senior Debt). The Senior Debt is unsecured and ranks equally with all of our other present and future unsecured unsubordinated obligations. The senior debt is effectively subordinated to our secured indebtedness and structurally subordinated to the indebtedness of our subsidiaries. At our option, the Senior Debt is callable, in whole or in part, after five years. The Senior Debt matures on September 1, 2019.
Other Borrowed Funds
Included in other borrowed funds are collateralized borrowings of $14.5 million and $11.6 million at December 31, 2015 and 2014, respectively, consisting of outstanding retail repurchase agreements, contractual arrangements under which portions of certain securities are sold overnight to retail customers under agreements to repurchase. Such borrowings were collateralized by mortgage-backed securities. The average rates on these borrowings were 0.09% and 0.08% at December 31, 2015 and 2014, respectively.
Borrower in custody
As of December 31, 2015, the Bank had $204.1 million of loans pledged to the Federal Reserve of Philadelphia (FRB). The Bank did not borrow funds from the FRB during 2015.
92
Table of Contents
12. STOCK AND COMMON STOCK WARRANTS
In 2009 we completed a private placement of stock to Peninsula Investment Partners, L.P. (Peninsula), pursuant to which the Company issued and sold 2,586,207 shares of common stock for a total purchase price of $25.0 million, and a 10-year warrant to purchase 387,930 shares of common stock at an exercise price of $9.67 per share. The warrant was immediately exercisable. Total proceeds of $25.0 million were allocated, based on the relative fair value of common stock and common stock warrants, to common stock for $23.5 million and common stock warrants for $1.5 million. During 2014, we entered into an agreement in which the Company repurchased the warrants for $6.3 million.
During 2014, the Board of Directors approved a stock buyback program of up to 5% of total outstanding shares of common stock. Related to this authorization, during 2015 the Company repurchased 1,060,137 common shares at an average price of $26.88 per share. Additionally, in 2014 the Company repurchased 349,263 common shares and common share equivalents at an implied price of $25.73 per share. These buybacks included 243,699 common share equivalents related to the repurchase of the 387,930 warrants to purchase common stock issued in conjunction with the 2009 equity offering described in the preceding paragraph. The Company completed this stock buyback program during the fourth quarter of 2015.
During 2015, the Board of Directors approved an additional stock buyback program of up to 5% of total outstanding shares of common stock. Related to this authorization, the Company repurchased 92,096 common shares at an average price of $33.74 per share. The Company has approximately 1.4 million shares (or just under 5% of its 29.8 million shares outstanding), remaining to repurchase under its current authorization as of December 31, 2015.
All share and per share information has been retroactively adjusted to reflect the Company’s three-for-one stock split in May 2015. See Note 1 to the Consolidated Financial Statements for additional information.
13. STOCKHOLDERS’ EQUITY AND REGULATORY CAPITAL
Savings institutions such as the Bank are subject to regulatory capital requirements administered by various banking regulators. Failure to meet minimum capital requirements could result in certain actions by regulators that could have a material effect on the Company’s financial statements. In July 2013, the Federal Reserve Board approved final rules (the “U.S. Basel III Capital Rules”) establishing a new comprehensive capital framework for U.S. banking organizations. The U.S. Basel III Capital Rules substantially revise the risk-based capital requirements applicable to bank holding companies and depository institutions.
The new minimum regulatory capital requirements became effective for the Bank and the Company on January 1, 2015 and include a new minimum common equity Tier 1 capital ratio of 4.50% of risk-weighted assets and raise the Tier 1 capital ratio from 4.00% to 6.00% of risk-weighted assets. The rules also require a current minimum Total capital ratio of 8.00% of risk-weighted assets and a minimum Tier 1 leverage capital ratio of 4.00% of average assets.
As of December 31, 2015 and 2014, the Bank was in compliance with regulatory capital requirements and exceeded the amounts required to be considered “well capitalized” as defined in the regulations.
The following table presents the capital position of the Bank and the Company as of December 31, 2015 and 2014:
| Consolidated Bank Capital |
For Capital Adequacy Purposes |
To Be Well-Capitalized Under Prompt Corrective Action Provisions |
||||||||||||||||||||||
| (In Thousands) | Amount | Percent | Amount | Percent | Amount | Percent | ||||||||||||||||||
| As of December 31, 2015 |
||||||||||||||||||||||||
| Total Capital (to risk-weighted assets) |
||||||||||||||||||||||||
| Wilmington Savings Fund Society, FSB |
$ | 618,454 | 13.11 | % | $ | 377,332 | 8.00 | % | $ | 471,666 | 10.00 | % | ||||||||||||
| WSFS Financial Corporation |
595,996 | 12.62 | 377,948 | 8.00 | N/A | N/A | ||||||||||||||||||
| Tier 1 Capital (to risk-weighted assets) |
||||||||||||||||||||||||
| Wilmington Savings Fund Society, FSB |
580,735 | 12.31 | 282,999 | 6.00 | 377,332 | 8.00 | ||||||||||||||||||
| WSFS Financial Corporation |
558,278 | 11.82 | 283,461 | 6.00 | N/A | N/A | ||||||||||||||||||
| Common Equity Tier 1 Capital (to risk-weighted assets) |
||||||||||||||||||||||||
| Wilmington Savings Fund Society, FSB |
580,735 | 12.31 | 212,249 | 4.50 | 306,583 | 6.50 | ||||||||||||||||||
| WSFS Financial Corporation |
494,571 | 10.47 | 212,596 | 4.50 | N/A | N/A | ||||||||||||||||||
| Tier 1 Leverage Capital |
||||||||||||||||||||||||
| Wilmington Savings Fund Society, FSB |
580,735 | 10.88 | 213,502 | 4.00 | 266,877 | 5.00 | ||||||||||||||||||
| WSFS Financial Corporation |
558,278 | 10.44 | 213,849 | 4.00 | N/A | N/A | ||||||||||||||||||
93
Table of Contents
| Consolidated Bank Capital |
For Capital Adequacy Purposes |
To Be Well-Capitalized Under Prompt Corrective Action Provisions |
||||||||||||||||||||||
| (In Thousands) | Amount | Percent | Amount | Percent | Amount | Percent | ||||||||||||||||||
| As of December 31, 2014 |
||||||||||||||||||||||||
| Total Capital (to risk-weighted assets) |
||||||||||||||||||||||||
| Wilmington Savings Fund Society, FSB |
$ | 531,209 | 13.83 | % | $ | 307,217 | 8.00 | % | $ | 384,022 | 10.00 | % | ||||||||||||
| WSFS Financial Corporation |
533,300 | 13.86 | 307,739 | 8.00 | N/A | N/A | ||||||||||||||||||
| Core Capital (to adjusted tangible assets) |
||||||||||||||||||||||||
| Wilmington Savings Fund Society, FSB |
491,229 | 10.25 | 191,753 | 4.00 | 239,692 | 5.00 | ||||||||||||||||||
| WSFS Financial Corporation |
493,534 | 10.56 | 186,954 | 4.00 | N/A | N/A | ||||||||||||||||||
| Tangible Capital (to tangible assets) |
||||||||||||||||||||||||
| Wilmington Savings Fund Society, FSB |
491,229 | 10.25 | 71,907 | 1.50 | N/A | N/A | ||||||||||||||||||
| WSFS Financial Corporation |
493,534 | 10.56 | 70,108 | 1.50 | N/A | N/A | ||||||||||||||||||
| Tier 1 Capital (to risk-weighted assets) |
||||||||||||||||||||||||
| Wilmington Savings Fund Society, FSB |
491,229 | 12.79 | 153,609 | 4.00 | 230,413 | 6.00 | ||||||||||||||||||
| WSFS Financial Corporation |
493,534 | 12.83 | 153,869 | 4.00 | N/A | N/A | ||||||||||||||||||
The December 31, 2015 capital ratios presented above were determined in accordance with the Basel III Capital Rules while the December 31, 2014 capital ratios were calculated under the prior capital standards.
The Holding Company
As of December 31, 2015, our capital structure includes one class of stock, $0.01 par common stock outstanding with each share having equal voting rights.
In 2005, WSFS Capital Trust III, our unconsolidated subsidiary, issued Pooled Floating Rate Securities at a variable interest rate of 177 basis points over the three-month LIBOR rate with a scheduled maturity of June 1, 2035. The par value of these securities is $2.0 million and the aggregate principal is $67.0 million. The proceeds from the issue were invested in Junior Subordinated Debentures the Company issued. These securities are treated as borrowings with interest included in interest expense on the Consolidated Statements of Operations. At December 31, 2015, the coupon rate of the WSFS Capital Trust III securities was 2.18%. The effective rate will vary due to fluctuations in interest rates.
When infused into the Bank, the Trust Preferred Securities issued in 2005 qualify as Tier 1 capital. The Bank is prohibited from paying any dividend or making any other capital distribution if, after making the distribution, the Bank would be undercapitalized within the meaning of the Prompt Corrective Action regulations.
At December 31, 2015, $26.4 million in cash remains at the holding company to support the parent company’s needs.
Pursuant to federal laws and regulations, our ability to engage in transactions with affiliated corporations, including the loan of funds to, or guarantee of the indebtedness of, an affiliate, is limited.
14. ASSOCIATE (EMPLOYEE) BENEFIT PLANS
Associate 401(k) Savings Plan
Certain subsidiaries of ours maintain a qualified plan in which Associates may participate. Participants in the plan may elect to direct a portion of their wages into investment accounts that include professionally managed mutual and money market funds and our common stock. Generally, the principal and related earnings are tax deferred until withdrawn. We match a portion of the Associates’ contributions. As a result, our total cash contributions to the plan on behalf of our Associates resulted in an expense of $2.6 million, $2.2 million, and $2.6 million for 2015, 2014, and 2013, respectively.
All contributions are invested in accordance with the Associates’ selection of investments. If Associates do not designate how discretionary contributions are to be invested, 100% will be invested in a balanced fund. Associates may
94
Table of Contents
generally make transfers to various other investment vehicles within the plan. The plan’s yearly activity includes net sales of 25,000 and 2,000 of our common stock in 2015 and 2014 respectively and net purchases of 19,000 shares of our common stock during 2013.
Postretirement Benefits
We share certain costs of providing health and life insurance benefits to eligible retired Associates and their eligible dependents. Previously, all Associates were eligible for these benefits if they reached normal retirement age while working for us. Effective March 31, 2014, we changed the eligibility of this plan to include only those Associates who have achieved ten years of service with us as of March 31, 2014.
We account for our obligations under the provisions of FASB ASC 715, Compensation — Retirement Benefits (ASC 715). ASC 715 requires that the costs of these benefits be recognized over an Associate’s active working career. Amortization of unrecognized net gains or losses resulting from experience different from that assumed and from changes in assumptions is included as a component of net periodic benefit cost over the remaining service period of active employees to the extent that such gains and losses exceed 10% of the accumulated postretirement benefit obligation, as of the beginning of the year.
ASC 715 requires that we recognize the funded status of our defined benefit postretirement plan in our statement of financial position, with a corresponding adjustment to accumulated other comprehensive income, net of tax. The adjustment to accumulated other comprehensive income at adoption represented the net unrecognized actuarial losses and unrecognized transition obligation remaining from the initial adoption of ASC 715, all of which were previously netted against the plan’s funded status in our statement of financial position pursuant to the provisions of ASC 715. These amounts will be subsequently recognized as net periodic pension costs pursuant to our historical accounting policy for amortizing such amounts. Further, actuarial gains and losses that arise in subsequent periods, and are not recognized as net periodic pension cost in the same periods, will be recognized as a component of other comprehensive income. Those amounts will be subsequently recognized as a component of net periodic pension cost on the same basis as the amounts recognized in accumulated other comprehensive income at adoption of ASC 715.
In accordance with ASC 715, during 2016 we expect to recognize $64,000 of amortization related to the net actuarial gain, and $76,000 relating to the net transition obligation.
The following disclosures relating to postretirement benefits were measured at December 31:
| (In Thousands) | 2015 | 2014 | 2013 | |||||||||
| Change in benefit obligation: |
||||||||||||
| Benefit obligation at beginning of year |
$ | 2,266 | $ | 4,560 | $ | 4,478 | ||||||
| Service cost |
59 | 195 | 343 | |||||||||
| Interest cost |
89 | 195 | 176 | |||||||||
| Actuarial gain |
(502 | ) | (1,611 | ) | (288 | ) | ||||||
| Benefits paid |
(107 | ) | (125 | ) | (149 | ) | ||||||
| Plan change |
— | (948 | ) | — | ||||||||
|
|
|
|
|
|
|
|||||||
| Benefit obligation at end of year |
$ | 1,805 | $ | 2,266 | $ | 4,560 | ||||||
|
|
|
|
|
|
|
|||||||
| Change in plan assets: |
||||||||||||
| Fair value of plan assets at beginning of year |
$ | — | $ | — | $ | — | ||||||
| Employer contributions |
107 | 125 | 149 | |||||||||
| Benefits paid |
(107 | ) | (125 | ) | (149 | ) | ||||||
|
|
|
|
|
|
|
|||||||
| Fair value of plan assets at end of year |
$ | — | $ | — | $ | — | ||||||
|
|
|
|
|
|
|
|||||||
| Funded status: |
||||||||||||
| Unfunded status |
$ | (1,805 | ) | $ | (2,266 | ) | $ | (4,560 | ) | |||
| Total (income) loss recognized in other comprehensive income |
(1,271 | ) | (1,367 | ) | 1,221 | |||||||
|
|
|
|
|
|
|
|||||||
| Net amount recognized |
$ | (3,076 | ) | $ | (3,633 | ) | $ | (3,339 | ) | |||
|
|
|
|
|
|
|
|||||||
95
Table of Contents
| (In Thousands) | 2015 | 2014 | 2013 | |||||||||
| Components of net periodic benefit cost: |
||||||||||||
| Service cost |
$ | 59 | $ | 195 | $ | 343 | ||||||
| Interest cost |
89 | 195 | 177 | |||||||||
| Amortization of transition obligation |
(76 | ) | (57 | ) | — | |||||||
| Net (gain) loss recognition |
(20 | ) | 86 | 78 | ||||||||
|
|
|
|
|
|
|
|||||||
| Net periodic benefit cost |
$ | 52 | $ | 419 | $ | 598 | ||||||
|
|
|
|
|
|
|
|||||||
| Assumptions used to determine net periodic benefit cost: |
||||||||||||
| Discount rate |
4.00 | % | 5.00 | % | 4.00 | % | ||||||
| Health care cost trend rate |
5.00 | % | 5.00 | % | 5.00 | % | ||||||
| Sensitivity analysis of health care cost trends: |
||||||||||||
| Effect of +1% on service cost plus interest cost |
$ | — | $ | — | $ | — | ||||||
| Effect of –1% on service cost plus interest cost |
— | — | — | |||||||||
| Effect of +1% on APBO |
— | — | — | |||||||||
| Effect of –1% on APBO |
— | — | — | |||||||||
| Assumptions used to value the Accumulated Postretirement Benefit Obligation (APBO): |
||||||||||||
| Discount rate |
4.25 | % | 4.00 | % | 5.00 | % | ||||||
| Health care cost trend rate |
5.00 | % | 5.00 | % | 5.00 | % | ||||||
| Ultimate trend rate |
5.00 | % | 5.00 | % | 5.00 | % | ||||||
| Year of ultimate trend rate |
2016 | 2015 | 2014 | |||||||||
Estimated future benefit payments:
The following table shows the expected future payments for the next 10 years:
(In Thousands)
| During 2016 |
$ | 62 | ||
| During 2017 |
64 | |||
| During 2018 |
65 | |||
| During 2019 |
67 | |||
| During 2020 |
68 | |||
| During 2021 through 2025 |
404 | |||
|
|
|
|||
| $ | 730 | |||
|
|
|
We assume medical benefits will increase at an average rate of less than 10% per annum. The costs incurred for retirees’ health care are limited since certain current and all future retirees are restricted to an annual medical premium cap indexed (since 1995) by the lesser of 4% or the actual increase in medical premiums paid by us. For 2015, this annual premium cap amounted to $3,158 per retiree. We estimate that we will contribute approximately $3,285 per retiree to the plan during fiscal 2016.
We have five additional plans which are no longer being provided to Associates: (1) a Supplemental Pension Plan with a corresponding liability of $810,000 and $856,000 for December 31, 2015 and December 31, 2014, respectively; (2) an Early Retirement Window Plan with a corresponding liability of $193,000 and $179,000 for December 31, 2015 and December 31, 2014, respectively; (3) a Director’s Plan with a corresponding liability of $43,000 and $60,000 for December 31, 2015 and December 31, 2014, respectively; (4) a Supplemental Executive Retirement Plan with a corresponding liability of $1.4 million and $1.5 million for December 31, 2015 and December 31, 2014, respectively, and; (5) a Post-Retirement Medical Plan with a corresponding liability of $130,000 and $147,000 for December 31, 2015 and December 31, 2014, respectively.
96
Table of Contents
15. TAXES ON INCOME
The Company and its subsidiaries file a consolidated federal income tax return and separate state income tax returns. Our income tax provision consists of the following:
| Year Ended December 31, |
2015 | 2014 | 2013 | |||||||||
| (In Thousands) | ||||||||||||
| Current income taxes: |
||||||||||||
| Federal taxes |
$ | 24,237 | $ | 21,252 | $ | 22,416 | ||||||
| State and local taxes |
3,805 | 3,215 | 2,759 | |||||||||
| Deferred income taxes: |
||||||||||||
| Federal taxes |
2,283 | (5,575 | ) | 875 | ||||||||
| State and local taxes |
(52 | ) | (89 | ) | (120 | ) | ||||||
|
|
|
|
|
|
|
|||||||
| Total |
$ | 30,273 | $ | 18,803 | $ | 25,930 | ||||||
|
|
|
|
|
|
|
|||||||
Current federal income taxes include taxes on income that cannot be offset by net operating loss carryforwards.
Deferred income taxes reflect the net tax effects of temporary differences between the carrying amounts of assets and liabilities for financial reporting purposes and the amounts used for income tax purposes. The following is a summary of the significant components of our deferred tax assets and liabilities as of December 31, 2015 and 2014:
| (In Thousands) | 2015 | 2014 | ||||||
| Deferred tax assets: |
||||||||
| Unrealized losses on available-for-sale securities |
$ | 57 | $ | — | ||||
| Allowance for loan losses |
12,981 | 13,799 | ||||||
| Purchase accounting adjustments—loans |
4,597 | 3,016 | ||||||
| Reserves and other accruals |
14,147 | 10,091 | ||||||
| Deferred gains |
888 | 761 | ||||||
| Net operating losses |
785 | 1,104 | ||||||
| Tax credits |
1,664 | 309 | ||||||
| Reverse mortgages |
3,290 | 3,707 | ||||||
|
|
|
|
|
|||||
| Total deferred tax assets before valuation allowance |
38,409 | 32,787 | ||||||
|
|
|
|
|
|||||
| Less: valuation allowance |
— | — | ||||||
|
|
|
|
|
|||||
| Total Deferred tax assets |
$ | 38,409 | $ | 32,787 | ||||
|
|
|
|
|
|||||
| Deferred tax liabilities: |
||||||||
| Unrealized gains on available-for-sale securities |
$ | — | $ | (1,626 | ) | |||
| Bad debt recapture |
(954 | ) | (1,233 | ) | ||||
| Accelerated depreciation |
(1,806 | ) | (1,915 | ) | ||||
| Other |
(344 | ) | (267 | ) | ||||
| Prepaid expenses |
(371 | ) | (741 | ) | ||||
| Deferred loan costs |
(1,209 | ) | (1,904 | ) | ||||
| Intangibles |
(4,876 | ) | (3,349 | ) | ||||
|
|
|
|
|
|||||
| Total deferred tax liabilities |
(9,560 | ) | (11,035 | ) | ||||
|
|
|
|
|
|||||
| Net deferred tax asset |
$ | 28,849 | $ | 21,752 | ||||
|
|
|
|
|
|||||
Included in the table above is the effect of certain temporary differences for which no deferred tax expense or benefit was recognized. In 2015, such items consisted primarily of $57,000 of unrealized losses on certain investments in debt and equity securities accounted for under ASC 320 along with $223,000 of unrealized gains related to postretirement benefit obligations accounted for under ASC 715. In 2014, they consisted primarily of $1.6 million of unrealized gains on certain investments in debt and equity securities along with $258,000 related to postretirement benefit obligations.
97
Table of Contents
Based on our history of prior earnings and our expectations of the future, it is anticipated that operating income and the reversal pattern of our temporary differences will, more likely than not, be sufficient to realize a net deferred tax asset of $28.8 million at December 31, 2015.
As a result of the acquisition of Alliance on October 9, 2015, we recorded a net deferred tax asset (DTA) of $7.6 million. Included in this DTA are $1.1 million of federal net operating losses (NOL) carryovers, $2.6 million of state NOL carryovers and $1.7 million of alternative minimum tax credit carryovers. Such federal NOL’s expire beginning in 2035 while the state NOLs expire in 2017. The tax credits have an indefinite life. Although there is a limitation on the amount of Alliance’s net operating loss deduction and tax credit utilization (and certain other deductions) that we can utilize each tax year, we expect to fully utilize these tax attributes and, therefore, no valuation allowance has been recorded against the DTA. Retained earnings at December 31, 2015 include approximately $7.1 million, representing prior Alliance bad debt deductions, for which no deferred income taxes have been provided.
As a result of the acquisition of the First National Bank of Wyoming (FNBW) in 2014, we recorded a net DTA of $3.1 million. Included in this DTA are $1.9 million of NOL carryovers and $309,000 of alternative minimum tax credit carryovers. Such NOLs expire beginning in 2034, while the tax credits have an indefinite life. Although there is a limitation on the amount of FNBW’s net operating loss deduction (and certain other deductions) that we can utilize each tax year, we expect to fully utilize these tax attributes and, therefore, no valuation allowance has been recorded against the DTA.
A reconciliation showing the differences between our effective tax rate and the U.S. Federal statutory tax rate is as follows:
| Year Ended December 31, |
2015 | 2014 | 2013 | |||||||||
| Statutory federal income tax rate |
35.0 | % | 35.0 | % | 35.0 | % | ||||||
| State tax, net of federal tax benefit |
2.9 | 2.8 | 2.4 | |||||||||
| Nondeductible acquisition costs |
0.7 | 0.2 | — | |||||||||
| Tax-exempt interest |
(1.9 | ) | (2.0 | ) | (1.2 | ) | ||||||
| Bank-owned life insurance income |
(0.3 | ) | (0.3 | ) | (0.1 | ) | ||||||
| Incentive stock option and other nondeductible compensation |
— | — | 0.3 | |||||||||
| Tax benefits from previously unconsolidated subsidiary (SASCO) |
— | (9.4 | ) | — | ||||||||
| Federal tax credits, net of amortization |
(0.5 | ) | (0.5 | ) | (0.7 | ) | ||||||
| Other |
0.2 | 0.1 | (0.1 | ) | ||||||||
|
|
|
|
|
|
|
|||||||
| Effective tax rate |
36.1 | % | 25.9 | % | 35.6 | % | ||||||
|
|
|
|
|
|
|
|||||||
As a result of the consolidation for accounting purposes of the SASCO reverse mortgage securitization trust during 2013, a deferred tax asset of approximately $4.9 million was recorded. In addition we recorded a $1.8 million deferred tax liability associated with our investment in SASCO. However, because SASCO was not consolidated for income tax purposes, a full valuation allowance was also recorded on this DTA due to the uncertainty of its realization, as the realization was dependent on future taxable income. On January 27, 2014 the separate company SASCO tax structure was eliminated, which permits tax consolidation within the Bank’s tax return filings on a prospective basis. At this date, the uncertainty surrounding the realization of the DTA was eliminated. Accordingly, we removed the $4.9 million valuation allowance and eliminated the $1.8 million deferred tax liability, which resulted in an overall income tax benefit of $6.7 million in 2014. Finally, SASCO has $1.1 million of remaining Federal net operating losses that the Bank acquired upon SASCO’s liquidation. Such NOLs expire beginning in 2030 and, due to IRS limitations, $110,000 are being utilized each year. Accordingly, we fully expect to utilize all of these NOLs.
As of December 31, 2015, we have federal and state NOLs of $1.7 million and $2.6 million, respectively. Such NOLs will begin to expire after 2033 and 2017, respectively if not utilized. In addition, we have federal alternative minimum tax credit carryovers of $1.7 million as of December 31, 2015 that have an indefinite life.
98
Table of Contents
We account for income taxes in accordance with FASB Accounting Standards Codification (ASC) 740, Income Taxes (formerly Statement of Financial Accounting Standards (SFAS) No. 109, Accounting for Income Taxes and FASB Interpretation No. 48, Accounting for Uncertainty in Income Taxes, an interpretation of FASB Statement 109). ASC 740 prescribes a recognition threshold and a measurement attribute for the financial statement recognition and measurement of tax positions taken or expected to be taken in a tax return. Benefits from tax positions are recognized in the financial statements only when it is more-likely-than-not that the tax position will be sustained upon examination by the appropriate taxing authority that would have full knowledge of all relevant information. A tax position that meets the more-likely-than-not recognition threshold is measured at the largest amount of benefit that is greater than 50% likely of being realized upon ultimate settlement. Tax positions that previously failed to meet the more-likely-than-not recognition threshold are recognized in the first subsequent financial reporting period in which that threshold is met. Previously recognized tax positions that no longer meet the more-likely-than-not recognition threshold are derecognized in the first subsequent financial reporting period in which that threshold is no longer met. ASC 740 also provides guidance on the accounting for and disclosure of unrecognized tax benefits, interest and penalties.
We record interest and penalties on potential income tax deficiencies as income tax expense. Federal tax years 2012 through 2015 remain subject to examination as of December 31, 2015, while tax years 2012 through 2015 remain subject to examination by state taxing jurisdictions. During 2013, the audit of our 2010 federal tax return was completed by the IRS. We recorded a $186,000 tax benefit as a result of settling this audit. No federal income tax return examinations are currently in process; however, Pennsylvania is currently examining our 2012 state tax return. We do not expect to record or realize any material unrecognized tax benefits during 2016.
ASC 740 prescribes a minimum probability threshold that a tax position must meet before a financial statement benefit is recognized. We recognize, when applicable, interest and penalties related to unrecognized tax benefits in the provision for income taxes in the financial statements. Assessment of uncertain tax positions under ASC 740 requires careful consideration of the technical merits of a position based on our analysis of tax regulations and interpretations. There are no longer any unrecognized tax benefits related to ASC 740 as of December 31, 2015 nor has there been any unrecognized tax benefit activity since December 31, 2012.
As a result of the adoption of ASU No. 2014-01, “Investments-Equity Method and Joint Ventures: Accounting for Investments in Qualified Affordable Housing Projects,” the amortization of our low-income housing credit investments has been reflected as income tax expense. Accordingly, $1.9 million of such amortization has been reflected as income tax expense for the year ended December 31, 2015, compared to $1.2 million and $1.2 million for the years ended December 31, 2014 and December 31, 2013, respectively.
The amount of affordable housing tax credits, amortization and tax benefits recorded as income tax expense for the year ended December 31, 2015 were $2.0 million, $1.9 million and $293,000, respectively. The carrying value of the investment in affordable housing credits is $12.0 million at December 31, 2015, compared to $13.0 million at December 31, 2014.
16. STOCK-BASED COMPENSATION
Our Stock Incentive Plans provide for the granting of stock options, stock appreciation rights, performance awards, restricted stock and restricted stock unit awards, deferred stock units, and other awards that are payable in or valued by reference to our common shares. The number of shares reserved for issuance under our 2013 Incentive Plan (2013 Plan) is 2,096,535. At December 31, 2015, there were 946,146 shares available for future grants under the 2013 Plan. Generally, all awards become exercisable immediately in the event of a change in control, as defined within the Stock Incentive Plans.
Total stock-based compensation expense recognized was $3.2 million ($2.2 million after tax) for 2015, $3.7 million ($2.6 million after tax) for 2014, and $3.2 million ($2.5 million after tax) for 2013. Stock-based compensation expense related to awards granted to Associates is recorded in salaries, benefits and other compensation; expense related to awards granted to directors is recorded in other operating expense.
99
Table of Contents
Stock Options
Stock options are granted with an exercise price not less than the fair market value of our common stock on the date of the grant. With the exception of certain Non-Plan Stock Options (as defined below), all stock options granted during 2015, 2014 and 2013 vest in 25% per annum increments, start to become exercisable one year from the grant date and expire between five and seven years from the grant date. We issue new shares upon the exercise of options.
We determine the grant date fair value of stock options using the Black-Scholes option-pricing model. The model requires the use of numerous assumptions, many of which are subjective. We use the simplified method provided for in Staff Accounting Bulletin (SAB) Topic 14.D.2 to estimate the expected term of options as we believe our historical share option exercise experience is not sufficient to provide a reasonable basis upon which to estimate expected term. Other significant assumptions to determine 2015, 2014 and 2013 grant date fair value included volatility measured using the fluctuation in month end closing stock prices over a period which corresponds with the average expected option life; a weighted-average risk-free rate of return (zero coupon treasury yield); and a dividend yield indicative of our current dividend rate. The assumptions for options issued during 2015, 2014, and 2013 are presented below:
| 2015 | 2014 | 2013 | ||||||||||
| Expected term (in years) |
4.9 | 4.9 | 3.9 | |||||||||
| Volatility |
25.0 | % | 29.0 | % | 30.7 | % | ||||||
| Weighted-average risk-free interest rate |
1.54 | % | 0.97 | % | 0.50 | % | ||||||
| Dividend yield |
0.76 | % | 0.67 | % | 1.01 | % | ||||||
On April 25, 2013 stockholders approved a change in future compensation for Mark A. Turner, President and CEO. As a result, Mr. Turner was granted 750,000 non-statutory stock options (“Non-Plan Stock Options’) with a longer and slower vesting schedule than our standard options, 40% vesting after the second year and 20% vesting in each of the following three years. Additionally, these options were awarded at an exercise price of 20% over the December 2012 market value (the date on which framework of the plan was decided). Upon the grant, Mr. Turner is no longer eligible to receive grants under any of our other stock based award programs for a period of five years. The Black-Scholes option-pricing model was used to determine the grant date fair value of the options. Significant assumptions used in the model included a weighted-average risk-free rate of return (zero coupon treasury yield) of 0.76%; an expected option life of five years; an expected stock price volatility of 40.5%; and a dividend yield of 1.01%.
Additionally, in 2013, 450,000 incentive stock options were issued to certain executive officers of the Company under the 2013 Plan. These options have the same vesting schedule and exercise price as the Non-Plan Stock Options granted to Mr. Turner. The Black-Scholes option-pricing model with the same assumptions as the Non-Plan Stock Options was used to determine the grant date fair value of the options.
A summary of the status of our options (including Non-Plan Stock Options) as of December 31, 2015, and changes during the year, is presented below:
| 2015 | ||||||||||||||||
| Shares | Weighted- Average Exercise Price |
Weighted- Average Remaining Contractual Term (Year) |
Aggregate Intrinsic Value (In Thousands) |
|||||||||||||
| Stock Options: |
||||||||||||||||
| Outstanding at beginning of year |
1,984,035 | $ | 16.38 | 4.30 | $ | 18,444 | ||||||||||
| Granted |
73,728 | 26.24 | ||||||||||||||
| Exercised |
(262,512 | ) | 15.42 | |||||||||||||
| Forfeited |
(147,373 | ) | 17.23 | |||||||||||||
|
|
|
|||||||||||||||
| Outstanding at end of year |
1,647,878 | 17.08 | 3.74 | 25,175 | ||||||||||||
| Nonvested at end of year |
1,028,142 | 17.58 | 3.99 | 15,200 | ||||||||||||
| Exercisable at end of year |
619,736 | 16.26 | $ | 3.33 | 9,975 | |||||||||||
100
Table of Contents
The weighted-average fair value of options granted was $5.73 in 2015, $5.78 in 2014, and $4.65 in 2013. The aggregate intrinsic value of options exercised was $3.0 million in 2015, $2.4 million in 2014, and $2.7 million in 2013.
The following table provides information about our nonvested stock options outstanding at December 31, 2015:
| 2015 | ||||||||||||
| Shares | Weighted- Average Exercise Price |
Weighted- Average Grant Date Fair Value |
||||||||||
| Stock Options: |
||||||||||||
| Nonvested at beginning of period |
1,729,143 | $ | 16.67 | $ | 4.76 | |||||||
| Granted |
73,728 | 26.24 | 5.73 | |||||||||
| Vested |
(674,948 | ) | 16.44 | 4.75 | ||||||||
| Forfeited |
(99,781 | ) | 17.35 | 4.81 | ||||||||
|
|
|
|||||||||||
| Nonvested at end of period |
1,028,142 | $ | 17.58 | $ | 4.85 | |||||||
The total amount of unrecognized compensation cost related to nonvested stock options as of December 31, 2015 was $3.2 million. The weighted-average period over which the expense is expected to be recognized is 2.2 years.
Restricted Stock and Restricted Stock Units
Restricted stock awards (RSAs) and restricted stock units (RSUs) are granted at no cost to the recipient and generally vest over a four year period. RSA recipients are entitled to voting rights and generally entitled to dividends on the common stock during the vesting period. The fair value of RSAs and RSUs is equal to the fair value of the Company’s common stock on the date of grant. We recognize the expense related to RSAs and RSUs granted to Associates into salaries, benefits and other compensation expense and granted to directors into other operating expense on an accrual basis over the requisite service period for the entire award. When we award restricted stock to individuals from whom we may not receive services in the future, we recognize the expense of restricted stock grants when we make the award, instead of amortizing the expense over the vesting period of the award.
Effective January 3, 2011, the Board approved a plan in which Marvin N. Schoenhals, Chairman of the Board, was granted 66,750 RSA’s with a five-year performance vesting schedule starting at the end of the second year following the grant date. These RSAs are subject to vesting in whole or in part based on the role that Mr. Schoenhals plays in establishing new business over a two year period of time that achieves over a two year period a result of at least a 50% return on investment of the cost of the restricted stock. We recognized compensation expense of $256,000 related to this award in 2015.
The Long-Term Performance-Based Restricted Stock Unit program (Long-Term Program) provided for awards up to an aggregate of 233,400 RSUs to participants, only after the achievement of targeted levels of return on assets (ROA) in any year through 2013. During 2013, the company achieved the 1.00% ROA performance level. In accordance with the Long-Term Program, the Company issued 108,456 RSUs to the plan’s participants in 2014. The RSUs vest in 25% increments over four years and we recognize expense over the implicit service period associated with the performance condition. During 2015, we recognized $380,000 of compensation expense related to this program.
The weighted-average fair value of RSUs and RSAs granted was $26.13 in 2015, $23.72 in 2014, and $15.83 in 2013. The total amount of compensation cost to be recognized relating to nonvested restricted stock, including performance awards, as of December 31, 2015, was $1.9 million. The weighted-average period over which the cost is expected to be recognized is 2.5 years.
The following table summarizes the Company’s RSAs and RSUs, including performance awards, and changes during the year:
| Units (in whole) |
Weighted Average Grant-Date Fair Value per Unit |
|||||||
| Balance at December 31, 2014 |
252,615 | $ | 10.11 | |||||
| Granted |
37,986 | 26.13 | ||||||
| Vested |
(106,434 | ) | 12.17 | |||||
| Forfeited |
(12,333 | ) | 6.92 | |||||
|
|
|
|||||||
| Balance at December 31, 2015 |
171,834 | $ | 12.60 | |||||
101
Table of Contents
The total fair value of RSUs and RSAs that vested was $1.3 million in 2015, $1.2 million in 2014, and $1.2 million in 2013.
17. COMMITMENTS AND CONTINGENCIES
Data Processing Operations
We have entered into contracts to manage our network operations, data processing and other related services. The projected amounts of future minimum payments contractually due (in thousands) are as follows:
| Year |
Amount | |||
| 2016 |
$ | 4,962 | ||
| 2017 |
4,107 | |||
| 2018 |
3,367 | |||
| 2019 |
3,396 | |||
| 2020 |
3,462 | |||
The expenses for data processing and operations for the year ending December 31, 2015 were $5.9 million, compared to $6.1 million for the year ended December 31, 2014 and $5.9 million for the year ended December 31, 2013.
Legal Proceedings
In the ordinary course of business, we are subject to legal actions that involve claims for monetary relief. For additional information regarding legal proceedings, see Note 23 to the Consolidated Financial Statements.
Financial Instruments With Off-Balance Sheet Risk
We are a party to financial instruments with off-balance sheet risk in the normal course of business primarily to meet the financing needs of our customers. To varying degrees, these financial instruments involve elements of credit risk that are not recognized in the Consolidated Statement of Condition.
Exposure to loss for commitments to extend credit and standby letters of credit written is represented by the contractual amount of those instruments. We generally require collateral to support such financial instruments in excess of the contractual amount of those instruments and use the same credit policies in making commitments as we do for on-balance sheet instruments.
The following represents a summary of off-balance sheet financial instruments at year-end:
| December 31, |
2015 | 2014 | ||||||
| (In Thousands) | ||||||||
| Financial instruments with contract amounts which represent potential credit risk: |
||||||||
| Construction loan commitments |
$ | 149,119 | $ | 99,917 | ||||
| Commercial mortgage loan commitments |
22,393 | 16,110 | ||||||
| Commercial loan commitments |
506,615 | 393,028 | ||||||
| Commercial owner-occupied commitments |
40,052 | 33,302 | ||||||
| Commercial standby letters of credit |
49,832 | 47,667 | ||||||
| Residential mortgage loan commitments |
2,218 | 22,617 | ||||||
| Consumer loan commitments |
189,392 | 168,391 | ||||||
At December 31, 2015, we had total commitments to extend credit of $959.6 million. Commitments for consumer lines of credit were $189.4 million of which, $173.8 million were secured by real estate. Residential mortgage loan commitments generally have closing dates within a one-month period but can be extended to six months. Not reflected in the table above are commitments to sell residential mortgages of $90.3 million and $34.6 million at December 31, 2015 and 2014, respectively.
102
Table of Contents
Commitments provide for financing on predetermined terms as long as the customer continues to meet specific criteria. Commitments generally have fixed expiration dates or other termination clauses and may require payment of a fee. Since many of the commitments are expected to expire without being completely drawn upon, the total commitment amounts do not necessarily represent future cash requirements. Standby letters of credit are conditional commitments issued to guarantee the performance of a customer to a third party. We evaluate each customer’s creditworthiness and obtain collateral based on our credit evaluation of the counterparty.
Indemnifications
Secondary Market Loan Sales. Given the current interest rate environment, coupled with our desire not to hold these assets in our portfolio, we generally sell newly originated residential mortgage loans in the secondary market to mortgage loan aggregators and on a more limited basis to GSEs such as FHLMC, FNMA, and the FHLB. Loans Held-for-Sale are reflected on our Balance Sheet at their fair value with changes in the value reflected in our Consolidated Statements. Gains and losses are recognized at the time of sale. We periodically retain the servicing rights on residential mortgage loans sold which result in monthly service fee income and are included in our Mortgage Servicing Rights (MSRs). Otherwise, we sell loans with servicing released on a nonrecourse basis. Rate-locked loan commitments we intend to sell in the secondary market are accounted for as derivatives under the guidance promulgated in FASB ASC Topic 815, Derivatives and Hedging (ASC:815).
We generally do not sell loans with recourse, except for standard loan sale contract provisions covering violations of representations and warranties and, under certain circumstances, early payment default by the borrower. These are customary repurchase provisions in the secondary market for residential mortgage loan sales. These provisions may include either an indemnification from loss or the repurchase of the loans. Repurchases and losses have been rare and no provision is made for losses at the time of sale. There was one repurchase totaling $385,000 for the year ended December 31, 2015 and two repurchases totaling $354,000 for the year ended December 31, 2014.
Swap Guarantees. We entered into agreements with five unrelated financial institutions whereby those financial institutions entered into interest rate derivative contracts (interest rate swap transactions) with customers referred to them by us. By the terms of the agreements, those financial institutions have recourse to us for any exposure created under each swap transaction in the event the customer defaults on the swap agreement and the agreement is in a paying position to the third-party financial institution. This is a customary arrangement that allows smaller financial institutions like us to provide access to interest rate swap transactions for our customers without creating the swap ourselves. These swap guarantees are accounted for as credit derivatives.
At December 31, 2015, there were 119 variable-rate to fixed-rate swap transactions between the third-party financial institutions and our customers. The initial notional aggregated amount was approximately $481.6 million, with maturities ranging from under one year to ten years. The aggregate fair value of these swaps to the customers was a liability of $18.1 million as of December 31, 2015, with all 119 swaps, in paying positions to a third party. We had no reserves for the swap guarantees as of December 31, 2015.
At December 31, 2014, there were 101 variable-rate to fixed-rate swap transactions between the third-party financial institutions and our customers. The initial notional aggregated amount was approximately $417.9 million, with maturities ranging from three months to eleven years. The aggregate fair value of these swaps to the customers was a liability of $16.5 million as of December 31, 2014, of which 99 swaps, with a liability of $16.5 million, were in paying positions to a third party. We had no reserves for the swap guarantees as of December 31, 2014.
103
Table of Contents
18. FAIR VALUE DISCLOSURES
Fair Value of Financial Assets and Liabilities
ASC 820-10 defines fair value as the price that would be received to sell an asset or paid to transfer a liability in an orderly transaction between market participants at the measurement date. ASC 820-10 establishes a fair value hierarchy that prioritizes the use of inputs used in valuation methodologies into the following three levels:
Level 1: Inputs to the valuation methodology are quoted prices, unadjusted, for identical assets or liabilities in active markets. A quoted price in an active market provides the most reliable evidence of fair value and shall be used to measure fair value whenever available.
Level 2: Inputs to the valuation methodology include quoted prices for similar assets or liabilities in active markets; inputs to the valuation methodology include quoted prices for identical or similar assets or liabilities in markets that are not active; or inputs to the valuation methodology that are derived principally from or can be corroborated by observable market data by correlation or other means.
Level 3: Inputs to the valuation methodology are unobservable and significant to the fair value measurement. Level 3 assets and liabilities include financial instruments whose value is determined using discounted cash flow methodologies, as well as instruments for which the determination of fair value requires significant management judgment or estimation.
The following tables present financial instruments carried at fair value as of December 31, 2015 and December 31, 2014 by valuation hierarchy (as described above):
| (In Thousands) Description |
Quoted Prices in Active Markets for Identical Assets (Level 1) |
Significant Other Observable Inputs (Level 2) |
Significant Unobservable Inputs (Level 3) |
Total Fair Value |
||||||||||||
| Assets measured at fair value on a recurring basis: |
||||||||||||||||
| Available-for-sale securities: |
||||||||||||||||
| CMO |
$ | — | $ | 251,488 | $ | — | $ | 251,488 | ||||||||
| FNMA MBS |
— | 318,471 | — | 318,471 | ||||||||||||
| FHLMC MBS |
— | 99,442 | — | 99,442 | ||||||||||||
| GNMA MBS |
— | 20,714 | — | 20,714 | ||||||||||||
| GSE |
— | 30,914 | 30,914 | |||||||||||||
|
|
|
|
|
|
|
|
|
|||||||||
| Total assets measured at fair value on a recurring basis |
— | 721,029 | — | 721,029 | ||||||||||||
| Assets measured at fair value on a nonrecurring basis: |
||||||||||||||||
| Other real estate owned |
$ | — | $ | — | $ | 5,080 | $ | 5,080 | ||||||||
| Loans held-for-sale |
— | 41,807 | — | 41,807 | ||||||||||||
| Impaired loans |
— | — | 35,086 | 35,086 | ||||||||||||
|
|
|
|
|
|
|
|
|
|||||||||
| Total assets measured at fair value on a nonrecurring basis |
$ | — | $ | 41,807 | $ | 40,166 | $ | 81,973 | ||||||||
104
Table of Contents
| Description |
Quoted Prices in Active Markets for Identical Assets (Level 1) |
Significant Other Observable Inputs (Level 2) |
Significant Unobservable Inputs (Level 3) |
Total Fair Value |
||||||||||||
| Assets measured at fair value on a recurring basis: |
||||||||||||||||
| Available-for-sale securities: |
||||||||||||||||
| CMO |
$ | — | $ | 192,932 | $ | — | $ | 192,932 | ||||||||
| FNMA MBS |
— | 292,553 | — | 292,553 | ||||||||||||
| FHLMC MBS |
— | 146,882 | — | 146,882 | ||||||||||||
| GNMA MBS |
— | 77,797 | — | 77,797 | ||||||||||||
| GSE |
— | 29,960 | — | 29,960 | ||||||||||||
|
|
|
|
|
|
|
|
|
|||||||||
| Total assets measured at fair value on a recurring basis |
$ | — | $ | 740,124 | $ | — | $ | 740,124 | ||||||||
| Assets measured at fair value on a nonrecurring basis: |
||||||||||||||||
| Other real estate owned |
$ | — | $ | — | $ | 5,734 | $ | 5,734 | ||||||||
| Loans held-for-sale |
— | 28,508 | — | 28,508 | ||||||||||||
| Impaired loans |
— | — | 41,334 | 41,334 | ||||||||||||
|
|
|
|
|
|
|
|
|
|||||||||
| Total assets measured at fair value on a nonrecurring basis |
$ | — | $ | 28,508 | $ | 47,068 | $ | 75,576 | ||||||||
There were no transfers between Level 1 and Level 2 of the fair value hierarchy during 2015 and no material liabilities measured at fair value as of December 31, 2015 and December 31, 2014.
Fair value is based upon quoted market prices, where available. If such quoted market prices are not available, fair value is based upon internally developed models or obtained from third parties that primarily use, as inputs, observable market-based parameters. Valuation adjustments may be made to ensure that financial instruments are recorded at fair value. These adjustments may include unobservable parameters. Our valuation methodologies may produce a fair value calculation that may not be indicative of net realizable value or reflective of future fair values. While we believe our valuation methodologies are appropriate and consistent with other market participants, the use of different methodologies or assumptions to determine the fair value of certain financial instruments could result in a different estimate of fair value at the reporting date.
Available-for-sale securities
As of December 31, 2015 securities classified as available-for-sale are reported at fair value using Level 2 inputs. Included in the Level 2 total are approximately $30.9 million in U.S. Treasury Notes and Federal Agency debentures, and $690.1 million in Federal Agency MBS. We believe that this Level 2 designation is appropriate for these securities under ASC 820-10 as, with almost all fixed income securities, none are exchange traded, and all are priced by correlation to observed market data. For these securities we obtain fair value measurements from an independent pricing service. The fair value measurements consider observable data that may include dealer quotes, market spreads, cash flows, U.S. government and agency yield curves, live trading levels, trade execution data, market consensus prepayment speeds, credit information, and the security’s terms and conditions, among other factors.
Other real estate owned
Other real estate owned consists of loan collateral which has been repossessed through foreclosure or other measures. Initially, foreclosed assets are recorded at the lower of the loan balance or fair value of the collateral less estimated selling costs. Subsequent to foreclosure, valuations are updated periodically and the assets may be marked down further, reflecting a new cost basis. The fair value of our real estate owned was estimated using Level 3 inputs based on appraisals obtained from third parties.
105
Table of Contents
Loans held-for-sale
The fair value of our loans held-for-sale is based upon estimates using Level 2 inputs. These inputs are based upon pricing information obtained from secondary markets and brokers and applied to loans with similar interest rates and maturities.
Impaired loans
We evaluate and value impaired loans at the time the loan is identified as impaired, and the fair values of such loans are estimated using Level 3 inputs in the fair value hierarchy. Each loan’s collateral has a unique appraisal and management’s discount of the value is based on the factors unique to each impaired loan. The significant unobservable input in determining the fair value is management’s subjective discount on appraisals of the collateral securing the loan, which range from 10% — 50%. Collateral may consist of real estate and/or business assets including equipment, inventory and/or accounts receivable and the value of these assets is determined based on the appraisals by qualified licensed appraisers hired by us. Appraised and reported values may be discounted based on management’s historical knowledge, changes in market conditions from the time of valuation, estimated costs to sell, and/or management’s expertise and knowledge of the client and the client’s business.
Impaired loans, which are measured for impairment by either calculating the expected future cash flows discounted at the loan’s effective interest rate or determining the fair value of the collateral for collateral dependent loans has a gross amount of $37.7 million and $46.7 million at December 31, 2015 and December 31, 2014, respectively. The valuation allowance on impaired loans was $2.6 million as of December 31, 2015 and $5.3 million as of December 31, 2014.
Fair Value of Financial Instruments
The reported fair values of financial instruments are based on a variety of factors. In certain cases, fair values represent quoted market prices for identical or comparable instruments. In other cases, fair values have been estimated based on assumptions regarding the amount and timing of estimated future cash flows that are discounted to reflect current market rates and varying degrees of risk. Accordingly, the fair values may not represent actual values of the financial instruments that could have been realized as of period-end or that will be realized in the future.
The following methods and assumptions were used to estimate the fair value of each class of financial instruments for which it is practicable to estimate that value:
Cash and cash equivalents
For cash and short-term investment securities, including due from banks, federal funds sold or purchased under agreements to resell and interest-bearing deposits with other banks, the carrying amount is a reasonable estimate of fair value.
Investment securities
Fair value is estimated using quoted prices for similar securities, which we obtain from a third party vendor. We utilize one of the largest providers of securities pricing to the industry and management periodically assesses the inputs used by this vendor to price the various types of securities owned by us to validate the vendor’s methodology.
Loans held-for sale
Loans held-for- sale are carried at their fair value (see discussion earlier in this note).
Loans
Fair values are estimated for portfolios of loans with similar financial characteristics. Loans are segregated by type: commercial, commercial mortgages, construction, residential mortgages and consumer. For loans that reprice frequently,
106
Table of Contents
the book value approximates fair value. The fair values of other types of loans are estimated by discounting expected cash flows using the current rates at which similar loans would be made to borrowers with comparable credit ratings and for similar remaining maturities. The fair value of nonperforming loans is based on recent external appraisals of the underlying collateral. Estimated cash flows, discounted using a rate commensurate with current rates and the risk associated with the estimated cash flows, are utilized if appraisals are not available. This technique does not contemplate an exit price.
Reverse mortgage loans
The fair value of our investment in reverse mortgages is based on the net present value of estimated cash flows, which have been updated to reflect recent external appraisals of the underlying collateral. For additional information on reverse mortgage loans, see Note 7, Reverse Mortgage Loans.
Stock in the Federal Home Loan Bank (FHLB) of Pittsburgh
The fair value of FHLB stock is assumed to be equal to its cost basis, since the stock is non-marketable but redeemable at its par value.
Other assets
Other assets includes other real estate owned (see discussion earlier in this note) and our investment in Visa Class B stock. Our ownership includes shares acquired at no cost from our prior participation in Visa’s network, while Visa operated as a cooperative. During 2015 we purchased additional shares which are accounted for as non-marketable equity securities and carried at cost. We evaluated the shares carried at cost for OTTI as of December 31, 2015, and the evaluation showed no OTTI as of December 31, 2015. Following resolution of Visa’s covered litigation, shares of Visa’s Class B stock will be converted to Visa Class A shares
While only current owners of Class B shares are allowed to purchase other Class B shares, there have been several transactions between Class B shareholders. Based on these transactions we estimate the value of our Class B shares to be $13.3 million as of December 31, 2015.
Deposits
The fair value of deposits with no stated maturity, such as noninterest-bearing demand deposits, money market and interest-bearing demand deposits, is assumed to be equal to the amount payable on demand. The fair value of time deposits is based on the discounted value of contractual cash flows. The discount rate is estimated using rates currently offered for deposits with comparable remaining maturities.
Borrowed funds
Rates currently available to us for debt with similar terms and remaining maturities are used to estimate fair value of existing debt.
Off-balance sheet instruments
The fair value of off-balance sheet instruments, including commitments to extend credit and standby letters of credit, approximates the recorded net deferred fee amounts, which are not significant. Because commitments to extend credit and letters of credit are generally not assignable by either us or the borrower, they only have value to us and the borrower.
107
Table of Contents
The book value and estimated fair value of our financial instruments are as follows:
| (In Thousands) | Fair Value Measurement |
2015 | 2014 | |||||||||||||||
| At December 31, |
Book Value | Fair Value | Book Value | Fair Value | ||||||||||||||
| Financial assets: |
||||||||||||||||||
| Cash and cash equivalents |
Level 1 | $ | 561,179 | $ | 561,179 | $ | 508,039 | $ | 508,039 | |||||||||
| Investment securities available-for-sale |
See previous table | 721,029 | 721,029 | 740,124 | 740,124 | |||||||||||||
| Investment securities held-to-maturity |
Level 2 | 165,862 | 167,743 | 126,168 | 126,171 | |||||||||||||
| Loans, held-for-sale |
See previous table | 41,807 | 41,807 | 28,508 | 28,508 | |||||||||||||
| Loans, net (1) |
Level 2 | 3,693,964 | 3,637,714 | 3,115,318 | 3,080,521 | |||||||||||||
| Impaired loans, net |
See previous table | 35,086 | 35,086 | 41,334 | 41,334 | |||||||||||||
| Reverse Mortgages |
Level 3 | 24,284 | 24,284 | 29,298 | 29,298 | |||||||||||||
| Stock in Federal Home Loan Bank of Pittsburgh |
Level 2 | 30,519 | 30,519 | 23,278 | 23,278 | |||||||||||||
| Accrued interest receivable |
Level 2 | 14,040 | 14,040 | 11,782 | 11,782 | |||||||||||||
| Other assets |
Level 3 | 8,669 | 18,416 | 5,739 | 10,577 | |||||||||||||
| Financial liabilities: |
||||||||||||||||||
| Deposits |
Level 2 | $ | 4,016,566 | $ | 3,791,606 | $ | 3,649,235 | $ | 3,461,218 | |||||||||
| Borrowed funds |
Level 2 | 934,211 | 935,230 | 667,775 | 672,850 | |||||||||||||
| Standby letters of credit |
Level 3 | 195 | 195 | 151 | 151 | |||||||||||||
| Accrued interest payable |
Level 2 | 801 | 801 | 1,004 | 1,004 | |||||||||||||
| (1) Excludes impaired loans, net. |
||||||||||||||||||
At December 31, 2015 and December 31, 2014 we had no commitments to extend credit measured at fair value.
19. RELATED PARTY TRANSACTIONS
We routinely entered into transactions with our directors and officers. These related party transactions were made in the ordinary course of business on substantially the same terms and conditions, including interest rates and collateral, as those prevailing at the same time for comparable transactions with other customers. They did not, in the opinion of management, involve more than the normal credit risk or present other unfavorable features. The outstanding balance of loans to related parties at December 31, 2015 and 2014 was $1.9 million and $2.9 million, respectively. Total deposits to related parties at December 31, 2015 and 2014 was $2.0 million and $4.2 million, respectively. During 2015, new loans and credit line advances to related parties amounted to $218,000 and repayments amounted to $886,000.
20. SEGMENT INFORMATION
In accordance with FASB ASC 280, Segment Reporting (ASC 280) we discuss our business in three segments. An operating segment is a component of an enterprise that engages in business activities from which it may earn revenues and incur expenses, whose operating results are regularly reviewed by the enterprise’s chief operating decision makers to make decisions about resources to be allocated to the segment and assess its performance, and for which discrete financial information is available. We evaluate performance based on pretax ordinary income relative to resources used, and allocate resources based on these results. The accounting policies applicable to our segments are those that apply to our preparation of the accompanying Consolidated Financial Statements. We have three segments: WSFS Bank, Cash Connect, and Wealth Management.
The WSFS Bank segment provides financial products to commercial and retail customers. Retail and Commercial Banking, Commercial Real Estate Lending and other banking business units are operating departments of WSFS. These departments share the same regulator, the same market, many of the same customers and provide similar products and services through the general infrastructure of the Bank. Because of the following and other reasons, these departments are not considered discrete segments and are appropriately aggregated within the WSFS Bank segment in accordance with ASC 280.
108
Table of Contents
Cash Connect provides ATM vault cash and cash logistics services through strategic partnerships with several of the largest networks, manufacturers and service providers in the ATM industry. The balance sheet category “Cash in non-owned ATMs” includes cash from which fee income is earned through bailment arrangements with customers of Cash Connect.
The Wealth Management segment provides a broad array of fiduciary, investment management, credit and deposit products to clients through four business lines. WSFS Wealth Investments provides insurance and brokerage products primarily to our retail banking clients. Cypress Capital Management, LLC is a registered investment advisor. Cypress’ primary market segment is high net worth individuals, offering a “balanced” investment style focused on preservation of capital and current income. Christiana Trust provides fiduciary and investment services to personal trust clients, and trustee, agency, bankruptcy, custodial and commercial domicile services to corporate and institutional clients. WSFS Private Banking serves high net worth clients by delivering credit and deposit products and partnering with other business units to deliver investment management and fiduciary products and services.
Segment information for the years ended December 31, 2015, 2014, and 2013 follows:
| For the Year Ended December 31, 2015: |
WSFS Bank |
Cash Connect |
Wealth Management |
Total | ||||||||||||
| (In Thousands) | ||||||||||||||||
| External customer revenues: |
||||||||||||||||
| Interest income |
$ | 174,636 | $ | — | $ | 7,940 | $ | 182,576 | ||||||||
| Noninterest income |
37,042 | 28,420 | 22,793 | 88,255 | ||||||||||||
|
|
|
|
|
|
|
|
|
|||||||||
| Total external customer revenues |
211,678 | 28,420 | 30,733 | 270,831 | ||||||||||||
|
|
|
|
|
|
|
|
|
|||||||||
| Inter-segment revenues: |
||||||||||||||||
| Interest income |
3,507 | — | 6,678 | 10,185 | ||||||||||||
| Noninterest income |
7,988 | 873 | 96 | 8,957 | ||||||||||||
|
|
|
|
|
|
|
|
|
|||||||||
| Total inter-segment revenues |
11,495 | 873 | 6,774 | 19,142 | ||||||||||||
|
|
|
|
|
|
|
|
|
|||||||||
| Total revenue |
223,173 | 29,293 | 37,507 | 289,973 | ||||||||||||
|
|
|
|
|
|
|
|
|
|||||||||
| External customer expenses: |
||||||||||||||||
| Interest expense |
15,155 | — | 621 | 15,776 | ||||||||||||
| Noninterest expenses |
129,138 | 17,270 | 17,051 | 163,459 | ||||||||||||
| Provision for loan losses |
7,476 | — | 314 | 7,790 | ||||||||||||
|
|
|
|
|
|
|
|
|
|||||||||
| Total external customer expenses |
151,769 | 17,270 | 17,986 | 187,025 | ||||||||||||
|
|
|
|
|
|
|
|
|
|||||||||
| Inter-segment expenses |
||||||||||||||||
| Interest expense |
6,678 | 1,547 | 1,960 | 10,185 | ||||||||||||
| Noninterest expenses |
969 | 2,612 | 5,376 | 8,957 | ||||||||||||
|
|
|
|
|
|
|
|
|
|||||||||
| Total inter-segment expenses |
7,647 | 4,159 | 7,336 | 19,142 | ||||||||||||
|
|
|
|
|
|
|
|
|
|||||||||
| Total expenses |
159,416 | 21,429 | 25,322 | 206,167 | ||||||||||||
|
|
|
|
|
|
|
|
|
|||||||||
| Income before taxes |
$ | 63,757 | $ | 7,864 | $ | 12,185 | $ | 83,806 | ||||||||
| Provision for income taxes |
30,273 | |||||||||||||||
|
|
|
|||||||||||||||
| Consolidated net income |
$ | 53,533 | ||||||||||||||
|
|
|
|||||||||||||||
| Cash and cash equivalents |
$ | 65,663 | $ | 493,165 | $ | 2,351 | $ | 561,179 | ||||||||
| Goodwill |
80,078 | — | 5,134 | 85,212 | ||||||||||||
| Other segment assets |
4,746,995 | 192,576 | 4,939,571 | |||||||||||||
|
|
|
|
|
|
|
|
|
|||||||||
| Total segment assets at December 31, 2015 |
$ | 4,892,736 | $ | 493,165 | $ | 200,061 | $ | 5,585,962 | ||||||||
|
|
|
|
|
|
|
|
|
|||||||||
| Capital expenditures |
$ | 8,017 | $ | 1,729 | $ | 22 | $ | 9,768 | ||||||||
109
Table of Contents
| For the Year Ended December 31, 2014: |
WSFS Bank | Cash Connect |
Wealth Management |
Total | ||||||||||||
| (In Thousands) | ||||||||||||||||
| External customer revenues: |
||||||||||||||||
| Interest income |
$ | 152,545 | $ | — | $ | 7,792 | $ | 160,337 | ||||||||
| Noninterest income |
34,461 | 25,698 | 18,119 | 78,278 | ||||||||||||
|
|
|
|
|
|
|
|
|
|||||||||
| Total external customer revenues |
187,006 | 25,698 | 25,911 | 238,615 | ||||||||||||
|
|
|
|
|
|
|
|
|
|||||||||
| Inter-segment revenues: |
||||||||||||||||
| Interest income |
3,405 | — | 5,558 | 8,963 | ||||||||||||
| Noninterest income |
6,814 | 804 | 114 | 7,732 | ||||||||||||
|
|
|
|
|
|
|
|
|
|||||||||
| Total inter-segment revenues |
10,219 | 804 | 5,672 | 16,695 | ||||||||||||
|
|
|
|
|
|
|
|
|
|||||||||
| Total revenue |
197,225 | 26,502 | 31,583 | 255,310 | ||||||||||||
|
|
|
|
|
|
|
|
|
|||||||||
| External customer expenses: |
||||||||||||||||
| Interest expense |
15,409 | — | 421 | 15,830 | ||||||||||||
| Noninterest expenses |
118,853 | 15,449 | 12,343 | 146,645 | ||||||||||||
| Provision for loan losses |
2,938 | — | 642 | 3,580 | ||||||||||||
|
|
|
|
|
|
|
|
|
|||||||||
| Total external customer expenses |
137,200 | 15,449 | 13,406 | 166,055 | ||||||||||||
|
|
|
|
|
|
|
|
|
|||||||||
| Inter-segment expenses |
||||||||||||||||
| Interest expense |
5,558 | 1,384 | 2,021 | 8,963 | ||||||||||||
| Noninterest expenses |
918 | 2,291 | 4,523 | 7,732 | ||||||||||||
|
|
|
|
|
|
|
|
|
|||||||||
| Total inter-segment expenses |
6,476 | 3,675 | 6,544 | 16,695 | ||||||||||||
|
|
|
|
|
|
|
|
|
|||||||||
| Total expenses |
143,676 | 19,124 | 19,950 | 182,750 | ||||||||||||
|
|
|
|
|
|
|
|
|
|||||||||
| Income before taxes |
$ | 53,549 | $ | 7,378 | $ | 11,633 | $ | 72,560 | ||||||||
| Provision for income taxes |
18,803 | |||||||||||||||
|
|
|
|||||||||||||||
| Consolidated net income |
$ | 53,757 | ||||||||||||||
|
|
|
|||||||||||||||
| Cash and cash equivalents |
$ | 73,395 | $ | 431,527 | $ | 3,117 | $ | 508,039 | ||||||||
| Goodwill |
43,517 | — | 5,134 | 48,651 | ||||||||||||
| Other segment assets |
4,107,212 | 2,006 | 187,412 | 4,296,630 | ||||||||||||
|
|
|
|
|
|
|
|
|
|||||||||
| Total segment assets at December 31, 2014 |
$ | 4,224,124 | $ | 433,533 | $ | 195,663 | $ | 4,853,320 | ||||||||
|
|
|
|
|
|
|
|
|
|||||||||
| Capital expenditures |
$ | 3,192 | $ | 1,531 | $ | 9 | $ | 4,732 | ||||||||
110
Table of Contents
| For the Year Ended December 31, 2013: |
WSFS Bank | Cash Connect |
Wealth Management |
Total | ||||||||||||
| (In Thousands) | ||||||||||||||||
| External customer revenues: |
||||||||||||||||
| Interest income |
$ | 139,082 | $ | — | $ | 7,840 | $ | 146,922 | ||||||||
| Noninterest income |
40,479 | 23,746 | 15,926 | 80,151 | ||||||||||||
|
|
|
|
|
|
|
|
|
|||||||||
| Total external customer revenues |
179,561 | 23,746 | 23,766 | 227,073 | ||||||||||||
|
|
|
|
|
|
|
|
|
|||||||||
| Inter-segment revenues: |
||||||||||||||||
| Interest income |
3,603 | — | 5,749 | 9,352 | ||||||||||||
| Noninterest income |
6,346 | 845 | 109 | 7,300 | ||||||||||||
|
|
|
|
|
|
|
|
|
|||||||||
| Total inter-segment revenues |
9,949 | 845 | 5,858 | 16,652 | ||||||||||||
|
|
|
|
|
|
|
|
|
|||||||||
| Total revenue |
189,510 | 24,591 | 29,624 | 243,725 | ||||||||||||
|
|
|
|
|
|
|
|
|
|||||||||
| External customer expenses: |
||||||||||||||||
| Interest expense |
14,744 | — | 590 | 15,334 | ||||||||||||
| Noninterest expenses |
106,021 | 12,950 | 12,784 | 131,755 | ||||||||||||
| Provision for loan losses |
6,759 | — | 413 | 7,172 | ||||||||||||
|
|
|
|
|
|
|
|
|
|||||||||
| Total external customer expenses |
127,524 | 12,950 | 13,787 | 154,261 | ||||||||||||
|
|
|
|
|
|
|
|
|
|||||||||
| Inter-segment expenses |
||||||||||||||||
| Interest expense |
5,749 | 1,541 | 2,062 | 9,352 | ||||||||||||
| Noninterest expenses |
954 | 2,237 | 4,109 | 7,300 | ||||||||||||
|
|
|
|
|
|
|
|
|
|||||||||
| Total inter-segment expenses |
6,703 | 3,778 | 6,171 | 16,652 | ||||||||||||
|
|
|
|
|
|
|
|
|
|||||||||
| Total expenses |
134,227 | 16,728 | 19,958 | 170,913 | ||||||||||||
|
|
|
|
|
|
|
|
|
|||||||||
| Income before taxes |
$ | 55,283 | $ | 7,863 | $ | 9,666 | $ | 72,812 | ||||||||
| Provision for income taxes |
25,930 | |||||||||||||||
|
|
|
|||||||||||||||
| Consolidated net income |
$ | 46,882 | ||||||||||||||
|
|
|
|||||||||||||||
| Cash and cash equivalents |
$ | 73,017 | $ | 408,096 | $ | 3,313 | $ | 484,426 | ||||||||
| Goodwill |
27,101 | — | 5,134 | 32,235 | ||||||||||||
| Other segment assets |
3,811,424 | 1,965 | 185,713 | 3,999,102 | ||||||||||||
|
|
|
|
|
|
|
|
|
|||||||||
| Total segment assets at December 31, 2013 |
$ | 3,911,542 | $ | 410,061 | $ | 194,160 | $ | 4,515,763 | ||||||||
|
|
|
|
|
|
|
|
|
|||||||||
| Capital expenditures |
$ | 2,232 | $ | 628 | $ | — | $ | 2,860 | ||||||||
111
Table of Contents
21. PARENT COMPANY FINANCIAL INFORMATION
Condensed Statements of Financial Condition
| December 31, |
2015 | 2014 | ||||||
| (In Thousands) |
||||||||
| Assets: |
||||||||
| Cash |
$ | 26,456 | $ | 54,331 | ||||
| Investment in subsidiaries |
667,587 | 551,784 | ||||||
| Investment in Capital Trust III |
2,011 | 2,011 | ||||||
| Other assets |
7,197 | 3,436 | ||||||
|
|
|
|
|
|||||
| Total assets |
$ | 703,251 | $ | 611,562 | ||||
|
|
|
|
|
|||||
| Liabilities: |
||||||||
| Trust preferred |
$ | 67,011 | $ | 67,011 | ||||
| Senior debt |
55,000 | 55,000 | ||||||
| Interest payable |
413 | 402 | ||||||
| Other liabilities |
356 | 98 | ||||||
|
|
|
|
|
|||||
| Total liabilities |
122,780 | 122,511 | ||||||
|
|
|
|
|
|||||
| Stockholders’ equity: |
||||||||
| Common stock |
560 | 557 | ||||||
| Capital in excess of par value |
256,435 | 201,130 | ||||||
| Accumulated other comprehensive income |
696 | 3,500 | ||||||
| Retained earnings |
570,630 | 523,099 | ||||||
| Treasury stock |
(247,850 | ) | (239,235 | ) | ||||
|
|
|
|
|
|||||
| Total stockholders’ equity |
580,471 | 489,051 | ||||||
|
|
|
|
|
|||||
| Total liabilities and stockholders’ equity |
$ | 703,251 | $ | 611,562 | ||||
|
|
|
|
|
|||||
Condensed Statements of Operations
| Year Ended December 31, |
2015 | 2014 | 2013 | |||||||||
| (In Thousands) | ||||||||||||
| Income: |
||||||||||||
| Interest income |
$ | 1,780 | $ | 785 | $ | 2,455 | ||||||
| Noninterest income |
30,180 | 74,125 | 9,983 | |||||||||
| Reverse mortgage consolidation gain |
— | — | 3,801 | |||||||||
|
|
|
|
|
|
|
|||||||
| 31,960 | 74,910 | 16,239 | ||||||||||
|
|
|
|
|
|
|
|||||||
| Expenses: |
||||||||||||
| Interest expense |
5,124 | 5,087 | 5,113 | |||||||||
| Other operating expenses |
233 | 140 | 197 | |||||||||
|
|
|
|
|
|
|
|||||||
| 5,357 | 5,227 | 5,310 | ||||||||||
|
|
|
|
|
|
|
|||||||
| Income before equity in undistributed income of subsidiaries |
26,603 | 69,683 | 10,929 | |||||||||
| Equity in undistributed income of subsidiaries |
25,765 | (17,437 | ) | 35,019 | ||||||||
|
|
|
|
|
|
|
|||||||
| Income before taxes |
52,368 | 52,246 | 45,948 | |||||||||
| Income tax benefit |
1,165 | 1,511 | 934 | |||||||||
| Dividends on preferred stock and accretion of discount |
— | — | (1,633 | ) | ||||||||
|
|
|
|
|
|
|
|||||||
| Net income allocable to common stockholders |
$ | 53,533 | $ | 53,757 | $ | 45,249 | ||||||
|
|
|
|
|
|
|
|||||||
112
Table of Contents
Condensed Statements of Cash Flows
| Year Ended December 31, |
2015 | 2014 | 2013 | |||||||||
| (In Thousands) | ||||||||||||
| Operating activities: |
||||||||||||
| Net income |
$ | 53,533 | $ | 53,757 | $ | 46,882 | ||||||
| Adjustments to reconcile net income to net cash used for operating activities: |
||||||||||||
| Equity in undistributed income of subsidiaries |
(25,765 | ) | 17,437 | (35,019 | ) | |||||||
| Reverse mortgage consolidation gain |
— | — | (3,801 | ) | ||||||||
| Increase in capitalized interest |
— | — | (801 | ) | ||||||||
| Decrease in other assets |
3,925 | 4,217 | 3,831 | |||||||||
| Increase in other liabilities |
405 | 203 | 245 | |||||||||
|
|
|
|
|
|
|
|||||||
| Net cash provided by operating activities |
32,098 | 75,614 | 11,337 | |||||||||
|
|
|
|
|
|
|
|||||||
| Investing activities: |
||||||||||||
| Payments for investment in and advances to subsidiaries |
— | (2,225 | ) | — | ||||||||
| Sale or repayment of investments in and advances to subsidiaries |
1,213 | 3,676 | — | |||||||||
| Net cash from business combinations |
(23,096 | ) | (32,028 | ) | — | |||||||
| Investment in non-marketable securities |
(3,589 | ) | — | — | ||||||||
|
|
|
|
|
|
|
|||||||
| Net cash used for investing activities |
(25,472 | ) | (30,577 | ) | — | |||||||
|
|
|
|
|
|
|
|||||||
| Financing activities: |
||||||||||||
| Issuance of common stock |
3,160 | 3,613 | 4,353 | |||||||||
| Redemption of preferred stock |
— | — | (52,625 | ) | ||||||||
| Repurchase of common stock warrants |
— | (6,300 | ) | |||||||||
| Payments to repurchase common stock |
(31,659 | ) | (2,686 | ) | — | |||||||
| Cash dividends paid |
(6,002 | ) | (4,644 | ) | (5,998 | ) | ||||||
|
|
|
|
|
|
|
|||||||
| Net cash used for financing activities |
(34,501 | ) | (10,017 | ) | (54,270 | ) | ||||||
|
|
|
|
|
|
|
|||||||
| (Decrease) increase in cash |
(27,875 | ) | 35,020 | (42,933 | ) | |||||||
| Cash at beginning of period |
54,331 | 19,311 | 62,244 | |||||||||
|
|
|
|
|
|
|
|||||||
| Cash at end of period |
$ | 26,456 | $ | 54,331 | $ | 19,311 | ||||||
|
|
|
|
|
|
|
|||||||
22. CHANGE IN ACCUMULATED OTHER COMPREHENSIVE INCOME
Accumulated other comprehensive income (loss) includes unrealized gains and losses on available-for-sale investments as well as unrecognized prior service costs, transition costs and actuarial gains and losses on defined benefit pension plans which reflects changes made to the post retirement benefit obligation for retiree health and life insurance. These changes were effective March 31, 2014 (see Note 14 “Associate (Employee) Benefit Plans” for further information). Changes to other accumulated other comprehensive income (loss) are presented net of tax effect as a component of equity. Reclassification out of accumulated other comprehensive income is recorded on the Statements of Operations either as a gain or loss.
113
Table of Contents
Changes to accumulated other comprehensive income (loss) by component are shown net of taxes in the following tables for the period indicated:
| (In Thousands) | Net change
in investment securities available-for-sale |
Net change in securities held-to- maturity |
Net change in defined benefit plan |
Total | ||||||||||||
| Balance, December 31, 2012 |
$ | 13,415 | $ | — | $ | (472 | ) | $ | 12,943 | |||||||
|
|
|
|
|
|
|
|
|
|||||||||
| Other comprehensive loss before reclassifications |
(32,057 | ) | — | — | (32,057 | ) | ||||||||||
| Less: Amounts reclassified from accumulated other comprehensive loss |
(2,180 | ) | — | — | (2,180 | ) | ||||||||||
|
|
|
|
|
|
|
|
|
|||||||||
| Net current-period other comprehensive loss |
(34,237 | ) | — | — | (34,237 | ) | ||||||||||
|
|
|
|
|
|
|
|
|
|||||||||
| Balance, December 31, 2013 |
$ | (20,822 | ) | $ | — | $ | (472 | ) | $ | (21,294 | ) | |||||
|
|
|
|
|
|
|
|
|
|||||||||
| Other comprehensive income before reclassifications |
24,118 | — | 24,118 | |||||||||||||
| Less: Amounts reclassified from accumulated other comprehensive loss |
(643 | ) | — | 1,319 | 676 | |||||||||||
|
|
|
|
|
|
|
|
|
|||||||||
| Net current-period other comprehensive income |
23,475 | — | 1,319 | 24,794 | ||||||||||||
|
|
|
|
|
|
|
|
|
|||||||||
| Balance, December 31, 2014 |
$ | 2,653 | $ | — | $ | 847 | $ | 3,500 | ||||||||
|
|
|
|
|
|
|
|
|
|||||||||
| Other comprehensive loss before reclassifications |
(1,417 | ) | — | (1,417 | ) | |||||||||||
| Less: Amounts reclassified from accumulated other comprehensive income |
(916 | ) | (412 | ) | (59 | ) | (1,387 | ) | ||||||||
|
|
|
|
|
|
|
|
|
|||||||||
| Net current-period other comprehensive loss |
(2,333 | ) | (412 | ) | (59 | ) | (2,804 | ) | ||||||||
|
|
|
|
|
|
|
|
|
|||||||||
| Balance, December 31, 2015 |
$ | 320 | $ | (412 | ) | $ | 788 | $ | 696 | |||||||
|
|
|
|
|
|
|
|
|
|||||||||
Components of other comprehensive income that impact the statement of operations are presented in the table below.
| Twelve Months Ended December 31, |
Affected line item in Statements of Operations | |||||||||||||
| (In Thousands) | 2015 | 2014 | 2013 | |||||||||||
| Securities available-for-sale: |
||||||||||||||
| Realized gains on securities transactions |
$ | (1,478 | ) | $ | (1,036 | ) | $ | (3,516 | ) | Securities gains, net | ||||
| Income taxes |
562 | 393 | 1,336 | Income tax provision | ||||||||||
|
|
|
|
|
|
|
|||||||||
| Net of tax |
$ | (916 | ) | $ | (643 | ) | $ | (2,180 | ) | |||||
|
|
|
|
|
|
|
|||||||||
| Net unrealized holding gains on securities transferred between available-for-sale and held-to-maturity: |
||||||||||||||
| Amortization of net unrealized gains to income during the period |
$ | (646 | ) | $ | — | $ | — | Interest income on investment securities | ||||||
| Income taxes |
234 | — | — | Income tax provision | ||||||||||
|
|
|
|
|
|
|
|||||||||
| Net of tax |
$ | (412 | ) | $ | — | $ | — | |||||||
|
|
|
|
|
|
|
|||||||||
| Amortization of Defined Benefit Pension Items: |
||||||||||||||
| Prior service costs |
$ | (76 | ) | $ | 891 | $ | — | |||||||
| Transition obligation |
— | 246 | — | |||||||||||
| Actuarial losses |
(20 | ) | 991 | — | ||||||||||
|
|
|
|
|
|
|
|||||||||
| Total before tax |
$ | (96 | ) | $ | 2,128 | $ | — | Salaries, benefits and other compensation | ||||||
| Income taxes |
37 | (809 | ) | — | Income tax provision | |||||||||
|
|
|
|
|
|
|
|||||||||
| Net of tax |
$ | (59 | ) | $ | 1,319 | $ | — | |||||||
|
|
|
|
|
|
|
|||||||||
| Total reclassifications |
$ | (1,387 | ) | $ | 676 | $ | (2,180 | ) | ||||||
|
|
|
|
|
|
|
|||||||||
114
Table of Contents
23. LEGAL AND OTHER PROCEEDINGS
As initially disclosed in 2011, we were served with a complaint, filed in the U.S. Bankruptcy Court for the Eastern District of Pennsylvania, by a bankruptcy trustee relating to a former WSFS Bank customer. The complaint challenges the Bank’s actions relating to the repayment of an outstanding loan and also seeks to avoid and recover the pre-bankruptcy repayment of that loan, approximately $5.0 million. The matter has been captioned Goldstein v. Wilmington Savings Fund Society, FSB (In re: Universal Marketing, Inc.), Chapter 7, Case No. 09-15404 (ELF), Adv. Pro. No. 11-00512. We believe we acted appropriately and we are vigorously defending ourselves against the complaint.
On November 24, 2015 the Court entered summary judgment in favor of WSFS Bank on all but one of the remaining counts, leaving one count for resolution at trial. Based upon available information we believe the estimate of the aggregate range of reasonably possible losses for this legal proceeding is from approximately $0 to approximately $5.0 million at December 31, 2015. Costs of litigation were initially covered by insurance; however, such costs have now exceeded the limits of insurance coverage for this case.
Four purported shareholder derivative and class action complaints relating to the October 2015 merger with Alliance were filed during the quarter ended June 30, 2015. These actions were consolidated under the caption In re: Alliance Bancorp, Inc. of Pennsylvania Derivative and Class Action Litigation, Court of Common Pleas of Delaware County, Pennsylvania, Consol. Action Lead Case No. 2015-3606 (Civil Div.) (the Alliance Action). The complaint named as defendants Alliance Bancorp, Inc. of Pennsylvania, its directors and certain of its officers, and the Company (the Defendants).
As previously disclosed, on June 11, 2015, solely to avoid the costs, risks and uncertainties inherent in litigation, Alliance, WSFS and the other Defendants entered into a Memorandum of Understanding (the MOU) with the plaintiffs ( the Plaintiffs) regarding the settlement of the Alliance Action. Pursuant to the MOU, Alliance filed with the SEC and made publicly available to Alliance shareholders supplemental disclosures, and the Plaintiffs agreed to release Alliance, WSFS and the other Defendants from all claims related to the Merger Agreement and the proposed merger, subject to approval of the Court of Common Pleas of Delaware County (the Court). In the MOU, the parties agreed to negotiate in good faith to prepare a stipulation of settlement to be filed with the Court and other documentation as may be required to effectuate the settlement. Management does not expect this settlement to have a material impact on the Company’s Consolidated Statements of Operations or Consolidated Statements of Condition. There can be no assurance that the parties ultimately will enter into a stipulation of settlement or that the Court will approve the settlement even if the parties were to enter into such stipulation. The proposed settlement contemplated by the MOU will become void in the event that the parties do not enter into such stipulation or the Court does not approve the settlement.
Additionally, in 2013 a regulatory inquiry commenced into the registrar and transfer agent (“RTA”) activities of WSFS, as successor to Christiana Bank & Trust. As a result of issues arising from that inquiry, WSFS revamped Christiana Trust’s RTA policies and procedures and remediated all deficiencies. We have included the estimated financial liability from the expected resolution of this inquiry, which is not material, in our Consolidated Financial Statements as of December 31, 2015.
From time-to-time we are brought into certain legal matters and/or disputes through our Wealth Management segment, as a result of sometimes highly complex documents and servicing requirements that are part of this business. While the outcomes carry some degree of uncertainty, management does not currently anticipate that the ultimate liability, if any, arising out of such other proceedings we are aware of, will have a material effect on the Consolidated Financial Statements.
There were no material changes or additions to other significant pending legal or other proceedings involving us other than those arising out of routine operations.
115
Table of Contents
24. SUBSEQUENT EVENTS
We reviewed subsequent events and determined that no further disclosures or measurements were required.
QUARTERLY FINANCIAL SUMMARY (Unaudited)
| Three months ended |
12/31/2015 | 9/30/2015 | 6/30/2015 | 3/31/2015 | 12/31/2014 | 9/30/2014 | 6/30/2014 | 3/31/2014 | ||||||||||||||||||||||||
| (In Thousands, Except Per Share Data) | ||||||||||||||||||||||||||||||||
| Interest income |
$ | 51,813 | $ | 44,857 | $ | 43,055 | $ | 42,851 | $ | 42,340 | $ | 40,799 | $ | 39,413 | $ | 37,785 | ||||||||||||||||
| Interest expense |
3,917 | 3,860 | 3,965 | 4,034 | 4,101 | 4,052 | 3,936 | 3,741 | ||||||||||||||||||||||||
|
|
|
|
|
|
|
|
|
|
|
|
|
|
|
|
|
|||||||||||||||||
| Net interest income |
47,896 | 40,997 | 39,090 | 38,817 | 38,239 | 36,747 | 35,477 | 34,044 | ||||||||||||||||||||||||
| Provision for loan losses |
1,778 | 1,453 | 3,773 | 786 | 567 | 333 | 50 | 2,630 | ||||||||||||||||||||||||
|
|
|
|
|
|
|
|
|
|
|
|
|
|
|
|
|
|||||||||||||||||
| Net interest income after provision for loan losses |
46,118 | 39,544 | 35,317 | 38,031 | 37,672 | 36,414 | 35,427 | 31,414 | ||||||||||||||||||||||||
| Noninterest income |
23,037 | 21,665 | 22,458 | 21,095 | 19,987 | 20,304 | 19,623 | 18,364 | ||||||||||||||||||||||||
| Noninterest expenses |
47,187 | 38,705 | 38,654 | 38,913 | 38,374 | 39,163 | 35,224 | 33,884 | ||||||||||||||||||||||||
|
|
|
|
|
|
|
|
|
|
|
|
|
|
|
|
|
|||||||||||||||||
| Income before taxes |
21,968 | 22,504 | 19,121 | 20,213 | 19,285 | 17,555 | 19,826 | 15,894 | ||||||||||||||||||||||||
| Income tax provision (benefit) |
7,984 | 8,078 | 6,887 | 7,324 | 6,577 | 6,142 | 7,101 | (1,017 | ) | |||||||||||||||||||||||
|
|
|
|
|
|
|
|
|
|
|
|
|
|
|
|
|
|||||||||||||||||
| Net Income |
$ | 13,984 | $ | 14,426 | $ | 12,234 | $ | 12,889 | $ | 12,708 | $ | 11,413 | $ | 12,725 | $ | 16,911 | ||||||||||||||||
|
|
|
|
|
|
|
|
|
|
|
|
|
|
|
|
|
|||||||||||||||||
| Earnings per share: |
||||||||||||||||||||||||||||||||
| Basic |
$ | 0.47 | $ | 0.52 | $ | 0.43 | $ | 0.46 | $ | 0.45 | $ | 0.42 | $ | 0.48 | $ | 0.63 | ||||||||||||||||
| Diluted |
0.46 | 0.51 | 0.43 | 0.45 | 0.44 | 0.41 | 0.46 | 0.62 | ||||||||||||||||||||||||
116
Table of Contents
ITEM 9. CHANGES IN AND DISAGREEMENTS WITH ACCOUNTANTS ON ACCOUNTING AND FINANCIAL DISCLOSURE
There are no matters required to be disclosed under this item.
ITEM 9A. CONTROLS AND PROCEDURES
Disclosure Controls and Procedures
With the participation of our Chief Executive Officer and Chief Financial Officer, we evaluated the effectiveness of our disclosure controls and procedures as of December 31, 2015. Based on that evaluation, the Chief Executive Officer and Chief Financial Officer concluded that our disclosure controls and procedures were effective as of such date.
Changes in Internal Control over Financial Reporting
There have been no changes in our internal control over financial reporting during the most recent fiscal quarter that have materially affected, or are reasonably likely to materially affect, our internal control over financial reporting.
On May 14, 2013, the Committee of Sponsoring Organizations of the Treadway Commission issued an updated version of its Internal Control – Integrated Framework (2013 Framework). Originally issued in 1992, the framework provides principles-based guidance for designing and implementing effective internal controls. The Company transitioned to the 2013 Framework in 2015.
117
Table of Contents
Management’s Report on Internal Control Over Financial Reporting
To Our Stockholders:
Management of WSFS Financial Corporation (the “Corporation”) is responsible for establishing and maintaining adequate internal control over financial reporting as defined in Rule 13a-15(f) under the Securities Exchange Act of 1934. The Corporation’s internal control over financial reporting is a process designed by, or under the supervision of, the Corporation’s Chief Executive Officer and Chief Financial Officer to provide reasonable assurance regarding the reliability of financial reporting and the preparation of the Corporation’s financial statements for external purposes in accordance with generally accepted accounting principles.
Management assessed the effectiveness of the Corporation’s internal control over financial reporting as of December 31, 2015. In making this assessment, management used the criteria set forth by the Committee of Sponsoring Organizations of the Treadway Commission (COSO) in Internal Control — Integrated Framework (2013). Based on this assessment, management has concluded that, as of December 31, 2015, the Corporation’s internal control over financial reporting was effective based on those criteria.
Because of its inherent limitations, internal control over financial reporting may not prevent or detect misstatements. Also, projections of any evaluation of effectiveness to future periods are subject to the risk that controls may become inadequate because of changes in conditions, or that the degree of compliance with the policies or procedures may deteriorate.
KPMG LLP, an independent registered public accounting firm, has audited the Corporation’s consolidated financial statements as of and for the year ended December 31, 2015 and the effectiveness of the Corporation’s internal control over financial reporting as of December 31, 2015, as stated in their reports, which are included herein.
| /s/ Mark A. Turner |
/s/ Rodger Levenson | |
| Mark A. Turner | Rodger Levenson | |
| President and Chief Executive Officer | Executive Vice President and | |
| Chief Financial Officer |
February 29, 2016
118
Table of Contents
Report of Independent Registered Public Accounting Firm
The Board of Directors and Stockholders
WSFS Financial Corporation:
We have audited WSFS Financial Corporation and subsidiaries’ internal control over financial reporting as of December 31, 2015, based on criteria established in Internal Control — Integrated Framework (2013) issued by the Committee of Sponsoring Organizations of the Treadway Commission (COSO). WSFS Financial Corporation and subsidiaries’ management is responsible for maintaining effective internal control over financial reporting and for its assessment of the effectiveness of internal control over financial reporting, included in the accompanying Management’s Report on Internal Control Over Financial Reporting. Our responsibility is to express an opinion on the Company’s internal control over financial reporting based on our audit.
We conducted our audit in accordance with the standards of the Public Company Accounting Oversight Board (United States). Those standards require that we plan and perform the audit to obtain reasonable assurance about whether effective internal control over financial reporting was maintained in all material respects. Our audit included obtaining an understanding of internal control over financial reporting, assessing the risk that a material weakness exists, and testing and evaluating the design and operating effectiveness of internal control based on the assessed risk. Our audit also included performing such other procedures as we considered necessary in the circumstances. We believe that our audit provides a reasonable basis for our opinion.
A company’s internal control over financial reporting is a process designed to provide reasonable assurance regarding the reliability of financial reporting and the preparation of financial statements for external purposes in accordance with generally accepted accounting principles. A company’s internal control over financial reporting includes those policies and procedures that (1) pertain to the maintenance of records that, in reasonable detail, accurately and fairly reflect the transactions and dispositions of the assets of the company; (2) provide reasonable assurance that transactions are recorded as necessary to permit preparation of financial statements in accordance with generally accepted accounting principles, and that receipts and expenditures of the company are being made only in accordance with authorizations of management and directors of the company; and (3) provide reasonable assurance regarding prevention or timely detection of unauthorized acquisition, use, or disposition of the company’s assets that could have a material effect on the financial statements.
Because of its inherent limitations, internal control over financial reporting may not prevent or detect misstatements. Also, projections of any evaluation of effectiveness to future periods are subject to the risk that controls may become inadequate because of changes in conditions, or that the degree of compliance with the policies or procedures may deteriorate.
In our opinion, WSFS Financial Corporation and subsidiaries maintained, in all material respects, effective internal control over financial reporting as of December 31, 2015, based on Internal Control — Integrated Framework (2013) issued by the Committee of Sponsoring Organizations of the Treadway Commission (COSO).
We also have audited, in accordance with the standards of the Public Company Accounting Oversight Board (United States), the consolidated statements of condition of WSFS Financial Corporation and subsidiaries as of December 31, 2015 and 2014, and the related consolidated statements of operations, comprehensive income, changes in stockholders’ equity, and cash flows for each of the years in the three-year period ended December 31, 2015 and our report dated February 29, 2016 expressed an unqualified opinion on those consolidated financial statements.
/s/ KPMG LLP
Philadelphia, Pennsylvania
February 29, 2016
119
Table of Contents
There are no matters required to be disclosed under this item.
ITEM 10. DIRECTORS, EXECUTIVE OFFICERS AND CORPORATE GOVERNANCE
The Information under “Directors and Officers of WSFS Financial Corporation and Wilmington Savings Fund Society, FSB” and “Corporate Governance — Committees of the Board of Directors” in the Registrant’s definitive proxy statement for the registrant’s Annual Meeting of Stockholders to be held on April 28, 2016 (the Proxy Statement) is incorporated into this item by reference.
We have adopted a Code of Ethics that applies to our principal executive officer, principal financial officer, principal accounting officer, Controller or persons performing similar functions. A copy of the Code of Ethics is posted on our website at www.wsfsbank.com.
ITEM 11. EXECUTIVE COMPENSATION
The information under the heading “Compensation” and “Compensation of the Board of Directors” in the Proxy Statement is incorporated into this item by reference.
ITEM 12. SECURITY OWNERSHIP OF CERTAIN BENEFICIAL OWNERS AND MANAGEMENT AND RELATED SHAREHOLDER MATTERS
| (a) | Security Ownership of Certain Beneficial Owners |
Information required by this item is incorporated herein by reference to the section captioned “Other Information — Large Stockholders” of the Proxy Statement
| (b) | Security Ownership of Management |
Information required by this item is incorporated herein by reference to the section captioned “Directors and Officers of WSFS Financial Corporation and Wilmington Savings Fund Society, FSB — Ownership of WSFS Financial Corporation Common Stock” of the Proxy Statement
| (c) | We know of no arrangements, including any pledge by any person of our securities, the operation of which may at a subsequent date result in a change in control of the registrant |
| (d) | Securities Authorized for Issuance Under Equity Compensation Plans |
Shown below is information as of December 31, 2015 with respect to compensation plans under which equity securities of the Registrant are authorized for issuance.
| Equity Compensation Plan Information | ||||||||||||
| (a) | (b) | (c) | ||||||||||
| Number of Securities to be issued upon exercise of outstanding options, warrants and rights |
Weighted-Average exercise price of outstanding options, warrants and rights |
Number of securities remaining available for future issuance under equity compensation plans (excluding securities reflected in column) (a) |
||||||||||
| Equity compensation plans approved by stockholders (1) |
1,772,906 | $ | 15.86 | 946,146 | ||||||||
| Equity compensation plans not approved by stockholders |
N/A | N/A | N/A | |||||||||
|
|
|
|
|
|
|
|||||||
| TOTAL |
1,772,906 | $ | 15.86 | 946,146 | ||||||||
|
|
|
|
|
|
|
|||||||
| (1) | Plans approved by stockholders include the 2005 Incentive Plan, as amended, and the 2013 Incentive Plan. |
120
Table of Contents
ITEM 13. CERTAIN RELATIONSHIPS AND RELATED TRANSACTIONS, AND DIRECTOR INDEPENDENCE
The information under “Directors and Officers of WSFS Financial Corporation and Wilmington Savings Fund Society, FSB — Transactions with our Insiders” in the Proxy Statement is incorporated into this item by reference.
ITEM 14. PRINCIPAL ACCOUNTANT FEES AND SERVICES
The information under “Committees of the Board of Directors — Audit Committee” in the Proxy Statement is incorporated into this item by reference.
ITEM 15. EXHIBITS AND FINANCIAL STATEMENT SCHEDULES
| (a) | Listed below are all financial statements and exhibits filed as part of this report, and which are herein incorporated by reference. |
| 1. | The Consolidated Statements of Condition of WSFS Financial Corporation and subsidiary as of December 31, 2015 and 2014, and the related Consolidated Statements of Operations, Changes in Stockholders’ Equity and Cash Flows for each of the years in the three year period ended December 31, 2015, together with the related notes and the report of KPMG LLP, independent registered public accounting firm. |
| 2. | Schedules omitted as they are not applicable. |
121
Table of Contents
The following exhibits are incorporated by reference herein or annexed to this Annual Report:
| Exhibit |
Description of Document | |
| 3.1 | Registrant’s Amended and Restated Certificate of Incorporation, is incorporated herein by reference to Exhibit 3.1 of the Registrant’s Annual Report on Form 10-K for the year ended December 31, 2011. | |
| 3.2 | Certificate of Amendment, dated May 1, 2015, to the Registrant’s Amended and Restated Certificate of Incorporation is incorporated by reference to Exhibit 3.1 of the Registrant’s Current Report on Form 8-K filed on May 5, 2015. | |
| 3.3 | Amended and Restated Bylaws of WSFS Financial Corporation, incorporated herein by reference to Exhibit 3.2 of the Registrant’s Current Report on Form 8-K filed on November 21, 2014. | |
| 10.1 | WSFS Financial Corporation, 1994 Short Term Management Incentive Plan Summary Plan Description is incorporated herein by reference to Exhibit 10.7 of the Registrant’s Annual Report on Form 10-K for the year ended December 31, 1994. | |
| 10.2 | Amended and Restated Wilmington Savings Fund Society, Federal Savings Bank 1997 Stock Option Plan is incorporated herein by reference to the Registrant’s Registration Statement on Form S-8 (File No. 333-26099) filed with the Commission on April 29, 1997. | |
| 10.3 | 2000 Stock Option and Temporary Severance Agreement among Wilmington Savings Fund Society, Federal Savings Bank, WSFS Financial Corporation and Marvin N. Schoenhals on February 24, 2000 is incorporated herein by reference to Exhibit 10.4 of the Registrant’s Annual Report on Form 10-K for the year ended December 31, 2000. | |
| 10.4 | WSFS Financial Corporation Severance Policy for Executive Vice Presidents dated February 28, 2008, incorporated herein by reference to Exhibit 10.4 of the Registrant’s Annual Report on Form 10-K for the year ended December 31, 2008. | |
| 10.5 | WSFS Financial Corporation’s 2005 Incentive Plan is incorporated herein by reference to appendix A of the Registrant’s Definitive Proxy Statement on Schedule 14-A for the 2005 Annual Meeting of Stockholders. | |
| 10.6 | Amendment to WSFS Financial Corporation 2005 Incentive Plan for IRC 409A and FAS 123R dated December 31, 2008, incorporated herein by reference to Exhibit 10.6 of the Registrant’s Annual Report on Form 10-K for the year ended December 31, 2008. | |
| 10.7 | Amendment to the WSFS Financial Corporation Severance Policy for Executive Vice Presidents dated December 31, 2008, incorporated herein by reference to Exhibit 10.7 of the Registrant’s Annual Report on Form 10-K for the year ended December 31, 2008. | |
| 10.8 | WSFS Financial Corporation’s 2013 Incentive Plan is incorporated herein by reference to appendix A of the Registrant’s Definitive Proxy Statement on Schedule 14-A for the 2013 Annual Meeting of Stockholders. | |
| 10.9 | Agreement and Plan of Reorganization, dated as of March 2, 2015, by and between WSFS Financial Corporation and Alliance Bancorp, Inc. of Pennsylvania, incorporated herein by reference to Exhibit 2.1 of the Registrant’s Form 8-K filed on March 6, 2015. | |
| 10.10 | Agreement and Plan of Reorganization, dated as of November 23, 2015, by and between WSFS Financial Corporation and Penn Liberty Financial Corp, incorporated herein by reference to Exhibit 2.1 of the Registrant’s Form 8-K filed on November 23, 2015. | |
| 21 | Subsidiaries of Registrant. | |
| 23 | Consent of KPMG LLP | |
| 24 | Power of Attorney (included on signature page to this report) | |
| 31.1 | Certification of CEO pursuant to Section 302 of the Sarbanes-Oxley Act of 2002 | |
| 31.2 | Certification of CFO pursuant to Section 302 of the Sarbanes-Oxley Act of 2002 | |
122
Table of Contents
| Exhibit |
Description of Document | |
| 32 | Certification pursuant to 18 U.S.C. Section 1350, as adopted pursuant to Section 906 of the Sarbanes-Oxley Act of 2002 | |
| 101.INS | XBRL Instance Document * | |
| 101.SCH | XBRL Schema Document * | |
| 101.CAL | XBRL Calculation Linkbase Document * | |
| 101.LAB | XBRL Labels Linkbase Document * | |
| 101.PRE | XBRL Presentation Linkbase Document * | |
| 101.DEF | XBRL Definition Linkbase Document * | |
* Submitted as Exhibits 101 to this Form 10-K are documents formatted in XBRL (Extensible Business Reporting Language). Pursuant to Rule 406T of Regulation S-T, these interactive data files are deemed not filed or part of a registration statement or prospectus for purposes of Sections 11 or 12 of the Securities Act of 1933 or Section 18 of the Securities Exchange Act of 1934, as amended, and otherwise are not subject to liability.
Exhibits 10.1 through 10.8 represent management contracts or compensatory plan arrangements.
123
Table of Contents
Pursuant to the requirements of Section 13 or 15(d) of the Securities Exchange Act of 1934, the registrant has duly caused this report to be signed on its behalf by the undersigned, thereunto duly authorized.
| WSFS FINANCIAL CORPORATION | ||||||||||
| Date: | February 29, 2016 | BY: | /s/ Mark A. Turner | |||||||
|
| ||||||||||
| Mark A. Turner | ||||||||||
| President and Chief Executive Officer | ||||||||||
Pursuant to the requirements of the Securities Exchange Act of 1934, this report has been signed below by the following persons on behalf of the registrant and in the capacities and on the dates indicated.
| Date: | February 29, 2016 | BY: | /s/ Marvin N. Schoenhals | |||||||
| Marvin N. Schoenhals | ||||||||||
| Chairman | ||||||||||
| Date: | February 29, 2016 | BY: | /s/ Mark A. Turner | |||||||
| Mark A. Turner | ||||||||||
| President , Chief Executive Officer and | ||||||||||
| Director | ||||||||||
| Date: | February 29, 2016 | BY: | /s/ Charles G. Cheleden | |||||||
| Charles G. Cheleden | ||||||||||
| Vice Chairman and Lead Director | ||||||||||
| Date: | February 29, 2016 | BY: | /s/ Anat Bird | |||||||
| Anat Bird | ||||||||||
| Director | ||||||||||
| Date: | February 29, 2016 | BY: | /s/ Francis B. Brake | |||||||
| Francis B. Brake | ||||||||||
| Director | ||||||||||
| Date: | February 29, 2016 | BY: | /s/ Eleuthère I. du Pont | |||||||
| Eleuthère I. du Pont | ||||||||||
| Director | ||||||||||
| Date: | February 29, 2016 | BY: | /s/ Jennifer W. Davis | |||||||
| Jennifer W. Davis | ||||||||||
| Director | ||||||||||
| Date: | February 29, 2016 | BY: | /s/ Donald W. Delson | |||||||
| Donald W. Delson | ||||||||||
| Director | ||||||||||
| Date: | February 29, 2016 | BY: | /s/ Calvert A. Morgan, Jr. | |||||||
| Calvert A. Morgan, Jr. | ||||||||||
| Director | ||||||||||
124
Table of Contents
| Date: | February 29, 2016 | BY: | /s/ David G. Turner | |||||
| David G. Turner | ||||||||
| Director | ||||||||
| Date: | February 29, 2016 | BY: | /s/ Rodger Levenson | |||||
| Rodger Levenson | ||||||||
| Executive Vice President and | ||||||||
| Chief Financial Officer | ||||||||
| Date: | February 29, 2016 | BY: | /s/ Charles K. Mosher | |||||
| Charles K. Mosher | ||||||||
| Senior Vice President and Controller | ||||||||
125