Attached files
| file | filename |
|---|---|
| EX-99.1 - EXHIBIT 99.1 - QUAKER CHEMICAL CORP | tm217958d1_ex99-1.htm |
| 8-K - FORM 8-K - QUAKER CHEMICAL CORP | tm217958d1_8k.htm |
Exhibit 99.2

Quaker Houghton Fourth Quarter and Full Year 2020 Results Investor Conference Call
On August 1, 2019, Quaker Chemical Corporation (the “Company”, also known as Quaker Houghton) completed its combination with Hou ghton International, Inc. (“Houghton”) (herein referred to as “the Combination”). In addition, the Company acquired the operating divisions of Norman Hay plc (“Norman Hay”) on October 1, 2019. Throughout this presentation, all figures presented, unless otherwise stated, reflect the results of operations of the combined company for the three months ended December 31, 2020 and 2019. Further, all year - to - date figures pre sented throughout the presentation for the year ended December 31, 2020 reflect the results of the combined company and for the year ended December 31, 2019 include five months of operations of Houghton post - clos ing of the Combination and three months of operations of Norman Hay post - closing. Regulation G The attached charts include Company information that does not conform to generally accepted accounting principles (“GAAP”). Man agement believes that an analysis of this data is meaningful to investors because it provides insight with respect to ongoing operating results of the Company and allows investors to better evaluate the financi al results of the Company. These measures should not be viewed as an alternative to GAAP measures of performance. Furthermore, these measures may not be consistent with similar measures provided by other companies . This data should be read in conjunction with the fourth quarter and full year earnings news release, dated February 25, 2021, which has been furnished to the Securities and Exchange Commission (“SEC”) on Fo rm 8 - K. Forward - Looking Statements This presentation contains "forward - looking statements" within the meaning of Section 27A of the Securities Act of 1933, as amen ded, and Section 21E of the Securities Exchange Act of 1934, as amended. These statements can be identified by the fact that they do not relate strictly to historical or current facts. We have based thes e f orward - looking statements including statements regarding the potential effects of the COVID - 19 pandemic on the Company’s business, results of operations, and financial condition, our expectations that we will maintain su ffi cient liquidity and remain in compliance with the terms of the Company’s credit facility, and statements regarding remediation of our material weaknesses in internal control over financial reporting on our current expec tat ions about future events. These forward - looking statements include statements with respect to our beliefs, plans, objectives, goals, expectations, anticipations, intentions, financial condition, results of op era tions, future performance, and business, including but not limited to the potential benefits of the Combination and other acquisitions, the impacts on our business as a result of the COVID - 19 pandemic and any projected global ec onomic rebound or anticipated positive results due to Company actions taken in response to the pandemic, and our current and future results and plans and statements that include the words "may," "could," "sh ould," "would," "believe," "expect," "anticipate," "estimate," "intend," "plan" or similar expressions. These forward - looking statements are subject to certain risks and uncertainties that could cause actual results to differ materially from those projected in such statements. A major risk is that demand for the Company's products and services is largely derived from the demand for its customers' products, which subjects the Compan y t o uncertainties related to downturns in a customer's business and unanticipated customer production shutdowns. Other major risks and uncertainties include, but are not limited to, the primary and secondar y i mpacts of the COVID - 19 pandemic, including actions taken in response to the pandemic by various governments, which could exacerbate some or all of the other risks and uncertainties faced by the Company, includi ng the potential for significant increases in raw material costs, supply chain disruptions, customer financial instability, worldwide economic and political disruptions, foreign currency fluctuations, significant chan ges in applicable tax rates and regulations, future terrorist attacks and other acts of violence. Furthermore, the Company is subject to the same business cycles as those experienced by our customers in the steel, automobil e, aircraft, industrial equipment, and durable goods industries. The ultimate impact of COVID - 19 on our business will depend on, among other things, the extent and duration of the pandemic, the severity of the diseas e and the number of people infected with the virus, the continued uncertainty regarding availability, administration and long - term efficacy of a vaccine, or other treatments, including on new strands or mutations of the virus, the longer - term effects on the economy by the pandemic, including the resulting market volatility, and by the measures taken by governmental authorities and other third parties restricting day - to - day life and business operations and the length of time that such measures remain in place, as well as laws and other governmental programs implemented to address the pandemic or assist impacted businesses, such as fiscal stimul us and other legislation designed to deliver monetary aid and other relief. Other factors could also adversely affect us, including those related to the Combination and other acquisitions and the integration of acqu ire d businesses. Our forward - looking statements are subject to risks, uncertainties and assumptions about the Company and its operations that are subject to change based on various important factors, some of which ar e beyond our control. These risks, uncertainties, and possible inaccurate assumptions relevant to our business could cause our actual results to differ materially from expected and historical results . All forward - looking statements included in this presentation, including expectations about the improvements in business conditions during 2021 and future periods, are based upon information available to the Company as of th e date of this presentation, which may change. Therefore, we caution you not to place undue reliance on our forward - looking statements. For more information regarding these risks and uncertainties as well as certain additional risks that we face, refer to the Risk Factors section, which appears in Item 1A of our Annual Report on Form 10 - K for the year ended December 31, 2019, our Quarterly Report on Form 10 - Q for the quarte r ended September 30, 2020, and in subsequent reports filed from time to time with the Securities and Exchange Commission, including, once filed, our Annual Report on Form 10 - K for the year ended December 31, 20 20. We do not intend to, and we disclaim any duty or obligation to, update or revise any forward - looking statements to reflect new information or future events or for any other reason. This discussion is provided as permitted by the Private Securities Litigation Reform Act of 1995. ©2019 Quaker Houghton. All Rights Reserved 2 Risks and Uncertainties Statement

Michael F. Barry Chairman of the Board, Chief Executive Officer & President Mary Dean Hall Senior Vice President, Chief Financial Officer & Treasurer Robert T. Traub Senior Vice President, General Counsel & Corporate Secretary Shane W. Hostetter Vice President, Finance & Chief Accounting Officer ©2019 Quaker Houghton. All Rights Reserved 3 Speakers

©2019 Quaker Houghton. All Rights Reserved 4 Fourth Quarter 2020 Headlines • Quarterly net sales of $385.9 million down 1% compared to the fourth quarter of 2019 but up 5% sequentially due to improved volumes on continued gradual COVID - 19 recovery • GAAP net income of $48.5 million compared to prior year fourth quarter net income of $15.2 million; non - GAAP net income of $29.3 million up 23% compared to $23.7 million in the prior year fourth quarter • Adjusted EBITDA of $65.5 million up 8% compared to the fourth quarter of 2019 and up 2% sequentially • Strong quarterly cash flow from operations of $66.3 million results in record full year operating cash flow of $178.4 million and 12% reduction in net debt during 2020 • Two recent bolt - on acquisitions expected to add approximately $11 million of adjusted EBITDA in 2021 • Full year 2021 adjusted EBITDA expected to be over 20% higher than $222 million in 2020
©2019 Quaker Houghton. All Rights Reserved 5 Chairman Comments Fourth Quarter of 2020 • Continue to see sales and volumes increase from the second and third quarter levels with sequential growth in each business segment including net market share gains of approximately 4% • Adjusted EBITDA grew 8% from the prior year fourth quarter and benefited from cost synergies of $18 million compared to $5 million in the fourth quarter of 2019 • Strong current quarter cashflow drove a full year reduction in net debt of $94 million or 12% compared to 2019 even with the $53 million December 2020 acquisition of Coral Chemical 2021 Outlook • Expect some short - term headwinds from higher raw material costs and lower than expected volumes in the automotive market due to the semiconductor shortage • Recent bolt - on acquisitions expected to add approximately $11 million in adjusted EBITDA in 2021 • Expect a step change in profitability with over a 20% increase in adjusted EBITDA compared to 2020 “ We feel positive about 2021 as we complete our integration cost synergies, continue to take further share in the marketplace, be nefit from a projected gradual rebound in demand, and see the positive impact of our recent acquisitions. ” – Michael F. Barry, Chairman, CEO and President
©2019 Quaker Houghton. All Rights Reserved 6 Financial Highlights – Actual Results Fourth quarter of 2020 • Net sales of $385.9 million decreased only 1% compared to $391.3 million in the Q4’19 primarily due to a 2% decrease from price and product mix, partially offset by a 1% positive impact from foreign currency translation; sales volumes were consistent with Q4’19 • Gross profit increased $5.9 million compared to Q4’19 primarily due to higher gross margins quarter - over - quarter; gross margin was 36.8% compared to 34.8% in Q4’19 which included a $1.5 million expense associated with selling acquired Norman Hay inventory at its fair value • Excluding the inventory adjustment, prior year estimated gross margin would have been approximately 35.3%; the estimated increase in gross margin quarter - over - quarter was primarily due to lower costs of goods sold as a result of the Company’s progress on Combination - related logistics, procurement and manufacturing costs savings initiatives • SG&A decreased $3.2 million compared to Q4’19 due primarily to the impact of COVID - 19 cost savings actions, including lower travel expenses, and the benefits of realized cost savings associated with the Combination, partially offset by the negative impact from foreign currency translation • Non - operating items compared to Q4’19 include a gain of $18.1 million related to restrictions lapsing on certain cash previously designated solely for the settlement of asbestos claims and lower interest expense due to a decline in interest rates in the current year, partially offset by higher foreign currency transaction losses compared to the prior year quarter • Effective tax rates of an expense of 4.9% and a benefit of 18.2% in Q4’20 and Q4’19, respectively, include various one - time impacts; without these items effective tax rates would have been ~30% and ~24% for Q4’20 and Q4’19, respectively
©2019 Quaker Houghton. All Rights Reserved 7 Financial Highlights – Non - GAAP Fourth quarter of 2020 Non - GAAP Results • Non - GAAP operating income increased 16% to $43.7 million compared to $37.6 million in Q4’19 primarily due to the benefits from cost savings related to the Combination, partially offset by the negative impacts of COVID - 19 • Non - GAAP adjusted EBITDA increased 8% to $65.5 million compared to $60.6 million in the prior year quarter primarily due to the benefits of cost synergies realized from the Combination, partially offset by the negative impacts of COVID - 19 and higher foreign currency transaction losses • 22% increase in non - GAAP EPS of $1.63 in Q4’20 compared to $1.34 in Q4’19 primarily due to the benefits of cost synergies realized from the Combination, partially offset by the negative impacts of COVID - 19, higher foreign currency transaction losses and an increase in the Company’s effective tax rate excluding certain non - GAAP tax items
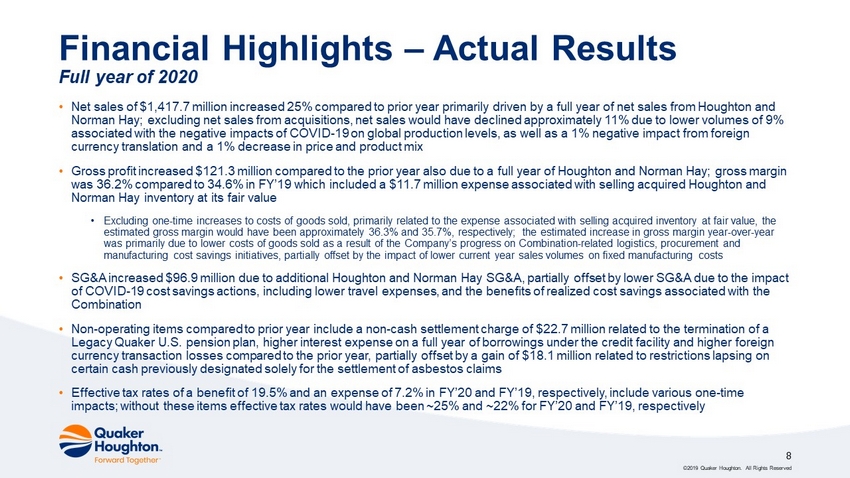
©2019 Quaker Houghton. All Rights Reserved 8 Financial Highlights – Actual Results Full year of 2020 • Net sales of $1,417.7 million increased 25% compared to prior year primarily driven by a full year of net sales from Houghton an d Norman Hay; excluding net sales from acquisitions, net sales would have declined approximately 11% due to lower volumes of 9% associated with the negative impacts of COVID - 19 on global production levels, as well as a 1% negative impact from foreign currency translation and a 1% decrease in price and product mix • Gross profit increased $121.3 million compared to the prior year also due to a full year of Houghton and Norman Hay; gross ma rgi n was 36.2% compared to 34.6% in FY’19 which included a $11.7 million expense associated with selling acquired Houghton and Norman Hay inventory at its fair value • Excluding one - time increases to costs of goods sold, primarily related to the expense associated with selling acquired inventory at fair value, the estimated gross margin would have been approximately 36.3% and 35.7%, respectively; the estimated increase in gross margin y ear - over - year was primarily due to lower costs of goods sold as a result of the Company’s progress on Combination - related logistics, procureme nt and manufacturing cost savings initiatives, partially offset by the impact of lower current year sales volumes on fixed manufactu rin g costs • SG&A increased $96.9 million due to additional Houghton and Norman Hay SG&A , partially offset by lower SG&A due to the impact of COVID - 19 cost savings actions, including lower travel expenses, and the benefits of realized cost savings associated with the Combination • Non - operating items compared to prior year include a non - cash settlement charge of $22.7 million related to the termination of a Legacy Quaker U.S. pension plan, higher interest expense on a full year of borrowings under the credit facility and higher fo rei gn currency transaction losses compared to the prior year, partially offset by a gain of $18.1 million related to restrictions l aps ing on certain cash previously designated solely for the settlement of asbestos claims • Effective tax rates of a benefit of 19.5% and an expense of 7.2% in FY’20 and FY’19, respectively, include various one - time impacts; without these items effective tax rates would have been ~25% and ~22% for FY’20 and FY’19, respectively
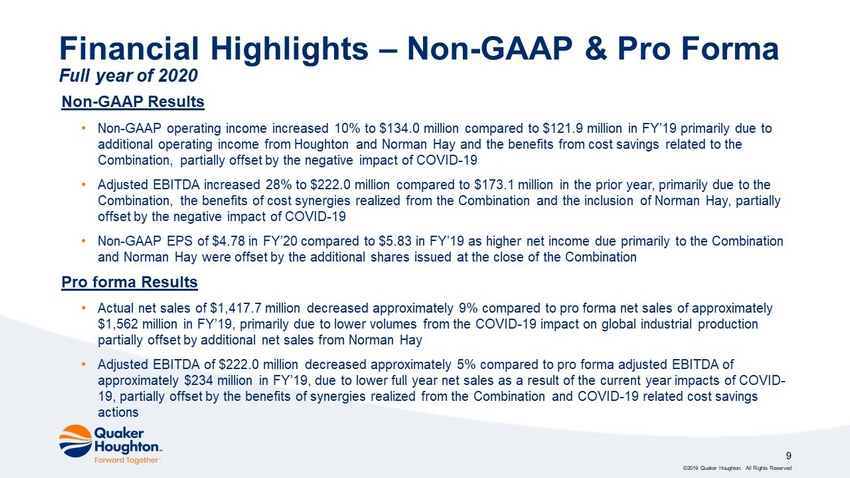
©2019 Quaker Houghton. All Rights Reserved 9 Financial Highlights – Non - GAAP & Pro Forma Full year of 2020 Non - GAAP Results • Non - GAAP operating income increased 10% to $134.0 million compared to $121.9 million in FY’19 primarily due to additional operating income from Houghton and Norman Hay and the benefits from cost savings related to the Combination, partially offset by the negative impact of COVID - 19 • Adjusted EBITDA increased 28% to $222.0 million compared to $173.1 million in the prior year, primarily due to the Combination, the benefits of cost synergies realized from the Combination and the inclusion of Norman Hay, partially offset by the negative impact of COVID - 19 • Non - GAAP EPS of $4.78 in FY’20 compared to $5.83 in FY’19 as higher net income due primarily to the Combination and Norman Hay were offset by the additional shares issued at the close of the Combination Pro forma Results • Actual net sales of $1,417.7 million decreased approximately 9% compared to pro forma net sales of approximately $1,562 million in FY’19, primarily due to lower volumes from the COVID - 19 impact on global industrial production partially offset by additional net sales from Norman Hay • Adjusted EBITDA of $222.0 million decreased approximately 5% compared to pro forma adjusted EBITDA of approximately $234 million in FY’19, due to lower full year net sales as a result of the current year impacts of COVID - 19, partially offset by the benefits of synergies realized from the Combination and COVID - 19 related cost savings actions
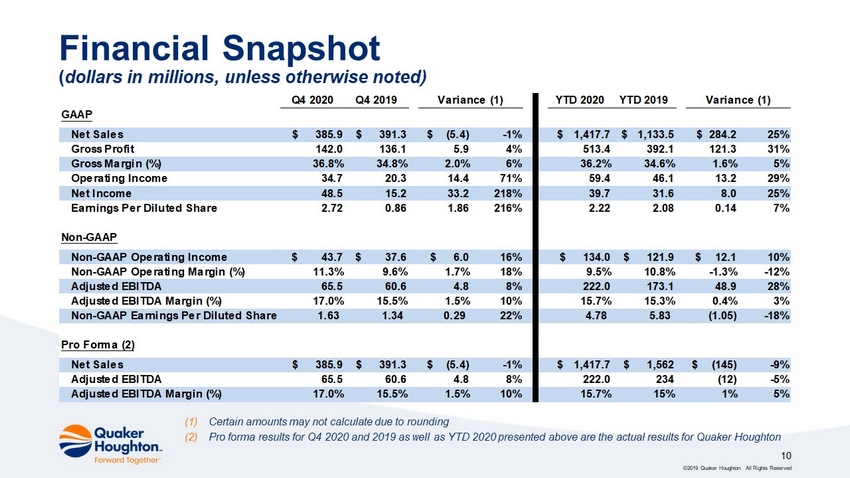
©2019 Quaker Houghton. All Rights Reserved 10 Financial Snapshot ( dollars in millions, unless otherwise noted) (1) Certain amounts may not calculate due to rounding (2) Pro forma results for Q4 2020 and 2019 as well as YTD 2020 presented above are the actual results for Quaker Houghton Q4 2020 Q4 2019 YTD 2020 YTD 2019 GAAP Net Sales $ 385.9 $ 391.3 $ (5.4) -1% $ 1,417.7 $ 1,133.5 $ 284.2 25% Gross Profit 142.0 136.1 5.9 4% 513.4 392.1 121.3 31% Gross Margin (%) 36.8% 34.8% 2.0% 6% 36.2% 34.6% 1.6% 5% Operating Income 34.7 20.3 14.4 71% 59.4 46.1 13.2 29% Net Income 48.5 15.2 33.2 218% 39.7 31.6 8.0 25% Earnings Per Diluted Share 2.72 0.86 1.86 216% 2.22 2.08 0.14 7% Non-GAAP Non-GAAP Operating Income $ 43.7 $ 37.6 $ 6.0 16% $ 134.0 $ 121.9 $ 12.1 10% Non-GAAP Operating Margin (%) 11.3% 9.6% 1.7% 18% 9.5% 10.8% -1.3% -12% Adjusted EBITDA 65.5 60.6 4.8 8% 222.0 173.1 48.9 28% Adjusted EBITDA Margin (%) 17.0% 15.5% 1.5% 10% 15.7% 15.3% 0.4% 3% Non-GAAP Earnings Per Diluted Share 1.63 1.34 0.29 22% 4.78 5.83 (1.05) -18% Pro Forma (2) Net Sales $ 385.9 $ 391.3 $ (5.4) -1% $ 1,417.7 $ 1,562 $ (145) -9% Adjusted EBITDA 65.5 60.6 4.8 8% 222.0 234 (12) -5% Adjusted EBITDA Margin (%) 17.0% 15.5% 1.5% 10% 15.7% 15% 1% 5% Variance (1) Variance (1)
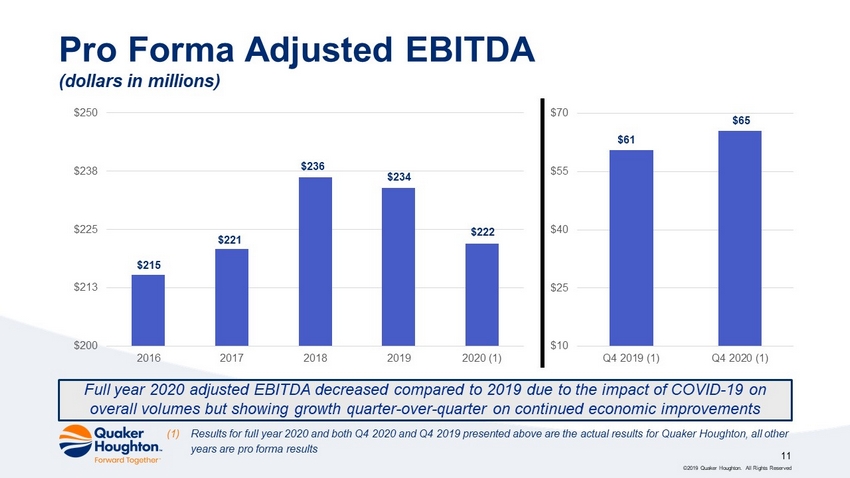
©2019 Quaker Houghton. All Rights Reserved 11 Pro Forma Adjusted EBITDA (dollars in millions) $215 $221 $236 $234 $222 $200 $213 $225 $238 $250 2016 2017 2018 2019 2020 (1) Full year 2020 adjusted EBITDA decreased compared to 2019 due to the impact of COVID - 19 on overall volumes but showing growth quarter - over - quarter on continued economic improvements $61 $65 $10 $25 $40 $55 $70 Q4 2019 (1) Q4 2020 (1) (1) Results for full year 2020 and both Q4 2020 and Q4 2019 presented above are the actual results for Quaker Houghton, all other years are pro forma results
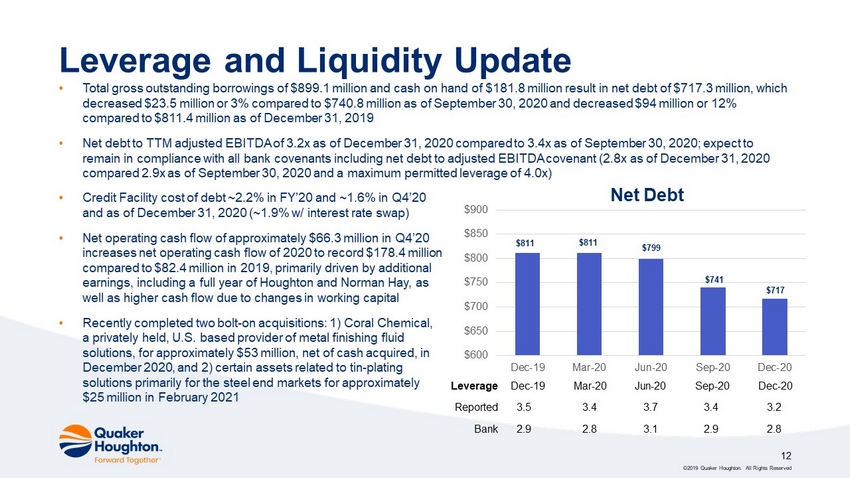
©2019 Quaker Houghton. All Rights Reserved 12 Leverage and Liquidity Update • Total gross outstanding borrowings of $899.1 million and cash on hand of $181.8 million result in net debt of $717.3 million, wh ich decreased $23.5 million or 3% compared to $740.8 million as of September 30, 2020 and decreased $94 million or 12% compared to $811.4 million as of December 31, 2019 • Net debt to TTM adjusted EBITDA of 3.2x as of December 31, 2020 compared to 3.4x as of September 30, 2020; expect to remain in compliance with all bank covenants including net debt to adjusted EBITDA covenant (2.8x as of December 31, 2020 compared 2.9x as of September 30, 2020 and a maximum permitted leverage of 4.0x) • Credit Facility cost of debt ~2.2% in FY’20 and ~1.6% in Q4’20 and as of December 31, 2020 (~1.9% w/ interest rate swap) • Net operating cash flow of approximately $66.3 million in Q4’20 increases net operating cash flow of 2020 to record $178.4 million compared to $82.4 million in 2019, primarily driven by additional earnings, including a full year of Houghton and Norman Hay, as well as higher cash flow due to changes in working capital • Recently completed two bolt - on acquisitions: 1) Coral Chemical, a privately held, U.S. based provider of metal finishing fluid solutions, for approximately $53 million, net of cash acquired, in December 2020, and 2) certain assets related to tin - plating solutions primarily for the steel end markets for approximately $25 million in February 2021 $811 $811 $799 $741 $717 $600 $650 $700 $750 $800 $850 $900 Dec-19 Mar-20 Jun-20 Sep-20 Dec-20 Net Debt Leverage Dec - 19 Mar - 20 Jun - 20 Sep - 20 Dec - 20 Reported 3.5 3.4 3.7 3.4 3.2 Bank 2.9 2.8 3.1 2.9 2.8
Appendix Actual and Non - GAAP Results
The information included in this presentation includes non - GAAP (unaudited) financial information that includes EBITDA, adjusted EBITDA, adjusted EBITDA margin, non - GAAP operating income, non - GAAP operating margin, non - GAAP net income, non - GAAP earnings per diluted share, and pro forma net sales, net income (loss) attributable to Qua ker Houghton, EBITDA, adjusted EBITDA, and adjusted EBITDA margin. The Company believes these non - GAAP financial measures provide meaningful supplemental information as they enhance a reader’s unders tanding of the financial performance of the Company, are indicative of future operating performance of the Company, and facilitate a comparison among fiscal periods, as the non - GAAP financial measures exclu de items that are not indicative of future operating performance or not considered core to the Company’s operations. Non - GAAP results and pro forma information are presented for supplemental informational purposes o nly and should not be considered a substitute for the financial information presented in accordance with GAAP. The Company presents EBITDA which is calculated as net income attributable to the Company before depreciation and amortizatio n, interest expense, net, and taxes on income before equity in net income of associated companies. The Company also presents adjusted EBITDA which is calculated as EBITDA plus or minus certain items that are not ind icative of future operating performance or not considered core to the Company’s operations. In addition, the Company presents non - GAAP operating income which is calculated as operating income plus or minus c ertain items that are not indicative of future operating performance or not considered core to the Company’s operations. Adjusted EBITDA margin and non - GAAP operating margin are calculated as the percentage of adju sted EBITDA and non - GAAP operating income to consolidated net sales, respectively. The Company believes these non - GAAP measures provide transparent and useful information and are widely used by an alysts, investors, and competitors in our industry as well as by management in assessing the operating performance of the Company on a consistent basis. Additionally, the Company presents non - GAAP net income and non - GAAP earnings per diluted share as additional performance measure s. Non - GAAP net income is calculated as adjusted EBITDA, defined above, less depreciation and amortization, interest expense, net, and taxes on income before equity in net income of associated companies , i n each case adjusted, as applicable, for any depreciation, amortization, interest or tax impacts resulting from the non - core items identified in the reconciliation of net income attributable to the Company to adjusted EBITDA. Non - GAAP earnings per diluted share is calculated as non - GAAP net income per diluted share as accounted for under the “two - class share method.” The Company believes that non - GAAP net income and non - GAAP e arnings per diluted share provide transparent and useful information and are widely used by analysts, investors, and competitors in our industry as well as by management in assessing the operating perfo rma nce of the Company on a consistent basis. In addition, the Company has provided certain unaudited pro forma financial information in this presentation. The unaudited pro forma financial information is based on the historical consolidated financial statements and results of both Quaker and Houghton and has been prepared to illustrate the effects of the Combination. The unaudited pro fo rma financial information has been presented for informational purposes only and is not necessarily indicative of Quaker Houghton’s past results of operations, nor is it indicative of the future operating results of Quaker Houghton and should not be considered a substitute for the financial information presented in accordance with GAAP. The Company has not provided pro forma financial information as it relates to the acquire d o perating divisions of Norman Hay plc based on materiality. Pro forma results for the year ended December 31, 2019 include five months of Houghton’s operations post - closing of the Combination, while Houghton reflects se ven months of results for the period from January 1, 2019 through July 31, 2019. Pro forma results for the years ended December 31, 2018, 2017 and 2016, respectively, include Quaker’s historical results, while Hou ghton reflects its stand - alone results. As it relates to 2021 projected adjusted EBITDA growth for the Company, including as a result of our recent acquisitions, as wel l as other forward - looking information described further above, the Company has not provided guidance for comparable GAAP measures or a quantitative reconciliation of forward - looking non - GAAP financial measures t o the most directly comparable U.S. GAAP measure because it is unable to determine with reasonable certainty the ultimate outcome of certain significant items necessary to calculate such measures without unre aso nable effort. These items include, but are not limited to, certain non - recurring or non - core items the Company may record that could materially impact net income, as well as the impact of COVID - 19. These items are uncert ain, depend on various factors, and could have a material impact on the U.S. GAAP reported results for the guidance period. The following charts should be read in conjunction with the Company’s fourth quarter and full year earnings news release date d F ebruary 25, 2021, which has been furnished to the Securities and Exchange Commission on Form 8 - K , and the Company’s Annual Report for the year ended December 31, 2019, and, once filed with the Securities and Exchange Comm iss ion, the Company’s Annual Report for the year ended December 31, 2020. These documents may contain additional explanatory language and information regarding certain of the items included in th e following reconciliations. ©2019 Quaker Houghton. All Rights Reserved 14 Non - GAAP and Pro Forma Measures
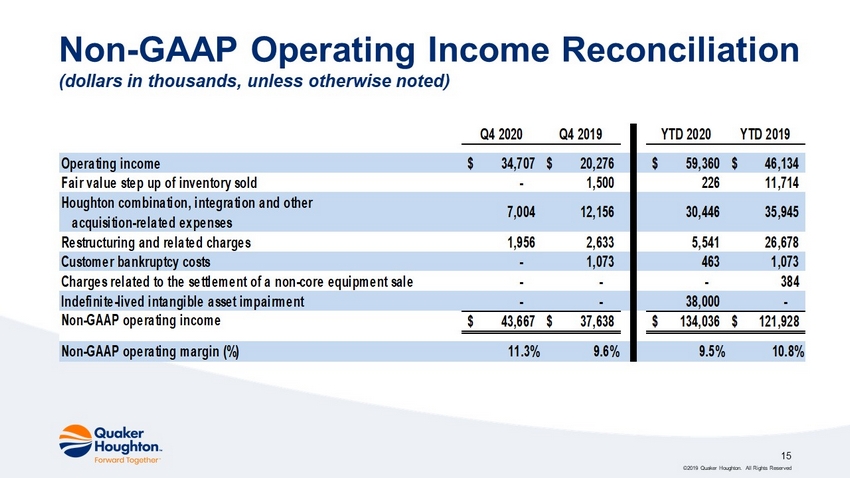
©2019 Quaker Houghton. All Rights Reserved 15 Non - GAAP Operating Income Reconciliation (dollars in thousands, unless otherwise noted) Q4 2020 Q4 2019 YTD 2020 YTD 2019 Operating income 34,707$ 20,276$ 59,360$ 46,134$ Fair value step up of inventory sold - 1,500 226 11,714 Houghton combination, integration and other acquisition-related expenses Restructuring and related charges 1,956 2,633 5,541 26,678 Customer bankruptcy costs - 1,073 463 1,073 Charges related to the settlement of a non-core equipment sale - - - 384 Indefinite-lived intangible asset impairment - - 38,000 - Non-GAAP operating income 43,667$ 37,638$ 134,036$ 121,928$ Non-GAAP operating margin (%) 11.3% 9.6% 9.5% 10.8% 35,945 30,446 12,156 7,004
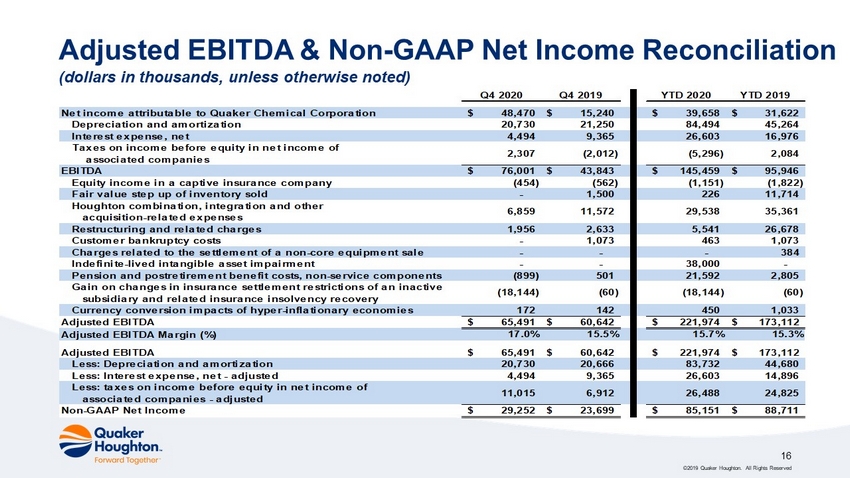
©2019 Quaker Houghton. All Rights Reserved 16 Adjusted EBITDA & Non - GAAP Net Income Reconciliation (dollars in thousands, unless otherwise noted) Q4 2020 Q4 2019 YTD 2020 YTD 2019 Net income attributable to Quaker Chemical Corporation 48,470$ 15,240$ 39,658$ 31,622$ Depreciation and amortization 20,730 21,250 84,494 45,264 Interest expense, net 4,494 9,365 26,603 16,976 Taxes on income before equity in net income of associated companies EBITDA 76,001$ 43,843$ 145,459$ 95,946$ Equity income in a captive insurance company (454) (562) (1,151) (1,822) Fair value step up of inventory sold - 1,500 226 11,714 Houghton combination, integration and other acquisition-related expenses Restructuring and related charges 1,956 2,633 5,541 26,678 Customer bankruptcy costs - 1,073 463 1,073 Charges related to the settlement of a non-core equipment sale - - - 384 Indefinite-lived intangible asset impairment - - 38,000 - Pension and postretirement benefit costs, non-service components (899) 501 21,592 2,805 Gain on changes in insurance settlement restrictions of an inactive subsidiary and related insurance insolvency recovery Currency conversion impacts of hyper-inflationary economies 172 142 450 1,033 Adjusted EBITDA 65,491$ 60,642$ 221,974$ 173,112$ Adjusted EBITDA Margin (%) 17.0% 15.5% 15.7% 15.3% Adjusted EBITDA 65,491$ 60,642$ 221,974$ 173,112$ Less: Depreciation and amortization 20,730 20,666 83,732 44,680 Less: Interest expense, net - adjusted 4,494 9,365 26,603 14,896 Less: taxes on income before equity in net income of associated companies - adjusted Non-GAAP Net Income 29,252$ 23,699$ 85,151$ 88,711$ 11,015 6,912 26,488 24,825 2,084 (5,296) (2,012) 2,307 35,361 29,538 11,572 6,859 (60) (18,144) (60) (18,144)
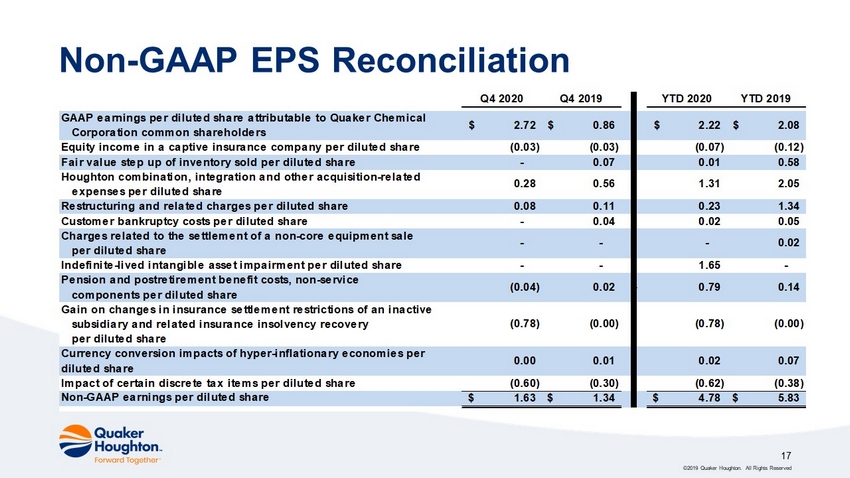
©2019 Quaker Houghton. All Rights Reserved 17 Non - GAAP EPS Reconciliation Q4 2020 Q4 2019 YTD 2020 YTD 2019 GAAP earnings per diluted share attributable to Quaker Chemical Corporation common shareholders Equity income in a captive insurance company per diluted share (0.03) (0.03) (0.07) (0.12) Fair value step up of inventory sold per diluted share - 0.07 0.01 0.58 Houghton combination, integration and other acquisition-related expenses per diluted share Restructuring and related charges per diluted share 0.08 0.11 0.23 1.34 Customer bankruptcy costs per diluted share - 0.04 0.02 0.05 Charges related to the settlement of a non-core equipment sale per diluted share Indefinite-lived intangible asset impairment per diluted share - - 1.65 - Pension and postretirement benefit costs, non-service components per diluted share Gain on changes in insurance settlement restrictions of an inactive subsidiary and related insurance insolvency recovery per diluted share Currency conversion impacts of hyper-inflationary economies per diluted share 0.00 0.01 0.02 0.07 Impact of certain discrete tax items per diluted share (0.60) (0.30) (0.62) (0.38) Non-GAAP earnings per diluted share 1.63$ 1.34$ 4.78$ 5.83$ - 0.14 0.79 0.02 (0.04) 2.08$ 2.22$ 0.86$ 2.72$ 2.05 1.31 0.56 0.28 (0.78) (0.00) (0.78) (0.00) 0.02 - -
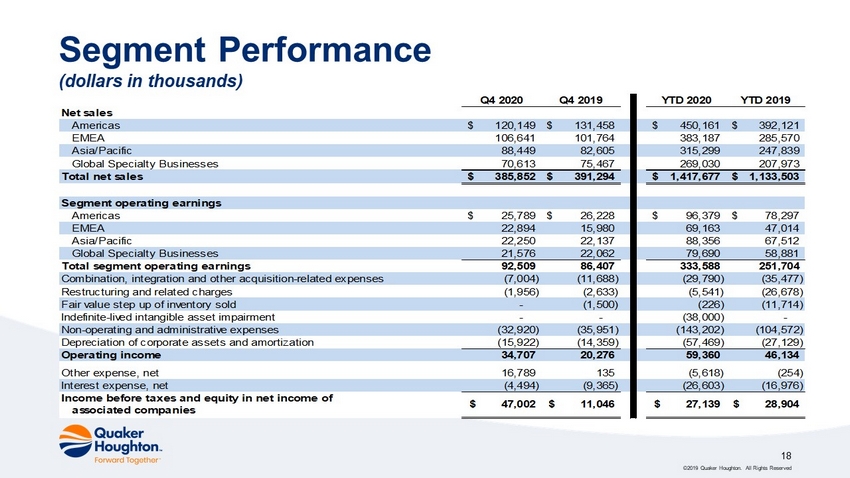
©2019 Quaker Houghton. All Rights Reserved 18 Segment Performance (dollars in thousands) Q4 2020 Q4 2019 YTD 2020 YTD 2019 Net sales Americas 120,149$ 131,458$ 450,161$ 392,121$ EMEA 106,641 101,764 383,187 285,570 Asia/Pacific 88,449 82,605 315,299 247,839 Global Specialty Businesses 70,613 75,467 269,030 207,973 Total net sales 385,852$ 391,294$ 1,417,677$ 1,133,503$ Segment operating earnings Americas 25,789$ 26,228$ 96,379$ 78,297$ EMEA 22,894 15,980 69,163 47,014 Asia/Pacific 22,250 22,137 88,356 67,512 Global Specialty Businesses 21,576 22,062 79,690 58,881 Total segment operating earnings 92,509 86,407 333,588 251,704 Combination, integration and other acquisition-related expenses (7,004) (11,688) (29,790) (35,477) Restructuring and related charges (1,956) (2,633) (5,541) (26,678) Fair value step up of inventory sold - (1,500) (226) (11,714) Indefinite-lived intangible asset impairment - - (38,000) - Non-operating and administrative expenses (32,920) (35,951) (143,202) (104,572) Depreciation of corporate assets and amortization (15,922) (14,359) (57,469) (27,129) Operating income 34,707 20,276 59,360 46,134 Other expense, net 16,789 135 (5,618) (254) Interest expense, net (4,494) (9,365) (26,603) (16,976) Income before taxes and equity in net income of associated companies 28,904$ 27,139$ 11,046$ 47,002$
Appendix Pro Forma Results
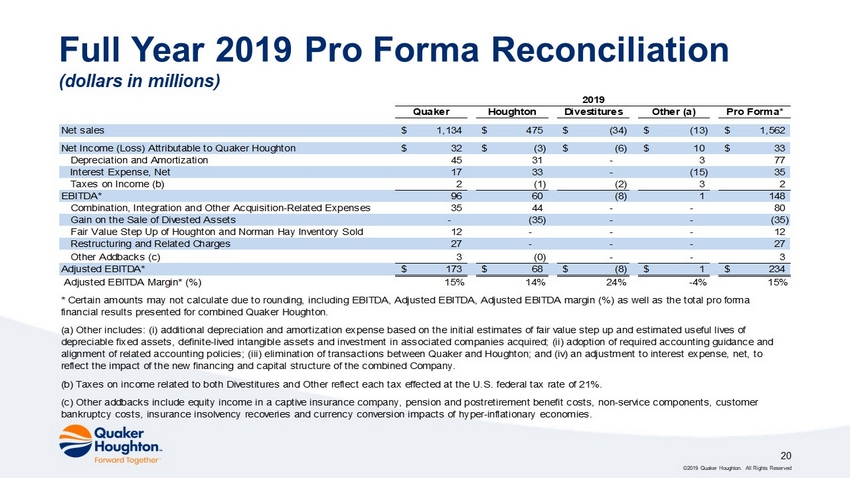
©2019 Quaker Houghton. All Rights Reserved 20 Full Year 2019 Pro Forma Reconciliation (dollars in millions) Quaker Houghton Divestitures Other (a) Pro Forma* Net sales 1,134$ 475$ (34)$ (13)$ 1,562$ Net Income (Loss) Attributable to Quaker Houghton 32$ (3)$ (6)$ 10$ 33$ Depreciation and Amortization 45 31 - 3 77 Interest Expense, Net 17 33 - (15) 35 Taxes on Income (b) 2 (1) (2) 3 2 EBITDA* 96 60 (8) 1 148 Combination, Integration and Other Acquisition-Related Expenses 35 44 - - 80 Gain on the Sale of Divested Assets - (35) - - (35) Fair Value Step Up of Houghton and Norman Hay Inventory Sold 12 - - - 12 Restructuring and Related Charges 27 - - - 27 Other Addbacks (c) 3 (0) - - 3 Adjusted EBITDA* 173$ 68$ (8)$ 1$ 234$ Adjusted EBITDA Margin* (%) 15% 14% 24% -4% 15% (b) Taxes on income related to both Divestitures and Other reflect each tax effected at the U.S. federal tax rate of 21%. (c) Other addbacks include equity income in a captive insurance company, pension and postretirement benefit costs, non-service components, customer bankruptcy costs, insurance insolvency recoveries and currency conversion impacts of hyper-inflationary economies. 2019 * Certain amounts may not calculate due to rounding, including EBITDA, Adjusted EBITDA, Adjusted EBITDA margin (%) as well as the total pro forma financial results presented for combined Quaker Houghton. (a) Other includes: (i) additional depreciation and amortization expense based on the initial estimates of fair value step up and estimated useful lives of depreciable fixed assets, definite-lived intangible assets and investment in associated companies acquired; (ii) adoption of required accounting guidance and alignment of related accounting policies; (iii) elimination of transactions between Quaker and Houghton; and (iv) an adjustment to interest expense, net, to reflect the impact of the new financing and capital structure of the combined Company.
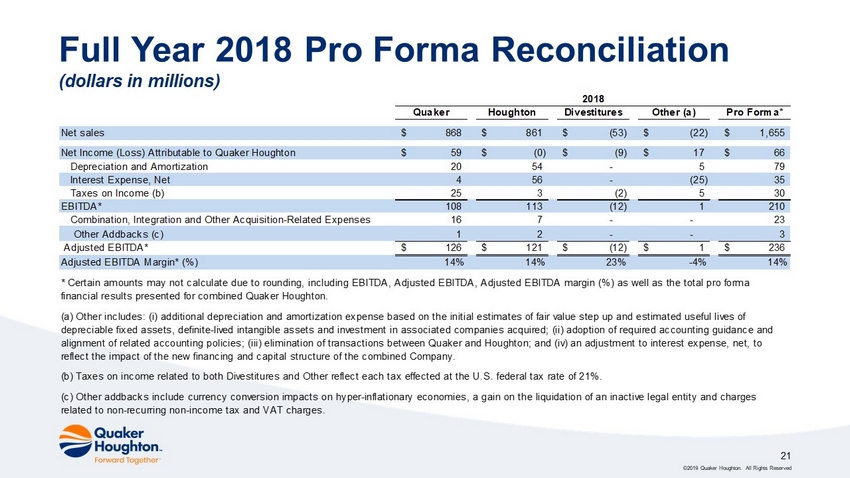
21 ©2019 Quaker Houghton. All Rights Reserved Full Year 2018 Pro Forma Reconciliation (dollars in millions) Quaker Houghton Divestitures Other (a) Pro Forma* Net sales 868$ 861$ (53)$ (22)$ 1,655$ Net Income (Loss) Attributable to Quaker Houghton 59$ (0)$ (9)$ 17$ 66$ Depreciation and Amortization 20 54 - 5 79 Interest Expense, Net 4 56 - (25) 35 Taxes on Income (b) 25 3 (2) 5 30 EBITDA* 108 113 (12) 1 210 Combination, Integration and Other Acquisition-Related Expenses 16 7 - - 23 Other Addbacks (c) 1 2 - - 3 Adjusted EBITDA* 126$ 121$ (12)$ 1$ 236$ Adjusted EBITDA Margin* (%) 14% 14% 23% -4% 14% (b) Taxes on income related to both Divestitures and Other reflect each tax effected at the U.S. federal tax rate of 21%. (a) Other includes: (i) additional depreciation and amortization expense based on the initial estimates of fair value step up and estimated useful lives of depreciable fixed assets, definite-lived intangible assets and investment in associated companies acquired; (ii) adoption of required accounting guidance and alignment of related accounting policies; (iii) elimination of transactions between Quaker and Houghton; and (iv) an adjustment to interest expense, net, to reflect the impact of the new financing and capital structure of the combined Company. (c) Other addbacks include currency conversion impacts on hyper-inflationary economies, a gain on the liquidation of an inactive legal entity and charges related to non-recurring non-income tax and VAT charges. 2018 * Certain amounts may not calculate due to rounding, including EBITDA, Adjusted EBITDA, Adjusted EBITDA margin (%) as well as the total pro forma financial results presented for combined Quaker Houghton.
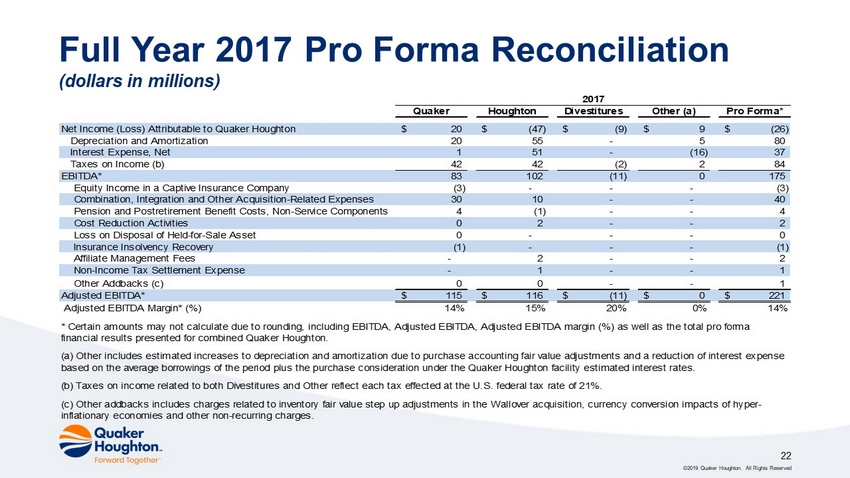
22 ©2019 Quaker Houghton. All Rights Reserved Full Year 2017 Pro Forma Reconciliation (dollars in millions) Quaker Houghton Divestitures Other (a) Pro Forma* Net Income (Loss) Attributable to Quaker Houghton 20$ (47)$ (9)$ 9$ (26)$ Depreciation and Amortization 20 55 - 5 80 Interest Expense, Net 1 51 - (16) 37 Taxes on Income (b) 42 42 (2) 2 84 EBITDA* 83 102 (11) 0 175 Equity Income in a Captive Insurance Company (3) - - - (3) Combination, Integration and Other Acquisition-Related Expenses 30 10 - - 40 Pension and Postretirement Benefit Costs, Non-Service Components 4 (1) - - 4 Cost Reduction Activities 0 2 - - 2 Loss on Disposal of Held-for-Sale Asset 0 - - - 0 Insurance Insolvency Recovery (1) - - - (1) Affiliate Management Fees - 2 - - 2 Non-Income Tax Settlement Expense - 1 - - 1 Other Addbacks (c) 0 0 - - 1 Adjusted EBITDA* 115$ 116$ (11)$ 0$ 221$ Adjusted EBITDA Margin* (%) 14% 15% 20% 0% 14% (b) Taxes on income related to both Divestitures and Other reflect each tax effected at the U.S. federal tax rate of 21%. 2017 * Certain amounts may not calculate due to rounding, including EBITDA, Adjusted EBITDA, Adjusted EBITDA margin (%) as well as the total pro forma financial results presented for combined Quaker Houghton. (a) Other includes estimated increases to depreciation and amortization due to purchase accounting fair value adjustments and a reduction of interest expense based on the average borrowings of the period plus the purchase consideration under the Quaker Houghton facility estimated interest rates. (c) Other addbacks includes charges related to inventory fair value step up adjustments in the Wallover acquisition, currency conversion impacts of hyper- inflationary economies and other non-recurring charges.
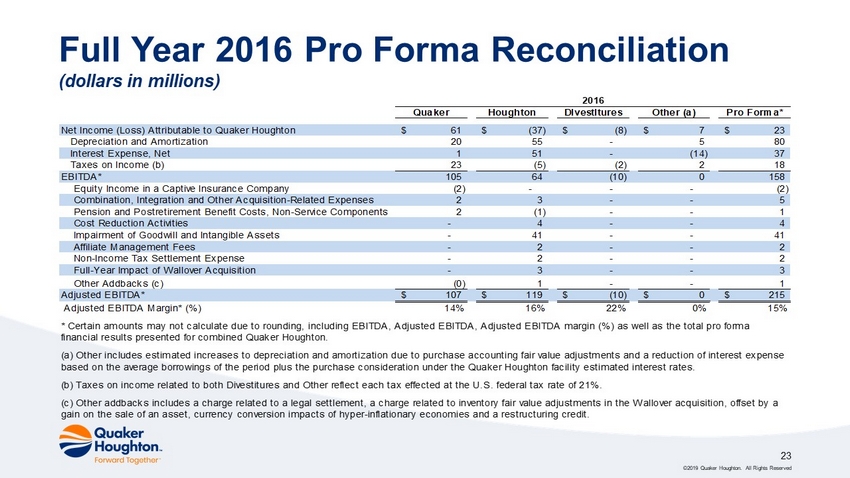
23 ©2019 Quaker Houghton. All Rights Reserved Full Year 2016 Pro Forma Reconciliation (dollars in millions) Quaker Houghton Divestitures Other (a) Pro Forma* Net Income (Loss) Attributable to Quaker Houghton 61$ (37)$ (8)$ 7$ 23$ Depreciation and Amortization 20 55 - 5 80 Interest Expense, Net 1 51 - (14) 37 Taxes on Income (b) 23 (5) (2) 2 18 EBITDA* 105 64 (10) 0 158 Equity Income in a Captive Insurance Company (2) - - - (2) Combination, Integration and Other Acquisition-Related Expenses 2 3 - - 5 Pension and Postretirement Benefit Costs, Non-Service Components 2 (1) - - 1 Cost Reduction Activities - 4 - - 4 Impairment of Goodwill and Intangible Assets - 41 - - 41 Affiliate Management Fees - 2 - - 2 Non-Income Tax Settlement Expense - 2 - - 2 Full-Year Impact of Wallover Acquisition - 3 - - 3 Other Addbacks (c) (0) 1 - - 1 Adjusted EBITDA* 107$ 119$ (10)$ 0$ 215$ Adjusted EBITDA Margin* (%) 14% 16% 22% 0% 15% (b) Taxes on income related to both Divestitures and Other reflect each tax effected at the U.S. federal tax rate of 21%. * Certain amounts may not calculate due to rounding, including EBITDA, Adjusted EBITDA, Adjusted EBITDA margin (%) as well as the total pro forma financial results presented for combined Quaker Houghton. (a) Other includes estimated increases to depreciation and amortization due to purchase accounting fair value adjustments and a reduction of interest expense based on the average borrowings of the period plus the purchase consideration under the Quaker Houghton facility estimated interest rates. (c) Other addbacks includes a charge related to a legal settlement, a charge related to inventory fair value adjustments in the Wallover acquisition, offset by a gain on the sale of an asset, currency conversion impacts of hyper-inflationary economies and a restructuring credit. 2016