Attached files
| file | filename |
|---|---|
| EX-99.1 - EXHIBIT 99.1 - New Senior Investment Group Inc. | a52385379ex99_1.htm |
| 8-K - NEW SENIOR INVESTMENT GROUP INC. 8-K - New Senior Investment Group Inc. | a52385379.htm |
|
|
Exhibit 99.2
|

Company Update February 25, 2021 Genesee GardensFlint Township, MI
Forward-Looking Statements, Non-GAAP and Other Information 1 IN GENERAL. This disclaimer applies to
this document and the verbal or written comments of any person presenting it. This document, taken together with any such verbal or written comments, is referred to herein as the “Presentation.” Throughout this Presentation, New Senior
Investment Group Inc. (NYSE: SNR) is referred to as “New Senior,” the “Company,” “SNR” or “we.”FORWARD-LOOKING STATEMENTS. Certain information in this Presentation may constitute “forward-looking statements” within the meaning of the Private
Securities Litigation Reform Act of 1995, including without limitation statements regarding New Senior’s 2021 strategic priorities and expectations with respect to the potential range of 2021 financial results; the expected impact of the
COVID-19 pandemic on our business, liquidity, properties, operators and the health systems and populations that we serve; the cost and effectiveness of measures we have taken to respond to the COVID-19 pandemic, including health and safety
protocols and system capacity enhancements that are intended to limit the transmission of COVID-19 at our properties; our expected occupancy rates and operating expenses; and the declaration or amount of any future dividend. These statements
are not historical facts. They represent management’s current expectations regarding future events and are subject to a number of risks and uncertainties, many of which are beyond our control, that could cause actual results to differ
materially from those described in the forward-looking statements. These risks and uncertainties include, but are not limited to, risks and uncertainties relating to the continuing impact of COVID-19 on our operations and the operation of our
facilities, including ongoing cases at certain of our facilities, the speed, geographic reach and duration of the COVID-19 pandemic; the legal, regulatory and administrative developments that occur at the federal, state and local levels; the
efficacy of our operators’ infectious disease protocols and prevention efforts; the broader impact of the pandemic on local economies and labor markets; the overall demand for our communities in the recovery period following the pandemic; our
ability to successfully manage the asset management by third parties; and market conditions generally which affect demand and supply for senior housing. Accordingly, you should not place undue reliance on any forward-looking statements
contained herein. For a discussion of these and other risks and important factors that could affect such forward-looking statements, see the sections entitled “Risk Factors” and “Management’s Discussion and Analysis of Financial Condition and
Results of Operations” in the Company’s most recent annual and quarterly reports filed with the Securities and Exchange Commission, which are available on the Company’s website (www.newseniorinv.com). New risks and uncertainties emerge from
time to time, and it is not possible for us to predict or assess the impact of every factor that may cause our results to differ materially from those anticipated by any forward-looking statements. Forward-looking statements contained herein,
and all statements made in this Presentation, speak only as of the date of this Presentation, and the Company expressly disclaims any duty or obligation to release publicly any updates or revisions to any statements contained herein to
reflect any change in the Company’s expectations with regard thereto or change in events, conditions or circumstances on which any statement is based.NON-GAAP FINANCIAL INFORMATION. This Presentation includes information based on financial
measures that are not recognized under generally accepted accounting principles (“GAAP”), such as NOI, cash NOI, adjusted same store cash NOI, Normalized FFO, AFFO and Normalized FAD. You should use non‐GAAP information in addition to, and
not as an alternative to, financial information prepared in accordance with GAAP. See the end of this Presentation for reconciliations to the most comparable GAAP measures and an explanation of each of our non-GAAP measures. Our non-GAAP
measures may not be identical or comparable to measures with the same name presented by other companies due to differences in calculation, capital structure or other factors. PAST PERFORMANCE. In all cases where historical results are
presented or past performance is described, we note that past performance is not a reliable indicator of future results and performance.GLOSSARY. See the Glossary at the end of this Presentation for an explanation of various terms used
herein.
Table of Contents SECTIONS PAGES I. Overview and Executive Summary 3 – 11 II. COVID-19
Situation Update 12 – 15 III. Financial Update 16 – 22 IV. Appendix 23 – 31 2

New Senior Overview New Senior Investment Group Inc. (NYSE: SNR) is a publicly-traded REIT with a
portfolio of 102 Independent Living (IL) properties and one NNN leased property Pure Play REIT Uniquely Positioned Geographic Diversification & Scale Experienced Operator Mix Uniquely positioned to capitalize on
long-term industry fundamentals95% of NOI from high-margin IL properties(1)All IL properties in managed structure The only pure play, publicly-traded senior housing REIT in the U.S.100% private pay senior housingAll properties wholly
owned Partnered with experienced senior housing operators5 operator relationships(3) Our largest operator is Holiday: 3rd largest senior housing operator(2) One of the largest owners of senior housing with a national footprint11th largest
owner of senior housing(2)Diversified across 36 states Percentage calculated based on 2020 NOI.ASHA, “50 Largest U.S. Seniors Housing Real Estate Owners and Operators,” June 1, 2020.Proforma for transitions to Atria Senior Living. 103
Properties12,404 Units 3

Geographically Diversified Portfolio Properties located in 36 different states, generally outside of
major metropolitan areas65% of NOI generated from properties located in secondary and tertiary markets(1) 4 As defined by National Investment Center for Seniors Housing & Care (NIC); Tertiary markets include Additional markets and
markets not covered by NIC.Percentages calculated based on 2020 NOI. Markets(1) Assets % of NOI(2) Primary 32 35% Secondary 32 32%
Tertiary 39 33% Managed
PropertiesNNN Lease Fleming PointRochester, NY Marion WoodsOcala, FL Top 5 States Assets % of NOI(2) California 9 11% North Carolina 8 10% Florida 9 9% Pennsylvania 5 8% Oregon 8 7% Vista De La
MontanaSurprise, AZ 103 Properties 12,404 Units 36 States 100% Private Pay
Executive Summary Maple SuitesDover, NH
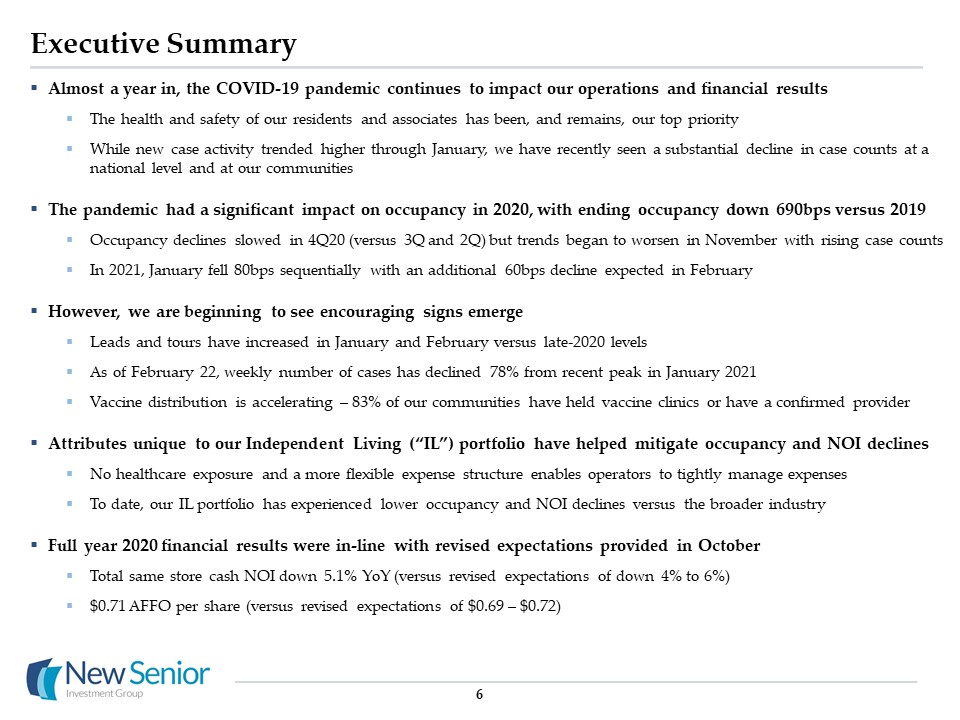
Executive Summary 6 Almost a year in, the COVID-19 pandemic continues to impact our operations and
financial results The health and safety of our residents and associates has been, and remains, our top priorityWhile new case activity trended higher through January, we have recently seen a substantial decline in case counts at a national
level and at our communitiesThe pandemic had a significant impact on occupancy in 2020, with ending occupancy down 690bps versus 2019Occupancy declines slowed in 4Q20 (versus 3Q and 2Q) but trends began to worsen in November with rising case
countsIn 2021, January fell 80bps sequentially with an additional 60bps decline expected in FebruaryHowever, we are beginning to see encouraging signs emerge Leads and tours have increased in January and February versus late-2020 levelsAs of
February 22, weekly number of cases has declined 78% from recent peak in January 2021Vaccine distribution is accelerating – 83% of our communities have held vaccine clinics or have a confirmed providerAttributes unique to our Independent
Living (“IL”) portfolio have helped mitigate occupancy and NOI declinesNo healthcare exposure and a more flexible expense structure enables operators to tightly manage expenses To date, our IL portfolio has experienced lower occupancy and NOI
declines versus the broader industryFull year 2020 financial results were in-line with revised expectations provided in OctoberTotal same store cash NOI down 5.1% YoY (versus revised expectations of down 4% to 6%)$0.71 AFFO per share (versus
revised expectations of $0.69 – $0.72)

Executive Summary (cont’d) 7 It remains difficult to predict when a recovery will begin and what
shape it will take We expect the pandemic to continue to impact operations and financial results in 2021However, increasing leads, declining cases and vaccine rollout provide optimism for a recovery to begin in 2021Safely managing through the
pandemic remains our top priority in 2021, including the distribution of vaccinesExpect to continue strict expense controls and preservation of liquidity until occupancy begins to growDespite ongoing pandemic, we expect to advance our
strategic priorities this year, including:Addressing operator alignment and diversificationPositioning our portfolio for the recovery and organic growth Strengthening the balance sheetConsistent with our priorities, we have entered into a new
strategic partnership with Atria Senior Living Transitioning the management of 21 communities in the second quarter Represents a significant step in our ongoing effort to improve operator diversification and alignmentDespite challenges
presented by the pandemic, senior housing fundamentals remain compellingAging population and demographic trends unabated by pandemic; expected to drive demand for decades to comeFavorable supply dynamics as new construction starts and
deliveries slowing considerably

2020 Summary – Navigating Through The Pandemic 8 COVID-19 Management 1 Established principles to
guide actions during pandemic, including a focus on safety of our residents and associates Worked closely with operators to track and understand trends; advised & assisted on developing COVID plans Early actions helped mitigate the impact
at communities Financial Results Total same store cash NOI down 5.1% YoY – mid-point of revised expectations range & significantly better than industryAFFO of $0.71 per share – at top end of pre-COVID revised expectations range and
in-line with revised expectations 2 Governance Appointed 2 new independent Board directors since November 2020Continued to improve corporate governance practices 5 Portfolio Management Successfully completed sale of 28 AL/MC assets for
$385 million in February 2020 (immediately pre-COVID) Resulted in a uniquely focused, low acuity and private pay senior housing portfolio 4 Balance Sheet & Liquidity 3 Completed ~$400 million of refinancings, improving interest costs
& extending debt maturities by 2 yearsOpportunistically executed interest rate swap to increase fixed rate debt exposure from 52% to 72% Repaid $20 million of preferred stock in December 2020 (remaining $20 million due in December
2021) Despite challenging backdrop, continued to advance initiatives and priorities

New Strategic Partnership with Atria Senior Living 9 In January 2021, New Senior entered into new
strategic partnership with Atria Senior Living (“Atria”)New partnership includes transitioning the management of 21 properties from Holiday Retirement to AtriaExpect to complete transitions in 2Q21Atria is a best-in-class operator with
significant experience successfully managing Independent Living properties Data-driven operator with proven history of growing occupancy and NOI through proprietary tools and systemsSuccessful track record transitioning and improving
performance of similar IL-only propertiesAn industry leader during the COVID-19 pandemicTransition portfolio is concentrated in markets and regions that align with Atria’s geographic footprint Benefits Atria Senior Living
Overview Leadership John Moore - CEOTenure of 17 years Number of Properties Managed 206 Independent Living Expertise 61 IL-only properties 31% of total units are IL Geographic Presence 28 states 7 Canadian provinces Operating
History 24 years Establishes partnership with one of the largest & most innovative operators in the industry New management agreement improves owner / operator alignmentAdvances our stated objective of improving operator
diversificationPartner with a strong track record of managing capital expenditure programs and redevelopment projects Provides new perspectives and best practices to drive organic growthEstablishes new partner for external growth
opportunities

New Senior Operator Mix(1) 10 New Senior has relationships with five different operating partners
Largest relationship with Holiday Retirement, the 3rd largest operator in the U.S. and primarily focused on ILNew relationship with Atria Senior Living, the 7th largest operator in the U.S. and experienced across IL and AL/MCContinue to
believe that Holiday is a very strong operator, particularly in the IL spacePost-transition, Holiday will manage ~75% of our portfolio and remains an important partnerDecision to transition properties is driven by New Senior’s stated goal of
increasing its operator diversificationRepresents a significant step in our ongoing effort to improve operator diversification and alignment Operator Diversification Operator Diversification Post-Atria Transition Holiday: 95% of
portfolio Atria: 20% of portfolio Holiday: 75% of portfolio SNR Operator Total Properties SNRProperties % of Properties 240 77 75% 206 21 20% 70 3 3% 57 1 1% 57 1 1% As of Year End 2020 Proforma for
Transition ASHA, “50 Largest U.S. Seniors Housing Real Estate Owners and Operators,” June 1, 2020. Proforma for transition to Atria.
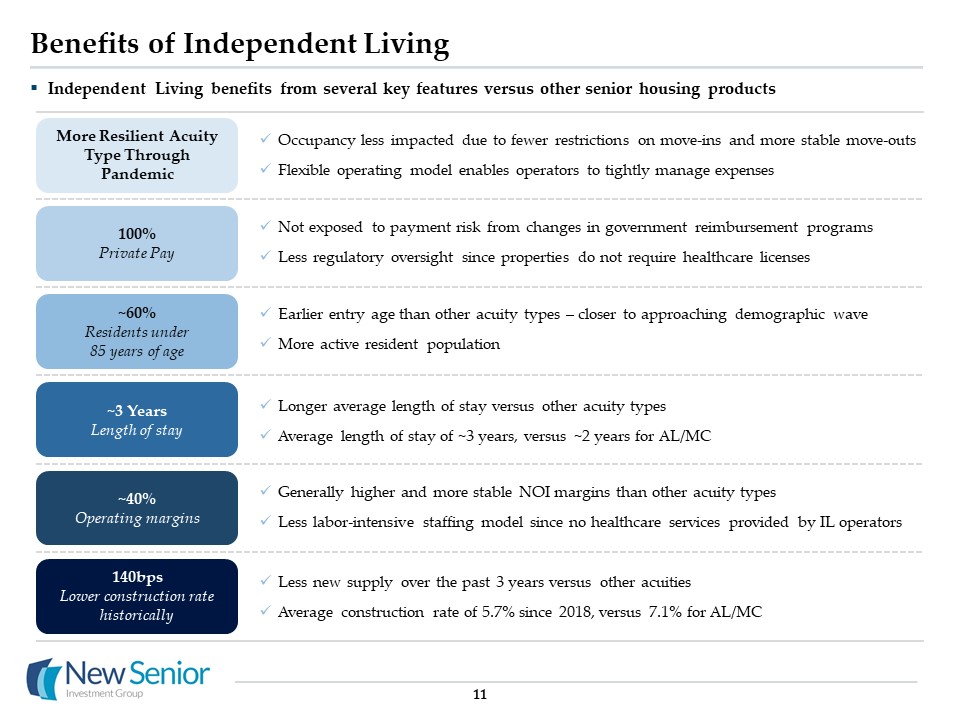
Benefits of Independent Living 11 100% Private Pay ~3 YearsLength of stay ~40% Operating
margins ~60% Residents under 85 years of age Not exposed to payment risk from changes in government reimbursement programs Less regulatory oversight since properties do not require healthcare licenses Longer average length of stay versus
other acuity typesAverage length of stay of ~3 years, versus ~2 years for AL/MC Generally higher and more stable NOI margins than other acuity typesLess labor-intensive staffing model since no healthcare services provided by IL
operators Earlier entry age than other acuity types – closer to approaching demographic waveMore active resident population 140bpsLower construction rate historically Less new supply over the past 3 years versus other acuitiesAverage
construction rate of 5.7% since 2018, versus 7.1% for AL/MC Occupancy less impacted due to fewer restrictions on move-ins and more stable move-outsFlexible operating model enables operators to tightly manage expenses More Resilient Acuity
Type Through Pandemic Independent Living benefits from several key features versus other senior housing products

COVID-19 Situation Update

COVID-19 Cases & Trends(1) As of February 22, our portfolio has 73 active cases (60 residents and
13 associates) across 23 propertiesSpread within properties has remained relatively low – 20 of the 23 properties have less than 4 active casesAfter increasing from September through January, rate of new cases has slowed significantly in
recent weeksAs of February 22, weekly new cases in our portfolio are down 78% from recent peak in JanuaryPercentage of portfolio with active cases also trending lower, down from 50% peak in January to 22% currentlyRate of cases within our
portfolio has continued to generally track broader US trendsContinued rapid decline is encouraging – new national cases currently down 72% from recent peak in January 13 New COVID-19 Cases – Monthly Trend Current Impact on Portfolio 80
properties w/ no active cases 20 properties w/ 1-3 active cases 3 properties w/ 4+ active cases 103 Properties All national COVID-19 case data per Johns Hopkins University.

COVID-19 Impact on Senior Housing COVID-19 has had a material impact on senior housing operations,
occupancy and financial resultsOperators had to adapt components of the business to keep residents & employees safe, including sales & marketing, dining, activities, housekeeping, maintenance & transportationAs a result, occupancy
declined significantly & operating expenses have increased across the industry To date, Independent Living properties have performed better than other acuity typesExperienced lower occupancy declines than AL/MCMore flexible operating
model and lower COVID-19 related expenses due to lack of healthcare services While vaccine developments are encouraging, the pandemic is expected to continue to impact results in near-term 14 Intra-quarterly data per NIC for all markets and
New Senior average occupancy.SHOP Growth represents average of Big 3 same store portfolio performance reported in specified quarters (VTR, PEAK, WELL). SNR based on Independent Living same store cash NOI results. T3 Occupancy Decline from
1Q20 to January 2021(1) NOI YoY Growth Throughout Pandemic(2)

15 Vaccine Update Despite Independent Living being excluded from Phase 1a of the federal vaccine
program, our operators have worked tirelessly to set up and conduct vaccine clinics at our communities83% of the properties in our portfolio have now conducted at least one clinic or have a confirmed providerProcess, provider and timing all
continue to vary significantly by geographyProviders primarily include pharmacies, medical centers, local health departments, and grocery storesVaccine participation continues to be major focus: currently trending at 80% for residents and 50%
for associatesRate of new cases has slowed dramatically in recent weeks as vaccine rollout has accelerated Property Vaccine Status Cumulative Initial Clinics (% of Portfolio) 12/29: First SNR clinic conductedin Tallahassee, FL 2/22: 57
initial clinics conducted to date 3/4: 63 initial clinics conducted or scheduled 103 Properties 57 properties with at least one clinic conducted 6 properties with clinic dates confirmed 22 properties with provider confirmed 18
properties with no provider confirmed 82 62 37 93 49 67 56 53 20 n/a New Weekly Cases: Down 78%

Financial Update PeninsulaGig Harbor, WA

Observations on Recent Occupancy & Financial Trends 17 Ending occupancy down 150bps sequentially
from 3Q20 to 4Q20, an improvement versus the 160bps decline in 3Q20Monthly trend worsened from October through January; move-ins declined due to surge in national COVID casesMonthly leads increased in January to highest level since pandemic
began; stronger volume has continued into FebruaryFebruary ending occupancy trend expected to improve versus January, as month-to-date move-ins are up versus January Occupancy 4Q20 total same store cash NOI down 9.6% YoY; full year 2020
total same store cash NOI down 5.1% YoY4Q20 cash interest expense flat versus 3Q20 4Q20 AFFO per share of $0.17; full year 2020 AFFO per share of $0.71 NOI & AFFO YoY: 4Q20 expenses down 3.7% from 4Q19, driven by occupancy-related
savingsExcluding COVID-19 specific costs, 4Q20 expenses down 4.7% YoYQoQ: 4Q20 expenses down 3.4% from 3Q20, driven by occupancy-related savings and typical seasonality Operating Expenses 4Q20 was the third full quarter where COVID-19
impacted the Company’s results Continuing to see the impact of the pandemic on occupancy results in 1Q21 to date

Full Year Results 2019 2020 YoY 88.7% 81.8% (690bps) $2,700 $2,718
0.7% 40.6% 39.6% (100bps) $137,307 $129,870 (5.4%) 5,749 5,907 2.7% $143,056 $135,777 (5.1%) $0.67 $0.71 $0.04 18 Financial Results – 4Q 2020 & Full Year 2020 4Q20: Same store cash NOI down 9.6% YoY and
down 1.4% QoQAFFO per share was $0.17, down $0.01 per share versus 4Q19 and flat versus 3Q20FY20: Same store cash NOI down 5.1% YoY and AFFO per share was $0.71, up $0.04 per share versus 2019 ($ in thousands, except RevPOR and per share
data) Quarterly Results 4Q19 3Q20 4Q20 QoQ YoY IL Ending Occupancy 88.7% 83.3% 81.8% (150bps) (690bps) IL RevPOR $2,711 $2,747 $2,713 (1.2%) 0.1% IL Margin 40.8% 38.6% 39.1% 50bps (170bps) IL Cash NOI
(102 Properties) $34,502 $31,465 $31,011 (1.4%) (10.1%) CCRC Cash NOI (1 Property) 1,450 1,490 1,490 0.0% 2.8% Total Same Store Cash NOI (103 Properties) $35,952 $32,955 $32,501 (1.4%) (9.6%) AFFO Per
Share $0.18 $0.17 $0.17 -- ($0.01)

Lead and Move-in Trends 19 January leads reached a new pandemic-high, and were up over 100% versus
the April low pointLead volume slowed in November and December due to holiday seasonality and the resurgence of U.S. COVID activityIn January, leads surged 22% vs. December as the COVID environment began to improve nationally and in our
properties February lead volume expected to decline slightly from fewer days, but weekly volume has remained strongMonthly move-ins have trended lower in recent months, but expected to increase in FebruaryAfter reaching pandemic-high in
October, November through January saw lower volume in line with COVID trendsFollowing strong lead growth in January, month-to-date February move-ins are at their highest point since November Monthly Leads Monthly Move-ins +101% -30%

Move-out and Occupancy Trends 20 January move-outs were flat versus December, and remained 10% below
recent peak in AugustMove-outs were above historical averages from July through October, but have trended closer to typical levels sinceNon-controllable move-outs (death, higher level of care) increasing in Jan. and Feb., in part from
elevated COVID casesQuarterly occupancy declines improved throughout the yearMonthly occupancy trend worsened from November to January, in line with declining move-in volumeFebruary currently pacing to decline 60bps, an improvement from prior
months as move-ins have trended higher Monthly Move-outs Change in Ending Occupancy 4Q: -150bp 3Q: -160bp 2Q: -250bp -10%

Expense Trends 21 4Q20 Expenses versus 4Q19 Expenses Historical Operating
Margins 1Q 2Q 3Q 4Q With no healthcare exposure, our IL portfolio has continued to benefit from a more flexible expense structureTotal expenses in 4Q20 were down 3.7% YoY, and down 4.7% excluding COVID-19 expenses Continuing to see
significant savings in occupancy-related costs (e.g., supplies, labor, referral fees, commissions)COVID-19 expenses decreased 40% versus 3Q20 as operators implemented new cost-reducing strategies throughout 2020Overall, we have seen modest
pressure on margins due to occupancy and revenue declines Total expenses down 3.7% YoY $50.1mm $48.2mm

1Q 2021 Guidance 22 Based on latest results and current trends, we are providing guidance for 1Q21
results 1Q21 total cash NOI (includes all 103 properties): down approximately 15% YoY Comparable period of 1Q20 was not significantly impacted by COVID-19; occupancy began to decline in March 20201Q21 results driven by occupancy declines
sustained throughout 2020, as well as additional declines experienced in 1Q21Based on latest trends, occupancy assumption includes monthly declines of 60bps in February and 30bps in March1Q21 AFFO per share: $0.14 to $0.15 per shareSequential
decline from 4Q20 driven by NOI decline Going forward, we remain committed to being transparent and will provide updates as appropriate 1Q21 Guidance 1Q20 2Q20 3Q20 4Q20 1Q21 IL Sequential Occupancy Decline(102
properties) (130bps) (250bps) (160bps) (150bps) Appx. (170bps) Total Same Store Cash NOI (103 properties) 0.1% (3.1%) (7.6%) (9.6%) Appx. (15%) AFFO Per Share $0.17 $0.19 $0.17 $0.17 $0.14 to $0.15

Appendix Springs of NapaNapa, CA

Capital Structure, Debt Maturities & Liquidity(1) Debt information is as of 12/31/2020 and based
on current unpaid principal balance.Company has two one-year extension options to extend the maturity date on $49 million, subject to a fee of 13bps of the total commitment on the second extension option.Includes the impact of swaps that
effectively converted $620 million LIBOR-based floating rate debt to fixed rate debt. 24 Amounts % of Total W.A. Maturity in Years Interest Rate Fixed $1,083 72% 4.5 years 3.9% Floating 419 28% 5.7 years 2.5% Total
Debt $1,502 100% 5.3 years 3.5% As of Dec. 31, 2020 the Company had $1.5 billion of debt Fixed rate exposure of 72%Average LIBOR for 4Q20 was in-line with 3Q20Current spot rate of 11bpsNo significant debt maturities until 2025Repaid
$20 million of preferred stock in December 2020 related to internalization Debt Composition(3) Debt Maturity & Amortization Schedule ($ in millions) ($ in millions) (2) Recent LIBOR Trends 1Q20 average of 165bps2Q20 average of
50bps3Q20 average of 16bps4Q20 average of 15bpsAs of 2/22/21, spot rate of 11bps
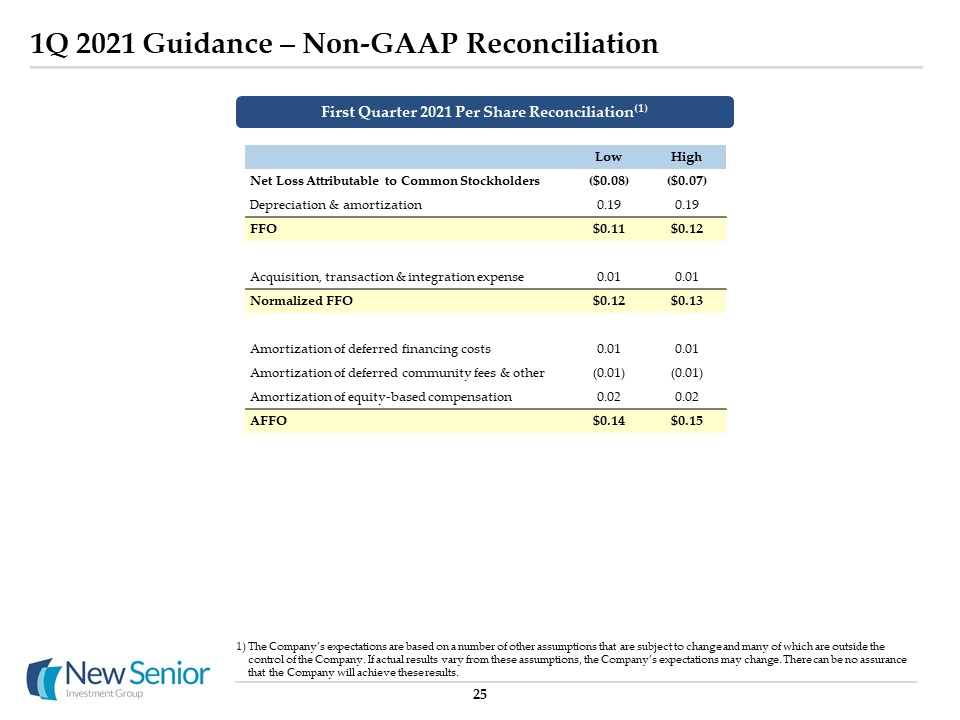
1Q 2021 Guidance – Non-GAAP Reconciliation 25 Low High Net Loss Attributable to Common
Stockholders ($0.08) ($0.07) Depreciation & amortization 0.19 0.19 FFO $0.11 $0.12 Acquisition, transaction & integration expense 0.01 0.01 Normalized FFO $0.12 $0.13 Amortization of deferred
financing costs 0.01 0.01 Amortization of deferred community fees & other (0.01) (0.01) Amortization of equity-based compensation 0.02 0.02 AFFO $0.14 $0.15 First Quarter 2021 Per Share Reconciliation(1) The Company’s
expectations are based on a number of other assumptions that are subject to change and many of which are outside the control of the Company. If actual results vary from these assumptions, the Company’s expectations may change. There can be no
assurance that the Company will achieve these results.

NOI Reconciliation – 4Q 2020 Year-over-Year 26 Includes amortization of deferred community fees and
other, which includes the net change in deferred community fees and other rent discounts or incentives. 4Q20 4Q19 IL Properties CCRC Total IL Properties CCRC Total Same store cash NOI (excluding
COVID-19 related expenses) $31,453 $1,490 $32,943 $34,502 $1,450 $35,952 COVID-19 related expenses (442) - (442) — - - Same Store Cash NOI 31,011 1,490 32,501 34,502 1,450 35,952 Straight-line
rental revenue - 95 95 - 134 134 Amortization of deferred community fees and other(1) 1,120 (2) 1,118 (21) (2) (23) Total NOI $32,131 $1,583 $33,714 $34,481 $1,583 $36,063
Interest expense (14,522) (17,982) Depreciation and amortization (15,769) (17,502) General and administrative expense (5,373) (5,925) Acquisition, transaction & integration
expense (272) (332) Other expense (944) (683) Income tax expense (22) (22) Litigation proceeds, net — 82 Loss from Continuing Operations (3,188) (6,301) Discontinued
operations, net — 245 Net Loss (3,188) (6,056) Deemed dividend on redeemable preferred stock (601) (605) Net Loss Attributable to Common Stockholders ($3,789) ($6,661) ($ in
thousands)

NOI Reconciliation – 4Q 2020 Quarter-over-Quarter 27 Includes amortization of deferred community fees
and other, which includes the net change in deferred community fees and other rent discounts or incentives. 4Q20 3Q20 IL Properties CCRC Total IL Properties CCRC Total Same store cash NOI (excluding
COVID-19 related expenses) $31,453 $1,490 $32,943 $32,250 $1,490 $33,740 COVID-19 related expenses (442) - (442) (785) - (785) Same Store Cash NOI 31,011 1,490 32,501 31,465 1,490 32,955
Straight-line rental revenue - 95 95 - 95 95 Amortization of deferred community fees and other(1) 1,120 (2) 1,118 160 (2) 158 Total NOI $32,131 $1,583 $33,714 $31,625
$1,583 $33,208 Interest expense (14,522) (14,540) Depreciation and amortization (15,769) (16,204) General and administrative expense (5,373) (5,905) Acquisition, transaction
& integration expense (272) (43) Other expense (944) (192) Income tax expense (22) (74) Net Loss (3,188) (3,750) Deemed dividend on redeemable preferred stock (601)
(605) Net Loss Attributable to Common Stockholders ($3,789) ($4,355) ($ in thousands)

NOI Reconciliation – Full Year 2020 Year-over-Year 28 Includes amounts from two AL/MC properties that
were sold in the second quarter of 2019.Includes amortization of deferred community fees and other, which includes the net change in deferred community fees and other rent discounts or incentives. 2020 2019 IL
Properties CCRC Total IL Properties CCRC / Other Properties Total Same store cash NOI (excluding COVID-19 related expenses) $133,041 $5,907 $138,948 $137,307 $5,749 $143,056 COVID-19 related expenses
(3,171) - (3,171) - - - Same Store Cash NOI 129,870 5,907 135,777 137,307 5,749 143,056 Non-same store cash NOI(1) - - - - (626) (626) Straight-line rental revenue - 431 431 -
589 589 Amortization of deferred community fees and other(1)(2) 2,020 (8) 2,012 (1,539) 66 (1,473) Total NOI $131,890 $6,330 $138,220 $135,768 $5,778 $141,546 Interest
expense (61,562) (76,364) Depreciation and amortization (66,291) (68,806) General and administrative expense (23,018) (21,672) Acquisition, transaction & integration expense (467)
(1,501) Loss on extinguishment of debt (5,884) (335) Other expense (1,464) (2,076) Income tax expense (178) (210) Litigation proceeds, net — 38,308 Loss on sale of real
estate — (122) Income (Loss) from Continuing Operations (20,644) 8,768 Gain on sale of real estate 19,992 — Loss from discontinued operations (3,107) (6,754) Discontinued
Operations, net 16,885 (6,754) Net Income (Loss) (3,759) 2,014 Deemed dividend on redeemable preferred stock (2,403) (2,407) Net Loss Attributable to Common
Stockholders ($6,162) ($393) ($ in thousands)

GAAP Reconciliation of FFO, Normalized FFO, AFFO and Normalized FAD 29 Primarily includes insurance
recoveries and casualty related charges.Includes amortization of deferred community fees and other, which includes the net change in deferred community fees and other rent discounts or incentives.Diluted share amounts have been calculated
using the treasury stock method. 4Q20 Full Year 2020 Net Loss Attributable to Common Stockholders ($3,789) ($6,162) Add (Deduct): Gain on sale of real estate - (19,992) Depreciation and amortization
15,769 66,291 FFO $11,980 $40,137 FFO per Basic Share $ 0.15 $ 0.49 FFO per Diluted Share $ 0.14 $ 0.48 Acquisition, transaction and integration expense 272 1,504 Compensation expense related to transition
awards 299 1,280 Loss on extinguishment of debt - 9,486 Other expense(1) 957 1,345 Normalized FFO $13,508 $53,752 Normalized FFO per Basic Share $ 0.16 $ 0.65 Normalized FFO per Diluted Share $0.16 $
0.64 Straight-line rental revenue (95) (431) Amortization of deferred financing costs 799 3,380 Amortization of deferred community fees and other(2) (1,118) (3,022) Amortization of equity-based
compensation 1,452 5,393 AFFO $14,546 $59,072 AFFO per Basic Share $ 0.18 $ 0.72 AFFO per Diluted Share $ 0.17 $ 0.71 Routine capital expenditures (1,795) (6,045) Normalized
FAD $12,751 $53,027 Normalized FAD per Basic Share $ 0.15 $ 0.64 Normalized FAD per Diluted Share $ 0.15 $ 0.63 Weighted average basic shares outstanding 82,569 82,496 Weighted average diluted shares
outstanding(3) 84,272 83,547 ($ and shares in thousands, except per share data)

Glossary Cash NOI MarginCash NOI margin is equal to Cash NOI divided by Cash Revenue.Discontinued
OperationsDiscontinued operations consists of 28 AL/MC properties that represented the entire Managed AL/MC Properties segment prior to the fourth quarter of 2019 and were classified as discontinued operations as of December 31, 2019. The
properties were subsequently sold in February 2020. EBITDARMEBITDARM is a non-GAAP measure that represents earnings before interest, taxes, depreciation, amortization, rent and management fees for the period stated unless otherwise noted. We
use EBITDARM in determining coverage and as a supplemental measure of the ability of the property to generate sufficient liquidity to meet related obligations to us. For our triple net lease portfolio, all facility financial performance data
was derived solely from information provided by operators/tenants without independent verification by us. EBITDARM does not represent net income or cash flow from operations and should not be considered an alternative to those indications.
EBITDARM CoverageFacility EBITDARM divided by the aggregate of base rent and any additional rent due to us for the same period. EBITDARM coverage is a supplemental measure of a property’s ability to generate cash flows for the operator/tenant
(not for us) to meet the operator’s/tenant’s related rent and other obligations to us. Enterprise ValueEnterprise value is equal to market capitalization plus carrying value of mortgage notes payable, minus cash. FFO, Normalized FFO, AFFO and
Normalized FADWe use Funds From Operations ("FFO") and Normalized FFO as supplemental measures of our operating performance. We use the National Association of Real Estate Investment Trusts ("NAREIT") definition of FFO. NAREIT defines FFO as
GAAP net income (loss) attributable to common stockholders, which includes loss from discontinued operations, excluding gains (losses) from sales of depreciable real estate assets and impairment charges of depreciable real estate, plus real
estate depreciation and amortization, and after adjustments for unconsolidated entities and joint ventures to reflect FFO on the same basis. FFO does not account for debt principal payments and is not intended as a measure of a REIT’s ability
to satisfy such payments or any other cash requirements. FFO, Normalized FFO, AFFO and Normalized FAD (continued)Normalized FFO, as defined below, measures the financial performance of our portfolio of assets excluding items that, although
incidental to, are not reflective of the day-to-day operating performance of our portfolio of assets. We believe that Normalized FFO is useful because it facilitates the evaluation of our portfolio’s operating performance (i) between periods
on a consistent basis and (ii) to the operating performance of other real estate companies. However, comparability may be limited because our calculation of Normalized FFO may differ significantly from that of other companies, or because of
features of our business that are not present in other companies.We define Normalized FFO as FFO excluding the following income and expense items, as applicable: (a) acquisition, transaction and integration related expenses; (b) the write off
of unamortized discounts, premiums, deferred financing costs, or additional costs, make whole payments and penalties or premiums incurred as the result of early repayment of debt (collectively “Gain (Loss) on extinguishment of debt”); (c)
incentive compensation recognized as a result of sales of real estate; (d) the remeasurement of deferred tax assets; (e) valuation allowance on deferred tax assets, net; (f) termination fee to affiliate; (g) gain on lease termination; (h)
compensation expense related to transition awards; (i) litigation proceeds; and (j) other items that we believe are not indicative of operating performance, generally reported as “Other (income) expense” in the Consolidated Statements of
Operations. We also use AFFO and Normalized FAD as supplemental measures of our operating performance. We believe AFFO is useful because it facilitates the evaluation of (i) the current economic return on our portfolio of assets between
periods on a consistent basis and (ii) our portfolio versus those of other real estate companies that report AFFO. However, comparability may be limited because our calculation of AFFO may differ significantly from that of other companies, or
because of features of our business that are not present in other companies. We define AFFO as Normalized FFO excluding the impact of the following: (a) straight-line rents; (b) amortization of above / below market lease intangibles; (c)
amortization of deferred financing costs; (d) amortization of premium or discount on mortgage notes payable; (e) amortization of deferred community fees and other, which includes the net change in deferred community fees and other rent
discounts or incentives and (f) amortization of equity-based compensation expense. 30

Glossary FFO, Normalized FFO, AFFO and Normalized FAD (continued)We define Normalized FAD as AFFO less
routine capital expenditures, which we view as a cost associated with the current economic return. Normalized FAD, which does not reflect debt principal payments and certain other expenses, does not represent cash available for distribution
to stockholders. We believe Normalized FAD is useful because it fully reflects the additional economic costs of maintaining the condition of the portfolio.Gross Assets The carrying amount of total assets, after adding back accumulated
depreciation and amortization, as reported in our consolidated financial statements. Investment Represents the carrying amount of real estate assets, including intangibles, after adding back accumulated depreciation and amortization, for all
assets owned as of the end of the respective reporting period. Net Operating Income (“NOI”) and Cash NOINOI and cash NOI are non-GAAP measures. We define NOI as total revenue less property operating expenses, which include property management
fees and travel cost reimbursements. Cash receipts may differ due to straight-line recognition of certain rental income and the application of other GAAP policies. We define cash NOI as NOI excluding the effects of straight-line rental
revenue, amortization of above / below market lease intangibles and amortization of deferred community fees and other, which includes the net change in deferred community fees and other rent discounts or incentives. We believe that NOI and
cash NOI serve as useful supplemental measures to net income because they allow investors, analysts and management to measure unlevered property-level operating results and to compare our operating results between periods and to the operating
results of other real estate companies on a consistent basis. 31 Occupancy For the managed portfolio, occupancy represents the facilities’ average operating occupancy for the applicable period. For the triple net lease portfolio, occupancy
is based on the period reported unless otherwise noted. The percentages are calculated based on available beds. All occupancy data was derived solely from information provided by operators/tenants without independent verification by us.
RevPORRepresents average cash revenues per occupied bed per month. We use RevPOR to evaluate the revenue generating potential of our senior housing portfolio independent of fluctuating occupancy rates.Same StoreSame store data presented
herein excludes properties acquired, sold, transitioned to other operators or between segments, or classified as held for sale or discontinued operations during the comparable periods. Same store data is intended to enable management to
evaluate the performance of a consistent portfolio of real estate in a manner that eliminates variances attributable to changes in the composition of our portfolio over time, due to sales and various other factors. Upon implementation of ASC
842 on 1/1/2019, bad debt expense is required to offset revenue as opposed to being included in operating expense under previous guidance. Accordingly, we have reclassified bad debt expense for prior years to offset revenue in order to
facilitate a historical comparison. The change has no impact on the Company’s NOI or Cash NOI.