Attached files
| file | filename |
|---|---|
| EX-99.1 - EXHIBIT 99.1 - LAUREATE EDUCATION, INC. | tm217253d1_ex99-1.htm |
| 8-K - FORM 8-K - LAUREATE EDUCATION, INC. | tm217253d1_8k.htm |
Exhibit 99.2

1 © 2021 Laureate Education, Inc. Fourth Quarter & Year - End 2020 Earnings Presentation February 25, 2021

2 © 2021 Laureate Education, Inc. This presentation includes statements that express Laureate’s opinions, expectations, beliefs, plans, objectives, assumptions or projections regarding future events or future results and therefore are, or may be deemed to be, ‘‘forward - looking statements’’ within the meaning of the federal secur ities laws, which involve risks and uncertainties. Laureate’s actual results may vary significantly from the results anticipated in these forward - looking statements . You can identify forward - looking statements because they contain words such as ‘‘believes,’’ ‘‘expects,’’ ‘‘may,’’ ‘‘will,’’ ‘‘should,’’ ‘‘seeks,’’ ‘‘approxim ate ly,’’ ‘‘intends,’’ ‘‘plans,’’ ‘‘estimates’’ or ‘‘anticipates’’ or similar expressions that concern our strategy, plans or intentions. All statements we make relating to (i) gu idance (including, but not limited to, total enrollments, revenues and Adjusted EBITDA), (ii) our planned divestitures, the expected proceeds generated therefrom and the exp ected reduction in revenue resulting therefrom, (iii) our exploration of strategic alternatives and potential future plans, strategies or transactions t hat may be identified, explored or implemented as a result of such review process and any resulting litigation or dispute therewith and (iv) the potential impact of the COVID - 19 pandemic on our business or the global economy as a whole are forward - looking statements. In addition, we, through our senior management, from time to time make forwar d - looking public statements concerning our expected future operations and performance and other developments. All of these forward - looking statements are su bject to risks and uncertainties that may change at any time, including, with respect to our exploration of strategic alternatives, risks and uncertainties as to the terms, timing, structure, benefits and costs of any divestiture or separation transaction and whether one will be consummated at all, and the impact of any divestit ure or separation transaction on our remaining businesses. Accordingly, our actual results may differ materially from those we expected. We derive most of our for war d - looking statements from our operating budgets and forecasts, which are based upon many detailed assumptions. While we believe that our assumptions are re aso nable, we caution that it is very difficult to predict the impact of known factors, and, of course, it is impossible for us to anticipate all factors that coul d a ffect our actual results. Important factors that could cause actual results to differ materially from our expectations are disclosed in our Annual Report on Form 10 - K filed with the U.S. Securities and Exchange Commission (the “SEC”) on February 25, 2021, and other filings made with the SEC. These forward - looking statements speak only as of the time of this release and we do not undertake to publicly update or revise them, whether as a result of new information, future events or otherwise, ex cep t as required by law. In addition, this presentation contains various operating data, including market share and market position, that are based on in ternal company data and management estimates. While management believes that our internal company research is reliable and the definitions of our markets which are used herein are appropriate, neither such research nor these definitions have been verified by an independent source and there are inherent challenges and limitat ion s involved in compiling data across various geographies and from various sources, including those discussed under “Market and Industry Data” in Laureate’s filing s w ith the SEC. Forward Looking Statements
3 © 2021 Laureate Education, Inc. In addition to the results provided in accordance with U.S. generally accepted accounting principles (GAAP) throughout this p res entation, Laureate provides the non - GAAP measurements of Adjusted EBITDA, Adjusted EBITDA margin, total debt, net of cash (or net debt), and Free Cash Flow. We h ave included these non - GAAP measurements because they are key measures used by our management and board of directors to understand and evaluate our core ope rating performance and trends, to prepare and approve our annual budget and to develop short - and long - term operational plans. Adjusted EBITDA consists of income (loss) from continuing operations, adjusted for the items included in the accompanying rec onc iliation. The exclusion of certain expenses in calculating Adjusted EBITDA can provide a useful measure for period - to - period comparisons of our core business. Addi tionally, Adjusted EBITDA is a key input into the formula used by the compensation committee of our board of directors and our Chief Executive Officer in connec tio n with the payment of incentive compensation to our executive officers and other members of our management team. Accordingly, we believe that Adjusted EBITDA an d Adjusted EBITDA margin, which is calculated by dividing Adjusted EBITDA by revenues, provide useful information to investors and others in understand ing and evaluating our operating results in the same manner as our management and board of directors. Total debt, net of cash (or net debt) consists of total gross debt, including seller notes, for Continuing Operations and Dis con tinued Operations, less total cash and cash equivalents for Continuing Operations and Discontinued Operations. Net debt provides a useful indicator about Laureate’s le verage and liquidity. Free Cash Flow consists of operating cash flow minus capital expenditures. Free Cash Flow provides a useful indicator about L aur eate’s ability to fund its operations and repay its debts. Laureate’s calculations of Adjusted EBITDA, Adjusted EBITDA margin, total debt, net of cash (or net debt), and Free Cash Flow ar e not necessarily comparable to calculations performed by other companies and reported as similarly titled measures. These non - GAAP measures should be considere d in addition to results prepared in accordance with GAAP, but should not be considered a substitute for or superior to GAAP results. Adjusted EBITDA is reconc ile d from the GAAP measure in the attached table “Non - GAAP Reconciliation.” We evaluate our results of operations on both an as reported and an organic constant currency basis. The organic constant cur ren cy presentation, which is a non - GAAP measure, excludes the impact of fluctuations in foreign currency exchange rates, acquisitions and divestitures, and othe r i tems. We believe that providing organic constant currency information provides valuable supplemental information regarding our results of operations, consist ent with how we evaluate our performance. We calculate organic constant currency amounts using the change from prior - period average foreign exchange rates to current - period average foreign exchange rates, as applied to local - currency operating results for the current period, and then exclude the impact of acquisitio ns and divestitures and other items described in the accompanying presentation. Presentation of Non - GAAP Measures

4 © 2021 Laureate Education, Inc. SUMMARY OVERVIEW Note: Throughout this presentation amounts may not sum to totals due to rounding Amounts presented for enrollments, Revenue, Adjusted EBITDA and Adjusted EBITDA margin are for continuing operations only

5 © 2021 Laureate Education, Inc. Strong Execution Against all Operating & Strategic Priorities Executive Summary (1) Based on anticipated net proceeds (net of taxes, fees and other costs) for sales of Walden, Brazil, and Honduras. Includes a ssu med debt and anticipated release of restricted cash (collateral for letter of credit and bonds at Walden); assumes all pending asset sale transaction close on an nou nced terms. x Fourth quarter Revenue & Adjusted EBITDA ahead of guidance x Net Income of $379M in Q4 driven by gain on sale of Australia/NZ business units x Strong Free Cash Flow performance in FY 2020; up 2% Vs. prior year despite COVID pandemic x Highly reputed institutions – continued recognition for quality of educational offerings x Closed sale of Australia/NZ for approx. $650M in November – Net Debt of $202M outstanding at year - end x Additional $1.95 billion of net proceeds from signed asset sales expected during 2021 1 x Mexico & Peru to be retained in a focused organization – still open to further engagement with potential buyers if accretive x $167M in Share Repurchases completed to - date since November (total of 11.7M shares repurchased)

6 © 2021 Laureate Education, Inc. Laureate Portfolio Overview Operations -- Remaining Operations -- Pending Asset Sales (as of December 31, 2020) Brazil Walden Honduras Mexico Peru Revenue 1 ~$1 billion Adjusted EBITDA (Excl Corp G&A) 1 ~$300 million of Net Proceeds Expected 2 $1.95 billion (1) Based on 2020 actual results; amount shown is for just Mexico & Peru segments (i.e. excluding corporate segment G&A expense w hic h were $97M in 2020). Corporate G&A expenses are expected to be reduced by 70 - 80% post completion of the pending asset sales. (2) Based on anticipated net proceeds (net of taxes, fees and other costs) for sales of Walden, Brazil, and Honduras. Includes a ssu med debt, and anticipated release of restricted cash (collateral for letter of credit and bonds at Walden); assumes all pending asset sale transaction close on announced terms. » 2 Universities » 35+ campuses » 190K+ students » 2 Universities / 1 Tech - Voc » 15+ campuses » 140K+ students

7 © 2021 Laureate Education, Inc. Mexico Peru Combined Population (M) 127M 33M 160M Higher Education Students (000s) 4,562 1,896 6,458 Higher Education Participation Rate 1 30% 47% 34% Market Share for Private Institution 2 44% 72% 56% Mexico & Peru Higher Education Market Overview Sources: UNESCO, World Bank, SEP database Attractive Markets with Significant Growth Opportunities Participation Rates Growing and Still Well Below Developed Markets (1) Defined as total enrollments as compared to 18 - 24 year old population (2) Private institution market share in higher education; for Mexico and Combined includes all states in which UVM or UNITEC have op erations (total private market share for all of Mexico is 35%); for Peru based on total country

8 © 2021 Laureate Education, Inc. Leading University Portfolio in Mexico & Peru Institution Enrollments @ 12/31/20 Market Segment QS Stars Œ Overall University Rating Ratings/Ranking Mexico Universidad del Valle de México (UVM) 95,000 Premium/ Traditional • Ranked #7 university in Mexico • One of only three 4 - Star rated universities in Mexico by QS Stars Œ Mexico Universidad Tecnológica de México (UNITEC) 99,000 Value/ Teaching • Largest private university in Mexico • 5 - Stars rated by QS Stars Œ in categories of Teaching & Employability Peru Universidad Peruana de Ciencias Aplicadas (UPC) 55,000 Premium/ Traditional • Ranked #3 university in Peru • Only 4 - Star rated university in Peru by QS Stars Œ Peru Universidad Privada del Norte (UPN) 73,700 Value/ Teaching • 2nd largest private university in Peru • 5 - Stars rated by QS Stars Œ in categories of Teaching & Employability Peru CIBERTEC 13,800 Tech/Voc N/A • 2nd largest private tech/ voc institute in Peru Sources: QS Stars Œ , Guía Universitaria (UVM), Scimago Institutions Rankings (UPC) Operating Leading Brands in Multiple Attractive Market Segments

9 © 2021 Laureate Education, Inc. Q4 & FY 2020 PERFORMANCE RESULTS CONTINUING OPERATIONS ONLY (I.E. MEXICO, PERU AND CORPORATE SEGMENTS)

10 © 2021 Laureate Education, Inc. Q4 ’20 Variance Vs. Q4 ‘19 Notes ($ in millions) (Enrollments in thousands) Results As Reported Organic/CC 1 New Enrollment 4K nm nm • Not a material intake cycle Total Enrollment 337K (8%) (8%) • Driven by lower NE volumes and increased attrition from COVID Revenue 285 (19%) (13%) • Driven by lower enrollment Adj. EBITDA 91 (9%) (2%) • Benefitting from cost actions Adj. EBITDA margin 31.8% 351 bps 379 bps 2020 Fourth Quarter – Financial Summary (1) Organic Constant Currency (CC) Operations excludes the period - over - period impact from currency fluctuations (if applicable), acq uisitions and divestitures, and other items. Other items include the impact of acquisition - related contingent liabilities for taxes other - than - income tax, net of chan ges in recorded indemnification assets. Tight Cost Management Mitigating Top Line Pressure Related to COVID

11 © 2021 Laureate Education, Inc. (1) Organic Constant Currency (CC) Operations excludes the period - over - period impact from currency fluctuations (if applicable), acq uisitions and divestitures, and other items. Other items include the impact of acquisition - related contingent liabilities for taxes other - than - income tax, net of chan ges in recorded indemnification assets. FY ’20 Variance Vs. FY‘19 Notes ($ in millions) (Enrollments in thousands) Results As Reported Organic/CC 1 New Enrollment 169K (6%) (6%) • Mexico ( - 5% vs PY) • Peru ( - 9% vs. PY) Total Enrollment 337K (8%) (8%) • Driven by lower NE volumes and increased attrition from COVID Revenue $1,025 (15%) (9%) • Driven by lower enrollment Adj. EBITDA $206 1% 13% • Benefitting from cost actions Adj. EBITDA margin 20.1% 327bps 398 bps • Continued margin progression 2020 FY – Financial Summary Tight Cost Management Mitigating Top Line Pressure Related to COVID

12 © 2021 Laureate Education, Inc. SEGMENT RESULTS CONTINUING OPERATIONS ONLY (I.E. MEXICO, PERU AND CORPORATE SEGMENTS)
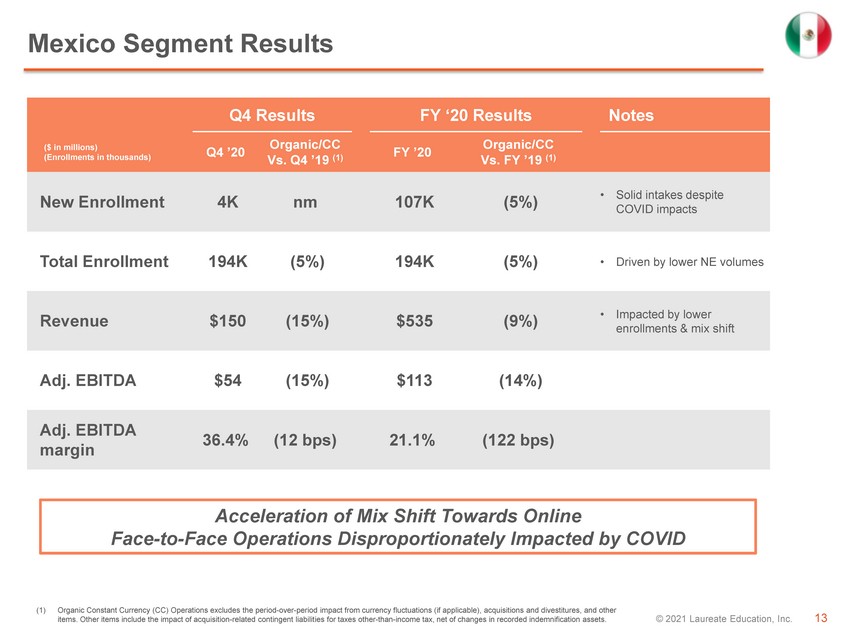
13 © 2021 Laureate Education, Inc. (1) Organic Constant Currency (CC) Operations excludes the period - over - period impact from currency fluctuations (if applicable), acq uisitions and divestitures, and other items. Other items include the impact of acquisition - related contingent liabilities for taxes other - than - income tax, net of chan ges in recorded indemnification assets. Q4 Results FY ‘20 Results Notes ($ in millions) (Enrollments in thousands) Q4 ’20 Organic/CC Vs. Q4 ’ 19 (1) FY ’20 Organic/CC Vs. FY ’ 19 (1) New Enrollment 4K nm 107K (5%) • Solid intakes despite COVID impacts Total Enrollment 194K (5%) 194K (5%) • Driven by lower NE volumes Revenue $150 (15%) $535 (9%) • Impacted by lower enrollments & mix shift Adj. EBITDA $54 (15%) $113 (14%) Adj. EBITDA margin 36.4% (12 bps) 21.1% (122 bps) Mexico Segment Results Acceleration of Mix Shift Towards Online Face - to - Face Operations Disproportionately Impacted by COVID

14 © 2021 Laureate Education, Inc. (1) Organic Constant Currency (CC) Operations excludes the period - over - period impact from currency fluctuations (if applicable), acq uisitions and divestitures, and other items. Other items include the impact of acquisition - related contingent liabilities for taxes other - than - income tax, net of chan ges in recorded indemnification assets. Q4 Results FY ‘20 Results Notes ($ in millions) (Enrollments in thousands) Q4 ’20 Organic/CC Vs. Q4 ’ 19 (1) FY ’20 Organic/CC Vs. FY ’ 19 (1) New Enrollment 1K nm 62K (9%) • Impacted by COVID Total Enrollment 143K (12%) 143K (12%) • Driven by lower NE volumes and increased attrition from COVID (primarily UPN) Revenue $132 (10%) $483 (7%) • YTD results reflecting lower volumes Adj. EBITDA $61 2% $190 1% Adj. EBITDA margin 46.0% 523 bps 39.2% 332 bps • Continued strong margin performance Peru Segment Results Strong Operating Results Despite Significant Enrollment Pressure due to COVID

15 © 2021 Laureate Education, Inc. Corporate G&A Expense Significant Reductions in Corporate G&A Continuing Throughout 2020 Further Right - Sizing Expected Following Completion of Pending Asset Sales $142 $133 $121 $104 $97 LTM Q3 ’20 FY 2019 LTM Q2 ’20 LTM Q1 ’20 FY 2020 Last Twelve Months Corporate Segment G&A Expenses ($USD in millions) Further reductions of approx. 70 - 80% expected (run - rate) following completion of pending asset sales. 1 (1) Estimated G&A reduction assumes completion of all pending asset sales (Walden, Brazil and Honduras).

16 © 2021 Laureate Education, Inc. FY 2020 Debt Capitalization – Adjusted for Pending Asset Sales ($ in millions) Amount Comments (Net Debt) / Cash @ 12/31/20 ($202) See Appendix Net Proceeds – Pending Asset Sales 1 $1,950 Including assumed debt Adjusted Net Cash Position @ 12/31/20 $1,748 Post receipt of anticipated net cash proceeds & assumed debt (1) Based on anticipated net proceeds (net of taxes, fees and other costs) for sales of Walden, Brazil and Honduras. Includes as sum ed debt and anticipated release of restricted cash (collateral for letter of credit and bonds at Walden); assumes all pending asset sale transaction close on announced terms. Pro - Forma Net Cash Position of Approximately $1.75Bn

17 © 2021 Laureate Education, Inc. OUTLOOK

18 © 2021 Laureate Education, Inc. Strong Outlook Expected for New Portfolio Post COVID Guidance Outlook x Mexico and Peru remain attractive market opportunities long term x 2021 will be a transition year for Laureate ‒ Enrollment expected to be impacted by the COVID pandemic for most of 2021 ‒ Down - sizing of Corporate G&A by 70 - 80% to happen throughout the year – mostly in H2 x 2021 dynamics by segment will be largely unchanged vs. 2020 x 2022 Adjusted EBITDA expected to be up +51% Vs. 2021 after transition is completed x Financials expected to return to pre - COVID trends starting in 2022

19 © 2021 Laureate Education, Inc. 2021 Full Year Guidance Details Note: An outlook for 2021 net income and reconciliation of the forward - looking 2021 Adjusted EBITDA outlook to projected net inc ome are not being provided as the company does not currently have sufficient data to accurately estimate the variables and individual adjustments for such outlook and rec onciliation. Due to this uncertainty, the company cannot reconcile Adjusted EBITDA to projected net income without unreasonable effort. Continued COVID Headwinds Expected for Much of 2021 Recovery Anticipated in 2022 (1) Based on actual FX rates for January 2021, and current spot FX rates (local currency per US dollar) of MXN 19.93 & PEN 3.64 f or February through December 2021. FX impact may change based on fluctuations in currency rates in future periods. (USD millions, except enrollments in thousands) Total Enrollment Revenues Adj. EBITDA 2020 Results 337K $1,025 $206 Organic Growth 0K ($25) – $15 ($17) – ($7) Growth % 0% (2%) - 2% (8%) – (3%) FAS 5 Expense/Indemnification Asset (non - cash) - - ($9) 2021 Guidance (Constant Currency) 337K $1,000 – $1,040 $180 – $190 FX Impact (spot FX) (1) - - - 2021 Guidance (@ spot FX) (1) 337K $1,000 – $1,040 $180 – $190 Growth % 0% (2%) – 2% (13%) – (8%)
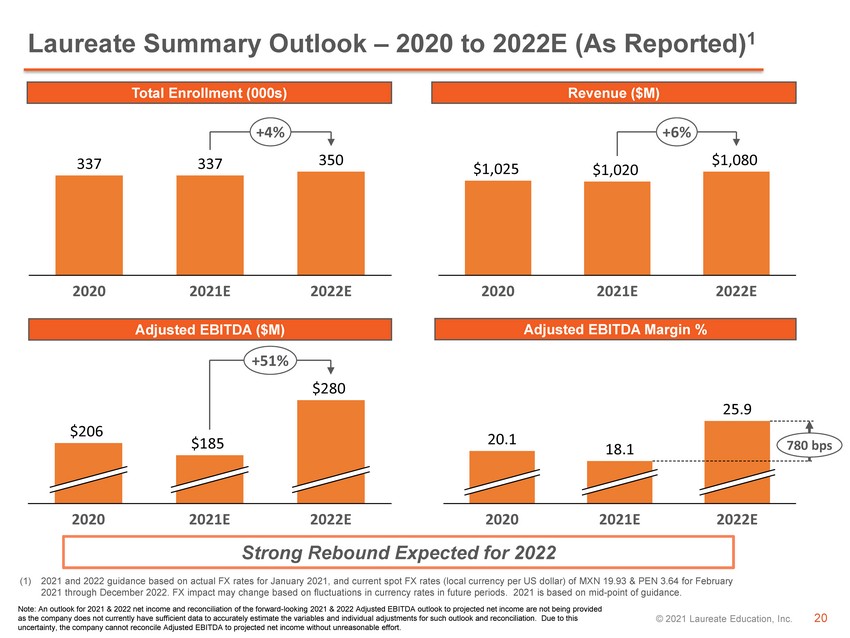
20 © 2021 Laureate Education, Inc. Laureate Summary Outlook – 2020 to 2022E (As Reported) 1 Strong Rebound Expected for 2022 Total Enrollment (000s) Revenue ($M) Adjusted EBITDA ($M) 337 337 350 2020 2021E 2022E +4% $1,025 $1,020 $1,080 2020 2021E 2022E +6% $206 2020 2021E 2022E $185 $280 +51% Adjusted EBITDA Margin % 25.9 2021E 2020 2022E 20.1 18.1 780 bps (1) 2021 and 2022 guidance based on actual FX rates for January 2021, and current spot FX rates (local currency per US dollar) of MX N 19.93 & PEN 3.64 for February 2021 through December 2022. FX impact may change based on fluctuations in currency rates in future periods. 2021 is based on mi d - point of guidance. Note: An outlook for 2021 & 2022 net income and reconciliation of the forward - looking 2021 & 2022 Adjusted EBITDA outlook to pro jected net income are not being provided as the company does not currently have sufficient data to accurately estimate the variables and individual adjustments for su ch outlook and reconciliation. Due to this uncertainty, the company cannot reconcile Adjusted EBITDA to projected net income without unreasonable effort.

21 © 2021 Laureate Education, Inc. 2021 to 2022 Adjusted EBITDA Bridge (Guidance) 1 Strong Rebound Expected for 2022 (1) Based on actual FX rates for January 2021, and current spot FX rates (local currency per US dollar) of MXN 19.93 & PEN 3.64 f or February 2021 through December 2022. FX impact may change based on fluctuations in currency rates in future periods. (2) Based on mid - point of 2021 guidance. ($USD in millions) $50 $13 $32 2021 Guidance $185 G&A Reduction FAS 5 / Indemnification Asset Operational Improvement 2022 Guidance $280 +51% (2) Note: An outlook for 2021 & 2022 net income and reconciliation of the forward - looking 2021 & 2022 Adjusted EBITDA outlook to pro jected net income are not being provided as the company does not currently have sufficient data to accurately estimate the variables and individual adjustments for su ch outlook and reconciliation. Due to this uncertainty, the company cannot reconcile Adjusted EBITDA to projected net income without unreasonable effort.
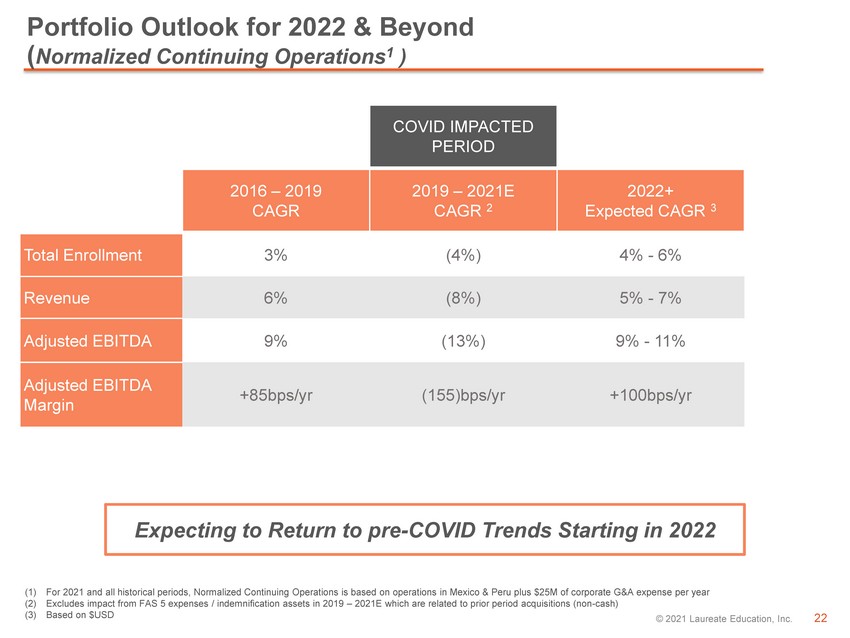
22 © 2021 Laureate Education, Inc. Portfolio Outlook for 2022 & Beyond ( Normalized Continuing Operations 1 ) Expecting to Return to pre - COVID Trends Starting in 2022 COVID IMPACTED PERIOD 2016 – 2019 CAGR 2019 – 2021E CAGR 2 2022+ Expected CAGR 3 Total Enrollment 3% (4%) 4% - 6% Revenue 6% (8%) 5% - 7% Adjusted EBITDA 9% (13%) 9% - 11% Adjusted EBITDA Margin +85bps/ yr (155)bps/ yr +100bps/ yr (1) For 2021 and all historical periods, Normalized Continuing Operations is based on operations in Mexico & Peru plus $25M of corporate G&A expense per year (2) Excludes impact from FAS 5 expenses / indemnification assets in 2019 – 2021E which are related to prior period acquisitions (non - cash) (3) Based on $USD

23 © 2021 Laureate Education, Inc. Q1 2021 Guidance Details Note: An outlook for 2021 net income and reconciliation of the forward - looking 2021 Adjusted EBITDA outlook to net income are no t being provided as the company does not currently have sufficient data to accurately estimate the variables and individual adjustments for such outl ook and reconciliation. Due to this uncertainty, the company cannot reconcile Adjusted EBITDA to projected net income without unreasonable effort. (1) Based on actual FX rates for January 2021, and current spot FX rates (local currency per US dollar) of MXN 19.93 & PEN 3.64 f or February through March 2021. FX impact may change based on fluctuations in currency rates in future periods. (USD millions ) Revenues Adj. EBITDA 2020 Q1 Results $192 ($29) Organic Growth ($7) – $3 $11 – $15 Growth % (4%) - 2% 37% - 52% FAS 5 Expense/Indemnification Asset (non - cash) - ($8) 2021 Q1 Guidance (Constant Currency) $185 – $195 ($26) – ($22) FX Impact (spot FX) (1) - - 2021 Q1 Guidance (@ spot FX) (1) $185 – $195 ($26) – ($22) Favorably Impacted by timing of academic calendar

24 © 2021 Laureate Education, Inc. APPENDIX

25 © 2021 Laureate Education, Inc. Q4 ’20 B / (W) Vs. Q4 ’19 Notes ($ in millions) Reported $ % Adjusted EBITDA 91 (9) (9%) • ($9M) impact from FX Depreciation & Amort. (27) (7) (33%) • Flat excluding amortization of tradename (moved to finite life asset in Q4) Interest Expense, net (25) (2) (8%) Impairments (1) (1) n.m. Other (119) (61) n.m. • FX and derivatives Income Tax (163) (226) n.m. • Tax effect from discrete items Income/(Loss) From Continuing Operations (244) (305) n.m. Discontinued Operations (Net of Tax) 623 624 n.m. • Driven by $556M gain on sale of Australia/NZ businesses Net Income / (Loss) 379 318 n.m. Income from Continuing Operations Impacted by FX 2020 Fourth Quarter – Net Income Reconciliation

26 © 2021 Laureate Education, Inc. FY ’20 B / (W) Vs. FY ’19 Notes ($ in millions) Reported $ % Adjusted EBITDA 206 2 1% • ($25M) impact from FX Depreciation & Amort. (83) (1) (1%) Interest Expense, net (99) 23 19% • Lower average debt balances in 2020 Impairments (352) (352) n.m. • Primarily Laureate tradename impairment Other (123) (3) n.m. • Loss on debt extinguishment in 2019 & FX impacts in 2020 Income Tax 130 161 n.m. • Tax effect from discrete items Income/(Loss) From Continuing Operations (321) (170) n.m. • Driven by impairment charges Discontinued Operations (Net of Tax) (298) (1,386) n.m. • Business units sold in 2019 impacting y - o - y comparability; Chile impairment in Q2 2020 Net Income / (Loss) (619) (1,556) n.m. 2020 FY – Net Income Reconciliation Income from Continuing Operations Impacted by Impairment Charges

27 © 2021 Laureate Education, Inc. FY 2020 Debt Capitalization ($ in millions) Continuing Operations Discontinued Operations Total Company Revolver $ - $ - $ - Sr. Notes $799 - $799 Local Debt / Seller Notes $250 $173 $423 Gross Debt $1,049 $173 $1,222 Cash ($750) ($270) ($1,020) Net Debt / (Cash) $299 ($97) $202 Net Debt of Only $202M as of Year - End 2020 Revolver Fully Repaid During Fourth Quarter ($410M Available)

28 © 2021 Laureate Education, Inc. (1) Sale of both Walden University and Brazilian operations expected to close in 2021. (2) Other predominantly includes divestitures already closed and completed. (3) Organic Constant Currency (CC) Operations excludes the period - over - period impact from currency fluctuations (if applicable), acq uisitions and divestitures, and other items. Other items include the impact of acquisition - related contingent liabilities for taxes other - than - income tax, net of chan ges in recorded indemnification assets. Online 1 Brazil 1 Other 2 Total Disc. Ops ($ in millions) (Enrollments in thousands) Q4 ’20 Vs. Q4 ‘19 Organic/ CC vs. Q4 ‘19 3 Q4 ‘20 Vs. Q4 ‘19 Organic/ CC vs. Q4 ‘19 3 Q4 ‘20 Vs. Q4 ‘19 Organic/ CC vs. Q4 ‘19 3 Q4 ‘20 Vs. Q4 ‘19 Organic/ CC vs. Q4 ‘19 3 New Enrollment 6 (4%) (4%) 23 11% 12% 2 (63%) (62%) 32 (5%) (5%) Total Enrollment 58 2% 2% 256 (6%) (6%) 21 (91%) (91%) 335 (42%) (42%) Revenue 163 4% 4% 121 (23%) 4% 48 (83%) (83%) 332 (43%) (37%) Adjusted EBITDA 43 (10%) (10%) 47 (8%) 17% 8 (87%) (87%) 98 (38%) (28%) Discontinued Operations – Q4 2020 vs. Q4 2019
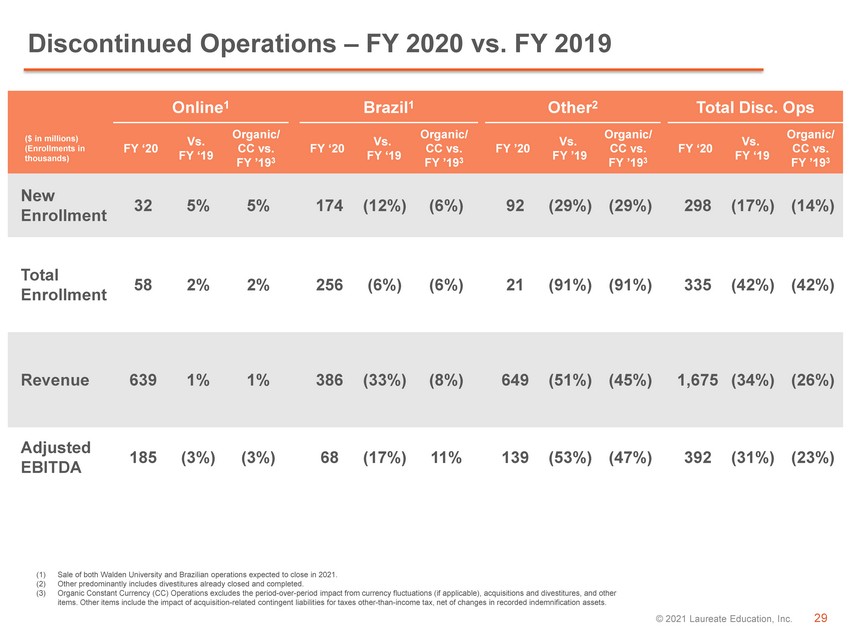
29 © 2021 Laureate Education, Inc. Online 1 Brazil 1 Other 2 Total Disc. Ops ($ in millions) (Enrollments in thousands) FY ‘20 Vs. FY ‘19 Organic/ CC vs. FY ’19 3 FY ‘20 Vs. FY ‘19 Organic/ CC vs. FY ’19 3 FY ’20 Vs. FY ’19 Organic/ CC vs. FY ’19 3 FY ‘20 Vs. FY ‘19 Organic/ CC vs. FY ’19 3 New Enrollment 32 5% 5% 174 (12%) (6%) 92 (29%) (29%) 298 (17%) (14%) Total Enrollment 58 2% 2% 256 (6%) (6%) 21 (91%) (91%) 335 (42%) (42%) Revenue 639 1% 1% 386 (33%) (8%) 649 (51%) (45%) 1,675 (34%) (26%) Adjusted EBITDA 185 (3%) (3%) 68 (17%) 11% 139 (53%) (47%) 392 (31%) (23%) Discontinued Operations – FY 2020 vs. FY 2019 (1) Sale of both Walden University and Brazilian operations expected to close in 2021. (2) Other predominantly includes divestitures already closed and completed. (3) Organic Constant Currency (CC) Operations excludes the period - over - period impact from currency fluctuations (if applicable), acq uisitions and divestitures, and other items. Other items include the impact of acquisition - related contingent liabilities for taxes other - than - income tax, net of chan ges in recorded indemnification assets.

30 © 2021 Laureate Education, Inc. Total Disc. Ops ($ in millions) (Enrollments in thousands) Q4 ‘20 Q4 ‘19 (Loss) income from discontinued operations, net of tax $623 ($1) Income tax expense $19 $82 Other non - operating expense (income) ($11) $25 (Gain)/Loss on sale of discontinued operations before taxes, net ($341) $24 Operating income $290 $131 Depreciation and amortization $0 $27 Share - based compensation expense 1 $1 $1 (Gain) on impairment of assets 2 ($201) ($25) EiP implementation expenses 3 $8 $21 Adjusted EBITDA (before allocations) $98 $155 Allocations, net $0 $2 Adjusted EBITDA $98 $157 Discontinued Operations Q4 2020 vs. Q4 2019 – Adjusted EBITDA Reconciliation ( 1 ) Represents non - cash, share - based compensation expense pursuant to the provisions of ASC Topic 718. ( 2 ) Represents non - cash charges related to impairments of long - lived assets. ( 3 ) Excellence - in - Process (EiP) implementation expenses are related to our enterprise - wide initiative to optimize and standardize Laureate’s processes, creating vertical integration of procurement, information technology, finance, accounting and human resources . It included the establishment of regional shared services organizations (SSOs) around the world, as well as improvements to the Company's system of internal controls over financial reporting . The EiP initiative also includes other back - and mid - office areas, as well as certain student - facing activities, expenses associated with streamlining the organizational structure and certain non - recurring costs incurred in connection with the planned and completed dispositions . Beginning in the third quarter of 2019 , EiP also includes expenses associated with an enterprise - wide program aimed at revenue growth .

31 © 2021 Laureate Education, Inc. Total Disc. Ops ($ in millions) (Enrollments in thousands) FY 2020 FY 2019 (Loss) income from discontinued operations, net of tax ($298) $1,088 Income tax expense $114 $34 Other non - operating expense $69 $71 (Gain) on sale of discontinued operations before taxes, net ($25) ($793) Operating (loss) income ($140) $399 Depreciation and amortization $60 $111 Share - based compensation expense 1 $3 $3 Loss on impairment of assets 2 $438 $1 EiP implementation expenses 3 $30 $48 Adjusted EBITDA (before allocations) $391 $561 Allocations, net $1 $7 Adjusted EBITDA $392 $569 Discontinued Operations FY 2020 vs. FY 2019 – Adjusted EBITDA Reconciliation ( 1 ) Represents non - cash, share - based compensation expense pursuant to the provisions of ASC Topic 718. ( 2 ) Represents non - cash charges related to impairments of long - lived assets. ( 3 ) Excellence - in - Process (EiP) implementation expenses are related to our enterprise - wide initiative to optimize and standardize Laureate’s processes, creating vertical integration of procurement, information technology, finance, accounting and human resources . It included the establishment of regional shared services organizations (SSOs) around the world, as well as improvements to the Company's system of internal controls over financial reporting . The EiP initiative also includes other back - and mid - office areas, as well as certain student - facing activities, expenses associated with streamlining the organizational structure and certain non - recurring costs incurred in connection with the planned and completed dispositions . Beginning in the third quarter of 2019 , EiP also includes expenses associated with an enterprise - wide program aimed at revenue growth .
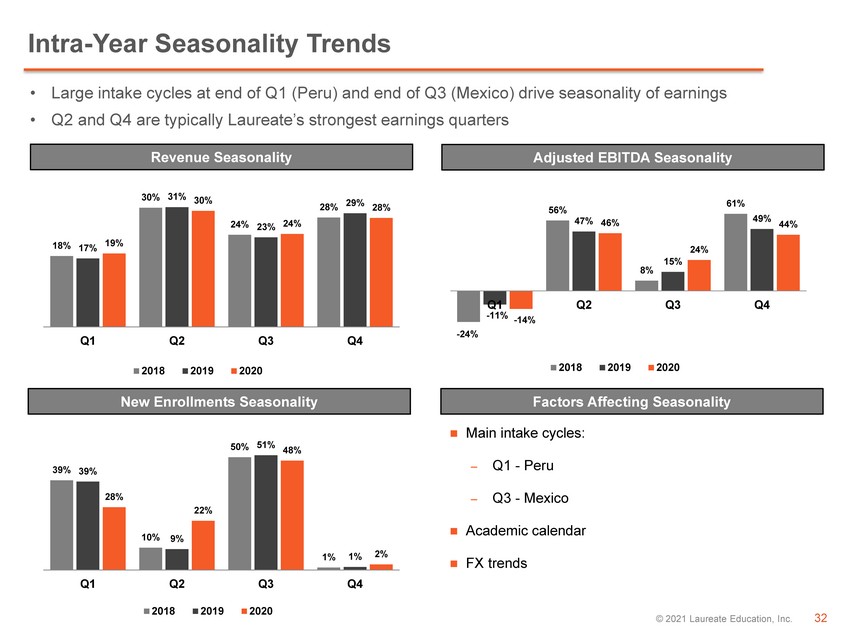
32 © 2021 Laureate Education, Inc. • Large intake cycles at end of Q1 (Peru) and end of Q3 (Mexico) drive seasonality of earnings • Q2 and Q4 are typically Laureate’s strongest earnings quarters Revenue Seasonality Adjusted EBITDA Seasonality New Enrollments Seasonality Factors Affecting Seasonality Main intake cycles: – Q1 - Peru – Q3 - Mexico Academic calendar FX trends Intra - Year Seasonality Trends 18% 30% 24% 28% 17% 31% 23% 29% 19% 30% 24% 28% Q1 Q2 Q3 Q4 2018 2019 2020 - 24% 56% 8% 61% - 11% 47% 15% 49% - 14% 46% 24% 44% Q1 Q2 Q3 Q4 2018 2019 2020 39% 10% 50% 1% 39% 9% 51% 1% 28% 22% 48% 2% Q1 Q2 Q3 Q4 2018 2019 2020

33 © 2021 Laureate Education, Inc. Normalized Continuing Operations - Summary Results (Adjusted) 1 (1) Defined as historical results for operations in Mexico & Peru, and including $25M of corporate G&A expense per year Strong Growth Track Record and Consistent Margin Expansion Total Enrollment (000s) Revenue ($M) Adjusted EBITDA ($M) 335 349 354 366 2019 2016 2017 2018 CAGR +3% 2017 $1,210 2016 2018 2019 $1,020 $1,101 $1,144 CAGR +6% 2018 2019 2016 2017 $337 $258 $284 $303 CAGR +9% Adjusted EBITDA Margin % 27.8 2016 2017 2018 2019 26.5 25.3 25.8 85 bps/ yr

34 © 2021 Laureate Education, Inc. Financial Results & Tables

35 © 2021 Laureate Education, Inc. Financial Tables Note: Dollars in millions, except per share amounts, and may not sum to total due to rounding Consolidated Statements of Operations For the three months ended December 31, For the year ended December 31, IN MILLIONS 2020 2019 Change 2020 2019 Change Revenues $ 285.2 $ 351.8 $ (66.6 ) $ 1,024.9 $ 1,212.1 $ (187.2 ) Costs and expenses: Direct costs 188.3 242.4 (54.1 ) 802.5 949.5 (147.0 ) General and administrative expenses 59.0 52.1 6.9 199.8 226.3 (26.5 ) Loss on impairment of assets 1.0 — 1.0 352.0 0.2 351.8 Operating income (loss) 36.9 57.3 (20.4 ) (329.3 ) 36.0 (365.3 ) Interest income 0.6 0.7 (0.1 ) 2.2 3.3 (1.1 ) Interest expense (25.2 ) (23.5 ) (1.7 ) (100.9 ) (125.0 ) 24.1 Loss on debt extinguishment (0.6 ) (0.5 ) (0.1 ) (0.6 ) (22.6 ) 22.0 (Loss) gain on derivatives (25.4 ) (0.9 ) (24.5 ) (26.0 ) 8.3 (34.3 ) Other (expense) income, net (3.2 ) (0.2 ) (3.0 ) (2.4 ) 8.9 (11.3 ) Foreign currency exchange (loss) gain, net (57.6 ) (15.7 ) (41.9 ) 13.5 (8.1 ) 21.6 Loss on disposals of subsidiaries, net (6.1 ) (19.0 ) 12.9 (7.3 ) (20.4 ) 13.1 Loss from continuing operations before income taxes and equity in net income of affiliates (80.6 ) (1.7 ) (78.9 ) (450.8 ) (119.7 ) (331.1 ) Income tax (expense) benefit (163.4 ) 62.9 (226.3 ) 130.1 (31.0 ) 161.1 Equity in net income of affiliates, net of tax — — — 0.2 0.2 — (Loss) income from continuing operations (244.1 ) 61.2 (305.3 ) (320.6 ) (150.5 ) (170.1 ) Income (loss) from discontinued operations, net of tax 623.1 (0.6 ) 623.7 (298.1 ) 1,088.1 (1,386.2 ) Net income (loss) 379.0 60.6 318.4 (618.7 ) 937.7 (1,556.4 ) Net loss attributable to noncontrolling interests 0.3 0.3 — 5.4 0.8 4.6 Net income (loss) attributable to Laureate Education, Inc. $ 379.3 $ 60.9 $ 318.4 $ (613.3 ) $ 938.5 $ (1,551.8 ) Accretion of redemption value of redeemable noncontrolling interests and equity $ — $ (0.5 ) $ 0.5 $ 0.1 $ (0.2 ) $ 0.3 Net income (loss) available to common stockholders $ 379.3 $ 60.4 $ 318.9 $ (613.2 ) $ 938.3 $ (1,551.5 ) Basic and diluted earnings (loss) per share: Basic weighted average shares outstanding 209.1 214.3 (5.2 ) 209.7 221.9 (12.2 ) Dilutive weighted average shares outstanding 209.1 214.9 (5.8 ) 209.7 221.9 (12.2 ) Basic and diluted earnings (loss) per share $ 1.81 $ 0.28 $ 1.53 $ (2.93 ) $ 4.23 $ (7.16 )

36 © 2021 Laureate Education, Inc. Financial Tables Note: Dollars in millions, and may not sum to total due to rounding Revenue and Adjusted EBITDA by segmen t IN MILLIONS % Change $ Variance Components For the three months ended December 31, 2020 2019 Reported Organic Constant Currency (1) Total Organic Constant Currency Other Acq/Div. FX Revenues Mexico $ 149.6 $ 188.1 (20)% (15)% $ (38.5 ) $ (27.4 ) $ — $ — $ (11.1 ) Peru 131.5 155.7 (16)% (10)% (24.2 ) (15.0 ) — — (9.2 ) Corporate & Eliminations 4.2 8.0 (48)% (48)% (3.8 ) (3.8 ) — — — Total Revenues $ 285.2 $ 351.8 (19)% (13)% $ (66.6 ) $ (46.3 ) $ — $ — $ (20.3 ) Adjusted EBITDA Mexico $ 54.4 $ 67.3 (19)% (15)% $ (12.9 ) $ (10.1 ) $ 1.6 $ — $ (4.4 ) Peru 60.5 63.8 (5)% 2% (3.3 ) 1.2 — — (4.5 ) Corporate & Eliminations (24.3 ) (31.7 ) 23% 23% 7.4 7.4 — — — Total Adjusted EBITDA $ 90.6 $ 99.4 (9)% (2)% $ (8.8 ) $ (1.5 ) $ 1.6 $ — $ (8.9 ) ( 1 ) Organic Constant Currency results exclude the period - over - period impact from currency fluctuations, acquisitions and divestitures, and other items . Other items include the impact of acquisition - related contingent liabilities for taxes other - than - income tax, net of changes in recorded indemnification assets . The "Organic Constant Currency" % changes are calculated by dividing the Organic Constant Currency amounts by the 2019 Revenues and Adjusted EBITDA amounts .

37 © 2021 Laureate Education, Inc. Financial Tables Revenue and Adjusted EBITDA by segment Note: Dollars in millions, and may not sum to total due to rounding IN MILLIONS % Change $ Variance Components For the year ended December 31, 2020 2019 Reported Organic Constant Currency (2) Total Organic Constant Currency Other Acq/Div. FX Revenues Mexico $ 534.6 $ 652.8 (18)% (9)% $ (118.2 ) $ (59.8 ) $ — $ — $ (58.4 ) Peru 482.9 546.8 (12)% (7)% (63.9 ) (40.5 ) — — (23.4 ) Corporate & Eliminations 7.4 12.5 (41)% (41)% (5.1 ) (5.1 ) — — — Total Revenues $ 1,024.9 $ 1,212.1 (15)% (9)% $ (187.2 ) $ (105.4 ) $ — $ — $ (81.8 ) Adjusted EBITDA Mexico $ 112.9 $ 147.8 (24)% (14)% $ (34.9 ) $ (21.0 ) $ 0.8 $ — $ (14.7 ) Peru 189.5 197.8 (4)% 1% (8.3 ) 2.1 — — (10.4 ) Corporate & Eliminations (96.7 ) (142.0 ) 32% 32% 45.3 45.3 — — — Total Adjusted EBITDA $ 205.7 $ 203.6 1% 13% $ 2.1 $ 26.4 $ 0.8 $ — $ (25.1 ) ( 2 ) Organic Constant Currency results exclude the period - over - period impact from currency fluctuations, acquisitions and divestitures, and other items . Other items include the impact of acquisition - related contingent liabilities for taxes other - than - income tax, net of changes in recorded indemnification assets . The "Organic Constant Currency" % changes are calculated by dividing the Organic Constant Currency amounts by the 2019 Revenues and Adjusted EBITDA amounts, excluding the impact of the divestitures .

38 © 2021 Laureate Education, Inc. Financial Tables Consolidated Balance Sheets Note: Dollars in millions, and may not sum to total due to rounding IN MILLIONS December 31, 2020 December 31, 2019 Change Assets Cash and cash equivalents $ 750.1 $ 61.6 $ 688.5 Receivables (current), net 111.9 75.1 36.8 Other current assets 146.8 72.9 73.9 Current assets held for sale 435.0 706.5 (271.5 ) Property and equipment, net 578.5 640.6 (62.1 ) Operating lease right - of - use assets, net 462.8 521.8 (59.0 ) Goodwill and other intangible assets 800.4 1,168.6 (368.2 ) Deferred income taxes 130.6 49.4 81.2 Other long - term assets 72.4 98.9 (26.5 ) Long - term assets held for sale 1,482.5 3,101.0 (1,618.5 ) Total assets $ 4,970.9 $ 6,496.4 $ (1,525.5 ) Liabilities and stockholders' equity Accounts payable and accrued expenses $ 200.9 $ 267.7 $ (66.8 ) Deferred revenue and student deposits 47.2 54.8 (7.6 ) Total operating leases, including current portion 519.1 559.0 (39.9 ) Total long - term debt, including current portion 995.7 1,151.4 (155.7 ) Other liabilities 240.0 292.1 (52.1 ) Current and long - term liabilities held for sale 702.3 1,354.9 (652.6 ) Total liabilities 2,705.2 3,680.0 (974.8 ) Redeemable noncontrolling interests and equity 1.7 12.3 (10.6 ) Total stockholders' equity 2,263.9 2,804.2 (540.3 ) Total liabilities and stockholders' equity $ 4,970.9 $ 6,496.4 $ (1,525.5 )

39 © 2021 Laureate Education, Inc. Financial Tables Consolidated Statements of Cash Flows Note: Dollars in millions, and may not sum to total due to rounding For the year ended December 31, IN MILLIONS 2020 2019 Change Cash flows from operating activities Net (loss) income $ (618.7 ) $ 937.7 $ (1,556.4 ) Depreciation and amortization 143.5 193.4 (49.9 ) Amortization of operating lease right - of - use assets 80.2 122.7 (42.5 ) Loss on impairment of assets 790.2 0.9 789.3 Gain on sales and disposal of subsidiaries and property and equipment, net (22.8 ) (753.5 ) 730.7 Loss ( Gain ) on derivative instruments 26.0 (7.4 ) 33.4 (Payments for) proceeds from settlement of derivative contracts (0.6 ) (8.8 ) 8.2 Loss on debt extinguishment 0.6 28.8 (28.2 ) Deferred income taxes (185.7 ) (29.8 ) (155.9 ) Unrealized foreign currency exchange loss 26.3 29.2 (2.9 ) Income tax receivable/payable, net 99.6 (36.2 ) 135.8 Working capital, excluding tax accounts (227.2 ) (252.8 ) 25.6 Other non - cash adjustments 148.1 115.8 32.3 Net cash provided by operating activities 259.6 339.8 (80.2 ) Cash flows from investing activities Purchase of property and equipment (74.6 ) (155.6 ) 81.0 Expenditures for deferred costs (14.5 ) (17.7 ) 3.2 Receipts from sales of discontinued operations, net of cash sold, property and equipment and other 676.6 1,266.0 (589.4 ) Settlement of derivatives related to sale of discontinued operations and net investment hedge — 12.9 (12.9 ) Proceeds from sale of investment — 11.5 (11.5 ) Investing other, net — (0.3 ) 0.3 Net cash provided by investing activities 587.4 1,116.8 (529.4 ) Cash flows from financing activities Decrease in long - term debt, net (177.0 ) (1,384.6 ) 1,207.6 Payments of deferred purchase price for acquisitions (5.7 ) (20.2 ) 14.5 Payments to purchase noncontrolling interests (13.7 ) (5.8 ) (7.9 ) Proceeds from exercise of stock options 25.7 14.0 11.7 Payments to repurchase common stock (99.5 ) (264.1 ) 164.6 Payments of debt issuance costs (0.8 ) (9.1 ) 8.3 Financing other, net (1.8 ) (4.2 ) 2.4 Net cash used in by financing activities (272.7 ) (1,674.0 ) 1,401.3 Effects of exchange rate changes on cash (0.5 ) 5.1 (5.6 ) Change in cash included in current assets held for sale 195.8 184.6 11.2 Net change in cash and cash equivalents 769.5 (27.8 ) 797.3 Cash and cash equivalents at beginning of period 97.8 125.6 (27.8 ) Cash and cash equivalents at end of period $ 867.3 $ 97.8 $ 769.5

40 © 2021 Laureate Education, Inc. Financial Tables Non - GAAP Reconciliation (1 of 2) Note: Dollars in millions, and may not sum to total due to rounding The following table reconciles (loss) income from continuing operations to Adjusted EBITDA and Adjusted EBITDA margin: For the three months ended December 31, For the year ended December 31, IN MILLIONS 2020 2019 Change 2020 2019 Change (Loss) income from continuing operations $ (244.1 ) $ 61.2 $ (305.3 ) $ (320.6 ) $ (150.5 ) $ (170.1 ) Plus: Equity in net income of affiliates, net of tax — — — (0.2 ) (0.2 ) — Income tax expense (benefit) 163.4 (62.9 ) 226.3 (130.1 ) 31.0 (161.1 ) Loss from continuing operations before income taxes and equity in net income of affiliates (80.6 ) (1.7 ) (78.9 ) (450.8 ) (119.7 ) (331.1 ) Plus: Loss on disposal of subsidiaries, net 6.1 19.0 (12.9 ) 7.3 20.4 (13.1 ) Foreign currency exchange loss (gain), net 57.6 15.7 41.9 (13.5 ) 8.1 (21.6 ) Other expense (income), net 3.2 0.2 3.0 2.4 (8.9 ) 11.3 Loss (gain) on derivatives 25.4 0.9 24.5 26.0 (8.3 ) 34.3 Loss on debt extinguishment 0.6 0.5 0.1 0.6 22.6 (22.0 ) Interest expense 25.2 23.5 1.7 100.9 125.0 (24.1 ) Interest income (0.6 ) (0.7 ) 0.1 (2.2 ) (3.3 ) 1.1 Operating income (loss) 36.9 57.3 (20.4 ) (329.3 ) 36.0 (365.3 ) Plus: Depreciation and amortization 27.2 20.4 6.8 83.1 82.0 1.1 EBITDA 64.1 77.7 (13.6 ) (246.2 ) 118.0 (364.2 ) Plus: Share - based compensation expense (3) 2.3 2.8 (0.5 ) 10.2 10.3 (0.1 ) Loss on impairment of assets (4) 1.0 — 1.0 352.0 0.2 351.8 EiP implementation expenses (5) 23.2 18.9 4.3 89.6 75.0 14.6 Adjusted EBITDA $ 90.6 $ 99.4 $ (8.8 ) $ 205.7 $ 203.6 $ 2.1 Revenues $ 285.2 $ 351.8 $ (66.6 ) $ 1,024.9 $ 1,212.1 $ (187.2 ) Adjusted EBITDA margin 31.8 % 28.3 % 351 bps 20.1 % 16.8 % 327 bps (3) Represents non - cash, share - based compensation expense pursuant to the provisions of ASC Topic 718, "Stock Compensation." (4) Represents non - cash charges related to impairments of long - lived assets. ( 5 ) EiP implementation expenses are related to our enterprise - wide initiative to optimize and standardize Laureate’s processes, creating vertical integration of procurement, information technology, finance, accounting and human resources . It included the establishment of regional shared services organizations (SSOs) around the world, as well as improvements to the Company's system of internal controls over financial reporting . The EiP initiative also includes other back - and mid - office areas, as well as certain student - facing activities, expenses associated with streamlining the organizational structure and certain non - recurring costs incurred in connection with the planned and completed dispositions . Beginning in 2019 , EiP also includes expenses associated with an enterprise - wide program aimed at revenue growth . .
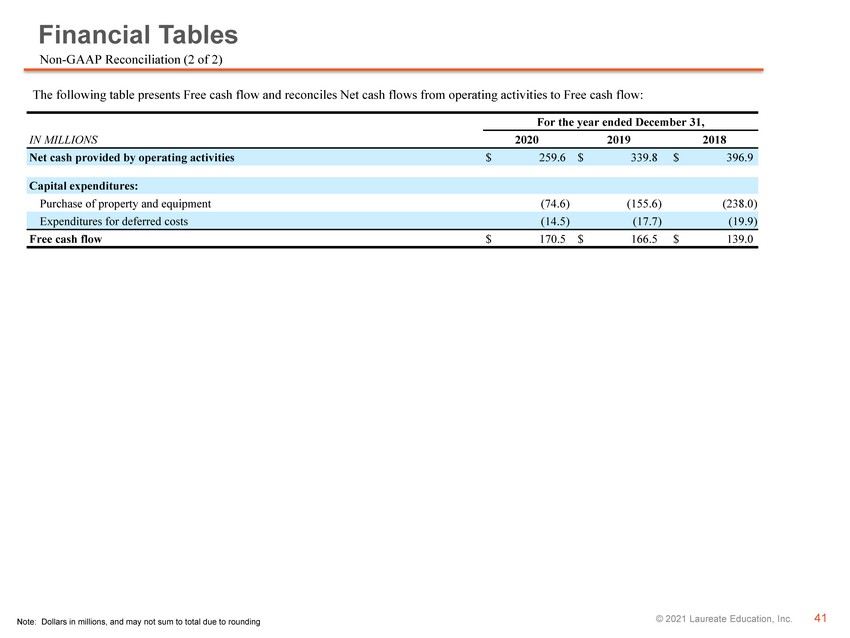
41 © 2021 Laureate Education, Inc. Financial Tables Non - GAAP Reconciliation (2 of 2) Note: Dollars in millions, and may not sum to total due to rounding The following table presents Free cash flow and reconciles Net cash flows from operating activities to Free cash flow: For the year ended December 31, IN MILLIONS 2020 2019 2018 Net cash provided by operating activities $ 259.6 $ 339.8 $ 396.9 Capital expenditures: Purchase of property and equipment (74.6 ) (155.6 ) (238.0 ) Expenditures for deferred costs (14.5 ) (17.7 ) (19.9 ) Free cash flow $ 170.5 $ 166.5 $ 139.0

42 © 2021 Laureate Education, Inc. Financial Tables (Historical Data) Revenue and Adjusted EBITDA by segment (historical) Note: Dollars in millions, and may not sum to total due to rounding The following table presents segment information for the four quarters of 2020 and the years ended December 31 , 2020 , 2019 and 2018 : Three Months Ended Years ended December 31, (in millions except for enrollment) December 31, 2020 September 30, 2020 June 30, 2020 March 31, 2020 2020 2019 2018 New Enrollment: Mexico 3,700 63,000 12,100 28,400 107,200 112,400 109,000 Peru 500 18,400 24,500 18,300 61,800 67,900 58,300 Total New Enrollment 4,200 81,400 36,600 46,700 169,000 180,300 167,300 Total Enrollment as of Reporting Date: Mexico 194,000 192,100 168,400 193,800 194,000 204,200 206,300 Peru 142,500 143,500 152,800 163,500 142,500 162,200 147,700 Total Enrollment 336,500 335,600 321,200 357,300 336,500 366,400 354,000 Revenues: Mexico $ 149.6 $ 115.9 $ 114.9 $ 154.2 $ 534.6 $ 652.8 $ 646.1 Peru 131.5 127.3 187.6 36.5 482.9 546.8 496.4 Corporate & Eliminations 4.2 0.3 1.4 1.6 7.4 12.5 2.1 Consolidated Total Revenues $ 285.2 $ 243.5 $ 303.9 $ 192.3 $ 1,024.9 $ 1,212.1 $ 1,144.6 Adjusted EBITDA: Mexico $ 54.4 $ 15.5 $ 19.7 $ 23.3 $ 112.9 $ 147.8 $ 143.1 Peru 60.5 56.5 99.2 (26.7 ) 189.5 197.5 169.2 Corporate & Eliminations (24.3 ) (21.6 ) (24.8 ) (26.0 ) (96.7 ) (141.7 ) (172.7 ) Consolidated Total Adjusted EBITDA $ 90.6 $ 50.4 $ 94.1 $ (29.4 ) $ 205.7 $ 203.6 $ 139.6

43 © 2021 Laureate Education, Inc.