Attached files
| file | filename |
|---|---|
| 8-K - FORM 8-K GVP INVESTOR RELATIONS PRESENTATION - GSE SYSTEMS INC | form8k.htm |
Exhibit 99.1

Investor PresentationGSE Systems, Inc. (“GSE Solutions”)NASDAQ: GVPFebruary 24, 2021

Forward Looking Statements and Non-GAAP Financial Measures This presentation, our remarks, and answers
to questions contain statements that are considered forward-looking statements within the meaning of Section 27A of the Securities Act of 1933, as amended, and Section 21E of the Securities Exchange Act of 1934. These statements reflect our
current expectations concerning future events and results. We use words such as "expect," "intend," "believe," "may," "will," "should," "could," "anticipate," and similar expressions to identify forward-looking statements, but their absence
does not mean a statement is not forward-looking. These statements are not guarantees of our future performance and are subject to risks, uncertainties, and other important factors that could cause our actual performance or achievements to be
materially different from those we project. For a full discussion of these risks, uncertainties, and factors, we encourage you to read our documents on file with the Securities and Exchange Commission, including those set forth in our periodic
reports under the forward-looking statements and risk factors sections. We do not intend to update or revise any forward-looking statements, whether as a result of new information, future events, or otherwise.This presentation, our remarks, and
answers to questions include references to Adjusted EBITDA, adjusted net income, and adjusted earnings per share (“adjusted EPS”), which do not adhere to generally accepted accounting principles (“GAAP”). We define EBITDA as earnings before
interest, taxes, depreciation and amortization (“EBITDA”). “Adjusted EBITDA” excludes from EBITDA certain non-recurring gains and expense including non-cash loss on impairment, impact of the change in fair value of contingent consideration,
restructuring charges, stock-based compensation expense, impact of the change in fair value of derivative instruments, and acquisition-related expense. References to “Adjusted net income” excludes from net income non-cash loss on impairment,
impact of the change in fair value of contingent consideration, restructuring charges, stock-based compensation expense, impact of the change in fair value of derivative instruments, acquisition-related expense, and amortization of intangible
assets related to acquisitions. We define adjusted EPS as adjusted net income divided by fully diluted shares of common stock issued and outstanding. EBITDA, Adjusted EBITDA, Adjusted net income, and adjusted EPS are reconciled to net income,
the most directly comparable GAAP measure, in the financial tables included in the Appendix to this presentation. We believe that this additional information and the reconciliation we provide may be useful to help evaluate our operations. This
information supplements our results as reported in accordance with GAAP and should not be viewed in isolation from, or as a substitute for, our GAAP results.We undertake no duty to update or revise the information in light of new information,
future events or otherwise, although we may do so from time to time as management believes is appropriate. Any such updating may be made through the filing of reports or documents with the Securities and Exchange Commission, through press
releases or through other public disclosures.

GSE: The Future of Power Operations GSE is a team of highly dedicated experts focused on decarbonization
of the power industry by providing specialized talent, services, and technologies that help deliver clean, safe, and low-cost energy the world expects.
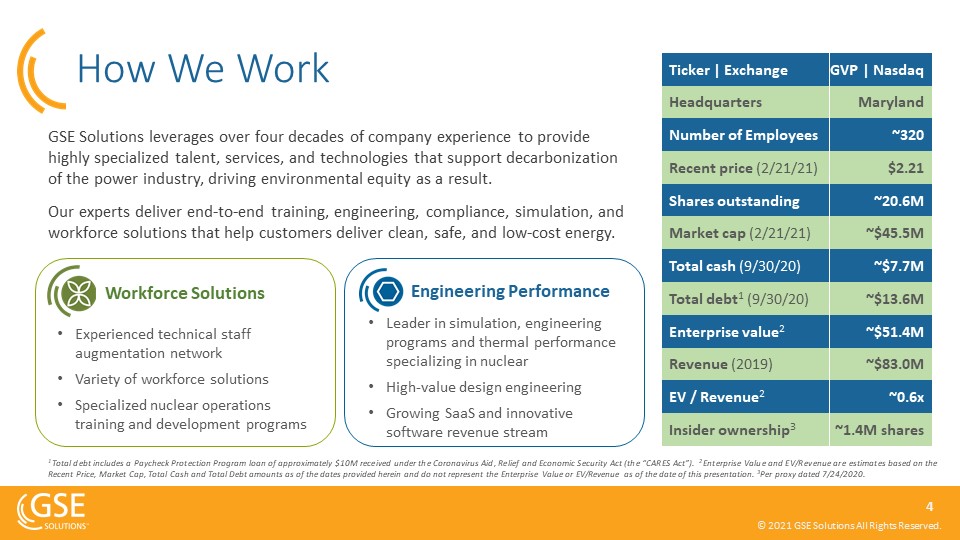
How We Work Experienced technical staff augmentation network Variety of workforce solutionsSpecialized
nuclear operations training and development programs Leader in simulation, engineering programs and thermal performance specializing in nuclear High-value design engineeringGrowing SaaS and innovative software revenue stream Workforce
Solutions Engineering Performance GSE Solutions leverages over four decades of company experience to provide highly specialized talent, services, and technologies that support decarbonization of the power industry, driving environmental
equity as a result. Our experts deliver end-to-end training, engineering, compliance, simulation, and workforce solutions that help customers deliver clean, safe, and low-cost energy. Ticker | Exchange GVP |
Nasdaq Headquarters Maryland Number of Employees ~320 Recent price (2/21/21) $2.21 Shares outstanding ~20.6M Market cap (2/21/21) ~$45.5M Total cash (9/30/20) ~$7.7M Total debt1 (9/30/20) ~$13.6M Enterprise
value2 ~$51.4M Revenue (2019) ~$83.0M EV / Revenue2 ~0.6x Insider ownership3 ~1.4M shares 1 Total debt includes a Paycheck Protection Program loan of approximately $10M received under the Coronavirus Aid, Relief and Economic
Security Act (the “CARES Act”). 2 Enterprise Value and EV/Revenue are estimates based on the Recent Price, Market Cap, Total Cash and Total Debt amounts as of the dates provided herein and do not represent the Enterprise Value or EV/Revenue as
of the date of this presentation. 3Per proxy dated 7/24/2020.

Approximate Revenue Mix (2019) Engineering Performance Workforce Solutions By Segment By
Industry Nuclear Other Power North America Europe By Geography Utilities Other By End User Asia Non-Power / Process

Business Model: How We Make Money ~55%30-40+%Engineering Modeling & Modification ServicesFixed
price, and time and material contractsPercent complete, or as service is performed billing occurs ~45%12-15%Technical / High-Value StaffingTime and material contractsAs service is performed billing occurs ~5%80-90%SoftwareSale of perpetual
license with recurring MX, or SaaS annual subscriptionLicense upon delivery, ratable recognition over life of MX agreement Engineering Performance Workforce Solutions Software1 % of RevenueGross MarginPrimarily SellingBusiness
ModelAccounting 1 Software is a component of GSE’s Engineering Performance group

Leadership with an “owner/operator” mentality Experience and skill-set to deliver operational
improvementsAligned with shareholders (CEO purchased >200,000 shares on open market in 2020) Investment Highlights Four decades serving a high-barrier-to-entry market Strong, enduring relationships with blue chip power and process
companies Blue Chip Client Base Four decades serving a high-barrier-to-entry market Strong, enduring relationships with blue chip power and process companies Aligned, ProvenLeadership Recognition of nuclear as a critical source of
resilient baseload carbon-free energy Environmentally-friendly Biden administration--ambitious plans to cut carbon emissionsAging workforce crisis / buoyant outlook for Small Modular Reactor (“SMR”) technology Favorable Industry
Drivers Significant discount relative to industry peersGrowing Software as a Service (“SaaS”) revenue stream (higher multiple) Attractive Valuation Expertise from 40+ years of serving clients in the power and process sectorsProven and
differentiated technology for simulation and training solutionsDifficult-to-replicate technology and base of talented, specialized employees Highly Specialized Platform Focus on growth, execute on exciting solutions roadmap Streamline
operations, contain costs and maximize cash flow Solid Growth Strategy
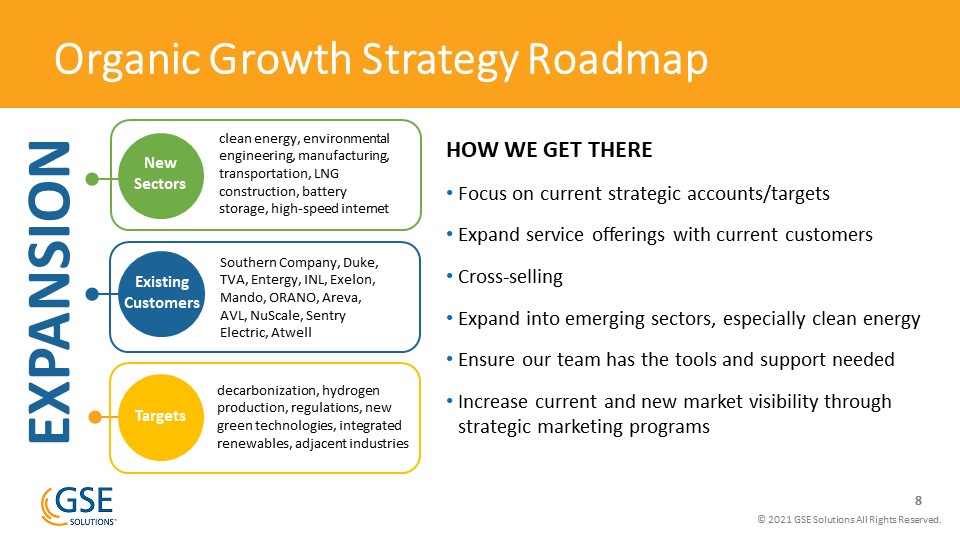
Organic Growth Strategy Roadmap Targets HOW WE GET THEREFocus on current strategic
accounts/targetsExpand service offerings with current customersCross-sellingExpand into emerging sectors, especially clean energyEnsure our team has the tools and support neededIncrease current and new market visibility through strategic
marketing programs EXPANSION New Sectors Existing Customers clean energy, environmental engineering, manufacturing, transportation, LNG construction, battery storage, high-speed internet Southern Company, Duke, TVA, Entergy, INL,
Exelon, Mando, ORANO, Areva, AVL, NuScale, Sentry Electric, Atwell decarbonization, hydrogen production, regulations, new green technologies, integrated renewables, adjacent industries

Engineering Performance Roadmap Build upon what has historically worked for GSE Engineering
Services Integrate our service areas to provide more comprehensive client solutions Evaluate and deliver new collaborative services, products and solutions 1 BUILD 3 EXPAND 2 INTEGRATE Maintain and optimize existing ops workflowBuild in
new revenue streams Identify and integrate accomplished, valued, low-cost, workflow options based on cross pollination Expand customer baseNew solutions with significant value to industryExtension into natural clean energy adjacent markets

GSE Senior Leadership Kyle Loudermilk President and Chief Executive Officer20+ years of executive
experience at publicly-listed MicroStrategy. AspenTech, and PE-backed Datatel/Ellucian Strong track record revitalizing technology companiesBS, MS, Chemical Engineering – Columbia University; Harvard University General Management
Program Emmett Pepe, CPA Chief Financial Officer30+ years of experience in finance management across a variety of business sectors Focus on the software and telecommunicationExecutive positions at MicroStrategy, BroadSoft, Software AG, and
webMethodsBS, Accounting – Penn State University Bahram Meyssami PhD Chief Technology Officer25+ years of experience in the software industryFormer positions at Aspen Technology, Datatel, University of MarylandBS, MS, PhD Chemical Engineering
– University of Maryland Don Horn President, Engineering Performance Group 25+ years in energy industry, focused on managerial and engineering responsibilitiesElectrical engineering experience with Foster Wheeler, Houston Lighting & Power,
and FluorBS in Electrical Engineering – Colorado State University Brian Greene Vice President, Workforce Solutions Group 15+ years of staffing industry experience More than a decade with System One, with a particular focus on staffing for the
nuclear energy and engineering sectorsBA, English – University of West Georgia
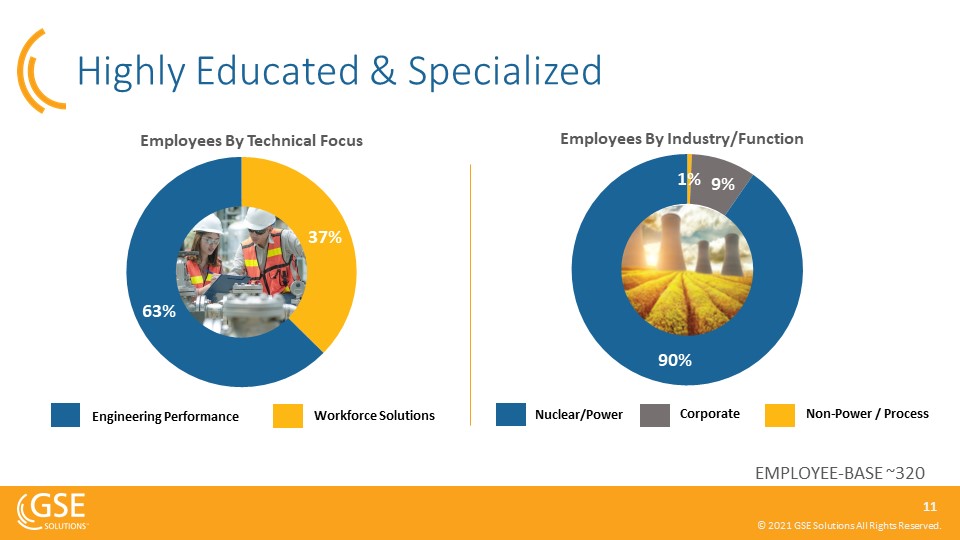
Highly Educated & Specialized Engineering Performance Workforce
Solutions Nuclear/Power Non-Power / Process Corporate Employees By Technical Focus Employees By Industry/Function EMPLOYEE-BASE ~320

Representative Blue-Chip Customers1 1The trademarks above are the property of the referenced companies;
GSE disclaims ownership of such marks. Inclusion of a representative customer herein is not intended to suggest endorsement or recommendation.

Attractive Valuation Relative to
Peers PEERS 2-3x ~1.0x >5x 10-12x 10-12x >15x 1 Enterprise Value (EV); Trailing Twelve Months (TTM); normalized average historical trading multiples for peers 2EBITDA is a non-GAAP financial measure EV/SALES
(TTM)1 EV/EBITDA (TTM)1,2 Workforce Solutions Engineering Improvement Software

Growing SaaS/Other Software MX Revenue Streams EnVision On Demand SaaS simulation & tutorials
Subscription-based softwareScalable platform“Anytime, anywhere” solutionRecurring and predictable revenue streamHigher market multipleOther License increasesSimulation upgradesNew software: Thermal System Monitoring (TSM) +19% Software
Revenue (in $M)

Utilities NEED Experienced Partners & Expert Solutions What’s Driving The
Market Delivering Environmental Equity Widening skills gap and aging workforce Awareness of the value of nuclear power as a source for carbon-free energy Demand for carbon-free electricity Restart of nuclear reactors
post-Fukushima Development of advanced small modular reactors The new administration’s plans to cut carbon emissions NEEDStaff Support NEEDTraining Programs NEEDOptimization
Programs NEEDEngineeringModifications NEEDSimulationSolutions
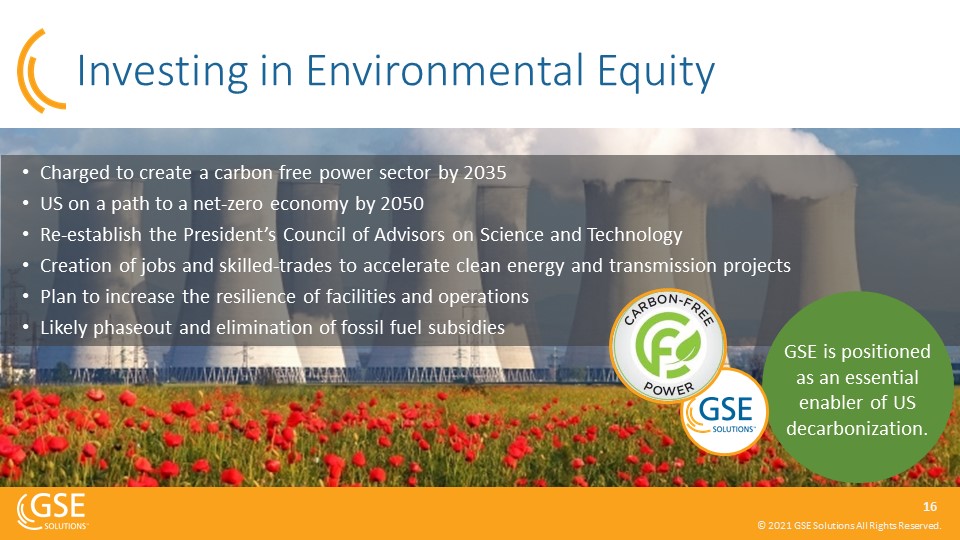
New Executive Actions: Clean Energy Charged to create a carbon free power sector by 2035 US on a path to
a net-zero economy by 2050Re-establish the President’s Council of Advisors on Science and TechnologyCreation of jobs and skilled-trades to accelerate clean energy and transmission projects Plan to increase the resilience of facilities and
operationsLikely phaseout and elimination of fossil fuel subsidies Investing in Environmental Equity GSE is positioned as an essential enabler of US decarbonization.

Nuclear Leads the Way in Reducing CO2 Emissions Million Metric Tons, 2019 2019 US Emissions-Free
Electricity Fuel CO2 Emissions Avoided by the US Power Industry “Nuclear energy is America’s top source of carbon-free electricity and avoids more than 1/2 billion tons of carbon emissions each year.” Source: Nuclear Energy Institute Inc.,
Nuclear By The Numbers (August 2020)
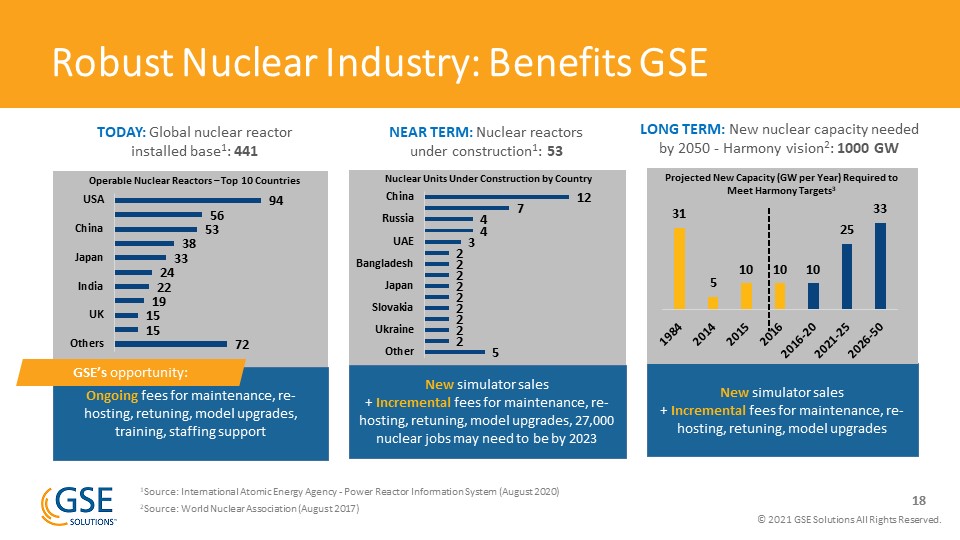
Robust Nuclear Industry: Benefits GSE TODAY: Global nuclear reactor installed base1: 441 Ongoing
fees for maintenance, re-hosting, retuning, model upgrades, training, staffing support NEAR TERM: Nuclear reactors under construction1: 53 LONG TERM: New nuclear capacity needed by 2050 - Harmony vision2: 1000 GW New simulator sales +
Incremental fees for maintenance, re-hosting, retuning, model upgrades, 27,000 nuclear jobs may need to be by 2023 New simulator sales+ Incremental fees for maintenance, re-hosting, retuning, model upgrades Nuclear Units Under Construction
by Country Operable Nuclear Reactors – Top 10 Countries Projected New Capacity (GW per Year) Required to Meet Harmony Targets3 GSE’s opportunity: 1Source: International Atomic Energy Agency - Power Reactor Information System (August
2020)2Source: World Nuclear Association (August 2017)

US Nuclear Fleet Still has 20-40 Years 1Source: Extrapolated from The Conversation, August 2018;
International Atomic Energy Agency Number of US Nuclear Plants per Age Group1 Plants here for long-term: An average nuclear plant spans 60 years - existing fleet requires 20-40 years depending on if licenses get extended to 80 yearsGSE
providesEssential services and technology to the aging US nuclear fleet to improve operations, enhance safety and extend plant lifeAdvanced solutions – helping expand into advance reactors and small modular reactors (SMR)Cross-over services
that fit with natural gas/renewables, wind and solar Years Lifespan The Average US Nuclear Plant is ~40 Years Old1

Small Modular Reactors (SMR) Gain Traction in 2020 * “A promising new non-emitting technology that has
the potential to produce reliable electricity in Canada, supporting the country’s transition to net-zero emissions by 2050.” SEPT US Nuclear Regulatory Commission approved the first SMR design by NuScale OCT US DOE awarded $160M to build
working models of smaller scale advanced nuclear reactor designs NOV UK announces ten-point plan for a green industrial revolution, including supporting the UK SMR program with a £215 million investment DEC DOE announced $30M in initial
funding under its new Advanced Reactor Demonstration Program (ARDP), selecting five teams to receive funding DEC Canada* outlines next steps for progress on SMR technology * December 2020 - Natural Resources Canada press release outlines
next steps for progress on small modular reactor technology.

Announced two MSAs with a total value of $35M at US major utility GSE Rises to the COVID-19
Challenge CHALLENGESClients reduced/postponed staff augmentation engagementsProject stoppage at client facilities due to onsite outbreakDelay in nonessential engineering services projects Leveraged technology to stay connected with
clients ACTIONSPrioritized the health and safety of employees and clientsMigrated a significant portion of employees to work remotePursued a hybrid virtual/in-person selling/delivery approach Won a multiyear subscription for EnVision by a
global energy company Opportunity to lower costs and reduce real estate footprint Secured three contracts with total value of $8.7M for training & staffing POSITIVE OUTCOMES
Focus on Organic Growth & Operational Improvement GSE Strategy:Capitalize on pent-up demand
coming to market after COVID-19-driven delaysStrengthen divisional leadershipUnify engineering services under one umbrellaStreamline operations, contain costs and maximize cash flow Disciplined capital structure management and debt
paydownDeliver on exciting solutions pipeline

APPENDIX

Annual Financial Highlights Revenue (in $M) Gross Profit (in $M) Adjusted EPS (Diluted)2 +17%
CAGR1 +13% CAGR1 Adjusted EBITDA (in $M)2 +$9.1M Improvement +$0.69 Improvement 1 CAGR = Compound Annual Growth Rate2 Adjusted EBITDA and Adjusted EPS are non-GAAP financial measures; see GAAP to non-GAAP reconciliation in
Appendix

GSE Solutions Financial History 1 Excludes DP Engineering for periods prior to February 15, 2019;
excludes True North prior to May 11, 2018 and excludes Absolute Consulting prior to September 20, 2017 2 EBITDA, Adjusted EBITDA, Adjusted net income and adjusted EPS are non-GAAP financial measures; see GAAP to non-GAAP reconciliation on pages
26 and 27 in the Appendix of this presentation. Financial Summary1 Fiscal Year Ended 9 Months Ended (in $ millions, except shares amounts) 2016 2017 2018 2019 Sep. 30, 2019 Sep. 30, 2020 Revenue 53.1 70.9 92.2
83.0 65.7 45.0 Gross Profit 16.3 18.5 23.1 20.3 15.3 11.0 Gross margin 31% 26% 25% 24% 23% 24% Operating (loss) income 1.6 0.2 1.4 (7.4) (5.8) (8.4) Operating
margin 3% 0% 1% (9%) (9%) (19%) Net (loss) income 1.4 6.6 (0.4) (12.1) (5.7) (9.1) Diluted EPS $0.08 $0.33 ($0.02) ($0.60) ($0.29) ($0.44) Diluted
shares 18,512,266 19,605,427 19,704,999 20,062,021 20,021,829 20,438,571 EBITDA 2.8 1.5 3.7 (2.2) (3.4) (6.3) Adjusted EBITDA 5.0 5.7 7.4 4.8 3.6 (1.4) Adjusted net (loss) income 4.0 3.0 (3.6) 8.0
1.3 (2.6) Adjusted EPS - diluted $0.21 $0.15 ($0.18) $0.39 $0.06 ($0.13) Balance Sheet (in $ millions) Sep. 30, 2020 Cash and cash equivalents 7.7 Current
assets 20.5 Total assets 41.6 Current liabilities 18.1 Total debt 13.6 Total stockholders' equity 11.4 1,2
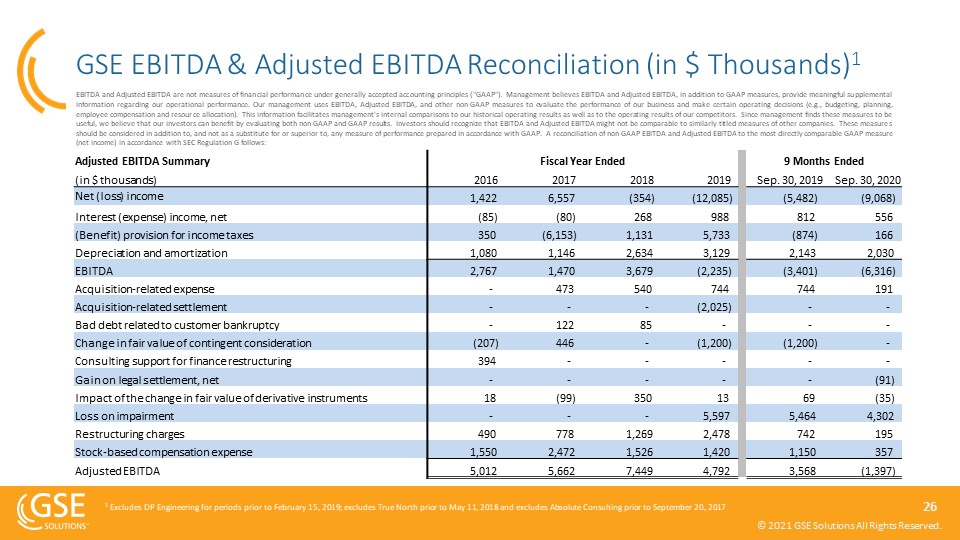
GSE EBITDA & Adjusted EBITDA Reconciliation (in $ Thousands)1 EBITDA and Adjusted EBITDA are not
measures of financial performance under generally accepted accounting principles ("GAAP"). Management believes EBITDA and Adjusted EBITDA, in addition to GAAP measures, provide meaningful supplemental information regarding our operational
performance. Our management uses EBITDA, Adjusted EBITDA, and other non-GAAP measures to evaluate the performance of our business and make certain operating decisions (e.g., budgeting, planning, employee compensation and resource allocation).
This information facilitates management's internal comparisons to our historical operating results as well as to the operating results of our competitors. Since management finds these measures to be useful, we believe that our investors can
benefit by evaluating both non-GAAP and GAAP results. Investors should recognize that EBITDA and Adjusted EBITDA might not be comparable to similarly-titled measures of other companies. These measures should be considered in addition to, and
not as a substitute for or superior to, any measure of performance prepared in accordance with GAAP. A reconciliation of non-GAAP EBITDA and Adjusted EBITDA to the most directly comparable GAAP measure (net income) in accordance with SEC
Regulation G follows: Adjusted EBITDA Summary Fiscal Year Ended 9 Months Ended (in $ thousands) 2016 2017 2018 2019 Sep. 30, 2019 Sep. 30, 2020 Net (loss) income 1,422 6,557 (354) (12,085) (5,482)
(9,068) Interest (expense) income, net (85) (80) 268 988 812 556 (Benefit) provision for income taxes 350 (6,153) 1,131 5,733 (874) 166 Depreciation and amortization 1,080 1,146 2,634 3,129
2,143 2,030 EBITDA 2,767 1,470 3,679 (2,235) (3,401) (6,316) Acquisition-related expense - 473 540 744 744 191 Acquisition-related settlement - - - (2,025) - - Bad debt
related to customer bankruptcy - 122 85 - - - Change in fair value of contingent consideration (207) 446 - (1,200) (1,200) - Consulting support for finance restructuring 394 - - - - -
Gain on legal settlement, net - - - - - (91) Impact of the change in fair value of derivative instruments 18 (99) 350 13 69 (35) Loss on impairment - - - 5,597 5,464 4,302
Restructuring charges 490 778 1,269 2,478 742 195 Stock-based compensation expense 1,550 2,472 1,526 1,420 1,150 357 Adjusted EBITDA 5,012 5,662 7,449 4,792 3,568 (1,397) 1
Excludes DP Engineering for periods prior to February 15, 2019; excludes True North prior to May 11, 2018 and excludes Absolute Consulting prior to September 20, 2017
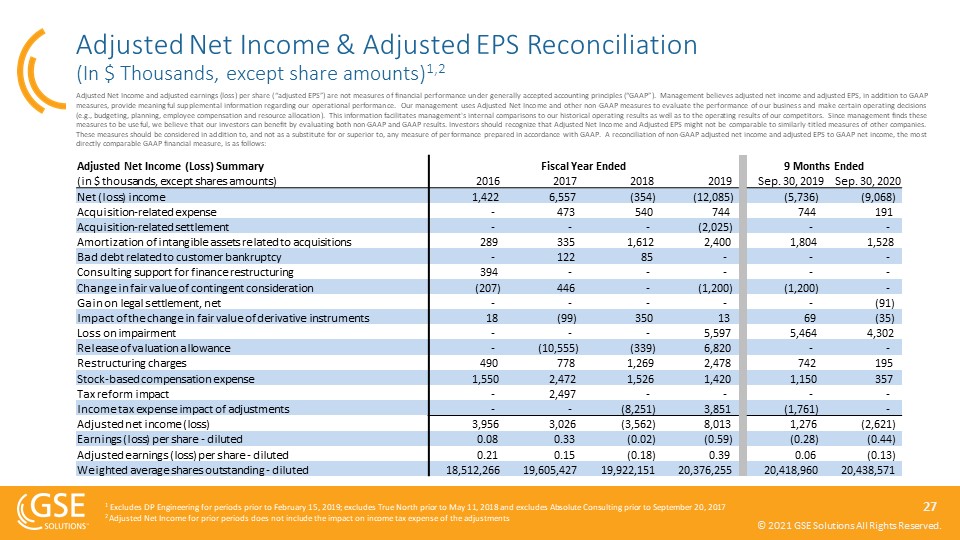
Adjusted Net Income & Adjusted EPS Reconciliation (In $ Thousands, except share amounts)1,2 Adjusted
Net Income and adjusted earnings (loss) per share (“adjusted EPS”) are not measures of financial performance under generally accepted accounting principles (“GAAP”). Management believes adjusted net income and adjusted EPS, in addition to GAAP
measures, provide meaningful supplemental information regarding our operational performance. Our management uses Adjusted Net Income and other non-GAAP measures to evaluate the performance of our business and make certain operating decisions
(e.g., budgeting, planning, employee compensation and resource allocation). This information facilitates management's internal comparisons to our historical operating results as well as to the operating results of our competitors. Since
management finds these measures to be useful, we believe that our investors can benefit by evaluating both non-GAAP and GAAP results. Investors should recognize that Adjusted Net Income and Adjusted EPS might not be comparable to
similarly-titled measures of other companies. These measures should be considered in addition to, and not as a substitute for or superior to, any measure of performance prepared in accordance with GAAP. A reconciliation of non-GAAP adjusted net
income and adjusted EPS to GAAP net income, the most directly comparable GAAP financial measure, is as follows: Adjusted Net Income (Loss) Summary Fiscal Year Ended 9 Months Ended (in $ thousands, except shares
amounts) 2016 2017 2018 2019 Sep. 30, 2019 Sep. 30, 2020 Net (loss) income 1,422 6,557 (354) (12,085) (5,736) (9,068) Acquisition-related expense - 473 540 744 744 191 Acquisition-related
settlement - - - (2,025) - - Amortization of intangible assets related to acquisitions 289 335 1,612 2,400 1,804 1,528 Bad debt related to customer bankruptcy - 122 85 - - -
Consulting support for finance restructuring 394 - - - - - Change in fair value of contingent consideration (207) 446 - (1,200) (1,200) - Gain on legal settlement, net - - - - -
(91) Impact of the change in fair value of derivative instruments 18 (99) 350 13 69 (35) Loss on impairment - - - 5,597 5,464 4,302 Release of valuation allowance - (10,555) (339) 6,820
- - Restructuring charges 490 778 1,269 2,478 742 195 Stock-based compensation expense 1,550 2,472 1,526 1,420 1,150 357 Tax reform impact - 2,497 - - - - Income tax expense
impact of adjustments - - (8,251) 3,851 (1,761) - Adjusted net income (loss) 3,956 3,026 (3,562) 8,013 1,276 (2,621) Earnings (loss) per share - diluted 0.08 0.33 (0.02) (0.59) (0.28)
(0.44) Adjusted earnings (loss) per share - diluted 0.21 0.15 (0.18) 0.39 0.06 (0.13) Weighted average shares outstanding - diluted 18,512,266 19,605,427 19,922,151 20,376,255 20,418,960 20,438,571 1
Excludes DP Engineering for periods prior to February 15, 2019; excludes True North prior to May 11, 2018 and excludes Absolute Consulting prior to September 20, 20172 Adjusted Net Income for prior periods does not include the impact on income
tax expense of the adjustments

GSE SolutionsKyle LoudermilkPresident and CEOkyle.loudermilk@gses.com+1
410.970.7800www.gses.com CONTACTS The Equity GroupKalle Ahl, CFA kahl@equityny.com +1 212.836.9614Devin Sullivandsullivan@equityny.com +1 212.836.9608