Attached files
UNITED STATES
SECURITIES AND EXCHANGE COMMISSION
Washington, D.C. 20549
FORM 10-K
|
(Mark One)
|
|||
|
☒
|
ANNUAL REPORT PURSUANT TO SECTION 13 OR 15(d)
OF THE SECURITIES EXCHANGE ACT OF 1934
For the fiscal year ended December 31, 2014
|
||
|
☐
|
TRANSITION REPORT PURSUANT TO SECTION 13 OR 15(d)
OF THE SECURITIES EXCHANGE ACT OF 1934
For the transition period from ____ to ____
|
|
Commission File Number 001-14785
|
|
GSE Systems, Inc.
|
|
(Exact name of registrant as specified in its charter)
|
|
Delaware
|
52-1868008
|
|
|
(State of incorporation)
|
(I.R.S. Employer Identification Number)
|
|
|
1332 Londontown Blvd., Suite 200, Sykesville MD
|
21784
|
|
|
(Address of principal executive offices)
|
(Zip Code)
|
|
Registrant's telephone number, including area code: (410) 970-7800
|
|
SECURITIES REGISTERED PURSUANT TO SECTION 12(b) OF THE ACT:
|
|
Title of each class
|
Name of each exchange on which registered
|
|
|
Common Stock, $.01 par value
|
NYSE MKT
|
SECURITIES REGISTERED PURSUANT TO SECTION 12(g) OF THE ACT: NONE
Indicate by check mark if the registrant is a well-known seasoned issuer, as defined in Rule 405 of the Securities Act. Yes o No ☒
Indicate by check mark if the registrant is not required to file reports pursuant to Section 13 or 15(d) of the Act. Yes o No ☒
Indicate by check mark whether the registrant (1) has filed all reports required to be filed by Section 13 or 15(d) of the Securities Exchange Act of 1934 during the preceding 12 months (or for such shorter period that the registrant was required to file such reports), and (2) has been subject to such filing requirements for the past 90 days. Yes ☒No ☐
Indicate by check mark whether the registrant has submitted electronically and posted on its corporate Web site, if any, every Interactive Data File required to be submitted and posted pursuant to Rule 405 of Regulation S-T (§ 232.405 of this chapter) during the preceding 12 months (or for such shorter period that the registrant was required to submit and post such files). Yes ☒No ☐
Indicate by check mark if disclosure of delinquent filers pursuant to Item 405 of Regulation S-K is not contained herein, and will not be contained, to the best of registrant's knowledge, in definitive proxy or information statements incorporated by reference in Part III of this Form 10-K or any amendment to this Form 10-K. [ ]
Indicate by check mark whether the registrant is a large accelerated filer, an accelerated filer, a non-accelerated filer or a smaller reporting company. See the definitions of "large accelerated filer", "accelerated filer" and "smaller reporting company" in Rule 12b-2 of the Exchange Act. (Check one):
|
Large accelerated filer ☐
|
Accelerated filer ☐
|
Non-accelerated filer ☐
|
Smaller reporting company ☒
|
|
(Do not check if a smaller reporting company)
|
Indicate by check mark whether the registrant is a shell company (as defined in rule 12(b)-2 of the Exchange Act). Yes o No ☒
The aggregate market value of Common Stock held by non-affiliates of the Registrant was $28,901,284 on June 30, 2014, the last business day of the Registrant's most recently completed second fiscal quarter, based on the closing price of such stock on that date of $1.66.
The number of shares outstanding of the registrant's Common Stock as of March 18, 2015 was 17,887,859 shares.
DOCUMENTS INCORPORATED BY REFERENCE
Portions of the registrant's Proxy Statement for the 2015 Annual Meeting of Stockholders to be filed pursuant to Regulation 14A under the Securities Exchange Act of 1934, as amended, are incorporated by reference into Part III.
1
TABLE OF CONTENTS
|
PART I
|
Page
|
|
|
Item 1.
|
4
|
|
|
Item 1A.
|
13
|
|
|
Item 1B.
|
20
|
|
|
Item 2.
|
20
|
|
|
Item 3.
|
20
|
|
|
Item 4.
|
20
|
|
|
PART II
|
||
|
Item 5.
|
21
|
|
|
Item 6.
|
24
|
|
|
Item 7.
|
25
|
|
|
Item 7A.
|
43
|
|
|
Item 8.
|
44
|
|
|
Item 9.
|
45
|
|
|
Item 9A.
|
45
|
|
|
Item 9B.
|
45
|
|
|
PART III
|
||
|
Item 10.
|
46
|
|
|
Item 11.
|
46
|
|
|
Item 12.
|
46
|
|
|
Item 13.
|
46
|
|
|
Item 14.
|
47
|
|
|
PART IV
|
||
|
Item 15.
|
47
|
|
|
48
|
||
|
49
|
| * | to be incorporated by reference from the Proxy Statement for the registrant's 2015 Annual Meeting of Shareholders. |
2
CAUTIONARY STATEMENT REGARDING FORWARD-LOOKING STATEMENTS.
This report and the documents incorporated by reference herein contain "forward-looking" statements within the meaning of Section 27A of the Securities Act of 1933 and Section 21E of the Securities Exchange Act of 1934, as amended (the "Exchange Act") that are based on management's assumptions, expectations and projections about us, and the industry within which we operate, that have been made pursuant to the Private Securities Litigation Reform Act of 1995 which reflect our expectations regarding our future growth, results of operations, performance and business prospects and opportunities. Wherever possible, words such as "anticipate", "believe", "continue", "estimate", "intend", "may", "plan", "potential", "predict", "expect", "should", "will" and similar expressions, or the negative of these terms or other comparable terminology, have been used to identify these forward-looking statements. These forward-looking statements may also use different phrases. These statements regarding our expectations reflect our current beliefs and are based on information currently available to us. Accordingly, these statements by their nature are subject to risks and uncertainties, including those listed under Item 1A Risk Factors, which could cause our actual growth, results, performance and business prospects and opportunities to differ from those expressed in, or implied by, these statements. We may not actually achieve the plans, intentions or expectations disclosed in our forward-looking statements and you should not place undue reliance on our forward-looking statements. Actual results or events could differ materially from the plans, intentions and expectations disclosed in the forward-looking statements we make. Except as otherwise required by federal securities law, we are not obligated to update or revise these forward looking statements to reflect new events or circumstances. We caution you that a variety of factors, including but not limited to the factors described below under Item 1A Risk Factors and the following, could cause our business conditions and results to differ materially from what is contained in forward-looking statements:
| - | changes in the rate of economic growth in the United States and other major |
international economies;
| - | changes in investment by the nuclear and fossil electric utility industry, the chemical and petrochemical industries and the U.S. military; |
| - | changes in the financial condition of our customers; |
| - | changes in regulatory environment; |
| - | changes in project design or schedules; |
| - | contract cancellations; |
| - | changes in our estimates of costs to complete projects; |
| - | changes in trade, monetary and fiscal policies worldwide; |
| - | currency fluctuations; |
| - | war and/or terrorist attacks on facilities either owned or where equipment or services are or may be provided; |
| - | outcomes of future litigation; |
| - | protection and validity of our trademarks and other intellectual property rights; |
| - | increasing competition by foreign and domestic companies; |
| - | compliance with our debt covenants; |
| - | recoverability of claims against our customers and others; and |
| - | changes in estimates used in our critical accounting policies. |
Other factors and assumptions not identified above were also involved in the formation of these forward-looking statements and the failure of such other assumptions to be realized, as well as other factors, may also cause actual results to differ materially from those projected. Most of these factors are difficult to predict accurately and are generally beyond our control. You should consider the areas of risk described above in connection with any forward-looking statements that may be made by us. You should not place undue reliance on any forward-looking statements. New factors emerge from time to time, and it is not possible for us to predict which factors will arise.
We undertake no obligation to publicly update any forward-looking statements, whether as a result of new information, future events or otherwise. You are advised, however, to consult any additional disclosures we make in proxy statements, quarterly reports on Form 10-Q and current reports on Form 8-K filed with the SEC.
Company Information Available on the Internet
Our Internet address is www.gses.com. We make available free of charge through our Internet site our annual reports on Form 10-K; quarterly reports on Form 10-Q; current reports on Form 8-K; and any amendment to those reports filed or furnished pursuant to the Exchange Act as soon as reasonably practicable after such material is electronically filed with, or furnished to, the SEC.
3
PART I
GSE Systems, Inc. ("GSE Systems", "GSE", the "Company", "we", "us" or "our"), a NYSE MKT company trading under symbol GVP, is a team of dedicated people that help customers meet their performance improvement goals and reduce their risk. We do this by combining expertise in simulation, visualization, engineering, equipment operations, and training to improve both plant and human performance.
We execute projects globally with over 330 employees operating from offices in the U.S., China, India, Sweden and the United Kingdom. While the majority of revenue comes from the nuclear and fossil power generation markets, we also serve the oil and gas, refining, chemicals, petrochemicals, industrial gas, manufacturing, transportation and plant utilities markets.
GSE Systems was formed on March 30, 1994 to consolidate the simulation and related businesses of S3 Technologies, General Physics International Engineering & Simulation and EuroSim, each separately owned and operated by ManTech International Corporation, GP Strategies Corporation and Vattenfall AB, respectively.
On April 26, 2010, we completed the acquisition of TAS Holdings Ltd ("TAS") and subsequently merged TAS into our UK subsidiary, GSE Systems Ltd. Our UK operations, located in Stockton-On-Tees, England provides engineering consulting, specifically in electrical system design, instrumentation and controls engineering and automation engineering. The majority of our UK customers are in the petroleum refining, oil and gas, chemical and petrochemical industries.
On January 4, 2011, we acquired EnVision Systems, Inc. ("EnVision"). The EnVision product line consists of interactive computer-based tutorials and related simulation models primarily for the petrochemical and oil & gas refining industries. The EnVision products provide a foundation in process fundamentals and plant operations and interaction. We have more than 750 installations of EnVision product in over 28 countries, and our approximately 130 clients include Shell Oil Company, BP Products North America ("BP"), Total and Chevron.
On November 14, 2014, we acquired Hyperspring, LLC, an Alabama limited liability company. Hyperspring is a staff augmentation company that hires personnel to fulfill staff positions on a short-term basis for energy industry customers, primarily nuclear power customers. Hyperspring personnel provide training, operations and maintenance support including: generic fundamentals exams (GFES), accreditation training visit (ATV) preparation, senior reactor operator (SRO) certification, procedure development, work management, tagging/labeling, outage execution, planning/scheduling, corrective action, self-assessments and equipment reliability. Customers include TVA, Entergy, PSEG Nuclear LLC and NRG Energy Inc.
In conjunction with the Hyperspring acquisition, the Company acquired a 50% ownership stake in IntelliQlik, LLC, a Delaware limited liability company. IntelliQlik is developing a software platform for online learning and learning management for the energy market. A former Member of Hyperspring also has a 50% ownership stake in IntelliQlik.
On December 31, 2014 the Company merged EnVision with GSE Power Systems, Inc. and changed the name of GSE Power Systems, Inc. to GSE Performance Solutions, Inc. The change reflects our growing focus on providing solutions to improve Human and Plant Performance Lifecycles.
For years we have described ourselves as a simulation company, providing mainly simulation solutions to improve designs, de-risk projects and train operators. Our acquisition of Hyperspring, LLC and investment in IntelliQlik, LLC in November 2014 are helping to accelerate our transformation into a Performance Improvement Company. We improve plant performance with a combination of simulation, engineering and plant services that help clients improve their plant's profitability, productivity and safety, and assist in decommissioning the plants at the end of their life cycle. We improve human performance by providing technologies and services that systematically help clients in recruiting and selecting the right person for the job and training that individual throughout their career from entry-level to expert.
As of December 31, 2014, GSE Systems was the parent company of:
| ¨ | GSE Performance Solutions, Inc. (formerly GSE Power Systems, Inc.), a Delaware corporation |
| ¨ | GSE Power Systems, AB, a Swedish corporation; |
| ¨ | GSE Engineering Systems (Beijing) Co. Ltd., a Chinese limited liability company; |
| ¨ | GSE Systems, Ltd., a Scottish limited liability company; |
| ¨ | EnVision Systems (India) Pvt. Ltd., an Indian limited liability company; and |
| ¨ | Hyperspring, LLC, an Alabama limited liability company. |
The Company has a 50% interest in IntelliQlik, LLC, a Delaware limited liability company and a 50% interest in General Simulation Engineering RUS LLC, a Russian closed joint-stock company.
4
Operating Segments
With the acquisition of Hyperspring, we now operate through two reportable business segments. We are organized by operating groups primarily based upon the services performed by each group. Each operating group consists of business units which are focused on providing specific products and services to certain classes of customers or within targeted markets. Marketing and communications, accounting, finance, legal, human resources, information systems and other administrative services are organized at the corporate level. Business development and sales resources are aligned with operating groups to support existing customer accounts and new customer development. Our two business segments are:
|
·
|
Performance Improvement Solutions
|
As evidenced through the change in the company name of our U.S. operating company to GSE Performance Solutions, Inc., our Performance Improvement Solutions business segment encompasses all of the solution-oriented technologies and services traditionally associated with GSE which focus on both our client's people and their plants and operations. This segment includes various simulation, training and engineering products and services delivered across the breadth of industries we serve. Our simulation solutions include platforms ranging from (1) the non-specific plant systems of our EnVision product line used to teach fundamental processes to newly hired employees, to (2) custom plant-specific simulators used to train plant operators, to (3) engineering-grade simulation solutions used to help clients verify and validate control systems prior to new plant construction or modification of existing plants, to (4) engineering-grade simulation solutions used for human factors engineering. Training applications include turnkey and custom training services and 3D visualization training products to make training more effective. Our engineering services include plant design, automation and control systems design, functional safety and compliance analysis, and engineering consultations.
|
·
|
Staff Augmentation
|
Staff Augmentation services provide specialized workforce solutions primarily to the nuclear industry. These employees work at our clients' facilities under client direction. Examples of staff augmentation positions include instructors, procedure writers, work management specialists, planners, outage execution specialists, corrective action and self-assessment specialists, and training material developers. This business is managed through our Hyperspring LLC subsidiary. The business model, management focus, margins and other factors clearly separate this business line from the rest of the GSE product and service portfolio. Hyperspring has been providing these services since 2005.
Financial information about our business segments and geographic operations and revenue are provided in Note 16 of the accompanying Consolidated Financial Statements.
Products, Services, Strategy
We believe the most serious future challenge facing the industries we serve is not their access to technology, their access to markets, nor their access to operating capital. Instead the challenge will be their access to a trained and efficient workforce. This challenge manifests itself due to both the knowledge that will be lost as a large percentage of the experienced workforce reaches retirement age in the next ten years and the replacement of these experienced workers by a new generation who have different learning styles and work expectations.
This belief is supported by the following trends as reported in the U.S. Department of Energy's National Energy Technology Laboratory 2013 report entitled Emerging Workforce Trends in the U.S. Energy and Mining Industries: A Call to Action.
|
·
|
About 1/3 of the U.S. energy industry workforce is comprised of "baby boomers" (those born between 1946 and 1964), and they are poised to retire in great numbers by the end of this decade,
|
|
·
|
There are too few younger workers in the pipeline to replace them, and many of the younger workers lack the necessary science, technology, engineering and math skills needed for many energy jobs,
|
|
·
|
There is a critical need to capture the knowledge of experienced employees before they leave.
|
Exacerbating this workforce trend is the continuing domestic and global population increases which will continue to increase the overall demand for energy. As the U.S.' current educational system is not able to provide the needed trained workers in adequate numbers, the onus is on the energy industry itself to address its training needs at both entry levels and more senior levels. A complete lifecycle of training, from a worker's entry into the energy industry through to the achievement of expert knowledge and skills, is now required for the energy industry more than ever.
Business leaders are recognizing the problem and the challenge ahead. A study published in Harvard Business Review (May 28, 2013) revealed that Boards of Directors identified Talent Management as their number one concern. Those same executives rated their companies very poorly on key elements of talent management including attracting, hiring, assessing and developing top talent.
As companies are always under pressure to improve productivity, reduce costs and improve operating margins, energy industry companies have been working to create leaner, more competent organizations that can rapidly respond to a changing environment. Increasing pressures to improve profitability have resulted in flatter organizational structures within companies with less middle management to exercise control. According to the International Atomic Energy Agency (IAEA) article, A Systematic Approach to Human Performance Improvement in Nuclear Power Plants: Training Solutions, companies understand and value the potential contribution that every employee can make to their overall success. As a result, companies have been emphasizing the quality of their human performance processes and the building of excellent educational processes for their employees.
5
Entry2Expert Performance Cycle
To assist our clients in creating world-class internal training and performance improvement programs, we are building the E2E (Entry2Expert) Performance Solution, a set of integrated and scalable products and services which provide a structured program from employee selection and onboarding through continuous skills improvement for experienced employees. GSE can now provide the right training solution for the right step in each employee's career.
The major elements of the E2E Performance Solution include:
|
·
|
Employee Screening and Selection: Leveraging the use of simulation and providing experts in employee assessments, we help clients ensure their candidates for employment possess both technical aptitude as well as personality traits suited for the specific job functions.
|
|
·
|
Training Needs Assessments: We help clients define their specific training needs by analyzing the job functions and processes specific to their plant. This is the first step in creating a structured training program that will provide consistent and predictable results.
|
|
·
|
Training Program Development: Following the ADDIE (Analyze, Design, Develop, Implement, and Evaluate) model for training program management, we can structure the entire training program for the client, including training media and modes, such as self-paced e-Learning, instructor-led classroom, in-depth simulation, and serious gaming.
|
|
·
|
Self-Paced Training Tutorials: We have a full complement of e-Learning material. The products include basic equipment and component fundamentals that are applicable across a variety of industries, as well as comprehensive training for the oil and gas and refining markets. Using a blended learning approach, students learn the overall purpose of plant systems, the major equipment, how the equipment is operated and controlled. This methodology ensures the students know the basics before entering a plant-specific training program. We have delivered over 500 such tutorial programs in multiple languages worldwide.
|
|
·
|
Instructor-Led Training: We provide classroom and simulator instructors as adjunct staff or to teach turnkey training programs using training materials that either we or the client have developed. Turnkey courses include ANSI Fundamentals (math and sciences), Generic Fundamentals (nuclear plant components, systems, and reactor theory), Senior Reactor Operator (SRO) Certification, and Engineering Systems Program courses.
|
6
|
·
|
Universal Training Simulators: These products complement the Self-Paced Training Tutorials by reinforcing what the student learned in the tutorial by putting it into practice on the Universal Simulator. The simulation models are high fidelity and engineering correct, but represent a typical plant or typical process, versus the exact replication of a client's plant. We have delivered over 250 such simulation models to clients consisting of major oil companies and educational institutions.
|
|
·
|
Part-Task Training Simulators: Like the Universal Simulators, we provide other unique training solutions such as a generic nuclear plant simulator, VPanel displays which replicate control room hardware and simulator solutions specific to industry need, such as Severe Accident models to train on and aid in the understanding of events such as the Fukushima Daiichi accident.
|
|
·
|
3D Visualization: Being able to visualize complex processes, or detailed maintenance tasks significantly improves understanding and retention while reducing the learning process. We provide 3D visualization solutions to help customers "see" and understand the internal workings complex systems such as nuclear reactors, or how to maintain complicated pieces of equipment. Blending the learning strategy of incorporating 3D visualization with high-fidelity, real-time simulation models enables us to provide the energy industry with better, faster, and less costly training in an immersive environment that is ideally suited for the next generation workforce.
|
|
·
|
Plant-Specific Operator Training Simulators: These simulators provide an exact replication of the plant control room and plant operations. They provide the highest level of realism and training and allow users to practice their own plant-specific procedures. Clients can safely practice startup, shutdown, normal operations, as well as response to abnormal events we all hope they never have to experience in real life. We have delivered nearly 450 plant-specific simulators to clients in the nuclear power, fossil power and process industries worldwide.
|
The goal of our E2E performance lifecycle offering is to ensure superior human achievement in the dimensions of:
|
·
|
Recruiting, screening, and selecting the right workforce
|
|
·
|
Shortening the learning process
|
|
·
|
Reduce human errors
|
|
·
|
Mitigate effects of retirement and turnover
|
|
·
|
Improve workforce agility
|
|
·
|
Achieve and maintain certifications and compliance
|
|
·
|
All of which improve our customers' bottom lines
|
The dramatic increase in energy demand world-wide over the next 30 years will require significant amounts of training for new employees and also require new plants using energy of all sources. Obviously, these new plants will need to be engineered and designed prior to construction, and due to their high-fidelity our modeling tools are being increasingly used to verify and validate control system and overall plant designs.
7
Design2Decom Performance Cycle
Just like the Entry2Expert (E2E) process helps improve the performance of our customers' people, Design2Decom (D2D) encompasses a range of services and technologies aimed at improving plant performance. From getting a client's system on-line faster, to operating safety, and support from experienced staff throughout the lifecycle, services include:
|
·
|
Engineering Consultancy, Project Execution and Project Management: Whether in the feasibility, concept or detail design stages of a plant or for plant modifications, we help clients design and implement engineering projects across several disciplines:
|
|
o
|
Instrumentation Engineering
|
|
o
|
Control Systems Engineering
|
|
o
|
Automation Design Engineering
|
|
o
|
Electrical Design Engineering
|
|
·
|
Virtual commissioning of plants. Our high-fidelity, simulation-based engineering solutions test design assumptions and provide feedback throughout the design process for:
|
|
o
|
Integrated systems design validation
|
|
o
|
Control strategy design validation
|
|
o
|
Human factors engineering support
|
|
o
|
Operating procedure validation
|
|
o
|
Control system validation
|
|
·
|
Safety and Compliance: Our engineering expert de-risk operations through engineering assessments and remediation services to ensure safety and legislative compliance in the following areas:
|
|
o
|
Functional Safety
|
|
o
|
Electrical Safety
|
|
o
|
Hazardous Areas Safety
|
|
o
|
Arc Flash Safety
|
|
o
|
Alarm Management
|
8
|
·
|
Specialized Plant Support: As our customers' experienced staffs retire, access to experts that can help with specialized plant projects is critical. Through the acquisition of Hyperspring, we also provide expert support either through staff augmentation or turnkey projects for the following:
|
|
o
|
Procedure Development
|
|
o
|
Training Material Upgrade and Development
|
|
o
|
Work Management
|
|
o
|
Outage Execution
|
|
o
|
Planning and Scheduling
|
|
o
|
Corrective Actions
|
|
o
|
Self-Assessments
|
|
o
|
Equipment Reliability
|
|
·
|
Decommissioning: As plants reach the end of their useful life, decommissioning and deconstruction is a critical service, particularly in the nuclear industry where contaminated material must be handled in safe and precise manners. Our engineering, simulation and visualization capabilities enable clients to plan for, train for, and execute decommissioning while minimizing exposure to hazardous materials and saving money.
|
The goal of Design2Decom (D2D) is to help clients optimize plant performance and compliance in terms of the following:
|
·
|
Finding design errors during engineering rather than construction allowing plant startup to occur sooner saving countless man-hours and dollars while simultaneously allowing revenue generation sooner.
|
|
·
|
Ensuring plants are safely operated within the regulatory requirements.
|
|
·
|
Providing expert support for specialized projects and to augment an aging workforce.
|
|
·
|
Limiting cost and hazards exposure through intelligent decommissioning solutions.
|
Our two overarching solution sets, Entry2Expert (E2E) and Design2Decom (D2D) bring together the collection of skills GSE has amassed over more than 40 years from its traditional roots in custom simulation to the acquisition of the specialized engineering capabilities of TAS Holding, entry and intermediate level training solutions via our EnVision acquisition, and now extensive training and plant support capabilities by acquiring Hyperspring.
9
Customers and Locations
For more than 40 years, we have been developing next-generation, custom training simulation technologies. Since we built the first commercial full-scope nuclear power plant simulator in 1971, we have completed more than 1,100 installations in 50 countries and have built more full-scope power plant simulators than all of our competitors combined.
In 2014, approximately 52% of our revenue was generated from end-users outside the United States. A small representative list of our customers include: ABB Inc., Comisión Federal de Electricidad (Mexico), EDF Energy (United Kingdom), Emerson Process Management, Kärnkraftsäkerhet och Utbildning AB (Sweden), Kraftwerks–Simulator-Gesellschaft GmbH (Germany), PSEG Nuclear, Inc., Shangdong Nuclear Power Co. Ltd. (China), Siemens AG, Slovenské elektrárne, a.s. (Slovakia), State Nuclear Power Automation System Engineering Company (China), and Westinghouse Electric Co.
Hydrocarbon and chemical process customers include numerous large oil refineries and chemical plants such as BP (worldwide), Statoil ASA (Norway), Chevron (USA), Emerson Process Management, Saudi Basic Industries Corporation (Saudi Arabia), Shell Oil Company (worldwide), Savannah River Nuclear Solutions, LLC (USA), Total (Belgium), and Bechtel Hanford National Laboratory (USA).
The following Power Simulation customer has provided more than 10% of the Company's consolidated revenue for the indicated periods:
|
Years ended December 31,
|
|||
|
2014
|
2013
|
||
|
Slovenské elektrárne, a.s.
|
2.3%
|
24.4%
|
|
Marketing and Sales
We market our products and services through a network of direct sales staff, agents and representatives, and strategic alliance partners. Market-oriented business and customer account teams define and implement specific campaigns to pursue opportunities.
We also launched a proactive public relations program, issuing more non-financial press releases aimed at product development and delivery, as well as our role in numerous industry trade shows and technical conferences. We are active across numerous social media platforms to build a stronger presence across all media our clients use to find information about the company.
The Company's ability to support its multi-facility, international and/or multinational clients is facilitated by its network of offices and strategic partners in the U.S. and overseas. In addition to the offices located overseas, the Company's ability to conduct international business is enhanced by its multilingual and multicultural workforce. GSE has strategic relationships with system integrators and agents representing its interests in the Czech Republic, Bulgaria, Japan, Mexico, South Korea, Taiwan, Ukraine and various locations in the Gulf Coast Countries of the Middle East.
Competition
The Power Simulation business encounters intense competition. In the nuclear simulation market, GSE competes directly with firms primarily from Canada, France and Russia, such as L-3 MAPPS Inc., a subsidiary of L-3 Communications (Canada), CORYS T.E.S.S (France) and Western Services Corporation (significant presence in Russia). In the fossil simulation market, the Company competes with smaller companies in the U.S. and overseas. In the process industries the main competition comes from large DCS/Automation companies such as Honeywell and Schneider. Competition for generalized engineering services, particularly those served from our office in the U.K., tend to be very locally oriented.
Hyperspring services include training related products and services as well as staff augmentation solutions. The competition for training related services includes: GP Strategies, The Westwind Group, Professional Training Technologies, and Western Technical Services. The competition for staff augmentation includes: Absolute Consulting, CB&I, Planet Forward, and The Westwind Group.
10
Competitive Advantages
While there is competition in various industry niches, there are few companies in our space that can combine the engineering, simulation and training expertise we now have through the execution of our acquisition strategy. None of our traditional competitors serve the broader performance improvement market.
|
·
|
Unique Combination of Talent. Nobody in our market space brings together the sophistication of simulation technology with the engineering expertise, training expertise and visualization expertise to provide the holistic people and plant performance improvement solutions.
|
|
·
|
Reputation for Customer Satisfaction. As part of its ISO-9000 Quality Program Certification, GSE measures customer satisfaction across numerous factors such as On-Time Delivery, Problem Solving, and Customer Communication. In each category measured we routinely exceed customer expectations.
|
|
·
|
Industry Expertise. GSE is a leading innovator and developer of real-time software with more than 40 years of experience producing high-fidelity, real-time simulators. As a result, the Company has acquired substantial applications expertise in the energy and industrial process industries. The Company employs a highly educated and experienced multinational workforce of over 300 employees, including approximately 180 engineers and scientists. Of the almost 180 engineers, approximately 49% of these engineers and scientists have advanced science and technical degrees in fields such as chemical, mechanical and electrical engineering, applied mathematics and computer sciences, while an additional 33% have master degrees, and another 12% have doctorate degrees in the aforementioned fields.
|
|
·
|
Proprietary Software Tools. GSE has developed a library of proprietary software tools including auto-code generators and system models that substantially facilitate and expedite the design, production and integration, testing and modification of software and systems. These tools are used to automatically generate the computer code and systems models required for specific functions commonly used in simulation applications, thereby enabling it or its customers to develop high-fidelity, real-time software quickly, accurately and at lower costs. The Company has a substantial library of Process-Specific Simulation models and eLearning Modules aimed at the oil and gas, refining and specialty chemicals market.
|
|
·
|
Training Curricula. The Company has developed hundreds of detailed courses and simulator exercise material or specific industrial applications including oil and gas refining, gas-oil production, nuclear and combined cycle gas turbine power plant and desalination.
|
|
·
|
In the area of training and training related products, Hyperspring can now include: state of the art 3D graphics and simulation to enhance our offerings and differentiate us from our competitors. The area of staff augmentation is mostly focused on training and operations support. The senior management of Hyperspring has strong active ties to the industries we serve which allows us to interface with our customers directly in the course of doing business versus having to periodically call on customers. Our proximity allows us a significant competitive advantage in that we can immediately offer solutions and therefore bypass lengthy bid processes.
|
11
Intellectual Property.
The Company depends upon its intellectual property rights in its proprietary technology and information. GSE maintains a portfolio of trademarks (both registered and unregistered), copyrights (both registered and unregistered), and licenses. While such trademarks, copyrights and licenses as a group are of material importance to the Company, it does not consider any one trademark, copyright, or license to be of such importance that the loss or expiration thereof would materially affect the Company. The Company relies upon a combination of trade secrets, copyright, and trademark law, contractual arrangements and technical means to protect its intellectual property rights. GSE distributes its software products under software license agreements that grant customers nonexclusive licenses for the use of its products, which are nontransferable. Use of the licensed software is restricted to designated computers at specified sites, unless the customer obtains a site license of its use of the software. Software and hardware security measures are also employed to prevent unauthorized use of the Company's software, and the licensed software is subject to terms and conditions prohibiting unauthorized reproduction of the software.
The Company does not own any patents. The Company believes that all of the Company's trademarks (especially those that use the phrase "GSE Systems") are valid and will have an unlimited duration as long as they are adequately protected and sufficiently used. The Company's licenses are perpetual in nature and will have an unlimited duration as long as they are adequately protected and the parties adhere to the material terms and conditions.
GSE has six registered U.S. trademarks: GSE Systems®, JTOPMERET®, RELAP5-HD®, D/3®, SABL® and SimExec®. Some of these trademarks have also been registered in foreign countries. The Company also claims trademark rights to BRUS™, ESmart™, GAARDS™, GCONTROL+™, GFLOW+™, GLOGIC+™, GPower+™, Enterprise Data Management, Java Application and Development Environment (JADE)™, OpenSim™, PEGASUS Plant Surveillance and Diagnosis System™, PSA-HD™, RACS™, Sens Base™, SIMON™, SimSuite Power™, SimSuite Pro™, SmartTutor™, THOR™, VPanel ™, Vista PIN™, and Xtreme I/S™.
In addition, the Company maintains federal statutory copyright protection with respect to its software programs and products, has registered copyrights for some of the documentation and manuals related to these programs, and maintains trade secret protection on its software products.
Despite these protections, the Company cannot be sure that it has protected or will be able to protect its intellectual property adequately, that the unauthorized disclosure or use of its intellectual property will be prevented, that others have not or will not develop similar technology independently, or, to the extent it owns any patents in the future, that others have not or will not be able to design around those patents. Furthermore, the laws of certain countries in which the Company's products are sold do not protect its products and intellectual property rights to the same extent as the laws of the United States.
Industries Served.
The following chart illustrates the approximate percentage of the Company's 2014 and 2013 consolidated revenue by industries served:
|
Years ended December 31,
|
|||
|
2014
|
2013
|
||
|
Nuclear power industry
|
57%
|
65%
|
|
|
Fossil fuel power industry
|
22%
|
16%
|
|
|
Process industry
|
14%
|
16%
|
|
|
Training and education industry
|
1%
|
3%
|
|
|
Other
|
6%
|
0%
|
|
|
Total
|
100%
|
100%
|
|
Contract Backlog.
The Company does not reflect an order in backlog until it has received a contract that specifies the terms and milestone delivery dates or other payment terms. As of December 31, 2014, the Company's aggregate contract backlog totaled approximately $48.4 million of which approximately $31.6 million or 65.3% is expected to be converted to revenue by December 31, 2015. As of December 31, 2013, the Company's aggregate contract backlog totaled approximately $38.0 million.
Employees.
As of December 31, 2014, the Company had 335 employees as compared to 235 employees at December 31, 2013.
12
The following are some of the factors that we believe could cause our actual results to differ materially from historical results and from the results contemplated by the forward-looking statements contained in this report and other public statements made by us. Additional risks and uncertainties not presently known to us, or that we currently see as immaterial, may also harm our business. Most of these risks are generally beyond our control. If any of the risks or uncertainties described below, or any such additional risks and uncertainties actually occurs, our business, results of operations and financial condition could be materially and adversely affected. The following information should be read in conjunction with Item 7 - Management's Discussion and Analysis of Financial Condition and Results of Operations and the consolidated financial statements and related notes under Item 8 - Financial Statements and Supplementary Data.
Our business is largely dependent on sales to the nuclear power industry. Any disruption in this industry would have a material adverse effect upon our revenue.
In 2014, 57% of our revenue was from customers in the nuclear power industry (65% in 2013). We expect to derive a significant portion of our revenue from customers in the nuclear power industry for the foreseeable future. Our ability to supply nuclear power plant simulators and related products and services is dependent on the continued operation of nuclear power plants and, to a lesser extent, on the construction of new nuclear power plants. A wide range of factors affect the continued operation and construction of nuclear power plants, including the political and regulatory environment, the availability and cost of alternative means of power generation, the occurrence of future nuclear incidents, such as the one which occurred at the Fukushima Daiichi nuclear plant in 2011, and general economic conditions.
Our sales to foreign customers expose us to risks associated with operating internationally.
Sales of products and services to end users outside the United States accounted for approximately 52% of the Company's consolidated revenue in 2014 and 67% of consolidated revenue in 2013. Consequently, our businesses are subject to a variety of risks that are specific to international operations, including the following:
| ¨ | export regulations that could erode profit margins or restrict exports; |
| ¨ | compliance with the U.S. Foreign Corrupt Practices Act and similar non-U.S. regulations; |
| ¨ | the burden and cost of compliance with foreign laws, treaties and technical standards and changes in those regulations; |
| ¨ | contract award and funding delays; |
| ¨ | potential restrictions on transfers of funds; |
| ¨ | potential difficulties in accounts receivable collection; |
| ¨ | currency fluctuations; |
| ¨ | import and export duties and value added taxes; |
| ¨ | transportation delays and interruptions; |
| ¨ | difficulties involving strategic alliances and managing foreign sales agents or representatives; |
| ¨ | uncertainties arising from foreign local business practices and cultural considerations; and |
| ¨ | potential military conflicts and political risks. |
While we have and will continue to adopt measures to reduce the potential impact of losses resulting from the risks of our foreign business, we cannot ensure that such measures will be adequate. The following foreign countries have provided more than 10% of our consolidated revenue for the indicated period:
|
Year Ended December 31,
|
|||
|
2014
|
2013
|
||
|
United Kingdom
|
12%
|
14%
|
|
|
People's Republic of China
|
11%
|
10%
|
|
|
Slovak Republic
|
2%
|
24%
|
|
13
Hyperspring's revenue, results of operations, and cash flows may suffer upon the loss of a significant customer.
We completed the acquisition of Hyperspring, LLC on November 14, 2014. See Note 3 to our Consolidated Financial Statements. For the years ended December 31, 2014 and 2013, the following customers accounted for in excess of 10% of Hyperspring's revenues:
|
Year Ended December 31,
|
|||
|
2014
|
2013
|
||
|
Tennessee Valley Authority
|
62%
|
72%
|
|
|
PSEG Nuclear LLC
|
17%
|
7%
|
|
|
Entergy Corporation
|
11%
|
13%
|
|
Hyperspring's contract for staff augmentation services with Tennessee Valley Authority expires on May 9, 2015 and such contract is expected to be rebid. Hyperspring also has a contract with PSEG Nuclear to provide training support which expires in December 2021. Hyperspring may lose a significant customer if any existing contract with such customer expires without being extended, renewed, renegotiated or is terminated by the customer prior to expiration, to the extent such early termination is permitted by the contract. A number of Hyperspring's other contracts with significant customers are typically subject to expiration during each year and they may lose any of these contracts if we are unable to extend, renew or renegotiate the contracts. The loss of any significant customer would adversely affect Hyperspring's revenue, results of operations, and cash flows.
Our expense levels are based upon our expectations as to future revenue, so we may be unable to adjust spending to compensate for a revenue shortfall. Accordingly, any revenue shortfall would likely have a disproportionate effect on our operating results.
Our revenue was $37.9 million and $47.6 million for the years ended December 31, 2014 and 2013, respectively. Our operating loss was $6.9 million and $10.7 million, for the years ended December 31, 2014 and 2013, respectively. Our operating results have fluctuated in the past and may fluctuate significantly in the future as a result of a variety of factors, including purchasing patterns, timing of new products and enhancements by us and our competitors, and fluctuating global economic conditions. Since our expense levels are based in part on our expectations as to future revenue and includes certain fixed costs, we may be unable to adjust spending in a timely manner to compensate for any revenue shortfall and such revenue shortfalls would likely have a disproportionate adverse effect on our operating results.
14
Our backlog is subject to reduction and cancellation.
Backlog represents products or services that our customers have committed by contract to purchase from us. Our backlog as of December 31, 2014 and 2013 was $48.4 million and $38.0 million, respectively. Our backlog is subject to fluctuations and is not necessarily indicative of future backlog or sales. Moreover, cancellations of purchase orders or reductions of the services requested in existing contracts could substantially and materially reduce our backlog and, consequently, future revenues. Our failure to replace canceled or reduced backlog would have an adverse effect on our operating results.
We are a party to fixed price contracts and will enter into similar contracts in the future, which could result in reduced profits or losses if we are not able to accurately estimate or control costs.
A significant portion of our revenue is attributable to contracts entered into on a fixed price basis, which allows us to benefit from cost savings, but we carry the burden of cost overruns. If our initial estimates are incorrect, or if unanticipated circumstances arise, we could experience cost overruns which would result in reduced profits or even result in losses on these contracts. Our financial condition is dependent upon our ability to maximize our earnings from our contracts. Lower earnings or losses caused by cost overruns could have a negative impact on our financial results.
Under time and materials contracts, we are paid for labor at negotiated hourly billing rates and for certain expenses. Under cost-reimbursable contracts, which are subject to a contract ceiling amount, we are reimbursed for allowable costs and paid a fee, which may be fixed or performance based. However, if costs exceed the contract ceiling or are not allowable under the provisions of the contract or applicable regulations, we may not be able to obtain reimbursement for all such costs.
Our inability to successfully estimate and manage costs on each of these contract types may materially and adversely affect our financial condition.
Our Simulation business is dependent on product innovation and research and development, which costs are incurred prior to revenue for new products and improvements.
We believe that our success will depend in large part on our ability to maintain and enhance our current product line, develop new products, maintain technological competitiveness and meet an expanding range of customer needs. Our product development activities are aimed at the development and expansion of our library of software modeling tools, the improvement of our display systems and workstation technologies, and the advancement and upgrading of our simulation technology. The life cycles for software modeling tools, graphical user interfaces, and simulation technology are variable and largely determined by competitive pressures. Consequently, we will need to continue to make significant investments in research and development to enhance and expand our capabilities in these areas and to maintain our competitive advantage.
We use derivative instruments in the normal course of our business which could result in financial losses that negatively impact our net income.
We periodically enter into forward foreign exchange contracts to manage market risks associated with the fluctuations in foreign currency exchange rates on foreign-denominated trade receivables. We could recognize financial losses as a result of volatility in the market values of these contracts or if a counterparty fails to perform. We attempt to minimize credit exposure by limiting counterparties to internationally recognized financial institutions.
15
We issue performance, advance payment, and bid bonds in the normal course of our business which could result in financial losses that negatively impact our net income.
We are often required to issue performance bonds to our customers as a normal part of our business activities. Our customers may have the ability to draw upon these performance bonds in the event we fail to cure a material breach of the contract within 30 days of receiving notice from the customer regarding the nature of the breach. As of December 31, 2014, we had issued advance payment and performance bonds on eleven contracts totaling $4.2 million, all of which have been cash collateralized except one bond totaling $48,000; the largest of these performance bonds was for $1.6 million. Although we expect no material breaches to occur on these contracts, if such a breach were to occur and we failed to cure such breach, we could incur a loss of up to $4.2 million.
We rely upon our intellectual property rights for the success of our business; however, the steps we have taken to protect our intellectual property may be inadequate.
Although we believe that factors such as the technological and creative skills of our personnel, new product developments, frequent product enhancements and reliable product maintenance are important to establishing and maintaining a technological leadership position, our business depends, in part, on our intellectual property rights in our proprietary technology and information. We rely upon a combination of trade secret, copyright, and trademark law, contractual arrangements and technical means to protect our intellectual property rights. We enter into confidentiality agreements with our employees, consultants, joint venture and alliance partners, customers and other third parties that are granted access to our proprietary information, and limit access to and distribution of our proprietary information. There can be no assurance, however, that we have protected or will be able to protect our proprietary technology and information adequately, that the unauthorized disclosure or use of our proprietary information will be prevented, that others have not or will not develop similar technology or information independently, or, to the extent we own any patents in the future, that others have not or will not be able to design around those future patents. Furthermore, the laws of certain countries in which our products are sold do not protect our products and intellectual property rights to the same extent as the laws of the United States.
The industries in which we operate are highly competitive. This competition may prevent us from raising prices at the same pace at which our costs increase.
Our businesses operate in highly competitive environments with both domestic and foreign competitors, many of whom have substantially greater financial, marketing and other resources than we do. The principal factors affecting competition include price, technological proficiency, ease of system configuration, product reliability, applications expertise, engineering support, local presence and financial stability. We believe competition in the simulation fields may further intensify in the future as a result of advances in technology, consolidations and/or strategic alliances among competitors, increased costs required to develop new technology and the increasing importance of software content in systems and products. As our business has a significant international component, changes in the value of the dollar could adversely affect our ability to compete internationally.
16
We may encounter difficulties in effectively integrating acquired businesses.
As part of our business strategy, we have acquired companies with compatible or related products. These and any future acquisitions we make will be accompanied by the risks commonly encountered in acquisitions of companies, which include, among other things:
| ¨ | potential exposure to unknown liabilities of the acquired companies; |
| ¨ | higher than anticipated acquisition costs and expenses; |
| ¨ | difficulty and expense of assimilating the operations and personnel of the companies, especially if the acquired operations are geographically distant; |
| ¨ | potential disruption of our ongoing business and diversion of management time and attention; |
| ¨ | failure to maximize our financial and strategic position by the successful incorporation of acquired technology; |
| ¨ | difficulties in adopting and maintaining uniform standards, controls, procedures and policies; |
| ¨ | loss of key employees and customers as a result of changes in management; and |
| ¨ | possible dilution to our shareholders. |
We may not be successful in overcoming these risks or any other problems encountered in connection with any of our acquisitions.
A failure to attract and retain technical personnel could reduce our revenue and our operational effectiveness.
There is a continuing demand for qualified technical personnel. We believe that our future growth and success will depend upon our ability to attract, train and retain such personnel. Our design and development efforts depend on hiring and retaining qualified technical personnel. An inability to attract or maintain a sufficient number of technical personnel could have a material adverse effect on our contract performance or on our ability to capitalize on market opportunities.
The nuclear power industry, our largest customer group, is associated with a number of hazards which could create significant liabilities.
Our business could expose us to third party claims with respect to product, environmental and other similar liabilities. Although we have sought protection from these potential liabilities through a variety of legal and contractual provisions as well as through liability insurance, the effectiveness of such protections has not been fully tested. Certain of our products and services are used by the nuclear power industry primarily in operator training. Although our contracts for such products and services typically contain provisions designed to protect us from potential liabilities associated with such use, there can be no assurance that we would not be materially adversely affected by claims or actions which may potentially arise.
17
Cyber security incidents could disrupt business operations, result in the loss of critical and confidential information, and adversely impact our reputation and results of operations.
Global cyber security threats can range from uncoordinated individual attempts to gain unauthorized access to our information technology (IT) systems to sophisticated and targeted measures known as advanced persistent threats. While we employ comprehensive measures to prevent, detect, address and mitigate these threats (including access controls, data encryption, vulnerability assessments, continuous monitoring of our IT networks and systems and maintenance of backup and protective systems), cyber security incidents, depending on their nature and scope, could potentially result in the misappropriation, destruction, corruption or unavailability of critical data and confidential or proprietary information (our own or that of third parties) and the disruption of business operations. The potential consequences of a material cyber security incident include reputational damage, litigation with third parties, diminution in the value of our investment in research, development and engineering, and increased cyber security protection and remediation costs, which in turn could adversely affect our competitiveness and results of operations.
Third-party claims that we allegedly infringe the intellectual property rights of others may be costly to defend or settle and could damage our business.
We cannot be certain that our software and services do not infringe issued patents, copyrights, trademarks or other intellectual property rights of third parties. We may be subject to legal proceedings and claims from time to time, including claims of alleged infringement of intellectual property rights of third parties by us or our licensees concerning their use of our software products and integration technologies and services. Third parties may bring claims of infringement against us. Because our software is integrated with our customers' networks and business processes, as well as other software applications, third parties may bring claims of infringement against us, as well as our customers and other software suppliers, if the cause of the alleged infringement cannot easily be determined.
Claims of alleged infringement may have a material adverse effect on our business and may discourage potential customers from doing business with us on acceptable terms, if at all. Defending against claims of infringement may be time-consuming and may result in substantial costs and diversion of resources, including our management's attention to our business. Furthermore, a party making an infringement claim could secure a judgment that requires us to pay substantial damages. A judgment could also include an injunction or other court order that could prevent us from selling our software or require that we re-engineer some or all of our products. Claims of intellectual property infringement also might require us to enter costly royalty or license agreements. We may be unable to obtain royalty or license agreements on terms acceptable to us or at all. Our business, operating results and financial condition could be harmed significantly if any of these events occurred, and the price of our common stock could be adversely affected. In addition, we have agreed, and may agree in the future, to indemnify certain of our customers against claims that our software infringes upon the intellectual property rights of others. Although we carry general liability insurance, our current insurance coverage may not apply to, and likely would not protect us from, liability that may be imposed under any of the types of claims described above.
We are subject to a wide variety of laws and regulations.
Our businesses are subject to regulation by U.S. federal and state laws and foreign laws, regulations and policies. Changes to laws or regulations may require us to modify our business objectives if existing practices become more restricted, subject to escalating costs or prohibited outright. Particular risks include regulatory risks arising from federal laws, such as laws regarding export of sensitive technologies or technical information. Our business and the industries in which we operate are also at times being reviewed or investigated by regulators, which could lead to enforcement actions, fines and penalties or the assertion of private litigation claims and damages.
18
Our stockholder protection rights agreement and classified Board of Directors could deter acquisition proposals and make it difficult for a third party to acquire control of the Company, which could have a negative effect on the price of our Common Stock.
We have a stockholder protection rights agreement and a classified Board of Directors, which could discourage potential acquisition proposals and could delay or prevent a change in control. This deterrent could adversely affect the price of our Common Stock and make it difficult to affect a change in the composition of the Board of Directors or a change in management.
The price of our common stock is highly volatile and could decline regardless of our operating performance.
The market price of our common stock could fluctuate in response to, among other things:
| ¨ | changes in economic and general market conditions; |
| ¨ | changes in the outlook and financial condition of certain of our significant customers and industries in which we have a concentration of business; |
| ¨ | changes in financial estimates, treatment of our tax assets or liabilities or investment recommendations by securities analysts following our business; |
| ¨ | changes in accounting standards, policies, guidance or interpretations or principles; |
| ¨ | sales of common stock by our directors, officers and significant stockholders; |
| ¨ | our failure to achieve operating results consistent with securities analysts' projections; and |
| ¨ | the operating and stock price performance of competitors. |
These factors might adversely affect the trading price of our common stock and prevent you from selling your common stock at or above the price at which you purchased it. In addition, in recent periods, the stock market has experienced significant price and volume fluctuations. This volatility has had a significant impact on the market price of securities issued by many companies, including ours and others in our industry. These changes can occur without regard to the operating performance of the affected companies. As a result, the price of our common stock could fluctuate based upon factors that have little or nothing to do with our company, and these fluctuations could materially reduce our share price.
A sustained decline in the price of our common stock or weaker than forecasted operating results could result in write-downs of goodwill and capitalized software.
In conjunction with business acquisitions, we record goodwill at fair value and review its fair value for impairment annually as of November 30, or on an interim basis if impairment indicators are present, such as a significant reduction in our market capitalization, significant declines in operating performance or disruptions to the business that could reduce our future cash flow. On November 14, 2014, we recorded $5.6 million of goodwill related to our acquisition of Hyperspring, LLC. We can provide no assurance that we will not have an impairment charge in future periods as the result of changing conditions. In 2013, the Company incurred a goodwill impairment of $4.5 million. See Note 4 to our Consolidated Financial Statements for information regarding our goodwill.
Certain computer software development costs are capitalized in the accompanying consolidated balance sheets. Capitalization of computer software development costs begins upon the establishment of technological feasibility. Capitalization ceases and amortization of capitalized costs begins when the software product is commercially available for general release to customers. Amortization of capitalized computer software development costs is included in cost of revenue and is determined using the straight-line method over the remaining estimated economic life of the product, typically three years. On an annual basis, and more frequently as conditions indicate, we assess the recoverability of the unamortized software development costs by estimating the net undiscounted cash flows expected to be generated by the sale of the product. If the undiscounted cash flows are not sufficient to recover the unamortized software costs we will write-down the investment to its estimated fair value based on the future undiscounted cash flows. The excess of any unamortized computer software costs over the related net realizable value is written down and charged to operations.
Based upon indicators of impairment in the second quarter of 2013, which included a substantial decrease in the Company's market capitalization, we performed an interim goodwill impairment test as of June 30, 2013. In conjunction with the goodwill impairment test, we analyzed the net realizable value of our capitalized software development costs and, based upon the results of this analysis, took a $2.2 million charge to earnings for a write-down of the capitalized software development costs. After the write-down, we had $769,000 of capitalized software remaining on the balance sheet at June 30, 2013. As of December 31, 2014 we have $1.4 million of capitalized software development costs recorded on the balance sheet. See Note 8 to our Consolidated Financial Statements for information regarding our capitalized software development costs.
19
None.
The Company is headquartered in a facility in Sykesville, Maryland (approximately 43,000 square feet). The lease for this facility expires on June 30, 2023. The Company has subleased approximately 1,000 square feet of the facility.
In addition, the Company leases office space domestically in St. Marys, Georgia, Huntsville, Alabama, Madison, New Jersey, Cary, North Carolina and Tarrytown, New York and internationally in Beijing, China, Chennai, India, Nyköping, Sweden and Stockton-On-Tees, England. The Company leases these facilities for terms ending between 2015 and 2023.
The Company and its subsidiaries are from time to time involved in ordinary routine litigation incidental to the conduct of its business. The Company and its subsidiaries are not a party to, and its property is not the subject of, any material pending legal proceedings that, in the opinion of management, are likely to have a material adverse effect on the Company's business, financial condition or results of operations.
Not applicable.
20
PART II
| ITEM 5. | MARKET FOR REGISTRANT'S COMMON EQUITY, RELATED STOCKHOLDER MATTERS, AND ISSUER PURCHASES OF EQUITY SECURITIES. |
The Company's common stock is listed on the NYSE MKT Stock Exchange, where it trades under the symbol "GVP". The following table sets forth, for the periods indicated, the high and low sale prices for the Company's common stock reported by the NYSE MKT Stock Exchange for each full quarterly period within the two most recent fiscal years:
|
2014
|
||||||||
|
Quarter
|
High
|
Low
|
||||||
|
First
|
$
|
1.90
|
$
|
1.62
|
||||
|
Second
|
$
|
1.81
|
$
|
1.65
|
||||
|
Third
|
$
|
1.78
|
$
|
1.54
|
||||
|
Fourth
|
$
|
1.65
|
$
|
1.20
|
||||
|
2013
|
||||||||
|
Quarter
|
High
|
Low
|
||||||
|
First
|
$
|
2.55
|
$
|
1.97
|
||||
|
Second
|
$
|
2.00
|
$
|
1.49
|
||||
|
Third
|
$
|
1.85
|
$
|
1.40
|
||||
|
Fourth
|
$
|
1.73
|
$
|
1.54
|
||||
21
The following table sets forth the equity compensation plan information for the year ended December 31, 2014:
|
Plan category
|
Number of Securities to
be Issued Upon Exercise of
Outstanding Options,
Warrants and Rights
(a)
|
Weighted Average Exercise Price of
Outstanding Options, Warrants and Rights
(b)
|
Number of Securities Remaining
Available for Future Issuance Under Equity Compensation Plans
(Excluding Securities Reflected in Column (a))
(c)
|
|||||||||
|
Equity compensation plans approved by security holders
|
2,708,273
|
$
|
3.12
|
1,147,967
|
||||||||
|
Equity compensation plans not approved by security holders
|
--
|
$
|
--
|
--
|
||||||||
|
Total
|
2,708,273
|
$
|
3.12
|
1,147,967
|
||||||||
There were approximately 910 holders of record of the common stock as of December 31, 2014. The Company has never declared or paid a cash dividend on its common stock. The Company currently intends to retain future earnings to finance the growth and development of its business and, therefore, does not anticipate paying any cash dividends in the foreseeable future on its common stock.
The Company believes factors such as quarterly fluctuations in results of operations and announcements of new products by the Company or by its competitors may cause the market price of the common stock to fluctuate, perhaps significantly. In addition, in recent years the stock market in general, and the shares of technology companies in particular, have experienced extreme price fluctuations. The Company's common stock has also experienced a relatively low trading volume, making it further susceptible to extreme price fluctuations. These factors may adversely affect the market price of the Company's common stock.
Issuer Purchases of Equity Securities
On March 21, 2011, the Board of Directors authorized the purchase of up to $3.0 million of the Company's common stock in accordance with the safe harbor provisions of Rule 10b-18 of the Securities Exchange Act of 1934. During the year ended December 31, 2013, the Company repurchased 494,424 shares at an aggregate cost of $0.8 million. The Company completed the share repurchase program in October 2013 and thus did not repurchase shares during 2014.
22
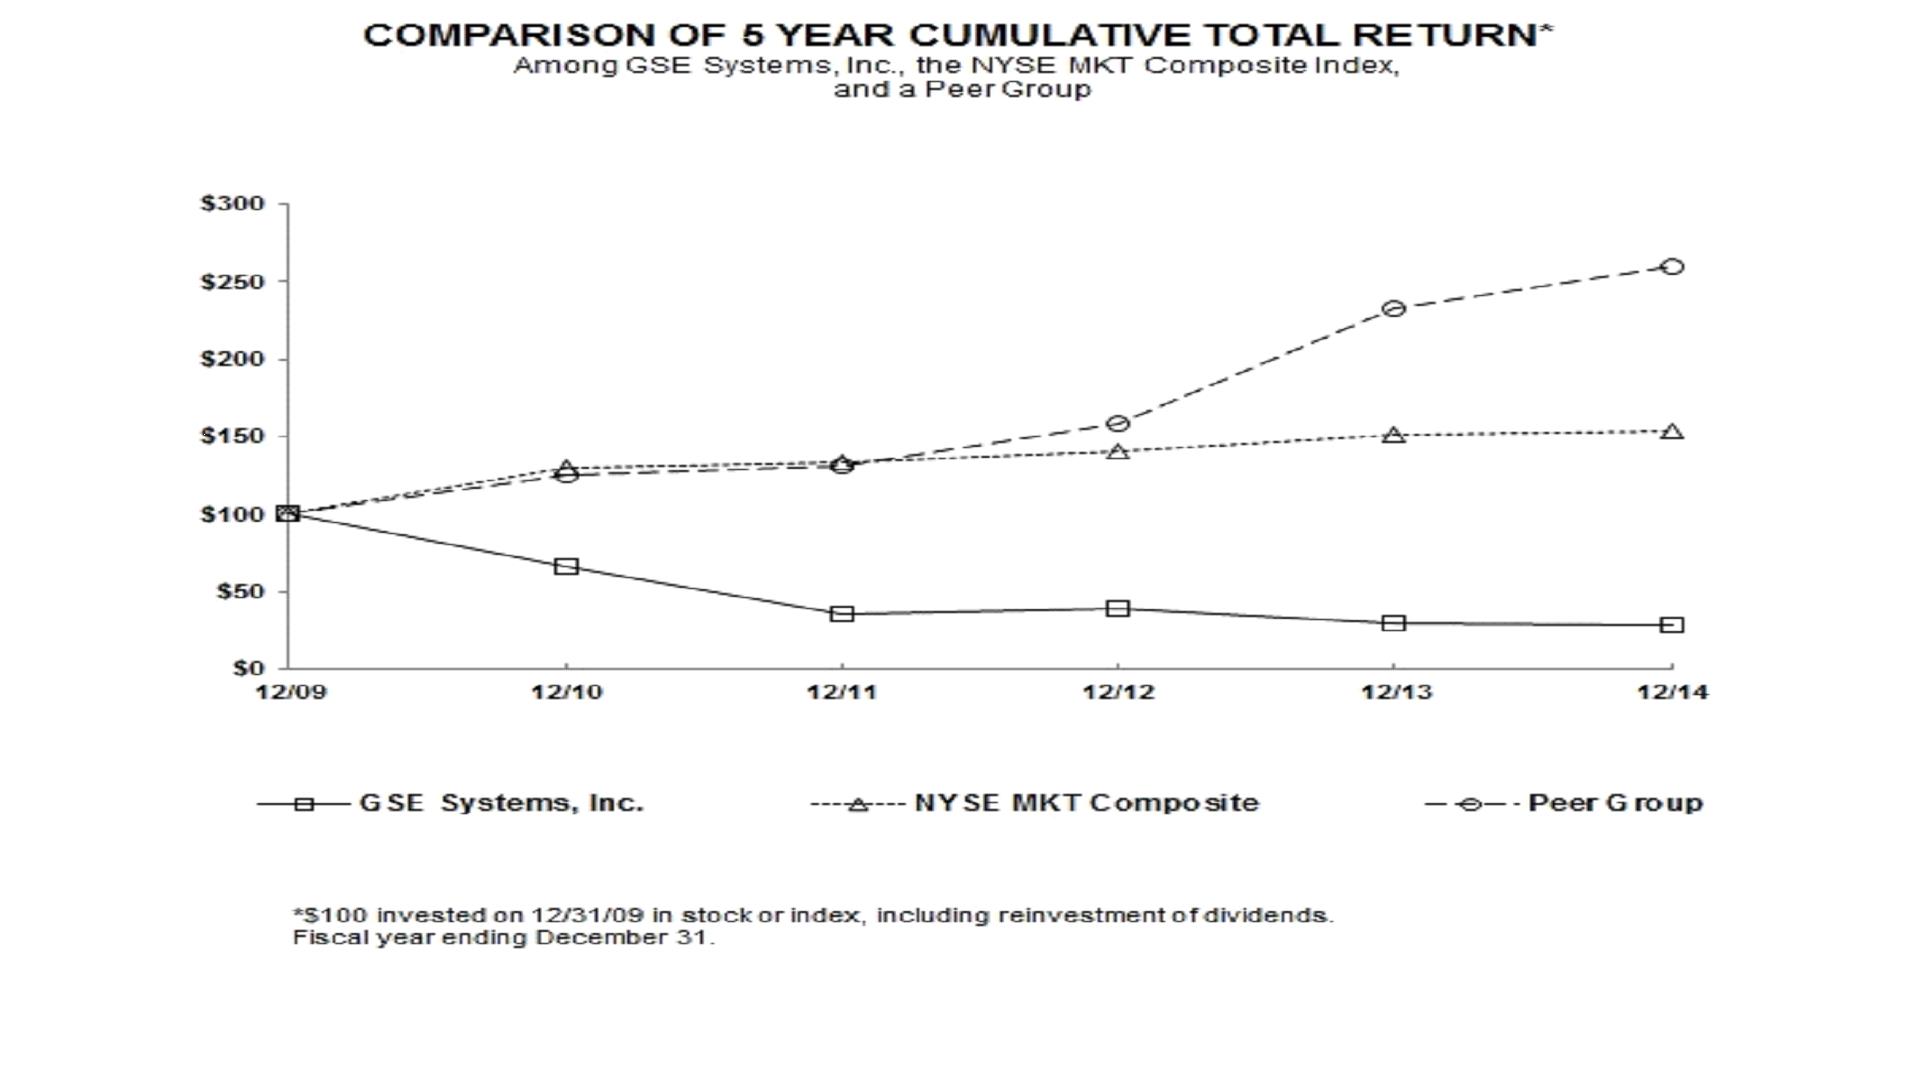
Performance Graph
The following graph compares the Company's cumulative total shareholder return since December 31, 2009 through December 31, 2014 with that of the NYSE MKT Composite Index and a peer group index. The Peer Group consists of companies selected on a line-of-business basis and includes Aspen Technology, Inc., L-3 Communications Holdings and Honeywell International. The graph assumes an initial investment of $100 on December 31, 2009 in the Company's common stock and each index. There were no dividends declared or paid by the Company during the five year period. The Company has never paid a dividend on its common stock. The indices are re-weighted daily, using the market capitalization on the previous tracking day. The comparisons shown in the graph below are based upon historical data. The stock price performance shown in the graph below is not necessarily indicative of, or intended to forecast, the potential future performance of the Company's common stock. The graph was prepared for the Company by Research Data Group, Inc.
|
Year ended December 31,
|
|||||||||||
|
2009
|
2010
|
2011
|
2012
|
2013
|
2014
|
||||||
|
GSE Systems, Inc.
|
100.00
|
66.06
|
35.58
|
39.42
|
29.20
|
29.01
|
|||||
|
NYSE MKT Composite
|
100.00
|
129.56
|
133.75
|
140.87
|
150.79
|
153.24
|
|||||
|
Peer Group
|
100.00
|
125.21
|
130.64
|
158.84
|
233.06
|
259.37
|
|||||
23
Historical consolidated results of operations and balance sheet data presented below have been derived from the historical financial statements of the Company. This information should be read in connection with the Company's consolidated financial statements.
|
(in thousands, except per share data)
|
Years ended December 31,
|
|||||||||||||||||||
|
2014 (1)
|
2013
|
2012
|
2011 (2)
|
2010 (3)
|
||||||||||||||||
|
Consolidated Statements of Operations:
|
||||||||||||||||||||
|
Contract revenue
|
$
|
37,930
|
$
|
47,562
|
$
|
52,246
|
$
|
51,126
|
$
|
47,213
|
||||||||||
|
Cost of revenue
|
26,551
|
34,981
|
34,509
|
34,781
|
36,081
|
|||||||||||||||
|
Write-down of capitalized software development costs (4)
|
-
|
2,174
|
-
|
-
|
-
|
|||||||||||||||
|
Gross profit
|
11,379
|
10,407
|
17,737
|
16,345
|
11,132
|
|||||||||||||||
|
Operating expenses:
|
||||||||||||||||||||
|
Selling, general and administrative
|
17,570
|
15,836
|
14,865
|
12,672
|
11,683
|
|||||||||||||||
|
Goodwill impairment loss (4)
|
-
|
4,462
|
-
|
-
|
-
|
|||||||||||||||
|
Depreciation
|
545
|
570
|
562
|
497
|
579
|
|||||||||||||||
|
Amortization of definite-lived intangible assets
|
193
|
207
|
313
|
948
|
102
|
|||||||||||||||
|
Total operating expenses
|
18,308
|
21,075
|
15,740
|
14,117
|
12,364
|
|||||||||||||||
|
Operating income (loss)
|
(6,929
|
)
|
(10,668
|
)
|
1,997
|
2,228
|
(1,232
|
)
|
||||||||||||
|
Interest income, net
|
143
|
105
|
162
|
131
|
19
|
|||||||||||||||
|
Gain (loss) on derivative instruments, net
|
209
|
265
|
(121
|
)
|
(68
|
)
|
(913
|
)
|
||||||||||||
|
Other income (expense), net
|
1
|
(67
|
)
|
(175
|
)
|
72
|
83
|
|||||||||||||
|
Income (loss) before income taxes
|
(6,576
|
)
|
(10,365
|
)
|
1,863
|
2,363
|
(2,043
|
)
|
||||||||||||
|
Provision (benefit) for income taxes
|
166
|
146
|
689
|
(438
|
)
|
206
|
||||||||||||||
|
Net income (loss)
|
$
|
(6,742
|
)
|
$
|
(10,511
|
)
|
$
|
1,174
|
$
|
2,801
|
$
|
(2,249
|
)
|
|||||||
|
Basic income (loss) per common share
|
$
|
(0.38
|
)
|
$
|
(0.58
|
)
|
$
|
0.06
|
$
|
0.15
|
$
|
(0.12
|
)
|
|||||||
|
Diluted income (loss) per common share
|
$
|
(0.38
|
)
|
$
|
(0.58
|
)
|
$
|
0.06
|
0.15
|
$
|
(0.12
|
)
|
||||||||
|
Weighted average common shares outstanding:
|
||||||||||||||||||||
|
-Basic
|
17,888
|
18,151
|
18,384
|
18,952
|
18,975
|
|||||||||||||||
|
-Diluted
|
17,888
|
18,151
|
18,458
|
19,123
|
18,975
|
|||||||||||||||
|
As of December 31,
|
||||||||||||||||||||
|
2014
|
2013
|
2012
|
2011
|
2010
|
||||||||||||||||
|
Consolidated Balance Sheet data:
|
||||||||||||||||||||
|
Working capital
|
$
|
11,456
|
$
|
25,991
|
$
|
29,782
|
$
|
30,240
|
$
|
30,040
|
||||||||||
|
Total assets
|
45,999
|
48,827
|
62,564
|
58,815
|
53,614
|
|||||||||||||||
|
Long-term liabilities
|
38
|
78
|
1,459
|
2,352
|
799
|
|||||||||||||||
|
Stockholders' equity
|
23,740
|
30,387
|
40,830
|
38,783
|
36,906
|
|||||||||||||||
(1) - Hyperspring, LLC was acquired on November 14, 2014. See Note 3 to Consolidated Financial Statements in Item 8.
(2) - EnVision Systems, Inc. was acquired in January 4, 2011.
(3) - TAS Holdings Ltd. was acquired in April 26, 2010.
(4) - See Note 4 and Note 8 in the Notes to Consolidated Financial Statements in Item 8.
24
On November 14, 2014, (the "Closing Date") the Company, through its operating subsidiary, GSE Power Systems, Inc. ("GSE Power"), acquired Hyperspring, LLC ("Hyperspring") pursuant to a Membership Interests Purchase Agreement ("Purchase Agreement") with the sellers of Hyperspring ("Sellers"). Hyperspring, headquartered in Huntsville, Alabama, specializes in training and development, plant operations support services, and staff augmentation, primarily in the United States nuclear industry. Hyperspring operates as a wholly-owned subsidiary of GSE Power. The purchase price allocation included customer relationship intangible assets valued at $779,000 which are being amortized over seven years.
GSE Power paid the Sellers an aggregate of $3.0 million in cash at the closing date. Hyperspring is in the process of bidding on a renewal of its current contract with the Tennessee Valley Authority ("TVA").If Hyperspring is successful in renewing the TVA contract for substantially the same scope as currently being provided and at an agreed upon profit margin on or before May 15, 2015, GSE will pay the Hyperspring members an additional $1.2 million. In addition, GSE Power may be required, pursuant to the terms of the Purchase Agreement, to pay the Sellers up to an additional an additional $7.2 million if Hyperspring attains certain EBITDA (earnings before interest, taxes, depreciation and amortization) targets for the three-year period ending November 13, 2017. However, if Hyperspring is not successful in renewing the TVA contracts, GSE may still be required to pay the Sellers up to an additional $8.4 million if Hyperspring attains certain EBITDA (earnings before interest, taxes, depreciation and amortization) targets for the three-year period ending November 13, 2017. Whether or not the TVA contract is renewed the total cash paid to the Hyperspring members may total $11.4 million. The estimated fair value of the purchase price recorded by the Company totaled $7.0 million.
With the acquisition of Hyperspring, the Company determined that it now has two reportable business segments: Staff Augmentation which provides personnel to fulfill staff positions on a short-term basis to energy industry customers and Performance Improvement Solutions which provides simulation, engineering, and training solutions and services to the nuclear and fossil fuel power industry and to the chemical and petrochemical industries.
On November 14, 2014, GSE invested $250,000 in exchange for a 50% interest in IntelliQlik, LLC. IntelliQlik is developing a software platform for online learning and learning management for the energy market. GSE is obligated to contribute an additional $250,000 to IntelliQlik upon the attainment of certain development milestones by September 15, 2015. The Company determined that the outcome of IntelliQlik reaching the milestones was probable and therefore evaluated the contingent consideration payment under ASC 450 (refer to Note 17). The Company does not have a controlling financial interest in IntelliQlik and therefore is accounting for its interest in IntelliQlik as an equity investment. Equity gains and losses incurred by IntelliQlik are recorded within the Performance Improvement Solutions segment according to the Company's 50% interest. See Note 17 in the Notes to Consolidated Financial Statements in Item 8 for further discussion of our equity method investments.
25
Critical Accounting Policies and Estimates.
As further discussed in Note 2 to the consolidated financial statements, in preparing the Company's financial statements, management makes several estimates and assumptions that affect the Company's reported amounts of assets, liabilities, revenues and expenses. Those accounting estimates that have the most significant impact on the Company's operating results and place the most significant demands on management's judgment are discussed below. For all of these policies, management cautions that future events rarely develop exactly as forecast, and the best estimates may require adjustment.
Revenue Recognition on Long-Term Contracts. The Company recognizes revenue through (1) fixed price contracts on the sale of uniquely designed systems containing hardware, software and other materials as well as (2) time and material contracts primarily through staff augmentation support and service agreements.
In accordance with U.S. generally accepted accounting principles ("GAAP"), our Performance Improvement Solutions segment accounts for revenue under fixed-price contracts using the percentage-of-completion method. This methodology recognizes revenue and earnings as work progresses on the contract and is based on an estimate of the revenue and earnings earned to date, less amounts recognized in prior periods. The Company bases its estimate of the degree of completion of the contract by reviewing the relationship of costs incurred to date to the expected total costs that will be incurred on the project. Estimated contract earnings are reviewed and revised periodically as the work progresses, and the cumulative effect of any change in estimate is recognized in the period in which the change is identified. Estimated losses are charged against earnings in the period such losses are identified. The Company recognizes revenue arising from contract claims either as income or as an offset against a potential loss only when the amount of the claim can be estimated reliably and realization is probable and there is a legal basis of the claim.
Uncertainties inherent in the performance of contracts include labor availability and productivity, material costs, change order scope and pricing, software modification and customer acceptance issues. The reliability of these cost estimates is critical to the Company's revenue recognition as a significant change in the estimates can cause the Company's revenue and related margins to change significantly from the amounts estimated in the early stages of the project.
As the Company recognizes revenue under the percentage-of-completion method, it provides an accrual for estimated future warranty costs based on historical and projected claims experience. The Company's long-term contracts generally provide for a one-year warranty on parts, labor and any bug fixes as it relates to software embedded in the systems.
The Company's system design contracts do not normally provide for "post customer support service" (PCS) in terms of software upgrades, software enhancements or telephone support. In order to obtain PCS, the customers normally must purchase a separate contract. Such PCS arrangements are generally for a one-year period renewable annually and include customer support, unspecified software upgrades, and maintenance releases. The Company recognizes revenue from these contracts ratably over the life of the agreements.
Revenue from the sale of software licenses which do not require significant modifications or customization for the Company's modeling tools are recognized when the license agreement is signed, the license fee is fixed and determinable, delivery has occurred, and collection is considered probable.
We evaluate our contracts for multiple deliverables under ASC 605-25 Revenue Recognition-Multiple Element Arrangements, and when appropriate, separate the contracts into separate units of accounting for revenue recognition. Contracts with multiple element arrangements typically include, but are not limited to, components such as training, licenses, and PCS, as described above, embedded in the agreement. When a contract contains multiple deliverables, the Company allocates revenue to each deliverable based on its relative selling price which is determined based on its vendor specific objective evidence ("VSOE") if available, third party evidence ("TPE") if VSOE is not available, or estimated selling price if neither VSOE nor TPE is available. Amounts allocated to training and support services are based on VSOE and revenue is deferred until the services have been performed. Amounts allocated to software licenses are also based on VSOE. Revenue related to software licenses is recognized once the license has been delivered.
The Company recognizes revenue under time and materials contracts primarily from staff augmentation and certain consulting agreements. Revenue on time and material contracts is recognized as services are rendered and performed. Under a typical time-and-materials billing arrangement, customers are billed on a regularly scheduled basis, such as biweekly or monthly. At the end of each accounting period, revenue is estimated and accrued for services performed since the last billing cycle. These unbilled amounts are billed the following month.
26
Impairment of Intangible Assets, including Goodwill. We review goodwill for impairment annually as of November 30 and whenever events or changes in circumstances indicate the carrying value of an asset may not be recoverable. We test goodwill at the reporting unit level. A reporting unit is an operating segment, or one level below an operating segment, as defined by U.S. GAAP. After the acquisition of Hyperspring, LLC ("Hyperspring") on November 14, 2014, our reporting units are: (i) Performance Improvement Solutions and (ii) Staff Augmentation. At December 31, 2014, the total $5.6 million balance of goodwill was represented by Hyperspring or our Staff Augmentation segment.
Accounting Standards Update ("ASU") 2011-08, Testing Goodwill for Impairment ("ASU 2011-08") permits an entity to first assess qualitative factors to determine whether it is more likely than not that the fair value of a reporting unit is less than its carrying amount as a basis for determining whether it is necessary to perform the two-step goodwill impairment test. Under ASU 2011-08, an entity is not required to perform step one of the goodwill impairment test for a reporting unit if it is more likely than not that its fair value is greater than its carrying amount. For our annual goodwill impairment test, we performed a qualitative assessment as permitted by ASU 2011-08 for the Staff Augmentation reporting unit. Based on the reporting unit's positive revenue, order and gross margin results since the acquisition, we determined that it was more likely than not that the fair values of each of our reporting units exceeded their respective carrying values.
If it is determined as a result of the qualitative assessment permitted by ASU 2011-08, that it is more likely than not that the fair value of a reporting unit is less than its carrying amount, a two-step impairment test is required. In the first step, we compare the fair value of each reporting unit to its carrying value. If the fair value of the reporting unit exceeds the carrying value of the net assets assigned to that unit, goodwill is not impaired and we are not required to perform further testing. If the carrying value of the net assets assigned to the reporting unit exceeds the fair value of the reporting unit, then we must perform the second step of the impairment test in order to determine the implied fair value of the reporting unit's goodwill. The implied fair value of goodwill is determined by allocating the fair value of the reporting unit's assets and liabilities in a manner similar to a purchase price allocation, with any residual fair value allocated to goodwill. If the carrying value of a reporting unit's goodwill exceeds its implied fair value, then we record an impairment loss equal to the difference.
Under the two-step impairment test, we determine the fair value of our reporting units using both an income approach and a market approach, and weigh both approaches to determine the fair value of each reporting unit. Under the income approach, we perform a discounted cash flow analysis which incorporates management's cash flow projections over a five-year period and a terminal value is calculated by applying a capitalization rate to terminal year projections based on an estimated long-term growth rate. The five-year projected cash flows and calculated terminal value are discounted using a weighted average cost of capital ("WACC") which takes into account the costs of debt and equity. The cost of equity is based on the risk-free interest rate, equity risk premium, industry and size equity premiums and any additional market equity risk premiums as deemed appropriate for each reporting unit. To arrive at a fair value for each reporting unit, the terminal value is discounted by the WACC and added to the present value of the estimated cash flows over the discrete five-year period. There are a number of other variables which impact the projected cash flows, such as expected revenue growth and profitability levels, working capital requirements, capital expenditures and related depreciation and amortization. Under the market approach, we perform a comparable public company analysis and apply revenue and earnings multiples from the identified set of companies to the reporting unit's actual and forecasted financial performance to determine the fair value of each reporting unit. We evaluate the reasonableness of the fair value calculations of our reporting units by reconciling the total of the fair values of all of our reporting units to our total market capitalization, and adjusting for an appropriate control premium. In addition, we make certain judgments in allocating shared assets and liabilities to determine the carrying values for each of our reporting units.
Determining the fair value of a reporting unit is judgmental in nature and involves the use of significant estimates and assumptions. These estimates and assumptions include revenue growth rates and operating margins used to calculate projected future cash flows, risk-adjusted discount rates, future economic and market conditions and determination of appropriate market comparables. We base our fair value estimates on assumptions we believe to be reasonable but that are unpredictable and inherently uncertain. Actual future results may differ from those estimates. In addition, we make certain judgments and assumptions in allocating shared assets and liabilities to determine the carrying values for each of our reporting units. The timing and frequency of our goodwill impairment tests are based on an ongoing assessment of events and circumstances that would indicate a possible impairment. We will continue to monitor our goodwill and intangible assets for impairment and conduct formal tests when impairment indicators are present.
27
Capitalization of Computer Software Development Costs. In accordance with U.S. generally accepted accounting principles, the Company capitalizes computer software development costs incurred after technological feasibility has been established, but prior to the release of the software product for sale to customers. Once the product is available to be sold, the Company amortizes the costs, on a straight line method, over the estimated useful life of the product, which normally ranges from three to five years. As of December 31, 2014, the Company has net capitalized software development costs of $1.4 million. On an annual basis, and more frequently as conditions indicate, the Company assesses the recovery of the unamortized software development costs by estimating the net undiscounted cash flows expected to be generated by the sale of the product. If the undiscounted cash flows are not sufficient to recover the unamortized software costs the Company will write-down the investment to its estimated fair value based on future discounted cash flows. The excess of any unamortized computer software costs over the related net realizable value is written down and charged to operations. Significant changes in the sales projections could result in an impairment with respect to the capitalized software that is reported on the Company's consolidated balance sheet.
During the second quarter of 2013, the Company incurred a charge of $2.2 million related to the write-down of certain capitalized software development costs based on the net realizable value analysis performed in conjunction with our goodwill impairment test.
Valuation of Contingent Consideration for Business Acquisitions. Acquisitions may include contingent consideration payments based on future financial measures of an acquired company. Contingent consideration is required to be recognized at fair value as of the acquisition date. We estimate the fair value of these liabilities based on financial projections of the acquired companies and estimated probabilities of achievement. We believe our estimates and assumptions are reasonable; however, there is significant judgment involved. At each reporting date, the contingent consideration obligation will be revalued to estimated fair value and changes in fair value subsequent to the acquisition will be reflected in income or expense in the consolidated statements of operations, and could cause a material impact to our operating results. Changes in the fair value of contingent consideration obligations may result from changes in discount periods and rates, changes in the timing and amount of revenue and/or earnings estimates and changes in probability assumptions with respect to the likelihood of achieving the various earn-out criteria.
Deferred Income Tax Valuation Allowance. Deferred income taxes arise from temporary differences between the tax basis of assets and liabilities and their reported amounts in the financial statements. Management makes a regular assessment of the realizability of the Company's deferred tax assets. In making this assessment, management considers whether it is more likely than not that some or all of the deferred tax assets will not be realized. The ultimate realization of deferred tax assets is dependent upon the generation of future taxable income during the periods in which those temporary differences become deductible. Management considers the scheduled reversal of deferred tax liabilities and projected future taxable income of the Company in making this assessment. A valuation allowance is recorded to reduce the total deferred income tax asset to its realizable value. As of December 31, 2014, the Company's largest deferred tax asset of $6.8 million primarily relates to a U.S. net operating loss carryforward of $19.1 million which expires in various amounts between 2020 and 2034. The amount of U.S. loss carryforward which can be used by the Company each year is limited due to changes in the Company's ownership which occurred in 2003. Thus, a portion of the Company's loss carryforward may expire unutilized. We believe that the Company will achieve profitable operations in future years that will enable the Company to recover the benefit of its net deferred tax assets. However, other than a portion of the net deferred tax assets that are related to the Company's Indian subsidiary, the recovery of the net deferred tax assets could not be substantiated by currently available objective evidence. Accordingly, the Company has established a $10.0 million valuation allowance for its net deferred tax assets.
28
Results of Operations.
The following table sets forth the results of operations for the periods presented expressed in thousands of dollars and as a percentage of contract revenue.
|
($ in thousands)
|
Years ended December 31,
|
|||||||||||||||
|
2014
|
%
|
2013
|
%
|
|||||||||||||
|
Contract revenue
|
$
|
37,930
|
100.0
|
%
|
$
|
47,562
|
100.0
|
%
|
||||||||
|
Cost of revenue
|
26,551
|
70.0
|
%
|
34,981
|
73.5
|
%
|
||||||||||
|
Write-down of capitalized software development costs
|
-
|
0.0
|
%
|
(2,174
|
)
|
4.6
|
%
|
|||||||||
|
Gross profit
|
11,379
|
30.0
|
%
|
10,407
|
21.9
|
%
|
||||||||||
|
Operating expenses
|
||||||||||||||||
|
Selling, general and administrative
|
17,570
|
46.3
|
%
|
15,836
|
33.3
|
%
|
||||||||||
|
Goodwill impairment loss
|
-
|
0.0
|
%
|
4,462
|
9.4
|
%
|
||||||||||
|
Depreciation
|
545
|
1.4
|
%
|
570
|
1.2
|
%
|
||||||||||
|
Amortization of definite-lived intangible assets
|
193
|
0.5
|
%
|
207
|
0.4
|
%
|
||||||||||
|
Total operating expenses
|
18,308
|
48.3
|
%
|
21,075
|
44.3
|
%
|
||||||||||
|
Operating loss
|
(6,929
|
)
|
-18.3
|
%
|
(10,668
|
)
|
-22.4
|
%
|
||||||||
|
Interest income, net
|
143
|
0.4
|
%
|
105
|
0.2
|
%
|
||||||||||
|
Gain on derivative instruments, net
|
209
|
0.6
|
%
|
265
|
0.5
|
%
|
||||||||||
|
Other income (expense) , net
|
1
|
0.0
|
%
|
(67
|
)
|
-0.1
|
%
|
|||||||||
|
Loss before income taxes
|
(6,576
|
)
|
-17.3
|
%
|
(10,365
|
)
|
-21.8
|
%
|
||||||||
|
Provision for income taxes
|
166
|
0.5
|
%
|
146
|
0.3
|
%
|
||||||||||
|
Net loss
|
$
|
(6,742
|
)
|
-17.8
|
%
|
$
|
(10,511
|
)
|
-22.1
|
%
|
||||||
29
Comparison of the Years Ended December 31, 2014 to December 31, 2013.
Contract Revenue. Contract revenue for the year ended December 31, 2014 totaled $37.9 million, which was 20.3% lower than the $47.6 million of revenue for the year ended December 31, 2013.
|
(in thousands)
|
Year ended December 31,
|
|||||||
|
2014
|
2013
|
|||||||
|
Contract Revenue:
|
||||||||
|
Performance Improvement Solutions
|
$
|
35,675
|
$
|
47,562
|
||||
|
Staff Augmentation
|
2,255
|
-
|
||||||
|
Total Contract Revenue
|
$
|
37,930
|
$
|
47,562
|
||||
Performance Improvement Solutions revenue decreased 25.0% from $47.6 million to $35.7 million for the years ended December 31, 2013 and 2014, respectively. We recorded total Performance Improvement Solutions orders of $40.9 million in the year ended December 31, 2014 as compared to $32.0 million in the year ended December 31, 2013. The decrease in revenue is primarily attributable to the completion of the $36.6 million full scope simulator and digital control system order from Slovenské elektrárne, a.s. ("SE") in April 2014. In the years ended December 31, 2014 and 2013, the Company recognized $770,000 and $11.6 million of contract revenue, respectively, on this project using the percentage-of-completion method, which accounted for 2.2% and 24.4% of the Company's Simulation revenue, respectively. During the year ended December 31, 2014, the Company's Swedish subsidiary had $2.1 million in revenue which was a 37.5% decrease in revenue from the prior year. The decrease was due in part to the decrease in orders from Japanese customers in the wake of the Fukushima Daiichi I Nuclear Power Plant disaster in 2011 as well as the completion of a large fossil simulation project in 2013. The Company downsized its Swedish operations in 2014.
As discussed earlier, our Staff Augmentation business segment was created due to the acquisition of Hyperspring, LLC on November 14, 2014. Revenue from the date of acquisition to December 31, 2014 totaled $2.3 million. Staff Augmentation orders totaled $914,000 during the same period.
At December 31, 2014, the Company's backlog was $48.4 million: $41.7 million for the Performance Improvement Solutions business segment and $6.7 million for Staff Augmentation. Performance Improvement Solutions backlog increased 9.7% from $38.0 million as of December 31, 2013.
Write-down of capitalized software development costs. The Company makes ongoing evaluations of the recoverability of its capitalized software projects by comparing the unamortized amount for each product to the estimated net realizable value of the product. If such evaluations indicate that the unamortized software development costs exceed the net realizable value, we write off the amount by which the unamortized software development costs exceed net realizable value. For the quarter ended June 30, 2013, we incurred a charge of $2.2 million related to the write-off of certain capitalized software development costs.
30
Gross Profit. Gross profit totaled $11.4 million for the year ended December 31, 2014 as compared to $10.4 million for the year ended December 31, 2013. As a percentage of revenue, gross profit increased from 21.9% for the year ended December 31, 2013 to 30.0% for the year ended December 31, 2014. Excluding the $2.2 million non-cash write-down of capitalized software development costs, which is discussed above, gross profit totaled $12.6 million and 26.5% as a percentage of revenue for the year ended December 31, 2013.
|
($ in thousands)
|
Years ended December 31,
|
|||||||||||||||
|
2014
|
%
|
2013
|
%
|
|||||||||||||
|
Gross Profit:
|
||||||||||||||||
|
Performance Improvement Solutions
|
$
|
11,159
|
31.3
|
%
|
$
|
12,581
|
26.5
|
%
|
||||||||
|
Staff Augmentation
|
220
|
9.8
|
%
|
-
|
0.0
|
%
|
||||||||||
|
Write-down of capitalized software development costs
|
-
|
0.0
|
%
|
(2,174
|
)
|
-4.6
|
%
|
|||||||||
|
Consolidated Gross Profit
|
11,379
|
30.0
|
%
|
10,407
|
21.9
|
%
|
||||||||||
Performance Improvement Solutions' gross profit of $11.2 million or 31.3% of revenue for the year ended December 31, 2014 decreased $1.4 million from $12.6 million or 26.5% of revenue for the year ended December 31, 2013. The $36.6 million full scope simulator and digital control system project for a Slovak utility which was completed in April 2014 made up 2.2% of the Company's Performance Improvement Solutions revenue in 2014 as compared to 24.4% in 2013. The significant decrease in revenue on the Slovakia contract as an overall percentage of the Company's revenue was the largest factor contributing to the increase in the Company's overall gross margin because this project had a gross profit lower than the Company's normal gross profits.
31
Selling, General and Administrative Expenses. Selling, general and administrative ("SG&A") expenses totaled $17.6 million and $15.8 million for the years ended December 31, 2014 and 2013, respectively. Fluctuations in the components of SG&A spending were as follows:
| ¨ | Business development costs decreased from $6.4 million for the year ended December 31, 2013 to $5.9 million in the year ended December 31, 2014. As part of the restructuring of our Swedish subsidiary, our Swedish VP of Business Development was terminated in early 2014. Included within the total business development costs were our bidding and proposal costs, which are the costs of operations personnel assisting with the preparation of contract proposals. Bidding and proposal costs totaled $1.5 million for the year ended December 31, 2014, a $353,000 decrease from the prior year. |
| ¨ | The Company's general and administrative expenses totaled $8.5 million and $7.9 million for the years ended December 31, 2014 and 2013, respectively. The increase of $0.6 million is primarily attributable to the following: |
| o | The Company incurred restructuring costs for our Swedish operations of $611,000 in the year ended December 31, 2014. |
| o | We incurred severance costs of $653,000 for our U.S. operations in the year ended December 31, 2014. |
| o | The Company's facility costs increased $263,000 for the year ended December 31, 2014 compared to the same period last year. In 2013, our Chinese subsidiary was located in an office which they shared with our Chinese joint venture, GSE-UNIS Simulation Technology Co., Ltd. In conjunction with the dissolution of the joint venture agreement in 2013, we relocated to a new office during the fourth quarter of 2013. As a result, facility costs for the Chinese office were $170,000 higher in 2014. |
| o | The Company incurred $265,000 in due diligence and legal costs related to the Hyperspring, LLC acquisition in 2014. |
| o | The Company has reduced corporate administrative costs by $1.1 million in the year ended December 31, 2014 as compared to 2013 as a result of spending reductions in numerous areas including corporate salaries, audit and tax services, travel, and problem resolution support for the Company's Oracle ERP system. The GSE Board of Directors elected to waive their fees for 2014; fees paid in 2013 totaled $196,000. |
| ¨ | Gross spending on software product development ("development") expenses, for the twelve months ended December 31, 2014 totaled $3.8 million, as compared to $2.9 million for the twelve months ended December 31, 2013. The Company capitalized $0.6 million and $1.3 million for the twelve months ended December 31, 2014 and 2013, respectively. Net development spending increased from $1.6 million for the twelve months ended December 31, 2013 to $3.2 million for the twelve months ended December 31, 2014. |
| o | The Company's Activ-3DiTM visualization team, which develops 3D technology to add to our training programs, incurred $231,000 and $99,000 of costs related to this effort during the twelve months ended December 31, 2014 and 2013, respectively. |
| o | Development expense related to the EnVision product line totaled $676,000 and $364,000 for the twelve months ended December 31, 2014 and 2013, respectively. |
| o | Spending on simulation software product development totaled $2.9 million for the twelve months ended December 31, 2014. For the twelve months ended December 31, 2013, development expense totaled $2.4 million. The Company's development expenses were mainly related to EDM™, our configuration management system, maintenance to our GPWR™ and JADE™ applications, and advance modeling software such as RELAP5-HD® and PSA-HD™. |
32
Goodwill impairment loss. Based upon indicators of impairment in the second quarter of 2013, which included a substantial decrease in the Company's market capitalization following the announcement of the Company's first quarter 2013 earnings and significantly lower than projected revenue and profits as a result of a change in market conditions, the Company performed an interim impairment test as of June 30, 2013. The results of the ASC 350 Step 1 goodwill impairment analysis indicated that the estimated fair value of our reporting unit was less than the carrying value. The reporting unit was unfavorably impacted by a combination of lower current and projected cash flows. Because our reporting unit's fair value estimate was lower than its carrying value, we applied the second step of the goodwill test, in accordance with ASC 350.
The second step of the goodwill impairment analysis indicated that the carrying value of the goodwill associated with the reporting unit exceeded its implied fair value resulting in a $4.5 million non-deductible goodwill impairment charge. Accordingly, the Company wrote off the entire existing goodwill balance in the second quarter 2013.
Depreciation. Depreciation expense totaled $545,000 and $570,000 for the years ended December 31, 2014 and 2013, respectively. The depreciation variance between the two years is immaterial.
Amortization of definite-lived intangible assets. Amortization expense related to definite-lived intangible assets totaled $193,000 and $207,000 for the years ended December 31, 2014 and 2013, respectively.
In conjunction with the Hyperspring acquisition on November 14, 2014, we recorded $779,000 of customer-related intangible assets which is being amortized on a waterfall basis over seven years. We recognized $50,000 of amortization expense for the Hyperspring intangibles in 2014.
The balance of the intangible asset amortization at December 31, 2014 related to the net Hyperspring, EnVision and TAS intangible assets. Amortization is recognized on a straight-line basis over the estimated useful life of the intangible assets, except for contractual customer relationships and contract backlog which are recognized in proportion to the related projected revenue streams.
Operating Loss. The Company had an operating loss of $6.9 million (-18.3% of revenue) in the year ended December 31, 2014, as compared with an operating loss of $10.7 million (-22.4% of revenue) for the year ended December 31, 2013. The variances were due to the factors outlined above.
33
Interest Income, Net. The Company's interest income, net totaled $143,000 and $105,000 for the years ended December 31, 2014 and 2013, respectively.
At December 31, 2014, the Company had a $7.5 million revolving line of credit with Susquehanna Bank which expires on March 31, 2015. The credit facility was established mainly to collateralize letters of credit which are issued as advance payment, bid or performance bonds. The line of credit, which is in the principal amount of up to $7.5 million, bears interest at a rate equal to the Wall Street Journal Prime Rate of Interest, floating with a floor of 4 ½%.
In 2014, Susquehanna amended the credit agreement to require that all outstanding letters of credit be cash collateralized in segregated, restricted accounts. At December 31, 2014 and 2013, the Company had approximately $4.2 million and $1.1 million, respectively, of cash in escrow accounts with Susquehanna that were being used as collateral for various advance payment and performance bonds. The Company recorded interest income of $7,000 and $8,000 from the escrow accounts in the years ended December 31, 2014 and 2013, respectively. The interest earned on these restricted funds is added to the restricted cash balance.
The deferred financing costs incurred when the Susquehanna line of credit was first established in 2011 were amortized over the original two-year term of the line of credit. Amortization began in November 2011 and ended during 2013. As a result, no amortization related to the deferred financing costs was recognized for the year ended December 31, 2014. Amortization of deferred financing costs totaling $10,000 was recognized for the twelve months ended December 31, 2013.
On November 14, 2014, the acquisition date, Hyperspring, LLC had a $1.0 million working capital line of credit with IberiaBank. Interest was payable monthly at a rate of the prime rate of interest as published in the money rate section of the Wall Street Journal plus 2.50%. The effective rate at November 14, 2014 was 5.750%. The line was secured by all accounts and was guaranteed by the members of Hyperspring, LLC. The Company recorded interest expense of $1,000 from the line of credit for the year ended December 31, 2014.
On December 7, 2014, the working capital line of credit matured while the Company was renegotiating the new terms with IberiaBank subsequent to the acquisition of Hyperspring. On January 22, 2015, a promissory note was executed between Hyperspring, LLC and IberiaBank to extend the $1.0 million line of credit until June 30, 2015. Under the new terms, interest is payable monthly at a rate of the prime rate of interest as published in the money rate section of the Wall Street Journal plus 1.00 %. The effective rate at the date of the promissory note was 4.25%. The line is secured by all accounts and guaranteed by GSE Systems, Inc.
The Company had $7.5 million and $9.5 million deposited in an unrestricted money market account with Susquehanna on December 31, 2014 and 2013, respectively. Interest income earned on the money market accounts totaled $37,000 and $43,000 in the years ended 2014 and 2013, respectively.
Interest income on deposits held by the Company's foreign subsidiaries increased from $64,000 in the year ended December 31, 2013 to $102,000 for the year ended December 31, 2014. The increase was primarily attributable to the higher cash balances maintained by the subsidiaries during 2014.
34
Gain on Derivative Instruments, net. The Company periodically enters into forward foreign exchange contracts to manage market risks associated with the fluctuations in foreign currency exchange rates on foreign-denominated trade receivables. As of December 31, 2014, the Company had foreign exchange contracts outstanding of approximately 0.3 million Pounds Sterling, 1.4 million Euro, 0.8 million Australian Dollars, and 0.5 million Malaysian Ringgits. The contracts expire on various dates through November 2016. The Company had not designated the contracts as hedges and has recognized a gain on the change in the estimated fair value of the contracts of $365,000 for the twelve months ended December 31, 2014.
At December 31, 2013, the Company had foreign exchange contracts outstanding of approximately 0.2 million Pounds Sterling, 13.3 million Euro, and 10.1 million Japanese Yen at fixed rates. The contracts expired on various dates through May 2016. The Company had not designated the contracts as hedges and had recognized a loss on the change in the estimated fair value of the contracts of $489,000 for the twelve months ended December 31, 2013.
The estimated net fair values of the contracts at December 31, 2014 and 2013 was a net asset of $68,000 and a net liability of $513,000, respectively. The amounts were recorded on the balance sheets as follows:
|
December 31,
|
||||||||
|
(in thousands)
|
2014
|
2013
|
||||||
|
Asset derivatives
|
||||||||
|
Prepaid expenses and other current assets
|
$
|
71
|
$
|
140
|
||||
|
Other assets
|
21
|
2
|
||||||
|
92
|
142
|
|||||||
|
Liability derivatives
|
||||||||
|
Other current liabilities
|
(23
|
)
|
(637
|
)
|
||||
|
Other liabilities
|
(1
|
)
|
(18
|
)
|
||||
|
(24
|
)
|
(655
|
)
|
|||||
|
Net fair value
|
$
|
68
|
$
|
(513
|
)
|
|||
The foreign currency denominated trade receivables and unbilled receivables that are related to the outstanding foreign exchange contracts at December 31, 2014 are remeasured at the end of each period into the functional currency using the current exchange rate at the end of the period. For the years ended December 31, 2014 and 2013, the Company incurred a loss of $156,000 and a gain of $754,000, respectively, from the remeasurement of such trade and unbilled receivables.
35
Other Income (Expense), Net. The Company recognized $1,000 of other income, net and $67,000 of other expense, net for the years ended December 31, 2014 and 2013, respectively.
| o | During 2013, the Company recognized losses of $148,000, relating to its pro rata share of operating results from its equity investment in GSE-UNIS. In 2013, the Company agreed to sell its 49% stake in GSE-UNIS to its partner, Beijing Unis Venture Capital Co., Ltd. and terminate the joint venture agreement as of July 31, 2013. |
| o | As a 10% owner of the Emirates Simulation Academy ("ESA") in the UAE, the Company was required to provide a guarantee of 10% of ESA's credit facility. The Company provided the guarantee by depositing cash into an interest bearing, restricted account with the Union National Bank ("UNB"). In 2009, the Company wrote off the entire balance in this account. In the second quarter of 2013, the Company was notified by UNB that the ESA line of credit had been paid off by utilizing the guarantees from the three owners. The balance remaining in our account after the settlement of the guarantee, $82,000 was transferred to the Company and the UNB account was closed. |
| o | On May 22, 2013, the Company and Electrobalt Holding, a Russian Federation closed joint-stock company, created a 50/50 joint venture called General Simulation Engineering RUS Limited Liability Company ("GSE RUS"). GSE's equity contribution was 1.5 million Roubles ($46,000) and was paid to the joint venture in November 2013. For the years ended December 31, 2014, and 2013, the Company recognized a $38,000 and $8,000 equity loss on its investment in GSE RUS, respectively. |
| o | On November 14, 2014, in conjunction with the Hyperspring acquisition, the Company invested $250,000 for a 50% interest in IntelliQlik, LLC ("IntelliQlik") and is obligated to contribute an additional $250,000 upon the attainment by IntelliQlik of certain milestones. IntelliQlik is jointly owned by GSE Power and one of the former shareholders of Hyperspring. For the year ended December 31, 2014, the Company recognized a $17,000 equity loss on its investment in IntelliQlik. |
| o | The Company had other miscellaneous income of $56,000 and $7,000 for the years ended December 31, 2014 and 2013, respectively. |
36
Provision for Income Taxes.
The Company files tax returns in the United States federal jurisdiction and in several state and foreign jurisdictions. Because of the net operating loss carryforwards, the Company is subject to U.S. federal and state income tax examinations from years 1997 and forward and is subject to foreign tax examinations by tax authorities for years 2007 and forward. Open tax years related to state and foreign jurisdictions remain subject to examination but are not considered material to our financial position, results of operations or cash flows.
An uncertain tax position taken or expected to be taken in a tax return is recognized in the financial statements when it is more likely than not (i.e., a likelihood of more than fifty percent) that the position would be sustained upon examination by tax authorities that have full knowledge of all relevant information. A recognized tax position is then measured at the largest amount of benefit that is greater than fifty percent likely of being realized upon ultimate settlement. Interest and penalties related to income taxes are accounted for as income tax expense.
During 2013 and 2014, the Company recorded $187,000 and $20,000 of tax liabilities for certain foreign tax contingencies, respectively. The Company made payments of $103,000 and $211,000 during 2013 and 2014, respectively, related to these foreign tax contingencies.
The Company's tax expense in 2014 was $166,000 and consisted of $10,000 state income taxes, $1,000 foreign income taxes from the Company's foreign subsidiaries, $55,000 for foreign income tax withholding on several non-U.S. contracts, $76,000 of foreign income tax liabilities, and a $24,000 deferred tax liability relating to the tax amortization of goodwill that cannot be offset by deferred tax assets because the anticipated reversal of the deferred tax liability is outside of the anticipated reversal of the deferred tax assets.
The Company's tax expense in 2013 was $146,000 and consisted of $22,000 state income taxes, $159,000 foreign income tax benefits from the Company's foreign subsidiaries, $4,000 U.S. alternative minimum tax, $83,000 for foreign income tax withholding on several non-U.S. contracts, $245,000 of foreign income tax liabilities, and $49,000 tax benefit resulting from OCI allocation.
The Company has a full valuation allowance on its U.S., Swedish, and Chinese net deferred tax assets at December 31, 2014.
37
Liquidity and Capital Resources.
As of December 31, 2014, GSE had cash and cash equivalents of $13.6 million compared to $15.6 million at December 31, 2013.
Cash provided by (used in) operating activities. For the year ended December 31, 2014, net cash provided by operating activities totaled $6.6 million; for the year ended December 31, 2013, the Company used $3.2 million of cash in operating activities. Significant changes in the Company's assets and liabilities in the year ended December 31, 2014 included:
| ¨ | A $10.3 million decrease in the Company's contracts receivable. The Company's trade receivables, net of the allowance for doubtful accounts, decreased from $19.0 million at December 31, 2013 to $10.8 million at December 31, 2014. Through February 28, 2015, the Company collected 62% of the gross trade receivables outstanding as of December 31, 2014. The Company's unbilled receivables decreased by $0.5 million to $5.1 million at December 31, 2014. The decrease in the unbilled receivables is due to the timing of contracted billing milestones of the Company's current projects. In January and February 2015, the Company invoiced $1.3 million of the unbilled amounts; the balance of the unbilled amounts is expected to be invoiced within one year. At December 31, 2014, trade receivables outstanding for more than 90 days totaled $0.4 million compared to $0.6 million at December 31, 2013. |
| ¨ | A $2.2 million decrease in prepaid expenses and other assets. In 2013, the Company agreed to sell its 49% stake in GSE-UNIS Simulation Engineering Co., Ltd to its partner, Beijing Unis Venture Capital Co., Ltd. for $1.2 million and terminate the joint venture agreement as of July 31, 2013. We received the $1.2 million in December 2014. At December 31, 2013, the Company had a $0.4 million receivable for Value Added Tax refund related to our Slovakia project which was collected in 2014. Our Swedish subsidiary applied $0.3 million of prepayments to pay the Swedish Tax Agency. |
| ¨ | A $2.1 million decrease in accounts payable, accrued compensation and accrued expenses. At December 31, 2013 the Company had a $1.1 million accounts payable due to Siemens in conjunction with its Slovak project; the payment was made in 2014. The Company's December 31, 2014 subcontractor accrual decreased $372,000 due to the progression of work on several projects utilizing subcontractor labor and the related timing of the billing milestones on those contracts. |
| ¨ | A $2.1 million increase in billings in excess of revenue earned. The increase is due to the timing of contracted billing milestones of the Company's current projects. |
For the year ended December 31, 2013, net cash used in operating activities totaled $3.2 million. Significant changes in the Company's assets and liabilities in the year ended December 31, 2013 included:
|
¨
|
A $26,000 increase in the Company's contracts receivable. The Company's trade receivables, net of the allowance for doubtful accounts, increased from $12.4 million at December 31, 2012 to $19.0 million at December 31, 2013. The Company's unbilled receivables decreased by $5.8 million to $5.5 million at December 31, 2013. The decrease in the unbilled receivables is due to the timing of contracted billing milestones of the Company's current projects. At December 31, 2013, trade receivables outstanding for more than 90 days totaled $0.6 million compared to $2.5 million at December 31, 2012.
|
|
¨
|
A $1.9 million decrease in accounts payable, accrued compensation and accrued expenses. The Company's December 31, 2013 subcontractor accrual decreased $2.0 million due to the progression of work on several projects utilizing subcontractor labor and the related timing of the billing milestones on those contracts.
|
38
Cash Used in Investing Activities. For the year ended December 31, 2014, net cash used in investing activities was $7.3 million.
The Company made capital expenditures of $398,000 and capitalized software development costs of $646,000. Cash used as collateral for standby letters of credit, bank guarantees and foreign currency contracts increased by $3.1 million.
Effective November 14, 2014, GSE Power Systems Inc., completed the acquisition of Hyperspring, LLC ("Hyperspring"). On the closing date, we paid $3.0 million in cash to the Members of Hyperspring. GSE acquired approximately $152,000 in cash through the acquisition of Hyperspring, thus the net cash used in the acquisition was $2.8 million. In addition, if Hyperspring achieves certain EBITDA (earnings before interest, taxes, depreciation and amortization) targets for the three-year period ending November 13, 2017 and is awarded a renewal of their current contract with the Tennessee Valley Authority ("TVA") for substantially the same scope as currently being provided on or before May 15, 2015, the Hyperspring Members could receive up to an additional $8.4 million. Thus the total cash paid to the Hyperspring members may total $11.4 million. The estimated fair value of the purchase price recorded by the Company totaled $7.0 million.
In connection with the Hyperspring acquisition, the Company also invested $250,000 in IntelliQlik, LLC in exchange for a 50% interest in IntelliQlik pursuant to the terms of the Operating Agreement dated as of November 14, 2014. The other 50% of IntelliQlik is owned by one of the members of Hyperspring.
For the year ended December 31, 2013, net cash used in investing activities was $883,000.
The Company made capital expenditures of $399,000 and capitalized software development costs of $1.3 million for the year ended December 31, 2013. Cash used as collateral for standby letters of credit, bank guarantees and foreign currency contracts decreased by $871,000 for the year ended December 31, 2013.
On May 22, 2013, the Company and Electrobalt Holding, a Russian Federation closed joint-stock company, created a 50/50 joint venture called General Simulation Engineering RUS Limited Liability Company ("GSE RUS"). GSE's equity contribution was 1.5 million Roubles ($46,000) and was paid to the joint venture in November 2013.
39
Cash Used in Financing Activities. For the year ended December 31, 2014, net cash used in financing activities totaled $0.9 million.
Hyperspring has a working capital line of credit with IberiaBank. The Company paid down $410,000 of the outstanding balance of the line of credit in the six weeks between the acquisition date of November 14, 2014 and December 31, 2014.
During the year ended December 31, 2014, the Company made payments of $0.5 million to the former shareholders of EnVision in accordance with the purchase agreement.
For the year ended December 31, 2013, net cash used in financing activities totaled $2.7 million. The Company repurchased 494,424 shares of the Company's common stock at an aggregate cost of $819,000, and received $44,000 from the issuance of common stock from the exercise of employee stock options. During the year ended December 31, 2013, the Company made payments totaling $1.9 million to the former EnVision shareholders in accordance with the purchase agreements.
40
Credit Facilities
At December 31, 2014, the Company had a Master Loan and Security Agreement and Revolving Credit Note with Susquehanna Bank. The Company and its subsidiary, GSE Performance Solutions, Inc. were jointly and severally liable as co-borrowers. The Loan Agreement provides a $7.5 million revolving line of credit for the purpose of (i) issuing stand-by letters of credit and (ii) providing working capital. Working capital advances bear interest at a rate equal to the Wall Street Journal Prime Rate of Interest, floating with a floor of 4 ½%. The agreement expires on March 31, 2015.
As collateral for the Company's obligations, the Company granted a first lien and security interest in all of the assets of the Company, including but not limited to, accounts receivable, proceeds and products, intangibles, trademarks, patents, intellectual property, machinery and equipment.
On September 9, 2014, the Company signed a Third Comprehensive Amendment to the Master Loan and Security Agreement. According to the Third Amendment, the Company is to maintain a segregated cash collateral account at Susquehanna Bank equal to the greater of (i) $3.0 million or (ii) the aggregate principal amounts of all Loans outstanding under the Revolving Credit Facility (including any issued and outstanding letters of credit, working capital advances, and negative foreign exchange positions) as security for the Company's obligations. Under this Amendment, Susquehanna Bank shall have complete and unconditional control over the cash collateral account.
On September 30, 2014, Susquehanna Bank collateralized the outstanding letters of credit issued under the line of credit. At December 31, 2014, the cash collateral account totaled $4.2 million and was classified as restricted cash on the balance sheet.
The credit agreements contain certain restrictive covenants regarding future acquisitions and incurrence of debt. In addition, the credit agreements contain financial covenants with respect to the Company's cash flow coverage ratio, minimum tangible capital base, quick ratio, and tangible capital base ratio.
|
As of
|
||
|
Covenant
|
December 31, 2014
|
|
|
Cash flow coverage ratio
|
Must Exceed 1.20 : 1.00
|
-12.11 : 1.00
|
|
Minimum tangible capital base
|
Must Exceed $26.0 million
|
$15.4 million
|
|
Quick ratio
|
Must Exceed 2.00 : 1.00
|
1.57 : 1.00
|
|
Tangible capital base ratio
|
Not to Exceed .75 : 1.00
|
1.44 : 1.00
|
As of December 31, 2014, the Company was not in compliance with any of its covenants as defined above; however, the Company has received a written waiver from Susquehanna Bank for noncompliance.
On November 14, 2014, the acquisition date, Hyperspring, LLC had a $1.0 million working capital line of credit with IberiaBank. Interest was payable monthly at a rate of the prime rate of interest as published in the money rate section of the Wall Street Journal plus 2.50%. The effective rate at November 14, 2014 was 5.750%. The line was secured by all accounts and was guaranteed by the members of Hyperspring, LLC. At November 14, 2014 the outstanding balance on the line of credit was $749,000.
On December 7, 2014, the working capital line of credit matured while the Company was renegotiating the new terms with IberiaBank subsequent to the acquisition of Hyperspring. On January 22, 2015, a promissory note was executed between Hyperspring, LLC and IberiaBank to extend the $1.0 million line of credit until June 30, 2015. Under the new terms, interest is payable monthly at a rate of the prime rate of interest as published in the money rate section of the Wall Street Journal plus 1.00%. The effective rate at the date of the promissory note was 4.25%. The line is secured by all accounts and guaranteed by GSE Systems, Inc. At December 31, 2014 the outstanding balance on the line of credit was $339,000.
The Company draws on the IberiaBank line of credit as needed mainly to provide for payroll funding for Hyperspring. The line is replenished through collection of receivables obtained in the following weeks.
41
Contractual Cash Commitments
The following summarizes the Company's contractual cash obligations as of December 31, 2014 and the effect these obligations are expected to have on its liquidity and cash flow in future periods:
|
Payments Due by Period
|
||||||||||||||||||||
|
(in thousands)
|
||||||||||||||||||||
|
Contractual Cash Obligations
|
Total
|
Less than 1 year
|
1-3 Years
|
4-5 Years
|
After 5 Years
|
|||||||||||||||
|
Long Term Debt
|
$
|
-
|
$
|
-
|
$
|
-
|
$
|
-
|
$
|
-
|
||||||||||
|
Subcontractor and Purchase Commitments
|
$
|
4,553
|
$
|
3,944
|
$
|
609
|
$
|
-
|
$
|
-
|
||||||||||
|
Net Future Minimum Lease Payments
|
$
|
6,108
|
$
|
1,163
|
$
|
1,720
|
$
|
1,358
|
$
|
1,867
|
||||||||||
|
Total
|
$
|
10,661
|
$
|
5,107
|
$
|
2,329
|
$
|
1,358
|
$
|
1,867
|
||||||||||
As of December 31, 2014, the Company was contingently liable for twelve standby letters of credit and one surety bond totaling $4.2 million which represented advance payment and performance bonds on eleven contracts. The Company has deposited the full value of eleven standby letters of credit, $4.2 million, into money market escrow accounts which have been restricted in that the Company does not have access to these funds until the related letters of credit have expired. The cash has been recorded on the Company's balance sheet at December 31, 2014 as restricted cash and long-term restricted cash depending on the expiration date of the underlying letters of credit.
As of December 31, 2013, the Company was contingently liable for ten standby letters of credit and two surety bonds totaling $4.9 million which represented advance payment and performance bonds on eleven contracts. The Company had deposited the full value of four standby letters of credit, $1.1 million, into money market escrow accounts which had been restricted in that the Company did not have access to these funds until the related letters of credit have expired. The cash was recorded on the Company's balance sheet at December 31, 2013 as restricted cash and long-term restricted cash depending on the expiration date of the underlying letters of credit. An additional six letters of credit for $3.6 million were collateralized using the Company's Susquehanna Bank line of credit at December 31, 2013.
2015 Liquidity Outlook
At December 31, 2014, the Company had cash and cash equivalents of $13.6 million and $4.2 million of restricted cash.
The Company has a Master Loan and Security Agreement and Revolving Credit Note with Susquehanna Bank. The Loan Agreement provides a $7.5 million revolving line of credit for the purpose of (i) issuing stand-by letters of credit and (ii) providing working capital. Working capital advances bear interest at a rate equal to the Wall Street Journal Prime Rate of Interest, floating with a floor of 4 ½%. The two year agreement expires on March 31, 2015.
Under the Agreement, the Company is to maintain a segregated cash collateral account at Susquehanna Bank equal to the greater of (i) $3.0 million or (ii) the aggregate principal amounts of all Loans outstanding under the Revolving Credit Facility (including any issued and outstanding letters of credit, working capital advances, and negative foreign exchange positions) as security for the Company's obligations. Under this Amendment, Susquehanna Bank shall have complete and unconditional control over the cash collateral account. At December 31, 2014 we were required to maintain cash balances of $4.2 million at Susquehanna in segregated cash collateral accounts.
The Company has a $1.0 million working capital line of credit with IberiaBank. We draw on this line of credit as needed mainly to provide for Hyperspring's payroll funding. The line is replenished through collection of receivables obtained in the following weeks. On January 22, 2015, a promissory note was executed between Hyperspring and IberiaBank, extending the line of credit until June 30, 2015. Under the new terms, interest is payable monthly at a rate of the prime rate of interest as published in the money rate section of the Wall Street Journal plus 1.00 %. The effective rate at the date of the promissory note was 4.25%. The line is secured by all accounts and guaranteed by GSE Systems, Inc. At December 31, 2014 the outstanding balance on the line of credit was $339,000.
The Company has entered into 2015 with $48.4 million of backlog; $31.6 million of which is expected to convert to revenue in 2015. The Company anticipates that its normal operations will generate all of the funds necessary to fund its consolidated operations during the next twelve months. The Company believes that it will have sufficient liquidity and working capital without additional financing. However, notwithstanding the foregoing, the Company may be required to look for additional capital to fund its operations if the Company is unable to operate profitably and generate sufficient cash from operations. There can be no assurance that the Company would be successful in raising such additional funds.
42
Foreign Exchange.
A portion of the Company's international sales revenue has been and may be received in a currency other than the currency in which the expenses relating to such revenue are paid. Accordingly, the Company periodically enters into forward foreign exchange contracts to manage the market risks associated with the fluctuations in foreign currency exchange rates.
Off-balance Sheet Obligations.
The Company has no off-balance sheet obligations as of December 31, 2014, except for its operating lease commitments and outstanding letters of credit and surety bonds. See Contractual Cash Commitments above.
Other Matters.
Management believes inflation has not had a material impact on the Company's operations.
The Company's market risk is principally confined to changes in foreign currency exchange rates. During the year ended December 31, 2014, 29% of the Company's revenue was from contracts which required payments in a currency other than U.S. Dollars, principally British Pounds Sterling (12%), Euros (5%), Japanese Yen (0.3%), Chinese Renminbi (7%), Canadian Dollar (2%) and Swedish Krona (2%). For the years ended December 31, 2013, 51% of the Company's revenue was from contracts which required payments in a currency other than U.S. Dollars, principally Euros, Swedish Krona, British Pounds Sterling, Chinese Renminbi, Canadian Dollars and Japanese Yen.
In addition, for both the years ended December 31, 2014 and 2013, 9% of the Company's expenses were incurred in Swedish Krona. In the years ended December 31, 2014 and 2013, 11% and 10% of the Company's expenses were incurred in Pounds Sterling, respectively. The Company's exposure to foreign exchange rate fluctuations arises in part from inter-company accounts in which costs incurred in one entity are charged to other entities in different foreign jurisdictions. The Company is also exposed to foreign exchange rate fluctuations as the financial results of all foreign subsidiaries are translated into U.S. dollars in consolidation. As exchange rates vary, those results when translated may vary from expectations and adversely impact overall expected profitability.
The Company utilizes forward foreign currency exchange contracts to manage market risks associated with the fluctuations in foreign currency exchange rates. The principal currencies for which such forward exchange contracts are entered into are the Pound Sterling, the Euro and the Japanese Yen. It is the Company's policy to use such derivative financial instruments to protect against market risk arising in the normal course of business in order to reduce the impact of these exposures. The Company minimizes credit exposure by limiting counterparties to nationally recognized financial institutions.
At December 31, 2013, the Company had foreign exchange contracts outstanding of approximately 0.2 million Pounds Sterling, 13.3 million Euro, and 10.1 million Japanese Yen at fixed rates. The contracts expire on various dates through May 2016.
As of December 31, 2014, the Company had foreign exchange contracts outstanding of approximately 0.3 million Pounds Sterling, 1.4 million Euro, 0.8 million Australian Dollars, and 0.5 million Malaysian Ringgits at fixed rates. The contracts expire on various dates through November 2016. The Company had not designated the contracts as hedges and has recorded a gain on the change in the estimated fair value of the contracts of $365,000 for the year ended December 31, 2014. The estimated fair value of the contracts was recorded as a net asset totaling $68,000 at December 31, 2014. The Company recognized a loss of $489,000 for the year ended December 31, 2013, on the changes in fair value of its forward currency exchange contracts. A 10% fluctuation in the foreign currency exchange rates up or down as of December 31, 2014 would have increased/decreased the change in estimated fair value of the contracts by $6,800.
43
INDEX TO CONSOLIDATED FINANCIAL STATEMENTS
|
Page
|
|
|
GSE Systems, Inc. and Subsidiaries
|
|
|
F-1
|
|
|
F-2
|
|
|
F-3
|
|
|
F-4
|
|
|
F-5
|
|
|
F-6
|
|
|
F-7
|
|
|
F-8
|
44
Board of Directors and Stockholders
GSE Systems, Inc.
Sykesville, Maryland
We have audited the accompanying consolidated balance sheet of GSE Systems, Inc. and subsidiaries as of December 31, 2014 and the related consolidated statements of operations, comprehensive loss, changes in stockholders' equity, and cash flows for the year ended December 31, 2014. These financial statements are the responsibility of the Company's management. Our responsibility is to express an opinion on these financial statements based on our audit.
We conducted our audit in accordance with the standards of the Public Company Accounting Oversight Board (United States). Those standards require that we plan and perform the audit to obtain reasonable assurance about whether the financial statements are free of material misstatement. The Company is not required to have, nor were we engaged to perform, an audit of its internal control over financial reporting. Our audit included consideration of internal control over financial reporting as a basis for designing audit procedures that are appropriate in the circumstances, but not for the purpose of expressing an opinion on the effectiveness of the Company's internal control over financial reporting. Accordingly, we express no such opinion. An audit also includes examining, on a test basis, evidence supporting the amounts and disclosures in the financial statements, assessing the accounting principles used and significant estimates made by management, as well as evaluating the overall financial statement presentation. We believe that our audit provides a reasonable basis for our opinion.
In our opinion, the consolidated financial statements referred to above present fairly, in all material respects, the financial position of GSE Systems, Inc. and subsidiaries at December 31, 2014, and the results of its operations and its cash flows for the year ended December 31, 2014, in conformity with accounting principles generally accepted in the United States of America.
/s/ BDO USA, LLP
Bethesda, Maryland
March 19, 2015
F-1
The Board of Directors and Stockholders
GSE Systems, Inc.:
We have audited the accompanying consolidated balance sheet of GSE Systems, Inc. and subsidiaries as of December 31, 2013, and the related consolidated statement of operations, comprehensive loss, changes in stockholders' equity, and cash flows for the year then ended. These consolidated financial statements are the responsibility of the Company's management. Our responsibility is to express an opinion on these consolidated financial statements based on our audit.
We conducted our audit in accordance with the standards of the Public Company Accounting Oversight Board (United States). Those standards require that we plan and perform the audit to obtain reasonable assurance about whether the financial statements are free of material misstatement. An audit includes examining, on a test basis, evidence supporting the amounts and disclosures in the financial statements. An audit also includes assessing the accounting principles used and significant estimates made by management, as well as evaluating the overall financial statement presentation. We believe that our audit provides a reasonable basis for our opinion.
In our opinion, the consolidated financial statements referred to above present fairly, in all material respects, the financial position of GSE Systems, Inc. and subsidiaries as of December 31, 2013 and the results of their operations and their cash flows for the year then ended, in conformity with U.S. generally accepted accounting principles.
/s/ KPMG LLP
Baltimore, Maryland
March 26, 2014
F-2
PART I - FINANCIAL INFORMATION
Item 1. Financial Statements
GSE SYSTEMS, INC. AND SUBSIDIARIES
(in thousands, except share data)
|
December 31,
|
||||||||
|
ASSETS
|
2014
|
2013
|
||||||
|
Current assets:
|
||||||||
|
Cash and cash equivalents
|
$
|
13,583
|
$
|
15,643
|
||||
|
Restricted cash
|
613
|
45
|
||||||
|
Contract receivables, net
|
15,830
|
24,557
|
||||||
|
Prepaid expenses and other current assets
|
1,703
|
3,699
|
||||||
|
Total current assets
|
31,729
|
43,944
|
||||||
|
Equipment, software and leasehold improvements
|
7,055
|
$
|
7,090
|
|||||
|
Accumulated depreciation
|
(5,229
|
)
|
(5,175
|
)
|
||||
|
Equipment, software and leasehold improvements, net
|
1,826
|
1,915
|
||||||
|
Software development costs, net
|
1,414
|
1,020
|
||||||
|
Goodwill
|
5,612
|
-
|
||||||
|
Intangible assets, net
|
1,279
|
709
|
||||||
|
Long-term restricted cash
|
3,591
|
1,021
|
||||||
|
Other assets
|
548
|
218
|
||||||
|
Total assets
|
$
|
45,999
|
$
|
48,827
|
||||
|
LIABILITIES AND STOCKHOLDERS' EQUITY
|
||||||||
|
Current liabilities:
|
||||||||
|
Line of credit
|
$
|
339
|
$
|
-
|
||||
|
Accounts payable
|
2,330
|
3,554
|
||||||
|
Accrued expenses
|
1,554
|
1,903
|
||||||
|
Accrued compensation and payroll taxes
|
2,595
|
2,497
|
||||||
|
Billings in excess of revenue earned
|
8,684
|
6,545
|
||||||
|
Accrued warranty
|
1,456
|
1,851
|
||||||
|
Current contingent consideration
|
2,842
|
492
|
||||||
|
Other current liabilities
|
473
|
1,111
|
||||||
|
Total current liabilities
|
20,273
|
17,953
|
||||||
|
Contingent consideration
|
1,948
|
409
|
||||||
|
Other liabilities
|
38
|
78
|
||||||
|
Total liabilities
|
22,259
|
18,440
|
||||||
|
Stockholders' equity:
|
||||||||
|
Preferred stock $.01 par value, 2,000,000 shares authorized, shares issued and outstanding none in 2014 and 2013
|
-
|
-
|
||||||
|
Common stock $.01 par value, 30,000,000 shares authorized, shares issued 19,486,770 and 17,887,859 shares outstanding in both 2014 and 2013
|
195
|
195
|
||||||
|
Additional paid-in capital
|
72,917
|
72,205
|
||||||
|
Accumulated deficit
|
(45,142
|
)
|
(38,400
|
)
|
||||
|
Accumulated other comprehensive loss
|
(1,231
|
)
|
(614
|
)
|
||||
|
Treasury stock at cost, 1,598,911 shares in 2014 and 2013
|
(2,999
|
)
|
(2,999
|
)
|
||||
|
Total stockholders' equity
|
23,740
|
30,387
|
||||||
|
Total liabilities and stockholders' equity
|
$
|
45,999
|
$
|
48,827
|
||||
The accompanying notes are an integral part of these consolidated financial statements.
F-3
GSE SYSTEMS, INC. AND SUBSIDIARIES
(in thousands, except per share data)
|
Years ended December 31,
|
||||||||
|
2014
|
2013
|
|||||||
|
Contract revenue
|
$
|
37,930
|
$
|
47,562
|
||||
|
Cost of revenue
|
26,551
|
34,981
|
||||||
|
Write-down of capitalized software development costs
|
-
|
2,174
|
||||||
|
Gross profit
|
11,379
|
10,407
|
||||||
|
Operating expenses
|
||||||||
|
Selling, general and administrative
|
17,570
|
15,836
|
||||||
|
Goodwill impairment loss
|
-
|
4,462
|
||||||
|
Depreciation
|
545
|
570
|
||||||
|
Amortization of definite-lived intangible assets
|
193
|
207
|
||||||
|
Total operating expenses
|
18,308
|
21,075
|
||||||
|
Operating loss
|
(6,929
|
)
|
(10,668
|
)
|
||||
|
Interest income, net
|
143
|
105
|
||||||
|
Gain on derivative instruments, net
|
209
|
265
|
||||||
|
Other income (expense) , net
|
1
|
(67
|
)
|
|||||
|
Loss before income taxes
|
(6,576
|
)
|
(10,365
|
)
|
||||
|
Provision for income taxes
|
166
|
146
|
||||||
|
Net loss
|
$
|
(6,742
|
)
|
$
|
(10,511
|
)
|
||
|
Basic loss per common share
|
$
|
(0.38
|
)
|
$
|
(0.58
|
)
|
||
|
Diluted loss per common share
|
$
|
(0.38
|
)
|
$
|
(0.58
|
)
|
||
The accompanying notes are an integral part of these consolidated financial statements.
F-4
GSE SYSTEMS, INC. AND SUBSIDIARIES
(in thousands)
|
Years ended December 31,
|
||||||||
|
2014
|
2013
|
|||||||
|
Net loss
|
$
|
(6,742
|
)
|
$
|
(10,511
|
)
|
||
|
Foreign currency translation adjustment
|
(617
|
)
|
82
|
|||||
|
Non-cash tax provision
|
-
|
(49
|
)
|
|||||
|
Comprehensive loss
|
$
|
(7,359
|
)
|
$
|
(10,478
|
)
|
||
The accompanying notes are an integral part of these consolidated financial statements.
F-5
GSE SYSTEMS, INC, AND SUBSIDIARIES
(in thousands)
|
Common
Stock
|
Additional
Paid-in
|
Accumulated
|
Accumulated
Other Comprehensive
|
Treasury Stock
|
||||||||||||||||||||||||||||
|
Shares
|
Amount
|
Capital
|
Deficit
|
Loss
|
Shares
|
Amount
|
Total
|
|||||||||||||||||||||||||
|
Balance, December 31, 2012
|
19,435
|
$
|
194
|
$
|
71,352
|
$
|
(27,889
|
)
|
$
|
(647
|
)
|
(1,104
|
)
|
$
|
(2,180
|
)
|
$
|
40,830
|
||||||||||||||
|
Stock-based compensation expense
|
-
|
-
|
810
|
-
|
-
|
-
|
-
|
810
|
||||||||||||||||||||||||
|
Net issuances of stock pursuant to stock compensation plans
|
52
|
1
|
43
|
-
|
-
|
-
|
-
|
44
|
||||||||||||||||||||||||
|
Foreign currency translation adjustment
|
-
|
-
|
-
|
-
|
82
|
-
|
-
|
82
|
||||||||||||||||||||||||
|
Non-cash tax provision
|
-
|
-
|
-
|
-
|
(49
|
)
|
-
|
-
|
(49
|
)
|
||||||||||||||||||||||
|
Treasury stock at cost
|
-
|
-
|
-
|
-
|
-
|
(495
|
)
|
(819
|
)
|
(819
|
)
|
|||||||||||||||||||||
|
Net loss
|
-
|
-
|
-
|
(10,511
|
)
|
-
|
-
|
-
|
(10,511
|
)
|
||||||||||||||||||||||
|
Balance, December 31, 2013
|
19,487
|
$
|
195
|
$
|
72,205
|
$
|
(38,400
|
)
|
$
|
(614
|
)
|
(1,599
|
)
|
$
|
(2,999
|
)
|
$
|
30,387
|
||||||||||||||
|
Stock-based compensation expense
|
-
|
-
|
712
|
-
|
-
|
-
|
-
|
712
|
||||||||||||||||||||||||
|
Foreign currency translation adjustment
|
-
|
-
|
-
|
-
|
(617
|
)
|
-
|
-
|
(617
|
)
|
||||||||||||||||||||||
|
Net loss
|
-
|
-
|
-
|
(6,742
|
)
|
-
|
-
|
-
|
(6,742
|
)
|
||||||||||||||||||||||
|
Balance, December 31, 2014
|
19,487
|
$
|
195
|
$
|
72,917
|
$
|
(45,142
|
)
|
$
|
(1,231
|
)
|
(1,599
|
)
|
$
|
(2,999
|
)
|
$
|
23,740
|
||||||||||||||
The accompanying notes are an integral part of these consolidated financial statements.
F-6
GSE SYSTEMS, INC. AND SUBSIDIARIES
(in thousands)
|
Years ended December 31,
|
||||||||
|
2014
|
2013
|
|||||||
|
Cash flows from operating activities:
|
||||||||
|
Net loss
|
$
|
(6,742
|
)
|
$
|
(10,511
|
)
|
||
|
Adjustments to reconcile net loss to net cash provided by (used in) operating activities:
|
||||||||
|
Goodwill impairment loss
|
-
|
4,462
|
||||||
|
Write-down of capitalized software development costs
|
-
|
2,174
|
||||||
|
Depreciation
|
545
|
570
|
||||||
|
Amortization of definite-lived intangible assets
|
193
|
207
|
||||||
|
Capitalized software amortization
|
252
|
541
|
||||||
|
Amortization of deferred financing costs
|
-
|
10
|
||||||
|
Change in fair value of contingent consideration
|
229
|
254
|
||||||
|
Stock-based compensation expense
|
712
|
810
|
||||||
|
Equity loss on investments
|
55
|
156
|
||||||
|
Gain on derivative instruments
|
(209
|
)
|
(265
|
)
|
||||
|
Deferred income taxes
|
(22
|
)
|
(262
|
)
|
||||
|
Changes in assets and liabilities:
|
||||||||
|
Contract receivables, net
|
10,285
|
(26
|
)
|
|||||
|
Prepaid expenses and other assets
|
2,240
|
204
|
||||||
|
Accounts payable, accrued compensation and accrued expenses
|
(2,136
|
)
|
(1,947
|
)
|
||||
|
Billings in excess of revenue earned
|
2,109
|
531
|
||||||
|
Accrued warranty reserves
|
(395
|
)
|
(256
|
)
|
||||
|
Other liabilities
|
(467
|
)
|
172
|
|||||
|
Net cash provided by (used in) operating activities
|
6,649
|
(3,176
|
)
|
|||||
|
Cash flows from investing activities:
|
||||||||
|
Capital expenditures
|
(398
|
)
|
(399
|
)
|
||||
|
Capitalized software development costs
|
(646
|
)
|
(1,309
|
)
|
||||
|
Investment in GSE-RUS LLC
|
-
|
(46
|
)
|
|||||
|
Investment in IntelliQlik, LLC
|
(250
|
)
|
-
|
|||||
|
Acquisition of Hyperspring, LLC, net of cash acquired
|
(2,848
|
)
|
-
|
|||||
|
Restrictions of cash as collateral under letters of credit
|
(3,172
|
)
|
(228
|
)
|
||||
|
Releases of cash as collateral under letters of credit
|
34
|
1,099
|
||||||
|
Net cash used in investing activities
|
(7,280
|
)
|
(883
|
)
|
||||
|
Cash flows from financing activities:
|
||||||||
|
Payments on line of credit
|
(410
|
)
|
-
|
|||||
|
Proceeds from issuance of common stock
|
-
|
44
|
||||||
|
Treasury stock purchases
|
-
|
(819
|
)
|
|||||
|
Payments of the liability-classified contingent consideration arrangements
|
(500
|
)
|
(1,899
|
)
|
||||
|
Net cash used in financing activities
|
(910
|
)
|
(2,674
|
)
|
||||
|
Effect of exchange rate changes on cash
|
(519
|
)
|
(10
|
)
|
||||
|
Net decrease in cash and cash equivalents
|
(2,060
|
)
|
(6,743
|
)
|
||||
|
Cash and cash equivalents at beginning of year
|
15,643
|
22,386
|
||||||
|
Cash and cash equivalents at end of period
|
$
|
13,583
|
$
|
15,643
|
||||
The accompanying notes are an integral part of these consolidated financial statements.
F-7
GSE SYSTEMS, INC. AND SUBSIDIARIES
December 31, 2014, and 2013
1. Business and Basis of Presentation
GSE Systems, Inc. ("GSE Systems", "GSE" or the "Company") improves human performance through a series of technologies and services that systematically helps clients with everything from recruiting and selecting the right person for the job to training that individual throughout their career from entry-level to expert. We improve plant performance with a combination of engineering, simulation and plant services that help clients get their plants producing revenue faster, running them safely and responsibly decommissioning them.
The Company's operations are subject to certain risks and uncertainties including, among others, rapid technological changes, success of the Company's product development, marketing and distribution strategies, the need to manage growth, the need to retain key personnel and protect intellectual property, and the availability of additional financing on terms acceptable to the Company.
2. Summary of Significant Accounting Policies
Principles of consolidation
The accompanying consolidated financial statements include the accounts of the Company and its wholly-owned subsidiaries. All intercompany balances and transactions have been eliminated.
Accounting estimates
The preparation of financial statements in conformity with accounting principles generally accepted in the United States of America requires management to make estimates and assumptions that affect the reported amounts of assets and liabilities and disclosure of contingent assets and liabilities at the date of the financial statements and the reported amounts of revenue and expenses during the reporting period. On an ongoing basis, the Company evaluates the estimates used, including but not limited to those related to revenue recognition, the allowance for doubtful accounts, estimates of future warranty costs, impairments of goodwill and other intangible assets, valuation of intangible assets acquired and contingent consideration to be paid in business acquisitions, valuation of stock based compensation awards, and income taxes. Actual results could differ from these estimates.
F-8
Revenue recognition
The Company recognizes revenue through (1) fixed price contracts on the sale of uniquely designed systems containing hardware, software and other materials which applies only to the Performance Improvement Solutions segment as well as (2) time and material contracts primarily through staff augmentation support and service agreements.
In accordance with U.S. generally accepted accounting principles, the revenue under fixed-price contracts is accounted for on the percentage-of-completion method. This methodology recognizes revenue and earnings as work progresses on the contract and is based on an estimate of the revenue and earnings earned to date, less amounts recognized in prior periods. The Company bases its estimate of the degree of completion of the contract by reviewing the relationship of costs incurred to date to the expected total costs that will be incurred on the project. Estimated contract earnings are reviewed and revised periodically as the work progresses, and the cumulative effect of any change in estimate is recognized in the period in which the change is identified. Estimated losses are charged against earnings in the period such losses are identified. The Company recognizes revenue arising from contract claims either as income or as an offset against a potential loss only when the amount of the claim can be estimated reliably and realization is probable and there is a legal basis of the claim.
As the Company recognizes revenue under the percentage-of-completion method, it provides an accrual for estimated future warranty costs based on historical and projected claims experience. The Company's long-term contracts generally provide for a one-year warranty on parts, labor and any bug fixes as it relates to software embedded in the systems.
The Company's system design contracts do not normally provide for "post customer support service" (PCS) in terms of software upgrades, software enhancements or telephone support. In order to obtain PCS, the customers must normally purchase a separate contract. Such PCS arrangements are generally for a one-year period renewable annually and include customer support, unspecified software upgrades, and maintenance releases. The Company recognizes revenue from these contracts ratably over the life of the agreements.
Revenue from the sale of software licenses which do not require significant modifications or customization for the Company's modeling tools are recognized when the license agreement is signed, the license fee is fixed and determinable, delivery has occurred, and collection is considered probable.
We evaluate our contracts for multiple deliverables under ASC 605-25 Revenue Recognition-Multiple Element Arrangements, and when appropriate, separate the contracts into separate units of accounting for revenue recognition. Contracts with multiple element arrangements typically include, but are not limited to, components such as training, licenses, and PCS, as described above, embedded in the agreement. When a contract contains multiple deliverables, the Company allocates revenue to each deliverable based on its relative selling price which is determined based on its vendor specific objective evidence ("VSOE") if available, third party evidence ("TPE") if VSOE is not available, or estimated selling price if neither VSOE nor TPE is available. Amounts allocated to training and support services are based on VSOE and revenue is deferred until the services have been performed. Amounts allocated to software licenses are also based on VSOE. Revenue related to software licenses is recognized once the license has been delivered.
The Company recognizes revenue under time and materials contracts primarily from staff augmentation and certain consulting agreements. Revenue on time and material contracts is recognized as services are rendered and performed. Under a typical time-and-materials billing arrangement, customers are billed on a regularly scheduled basis, such as biweekly or monthly. At the end of each accounting period, revenue is estimated and accrued for services performed since the last billing cycle. These unbilled amounts are billed the following month.
F-9
Cash and cash equivalents
Cash and cash equivalents consist of cash on hand and highly liquid investments with maturities of three months or less at the date of purchase.
The Company had $7.5 million and $9.5 million deposited in an unrestricted money market account with Susquehanna Bank on December 31, 2014 and 2013, respectively.
Restricted Cash
Restricted cash consists of the cash collateralization of our outstanding letters of credit used for various advance payment, bid, surety and performance bonds, and negative foreign exchange positions which have been segregated into restricted money market accounts with Susquehanna Bank. Susquehanna has complete and unconditional control over the restricted money market accounts.
At December 31, 2014 and 2013, the Company had approximately$4.2 million, and $1.1 million, respectively, of cash in escrow accounts with Susquehanna. The restricted cash balance has been classified within the Consolidated Balance Sheet as follows; $613,000 of current assets, and $3.6 million of long term assets at December 31, 2014, respectively, compared to $45,000 of current assets and $1.0 million of long-term assets at December 31, 2013. The Company recorded interest income of $7,000 and $8,000 from the escrow accounts in the years ended December 31, 2014 and 2013, respectively. The interest earned on these restricted funds is added to the restricted cash balance. We classify the restriction and release of the cash collateralization of our outstanding letters of credit as an investing activity within the consolidated statement of cash flows, as these deposits are not related to borrowings against our line of credit.
Contract receivables
Contract receivables include recoverable costs and accrued profit not billed which represents revenue recognized in excess of amounts billed. The liability "Billings in excess of revenue earned" represents billings in excess of revenue recognized.
Billed receivables are recorded at invoiced amounts. The allowance for doubtful accounts is based on historical trends of past due accounts, write-offs, and specific identification and review of customer accounts.
The activity in the allowance for doubtful accounts is as follows:
|
(in thousands)
|
As of and for the
|
|||||||
|
Years ended December 31,
|
||||||||
|
2014
|
2013
|
|||||||
|
Beginning balance
|
$
|
2
|
$
|
2
|
||||
|
Current year provision
|
22
|
38
|
||||||
|
Acquired allowance for doubtful accounts
|
20
|
-
|
||||||
|
Current year write-offs
|
(22
|
)
|
(38
|
)
|
||||
|
Ending balance
|
$
|
22
|
$
|
2
|
||||
Equipment, software and leasehold improvements, net
Equipment and purchased software are recorded at cost and depreciated using the straight-line method with estimated useful lives ranging from three to ten years. Leasehold improvements are amortized over the life of the lease or the estimated useful life, whichever is shorter, using the straight-line method. Upon sale or retirement, the cost and related depreciation are eliminated from the respective accounts and any resulting gain or loss is included in operations. Maintenance and repairs are charged to expense as incurred.
F-10
Software development costs
Certain computer software development costs are capitalized in the accompanying consolidated balance sheets in accordance with U.S. generally accepted accounting principles. Capitalization of computer software development costs begins upon the establishment of technological feasibility. Capitalization ceases and amortization of capitalized costs begins when the software product is commercially available for general release to customers. Amortization of capitalized computer software development costs is included in cost of revenue and is determined using the straight-line method over the remaining estimated economic life of the product, typically three years. On an annual basis, and more frequently as conditions indicate, the Company assesses the recovery of the unamortized software development costs by estimating the net undiscounted cash flows expected to be generated by the sale of the product. If the undiscounted cash flows are not sufficient to recover the unamortized software costs the Company will write-down the investment to its estimated fair value based on the future undiscounted cash flows. The excess of any unamortized computer software costs over the related net realizable value is written down and charged to operations.
During the second quarter of 2013, the Company incurred a charge of $2.2 million related to the write-down of certain capitalized software development costs based on the net realizable value analysis performed in conjunction with our goodwill impairment test.
Development expenditures
Development expenditures incurred to meet customer specifications under contracts are charged to contract costs. Company sponsored development expenditures are either charged to operations as incurred and are included in selling, general and administrative expenses or are capitalized as software development costs. See Note 8, Software development costs. The amounts incurred for Company sponsored development activities relating to the development of new products and services or the improvement of existing products and services, were approximately $3.8 million and $2.9 million for the years ended December 31, 2014, and 2013, respectively.
Impairment of long-lived assets
Long-lived assets, such as equipment, software, capitalized computer software costs subject to amortization, and intangibles subject to amortization, are reviewed for impairment whenever events or changes in circumstances indicate that the carrying amount of an asset may not be recoverable. Recoverability of assets to be held and used is measured by a comparison of the carrying amount of an asset to estimated undiscounted future cash flows expected to be generated by the asset. If the carrying amount of an asset exceeds its estimated future cash flows, an impairment charge is recognized at the amount by which the carrying amount of the asset exceeds the fair value of the asset. Assets to be disposed of would be separately presented in the balance sheet and reported at the lower of the carrying amount or fair value less costs to sell, and would no longer be depreciated.
F-11
Goodwill and Intangible Assets
The Company's intangible assets include amounts recognized in connection with business acquisitions, including customer relationships, contract backlog and software. Intangible assets are initially valued at fair market value using generally accepted valuation methods appropriate for the type of intangible asset. Amortization is recognized on a straight-line basis over the estimated useful life of the intangible assets, except for contract backlog and contractual customer relationships which are recognized in proportion to the related projected revenue streams. Intangible assets with definite lives are reviewed for impairment if indicators of impairment arise. The Company does not have any intangible assets with indefinite useful lives.
We review goodwill for impairment annually as of November 30 and whenever events or changes in circumstances indicate the carrying value of goodwill may not be recoverable in accordance with Accounting Standards Update ("ASU") number 2011-08 and Accounting Standards Codification 350, Intangibles — Goodwill and Other (ASC 350).
ASU number 2011-08 outlines the qualitative assessment (i.e., the "Step 0 Test") as a precursor to the traditional two-step quantitative process. The Step 0 Test effectively modifies Accounting Standards Codification ("ASC") 350-20-35, Goodwill – Subsequent Measurement. In general, the Step 0 Test allows an entity to first assess qualitative factors to determine whether it is more likely than not (i.e., more than 50%) that the Fair Value of a reporting unit is less than its carrying value. In order to make this evaluation, the FASB outlines relevant examples and circumstances to consider, including:
|
·
|
General macroeconomic conditions,
|
|
·
|
Industry and market conditions,
|
|
·
|
Changes in cost factors,
|
|
·
|
Overall financial performance,
|
|
·
|
Entity and reporting unit specific events, etc.
|
If the qualitative factors outlined in the Step 0 Test indicates that the Fair Value of a reporting unit is greater than its carrying value, than no additional testing is performed. If the Step 0 Test indicates the Fair Value of a reporting unit is less than its carrying value, we perform the additional impairment test in accordance with the provisions of ASC 350.
The provisions of ASC 350 require that we perform a two-step impairment test on goodwill. In the first step, we compare the fair value of our reporting unit to its carrying value. The Company has two reporting units. If the fair value of the reporting unit exceeds the carrying value of the net assets assigned to that unit, goodwill is not impaired and we are not required to perform further testing. If the carrying value of the net assets assigned to the reporting unit exceeds the fair value of the reporting unit, then we must perform the second step of the impairment test in order to determine the implied fair value of the reporting unit's goodwill. The implied fair value of goodwill is determined by allocating the fair value of the reporting unit's assets and liabilities in a manner similar to a purchase price allocation, with any residual fair value allocated to goodwill. If the carrying value of the reporting unit's goodwill exceeds its implied fair value, then we record an impairment loss equal to the difference. Refer to Note 4, Goodwill and Intangible Assets, for information on the $4.5 million goodwill impairment loss taken during 2013. No impairment losses were recognized during 2014.
F-12
Foreign currency translation
Balance sheet accounts for foreign operations are translated at the exchange rate as of the balance sheet date, and income statement accounts are translated at the average exchange rate for the period. The resulting translation adjustments are included in accumulated other comprehensive loss. Transaction gains and losses, resulting from changes in exchange rates, are recorded in operating income in the period in which they occur. For the years ended December 31, 2014, and 2013, foreign currency transaction losses were approximately $180,000, and $111,000, respectively.
Accrued Warranty
As the Company recognizes revenue under the percentage-of-completion method, it provides an accrual for estimated future warranty costs based on historical experience and projected claims.
The activity in the accrued warranty accounts is as follows:
|
(in thousands)
|
As of and for the
|
|||||||
|
Years ended December 31,
|
||||||||
|
2014
|
2013
|
|||||||
|
Beginning balance
|
$
|
1,851
|
$
|
2,107
|
||||
|
Current year provision
|
660
|
809
|
||||||
|
Current year claims
|
(1,025
|
)
|
(1,065
|
)
|
||||
|
Currency adjustment
|
(30
|
)
|
-
|
|||||
|
Ending balance
|
$
|
1,456
|
$
|
1,851
|
||||
Income taxes
Income taxes are provided under the asset and liability method. Under this method, deferred income taxes are determined based on the differences between the financial statement and tax bases of assets and liabilities using enacted tax rates in effect for the year in which the differences are expected to reverse. Valuation allowances are established, when necessary, to reduce deferred tax assets to the amounts expected to be realized. A provision is made for the Company's current liability for federal, state and foreign income taxes and the change in the Company's deferred income tax assets and liabilities.
We establish accruals for uncertain tax positions taken or expected to be taken in a tax return when it is more likely than not (i.e., a likelihood of more than fifty percent) that the position would be sustained upon examination by tax authorities that have full knowledge of all relevant information. A recognized tax position is then measured at the largest amount of benefit that is greater than fifty percent likely of being realized upon ultimate settlement. Favorable or unfavorable adjustment of the accrual for any particular issue would be recognized as an increase or decrease to income tax expense in the period of a change in facts and circumstances. Interest and penalties related to income taxes are accounted for as income tax expense.
F-13
Stock-based compensation
Compensation expense related to share based awards is recognized on a pro rata straight-line basis based on the value of share awards that are scheduled to vest during the requisite service period. During the twelve months ended December 31, 2014, and 2013 the Company recognized $712,000, and $810,000, respectively, of pre-tax stock-based compensation expense under the fair value method. As of December 31, 2014, the Company had $0.7 million of unrecognized compensation expense related to the unvested portion of outstanding stock option awards expected to be recognized through November 2016.
Loss per share
Basic loss per share is based on the weighted average number of outstanding common shares for the period. Diluted loss per share adjusts the weighted average shares outstanding for the potential dilution that could occur if stock options or warrants were exercised.
The number of common shares and common share equivalents used in the determination of basic and diluted loss per share were as follows:
|
Years ended December 31,
|
||||||||
|
2014
|
2013
|
|||||||
|
Numerator:
|
||||||||
|
Net loss attributed to common stockholders
|
$
|
(6,742
|
)
|
$
|
(10,511
|
)
|
||
|
Denominator:
|
||||||||
|
Weighted-average shares outstanding for basic earnings per share
|
17,887,859
|
18,150,915
|
||||||
|
Effect of dilutive securities:
|
||||||||
|
Employee stock options and warrants
|
-
|
-
|
||||||
|
Adjusted weighted-average shares outstanding and assumed conversions for diluted earnings per share
|
17,887,859
|
18,150,915
|
||||||
|
Shares related to dilutive securities excluded because inclusion would be anti-dilutive
|
2,811,709
|
2,919,521
|
||||||
Conversion of outstanding stock options and warrants was not assumed for the years ended December 31, 2014 and 2013 because the impact was anti-dilutive.
F-14
Concentration of credit risk
The Company is subject to concentration of credit risk with respect to contract receivables. Credit risk on contract receivables is mitigated by the nature of the Company's worldwide customer base and its credit policies. The Company's customers are not concentrated in any specific geographic region, but are concentrated in the energy industry. The following customers have provided more than 10% of the Company's consolidated contract receivables for the indicated periods:
|
December 31,
|
|||
|
2014
|
2013
|
||
|
State Nuclear Power Automation System Engineering Co.
|
10.2%
|
5.9%
|
|
|
Slovenské elektrárne, a.s.
|
1.9%
|
35.9%
|
|
Fair values of financial instruments
The carrying amounts of current assets and current liabilities reported in the consolidated balance sheets approximate fair value due to their short term duration.
Contingent consideration for business acquisitions
Acquisitions may include contingent consideration payments based on future financial measures of an acquired company. Contingent consideration is required to be recognized at fair value as of the acquisition date. We estimate the fair value of these liabilities based on financial projections of the acquired companies and estimated probabilities of achievement. At each reporting date, the contingent consideration obligation is revalued to estimated fair value and changes in fair value subsequent to the acquisition are reflected in income or expense in the consolidated statements of operations, and could cause a material impact to our operating results. Changes in the fair value of contingent consideration obligations may result from changes in discount periods and rates, changes in the timing and amount of revenue and/or earnings estimates and changes in probability assumptions with respect to the likelihood of achieving the various earn-out criteria.
Deferred financing fees
The Company amortizes the cost incurred to obtain debt financing using the straight-line method over the term of the underlying obligations. The amortization of deferred financing costs is included in interest expense. The Company recognized $10,000 of expense related to the amortization of deferred financing costs during the year ended December 31, 2013. The Company recognized no amortization of deferred financing costs during the year ended December 31, 2014.
F-15
Derivative instruments
The Company utilizes forward foreign currency exchange contracts to manage market risks associated with the fluctuations in foreign currency exchange rates. It is the Company's policy to use such derivative financial instruments to protect against market risk arising in the normal course of business in order to reduce the impact of these exposures. The Company minimizes credit exposure by limiting counterparties to nationally recognized financial institutions.
As of December 31, 2014, the Company had foreign exchange contracts outstanding of approximately 0.3 million Pounds Sterling, 1.4 million Euro, 0.8 million Australian Dollars, and 0.5 million Malaysian Ringgits. At December 31, 2013, the Company had foreign exchange contracts outstanding of approximately 0.2 million Pounds Sterling, 13.3 million Euro, and 10.1 million Japanese Yen at fixed rates. The contracts expire on various dates through November 2016. The Company had not designated the foreign exchange contracts as hedges and had recorded the estimated fair value of the contracts in the consolidated balance sheet as follows:
|
December 31,
|
||||||||
|
(in thousands)
|
2014
|
2013
|
||||||
|
Asset derivatives
|
||||||||
|
Prepaid expenses and other current assets
|
$
|
71
|
$
|
140
|
||||
|
Other assets
|
21
|
2
|
||||||
|
92
|
142
|
|||||||
|
Liability derivatives
|
||||||||
|
Other current liabilities
|
(23
|
)
|
(637
|
)
|
||||
|
Other liabilities
|
(1
|
)
|
(18
|
)
|
||||
|
(24
|
)
|
(655
|
)
|
|||||
|
Net fair value
|
$
|
68
|
$
|
(513
|
)
|
|||
The changes in the fair value of the foreign exchange contracts are included in gain on derivative instruments in the consolidated statements of operations.
The foreign currency denominated trade receivables, unbilled receivables, billings in excess of revenue earned and subcontractor accruals that are related to the outstanding foreign exchange contracts are remeasured at the end of each period into the functional currency using the current exchange rate at the end of the period. The gain or loss resulting from such remeasurement is also included in gain on derivative instruments in the consolidated statement of operations.
For the years ended December 31, 2014, and 2013, the Company recognized a net gain on its derivative instruments as outlined below:
|
Years ended December 31,
|
||||||||
|
(in thousands)
|
2014
|
2013
|
||||||
|
Foreign exchange contracts- change in fair value
|
$
|
365
|
$
|
(489
|
)
|
|||
|
Remeasurement of related contract receivables and billings in excess of revenue earned
|
(156
|
)
|
754
|
|||||
|
$
|
209
|
$
|
265
|
|||||
F-16
Reclassifications
Certain prior year amounts have been reclassified to conform with the current year presentation.
Recently Issued Accounting Pronouncements Not Yet Adopted
In May 2014, the Financial Accounting Standards Board ("FASB") issued Accounting Standards Update ("ASU") 2014-09, Revenue from Contracts with Customers, which provides guidance for revenue recognition. The standard's core principle is that a company will recognize revenue when it transfers promised goods or services to customers in an amount that reflects the consideration to which the company expects to be entitled in exchange for those goods or services. In doing so, companies will need to use more judgment and make more estimates than under today's guidance. These may include identifying performance obligations in the contract, estimating the amount of variable consideration to include in the transaction price and allocating the transaction price to each separate performance obligation. This guidance will be effective for the Company in the first quarter of its fiscal year ending December 31, 2017, and interim periods therein, using either of the following transition methods: (i) a full retrospective approach reflecting the application of the standard in each prior reporting period with the option to elect certain practical expedients, or (ii) a retrospective approach with the cumulative effect of initially adopting ASU 2014-09 recognized at the date of adoption (which includes additional footnote disclosures). The Company is currently in the process of evaluating the impact of its pending adoption of this ASU on the Company's combined financial statements and has not yet determined the method by which it will adopt the standard in 2017.
F-17
3. Acquisitions
Hyperspring, LLC
On November 14, 2014, (the "Closing Date") the Company, through its operating subsidiary, GSE Power Systems, Inc. ("GSE Power"), acquired Hyperspring, LLC ("Hyperspring") pursuant to a Membership Interests Purchase Agreement ("Purchase Agreement") with the sellers of Hyperspring ("Sellers"). Hyperspring, headquartered in Huntsville, Alabama, specializes in training and development, plant operations support services, and staff augmentation, primarily in the United States nuclear industry. Hyperspring operates as a wholly-owned subsidiary of GSE Power. The purchase price allocation included customer relationship intangible assets valued at $779,000 which are being amortized over seven years.
GSE Power paid the Sellers an aggregate of $3.0 million in cash at the closing date. Hyperspring is in the process of bidding on a renewal of its current contract with the Tennessee Valley Authority ("TVA"). If Hyperspring is successful in renewing the TVA contract for substantially the same scope as currently being provided and at a profit margin that is greater than 15% on or before May 15, 2015, GSE will pay the Hyperspring members an additional $1.2 million. In addition, GSE Power may be required, pursuant to the terms of the Purchase Agreement, to pay the Sellers up to an additional an additional $7.2 million if Hyperspring attains certain EBITDA (earnings before interest, taxes, depreciation and amortization) targets for the three-year period ending November 13, 2017. However, if Hyperspring is not successful in renewing the TVA contracts, GSE may still be required to pay the Sellers up to an additional $8.4 million if Hyperspring attains certain EBITDA (earnings before interest, taxes, depreciation and amortization) targets for the three-year period ending November 13, 2017. Whether or not the TVA contract is renewed the total cash paid to the Hyperspring members may total $11.4 million.
In conjunction with the Hyperspring acquisition, GSE Power invested $250,000 for a 50% interest in IntelliQlik, LLC ("IntelliQlik") and is obligated to contribute an additional $250,000 upon the attainment by IntelliQlik of certain milestones. IntelliQlik is jointly owned by GSE Power and a former member of Hyperspring. See Note 17 in the Notes to Consolidated Financial Statements in Item 8 for further discussion related to IntelliQlik.
To assist our clients in creating world-class internal training and performance improvement programs, GSE is building an E2E (Entry2Expert) Performance Solution. The Performance Solution includes a set of integrated and scalable products and services that provide a structured training program, from employee selection and onboarding through continuous skills improvement for experienced employees. The Hyperspring acquisition, through its staff of instructors, engineers and specialist, and the IntelliQlik training platform, once completed, will increase the breadth of solutions that GSE can offer within the E2E Performance Solution program.
Hyperspring's results of operations are included in the consolidated financial statements for the period beginning November 14, 2014.
F-18
The following table summarizes the purchase price and purchase price allocation for the acquisition of Hyperspring, LLC, acquired on November 14, 2014.
|
(Dollars in thousands)
|
||||
|
Hyperspring, LLC
|
||||
|
Cash purchase price
|
$
|
3,000
|
||
|
Fair value of contingent consideration
|
3,953
|
|||
|
Total purchase price
|
$
|
6,953
|
||
|
Purchase price allocation:
|
||||
|
Cash
|
$
|
152
|
||
|
Contract receivables
|
1,719
|
|||
|
Prepaid expenses and other current assets
|
23
|
|||
|
Property and equipment, net
|
12
|
|||
|
Intangible assets
|
779
|
|||
|
Goodwill
|
5,612
|
|||
|
Total assets
|
8,297
|
|||
|
Line of credit
|
749
|
|||
|
Accounts payable, accrued expenses, and other liabilities
|
586
|
|||
|
Billings in excess of revenue earned
|
9
|
|||
|
Total liabilities
|
1,344
|
|||
|
Net assets acquired
|
$
|
6,953
|
||
Pro forma results. Our consolidated financial statements include the operating results of Hyperspring as of the date of acquisition. For the twelve months ended December 31, 2014 and 2013, the unaudited pro forma financial information below assumes that our material business acquisition of Hyperspring occurred on January 1, 2013.
|
(in thousands except per share data)
|
(unaudited)
|
|||||||
|
Year ended
|
||||||||
|
December 31,
|
||||||||
|
Pro forma financial information including the acquisition of Hyperspring
|
2014
|
2013
|
||||||
|
Revenue
|
$
|
53,611
|
$
|
66,587
|
||||
|
Operating loss
|
(6,149
|
)
|
(10,534
|
)
|
||||
|
Net loss
|
(5,977
|
)
|
(1,711
|
)
|
||||
|
Loss per common share — basic
|
$
|
(0.33
|
)
|
$
|
(0.57
|
)
|
||
|
Loss per common share — diluted
|
$
|
(0.33
|
)
|
$
|
(0.57
|
)
|
||
F-19
Contingent Consideration
ASC Topic 805 requires that contingent consideration be recognized at fair value on the acquisition date and be re-measured each reporting period with subsequent adjustments recognized in the consolidated statement of operations. We estimate the fair value of contingent consideration liabilities based on financial projections of the acquired companies and estimated probabilities of achievement and discount the liabilities to present value using a weighted-average cost of capital. Contingent consideration is valued using significant inputs that are not observable in the market which are defined as Level 3 inputs pursuant to fair value measurement accounting. We believe our estimates and assumptions are reasonable, however, there is significant judgment involved. At each reporting date, the contingent consideration obligation is revalued to estimated fair value, and changes in fair value subsequent to the acquisitions are reflected in income or expense in the consolidated statements of operations, and could cause a material impact to, and volatility in, our operating results. Changes in the fair value of contingent consideration obligations may result from changes in discount periods, changes in the timing and amount of revenue and/or earnings estimates and changes in probability assumptions with respect to the likelihood of achieving the various earn-out criteria.
As of December 31, 2014 and 2013, contingent consideration included in the other current liabilities on the consolidated balance sheet totaled $2.8 million and $492,000, respectively. As of December 31, 2014 and 2013, we also had accrued contingent consideration totaling $1.9 million and $409,000, respectively, which is included in other long-term liabilities on the consolidated balance sheet and represents the portion of contingent consideration estimated to be payable greater than twelve months from the balance sheet date.
|
(in thousands)
|
||||||||
|
December 31,
|
||||||||
|
2014
|
2013
|
|||||||
|
Hyperspring, LLC
|
$
|
2,152
|
$
|
-
|
||||
|
IntelliQlik, LLC
|
213
|
-
|
||||||
|
EnVision Systems, Inc.
|
477
|
492
|
||||||
|
Current contingent consideration
|
2,842
|
492
|
||||||
|
Hyperspring, LLC
|
1,948
|
-
|
||||||
|
EnVision Systems, Inc.
|
-
|
409
|
||||||
|
Contingent consideration
|
$
|
1,948
|
$
|
409
|
||||
F-20
4. Goodwill and Intangible Assets
Goodwill
Changes in the carrying amount of goodwill for the years ended December 31, 2014 and 2013 were as follows (in thousands):
|
Net book value at December 31, 2012
|
$
|
4,502
|
||
|
2013 Activity
|
||||
|
Goodwill impairment loss
|
(4,462
|
)
|
||
|
Foreign currency translation
|
(40
|
)
|
||
|
Net book value at December 31, 2013
|
$ |
-
|
||
|
2014 Activity
|
||||
|
Acquisition
|
5,612
|
|||
|
Net book value at December 31, 2014
|
$
|
5,612
|
||
We review goodwill for impairment annually as of November 30 and whenever events or changes in circumstances indicate the carrying value of an asset may not be recoverable. We test goodwill at the reporting unit level. A reporting unit is an operating segment, or one level below an operating segment, as defined by U.S. generally accepted accounting principles. After the acquisition of Hyperspring, LLC ("Hyperspring") on November 14, 2014, our reporting units are: (i) Performance Improvement Solutions and (ii) Staff Augmentation. At December 31, 2014, the total $5.6 million balance of goodwill was represented by Hyperspring or our Staff Augmentation segment.
Accounting Standards Update ("ASU") 2011-08, Testing Goodwill for Impairment ("ASU 2011-08") permits an entity to first assess qualitative factors to determine whether it is more likely than not that the fair value of a reporting unit is less than its carrying amount as a basis for determining whether it is necessary to perform the two-step goodwill impairment test. Under ASU 2011-08, an entity is not required to perform step one of the goodwill impairment test for a reporting unit if it is more likely than not that its fair value is greater than its carrying amount. For our annual goodwill impairment test, we performed a qualitative assessment as permitted by ASU 2011-08 for the Staff Augmentation reporting unit. Based on the reporting unit's positive revenue, order and gross margin results since the acquisition, we determined that it was more likely than not that the fair values of each of our reporting units exceeded their respective carrying values.
Based upon indicators of impairment in the second quarter of 2013, which included a substantial decrease in the Company's market capitalization following the announcement of the Company's first quarter 2013 earnings, and significantly lower than projected revenue and profits as a result of a change in market conditions, the Company performed an interim impairment test as of June 30, 2013.
The fair value of our reporting unit was estimated using a combination of appropriately weighted income and market approaches. The cash flows employed in the income approach were based on our most recent forecasts and business plans developed in the second quarter of 2013, as well as various growth rate assumptions for the years beyond the current business plan period, discounted using an estimated weighted average cost of capital ("WACC"). The WACC is comprised of (1) a risk free rate of return, (2) an equity and size risk premium that is based on the rate of return on equity of publicly traded companies with business characteristics comparable to our reporting unit, (3) the current after-tax market rate of return on debt of companies with business characteristics similar to our reporting unit, each weighted by the relative market value percentages of our equity and debt, and (4) an industry and specific company risk factor.
The results of the ASC 350 Step 1 goodwill impairment analysis indicated that the estimated fair value of our reporting unit was less than the carrying value. The reporting unit was unfavorably impacted by a combination of lower current and projected cash flows. Because our reporting unit's fair value estimate was lower than its carrying value, we applied the second step of the goodwill test, in accordance with ASC 350.
The second step of the goodwill impairment analysis indicated that the carrying values of the goodwill associated with the reporting unit exceeded its implied fair value resulting in a $4.5 million non-deductible goodwill impairment charge. As a result of the analysis, the company recorded a full impairment loss. The impairment was non-cash in nature and did not affect the Company's current liquidity, and did not impact the debt covenants under the Company's existing credit facility.
F-21
Intangible Assets Subject to Amortization
The following table shows the gross carrying amount and accumulated amortization of definite-lived intangibles related to continuing operations:
|
(in thousands)
|
As of December 31, 2014
|
|||||||||||
|
Gross Carrying Amount
|
Accumulated Amortization
|
Net
|
||||||||||
|
Amortized intangible assets:
|
||||||||||||
|
Customer relationships
|
$
|
1,425
|
$
|
(695
|
)
|
$
|
730
|
|||||
|
Non-contractual customer relationships
|
911
|
(618
|
)
|
293
|
||||||||
|
Developed technology
|
471
|
(236
|
)
|
235
|
||||||||
|
In process research and development
|
152
|
(136
|
)
|
16
|
||||||||
|
Contract backlog
|
36
|
(36
|
)
|
-
|
||||||||
|
Trade names and other
|
29
|
(29
|
)
|
-
|
||||||||
|
Foreign currency translation
|
7
|
(2
|
)
|
5
|
||||||||
|
Total
|
$
|
3,031
|
$
|
(1,752
|
)
|
$
|
1,279
|
|||||
|
(in thousands)
|
As of December 31, 2013
|
|||||||||||
|
Gross Carrying Amount
|
Accumulated Amortization
|
Net
|
||||||||||
|
Amortized intangible assets:
|
||||||||||||
|
Customer relationships
|
$
|
646
|
$
|
(646
|
)
|
$
|
-
|
|||||
|
Non-contractual customer relationships
|
911
|
(557
|
)
|
354
|
||||||||
|
Developed technology
|
471
|
(177
|
)
|
294
|
||||||||
|
In process research and development
|
152
|
(127
|
)
|
25
|
||||||||
|
Contract backlog
|
36
|
(36
|
)
|
-
|
||||||||
|
Trade names and other
|
29
|
(29
|
)
|
-
|
||||||||
|
Foreign currency translation
|
52
|
(16
|
)
|
36
|
||||||||
|
Total
|
$
|
2,297
|
$
|
(1,588
|
)
|
$
|
709
|
|||||
Amortization is recognized on a straight-line basis over the estimated useful life of the intangible assets, except for contractual customer relationships and contract backlog, which is recognized in proportion to the related projected revenue streams. The Company reviews specific definite-lived intangibles for impairment when events occur that may impact their value in accordance with the respective accounting guidance for long-lived assets. There were no impairment charges recorded for the years ended December 31, 2014, and 2013.
Amortization expense related to definite-lived intangible assets totaled $193,000, and $207,000 for the years ended December 31, 2014, and 2013, respectively. The following table shows the estimated amortization expense of the definite-lived intangible assets for the next five years and thereafter:
|
(in thousands)
|
||||
|
Fiscal year ending:
|
||||
|
2015
|
$
|
494
|
||
|
2016
|
296
|
|||
|
2017
|
207
|
|||
|
2018
|
160
|
|||
|
2019
|
74
|
|||
|
Thereafter
|
48
|
|||
|
$
|
1,279
|
|||
F-22
5. Contract Receivables
Contract receivables represent balances due from a broad base of both domestic and international customers. All contract receivables are considered to be collectible within twelve months. Recoverable costs and accrued profit not billed represent costs incurred and associated profit accrued on contracts that will become billable upon future milestones or completion of contracts. The components of contract receivables are as follows:
|
(in thousands)
|
December 31,
|
|||||||
|
2014
|
2013
|
|||||||
|
Billed receivables
|
$
|
10,792
|
$
|
19,040
|
||||
|
Recoverable costs and accrued profit not billed
|
5,060
|
5,519
|
||||||
|
Allowance for doubtful accounts
|
(22
|
)
|
(2
|
)
|
||||
|
Total contract receivables, net
|
$
|
15,830
|
$
|
24,557
|
||||
6. Prepaid Expenses and Other Current Assets
Prepaid expenses and other current assets consist of the following:
|
(in thousands)
|
December 31,
|
|||||||
|
2014
|
2013
|
|||||||
|
Prepaid expenses
|
$
|
539
|
$
|
630
|
||||
|
Deferred income taxes- current
|
27
|
13
|
||||||
|
Value added tax receivable
|
533
|
409
|
||||||
|
Receivable from sale of 49% stake in GSE-UNIS
|
-
|
1,183
|
||||||
|
Other current assets
|
604
|
1,464
|
||||||
|
Total
|
$
|
1,703
|
$
|
3,699
|
||||
In 2013, the Company agreed to sell its 49% stake in GSE-UNIS Simulation Technology Co., Ltd ("GSE-UNIS") to its partner, Beijing Unis Venture Capital Co., Ltd. and terminate the joint venture agreement as of July 31, 2013. The sales price was basically equivalent to the Company's investment in GSE-UNIS as of the closing date.
F-23
7. Equipment, Software and Leasehold Improvements
Equipment, software and leasehold improvements consist of the following:
|
(in thousands)
|
December 31,
|
|||||||
|
2014
|
2013
|
|||||||
|
Computer equipment
|
$
|
3,235
|
$
|
3,304
|
||||
|
Software
|
1,429
|
1,348
|
||||||
|
Leasehold improvements
|
543
|
446
|
||||||
|
Furniture and fixtures
|
1,848
|
1,992
|
||||||
|
7,055
|
7,090
|
|||||||
|
Accumulated depreciation
|
(5,229
|
)
|
(5,175
|
)
|
||||
|
Equipment, software and leasehold improvements, net
|
$
|
1,826
|
$
|
1,915
|
||||
Depreciation expense was $545,000 and $570,000 for the years ended December 31, 2014 and 2013, respectively.
8. Software Development Costs, net
Software development costs, net consist of the following:
|
(in thousands)
|
December 31,
|
|||||||
|
2014
|
2013
|
|||||||
|
Beginning Balance
|
$
|
1,020
|
$
|
2,426
|
||||
|
Additions
|
646
|
1,309
|
||||||
|
Amortization
|
(252
|
)
|
(541
|
)
|
||||
|
Impairments
|
-
|
(2,174
|
)
|
|||||
|
Ending Balance
|
$
|
1,414
|
$
|
1,020
|
||||
Software development costs capitalized were $0.6 million and $1.3 million for the years ended December 31, 2014 and 2013, respectively. Amortization of software development costs capitalized was $252,000 and $541,000 for the years ended December 31, 2014 and 2013, respectively, and was included in cost of revenue.
During the second quarter of 2013, the Company incurred an impairment charge of $2.2 million related to the write-down of certain capitalized software development costs based on the net realizable value analysis.
F-24
9. Fair Value of Financial Instruments
ASC 820 Fair Value Measurements and Disclosures defines fair value as the exchange price that would be received for an asset or paid to transfer a liability (an exit price) in the principle or most advantageous market for the asset or liability in an orderly transaction between market participants on the measurement date. ASC 820 also establishes a fair value hierarchy which requires an entity to maximize the use of observable inputs and minimize the use of unobservable inputs when measuring fair value.
The levels of the fair value hierarchy established by ASC 820 are:
Level 1: inputs are quoted prices, unadjusted, in active markets for identical assets or liabilities that the reporting entity has the ability to access at the measurement date.
Level 2: inputs are other than quoted prices included within Level 1 that are observable for the asset or liability, either directly or indirectly. A Level 2 input must be observable for substantially the full term of the asset or liability.
Level 3: inputs are unobservable and reflect the reporting entity's own assumptions about the assumptions that market participants would use in pricing the asset or liability.
The Company considers the recorded value of certain of its financial assets and liabilities, which consist primarily of cash equivalents, accounts receivable and accounts payable, to approximate the fair value of the respective assets and liabilities at December 31, 2014 and December 31, 2013 based upon the short-term nature of the assets and liabilities.
The Company had $7.5 million and $9.5 million deposited in an unrestricted money market account with Susquehanna Bank on December 31, 2014 and 2013, respectively.
As of December 31, 2014, the Company was contingently liable for twelve standby letters of credit and one surety bonds totaling $4.2 million which represent advance payment and performance bonds on eleven contracts. The Company has deposited the full value of eleven standby letters of credit, $4.2 million, into money market escrow accounts which have been restricted in that the Company does not have access to these funds until the related letters of credit have expired. The cash has been recorded on the Company's balance sheet at December 31, 2014 as restricted cash and long-term restricted cash depending on the expiration date of the underlying letters of credit.
F-25
The following table presents assets and liabilities measured at fair value at December 31, 2014:
|
Quoted Prices
in Active Markets
for Identical Assets
|
Significant
Other Observable
Inputs
|
Significant
Unobservable
Inputs
|
||||||||||||||
|
(in thousands)
|
(Level 1)
|
(Level 2)
|
(Level 3)
|
Total
|
||||||||||||
|
Money market funds
|
$
|
11,661
|
$
|
-
|
$
|
-
|
$
|
11,661
|
||||||||
|
Foreign exchange contracts
|
-
|
92
|
-
|
92
|
||||||||||||
|
Total assets
|
$
|
11,661
|
$
|
92
|
$
|
-
|
$
|
11,753
|
||||||||
|
Foreign exchange contracts
|
$
|
-
|
$
|
(24
|
)
|
$
|
-
|
$
|
(24
|
)
|
||||||
|
Total liabilities
|
$
|
-
|
$
|
(24
|
)
|
$
|
-
|
$
|
(24
|
)
|
||||||
The following table presents assets and liabilities measured at fair value at December 31, 2013:
|
Quoted Prices
in Active Markets
for Identical Assets
|
Significant
Other Observable
Inputs
|
Significant
Unobservable
Inputs
|
||||||||||||||
|
(in thousands)
|
(Level 1)
|
(Level 2)
|
(Level 3)
|
Total
|
||||||||||||
|
Money market funds
|
$
|
10,553
|
$
|
-
|
$
|
-
|
10,553
|
|||||||||
|
Foreign exchange contracts
|
-
|
142
|
-
|
142
|
||||||||||||
|
Total assets
|
$
|
10,553
|
$
|
142
|
$
|
-
|
$
|
10,695
|
||||||||
|
Foreign exchange contracts
|
$
|
-
|
$
|
(655
|
)
|
$
|
-
|
$
|
(655
|
)
|
||||||
|
Total liabilities
|
$
|
-
|
$
|
(655
|
)
|
$
|
-
|
$
|
(655
|
)
|
||||||
For the years ended December 31, 2014 and 2013, the Company did not have any transfers between fair value Level 1 and Level 2.
F-26
10. Long-Term Debt
At December 31, 2014 and 2013, the Company had no long-term debt.
Line of Credit
Susquehanna Bank
At December 31, 2014, the Company had a Master Loan and Security Agreement and Revolving Credit Note with Susquehanna Bank ("Susquehanna"). The Company and its subsidiary, GSE Performance Solutions, Inc., were jointly and severally liable as co-borrowers. The Loan Agreement provides a $7.5 million revolving line of credit for the purpose of (i) issuing stand-by letters of credit and (ii) providing working capital. Working capital advances bear interest at a rate equal to the Wall Street Journal Prime Rate of Interest, floating with a floor of 4 1/2%. The agreement expires on March 31, 2015.
As collateral for the Company's obligations, the Company granted a first lien and security interest in all of the assets of the Company, including but not limited to, accounts receivable, proceeds and products, intangibles, trademarks, patents, intellectual property, machinery and equipment.
On September 9, 2014, the Company signed a Third Comprehensive Amendment to the Master Loan and Security Agreement. According to the Third Amendment, the Company is to maintain a segregated cash collateral account at Susquehanna Bank equal to the greater of (i) $3.0 million or (ii) the aggregate principal amounts of all Loans outstanding under the Revolving Credit Facility (including any issued and outstanding letters of credit, working capital advances, and negative foreign exchange positions) as security for the Company's obligations. Under this Amendment, Susquehanna Bank shall have complete and unconditional control over the cash collateral account.
On September 30, 2014, Susquehanna Bank collateralized the outstanding letters of credit issued under the line of credit. At December 31, 2014, the cash collateral account totaled $4.2 million and was classified as restricted cash on the balance sheet.
The credit agreement contains certain restrictive covenants regarding future acquisitions and incurrence of debt. In addition, the credit agreement contains financial covenants with respect to the Company's cash flow coverage ratio, minimum tangible capital base, quick ratio, and tangible capital base ratio.
|
As of
|
||
|
Covenant
|
December 31, 2014
|
|
|
Cash flow coverage ratio
|
Must Exceed 1.20 : 1.00
|
-12.11 : 1.00
|
|
Minimum tangible capital base
|
Must Exceed $26.0 million
|
$15.4 million
|
|
Quick ratio
|
Must Exceed 2.00 : 1.00
|
1.57 : 1.00
|
|
Tangible capital base ratio
|
Not to Exceed .75 : 1.00
|
1.44 : 1.00
|
As of December 31, 2014, the Company was not in compliance with any of its covenants as defined above, however, the Company has received a written waiver from Susquehanna Bank for noncompliance.
F-27
IberiaBank
On November 14, 2014, the acquisition date, Hyperspring, LLC had a $1.0 million working capital line of credit with IberiaBank. Interest was payable monthly at a rate of the prime rate of interest as published in the money rate section of the Wall Street Journal plus 2.50%. The effective rate at November 14, 2014 was 5.750%. The line was secured by all accounts and was guaranteed by the members of Hyperspring, LLC. At November 14, 2014 the outstanding balance on the line of credit was $749,000.
On December 7, 2014, the working capital line of credit matured while the Company was renegotiating the new terms with IberiaBank subsequent to the acquisition of Hyperspring. On January 22, 2015, a promissory note was executed between Hyperspring, LLC and IberiaBank to extend the $1.0 million line of credit until June 30, 2015. Under the new terms, interest is payable monthly at a rate of the prime rate of interest as published in the money rate section of the Wall Street Journal plus 1.00 %. The effective rate at the date of the promissory note was 4.25 %. The line is secured by all accounts and guaranteed by GSE Systems, Inc.
At December 31, 2014 the outstanding balance on the line of credit was $339,000. Subsequent to year end, the outstanding balance on the line of credit was repaid.
The Company draws on the IberiaBank line of credit as needed mainly to provide for payroll funding for Hyperspring. The line is replenished through collection of receivables obtained in the following weeks.
F-28
11. Income Taxes
The consolidated loss before income taxes, by domestic and foreign sources, is as follows:
|
(in thousands)
|
Years ended December 31,
|
|||||||
|
2014
|
2013
|
|||||||
|
Domestic
|
$
|
(4,608
|
)
|
$
|
(7,797
|
)
|
||
|
Foreign
|
(1,968
|
)
|
(2,568
|
)
|
||||
|
Total
|
$
|
(6,576
|
)
|
$
|
(10,365
|
)
|
||
The provision for income taxes is as follows:
|
(in thousands)
|
Years ended December 31,
|
|||||||
|
2014
|
2013
|
|||||||
|
Current:
|
||||||||
|
Federal
|
$
|
-
|
$
|
4
|
||||
|
State
|
10
|
22
|
||||||
|
Foreign
|
178
|
382
|
||||||
|
Subtotal
|
188
|
408
|
||||||
|
Deferred:
|
||||||||
|
Federal
|
24
|
-
|
||||||
|
Foreign
|
(46
|
)
|
(262
|
)
|
||||
|
Subtotal
|
(22
|
)
|
(262
|
)
|
||||
|
Total
|
$
|
166
|
$
|
146
|
||||
The Company is entitled to a deduction for federal and state tax purposes with respect to employees' stock option activity. As of December 31, 2014, the Company had $5.4 million of unrecognized excess tax deductions related to compensation for stock option exercises which will be recognized when the net operating loss carryforwards are fully utilized and those excess tax benefits result in a reduction to income taxes payable.
The effective income tax rate differed from the statutory federal income tax rate due to the following:
|
Effective Tax Rate Percentage (%)
|
|||
|
Years ended December 31,
|
|||
|
2014
|
2013
|
||
|
Statutory federal income tax rate
|
34.0%
|
34.0%
|
|
|
State income taxes, net of federal tax benefit
|
(0.1)%
|
(0.1)%
|
|
|
Effect of foreign operations
|
(10.2)%
|
(6.9)%
|
|
|
Tax benefit resulting from OCI allocation
|
0.0%
|
0.5%
|
|
|
Change in valuation allowance
|
(22.8)%
|
(12.1)%
|
|
|
Other, principally permanent differences
|
(3.4)%
|
(16.8)%
|
|
|
Effective tax rate
|
(2.5)%
|
(1.4)%
|
|
F-29
Deferred income taxes arise from temporary differences between the tax bases of assets and liabilities and their reported amounts in the financial statements. A summary of the tax effect of the significant components of the deferred income tax liabilities is as follows:
|
(in thousands)
|
Years ended December 31,
|
|||||||
|
2014
|
2013
|
|||||||
|
Deferred tax assets:
|
||||||||
|
Net operating loss carryforwards
|
$
|
7,745
|
$
|
5,589
|
||||
|
Capital loss carryforwards
|
615
|
703
|
||||||
|
Accruals
|
485
|
337
|
||||||
|
Reserves
|
521
|
611
|
||||||
|
Alternative minimum tax credit carryforwards
|
166
|
166
|
||||||
|
Other
|
1,484
|
1,701
|
||||||
|
Total deferred tax asset
|
11,016
|
9,107
|
||||||
|
Valuation allowance
|
(10,006
|
)
|
(7,057
|
)
|
||||
|
Total deferred tax asset less valuation allowance
|
1,010
|
2,050
|
||||||
|
Deferred tax liabilities:
|
||||||||
|
Undistributed earnings of foreign subsidiary
|
(102
|
)
|
(1,228
|
)
|
||||
|
Software development costs
|
(542
|
)
|
(384
|
)
|
||||
|
Other
|
(397
|
)
|
(491
|
)
|
||||
|
Total deferred tax liability
|
(1,041
|
)
|
(2,103
|
)
|
||||
|
Net deferred tax liability
|
$
|
(31
|
)
|
$
|
(53
|
)
|
||
In assessing the realizability of deferred tax assets, management considers whether it is more likely than not that some or all of the deferred tax assets will not be realized. The ultimate realization of deferred tax assets is dependent upon the generation of future taxable income during the periods in which those temporary differences become deductible. Management considers the scheduled reversal of deferred tax liabilities and projected future income in making this assessment.
Management believes that the Company will achieve profitable operations in future years that will enable the Company to recover the benefit of its deferred tax assets. However, other than for a portion of the deferred tax assets that are related to the Company's Indian subsidiary, the Company presently does not have sufficient objective evidence to substantiate the recovery of the deferred tax assets. Accordingly, the Company has established a full $10.0 million valuation allowance on its U.S., Swedish, and Chinese deferred tax assets at December 31, 2014. The valuation allowance for deferred tax assets increased by $2.9 million in 2014, and increased by $31,000 in 2013.
The Company has recorded a deferred tax liability in the amount of $24,000 at December 31, 2014, relating to the tax amortization of goodwill that cannot be offset by deferred tax assets because the anticipated reversal of the deferred tax liability is outside of the anticipated reversal of the deferred tax assets.
F-30
At December 31, 2014, the Company's largest deferred tax asset of $6.8 million primarily relates to a U.S. net operating loss carryforward of $19.1 million which expires in various amounts between 2020 and 2034. The amount of U.S. loss carryforward which can be used by the Company each year is limited due to changes in the Company's ownership which occurred in 2003. Thus, a portion of the Company's loss carryforward may expire unutilized.
Uncertain Tax Positions
During 2014 and 2013, the Company also recorded $20,000 and $187,000, respectively, of tax liabilities for certain foreign tax contingencies, respectively. The Company made payments of $211,000 and $103,000 during 2014 and 2013, respectively, related to these foreign tax liabilities. The Company recorded these uncertain tax positions in other current liabilities on the consolidated balance sheet, and recorded the associated interest and penalties as a component of income tax expense. In 2014 and 2013, the Company accrued $2,000 and $2,000 of interest and penalties, respectively.
Intraperiod tax allocation
The Company utilizes the with-and-without intraperiod tax allocation approach as described in ASC 740-20-45-12 which results in the use of the windfall tax benefits being utilized last.
12. Capital Stock
The Company's Board of Directors has authorized 32,000,000 total shares of capital stock, of which 30,000,000 are designated as common stock and 2,000,000 are designated as preferred stock. The Board of Directors has the authority to establish one or more classes of preferred stock and to determine, within any class of preferred stock, the preferences, rights and other terms of such class.
As of December 31, 2014, the Company has reserved 3,856,240 shares of common stock for issuance; 2,708,273 shares upon exercise of outstanding stock options; and 1,147,967 shares for future grants under the Company's 1995 Long-Term Incentive Plan.
Share Repurchase Plan
On March 21, 2011, the Board of Directors authorized the purchase of up to $3.0 million of the Company's common stock in accordance with the safe harbor provisions of Rule 10b-18 of the Securities Exchange Act of 1934. The Company completed the share repurchase program in October 2013 and thus did not repurchase shares during 2014. The Company repurchased 494,424 shares at an aggregate cost of $819,000 in the year ended December 31, 2013.
Preferred Stock Rights
On March 21, 2011, the Board of Directors of the Company declared a dividend, payable to holders of record as of the close of business on April 1, 2011, of one preferred stock purchase right (a "Right") for each outstanding share of common stock, par value $0.01 per share, of the Company (the "Common Stock"). In addition, the Company will issue one Right with each new share of Common Stock issued. In connection therewith, on March 21, 2011, the Company entered into a Stockholder Protection Rights Agreement (as amended from time to time, the Rights Agreement) with Continental Stock Transfer & Trust Company, as Rights Agent, which has a term of three years, unless amended by the Board of Directors in accordance with the terms of the Rights Agreement. On March 21, 2014 , the Rights Agreement was amended to extend the term an additional two years. The Rights Agreement will now expire on March 21, 2016. The Rights will initially trade with and be inseparable from the Common Stock and will not be evidenced by separate certificates unless they become exercisable. Each Right entitles its holder to purchase from the Company one-hundredth of a share of participating preferred stock having economic and voting terms similar to the Common Stock at an exercise price of $8.00 per Right, subject to adjustment in accordance with the terms of the Rights Agreement, once the Rights become exercisable. Under the Rights Agreement, the Rights become exercisable if any person or group acquires 20% or more of the Common Stock or, in the case of any person or group that owned 20% or more of the Common Stock as of March 21, 2011, upon the acquisition of any additional shares by such person or group. The Company, its subsidiaries, employee benefit plans of the Company or any of its subsidiaries and any entity holding Common Stock for or pursuant to the terms of any such plan are accepted. Upon exercise of the Right in accordance with the Rights Agreement, the holder would be able to purchase a number of shares of Common Stock from the Company having an aggregate market price (as defined in the Rights Agreement) equal to twice the then-current exercise price for an amount in cash equal to the then-current exercise price. In addition, the Company may, in certain circumstances and pursuant to the terms of the Rights Agreement, exchange the Rights for one share of Common Stock or an equivalent security for each Right or, alternatively, redeem the Rights for $0.001 per Right. The Rights will not prevent a takeover of our Company, but may cause substantial dilution to a person that acquires 20% or more of the Company's Common Stock.
F-31
13. Stock-Based Compensation
Long-term incentive plan
During 1995, the Company established the 1995 Long-Term Incentive Stock Option Plan (the "Plan"), which permits the granting of stock options (including incentive stock options and nonqualified stock options) stock appreciation rights, restricted or unrestricted stock awards, phantom stock, performance awards or any combination of these to employees, directors or consultants. Options to purchase shares of the Company's common stock under the Plan expire in either seven or ten years from the date of grant and become exercisable in three, five, or seven installments with a certain percentage of options vesting on the first anniversary of the grant date and additional options vesting on each of the subsequent anniversaries of the grant date, subject to acceleration under certain circumstances. The Plan expires on June 30, 2018; the total number of shares that could be issued under the Plan is 5,500,000. As of December 31, 2014, 1,643,760 shares have been issued under the Plan, 2,708,273 stock options were outstanding under the Plan, while 1,147,967 stock options remained to be granted under the Plan.
The Company recognizes compensation expense on a pro rata straight-line basis over the requisite service period for stock-based compensation awards with both graded and cliff vesting terms. The Company recognizes the cumulative effect of a change in the number of awards expected to vest in compensation expense in the period of change. The Company has not capitalized any portion of its stock-based compensation.
During the years ended December 31, 2014, and 2013, the Company recognized $712,000, and $810,000, respectively, of stock-based compensation expense under the fair value method.
Stock option activity
During the year ended December 31, 2014, the Company granted stock options to purchase 158,573 shares of common stock to GSE directors and employees. During the year ended December 31, 2013, the Company granted stock options to purchase 293,000 shares of common stock to GSE directors and employers.
Information with respect to stock option activity as of and for the year ended December 31, 2014 is as follows:
|
Number
of Shares
|
Weighted
Average
Exercise
Price
|
Aggregate
Intrinsic
Value (in thousands)
|
Weighted
Average
Remaining
Contractual Life
(Years)
|
|||||||||||||
|
Options outstanding at December 31, 2013
|
3,035,987
|
$
|
3.38
|
|||||||||||||
|
Options granted
|
158,573
|
2.03
|
||||||||||||||
|
Options exercised
|
-
|
-
|
||||||||||||||
|
Options forfeited
|
(486,287
|
)
|
4.35
|
|||||||||||||
|
Options outstanding at December 31, 2014
|
2,708,273
|
3.12
|
$
|
-
|
3.55
|
|||||||||||
|
Options expected to vest
|
681,983
|
2.23
|
$
|
-
|
4.48
|
|||||||||||
|
Options exercisable at December 31, 2014
|
2,026,290
|
$
|
3.42
|
$
|
-
|
3.23
|
||||||||||
Information with respect to stock option activity as of and for the year ended December 31, 2013 is as follows:
|
Number
of Shares
|
Weighted
Average
Exercise
Price
|
Aggregate
Intrinsic
Value (in thousands)
|
Weighted
Average
Remaining
Contractual Life
(Years)
|
|||||||||||||
|
Options outstanding at December 31, 2012
|
3,070,803
|
$
|
3.40
|
|||||||||||||
|
Options granted
|
293,000
|
1.76
|
||||||||||||||
|
Options exercised
|
(162,000
|
)
|
1.62
|
|||||||||||||
|
Options forfeited
|
(165,816
|
)
|
2.71
|
|||||||||||||
|
Options outstanding at December 31, 2013
|
3,035,987
|
3.38
|
$
|
-
|
4.32
|
|||||||||||
|
Options expected to vest
|
1,287,801
|
2.37
|
$
|
-
|
5.28
|
|||||||||||
|
Options exercisable at December 31, 2013
|
1,748,186
|
$
|
4.12
|
$
|
-
|
3.62
|
||||||||||
F-32
A summary of the status of the Company's nonvested options as of and for the year ended December 31, 2014 is presented below.
|
Number of Shares
|
Weighted Average Fair Value
|
|||||||
|
Nonvested options at December 31, 2013
|
1,287,801
|
$
|
1.33
|
|||||
|
Options granted
|
158,573
|
0.67
|
||||||
|
Options forfeited
|
(190,433
|
)
|
1.29
|
|||||
|
Options vested during the period
|
(573,958
|
)
|
1.29
|
|||||
|
Nonvested options at December 31, 2014
|
681,983
|
$
|
1.22
|
|||||
A summary of the status of the Company's nonvested options as of and for the year ended December 31, 2013 is presented below.
|
Number of Shares
|
Weighted Average Fair Value
|
|||||||
|
Nonvested options at December 31, 2012
|
1,750,107
|
$
|
1.43
|
|||||
|
Options granted
|
293,000
|
0.90
|
||||||
|
Options forfeited
|
(120,646
|
)
|
1.19
|
|||||
|
Options vested during the period
|
(634,660
|
)
|
1.45
|
|||||
|
Nonvested options at December 31, 2013
|
1,287,801
|
$
|
1.33
|
|||||
The fair value of the options granted in 2014 and 2013 were estimated on the date of grant using a Black-Scholes option-pricing model with the following assumptions:
|
Years ended December 31,
|
|||
|
2014
|
2013
|
||
|
Risk-free interest rates
|
1.29 - 2.15%
|
.85 - 1.68%
|
|
|
Dividend yield
|
0%
|
0%
|
|
|
Expected life
|
3.81 - 7.00 years
|
5.49 - 7.00 years
|
|
|
Volatility
|
49.89 - 50.34%
|
51.31 - 56.80%
|
|
|
Weighted average volatility
|
50.06%
|
52.46%
|
|
As of December 31, 2014, the Company had $0.7 million of unrecognized compensation expense related to the unvested portion of outstanding stock options expected to be recognized on a pro-rata straight line basis over a weighted average remaining service period of approximately 4.48 years.
No stock options were exercised during the year ended December 31, 2014. The Company received cash for the exercise price associated with stock options exercised of $44,000 and the total intrinsic value realized by participants on stock options exercised was $57,000 during the year ended December 31, 2013.
F-33
14. Commitments and Contingencies
Leases
The Company is obligated under certain noncancelable operating leases for office facilities and equipment. Future minimum lease payments under noncancelable operating leases as of December 31, 2014 are as follows:
|
(in thousands)
|
Gross Future
|
|||
|
Minimum Lease
|
||||
|
Payments
|
||||
|
2015
|
$
|
1,163
|
||
|
2016
|
897
|
|||
|
2017
|
823
|
|||
|
2018
|
746
|
|||
|
2019
|
612
|
|||
|
Thereafter
|
1,867
|
|||
|
Total
|
$
|
6,108
|
||
Total rent expense under operating leases for the years ended December 31, 2014, and 2013, was approximately $1.4 million, and $1.1 million, respectively.
Standby Letters of credit, bank guarantees, surety bonds and performance bonds
As of December 31, 2014, the Company was contingently liable for twelve standby letters of credit and one surety bonds totaling $4.2 million which represent advance payment and performance bonds on eleven contracts. The Company has deposited the full value of eleven standby letters of credit, $4.2 million, into money market escrow accounts which have been restricted in that the Company does not have access to these funds until the related letters of credit have expired. The cash has been recorded on the Company's balance sheet at December 31, 2014 as restricted cash and long-term restricted cash depending on the expiration date of the underlying letters of credit.
Contingencies
Various actions and proceedings are presently pending to which the Company is a party. In the opinion of management, the aggregate liabilities, if any, arising from such actions are not expected to have a material adverse effect on the financial position, results of operations or cash flows of the Company.
15. Employee Benefits
The Company has a qualified defined contribution plan that covers substantially all U.S. employees under Section 401(k) of the Internal Revenue Code. Under this plan, the Company's stipulated basic contribution matches a portion of the participants' contributions based upon a defined schedule. The Company's contributions to the plan were approximately $256,000 and $270,000 for the years ended December 31, 2014 and 2013, respectively.
F-34
16. Segment Information
The Company has two reportable business segments. The Performance Improvement Solutions
business segment provides simulation, training and engineering products and services delivered across the breadth of industries we serve. Solutions include simulation for both training and engineering applications. Example training applications include turnkey and custom training services, while engineering services include plant design verification and validation. We provide these services across all our market segments. Contracts typically range from 10 months to three years.
The Staff Augmentation services segment provide specialized workforce solutions primarily to the nuclear industry, working at our clients' facilities. This business is managed through our Hyperspring, LLC subsidiary. The business model, management focus, margins and other factors clearly separate this business line from the rest of the GSE product and service portfolio. Hyperspring has been providing these services since 2005.
The following table sets forth the revenue and operating results attributable to each reportable segment and includes a reconciliation of segment revenue to consolidated revenue and operating results to consolidated income before income tax expense:
|
(in thousands)
|
Years ended December 31,
|
|||||||
|
2014
|
2013
|
|||||||
|
Contract revenue:
|
||||||||
|
Performance Improvement Solutions
|
$
|
35,675
|
$
|
47,562
|
||||
|
Staff Augmentation
|
2,255
|
-
|
||||||
|
$
|
37,930
|
$
|
47,562
|
|||||
|
Operating income (loss):
|
||||||||
|
Performance Improvement Solutions
|
$
|
(6,805
|
)
|
$
|
(10,414
|
)
|
||
|
Staff Augmentation
|
105
|
-
|
||||||
|
Loss on change in fair value of contingent consideration, net
|
(229
|
)
|
(254
|
)
|
||||
|
Operating loss
|
$
|
(6,929
|
)
|
$
|
(10,668
|
)
|
||
|
Interest income, net
|
143
|
105
|
||||||
|
Gain on derivative instruments, net
|
209
|
265
|
||||||
|
Other income (expense) , net
|
1
|
(67
|
)
|
|||||
|
Net loss
|
$
|
(6,576
|
)
|
$
|
(10,365
|
)
|
||
F-35
Additional information relating to our business segments is as follows:
|
(in thousands)
|
December 31,
|
|||||||
|
2014
|
2013
|
|||||||
|
Identifiable assets:
|
||||||||
|
Performance Improvement Solutions
|
$
|
38,309
|
$
|
48,827
|
||||
|
Staff Augmentation
|
8,090
|
-
|
||||||
|
Intercompany receivable elimination
|
(400
|
)
|
-
|
|||||
|
Total Assets
|
$
|
45,999
|
$
|
48,827
|
||||
For the years ended December 31, 2014 and 2013, 57% and 65%, respectively, of the Company's consolidated revenue was from customers in the nuclear power industry. The Company designs, develops and delivers business and technology solutions to the energy industry worldwide. Revenue, operating income (loss) and total assets for the Company's United States, European, and Asian subsidiaries as of and for the years ended December 31, 2014 and 2013 are as follows:
|
(in thousands)
|
Year ended December 31, 2014
|
|||||||||||||||||||
|
United States
|
Europe
|
Asia
|
Eliminations
|
Consolidated
|
||||||||||||||||
|
Contract revenue
|
$
|
29,038
|
$
|
6,414
|
$
|
2,478
|
$
|
-
|
$
|
37,930
|
||||||||||
|
Transfers between geographic locations
|
2,176
|
741
|
1,242
|
(4,159
|
)
|
-
|
||||||||||||||
|
Total contract revenue
|
$
|
31,214
|
$
|
7,155
|
$
|
3,720
|
$
|
(4,159
|
)
|
$
|
37,930
|
|||||||||
|
Operating loss
|
$
|
(4,743
|
)
|
$
|
(2,094
|
)
|
$
|
(92
|
)
|
$
|
-
|
$
|
(6,929
|
)
|
||||||
|
Total assets, at December 31
|
$
|
116,586
|
$
|
5,828
|
$
|
4,694
|
$
|
(81,109
|
)
|
$
|
45,999
|
|||||||||
|
(in thousands)
|
Year ended December 31, 2013
|
|||||||||||||||||||
|
United States
|
Europe
|
Asia
|
Eliminations
|
Consolidated
|
||||||||||||||||
|
Contract revenue
|
$
|
33,419
|
$
|
8,639
|
$
|
5,504
|
$
|
-
|
$
|
47,562
|
||||||||||
|
Transfers between geographic locations
|
5,602
|
446
|
636
|
(6,684
|
)
|
-
|
||||||||||||||
|
Total contract revenue
|
$
|
39,021
|
$
|
9,085
|
$
|
6,140
|
$
|
(6,684
|
)
|
$
|
47,562
|
|||||||||
|
Operating income (loss)
|
$
|
(7,767
|
)
|
$
|
(3,053
|
)
|
$
|
152
|
$
|
-
|
$
|
(10,668
|
)
|
|||||||
|
Total assets, at December 31
|
$
|
67,255
|
$
|
11,206
|
$
|
6,508
|
$
|
(36,142
|
)
|
$
|
48,827
|
|||||||||
Approximately 52% and 67%, of the Company's 2014 and 2013 revenue, respectively, was derived from international sales of its products and services from all of its subsidiaries.
F-36
17. Equity Method Investments
Investments in partnerships, joint ventures, and less-than-majority owned subsidiaries in which the Company has significant influence are accounted for under the equity method. As of December 31, 2014 and 2013, the Company had the following equity investments.
IntelliQlik, LLC
In conjunction with the Hyperspring acquisition, the Company invested $250,000 for a 50% interest in IntelliQlik, LLC ("IntelliQlik") and is obligated to contribute an additional $250,000 upon the attainment by IntelliQlik of certain milestones as of September 30, 2015. IntelliQlik is jointly owned by GSE and a former member of Hyperspring. IntelliQlik will develop a software platform for online learning and learning management for all energy sectors, including nuclear, thermal, oil & gas, and hydro-electric. The IntelliQlik platform will also include applications to support plant engineering, operations and maintenance, as well as provide a platform for Software as a Service to deliver learning materials, industry recruitment services, and specialized simulator training programs.
The Company determined that the outcome of IntelliQlik reaching the milestones was probable and therefore evaluated the contingent consideration liability under Accounting Standards Codification ("ASC") 450-20-30, Loss Contingencies - Initial Measurement. Based on the progress of IntelliQlik and the timeframe to achieve the milestones, the Company estimates that there is a significant probability that IntelliQlik will reach the milestones by September 2015 and accordingly has recorded a contingent liability of $213,000 at December 31, 2014 which is included in the current contingent consideration line of the consolidated balance sheet. Equity gains and losses incurred by IntelliQlik are recorded within the Performance Improvement Solutions segment according to the Company's 50% interest. As of December 31, 2014, the carrying value of our investment was $440,000.
General Simulation Engineering RUS Limited Liability Company
On May 22, 2013, the Company and Electrobalt Holding, a Russian Federation closed joint-stock company, created a 50/50 joint venture called General Simulation Engineering RUS Limited Liability Company ("GSE RUS"). GSE's equity contribution was 1.5 million Roubles ($46,000) and was paid to the joint venture in November 2013. As of December 31, 2014 and 2013, the carrying value of our investment was $0 and $38,000, respectively.
GSE-UNIS Simulation Technology Co., Ltd
In 2013, the Company agreed to sell its 49% stake in GSE-UNIS Simulation Technology Co., Ltd ("GSE-UNIS") to its partner, Beijing Unis Venture Capital Co., Ltd. and terminate the joint venture agreement as of July 31, 2013. The Company had accounted for this joint venture as an equity method investment. The sales price was basically equivalent to the Company's investment in GSE-UNIS as of the closing date. In 2013, the Company agreed to sell its 49% stake in GSE-UNIS Simulation Engineering Co., Ltd to its partner, Beijing Unis Venture Capital Co., Ltd. for $1.2 million and terminate the joint venture agreement as of July 31, 2013. As of December 31, 2013 we had classified this receivable within Other Current Assets. We received the $1.2 million in December 2014.
Schedule of Equity Losses
We had the following net losses of our equity method investments during the years ended December 31, 2014 and 2013. The losses from equity method investments are included in Other income (expense), net within the Consolidated Statement of Operations.
|
(in thousands)
|
Years ended December 31,
|
|||||||
|
2014
|
2013
|
|||||||
|
Equity Method Investment
|
||||||||
|
IntelliQlik, LLC
|
$
|
(17
|
)
|
$
|
-
|
|||
|
General Simulation Engineering RUS LLC
|
(38
|
)
|
(8
|
)
|
||||
|
GSE-UNIS Simulation Technology , Ltd.
|
-
|
(148
|
)
|
|||||
|
Total loss from equity method investments
|
$
|
(55
|
)
|
$
|
(156
|
)
|
||
F-37
18. Supplemental Disclosure of Cash Flow Information
|
(in thousands)
|
Year ended December 31,
|
|||||||
|
2014
|
2013
|
|||||||
|
Cash paid:
|
||||||||
|
Interest
|
$
|
1
|
$
|
-
|
||||
|
Income taxes
|
$
|
395
|
$
|
539
|
||||
|
Non-cash financing activities:
|
||||||||
|
Hyperspring, LLC (1)
|
$
|
3,953
|
$
|
-
|
||||
|
IntelliQlik, LLC (2)
|
207
|
-
|
||||||
|
Total accrued contingent consideration
|
$
|
4,160
|
$
|
-
|
||||
(1) Total accrued contingent consideration recorded on November 14, 2014, the date of the Hyperspring acquisition.
(2) Total accrued contingent consideration recorded on November 14, 2014, the date of the Company's investment in IntelliQlik.
19. Subsequent Event
During 2014, Hyperspring, LLC had a $1.0 million working capital line of credit with IberiaBank. On December 7, 2014, the working capital line of credit matured while the bank was renegotiating the new terms with GSE Systems, Inc. and Hyperspring, LLC subsequent to the acquisition of Hyperspring (See Note 3). On January 22, 2015, a promissory note was executed between Hyperspring, LLC and IberiaBank to extend the $1.0 million line of credit until June 30, 2015. Under the new terms, interest is payable monthly at a rate of the prime rate of interest as published in the money rate section of the Wall Street Journal plus 1.00 %. The effective rate at the date of the promissory note was 4.25 %. The line is secured by all accounts and guaranteed by GSE Systems, Inc.
F-38
None.
(a) Evaluation of Disclosure Controls and Procedures
The Company maintains disclosure controls and procedures that are designed to ensure that information required to be disclosed by it in its reports filed or submitted pursuant to the Securities Exchange Act of 1934, as amended (the "Exchange Act"), is recorded, processed, summarized and reported within the time periods specified in the Securities and Exchange Commission's rules and forms and that information required to be disclosed by the Company in its Exchange Act reports is accumulated and communicated to management, including the Company's Chief Executive Officer ("CEO"), who is its principal executive officer, and Chief Financial Officer ("CFO"), who is its principal financial officer, to allow timely decisions regarding required disclosure. At the end of the period covered by this report, an evaluation was performed under the supervision and with the participation of our management including our CEO and our CFO, of the effectiveness of the design and operation of our disclosure controls and procedures pursuant to Rule 13-15(e) of the Exchange Act. Based on the evaluation of our disclosure controls and procedures as of December 31, 2014, our Chief Executive Officer and Chief Financial Officer concluded that, as of such date, our disclosure controls and procedures were effective.
(b) Management's Annual Report on Internal Control over Financial Reporting
Management is responsible for establishing and maintaining adequate internal control over financial reporting as defined in Rule 13a-15(f) under the Exchange Act. Internal control over financial reporting is a process designed to provide reasonable assurance regarding the reliability of financial reporting and the preparation of financial statements for external purposes in accordance with U.S. generally accepted accounting principles. The effectiveness of any system of internal control over financial reporting is subject to inherent limitations, including the exercise of judgment in designing, implementing, operating and evaluating the controls and procedures. Because of these inherent limitations, internal control over financial reporting cannot provide absolute assurance regarding the reliability of financial reporting and the preparation of financial statements in accordance with U.S. generally accepted accounting principles and may not prevent or detect misstatements. Also, projections of any evaluation of effectiveness to future periods are subject to the risk that internal controls may become inadequate because of changes in conditions, or that the degree of compliance with the policies or procedures may deteriorate.
A "material weakness" as defined by Public Company Accounting Oversight Board ("PCAOB") Auditing Standard No. 5, "An Audit of Internal Control over Financial Reporting That is Integrated with an Audit of Financial Statements" ("Auditing Standard No. 5") is "a deficiency, or a combination of deficiencies, in internal control over financial reporting, such that there is a reasonable possibility that a material misstatement of the annual or interim financial statements will not be prevented or detected on a timely basis." A "deficiency" in internal control over financial reporting as defined by Auditing Standard No. 5 "exists when the design or operation of a control does not allow management or employees, in the normal course of performing their assigned functions, to prevent or detect misstatements on a timely basis."
Under the supervision and with the participation of management, including our CEO and CFO, we conducted an evaluation of internal control over financial reporting as of December 31, 2014, based on the "Internal Control—Integrated Framework (1992)" issued by the Committee of Sponsoring Organizations of the Treadway Commission (COSO). Based upon our evaluation, we concluded that our internal control over financial reporting was effective as of December 31, 2014.
(c) Changes in Internal Control over Financial Reporting
The Company has made no changes in its internal controls over financial reporting (as defined in Exchange Act Rule 13a-15) during the year ended December 31, 2014 that have materially affected or are reasonably likely to materially affect our internal control over financial reporting.
(d) Limitation of Effectiveness of Controls
Internal control over financial reporting has inherent limitations. Internal control over financial reporting is a process that involves human diligence and compliance and is subject to lapses in judgment and breakdowns resulting from human failures. Internal control over financial reporting also can be circumvented by collusion or improper management override. Because of such limitations, there is a risk that material misstatements will not be prevented or detected on a timely basis by internal control over financial reporting. However, these inherent limitations are known features of the financial reporting process. Therefore, it is possible to design into the process safeguards to reduce, though not eliminate this risk.
None.
45
The information required by this item, including items 401, 405, 406 and 407 of Regulation S-K, is incorporated by reference to the section captioned "Directors and Executive Officers" in the definitive Proxy Statement for the Company's 2015 Annual Meeting of Shareholders and incorporated herein by reference or will be provided in an amendment to this Annual Report on Form 10-K.
The Company has adopted a Conduct of Business Policy that applies to its directors, officers and employees, including its principal executive officer, and principal financial officer. The Conduct of Business Policy is available on the Company's website at www.gses.com. In addition, the Company has adopted a Code of Ethics for its principal executive officer and senior financial officers which is also available on the Company's website. The Company will post on its website information about any amendment to, or waiver from, any provision of the Code of Ethics that applies to its principal executive officer, principal financial officer, or principal accounting officer.
The information required by this item will either be set forth under the "Executive Compensation" section in the definitive Proxy Statement for the 2015 Annual Meeting of Shareholders and incorporated herein by reference or will be provided in an amendment to this Annual Report on Form 10-K.
| ITEM 12. | SECURITY OWNERSHIP OF CERTAIN BENEFICIAL OWNERS AND MANAGEMENT AND RELATED STOCKHOLDER MATTERS. |
The information required by this item will be either set forth under the sections captioned "Voting Securities and Principal Holders Thereof," and "Executive Compensation" in the definitive Proxy Statement for the 2015 Annual Meeting of Shareholders and incorporated herein by reference or will be provided in an amendment to this Annual Report on Form 10-K.
The information required by this item will be either set forth under the "Directors and Executive Officers" section in the definitive Proxy Statement for the 2015 Annual Meeting of Shareholders and incorporated herein by reference or will be provided in an amendment to this Annual Report on Form 10-K.
46
The information required by this item will be either set forth under the "Audit Committee Pre-Approval of Audit and Non-Audit Services" section in the definitive Proxy Statement for the 2015 Annual Meeting of Shareholders and incorporated herein by reference or will be provided in an amendment to this Annual Report on Form 10-K.
(a) (1) List of Financial Statements
The following financial statements are included in Item 8:
|
GSE Systems, Inc. and Subsidiaries
|
|
Report of Independent Registered Public Accounting Firm - BDO USA, LLP
|
|
Report of Independent Registered Public Accounting Firm - KPMG LLP
|
|
Consolidated Balance Sheets as of December 31, 2014 and 2013
|
|
Consolidated Statements of Operations for the years ended December 31, 2014 and 2013
|
|
Consolidated Statements of Comprehensive Loss for the years ended December 31, 2014 and 2013
|
|
Consolidated Statements of Changes in Stockholders' Equity for the years ended December 31, 2014 and 2013
|
|
Consolidated Statements of Cash Flows for the years ended December 31, 2014 and 2013
|
|
Notes to Consolidated Financial Statements
|
(a) (2) List of Schedules
All other schedules to the consolidated financial statements are omitted as the required information is either inapplicable or presented in the consolidated financial statements or related notes.
(a) (3) List of Exhibits
The Exhibits which are filed with this report or which are incorporated by reference are set forth in the Exhibit Index hereto.
47
Pursuant to the requirements of Section 13 or 15(d) of the Securities Exchange Act of 1934, the registrant has duly caused this report to be signed on its behalf by the undersigned, thereunto duly authorized.
|
GSE Systems, Inc.
|
||
|
By:/ s / James A. Eberle
|
||
|
James A. Eberle
|
||
|
Chief Executive Officer
|
Pursuant to the requirements of the Securities Act, this report has been signed by the following persons in the capacities and on the dates indicated.
|
Date: March 19, 2015
|
/s / JAMES A. EBERLE
|
||
|
James A. Eberle, Chief Executive Officer
|
|||
|
(Principal Executive Officer)
|
|
Date: March 19, 2015
|
/ s / JEFFERY G. HOUGH
|
||
|
Jeffery G. Hough, Senior Vice President
|
|||
|
and Chief Financial Officer
|
|||
|
(Principal Financial and Accounting Officer)
|
|
Date: March 19, 2015
|
(Jerome I. Feldman, Chairman of the Board
|
)
|
By:
|
/ s / JEFFERY G. HOUGH
|
|
|
(Dr. Sheldon L. Glashow, Director
|
)
|
Jeffery G. Hough
|
|||
|
(Jane Bryant Quinn, Director
|
)
|
Attorney-in-Fact
|
|||
|
(Dr. Roger Hagengruber, Director
|
)
|
||||
|
(Joseph W. Lewis, Director
|
)
|
||||
|
(Christopher Sorrells, Director
|
)
|
A Power of Attorney, dated March 4, 2015 authorizing Jeffery G. Hough to sign this Annual Report on Form 10-K for the fiscal year ended December 31, 2014 on behalf of certain of the directors of the Registrant is filed as Exhibit 24.1 to this Annual Report.
48
|
Description of Exhibits
|
|
|
2.
|
Plan of acquisition, reorganization, arrangement, liquidation, or succession
|
|
2.1
|
Stock Purchase Agreement, dated as of January 1, 2011 among GSE Systems, Inc., Toshi Shinohara, Santosh Joshi, Hideo Shinohara, and EnVision Systems, Inc., previously filed with Form 8-K as filed with the Securities and Exchange Commission on January 10, 2011 and incorporated herein by reference.
|
|
2.2
|
Membership Interests Purchase Agreement, dated as of November 14, 2014, by and between Dale Jennings, Paul Abbott, Shawn McKeever and Mickey Ellis and GSE Performance Solutions, Inc. Incorporated herein by reference to Exhibit 2.1 of GSE Systems, Inc. Form 8-K filed with the Securities and Exchange Commission on November 17, 2014.
|
|
2.3
|
IntelliQlik, LLC Operating Agreement, dated as of November 14, 2014. Incorporated herein by reference to Exhibit 2.2 of GSE Systems, Inc. Form 8-K filed with the Securities and Exchange Commission on November 17, 2014.
|
|
3.
|
Articles of Incorporation and Bylaws
|
|
3(i)
|
Fourth Amended and Restated Certificate of Incorporation of the Company. Previously filed in connection with the GSE Systems, Inc. Form DEF 14A as filed with the Securities and Exchange Commission on November 20, 2007 and incorporated herein by reference.
|
|
3(ii)
|
Amended and Restated Bylaws of the Company. Incorporated herein by reference to Exhibit 99.1 of GSE Systems, Inc. Form 8-K filed with the Securities and Exchange Commission on February 4, 2015.
|
49
|
10.
|
Material Contracts
|
|
10.1
|
Agreement among ManTech International Corporation, National Patent Development Corporation, GPS Technologies, Inc., General Physics Corporation, Vattenfall Engineering AB and GSE Systems, Inc. (dated as of April 13, 1994). Previously filed in connection with the GSE Systems, Inc. Form S-1 Registration Statement as filed with the Securities and Exchange Commission on April 24, 1995 and incorporated herein by reference.
|
|
10.2
|
GSE Systems, Inc. 1995 Long-Term Incentive Plan, amended and restated as of March 6, 2014. Incorporated herein by reference to Exhibit A of GSE Systems, Inc. Form DEF 14A filed with the Securities and Exchange Commission on April 29, 2014. *
|
|
10.3
|
Form of Option Agreement Under the GSE Systems, Inc. 1995 Long-Term Incentive Plan. Previously filed in connection with the GSE Systems, Inc. Form 10-K as filed with the Securities and Exchange Commission on March 22, 1996 and incorporated herein by reference. *
|
|
10.4
|
Office Lease Agreement between 1332 Londontown, LLC and GSE Systems, Inc. (dated as of February 27, 2008). Previously filed in connection with the GSE Systems, Inc. Form 8-K as filed with the Securities and Exchange Commission on March 11, 2008 and incorporated herein by reference.
|
|
10.5
|
Employment Agreement dated as of January 1, 2015 between GSE Systems, Inc. and James Eberle. Incorporated herein by reference to Exhibit 10.1 of GSE Systems, Inc. Form 8-K filed with the Securities and Exchange Commission on March 19, 2015. *
|
|
10.6
|
Employment Agreement dated as of January 1, 2015 between GSE Systems, Inc. and Jeffery G. Hough. Incorporated herein by reference to Exhibit 10.2 of GSE Systems, Inc. Form 8-K filed with the Securities and Exchange Commission on March 19, 2015. *
|
|
10.7
|
Employment Agreement dated as of January 1, 2015 between GSE Systems, Inc. and Lawrence Gordon. Incorporated herein by reference to Exhibit 10.3 of GSE Systems, Inc. Form 8-K filed with the Securities and Exchange Commission on March 19, 2015. *
|
|
10.8
|
Employment Agreement dated as of January 1, 2015 between GSE Systems, Inc. and Jerome I. Feldman. Filed herewith. *
|
|
10.9
|
Form of Employment Agreement between GSE Systems, Inc. and various executive officers. Filed herewith. *
|
|
10.10
|
Master Loan and Security Agreement dated November 22, 2011, by and among GSE Systems, Inc., GSE EnVision Inc. and Susquehanna Bank (the "Susquehanna Bank Agreement"). Previously filed in connection with the GSE Systems, Inc. Form 8-K filed with the Securities and Exchange Commission on November 29, 2011 and incorporated herein by reference.
|
50
|
10.11
|
Amendment No. 1 to the Susquehanna Bank Agreement, dated March 31, 2012. Filed herewith.
|
|
10.12
|
Amendment No. 2 to the Susquehanna Bank Agreement, dated April 8, 2014. Previously filed in connection with the GSE Systems, Inc. Form 10-Q filed with the Securities and Exchange Commission on November 14, 2014 and incorporated herein by reference.
|
|
10.13
|
Amendment No. 3 to the Susquehanna Bank Agreement, dated August 9, 2014. Previously filed in connection with the GSE Systems, Inc. Form 10-Q filed with the Securities and Exchange Commission on November 14, 2014 and incorporated herein by reference.
|
|
10.14
|
Amendment No. 4 to the Susquehanna Bank Agreement, dated as of December 31, 2014. Filed herewith.
|
|
10.15
|
The $7,500,000 Revolving Credit Note, dated November 22, 2011. Previously filed in connection with the GSE Systems, Inc. Form 8-K filed with the Securities and Exchange Commission on November 29, 2011 and incorporated herein by reference.
|
|
10.16
|
Extension of the $7,500,000 Revolving Credit Note, dated July 29, 2013. Incorporated herein by reference to Exhibit 10.14 of GSE Systems, Inc. Form 10-K filed with the Securities and Exchange Commission on March 26, 2014.
|
|
10.17
|
Extension to Revolving Credit Note, dated June 30, 2014. Previously filed in connection with the GSE Systems, Inc. Form 10-Q filed with the Securities and Exchange Commission on August 14, 2014 and incorporated herein by reference.
|
|
10.18
|
Stockholder Protection Rights Agreement, dated March 21, 2011, by and between GSE Systems, Inc. and Continental Stock Transfer & Trust Company, as Rights Agent. Incorporated herein by reference to Exhibit 4.1 of GSE Systems, Inc. Form 8-K filed with the Securities and Exchange Commission on March 21, 2011.
|
|
10.19
|
Amendment No. 1 to Stockholder Protection Rights Agreement, dated March 21, 2014. Incorporated herein by reference to Exhibit 10.15 of GSE Systems, Inc. Form 10-K filed with the Securities and Exchange Commission on March 26, 2014.
|
|
10.20
|
Amendment of Lease to Office Lease Agreement, dated May 28, 2008. Filed herewith.
|
|
10.21
|
Second Amendment of Lease to Office Lease Agreement, dated July 22, 2010. Filed herewith.
|
|
10.22
|
Third Amendment of Lease to Office Lease Agreement, dated May 15, 2012. Filed herewith.
|
|
10.23
|
Fourth Amendment of Lease to Office Lease Agreement, dated April 15, 2014. Incorporated herein by reference to Exhibit 10.1 of GSE Systems, Inc. Form 10-Q filed with the Securities and Exchange Commission on May 5, 2014.
|
51
|
14
|
Code of Ethics
|
|
14.1
|
Code of Ethics for the Principal Executive Officer and Senior Financial Officers. Previously filed in connection with the GSE Systems, Inc. Form 10-K filed with the Securities and Exchange Commission on March 31, 2006 and incorporated herein by reference.
|
|
21
|
Subsidiaries.
|
|
21.1
|
List of Subsidiaries of Registrant at December 31, 2014, filed herewith.
|
|
23
|
Consents of Independent Registered Public Accounting Firms
|
|
23.1
|
Consent of BDO USA, LLP, filed herewith.
|
|
23.2
|
Consent of KPMG LLP, filed herewith.
|
|
24
|
Power of Attorney
|
|
24.1
|
Power of Attorney for Directors' and Officers' Signatures on SEC Form 10-K, filed herewith.
|
|
31
|
Certifications
|
|
31.1
|
Certification of Chief Executive Officer of the Company pursuant to Securities and Exchange Act Rule 13d-14(a)/15(d-14(a), as adopted pursuant to Section 302 and 404 of the Sarbanes-Oxley Act of 2002, filed herewith.
|
|
31.2
|
Certification of Chief Financial Officer of the Company pursuant to Securities and Exchange Act Rule 13d-14(a)/15(d-14(a), as adopted pursuant to Section 302 and 404 of the Sarbanes-Oxley Act of 2002, filed herewith.
|
|
32
|
Section 1350 Certifications
|
|
32.1
|
Certification of Chief Executive Officer and Chief Financial Officer of the Company pursuant to 18 U.S.C. Section 1350 as adopted pursuant to Section 906 of the Sarbanes-Oxley Act of 2002, file herewith.
|
| * Management contracts or compensatory plans required to be filed as exhibits pursuant to Item 14 (c) of this report. |
52