Attached files
| file | filename |
|---|---|
| EX-99.4 - EX-99.4 - Alpine Income Property Trust, Inc. | tmb-20210210xex99d4.htm |
| EX-99.3 - EX-99.3 - Alpine Income Property Trust, Inc. | tmb-20210210xex99d3.htm |
| EX-99.1 - EX-99.1 - Alpine Income Property Trust, Inc. | tmb-20210210xex99d1.htm |
| EX-10.1 - EX-10.1 - Alpine Income Property Trust, Inc. | tmb-20210210xex10d1.htm |
| 8-K - 8-K - Alpine Income Property Trust, Inc. | tmb-20210210x8k.htm |
Exhibit 99.2
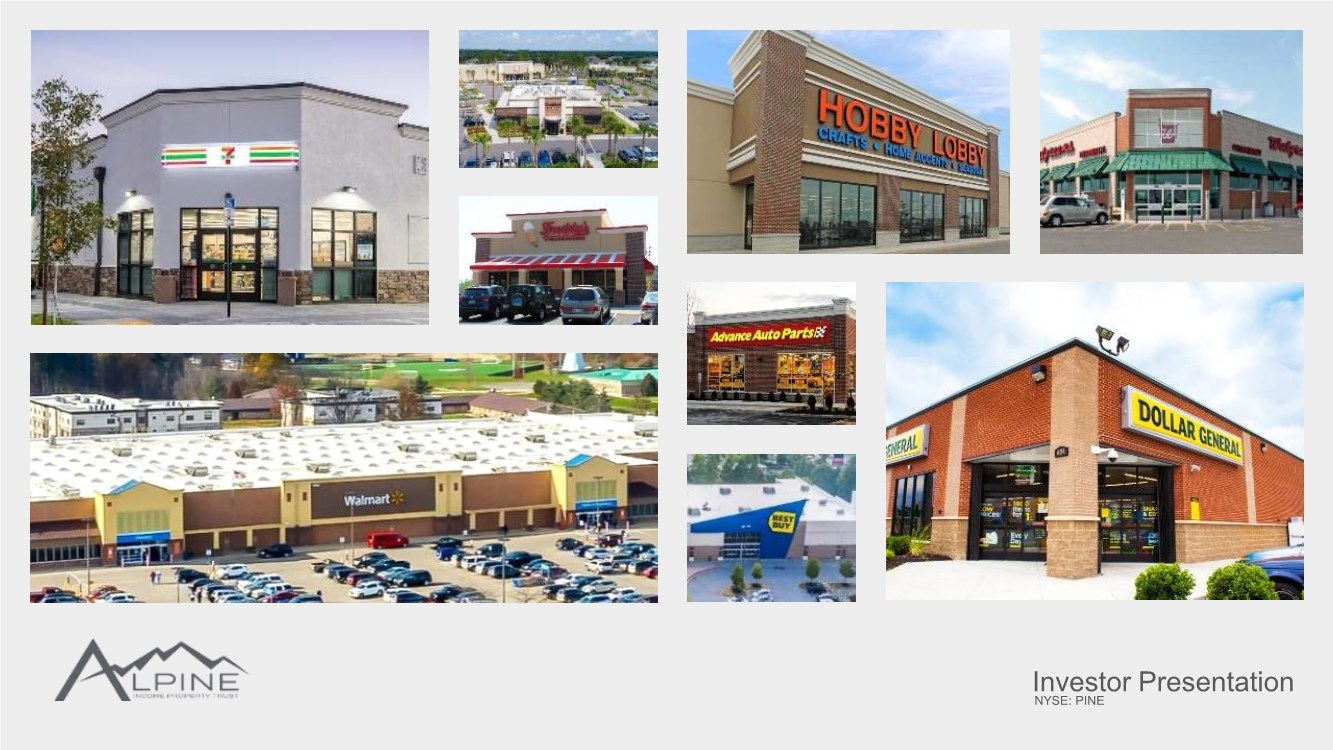
| Investor Presentation February 2021 NYSE: PINE |

| Forward-Looking Statements & Disclaimer This presentation may contain “forward-looking statements.” Forward-looking statements include statements that may be identified by words such as “could,” “may,” “might,” “will,” “likely,” “anticipates,” “intends,” “plans,” “seeks,” “believes,” “estimates,” “expects,” “continues,” “projects” and similar references to future periods, or by the inclusion of forecasts or projections. Forward-looking statements are based on the Company’s current expectations and assumptions regarding capital market conditions, the Company’s business, the economy and other future conditions. Because forward-looking statements relate to the future, by their nature, they are subject to inherent uncertainties, risks and changes in circumstances that are difficult to predict. As a result, the Company’s actual results may differ materially from those contemplated by the forward-looking statements. Important factors that could cause actual results to differ materially from those in the forward-looking statements include general business and economic conditions, continued volatility and uncertainty in the credit markets and broader financial markets, risks inherent in the real estate business, including tenant defaults, potential liability relating to environmental matters, illiquidity of real estate investments and potential damages from natural disasters, the impact of the COVID-19 Pandemic on the Company’s business and the business of its tenants and the impact on the U.S. economy and market conditions generally, other factors affecting the Company’s business or the business of its tenants that are beyond the control of the Company or its tenants, and the factors set forth under “Risk Factors” in the Company’s Annual Report on Form 10-K for the year ended December 31, 2019 and its Quarterly Report on Form 10-Q for the quarter ended September 30, 2020. Any forward-looking statement made in this presentation speaks only as of the date on which it is made. The Company undertakes no obligation to publicly update or revise any forward-looking statement, whether as a result of new information, future developments or otherwise. References in this presentation: A. All information is as of February 10, 2021, unless otherwise noted. B. Annualized straight-line Base Rent (“ABR”) is calculated based on our current portfolio as of February 10, 2021. C.Net asset value (“NAV”) is the value per share of the Company’s assets, net of its liabilities, and any reference to NAV is in reference to independent research analyst assessments and calculations of the Company’s NAV. The Company does not publish its internal NAV estimate and the information contained herein should not be construed as the Company’s opinion regarding its value per share. D.Dividends, subject to the required dividends to maintain our qualification as a REIT, are set by the Board of Directors and declared on a quarterly basis and there can be no assurances as to the likelihood or amount of dividends in the future. E. A credit rated, or investment grade rated tenant (a tenant carrying a rating of BBB- or Baa3 or higher) is a tenant or the parent of a tenant with a credit rating from S&P Global Ratings, Moody’s Investors Service, Fitch Ratings or the National Associated of Insurance Commissioners (NAIC). F. Contractual Base Rent (“CBR”) represents the amount owed to the Company under the terms of its lease agreements at the time referenced. Use of Non-GAAP Financial Information Our reported results are presented in accordance with GAAP. We also disclose Funds From Operations (‘FFO’) and Adjusted Funds From Operations (‘AFFO’) both of which are non-GAAP financial measures. We believe these two non-GAAP financial measures are useful to investors because they are widely accepted industry measures used by analysts and investors to compare the operating performance of REITs. FFO and AFFO do not represent cash generated from operating activities and are not necessarily indicative of cash available to fund cash requirements; accordingly, they should not be considered alternatives to net income as a performance measure or cash flows from operations as reported on our statement of cash flows as a liquidity measure and should be considered in addition to, and not in lieu of, GAAP financial measures. We compute FFO in accordance with the definition adopted by the Board of Governors of the National Association of Real Estate Investment Trusts, or NAREIT. NAREIT defines FFO as GAAP net income or loss adjusted to exclude extraordinary items (as defined by GAAP), net gain or loss from sales of depreciable real estate assets, impairment write-downs associated with depreciable real estate assets and real estate related depreciation and amortization, including the pro rata share of such adjustments of unconsolidated subsidiaries. To derive AFFO, we modify the NAREIT computation of FFO to include other adjustments to GAAP net income related to non-cash revenues and expenses such as straight-line rental revenue, amortization of deferred financing costs, amortization of capitalized lease incentives and above- and below-market lease related intangibles, and non-cash compensation. Such items may cause short-term fluctuations in net income but have no impact on operating cash flows or long-term operating performance. We use AFFO as one measure of our performance when we formulate corporate goals. FFO is used by management, investors and analysts to facilitate meaningful comparisons of operating performance between periods and among our peers primarily because it excludes the effect of real estate depreciation and amortization and net gains on sales, which are based on historical costs and implicitly assume that the value of real estate diminishes predictably over time, rather than fluctuating based on existing market conditions. We believe that AFFO is an additional useful supplemental measure for investors to consider because it will help them to better assess our operating performance without the distortions created by other non-cash revenues or expenses. FFO and AFFO may not be comparable to similarly titled measures employed by other companies. Investor Inquiries: Matthew M. Partridge Senior Vice President, Chief Financial Officer & Treasurer (386) 944-5643 mpartridge@alpinereit.com 2 |
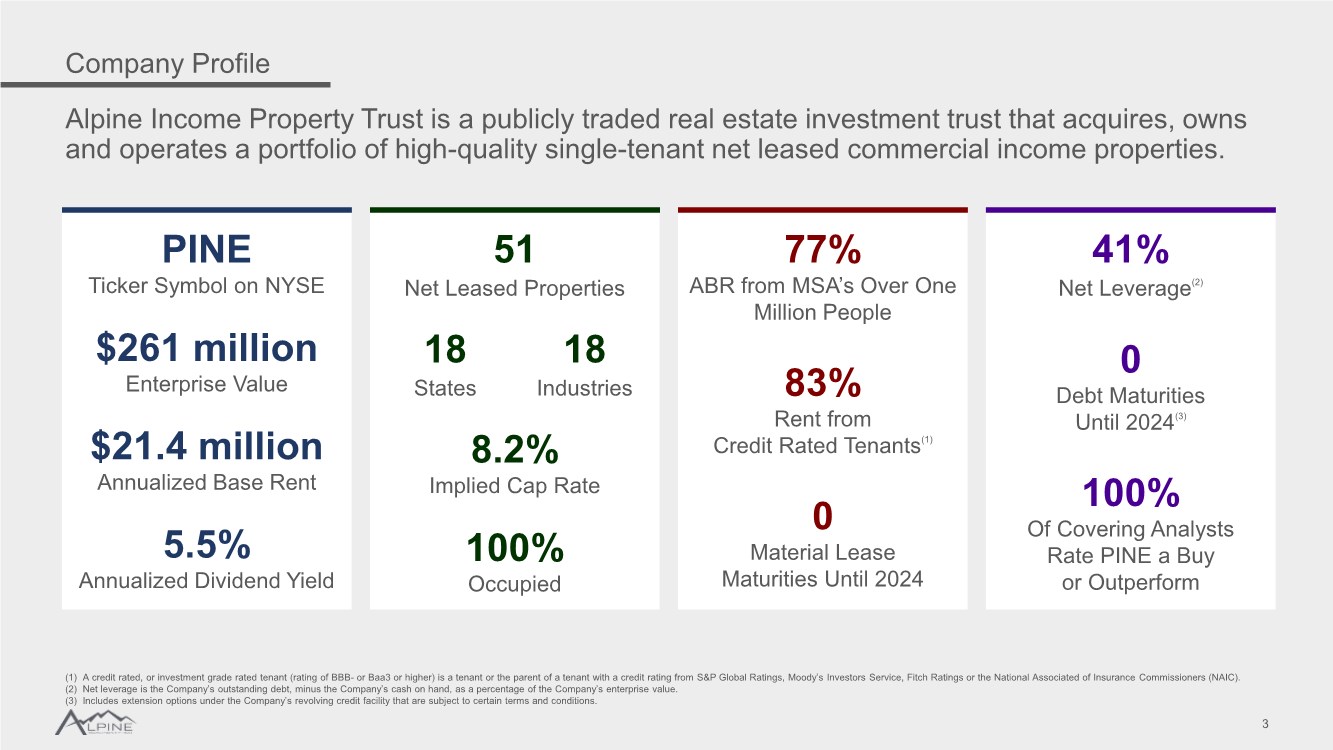
| Company Profile 3 Alpine Income Property Trust is a publicly traded real estate investment trust that acquires, owns and operates a portfolio of high-quality single-tenant net leased commercial income properties. PINE Ticker Symbol on NYSE $261 million Enterprise Value $21.4 million Annualized Base Rent 5.5% Annualized Dividend Yield 51 Net Leased Properties 8.2% Implied Cap Rate 100% Occupied 77% ABR from MSA’s Over One Million People 83% Rent from Credit Rated Tenants(1) 0 Material Lease Maturities Until 2024 (1) A credit rated, or investment grade rated tenant (rating of BBB- or Baa3 or higher) is a tenant or the parent of a tenant with a credit rating from S&P Global Ratings, Moody’s Investors Service, Fitch Ratings or the National Associated of Insurance Commissioners (NAIC). (2) Net leverage is the Company’s outstanding debt, minus the Company’s cash on hand, as a percentage of the Company’s enterprise value. (3) Includes extension options under the Company’s revolving credit facility that are subject to certain terms and conditions. 41% Net Leverage(2) 0 Debt Maturities Until 2024(3) 100% Of Covering Analysts Rate PINE a Buy or Outperform 18 Industries 18 States |
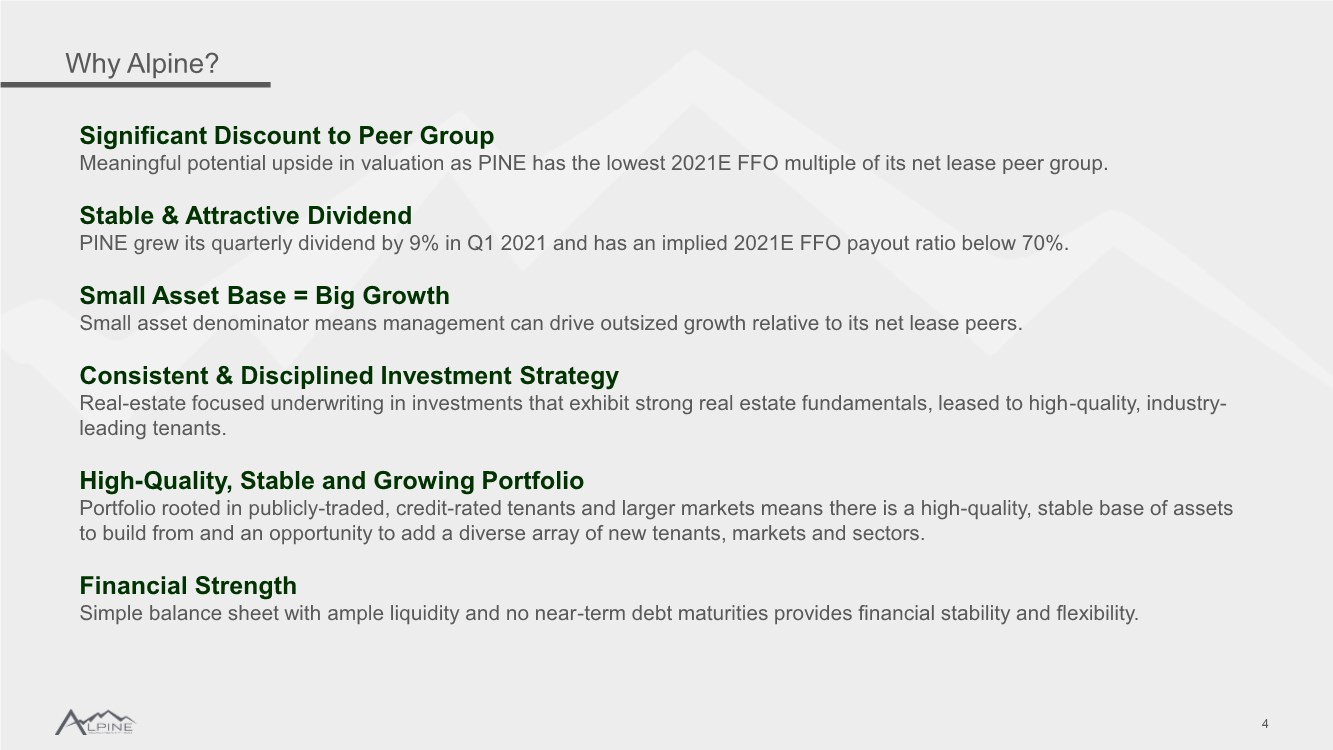
| Why Alpine? 4 Significant Discount to Peer Group Meaningful potential upside in valuation as PINE has the lowest 2021E FFO multiple of its net lease peer group. Stable & Attractive Dividend PINE grew its quarterly dividend by 9% in Q1 2021 and has an implied 2021E FFO payout ratio below 70%. Small Asset Base = Big Growth Small asset denominator means management can drive outsized growth relative to its net lease peers. Consistent & Disciplined Investment Strategy Real-estate focused underwriting in investments that exhibit strong real estate fundamentals, leased to high-quality, industry- leading tenants. High-Quality, Stable and Growing Portfolio Portfolio rooted in publicly-traded, credit-rated tenants and larger markets means there is a high-quality, stable base of assets to build from and an opportunity to add a diverse array of new tenants, markets and sectors. Financial Strength Simple balance sheet with ample liquidity and no near-term debt maturities provides financial stability and flexibility. |
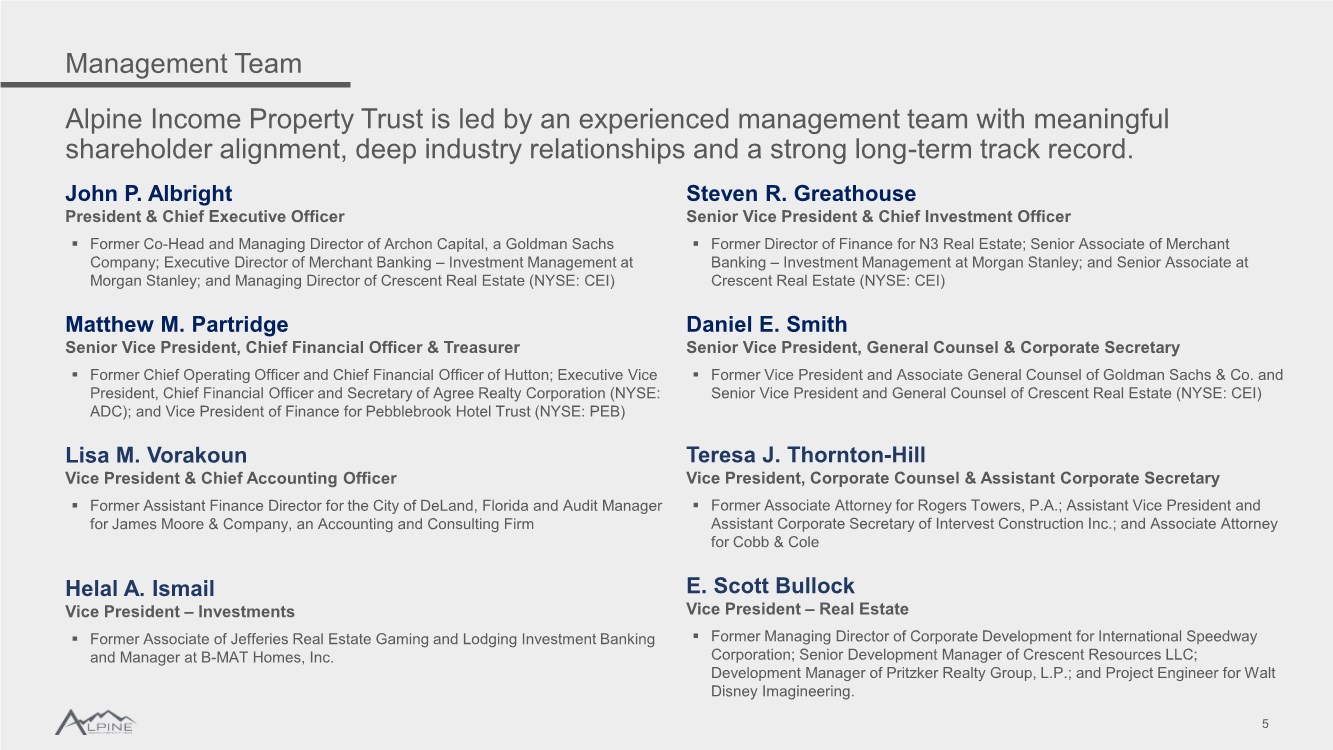
| Management Team 5 Alpine Income Property Trust is led by an experienced management team with meaningful shareholder alignment, deep industry relationships and a strong long-term track record. John P. Albright President & Chief Executive Officer ▪ Former Co-Head and Managing Director of Archon Capital, a Goldman Sachs Company; Executive Director of Merchant Banking – Investment Management at Morgan Stanley; and Managing Director of Crescent Real Estate (NYSE: CEI) Matthew M. Partridge Senior Vice President, Chief Financial Officer & Treasurer ▪ Former Chief Operating Officer and Chief Financial Officer of Hutton; Executive Vice President, Chief Financial Officer and Secretary of Agree Realty Corporation (NYSE: ADC); and Vice President of Finance for Pebblebrook Hotel Trust (NYSE: PEB) Lisa M. Vorakoun Vice President & Chief Accounting Officer ▪ Former Assistant Finance Director for the City of DeLand, Florida and Audit Manager for James Moore & Company, an Accounting and Consulting Firm Helal A. Ismail Vice President – Investments ▪ Former Associate of Jefferies Real Estate Gaming and Lodging Investment Banking and Manager at B-MAT Homes, Inc. Steven R. Greathouse Senior Vice President & Chief Investment Officer ▪ Former Director of Finance for N3 Real Estate; Senior Associate of Merchant Banking – Investment Management at Morgan Stanley; and Senior Associate at Crescent Real Estate (NYSE: CEI) Daniel E. Smith Senior Vice President, General Counsel & Corporate Secretary ▪ Former Vice President and Associate General Counsel of Goldman Sachs & Co. and Senior Vice President and General Counsel of Crescent Real Estate (NYSE: CEI) Teresa J. Thornton-Hill Vice President, Corporate Counsel & Assistant Corporate Secretary ▪ Former Associate Attorney for Rogers Towers, P.A.; Assistant Vice President and Assistant Corporate Secretary of Intervest Construction Inc.; and Associate Attorney for Cobb & Cole E. Scott Bullock Vice President – Real Estate ▪ Former Managing Director of Corporate Development for International Speedway Corporation; Senior Development Manager of Crescent Resources LLC; Development Manager of Pritzker Realty Group, L.P.; and Project Engineer for Walt Disney Imagineering. |
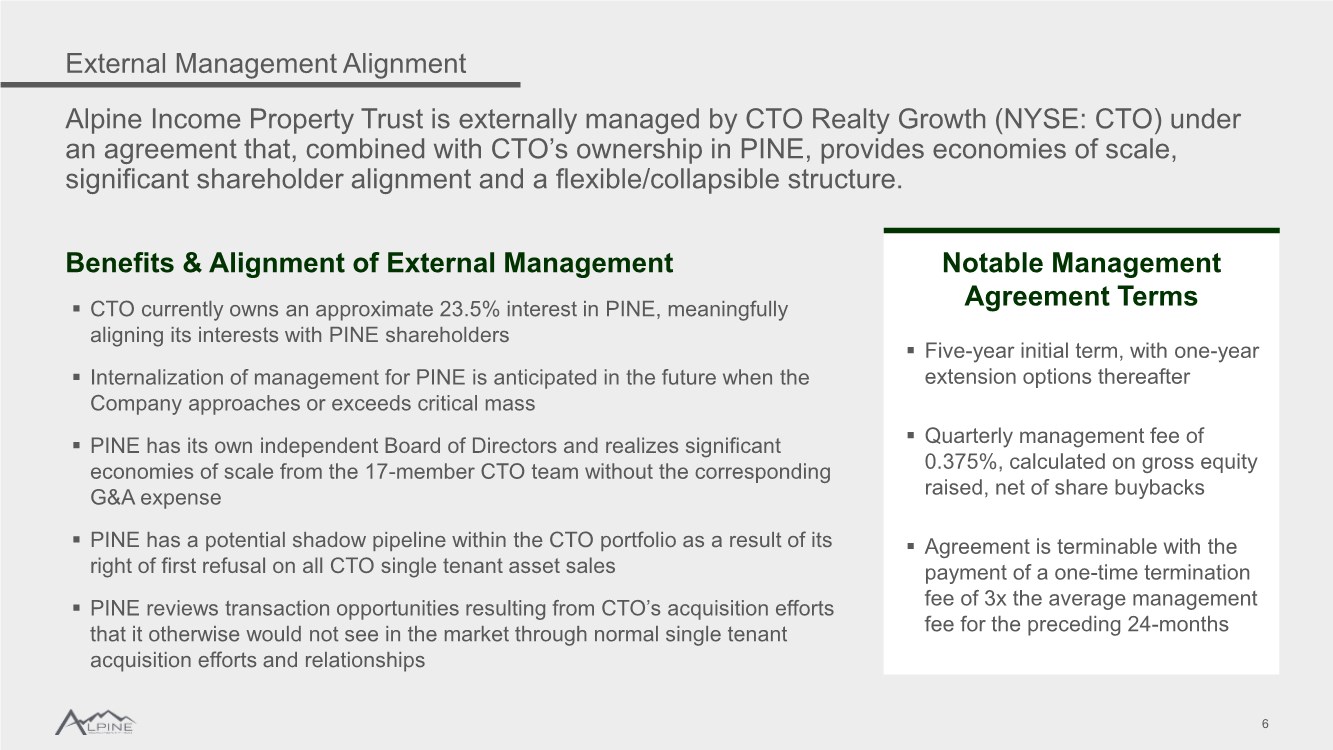
| External Management Alignment 6 Alpine Income Property Trust is externally managed by CTO Realty Growth (NYSE: CTO) under an agreement that, combined with CTO’s ownership in PINE, provides economies of scale, significant shareholder alignment and a flexible/collapsible structure. Notable Management Agreement Terms ▪ Five-year initial term, with one-year extension options thereafter ▪ Quarterly management fee of 0.375%, calculated on gross equity raised, net of share buybacks ▪ Agreement is terminable with the payment of a one-time termination fee of 3x the average management fee for the preceding 24-months Benefits & Alignment of External Management ▪ CTO currently owns an approximate 23.5% interest in PINE, meaningfully aligning its interests with PINE shareholders ▪ Internalization of management for PINE is anticipated in the future when the Company approaches or exceeds critical mass ▪ PINE has its own independent Board of Directors and realizes significant economies of scale from the 17-member CTO team without the corresponding G&A expense ▪ PINE has a potential shadow pipeline within the CTO portfolio as a result of its right of first refusal on all CTO single tenant asset sales ▪ PINE reviews transaction opportunities resulting from CTO’s acquisition efforts that it otherwise would not see in the market through normal single tenant acquisition efforts and relationships |
| Investment Strategy & Execution 7 Investment Strategy & Execution Single Tenant Portfolio Metrics Industry & Peer Comparisons Financial Strength Appendix |
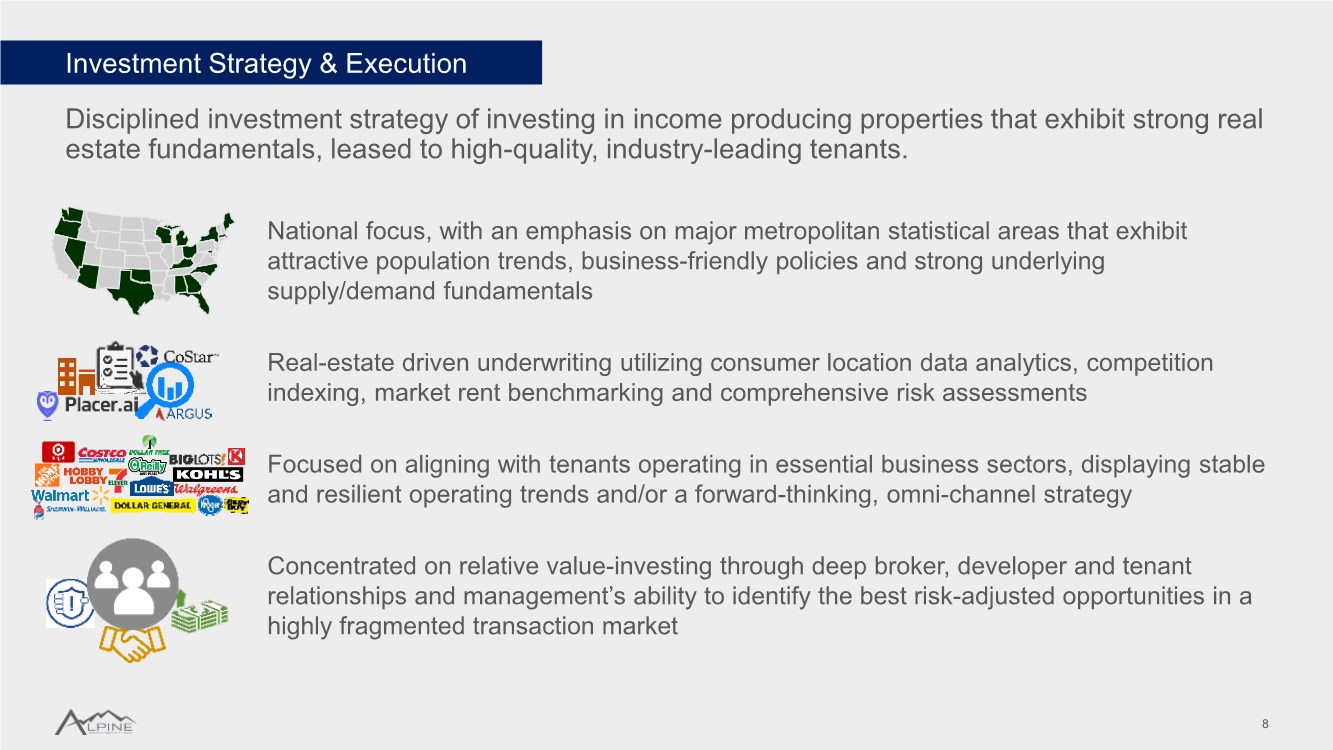
| Investment Strategy & Execution 8 Disciplined investment strategy of investing in income producing properties that exhibit strong real estate fundamentals, leased to high-quality, industry-leading tenants. National focus, with an emphasis on major metropolitan statistical areas that exhibit attractive population trends, business-friendly policies and strong underlying supply/demand fundamentals Real-estate driven underwriting utilizing consumer location data analytics, competition indexing, market rent benchmarking and comprehensive risk assessments Focused on aligning with tenants operating in essential business sectors, displaying stable and resilient operating trends and/or a forward-thinking, omni-channel strategy Concentrated on relative value-investing through deep broker, developer and tenant relationships and management’s ability to identify the best risk-adjusted opportunities in a highly fragmented transaction market |
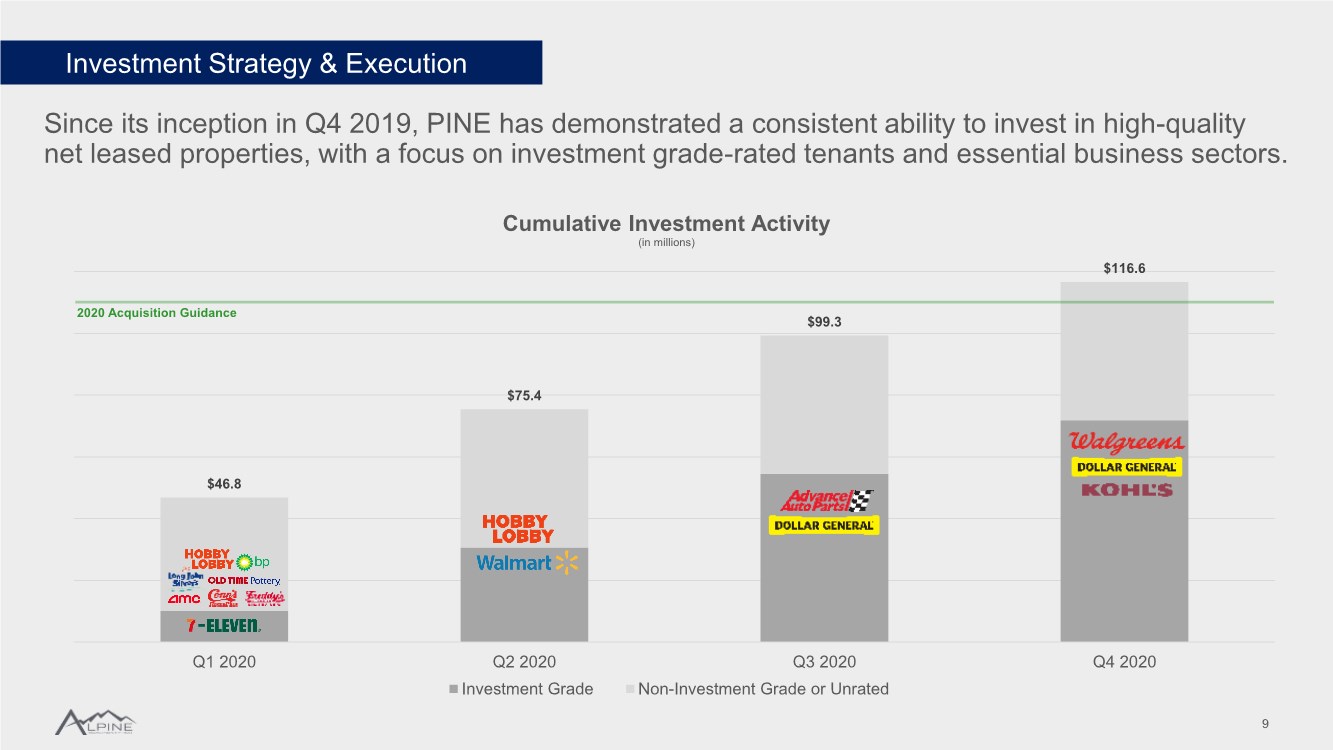
| Since its inception in Q4 2019, PINE has demonstrated a consistent ability to invest in high-quality net leased properties, with a focus on investment grade-rated tenants and essential business sectors. Investment Strategy & Execution 9 $46.8 $75.4 $99.3 $116.6 Q1 2020 Q2 2020 Q3 2020 Q4 2020 Cumulative Investment Activity (in millions) Investment Grade Non-Investment Grade or Unrated |
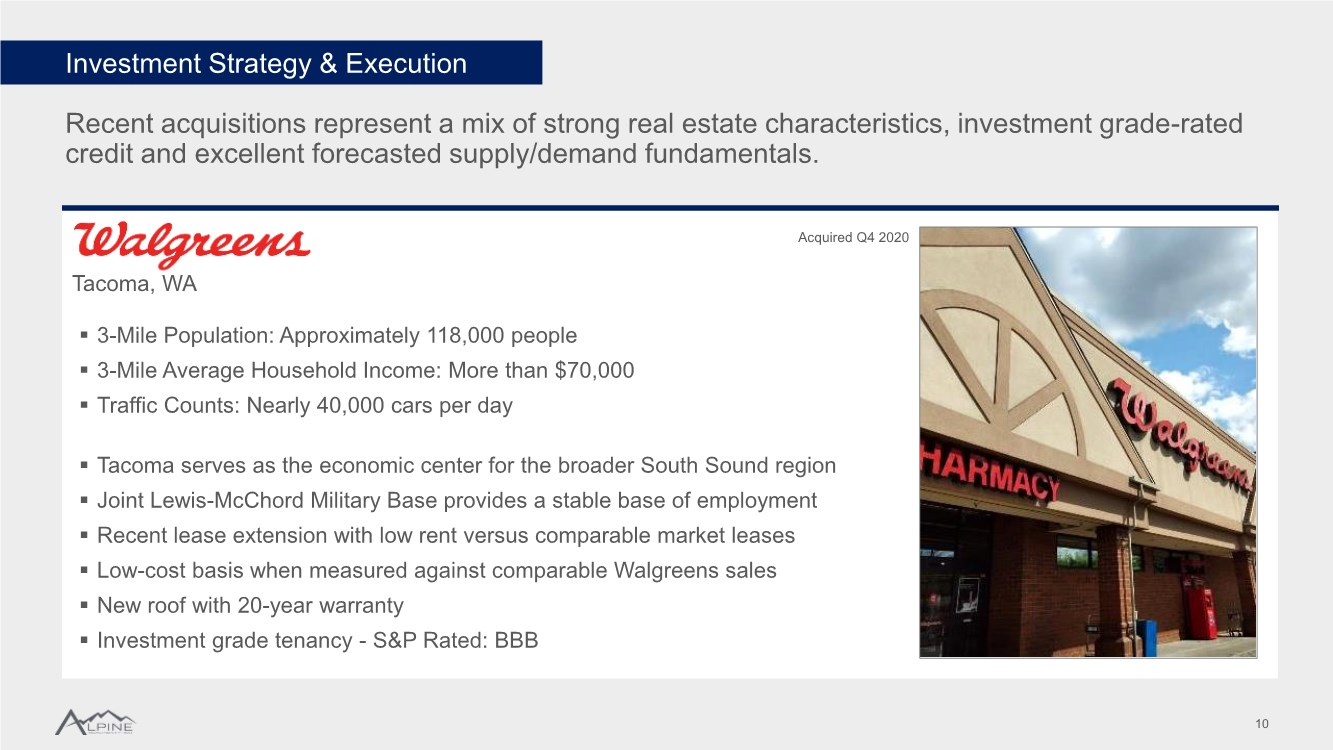
| Recent acquisitions represent a mix of strong real estate characteristics, investment grade-rated credit and excellent forecasted supply/demand fundamentals. Investment Strategy & Execution 10 Tacoma, WA ▪ 3-Mile Population: Approximately 118,000 people ▪ 3-Mile Average Household Income: More than $70,000 ▪ Traffic Counts: Nearly 40,000 cars per day ▪ Tacoma serves as the economic center for the broader South Sound region ▪ Joint Lewis-McChord Military Base provides a stable base of employment ▪ Recent lease extension with low rent versus comparable market leases ▪ Low-cost basis when measured against comparable Walgreens sales ▪ New roof with 20-year warranty ▪ Investment grade tenancy - S&P Rated: BBB Acquired Q4 2020 |
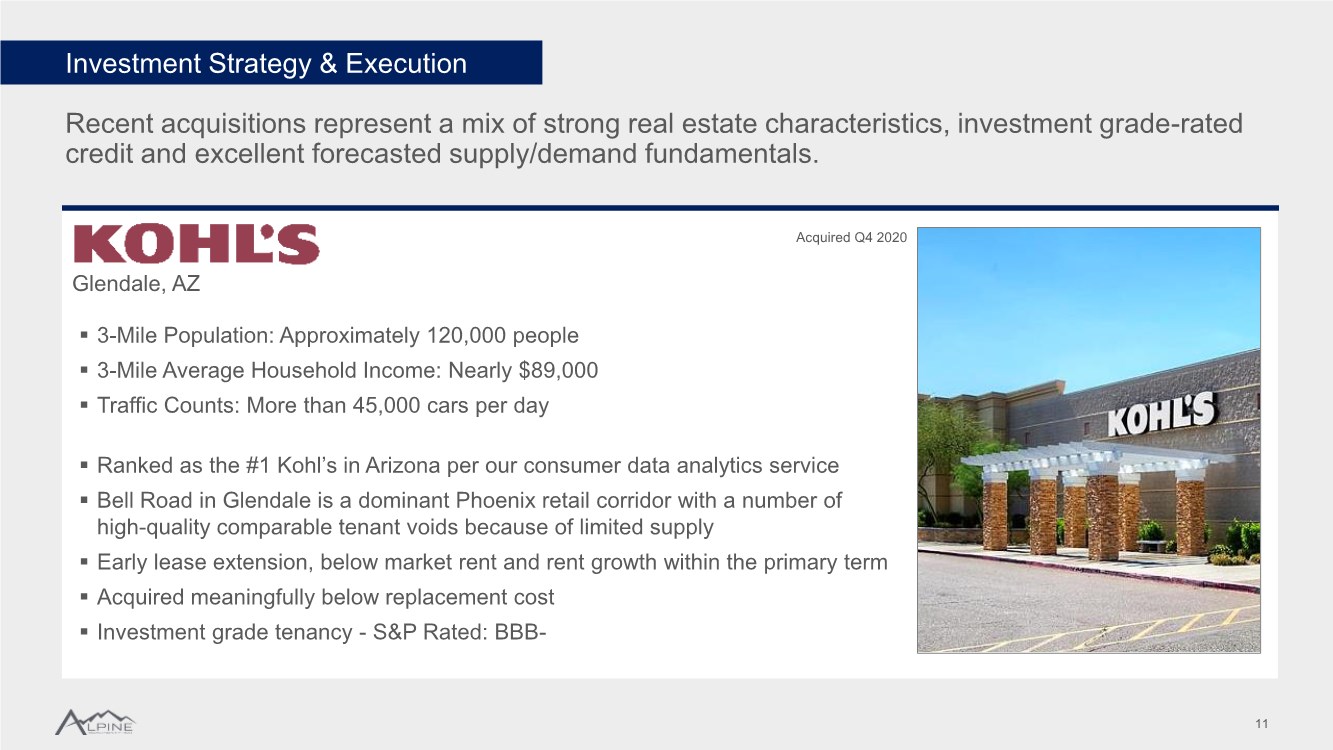
| Recent acquisitions represent a mix of strong real estate characteristics, investment grade-rated credit and excellent forecasted supply/demand fundamentals. Investment Strategy & Execution 11 Glendale, AZ ▪ 3-Mile Population: Approximately 120,000 people ▪ 3-Mile Average Household Income: Nearly $89,000 ▪ Traffic Counts: More than 45,000 cars per day ▪ Ranked as the #1 Kohl’s in Arizona per our consumer data analytics service ▪ Bell Road in Glendale is a dominant Phoenix retail corridor with a number of high-quality comparable tenant voids because of limited supply ▪ Early lease extension, below market rent and rent growth within the primary term ▪ Acquired meaningfully below replacement cost ▪ Investment grade tenancy - S&P Rated: BBB- Acquired Q4 2020 |
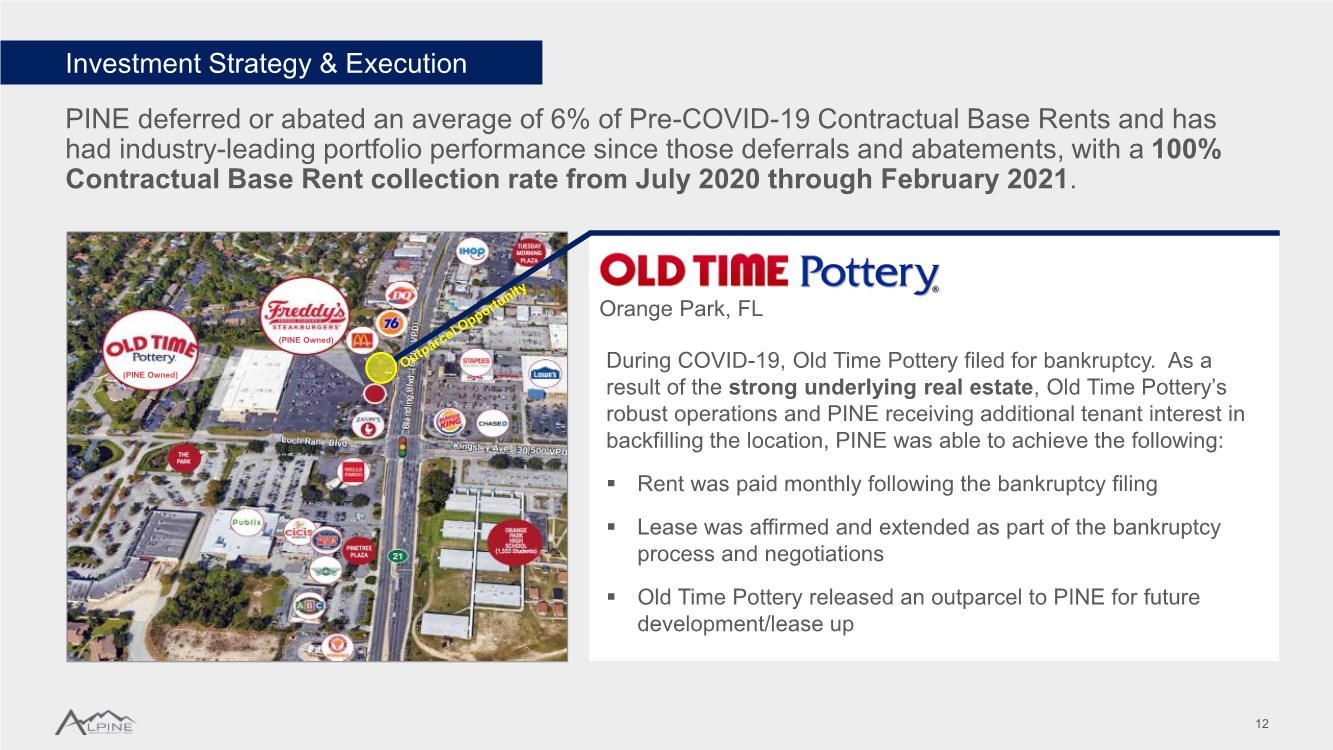
| Investment Strategy & Execution 12 PINE deferred or abated an average of 6% of Pre-COVID-19 Contractual Base Rents and has had industry-leading portfolio performance since those deferrals and abatements, with a 100% Contractual Base Rent collection rate from July 2020 through February 2021. Orange Park, FL During COVID-19, Old Time Pottery filed for bankruptcy. As a result of the strong underlying real estate, Old Time Pottery’s robust operations and PINE receiving additional tenant interest in backfilling the location, PINE was able to achieve the following: ▪ Rent was paid monthly following the bankruptcy filing ▪ Lease was affirmed and extended as part of the bankruptcy process and negotiations ▪ Old Time Pottery released an outparcel to PINE for future development/lease up (PINE Owned) (PINE Owned) |
| Single Tenant Portfolio Metrics 13 Investment Strategy & Execution Single Tenant Portfolio Metrics Industry & Peer Comparisons Financial Strength Appendix |
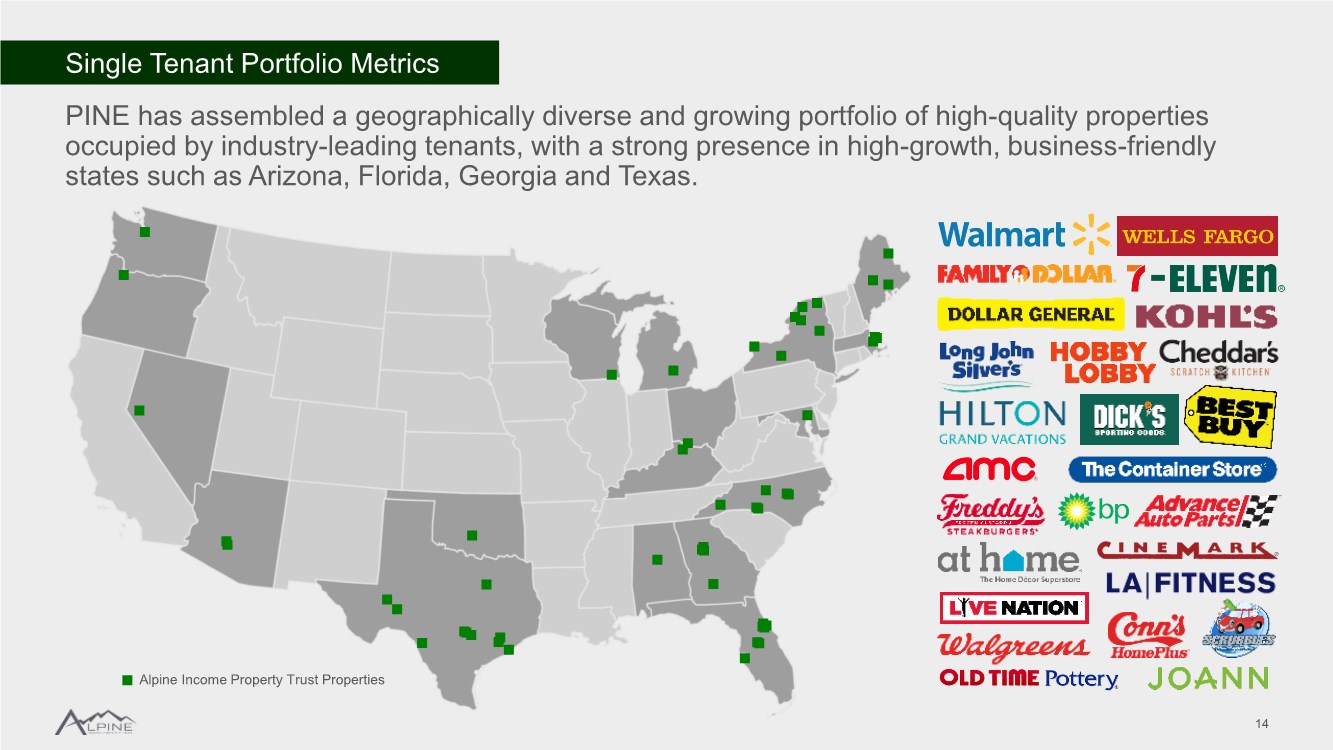
| Single Tenant Portfolio Metrics 14 PINE has assembled a geographically diverse and growing portfolio of high-quality properties occupied by industry-leading tenants, with a strong presence in high-growth, business-friendly states such as Arizona, Florida, Georgia and Texas. Alpine Income Property Trust Properties |
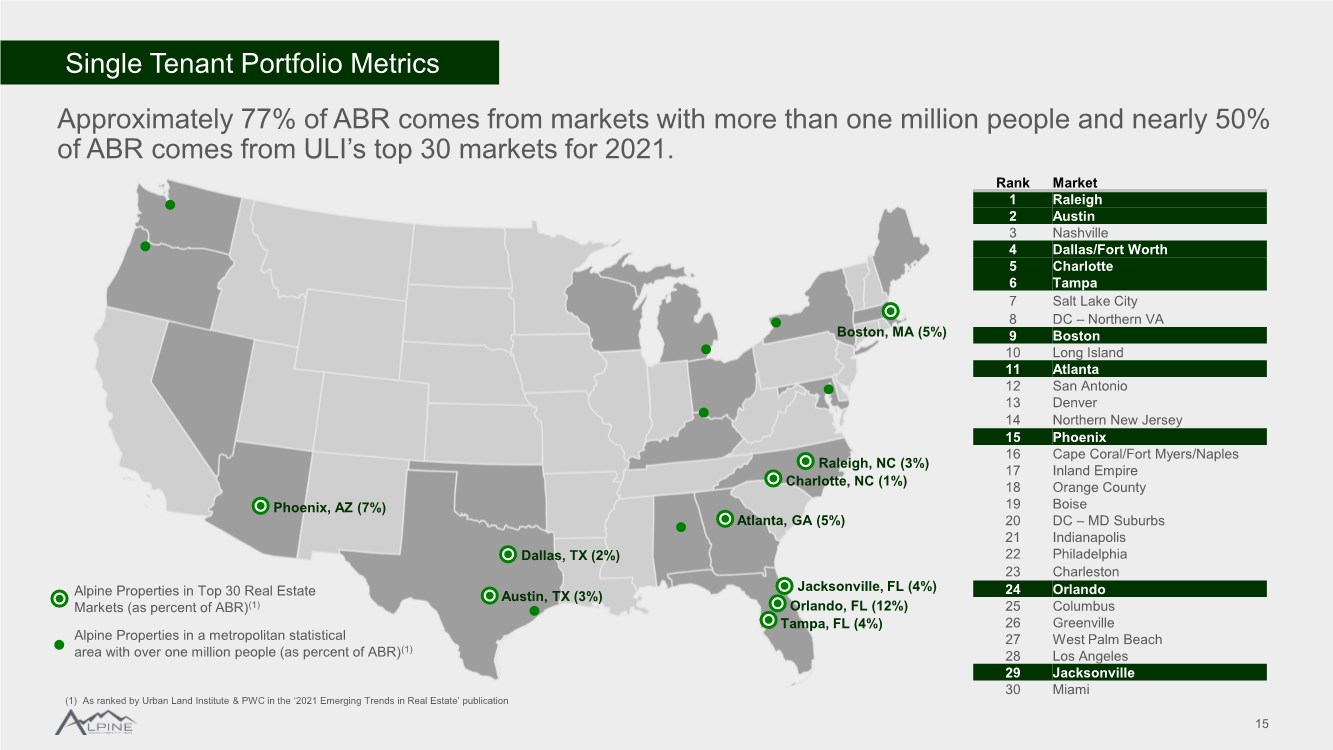
| Single Tenant Portfolio Metrics 15 Approximately 77% of ABR comes from markets with more than one million people and nearly 50% of ABR comes from ULI’s top 30 markets for 2021. Rank Market 1 Raleigh 2 Austin 3 Nashville 4 Dallas/Fort Worth 5 Charlotte 6 Tampa 7 Salt Lake City 8 DC – Northern VA 9 Boston 10 Long Island 11 Atlanta 12 San Antonio 13 Denver 14 Northern New Jersey 15 Phoenix 16 Cape Coral/Fort Myers/Naples 17 Inland Empire 18 Orange County 19 Boise 20 DC – MD Suburbs 21 Indianapolis 22 Philadelphia 23 Charleston 24 Orlando 25 Columbus 26 Greenville 27 West Palm Beach 28 Los Angeles 29 Jacksonville 30 Miami Alpine Properties in Top 30 Real Estate Markets (as percent of ABR)(1) Alpine Properties in a metropolitan statistical area with over one million people (as percent of ABR)(1) Raleigh, NC (3%) Boston, MA (5%) Charlotte, NC (1%) Atlanta, GA (5%) Jacksonville, FL (4%) Orlando, FL (12%) Tampa, FL (4%) Dallas, TX (2%) Austin, TX (3%) Phoenix, AZ (7%) (1) As ranked by Urban Land Institute & PWC in the ‘2021 Emerging Trends in Real Estate’ publication |
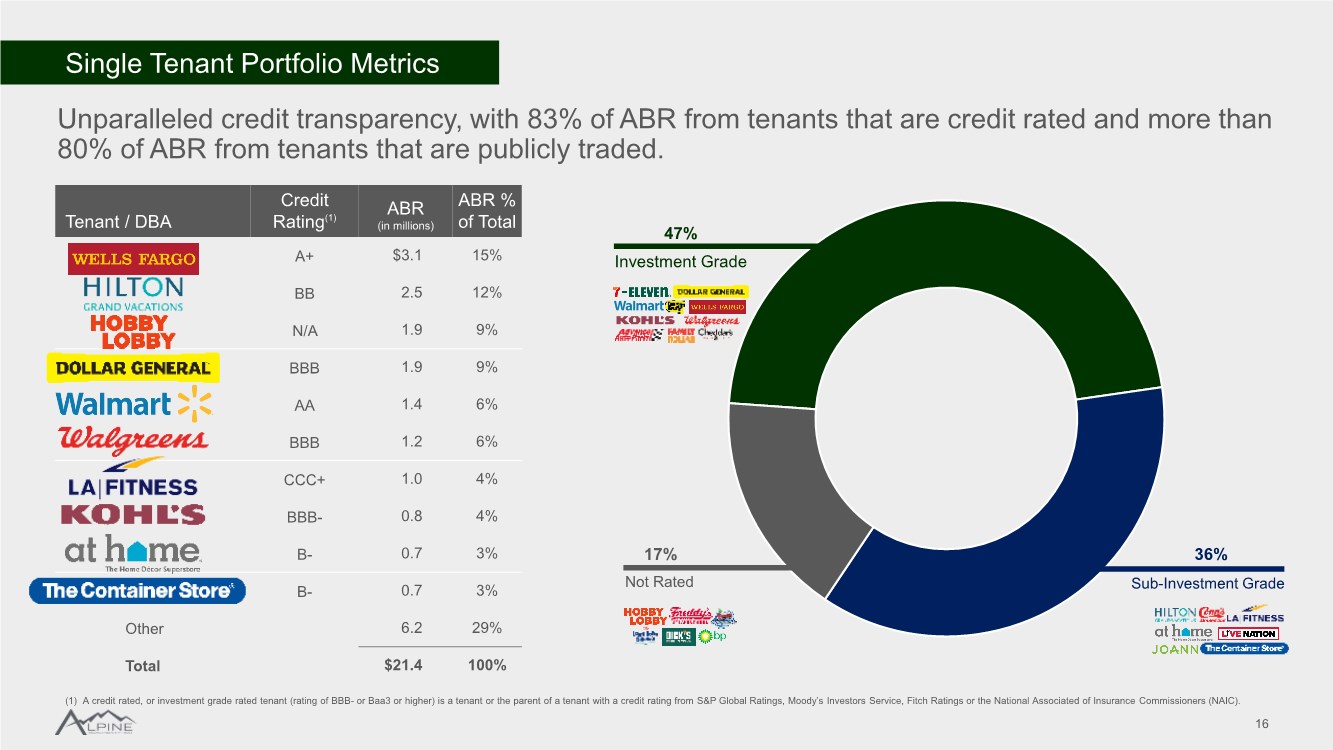
| Single Tenant Portfolio Metrics 16 Unparalleled credit transparency, with 83% of ABR from tenants that are credit rated and more than 80% of ABR from tenants that are publicly traded. Tenant / DBA Credit Rating(1) ABR (in millions) ABR % of Total A+ $3.1 15% BB 2.5 12% N/A 1.9 9% BBB 1.9 9% AA 1.4 6% BBB 1.2 6% CCC+ 1.0 4% BBB- 0.8 4% B- 0.7 3% B- 0.7 3% Other 6.2 29% Total $21.4 100% (1) A credit rated, or investment grade rated tenant (rating of BBB- or Baa3 or higher) is a tenant or the parent of a tenant with a credit rating from S&P Global Ratings, Moody’s Investors Service, Fitch Ratings or the National Associated of Insurance Commissioners (NAIC). Investment Grade 47% Not Rated 17% Sub-Investment Grade 36% |
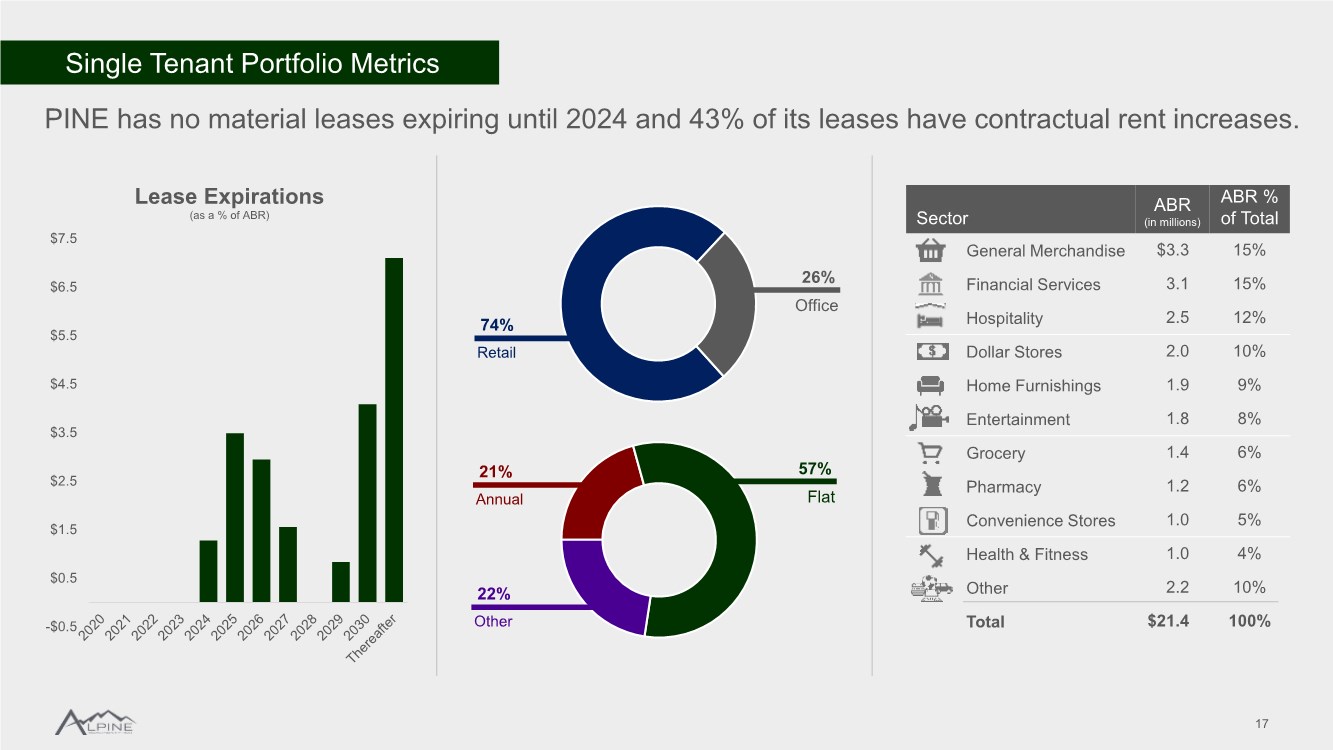
| Single Tenant Portfolio Metrics 17 PINE has no material leases expiring until 2024 and 43% of its leases have contractual rent increases. Sector ABR (in millions) ABR % of Total General Merchandise $3.3 15% Financial Services 3.1 15% Hospitality 2.5 12% Dollar Stores 2.0 10% Home Furnishings 1.9 9% Entertainment 1.8 8% Grocery 1.4 6% Pharmacy 1.2 6% Convenience Stores 1.0 5% Health & Fitness 1.0 4% Other 2.2 10% Total $21.4 100% -$0.5 $0.5 $1.5 $2.5 $3.5 $4.5 $5.5 $6.5 $7.5 Lease Expirations (as a % of ABR) Retail 74% Office 26% Other 22% Flat 57% Annual 21% |
| Industry & Peer Comparisons 18 Investment Strategy & Execution Single Tenant Portfolio Metrics Industry & Peer Comparisons Financial Strength Appendix |
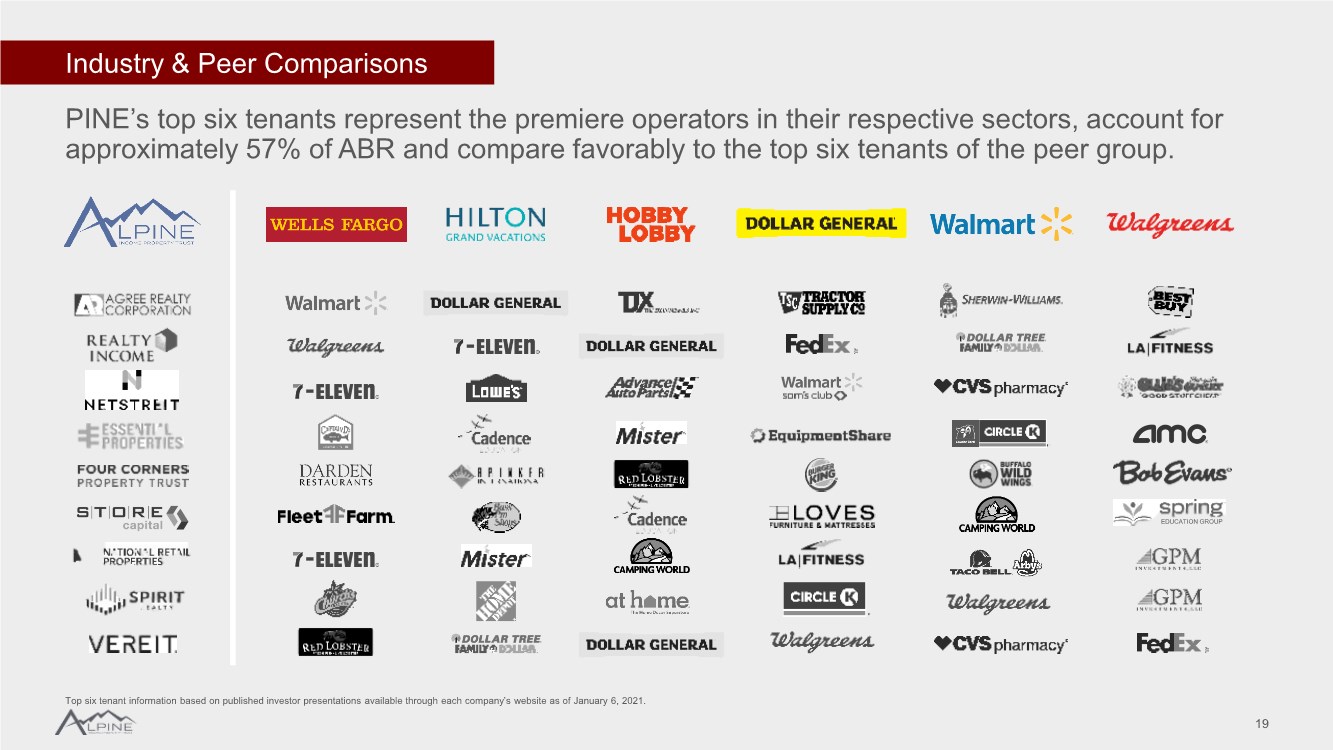
| Industry & Peer Comparisons 19 PINE’s top six tenants represent the premiere operators in their respective sectors, account for approximately 57% of ABR and compare favorably to the top six tenants of the peer group. EDUCATION GROUP Top six tenant information based on published investor presentations available through each company’s website as of January 6, 2021. |
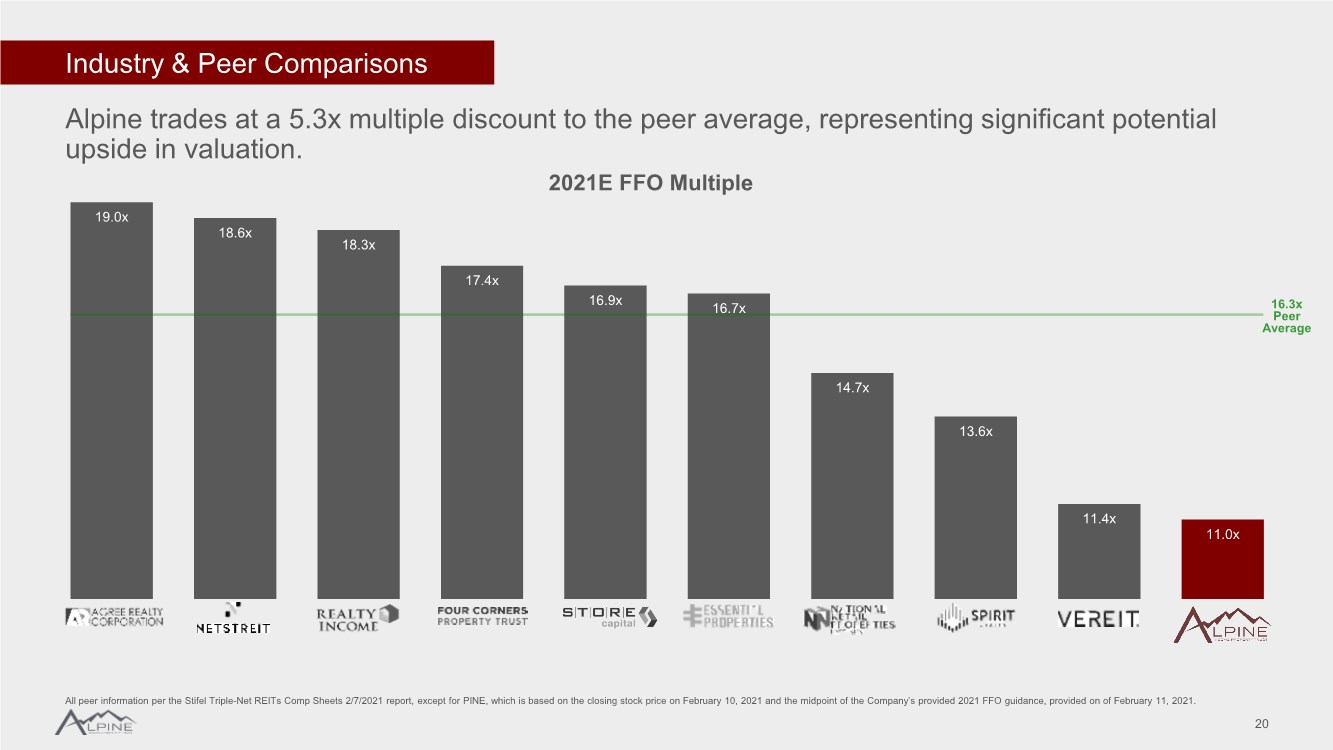
| Industry & Peer Comparisons 20 Alpine trades at a 5.3x multiple discount to the peer average, representing significant potential upside in valuation. 19.0x 18.6x 18.3x 17.4x 16.9x 16.7x 14.7x 13.6x 11.4x 11.0x 2021E FFO Multiple All peer information per the Stifel Triple-Net REITs Comp Sheets 2/7/2021 report, except for PINE, which is based on the closing stock price on February 10, 2021 and the midpoint of the Company’s provided 2021 FFO guidance, provided on of February 11, 2021. |
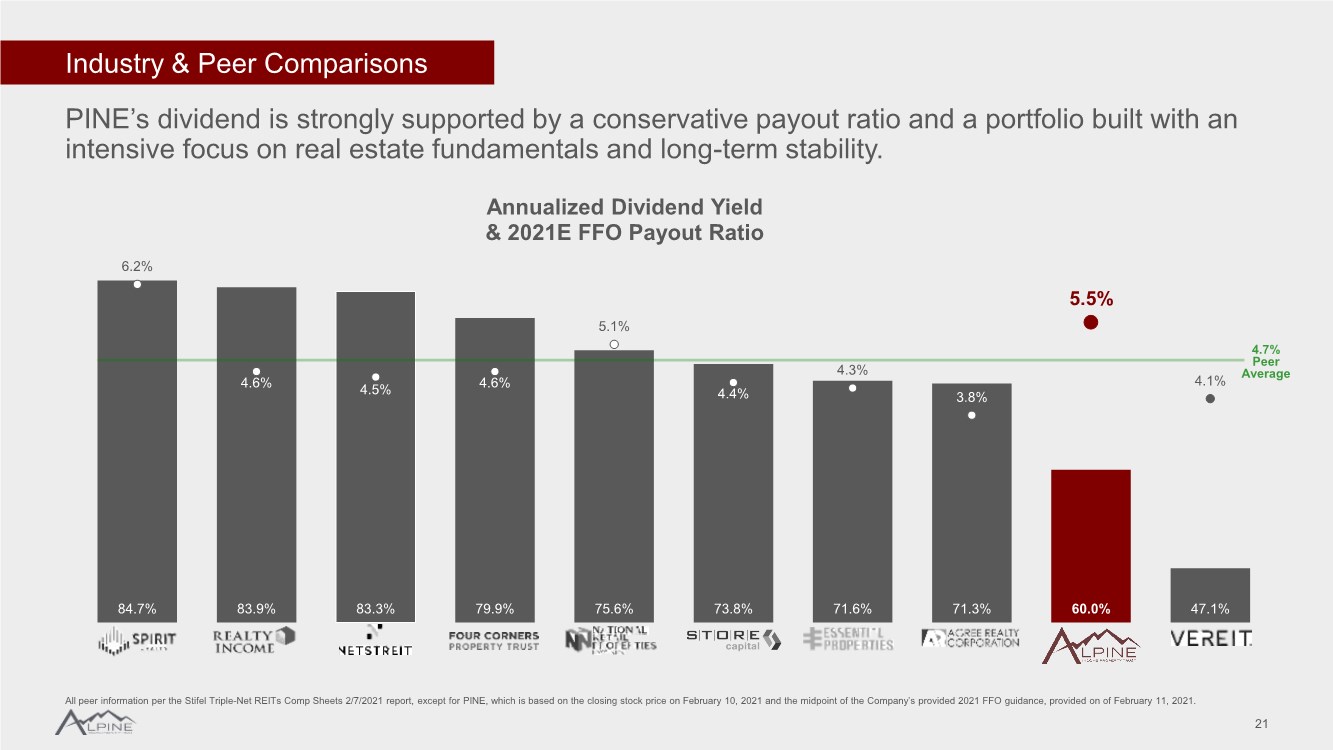
| PINE’s dividend is strongly supported by a conservative payout ratio and a portfolio built with an intensive focus on real estate fundamentals and long-term stability. 84.7% 83.9% 83.3% 79.9% 75.6% 73.8% 71.6% 71.3% 60.0% 47.1% 6.2% 4.6% 4.5% 4.6% 5.1% 4.4% 4.3% 3.8% 5.5% 4.1% Annualized Dividend Yield & 2021E FFO Payout Ratio Industry & Peer Comparisons 21 All peer information per the Stifel Triple-Net REITs Comp Sheets 2/7/2021 report, except for PINE, which is based on the closing stock price on February 10, 2021 and the midpoint of the Company’s provided 2021 FFO guidance, provided on of February 11, 2021. |
| Financial Strength 22 Investment Strategy & Execution Single Tenant Portfolio Metrics Industry & Peer Comparisons Financial Strength Appendix |
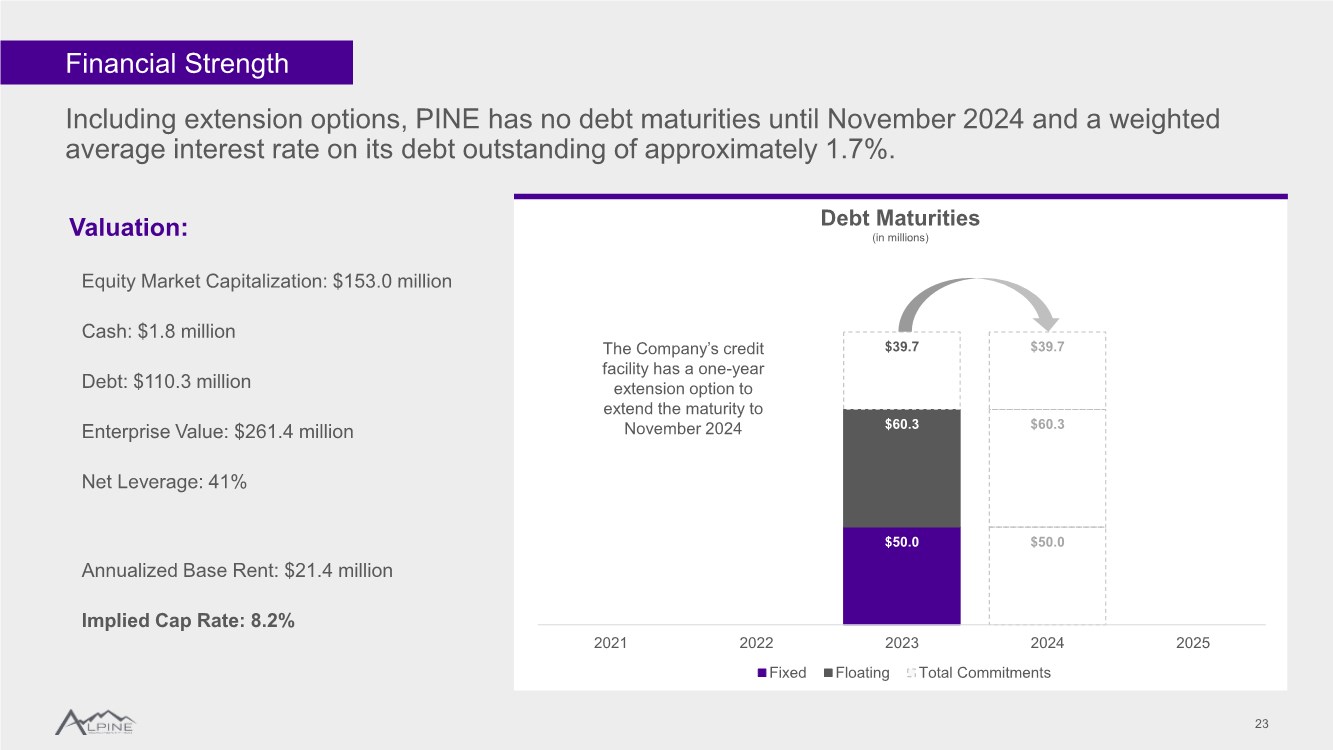
| Financial Strength 23 Including extension options, PINE has no debt maturities until November 2024 and a weighted average interest rate on its debt outstanding of approximately 1.7%. Debt Maturities (in millions) $50.0 $50.0 $60.3 $60.3 $39.7 $39.7 2021 2022 2023 2024 2025 Fixed Floating Total Commitments The Company’s credit facility has a one-year extension option to extend the maturity to November 2024 Valuation: Equity Market Capitalization: $153.0 million Cash: $1.8 million Debt: $110.3 million Enterprise Value: $261.4 million Net Leverage: 41% Annualized Base Rent: $21.4 million Implied Cap Rate: 8.2% |
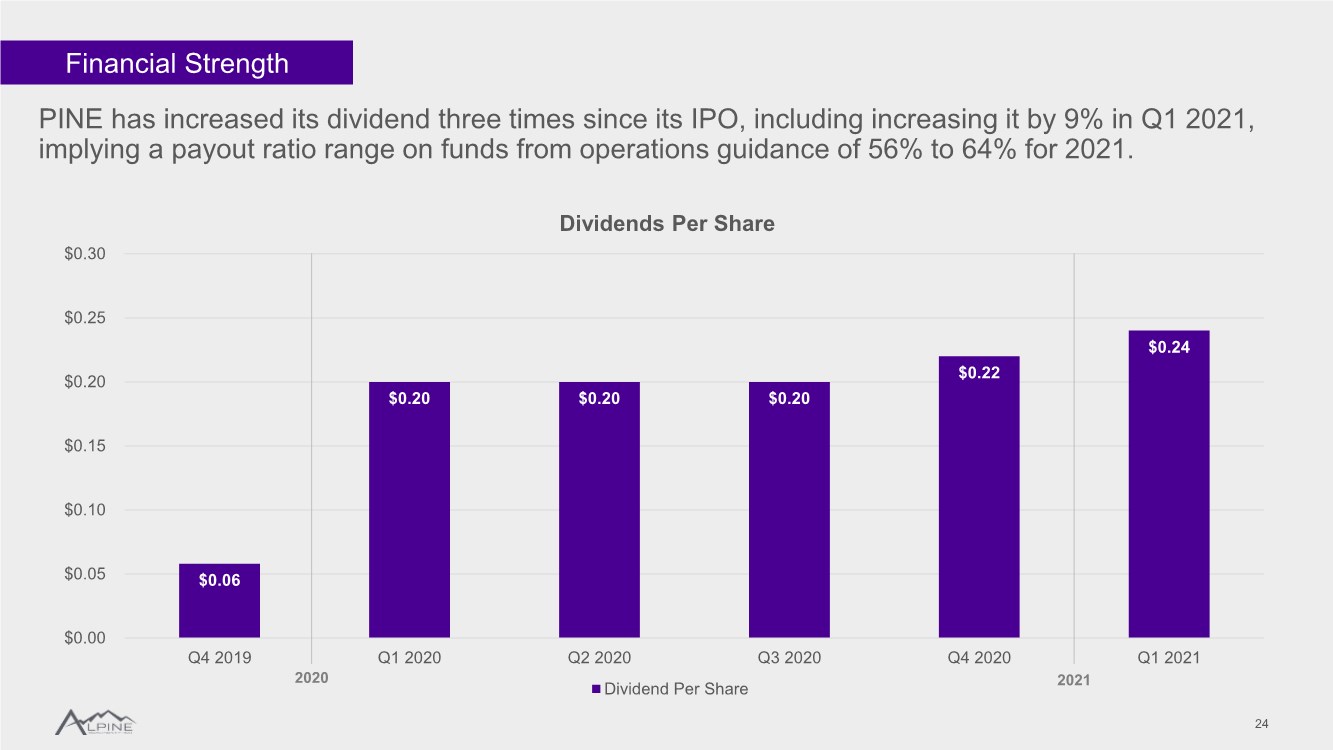
| Financial Strength 24 PINE has increased its dividend three times since its IPO, including increasing it by 9% in Q1 2021, implying a payout ratio range on funds from operations guidance of 56% to 64% for 2021. $0.06 $0.20 $0.20 $0.20 $0.22 $0.24 $0.00 $0.05 $0.10 $0.15 $0.20 $0.25 $0.30 Q4 2019 Q1 2020 Q2 2020 Q3 2020 Q4 2020 Q1 2021 Dividends Per Share Dividend Per Share 2020 2021 |
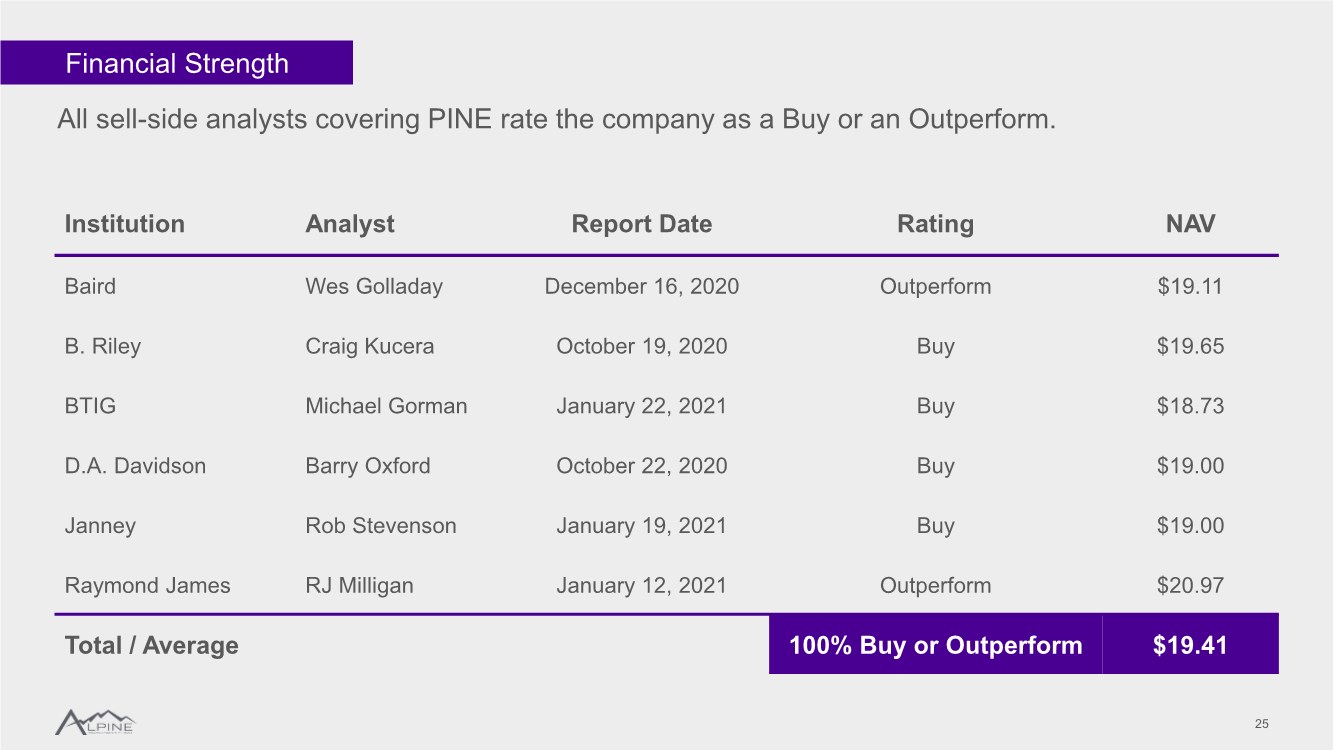
| Financial Strength 25 Institution Analyst Report Date Rating NAV Baird Wes Golladay December 16, 2020 Outperform $19.11 B. Riley Craig Kucera October 19, 2020 Buy $19.65 BTIG Michael Gorman January 22, 2021 Buy $18.73 D.A. Davidson Barry Oxford October 22, 2020 Buy $19.00 Janney Rob Stevenson January 19, 2021 Buy $19.00 Raymond James RJ Milligan January 12, 2021 Outperform $20.97 Total / Average 100% Buy or Outperform $19.41 All sell-side analysts covering PINE rate the company as a Buy or an Outperform. |
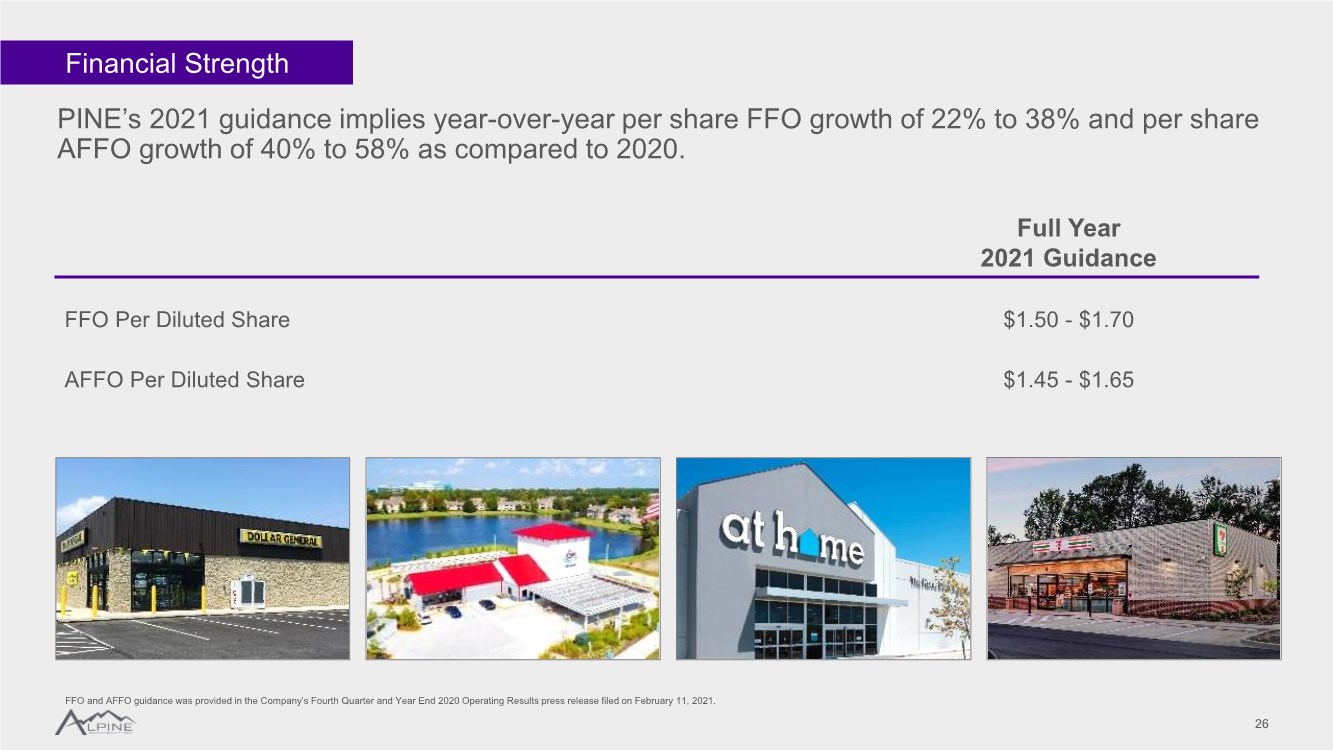
| PINE’s 2021 guidance implies year-over-year per share FFO growth of 22% to 38% and per share AFFO growth of 40% to 58% as compared to 2020. Financial Strength 26 Full Year 2021 Guidance FFO Per Diluted Share $1.50 - $1.70 AFFO Per Diluted Share $1.45 - $1.65 FFO and AFFO guidance was provided in the Company’s Fourth Quarter and Year End 2020 Operating Results press release filed on February 11, 2021. |
| Appendix 27 Investment Strategy & Execution Single Tenant Portfolio Metrics Industry & Peer Comparisons Financial Strength Appendix |
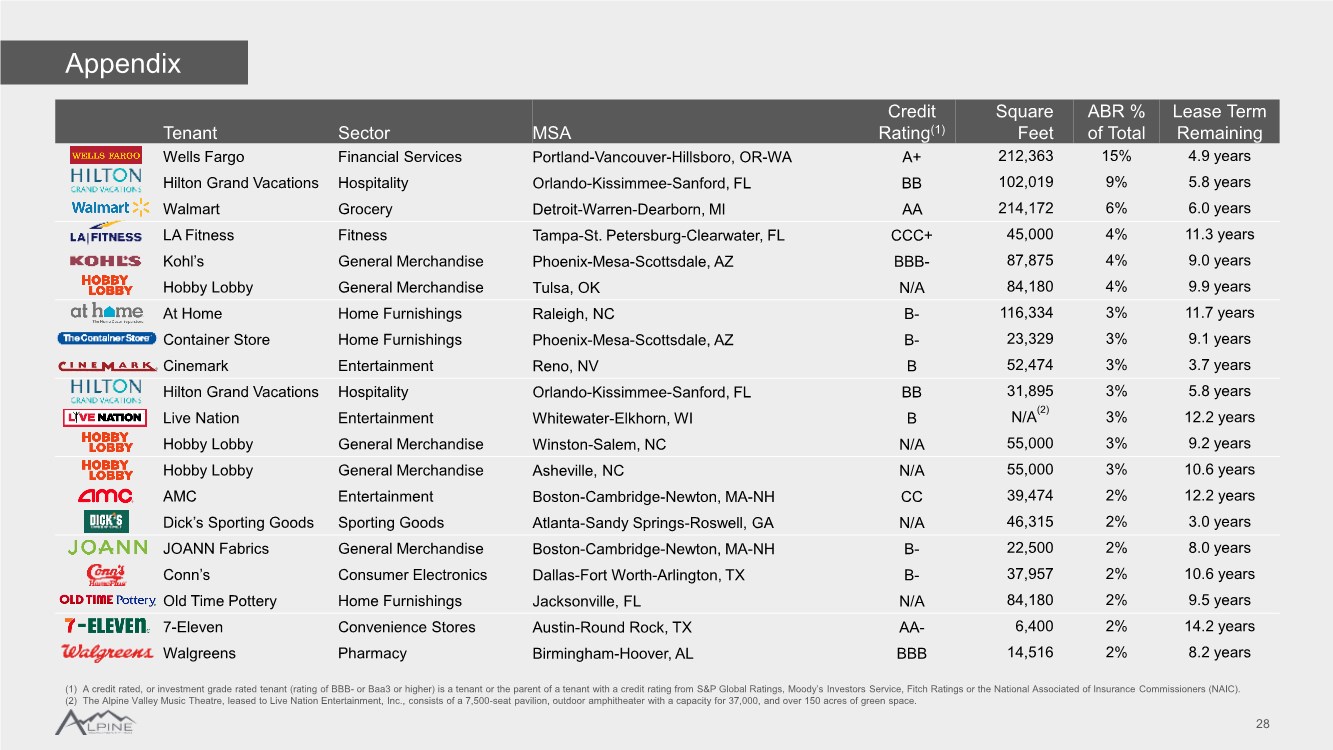
| Appendix 28 Tenant Sector MSA Credit Rating(1) Square Feet ABR % of Total Lease Term Remaining Wells Fargo Financial Services Portland-Vancouver-Hillsboro, OR-WA A+ 212,363 15% 4.9 years Hilton Grand Vacations Hospitality Orlando-Kissimmee-Sanford, FL BB 102,019 9% 5.8 years Walmart Grocery Detroit-Warren-Dearborn, MI AA 214,172 6% 6.0 years LA Fitness Fitness Tampa-St. Petersburg-Clearwater, FL CCC+ 45,000 4% 11.3 years Kohl’s General Merchandise Phoenix-Mesa-Scottsdale, AZ BBB- 87,875 4% 9.0 years Hobby Lobby General Merchandise Tulsa, OK N/A 84,180 4% 9.9 years At Home Home Furnishings Raleigh, NC B- 116,334 3% 11.7 years Container Store Home Furnishings Phoenix-Mesa-Scottsdale, AZ B- 23,329 3% 9.1 years Cinemark Entertainment Reno, NV B 52,474 3% 3.7 years Hilton Grand Vacations Hospitality Orlando-Kissimmee-Sanford, FL BB 31,895 3% 5.8 years Live Nation Entertainment Whitewater-Elkhorn, WI B N/A(2) 3% 12.2 years Hobby Lobby General Merchandise Winston-Salem, NC N/A 55,000 3% 9.2 years Hobby Lobby General Merchandise Asheville, NC N/A 55,000 3% 10.6 years AMC Entertainment Boston-Cambridge-Newton, MA-NH CC 39,474 2% 12.2 years Dick’s Sporting Goods Sporting Goods Atlanta-Sandy Springs-Roswell, GA N/A 46,315 2% 3.0 years JOANN Fabrics General Merchandise Boston-Cambridge-Newton, MA-NH B- 22,500 2% 8.0 years Conn’s Consumer Electronics Dallas-Fort Worth-Arlington, TX B- 37,957 2% 10.6 years Old Time Pottery Home Furnishings Jacksonville, FL N/A 84,180 2% 9.5 years 7-Eleven Convenience Stores Austin-Round Rock, TX AA- 6,400 2% 14.2 years Walgreens Pharmacy Birmingham-Hoover, AL BBB 14,516 2% 8.2 years (1) A credit rated, or investment grade rated tenant (rating of BBB- or Baa3 or higher) is a tenant or the parent of a tenant with a credit rating from S&P Global Ratings, Moody’s Investors Service, Fitch Ratings or the National Associated of Insurance Commissioners (NAIC). (2) The Alpine Valley Music Theatre, leased to Live Nation Entertainment, Inc., consists of a 7,500-seat pavilion, outdoor amphitheater with a capacity for 37,000, and over 150 acres of green space. |
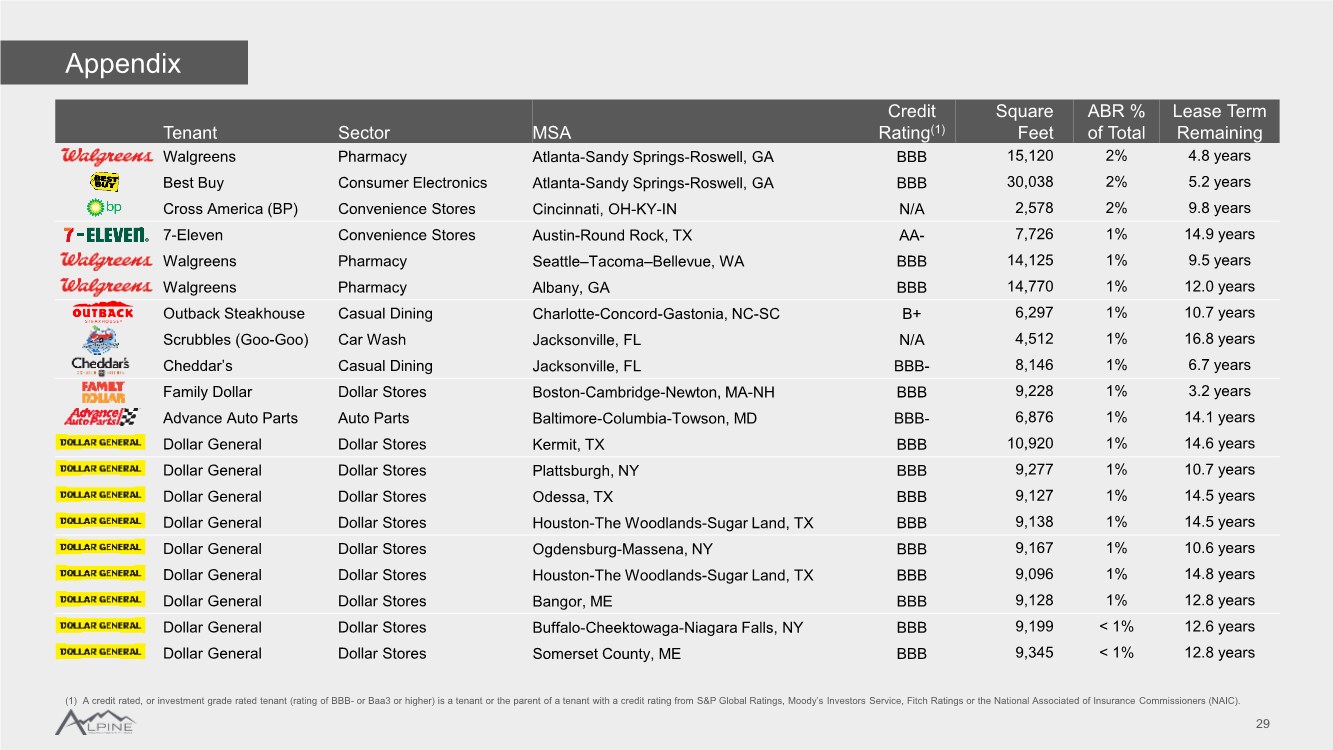
| Appendix 29 Tenant Sector MSA Credit Rating(1) Square Feet ABR % of Total Lease Term Remaining Walgreens Pharmacy Atlanta-Sandy Springs-Roswell, GA BBB 15,120 2% 4.8 years Best Buy Consumer Electronics Atlanta-Sandy Springs-Roswell, GA BBB 30,038 2% 5.2 years Cross America (BP) Convenience Stores Cincinnati, OH-KY-IN N/A 2,578 2% 9.8 years 7-Eleven Convenience Stores Austin-Round Rock, TX AA- 7,726 1% 14.9 years Walgreens Pharmacy Seattle–Tacoma–Bellevue, WA BBB 14,125 1% 9.5 years Walgreens Pharmacy Albany, GA BBB 14,770 1% 12.0 years Outback Steakhouse Casual Dining Charlotte-Concord-Gastonia, NC-SC B+ 6,297 1% 10.7 years Scrubbles (Goo-Goo) Car Wash Jacksonville, FL N/A 4,512 1% 16.8 years Cheddar’s Casual Dining Jacksonville, FL BBB- 8,146 1% 6.7 years Family Dollar Dollar Stores Boston-Cambridge-Newton, MA-NH BBB 9,228 1% 3.2 years Advance Auto Parts Auto Parts Baltimore-Columbia-Towson, MD BBB- 6,876 1% 14.1 years Dollar General Dollar Stores Kermit, TX BBB 10,920 1% 14.6 years Dollar General Dollar Stores Plattsburgh, NY BBB 9,277 1% 10.7 years Dollar General Dollar Stores Odessa, TX BBB 9,127 1% 14.5 years Dollar General Dollar Stores Houston-The Woodlands-Sugar Land, TX BBB 9,138 1% 14.5 years Dollar General Dollar Stores Ogdensburg-Massena, NY BBB 9,167 1% 10.6 years Dollar General Dollar Stores Houston-The Woodlands-Sugar Land, TX BBB 9,096 1% 14.8 years Dollar General Dollar Stores Bangor, ME BBB 9,128 1% 12.8 years Dollar General Dollar Stores Buffalo-Cheektowaga-Niagara Falls, NY BBB 9,199 < 1% 12.6 years Dollar General Dollar Stores Somerset County, ME BBB 9,345 < 1% 12.8 years (1) A credit rated, or investment grade rated tenant (rating of BBB- or Baa3 or higher) is a tenant or the parent of a tenant with a credit rating from S&P Global Ratings, Moody’s Investors Service, Fitch Ratings or the National Associated of Insurance Commissioners (NAIC). |
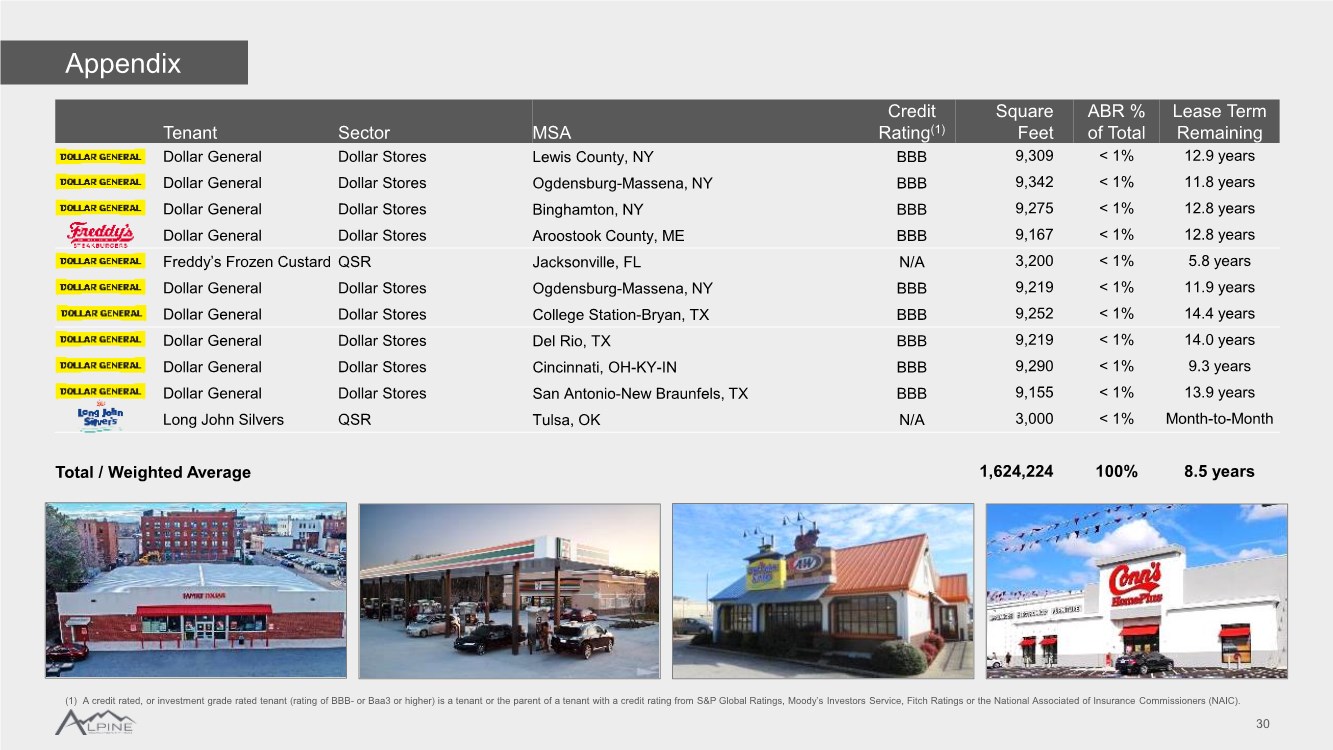
| Appendix 30 Tenant Sector MSA Credit Rating(1) Square Feet ABR % of Total Lease Term Remaining Dollar General Dollar Stores Lewis County, NY BBB 9,309 < 1% 12.9 years Dollar General Dollar Stores Ogdensburg-Massena, NY BBB 9,342 < 1% 11.8 years Dollar General Dollar Stores Binghamton, NY BBB 9,275 < 1% 12.8 years Dollar General Dollar Stores Aroostook County, ME BBB 9,167 < 1% 12.8 years Freddy’s Frozen Custard QSR Jacksonville, FL N/A 3,200 < 1% 5.8 years Dollar General Dollar Stores Ogdensburg-Massena, NY BBB 9,219 < 1% 11.9 years Dollar General Dollar Stores College Station-Bryan, TX BBB 9,252 < 1% 14.4 years Dollar General Dollar Stores Del Rio, TX BBB 9,219 < 1% 14.0 years Dollar General Dollar Stores Cincinnati, OH-KY-IN BBB 9,290 < 1% 9.3 years Dollar General Dollar Stores San Antonio-New Braunfels, TX BBB 9,155 < 1% 13.9 years Long John Silvers QSR Tulsa, OK N/A 3,000 < 1% Month-to-Month Total / Weighted Average 1,624,224 100% 8.5 years (1) A credit rated, or investment grade rated tenant (rating of BBB- or Baa3 or higher) is a tenant or the parent of a tenant with a credit rating from S&P Global Ratings, Moody’s Investors Service, Fitch Ratings or the National Associated of Insurance Commissioners (NAIC). |
| Investor Presentation NYSE: PINE |