Attached files
| file | filename |
|---|---|
| 8-K - 8-K - KKR & Co. Inc. | kkr-20210208.htm |

KKR & Co. Inc. Reports Fourth Quarter 2020 Results
__________________________________________________________________________________________________________________________________________________________________________
NEW YORK, February 8, 2021 - KKR & Co. Inc. (NYSE: KKR) today reported its fourth quarter 2020 results.
GAAP Net Income (Loss) Attributable to KKR & Co. Inc. Common Stockholders(1) was $1,479.7 million and $1,946.0 million, respectively, for the quarter and full year ended December 31, 2020. On a diluted basis, Net Income (Loss) Attributable to KKR & Co. Inc. Per Share of Common Stock was $2.46 and $3.37, respectively, for the quarter and full year ended December 31, 2020. KKR & Co. Inc. Stockholders' Equity - Common Stockholders(1) was $12.1 billion as of December 31, 2020, or $21.15 Per Outstanding Share of Common Stock.
After-tax Distributable Earnings and After-tax Distributable Earnings Per Adjusted Share were $431.1 million and $0.49, respectively, for the quarter ended December 31, 2020 and were $1,522.4 million and $1.78, respectively, for the full year ended December 31, 2020.
•After-tax Distributable Earnings Per Adjusted Share of $0.49 and $1.78 for the quarter and full year ended December 31, 2020, were up 11% and 6%, respectively, compared to the equivalent periods in 2019.
•Distributable operating earnings was up 18% and 11% for the quarter and full year ended December 31, 2020, respectively, compared to the equivalent periods in 2019.
•Assets Under Management and Fee Paying Assets Under Management were $252 billion and $186 billion, up 15% and 16%, respectively, year-over-year, driven in part by record fundraising in 2020. Uncalled commitments were $67 billion, up 18% year-over-year, of which $20 billion will contribute to Fee Paying Assets Under Management when that capital is either invested or enters its investment period.
•Capital Invested and Syndicated Capital totaled $12.5 billion and $34.5 billion in the quarter and full year ended December 31, 2020, respectively.
•Book Value was $20 billion or $23.09 per adjusted share as of December 31, 2020.
•On February 1, 2021, KKR completed the previously announced acquisition of Global Atlantic Financial Group Limited, a leading retirement and life insurance company. Pro forma for the transaction, KKR's Assets Under Management and Fee Paying Assets Under Management would be approximately $342 billion and $276 billion, respectively.
•KKR’s regular dividend of $0.135 per common share was declared for the quarter ended December 31, 2020. Additionally, beginning with the dividend to be announced with the results for the quarter ending March 31, 2021, KKR intends to increase its regular annualized dividend per share of common stock from $0.54 to $0.58.
___________________________
“We ended 2020 with a strong fourth quarter. We are enormously proud of the dedication of our employees and the results delivered on behalf of our fund investors and shareholders over the course of the year. In addition to strong investment performance and continued Book Value growth, we had the most active fundraising and deployment year in our history,” said Henry R. Kravis and George R. Roberts, Co-Chairmen and Co-Chief Executive Officers of KKR. “The strength of our fundamentals, coupled with the completion of our acquisition of Global Atlantic, positions us well for future growth.”
Note: KKR discloses in this earnings release certain financial measures, including after-tax distributable earnings, distributable revenues, distributable expenses, book value, book assets, and book liabilities, that are not calculated and presented in accordance with accounting principles generally accepted in the United States of America (“non-GAAP”). Such non-GAAP measures should be considered in addition to, and not a substitute for or superior to, financial measures calculated in accordance with accounting principles generally accepted in the United States of America (“GAAP”). Reconciliations of these non-GAAP financial measures to the most directly comparable GAAP financial measures are presented in Exhibit A.
(1)Represents only that portion of the business held by KKR & Co. Inc. and does not include the economic interests that are held by KKR Holdings L.P. Our non-GAAP financial results are presented prior to giving effect to the allocation of ownership interests between KKR & Co. Inc. and KKR Holdings L.P. and as such represents the business in total.
GAAP RESULTS
Net Income (Loss) Attributable to KKR & Co. Inc. Common Stockholders was $1,479.7 million for the quarter ended December 31, 2020, compared to $515.1 million for the quarter ended December 31, 2019. Net Income (Loss) Attributable to KKR & Co. Inc. Common Stockholders was $1,946.0 million for the year ended December 31, 2020, compared to $1,971.7 million for the year ended December 31, 2019.
Revenues for the quarter ended December 31, 2020 were $2,005.2 million compared to $1,063.1 million for the quarter ended December 31, 2019. The increase is primarily driven by (i) a higher level of carried interest and (ii) an increase in transaction fees and management fees. Revenues for the year ended December 31, 2020 were $4,230.9 million compared to $4,220.9 million for the year ended December 31, 2019. The increase is primarily driven by higher level of management fees and transaction fees, partially offset by a lower level of carried interest in the current period.
Expenses for the quarter ended December 31, 2020 were $1,179.1 million compared to $751.3 million for the quarter ended December 31, 2019. The increase is primarily driven by higher accrued carried interest compensation. Expenses for the year ended December 31, 2020 were $2,933.1 million compared to $2,908.4 million for the year ended December 31, 2019. The increase is primarily due to a higher level of compensation expense, partially offset by a decrease in general, administrative and other expense.
Total investment income (loss) for the quarter ended December 31, 2020 was $3,998.1 million compared to $1,145.0 million for the quarter ended December 31, 2019. Total investment income (loss) for the year ended December 31, 2020 was $4,428.9 million compared to $3,855.8 million for the year ended December 31, 2019. The increase in both periods is primarily due to investment portfolio appreciation.
KKR & Co. Inc. Stockholders’ Equity - Common Stockholders per Outstanding Share of common stock was $21.15 as of December 31, 2020, up from $18.44 as of December 31, 2019. The increase was primarily attributable to the net income that is attributable to KKR & Co. Inc. common stockholders during 2020, partially offset by dividends to common stockholders.
___________________________
NON-GAAP RESULTS
AFTER-TAX DISTRIBUTABLE EARNINGS
After-tax distributable earnings were $431.1 million for the quarter ended December 31, 2020, compared with $375.1 million in the comparable prior period. After-tax distributable earnings were $1,522.4 million for the year ended December 31, 2020, compared with $1,405.3 million in the comparable prior period.
After-tax distributable earnings increased in the quarterly period primarily due to increases in transaction fees and management fees, partially offset by a decrease in realized investment income and a higher level of compensation expense. The increase in the year ended December 31, 2020 is primarily attributable to increases in management fees and realized performance income, partially offset by a higher level of compensation expense and a decrease in realized investment income. Management fees were $393.1 million for the quarter ended December 31, 2020 and $1,417.6 million for the year ended December 31, 2020, compared with $317.1 million and $1,227.2 million in the comparable prior periods. The increase in management fees for both periods reflects an overall higher level of FPAUM in each of the Private Markets and Public Markets business lines.
BOOK VALUE PER ADJUSTED SHARE
Book value per adjusted share was $23.09 as of December 31, 2020, up 20%, compared with $19.24 as of December 31, 2019. The increase was primarily attributable to net appreciation in the value of our investment portfolio and after-tax distributable earnings for the year ended December 31, 2020 net of dividends to our shareholders. For the year ended December 31, 2020, KKR's private equity portfolio appreciated 17%.
___________________________
OPERATING METRICS
ASSETS UNDER MANAGEMENT
AUM was $251.7 billion as of December 31, 2020 compared to $233.8 billion as of September 30, 2020. The increase was primarily attributable to (i) new capital raised primarily in our real assets, growth equity and leveraged credit strategies and (ii) appreciation in the value of our Private Markets and Public Markets portfolios. The increases were partially offset by distributions to limited partners in our private equity and private credit portfolios and redemptions in funds managed by our strategic partners.
FEE PAYING ASSETS UNDER MANAGEMENT
FPAUM was $186.2 billion as of December 31, 2020 compared to $177.3 billion as of September 30, 2020. The increase was primarily attributable to new capital raised in our real assets, private equity, leveraged credit and private credit strategies, partially offset by distributions to limited partners in our private equity portfolio, distributions across various Public Markets strategies and redemptions in funds managed by our strategic partners.
Page 2
DIVIDENDS AND OTHER
A dividend of $0.135 per share of common stock has been declared for the fourth quarter of 2020, which will be paid on March 9, 2021 to holders of record of common stock as of the close of business on February 22, 2021. Beginning with any dividends to be announced with the results for the quarter ending March 31, 2021, KKR expects to pay its common stockholders an annualized dividend of $0.58 per share of common stock, equal to a quarterly dividend of $0.145 per share of common stock.
A dividend of $0.421875 per share of Series A Preferred Stock has been declared and set aside for payment on March 15, 2021 to holders of record of Series A Preferred Stock as of the close of business on March 1, 2021. A dividend of $0.406250 per share of Series B Preferred Stock has been declared and set aside for payment on March 15, 2021 to holders of record of Series B Preferred Stock as of the close of business on March 1, 2021. A dividend of $0.75 per share of Series C Mandatory Convertible Preferred Stock has been declared and set aside for payment on March 15, 2021 to holders of record of Series C Mandatory Convertible Preferred Stock as of the close of business on March 1, 2021.
The declaration and payment of any future dividends on preferred or common stock will be subject to the discretion of the board of directors of KKR & Co. Inc. based on a number of factors, including KKR’s future financial performance and other considerations that the board deems relevant, the terms of KKR & Co. Inc.'s certificate of incorporation and applicable law. There can be no assurance that future dividends will be made as intended or at all or that any particular dividend policy for common stock will be maintained.
Based on preliminary financial results of Global Atlantic as of December 31, 2020, the estimated value of the Global Atlantic assets to be managed by KKR as of the closing of the Global Atlantic acquisition is approximately $90 billion.
___________________________
SHARE REPURCHASE ACTIVITY (1)
KKR has a repurchase program, which may be used to repurchase shares in the open market as well as to reduce shares issuable to participants in its equity incentive plans. In total, as can be seen in the table below, KKR has used approximately $1.4 billion to either repurchase shares or retire equity awards since the inception of KKR’s share repurchase plan on October 27, 2015 through February 5, 2021.
Share Repurchase Activity -- October 27, 2015 through February 5, 2021 (2) | ||||||||
| (Amounts in millions, except per share amounts) | Inception to Date | |||||||
| Open Market Share Repurchases | 52.3 | |||||||
Reduction of Shares for Retired Equity Awards (3) | 20.5 | |||||||
| Total Repurchased Shares and Retired Equity Awards | 72.8 | |||||||
| Total Capital Used | $ | 1,411 | ||||||
Average Price Paid Per Share (4) | $ | 19.38 | ||||||
| Remaining Availability under Current Share Repurchase Plan | $ | 407 | ||||||
From December 31, 2019 through February 5, 2021, KKR used a total of approximately $379 million to repurchase 10.2 million shares in the open market and to retire equity awards representing 4.2 million shares that otherwise would have been issued to participants under the Equity Incentive Plans. During this period, open market purchases were made at an average cost of $24.14 per share. The timing, manner, price and amount of any common stock repurchases will be determined by KKR in its discretion and will depend on a variety of factors, including legal requirements, price and economic and market conditions. The program does not require KKR to repurchase any specific number of shares of common stock, and the program may be suspended, extended, modified or discontinued at any time.
(1)References to the repurchase and reduction of shares relate to shares of KKR common stock.
(2)KKR & Co. Inc.'s initial repurchase authorization was announced on October 27, 2015.
(3)Refers to the retirement of equity awards issued pursuant to the Amended and Restated KKR & Co. Inc. 2010 Equity Incentive Plan and the KKR & Co. Inc. 2019 Equity Incentive Plan (collectively the "Equity Incentive Plans").
(4)Average price paid per share reflects total capital used to repurchase shares and to retire equity awards from inception to February 5, 2021 divided by the total number of repurchased shares and retired equity awards.
Page 3
CONFERENCE CALL
A conference call to discuss KKR's financial results will be held on Tuesday, February 9, 2021 at 10:00 a.m. ET. The conference call may be accessed by dialing (877) 407-0312 (U.S. callers) or +1 (201) 389-0899 (non-U.S. callers); a pass code is not required. Additionally, the conference call will be broadcast live over the Internet and may be accessed through the Investor Center section of KKR's website at https://ir.kkr.com/events-presentations/. A replay of the live broadcast will be available on KKR's website beginning approximately one hour after the live broadcast ends.
A slide presentation containing supplemental commentary about KKR's financial results for the fiscal quarter and year ended December 31, 2020 may be accessed through the Investor Center of the KKR website at https://ir.kkr.com/events-presentations/. The presentation will be referenced on the conference call discussed above.
From time to time, KKR may use its website as a channel of distribution of material company information. Financial and other important information regarding KKR is routinely posted and accessible on the Investor Center for KKR & Co. Inc. at https://ir.kkr.com/. In addition, you may automatically receive email alerts and other information about KKR by enrolling your email address at the “Email Alerts” area of the Investor Center on the website.
___________________________
ABOUT KKR
KKR is a leading global investment firm that offers alternative asset management and capital markets and insurance solutions. KKR aims to generate attractive investment returns by following a patient and disciplined investment approach, employing world-class people, and supporting growth in its portfolio companies and communities. KKR sponsors investment funds that invest in private equity, credit and real assets and has strategic partners that manage hedge funds. KKR’s insurance subsidiaries offer retirement, life and reinsurance products under the management of The Global Atlantic Financial Group. References to KKR’s investments may include the activities of its sponsored funds and insurance subsidiaries. For additional information about KKR & Co. Inc. (NYSE: KKR), please visit KKR's website at www.kkr.com and on Twitter @KKR_Co.
___________________________
Page 4
FORWARD-LOOKING STATEMENTS
This release contains certain forward-looking statements. Forward-looking statements relate to expectations, estimates, beliefs, projections, future plans and strategies, anticipated events or trends and similar expressions concerning matters that are not historical facts, including but not limited to the statements with respect to: the declaration and payment of dividends in future quarters; the timing, manner and volume of repurchase of common stock pursuant to its repurchase program; the amount that Global Atlantic will contribute to KKR's AUM; KKR's ability to manage Global Atlantic's investments; operation of Global Atlantic following the closing of the transaction; expansion and growth opportunities and other synergies resulting from the transaction; the transaction’s effects on KKR’s operating results. The forward-looking statements are based on KKR’s beliefs, assumptions and expectations, taking into account all information currently available to it. These beliefs, assumptions and expectations can change as a result of many possible events or factors, not all of which are known to KKR or are within its control. If a change occurs, KKR’s business, financial condition, liquidity and results of operations, including but not limited to dividends, tax assets, tax liabilities, AUM, FPAUM, after-tax distributable earnings, capital invested, syndicated capital, uncalled commitments, cash and short-term investments, fee related earnings, adjusted EBITDA, core interest expense and book value, debt levels, outstanding shares of common stock and capital structure may vary materially from those expressed in the forward-looking statements. The following factors, among others, could cause actual results to vary from the forward-looking statements: failure to realize the anticipated benefits within the expected timeframes from the acquisition of Global Atlantic; unforeseen liabilities or integration and other costs of the Global Atlantic acquisition and timing related thereto; changes in Global Atlantic's business; distraction of KKR's or Global Atlantic's management or other diversion of resources within each company caused by the Global Atlantic acquisition; retention of key Global Atlantic employees; Global Atlantic's ability to maintain business relationships following the acquisition; the severity and duration of the COVID-19 pandemic; the pandemic's impact on the U.S. and global economies; foreign, federal, state and local governmental responses to the pandemic; whether KKR realizes all or any of the anticipated benefits from converting to a corporation and the timing of realizing such benefits; whether there are increased or unforeseen costs associated with the conversion, including any adverse change in tax law; the volatility of the capital markets; failure to realize the benefits of or changes in KKR's or Global Atlantic's business strategies including the ability to realize the anticipated synergies from acquisitions, including the Global Atlantic acquisition, strategic partnerships or other transactions; availability, terms and deployment of capital; availability of qualified personnel and expense of recruiting and retaining such personnel; changes in the asset management or insurance industry, interest rates, credit spreads, currency exchange rates or the general economy; underperformance of KKR's or Global Atlantic's investments and decreased ability to raise funds; KKR's and Global Atlantic's compliance with laws applicable to their respective businesses; changes to Global Atlantic as a consolidated subsidiary of KKR; ability of KKR to manage Global Atlantic's investments; KKR's control of Global Atlantic; changes in Global Atlantic policyholders' behaviors; any disruption in servicing Global Atlantic's insurance policies; the use of estimates and risk management in Global Atlantic's business; outcome of Global Atlantic's litigation and regulatory matters; and the degree and nature of KKR's and Global Atlantic's competition. All forward-looking statements speak only as of the date hereof. KKR does not undertake any obligation to update any forward-looking statements to reflect circumstances or events that occur after the date on which such statements were made except as required by law. In addition, KKR’s business strategy is focused on the long term and financial results are subject to significant volatility. Additional information about factors affecting KKR is available in KKR & Co. Inc.’s Annual Report on Form 10-K for the fiscal year ended December 31, 2019, filed with the SEC on February 18, 2020, quarterly reports on Form 10-Q for subsequent quarters and other filings with the SEC, which are available at www.sec.gov.
___________________________
CONTACT INFORMATION
Investor Relations:
Craig Larson
Tel: +1-877-610-4910 (U.S.) / +1-212-230-9410
investor-relations@kkr.com
Media:
Kristi Huller
Tel: +1-212-750-8300
media@kkr.com
Page 5
| GAAP CONDENSED CONSOLIDATED STATEMENTS OF OPERATIONS (UNAUDITED) | ||||||||||||||||||||||||||
| (Amounts in thousands, except share and per share amounts) | ||||||||||||||||||||||||||
| Quarter Ended | Year Ended | |||||||||||||||||||||||||
| December 31, 2020 | December 31, 2019 | December 31, 2020 | December 31, 2019 | |||||||||||||||||||||||
| Revenues | ||||||||||||||||||||||||||
| Fees and Other | $ | 669,406 | $ | 482,269 | $ | 2,006,791 | $ | 1,790,475 | ||||||||||||||||||
| Capital Allocation-Based Income (Loss) | 1,335,758 | 580,802 | 2,224,100 | 2,430,425 | ||||||||||||||||||||||
| Total Revenues | 2,005,164 | 1,063,071 | 4,230,891 | 4,220,900 | ||||||||||||||||||||||
| Expenses | ||||||||||||||||||||||||||
| Compensation and Benefits | 940,964 | 535,834 | 2,152,490 | 2,116,890 | ||||||||||||||||||||||
| Occupancy and Related Charges | 20,878 | 15,951 | 72,100 | 62,728 | ||||||||||||||||||||||
| General, Administrative and Other | 217,215 | 199,535 | 708,542 | 728,813 | ||||||||||||||||||||||
| Total Expenses | 1,179,057 | 751,320 | 2,933,132 | 2,908,431 | ||||||||||||||||||||||
| Investment Income (Loss) | ||||||||||||||||||||||||||
| Net Gains (Losses) from Investment Activities | 3,821,837 | 924,611 | 3,642,804 | 3,161,884 | ||||||||||||||||||||||
| Dividend Income | 57,516 | 131,228 | 352,563 | 318,972 | ||||||||||||||||||||||
| Interest Income | 363,388 | 350,138 | 1,403,440 | 1,418,516 | ||||||||||||||||||||||
| Interest Expense | (244,626) | (260,950) | (969,871) | (1,043,551) | ||||||||||||||||||||||
| Total Investment Income (Loss) | 3,998,115 | 1,145,027 | 4,428,936 | 3,855,821 | ||||||||||||||||||||||
| Income Tax Expense (Benefit) | 404,137 | 142,626 | 609,097 | 528,750 | ||||||||||||||||||||||
| Net Income (Loss) Attributable to Noncontrolling Interests | 2,908,864 | 790,710 | 3,115,089 | 2,634,491 | ||||||||||||||||||||||
| Series A and B Preferred Stock | 8,341 | 8,341 | 33,364 | 33,364 | ||||||||||||||||||||||
| Series C Mandatory Convertible Preferred Stock Dividends | 23,191 | — | 23,191 | — | ||||||||||||||||||||||
Net Income (Loss) Attributable to KKR & Co. Inc. Common Stockholders (1) | $ | 1,479,689 | $ | 515,101 | $ | 1,945,954 | $ | 1,971,685 | ||||||||||||||||||
Net Income (Loss) Attributable to KKR & Co. Inc. Per Share of Common Stock (1) | ||||||||||||||||||||||||||
| Basic | $ | 2.60 | $ | 0.93 | $ | 3.45 | $ | 3.62 | ||||||||||||||||||
Diluted (2) | $ | 2.46 | $ | 0.91 | $ | 3.37 | $ | 3.54 | ||||||||||||||||||
Weighted Average Shares of Common Stock Outstanding (1) | ||||||||||||||||||||||||||
| Basic | 570,818,257 | 555,379,973 | 562,812,883 | 545,096,999 | ||||||||||||||||||||||
Diluted (2) | 609,833,753 | 566,277,984 | 583,685,352 | 557,687,512 | ||||||||||||||||||||||
| GAAP CONDENSED CONSOLIDATED STATEMENTS OF FINANCIAL CONDITION (UNAUDITED) | ||||||||||||||
| (Amounts in thousands, except per share amounts) | ||||||||||||||
| As of | ||||||||||||||
| December 31, 2020 | December 31, 2019 | |||||||||||||
| Assets | ||||||||||||||
| Cash and Cash Equivalents | $ | 5,363,009 | $ | 2,346,713 | ||||||||||
| Investments | 69,274,715 | 54,936,268 | ||||||||||||
| Other Assets | 5,168,778 | 3,616,338 | ||||||||||||
| Total Assets | $ | 79,806,502 | $ | 60,899,319 | ||||||||||
| Liabilities and Equity | ||||||||||||||
| Debt Obligations | $ | 33,423,596 | $ | 27,013,284 | ||||||||||
| Other Liabilities | 5,582,990 | 3,383,661 | ||||||||||||
| Total Liabilities | 39,006,586 | 30,396,945 | ||||||||||||
| Stockholders' Equity | ||||||||||||||
| KKR & Co. Inc. Stockholders' Equity - Series A and B Preferred Stock | 482,554 | 482,554 | ||||||||||||
| KKR & Co. Inc. Stockholders' Equity - Series C Mandatory Convertible Preferred Stock | 1,115,792 | — | ||||||||||||
KKR & Co. Inc. Stockholders' Equity - Series I and II Preferred Stock, Common Stock (1) | 12,118,472 | 10,324,936 | ||||||||||||
| Noncontrolling Interests | 27,083,098 | 19,694,884 | ||||||||||||
| Total Equity | 40,799,916 | 30,502,374 | ||||||||||||
| Total Liabilities and Equity | $ | 79,806,502 | $ | 60,899,319 | ||||||||||
KKR & Co. Inc. Stockholders' Equity Per Outstanding Share of Common Stock (1) | $ | 21.15 | $ | 18.44 | ||||||||||
(1)As used in this press release, references to common stock for prior periods mean Class A common stock of KKR & Co. Inc. and references to Series I Preferred Stock and Series II Preferred Stock for prior periods mean Class B common stock and Class C common stock of KKR & Co. Inc., respectively.
(2)Consistent with prior quarters, KKR Holdings L.P. units have been excluded from the calculation of diluted earnings per share of common stock since the exchange of these units would not dilute KKR’s respective ownership interests in the KKR Group Partnership L.P.
Page 6
| DISTRIBUTABLE REVENUES, DISTRIBUTABLE EXPENSES AND AFTER-TAX DISTRIBUTABLE EARNINGS (UNAUDITED) | ||||||||||||||||||||||||||||||||
| (Amounts in thousands, except share and per share amounts) | ||||||||||||||||||||||||||||||||
| DISTRIBUTABLE REVENUES | ||||||||||||||||||||||||||||||||
| Quarter Ended | Year Ended | |||||||||||||||||||||||||||||||
| December 31, 2020 | September 30, 2020 | December 31, 2019 | December 31, 2020 | December 31, 2019 | ||||||||||||||||||||||||||||
| Distributable Revenues | ||||||||||||||||||||||||||||||||
| Fees and Other, Net | ||||||||||||||||||||||||||||||||
| Management Fees | $ | 393,144 | $ | 359,831 | $ | 317,131 | $ | 1,417,594 | $ | 1,227,236 | ||||||||||||||||||||||
| Transaction Fees | 388,730 | 300,645 | 255,511 | 949,134 | 910,932 | |||||||||||||||||||||||||||
| Monitoring Fees | 41,032 | 28,824 | 26,668 | 127,907 | 106,289 | |||||||||||||||||||||||||||
| Fee Credits | (147,476) | (115,442) | (108,662) | (373,643) | (382,940) | |||||||||||||||||||||||||||
| Total Fees and Other, Net | 675,430 | 573,858 | 490,648 | 2,120,992 | 1,861,517 | |||||||||||||||||||||||||||
| Realized Performance Income (Loss) | ||||||||||||||||||||||||||||||||
| Carried Interest | 117,230 | 217,978 | 232,180 | 1,042,204 | 1,070,788 | |||||||||||||||||||||||||||
| Incentive Fees | 126,137 | 16,223 | 12,771 | 163,050 | 65,256 | |||||||||||||||||||||||||||
| Total Realized Performance Income (Loss) | 243,367 | 234,201 | 244,951 | 1,205,254 | 1,136,044 | |||||||||||||||||||||||||||
| Realized Investment Income (Loss) | ||||||||||||||||||||||||||||||||
| Net Realized Gains (Losses) | 69,091 | 172,224 | 43,524 | 284,521 | 189,858 | |||||||||||||||||||||||||||
| Interest Income and Dividends | 79,664 | 88,191 | 182,946 | 360,138 | 495,915 | |||||||||||||||||||||||||||
| Total Realized Investment Income (Loss) | 148,755 | 260,415 | 226,470 | 644,659 | 685,773 | |||||||||||||||||||||||||||
| Total Distributable Revenues | $ | 1,067,552 | $ | 1,068,474 | $ | 962,069 | $ | 3,970,905 | $ | 3,683,334 | ||||||||||||||||||||||
| DISTRIBUTABLE EXPENSES | ||||||||||||||||||||||||||||||||
| Quarter Ended | Year Ended | |||||||||||||||||||||||||||||||
| December 31, 2020 | September 30, 2020 | December 31, 2019 | December 31, 2020 | December 31, 2019 | ||||||||||||||||||||||||||||
| Distributable Expenses | ||||||||||||||||||||||||||||||||
Compensation and Benefits (1) | $ | 375,537 | $ | 427,396 | $ | 357,740 | $ | 1,536,777 | $ | 1,446,292 | ||||||||||||||||||||||
| Occupancy and Related Charges | 17,142 | 13,639 | 14,302 | 58,859 | 58,888 | |||||||||||||||||||||||||||
| Other Operating Expenses | 106,838 | 76,163 | 108,133 | 334,680 | 343,418 | |||||||||||||||||||||||||||
| Total Distributable Expenses | $ | 499,517 | $ | 517,198 | $ | 480,175 | $ | 1,930,316 | $ | 1,848,598 | ||||||||||||||||||||||
| AFTER-TAX DISTRIBUTABLE EARNINGS | ||||||||||||||||||||||||||||||||
| Quarter Ended | Year Ended | |||||||||||||||||||||||||||||||
| December 31, 2020 | September 30, 2020 | December 31, 2019 | December 31, 2020 | December 31, 2019 | ||||||||||||||||||||||||||||
| After-tax Distributable Earnings | ||||||||||||||||||||||||||||||||
| (+) Total Distributable Revenues | $ | 1,067,552 | $ | 1,068,474 | $ | 962,069 | $ | 3,970,905 | $ | 3,683,334 | ||||||||||||||||||||||
| (-) Total Distributable Expenses | 499,517 | 517,198 | 480,175 | 1,930,316 | 1,848,598 | |||||||||||||||||||||||||||
| (=) Total Distributable Operating Earnings | 568,035 | 551,276 | 481,894 | 2,040,589 | 1,834,736 | |||||||||||||||||||||||||||
| (-) Interest Expense | 58,361 | 54,458 | 44,367 | 211,037 | 183,682 | |||||||||||||||||||||||||||
| (-) Series A and B Preferred Dividends | 8,341 | 8,341 | 8,341 | 33,364 | 33,364 | |||||||||||||||||||||||||||
| (-) Income (Loss) Attributable to Noncontrolling Interests | 3,042 | 2,709 | 1,803 | 7,842 | 4,907 | |||||||||||||||||||||||||||
| (-) Income Taxes Paid | 67,187 | 75,413 | 52,242 | 265,950 | 207,479 | |||||||||||||||||||||||||||
After-tax Distributable Earnings | $ | 431,104 | $ | 410,355 | $ | 375,141 | $ | 1,522,396 | $ | 1,405,304 | ||||||||||||||||||||||
After-tax Distributable Earnings Per Adjusted Share | $ | 0.49 | $ | 0.48 | $ | 0.44 | $ | 1.78 | $ | 1.67 | ||||||||||||||||||||||
Weighted Average Adjusted Shares (2) | 877,218,055 | 861,854,785 | 848,327,093 | 857,495,058 | 841,542,195 | |||||||||||||||||||||||||||
| Assets Under Management | $ | 251,679,200 | $ | 233,808,800 | $ | 218,355,100 | $ | 251,679,200 | $ | 218,355,100 | ||||||||||||||||||||||
| Fee Paying Assets Under Management | $ | 186,217,000 | $ | 177,290,200 | $ | 161,209,800 | $ | 186,217,000 | $ | 161,209,800 | ||||||||||||||||||||||
| Capital Invested and Syndicated Capital | $ | 12,482,900 | $ | 10,019,100 | $ | 9,833,000 | $ | 34,541,900 | $ | 28,055,900 | ||||||||||||||||||||||
| Uncalled Commitments | $ | 66,960,000 | $ | 67,077,600 | $ | 56,920,600 | $ | 66,960,000 | $ | 56,920,600 | ||||||||||||||||||||||
| Fee Related Earnings | $ | 430,866 | $ | 318,900 | $ | 271,210 | $ | 1,230,501 | $ | 1,031,084 | ||||||||||||||||||||||
(1)Includes equity-based compensation of $113.0 million, $42.5 million, and $49.9 million for the quarters ended December 31, 2020, September 30, 2020, and December 31, 2019, respectively, and $246.4 million and $207.8 million for the year ended December 31, 2020 and 2019, respectively.
(2)Includes shares of KKR & Co. Inc. common stock assuming conversion of all of the outstanding Series C Mandatory Convertible Preferred Stock. See Exhibit A for reconciliation of KKR's Weighted Average GAAP Shares of Common Stock Outstanding to Weighted Average Adjusted Shares.
Page 7
| SCHEDULE OF SELECTED SUPPLEMENTAL FINANCIAL INFORMATION (UNAUDITED) | ||||||||||||||||||||||||||||||||
| (Amounts in thousands) | ||||||||||||||||||||||||||||||||
| PRIVATE MARKETS BUSINESS LINE REVENUES & OPERATING METRICS | ||||||||||||||||||||||||||||||||
| Quarter Ended | Year Ended | |||||||||||||||||||||||||||||||
| December 31, 2020 | September 30, 2020 | December 31, 2019 | December 31, 2020 | December 31, 2019 | ||||||||||||||||||||||||||||
| Fees and Other, Net | ||||||||||||||||||||||||||||||||
| Management Fees | $ | 276,002 | $ | 241,788 | $ | 201,760 | $ | 958,271 | $ | 780,254 | ||||||||||||||||||||||
| Transaction Fees | 162,570 | 133,943 | 122,601 | 398,859 | 421,494 | |||||||||||||||||||||||||||
| Monitoring Fees | 41,032 | 28,824 | 26,668 | 127,907 | 106,289 | |||||||||||||||||||||||||||
| Fee Credits | (115,405) | (107,275) | (83,170) | (307,432) | (307,716) | |||||||||||||||||||||||||||
| Total Fees and Other, Net | $ | 364,199 | $ | 297,280 | $ | 267,859 | $ | 1,177,605 | $ | 1,000,321 | ||||||||||||||||||||||
| Realized Performance Income (Loss) | ||||||||||||||||||||||||||||||||
| Carried Interest | $ | 117,230 | $ | 217,978 | $ | 232,180 | $ | 1,006,564 | $ | 1,046,038 | ||||||||||||||||||||||
| Incentive Fees | 11,375 | 701 | 831 | 14,098 | 2,316 | |||||||||||||||||||||||||||
| Total Realized Performance Income (Loss) | $ | 128,605 | $ | 218,679 | $ | 233,011 | $ | 1,020,662 | $ | 1,048,354 | ||||||||||||||||||||||
| Assets Under Management | $ | 148,689,300 | $ | 135,758,500 | $ | 119,274,700 | $ | 148,689,300 | $ | 119,274,700 | ||||||||||||||||||||||
| Fee Paying Assets Under Management | $ | 94,195,900 | $ | 90,351,000 | $ | 76,918,100 | $ | 94,195,900 | $ | 76,918,100 | ||||||||||||||||||||||
Capital Invested | $ | 6,035,000 | $ | 6,232,000 | $ | 4,491,600 | $ | 19,207,000 | $ | 14,116,000 | ||||||||||||||||||||||
| Uncalled Commitments | $ | 56,631,700 | $ | 56,202,000 | $ | 46,811,300 | $ | 56,631,700 | $ | 46,811,300 | ||||||||||||||||||||||
| PUBLIC MARKETS BUSINESS LINE REVENUES & OPERATING METRICS | ||||||||||||||||||||||||||||||||
| Quarter Ended | Year Ended | |||||||||||||||||||||||||||||||
| December 31, 2020 | September 30, 2020 | December 31, 2019 | December 31, 2020 | December 31, 2019 | ||||||||||||||||||||||||||||
| Fees and Other, Net | ||||||||||||||||||||||||||||||||
| Management Fees | $ | 117,142 | $ | 118,043 | $ | 115,371 | $ | 459,323 | $ | 446,982 | ||||||||||||||||||||||
| Transaction Fees | 33,564 | 8,436 | 26,142 | 69,792 | 79,383 | |||||||||||||||||||||||||||
| Fee Credits | (32,071) | (8,167) | (25,492) | (66,211) | (75,224) | |||||||||||||||||||||||||||
| Total Fees and Other, Net | $ | 118,635 | $ | 118,312 | $ | 116,021 | $ | 462,904 | $ | 451,141 | ||||||||||||||||||||||
| Realized Performance Income (Loss) | ||||||||||||||||||||||||||||||||
| Carried Interest | $ | — | $ | — | $ | — | $ | 35,640 | $ | 24,750 | ||||||||||||||||||||||
| Incentive Fees | 114,762 | 15,522 | 11,940 | 148,952 | 62,940 | |||||||||||||||||||||||||||
| Total Realized Performance Income (Loss) | $ | 114,762 | $ | 15,522 | $ | 11,940 | $ | 184,592 | $ | 87,690 | ||||||||||||||||||||||
| Assets Under Management | $ | 102,989,900 | $ | 98,050,300 | $ | 99,080,400 | $ | 102,989,900 | $ | 99,080,400 | ||||||||||||||||||||||
| Fee Paying Assets Under Management | $ | 92,021,100 | $ | 86,939,200 | $ | 84,291,700 | $ | 92,021,100 | $ | 84,291,700 | ||||||||||||||||||||||
| Capital Invested | $ | 3,800,200 | $ | 1,708,300 | $ | 4,034,000 | $ | 10,309,500 | $ | 10,075,400 | ||||||||||||||||||||||
| Uncalled Commitments | $ | 10,328,300 | $ | 10,875,600 | $ | 10,109,300 | $ | 10,328,300 | $ | 10,109,300 | ||||||||||||||||||||||
| CAPITAL MARKETS BUSINESS LINE REVENUES & OPERATING METRICS | ||||||||||||||||||||||||||||||||
| Quarter Ended | Year Ended | |||||||||||||||||||||||||||||||
| December 31, 2020 | September 30, 2020 | December 31, 2019 | December 31, 2020 | December 31, 2019 | ||||||||||||||||||||||||||||
| Transaction Fees | $ | 192,596 | $ | 158,266 | $ | 106,768 | $ | 480,483 | $ | 410,055 | ||||||||||||||||||||||
| Syndicated Capital | $ | 2,647,700 | $ | 2,078,800 | $ | 1,307,400 | $ | 5,025,400 | $ | 3,864,500 | ||||||||||||||||||||||
| PRINCIPAL ACTIVITIES BUSINESS LINE REVENUES | ||||||||||||||||||||||||||||||||
| Quarter Ended | Year Ended | |||||||||||||||||||||||||||||||
| December 31, 2020 | September 30, 2020 | December 31, 2019 | December 31, 2020 | December 31, 2019 | ||||||||||||||||||||||||||||
| Realized Investment Income (Loss) | ||||||||||||||||||||||||||||||||
| Net Realized Gains (Losses) | $ | 69,091 | $ | 172,224 | $ | 43,524 | $ | 284,521 | $ | 189,858 | ||||||||||||||||||||||
| Interest Income and Dividends | 79,664 | 88,191 | 182,946 | 360,138 | 495,915 | |||||||||||||||||||||||||||
| Total Realized Investment Income (Loss) | $ | 148,755 | $ | 260,415 | $ | 226,470 | $ | 644,659 | $ | 685,773 | ||||||||||||||||||||||
Page 8
| BOOK ASSETS, BOOK LIABILITIES AND BOOK VALUE (UNAUDITED) | |||||||||||||||||
| (Amounts in thousands, except share and per share amounts) | |||||||||||||||||
| BOOK ASSETS | |||||||||||||||||
| As of | |||||||||||||||||
| December 31, 2020 | December 31, 2019 | ||||||||||||||||
| Book Assets | |||||||||||||||||
| Cash and Short-term Investments | $ | 5,961,083 | $ | 2,783,905 | |||||||||||||
| Investments | 14,991,914 | (1) | 13,026,387 | ||||||||||||||
| Net Unrealized Carried Interest | 2,625,935 | (2) | 1,982,251 | (2) | |||||||||||||
| Tax Assets | 43,446 | 111,719 | |||||||||||||||
| Other Assets | 4,198,641 | 3,716,189 | |||||||||||||||
| Total Book Assets | $ | 27,821,019 | $ | 21,620,451 | |||||||||||||
| BOOK LIABILITIES | |||||||||||||||||
| As of | |||||||||||||||||
| December 31, 2020 | December 31, 2019 | ||||||||||||||||
| Book Liabilities | |||||||||||||||||
| Debt Obligations - KKR (ex-KFN) | $ | 4,688,460 | $ | 3,097,460 | |||||||||||||
| Debt Obligations - KFN | 948,517 | 948,517 | |||||||||||||||
| Tax Liabilities | 529,412 | 169,997 | |||||||||||||||
| Other Liabilities | 857,764 | 514,236 | |||||||||||||||
| Total Book Liabilities | $ | 7,024,153 | $ | 4,730,210 | |||||||||||||
| BOOK VALUE | |||||||||||||||||
| As of | |||||||||||||||||
| December 31, 2020 | December 31, 2019 | ||||||||||||||||
| Book Value | |||||||||||||||||
| (+) Total Book Assets | $ | 27,821,019 | $ | 21,620,451 | |||||||||||||
| (-) Total Book Liabilities | 7,024,153 | 4,730,210 | |||||||||||||||
| (-) Noncontrolling Interests | 29,510 | 26,291 | |||||||||||||||
| (-) Series A and B Preferred Stock | 500,000 | 500,000 | |||||||||||||||
| Book Value | $ | 20,267,356 | $ | 16,363,950 | |||||||||||||
| Book Value Per Adjusted Share | $ | 23.09 | $ | 19.24 | |||||||||||||
| Adjusted Shares | 877,613,164 | 850,388,924 | |||||||||||||||
Note: As of December 31, 2020, KKR had a (i) $1.0 billion revolving credit facility, which was undrawn, and (ii) $1.5 billion in revolving credit facilities for use in its capital markets business, which were also undrawn.
(1)See schedule of investments that follows on the next page.
(2)The following table provides net unrealized carried interest by business line:
| As of | |||||||||||||||||
| December 31, 2020 | December 31, 2019 | ||||||||||||||||
| Private Markets Business Line | $ | 2,560,101 | $ | 1,832,581 | |||||||||||||
| Public Markets Business Line | 65,834 | 149,670 | |||||||||||||||
| Total | $ | 2,625,935 | $ | 1,982,251 | |||||||||||||
Page 9
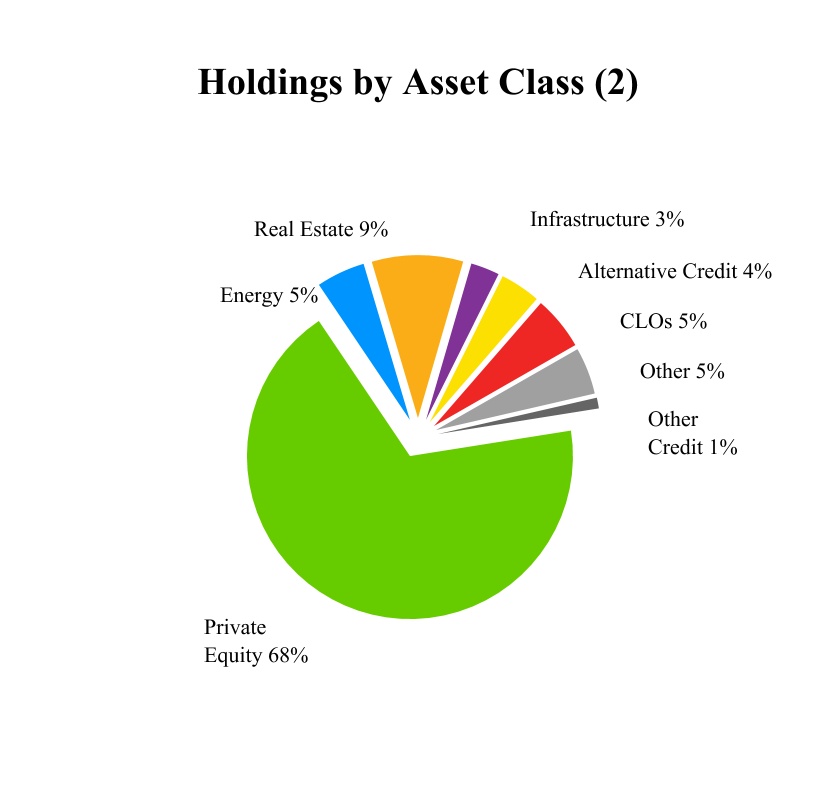
SCHEDULE OF INVESTMENTS (UNAUDITED) (1) | ||
| (Amounts in thousands, except percentage amounts) | ||
| As of December 31, 2020 | ||||||||
| Investments | Fair Value | |||||||
| Private Equity Funds / SMAs | $ | 6,445,077 | ||||||
| Private Equity Co-Investments and Other Equity | 3,719,477 | |||||||
| Private Equity Total | 10,164,554 | |||||||
| Energy | 724,848 | |||||||
| Real Estate | 1,324,660 | |||||||
| Infrastructure | 428,878 | |||||||
| Real Assets Total | 2,478,386 | |||||||
| Alternative Credit | 689,068 | |||||||
| CLOs | 798,279 | |||||||
| Other Credit | 161,187 | |||||||
| Credit Total | 1,648,534 | |||||||
| Other | 700,440 | |||||||
| Total Investments | $ | 14,991,914 | ||||||
| As of December 31, 2020 | ||||||||||||||
Significant Investments: (3) | Fair Value | Fair Value as a % of Total Investments | ||||||||||||
| Fiserv, Inc. | $ | 1,332,169 | 8.9 | % | ||||||||||
| BridgeBio Pharma Inc. | 974,317 | 6.5 | % | |||||||||||
| USI, Inc. | 884,634 | 5.9 | % | |||||||||||
| PetVet Care Centers, LLC | 559,333 | 3.7 | % | |||||||||||
| Heartland Dental, LLC | 545,064 | 3.6 | % | |||||||||||
| Total Significant Investments | 4,295,517 | 28.6 | % | |||||||||||
| Other Investments | 10,696,397 | 71.4 | % | |||||||||||
| Total Investments | $ | 14,991,914 | 100.0 | % | ||||||||||
(1)Investments is a term used solely for purposes of financial presentation of a portion of KKR’s balance sheet and includes majority ownership of subsidiaries that operate KKR’s asset management and other businesses, including the general partner interests of KKR’s investment funds.
(2)Private Equity includes KKR private equity funds, co-investments alongside such KKR sponsored private equity funds, core private equity funds and other opportunistic investments. Equity investments in other asset classes, such as energy, real estate, and alternative credit appear in these other asset classes.
(3)Significant Investments include the top five investments based on their fair values as of December 31, 2020. Significant Investments exclude (i) investments expected to be syndicated, (ii) investments expected to be transferred in connection with a new fundraising, and (iii) investments in funds and other entities that are owned by one or more third parties and established for the purpose of making investments. Accordingly, this list of Significant Investments should not be relied upon as a substitute for the "Holdings by Asset Class" pie chart above for information about the asset class exposure of KKR's balance sheet. The fair value figures include the co-investment and the limited partner and/or general partner interests held by KKR in the underlying investment, if applicable.
Page 10
| ASSETS UNDER MANAGEMENT (UNAUDITED) | ||||||||||||||||||||
| (Amounts in thousands) | ||||||||||||||||||||
| Private Markets Business Line | Public Markets Business Line | Total | ||||||||||||||||||
| Quarter Ended December 31, 2020 | ||||||||||||||||||||
| September 30, 2020 | $ | 135,758,500 | $ | 98,050,300 | $ | 233,808,800 | ||||||||||||||
| New Capital Raised | 7,847,000 | 3,750,900 | 11,597,900 | |||||||||||||||||
| Distributions and Other | (2,423,400) | (2,785,700) | (1) | (5,209,100) | ||||||||||||||||
| Change in Value | 7,507,200 | 3,974,400 | 11,481,600 | |||||||||||||||||
| December 31, 2020 | $ | 148,689,300 | $ | 102,989,900 | $ | 251,679,200 | ||||||||||||||
| Year Ended December 31, 2020 | ||||||||||||||||||||
| December 31, 2019 | $ | 119,274,700 | $ | 99,080,400 | $ | 218,355,100 | ||||||||||||||
| New Capital Raised | 28,040,000 | 15,750,300 | 43,790,300 | |||||||||||||||||
| Distributions and Other | (12,677,300) | (14,608,500) | (2) | (27,285,800) | ||||||||||||||||
| Change in Value | 14,051,900 | 2,767,700 | 16,819,600 | |||||||||||||||||
| December 31, 2020 | $ | 148,689,300 | $ | 102,989,900 | $ | 251,679,200 | ||||||||||||||
| FEE PAYING ASSETS UNDER MANAGEMENT (UNAUDITED) | ||||||||||||||||||||
| (Amounts in thousands) | ||||||||||||||||||||
| Private Markets Business Line | Public Markets Business Line | Total | ||||||||||||||||||
| Quarter Ended December 31, 2020 | ||||||||||||||||||||
| September 30, 2020 | $ | 90,351,000 | $ | 86,939,200 | $ | 177,290,200 | ||||||||||||||
| New Capital Raised | 5,583,900 | 4,640,800 | 10,224,700 | |||||||||||||||||
| Distributions and Other | (1,549,000) | (2,695,100) | (4) | (4,244,100) | ||||||||||||||||
Net Changes in Fee Base of Certain Funds (3) | (285,900) | — | (285,900) | |||||||||||||||||
| Change in Value | 95,900 | 3,136,200 | 3,232,100 | |||||||||||||||||
| December 31, 2020 | $ | 94,195,900 | $ | 92,021,100 | $ | 186,217,000 | ||||||||||||||
| Year Ended December 31, 2020 | ||||||||||||||||||||
| December 31, 2019 | $ | 76,918,100 | $ | 84,291,700 | $ | 161,209,800 | ||||||||||||||
| New Capital Raised | 24,357,800 | 16,025,700 | 40,383,500 | |||||||||||||||||
| Distributions and Other | (6,296,500) | (11,767,000) | (5) | (18,063,500) | ||||||||||||||||
Net Changes in Fee Base of Certain Funds (3) | (2,463,700) | — | (2,463,700) | |||||||||||||||||
| Change in Value | 1,680,200 | 3,470,700 | 5,150,900 | |||||||||||||||||
| December 31, 2020 | $ | 94,195,900 | $ | 92,021,100 | $ | 186,217,000 | ||||||||||||||
(1)Includes $2,230.6 million of redemptions by fund investors.
(2)Includes $11,047.5 million of redemptions by fund investors.
(3)Represents the impact of certain funds entering their post-investment period.
(4)Includes $1,826.9 million of redemptions by fund investors.
(5)Includes $7,443.2 million of redemptions by fund investors.
Page 11
| INVESTMENT VEHICLE SUMMARY (UNAUDITED) | ||||||||||||||||||||||||||||||||
| As of December 31, 2020 | ||||||||||||||||||||||||||||||||
| (Amounts in millions, except percentages) | ||||||||||||||||||||||||||||||||
| Investment Period | Amount | |||||||||||||||||||||||||||||||
| Start Date | End Date | Commitment | Uncalled Commitments | Percentage Committed by General Partner | Invested | Realized | Remaining Cost | Remaining Fair Value | ||||||||||||||||||||||||
| Private Markets Business Line | ||||||||||||||||||||||||||||||||
| Private Equity and Growth Funds | ||||||||||||||||||||||||||||||||
| Americas Fund XII | 1/2017 | 1/2023 | $ | 13,500.0 | $ | 5,462.1 | 5.8% | $ | 8,332.5 | $ | 379.6 | $ | 8,221.5 | $ | 13,506.1 | |||||||||||||||||
| North America Fund XI | 9/2012 | 1/2017 | 8,718.4 | 429.8 | 2.9% | 9,733.0 | 12,717.1 | 4,499.7 | 8,851.6 | |||||||||||||||||||||||
2006 Fund (1) | 9/2006 | 9/2012 | 17,642.2 | 247.4 | 2.1% | 17,309.3 | 32,435.1 | 2,546.3 | 4,794.0 | |||||||||||||||||||||||
Millennium Fund (1) | 12/2002 | 12/2008 | 6,000.0 | — | 2.5% | 6,000.0 | 14,123.1 | — | 6.1 | |||||||||||||||||||||||
| European Fund V | 3/2019 | 7/2025 | 6,415.0 | 3,810.0 | 1.8% | 2,605.0 | — | 2,605.0 | 3,130.9 | |||||||||||||||||||||||
| European Fund IV | 12/2014 | 3/2019 | 3,511.0 | 59.4 | 5.7% | 3,578.1 | 3,092.2 | 2,351.3 | 3,953.8 | |||||||||||||||||||||||
European Fund III (1) | 3/2008 | 3/2014 | 5,513.9 | 154.1 | 5.2% | 5,359.8 | 10,524.4 | 336.7 | 300.3 | |||||||||||||||||||||||
European Fund II (1) | 11/2005 | 10/2008 | 5,750.8 | — | 2.1% | 5,750.8 | 8,507.4 | — | 34.3 | |||||||||||||||||||||||
| Asian Fund IV | 7/2020 | 7/2026 | 13,818.5 | 13,818.5 | 7.2% | — | — | — | — | |||||||||||||||||||||||
| Asian Fund III | 4/2017 | 7/2020 | 9,000.0 | 3,168.7 | 5.6% | 6,190.7 | 1,261.1 | 5,795.6 | 8,773.5 | |||||||||||||||||||||||
| Asian Fund II | 4/2013 | 4/2017 | 5,825.0 | — | 1.3% | 6,842.4 | 4,903.4 | 4,023.2 | 5,416.4 | |||||||||||||||||||||||
Asian Fund (1) | 7/2007 | 4/2013 | 3,983.3 | — | 2.5% | 3,974.3 | 8,723.3 | 17.1 | 25.7 | |||||||||||||||||||||||
China Growth Fund (1) | 11/2010 | 11/2016 | 1,010.0 | — | 1.0% | 1,010.0 | 867.9 | 466.2 | 409.0 | |||||||||||||||||||||||
| Next Generation Technology Growth Fund II | 12/2019 | 12/2025 | 2,088.3 | 1,225.5 | 7.2% | 863.6 | 0.9 | 859.0 | 1,009.5 | |||||||||||||||||||||||
| Next Generation Technology Growth Fund | 3/2016 | 12/2019 | 658.9 | 2.3 | 22.5% | 663.3 | 326.8 | 527.6 | 1,096.4 | |||||||||||||||||||||||
| Health Care Strategic Growth Fund | 12/2016 | 12/2021 | 1,331.0 | 844.7 | 11.3% | 577.0 | 116.1 | 482.8 | 1,042.0 | |||||||||||||||||||||||
| Global Impact Fund | 2/2019 | 2/2025 | 1,242.2 | 694.6 | 8.1% | 547.6 | — | 547.6 | 645.8 | |||||||||||||||||||||||
| Total Private Equity and Growth Funds | 106,008.5 | 29,917.1 | 79,337.4 | 97,978.4 | 33,279.6 | 52,995.4 | ||||||||||||||||||||||||||
| Co-Investment Vehicles and Other | Various | Various | 12,069.8 | 4,285.7 | Various | 8,073.6 | 5,683.3 | 5,312.1 | 7,614.1 | |||||||||||||||||||||||
| Total Private Equity | 118,078.3 | 34,202.8 | 87,411.0 | 103,661.7 | 38,591.7 | 60,609.5 | ||||||||||||||||||||||||||
| Core Investment Vehicles | Various | Various | 10,693.6 | 3,326.3 | 33.0% | 7,367.3 | — | 7,367.3 | 10,481.9 | |||||||||||||||||||||||
| Real Assets | ||||||||||||||||||||||||||||||||
| Energy Income and Growth Fund II | 6/2018 | 6/2021 | 994.2 | 515.0 | 20.1% | 488.9 | 9.6 | 479.7 | 487.7 | |||||||||||||||||||||||
| Energy Income and Growth Fund | 9/2013 | 6/2018 | 1,974.2 | — | 12.9% | 1,967.9 | 834.8 | 1,239.4 | 975.9 | |||||||||||||||||||||||
Natural Resources Fund (1) | Various | Various | 887.4 | — | Various | 887.4 | 123.2 | 194.2 | 71.8 | |||||||||||||||||||||||
| Global Energy Opportunities | Various | Various | 914.1 | 63.4 | Various | 518.4 | 143.5 | 346.7 | 206.5 | |||||||||||||||||||||||
| Global Infrastructure Investors III | 6/2018 | 6/2024 | 7,193.3 | 4,019.1 | 3.8% | 3,390.1 | 216.0 | 3,328.7 | 3,294.9 | |||||||||||||||||||||||
| Global Infrastructure Investors II | 10/2014 | 6/2018 | 3,040.8 | 161.3 | 4.1% | 3,119.4 | 2,752.5 | 2,038.4 | 2,650.5 | |||||||||||||||||||||||
| Global Infrastructure Investors | 9/2011 | 10/2014 | 1,040.2 | 25.1 | 4.8% | 1,046.8 | 2,098.4 | 127.5 | 107.6 | |||||||||||||||||||||||
| Asia Pacific Infrastructure Investors | 1/2020 | 1/2026 | 3,791.6 | 3,791.6 | 6.6% | — | — | — | — | |||||||||||||||||||||||
| Real Estate Partners Americas II | 5/2017 | 12/2020 | 1,921.2 | 494.4 | 7.8% | 1,662.9 | 519.3 | 1,399.4 | 1,556.5 | |||||||||||||||||||||||
| Real Estate Partners Americas | 5/2013 | 5/2017 | 1,229.1 | 147.8 | 16.3% | 1,011.1 | 1,357.9 | 186.6 | 84.4 | |||||||||||||||||||||||
| Real Estate Partners Europe | 9/2015 | 12/2019 | 713.7 | 190.0 | 9.1% | 599.5 | 172.1 | 510.7 | 656.0 | |||||||||||||||||||||||
| Asia Real Estate Partners | 6/2019 | 6/2023 | 1,682.4 | 1,682.4 | 14.9% | — | — | — | — | |||||||||||||||||||||||
| Real Estate Credit Opportunity Partners II | 4/2019 | 6/2022 | 950.0 | 606.6 | 5.3% | 343.4 | 12.0 | 343.4 | 353.9 | |||||||||||||||||||||||
| Real Estate Credit Opportunity Partners | 2/2017 | 4/2019 | 1,130.0 | 122.2 | 4.4% | 1,007.8 | 232.2 | 1,007.8 | 942.6 | |||||||||||||||||||||||
| Property Partners Americas | 12/2019 | (2) | 2,012.5 | 1,446.7 | 24.8% | 565.8 | 11.5 | 565.8 | 618.1 | |||||||||||||||||||||||
| Co-Investment Vehicles and Other | Various | Various | 7,594.3 | 4,478.8 | Various | 3,115.5 | 923.5 | 3,111.8 | 3,644.3 | |||||||||||||||||||||||
| Total Real Assets | 37,069.0 | 17,744.4 | 19,724.9 | 9,406.5 | 14,880.1 | 15,650.7 | ||||||||||||||||||||||||||
Unallocated Commitments (3) | 903.1 | 903.1 | Various | — | — | — | — | |||||||||||||||||||||||||
| Private Markets Total | 166,744.0 | 56,176.6 | 114,503.2 | 113,068.2 | 60,839.1 | 86,742.1 | ||||||||||||||||||||||||||
Public Markets Business Line (4) | ||||||||||||||||||||||||||||||||
| Alternative Credit | ||||||||||||||||||||||||||||||||
| Dislocation Opportunities Fund | 5/2020 | 11/2021 | 2,813.9 | 2,162.3 | 14.3% | 651.6 | 23.8 | 651.6 | 802.9 | |||||||||||||||||||||||
| Special Situations Fund II | 2/2015 | 3/2019 | 3,524.7 | 299.5 | 9.0% | 3,225.2 | 1,054.8 | 2,533.8 | 2,373.1 | |||||||||||||||||||||||
| Special Situations Fund | 1/2013 | 1/2016 | 2,274.3 | 1.3 | 11.6% | 2,273.0 | 1,552.4 | 1,217.7 | 560.7 | |||||||||||||||||||||||
| Mezzanine Partners | 7/2010 | 3/2015 | 1,022.8 | 33.3 | 4.4% | 989.5 | 1,092.1 | 324.9 | 224.2 | |||||||||||||||||||||||
| Private Credit Opportunities Partners II | 12/2015 | 12/2020 | 2,245.1 | 803.0 | 2.2% | 1,442.1 | 178.7 | 1,392.4 | 1,462.0 | |||||||||||||||||||||||
| Lending Partners III | 4/2017 | 11/2021 | 1,497.8 | 757.1 | 1.7% | 740.7 | 187.9 | 740.7 | 774.3 | |||||||||||||||||||||||
| Lending Partners II | 6/2014 | 6/2017 | 1,335.9 | 156.8 | 3.7% | 1,179.1 | 1,100.7 | 529.9 | 215.8 | |||||||||||||||||||||||
| Lending Partners | 12/2011 | 12/2014 | 460.2 | 53.0 | 15.2% | 407.2 | 450.7 | 118.5 | 16.1 | |||||||||||||||||||||||
| Lending Partners Europe II | 6/2019 | 9/2023 | 836.6 | 655.2 | 6.7% | 181.4 | 10.1 | 181.4 | 211.0 | |||||||||||||||||||||||
| Lending Partners Europe | 3/2015 | 3/2019 | 847.6 | 212.3 | 5.0% | 635.3 | 240.7 | 515.4 | 378.7 | |||||||||||||||||||||||
| Total Alternative Credit | 16,858.9 | 5,133.8 | 11,725.1 | 5,891.9 | 8,206.3 | 7,018.8 | ||||||||||||||||||||||||||
| Other Alternative Credit Vehicles | Various | Various | 11,144.0 | 4,973.9 | Various | 6,170.1 | 3,706.7 | 4,153.1 | 4,206.4 | |||||||||||||||||||||||
Unallocated Commitments (3) | 124.3 | 124.3 | Various | — | — | — | — | |||||||||||||||||||||||||
| Public Markets Total | 28,127.2 | 10,232.0 | 17,895.2 | 9,598.6 | 12,359.4 | 11,225.2 | ||||||||||||||||||||||||||
| Total Eligible To Receive Carried Interest | $ | 194,871.2 | $ | 66,408.6 | $ | 132,398.4 | $ | 122,666.8 | $ | 73,198.5 | $ | 97,967.3 | ||||||||||||||||||||
(1)The "Invested" and "Realized" columns do not include the amounts of any realized investments that restored the unused capital commitments of the fund investors, if any.
(2)Open ended fund.
(3)Represents unallocated commitments from our strategic investor partnerships.
(4)The "Commitment" and "Uncalled Commitments" columns include income that is eligible to be reinvested if permitted under the terms of the investment vehicle agreements.
Page 12
| INVESTMENT VEHICLE SUMMARY (UNAUDITED) (CONTINUED) | ||||||||||||||||||||
| As of December 31, 2020 | ||||||||||||||||||||
| (Amounts in millions) | ||||||||||||||||||||
| Uncalled Commitments | Remaining Fair Value | Total | ||||||||||||||||||
| Carried Interest Eligible | $ | 66,408.6 | $ | 97,967.3 | $ | 164,375.9 | ||||||||||||||
| Incentive Fee Eligible | ||||||||||||||||||||
Hedge Fund Partnerships (1) | — | 21,215.9 | 21,215.9 | |||||||||||||||||
| Business Development Companies (BDCs) | — | 15,828.0 | 15,828.0 | |||||||||||||||||
| KKR Real Estate Finance Trust Inc. | — | 1,136.3 | 1,136.3 | |||||||||||||||||
| Other | — | 6,964.6 | 6,964.6 | |||||||||||||||||
| Total Carried Interest and Incentive Fee Eligible | 66,408.6 | 143,112.1 | 209,520.7 | |||||||||||||||||
| Collateralized Loan Obligations (CLOs) | — | 18,004.6 | 18,004.6 | |||||||||||||||||
Leveraged Credit / Hedge Fund Partnerships (1) / Other | 551.4 | 23,602.5 | 24,153.9 | |||||||||||||||||
| Total Assets Under Management | $ | 66,960.0 | $ | 184,719.2 | $ | 251,679.2 | ||||||||||||||
(1)Represents KKR's pro rata portion of AUM of hedge fund managers in which KKR holds a minority ownership interest. Total AUM for Hedge Fund Partnerships is $24,503.8 million, of which $21,215.9 million is incentive fee eligible.
| KKR’S PORTION OF TOTAL UNCALLED COMMITMENTS TO ITS INVESTMENT FUNDS | ||||||||||||||||||||
| (Amounts in thousands) | ||||||||||||||||||||
| As of | ||||||||||||||||||||
| December 31, 2020 | December 31, 2019 | |||||||||||||||||||
| Private Markets Business Line | $ | 5,517,700 | $ | 4,551,500 | ||||||||||||||||
| Public Markets Business Line | 756,200 | 689,700 | ||||||||||||||||||
| Total | $ | 6,273,900 | $ | 5,241,200 | ||||||||||||||||
Page 13
INFORMATION ON NON-GAAP AND OTHER MEASURES & DEFINITIONS (UNAUDITED)
KKR operates through one operating and reportable segment. Management makes operating decisions and assesses performance of our business prior to giving effect to the (i) allocation of income (loss) between KKR & Co. Inc. and KKR Holdings L.P.; (ii) consolidation of the investment funds and collateralized financing entities that KKR manages; and (iii) other consolidated entities that are not subsidiaries of KKR & Co. Inc.
KKR discloses the following financial measures in this earnings release that are calculated and presented using methodologies other than in accordance with GAAP: after-tax distributable earnings, after-tax distributable earnings per adjusted share, book value, book value per adjusted share, book assets, book liabilities, distributable revenues, distributable expenses and fee related earnings. We believe that providing these performance measures on a supplemental basis to our GAAP results is helpful to stockholders in assessing the overall performance of KKR’s businesses. These financial measures should not be considered as a substitute for similar financial measures calculated in accordance with GAAP, if available. In addition, we caution readers that these non-GAAP financial measures may differ from the calculations of other investment managers, and as a result, may not be comparable to similarly titled measures presented by other investment managers. These non-GAAP measures are presented in this earnings release as KKR’s operating results, which were previously referred to as segment results. Reconciliations of these non-GAAP financial measures to the most directly comparable financial measures calculated and presented in accordance with GAAP, where applicable, are included in Exhibit A.
Adjusted shares represents shares of common stock of KKR & Co. Inc. outstanding under GAAP adjusted to include shares issuable upon exchange of all units of KKR Holdings L.P. and the number of assumed shares of common stock issuable upon conversion of our Series C Mandatory Convertible Preferred Stock. We believe providing adjusted shares is useful to stockholders as it provides insight into the calculation of amounts available for distribution as dividends on a per adjusted share basis assuming all units of KKR Holdings L.P. and all shares of Series C Mandatory Convertible Preferred Stock are exchanged and converted, respectively, to shares of common stock. Weighted average adjusted shares is used in the calculation of after-tax distributable earnings per adjusted share and adjusted shares is used in the calculation of book value per adjusted share.
After-tax distributable earnings is a non-GAAP performance measure of KKR’s earnings excluding mark-to-market gains (losses) after interest expense, Series A and B preferred dividends, noncontrolling interests and income taxes paid. It is used by management to assess the net realized earnings of KKR for a given reporting period, after deducting equity-based compensation under the Equity Incentive Plans and adjusting to exclude the impact of strategic corporate transaction-related charges and non-recurring items, if any. KKR believes that after-tax distributable earnings is useful to stockholders as it aligns KKR’s net realization performance with the manner in which KKR receives its revenues and determines the compensation of its employees. Series C Mandatory Convertible Preferred Stock dividends have been excluded from after-tax distributable earnings because the definition of adjusted shares used to calculate after-tax distributable earnings per adjusted share assumes that all shares of Series C Mandatory Convertible Preferred Stock have been converted to shares of common stock. After-tax distributable earnings does not represent and is not used to calculate actual dividends under KKR’s dividend policy. Equity-based compensation expense is included in after-tax distributable earnings as a component of compensation expense in order to reflect the dilutive nature of these non-cash equity-based awards. Income taxes paid represents the implied amount of income taxes that would be paid assuming that all pre-tax distributable earnings were allocated to KKR & Co. Inc. and taxed at the same effective rate, which would occur following an exchange of all KKR Holdings units for common stock of KKR & Co. Inc. Income taxes paid also includes amounts paid pursuant to the tax receivable agreement.
Assets under management ("AUM") represent the assets managed or advised by KKR from which KKR is entitled to receive fees or a carried interest (either currently or upon deployment of capital), general partner capital, and assets managed or advised by our strategic BDC partnership and the hedge fund and other managers in which KKR holds an ownership interest. We believe this measure is useful to stockholders as it provides additional insight into the capital raising activities of KKR and its hedge fund and other managers and the overall activity in their investment funds and other managed capital. KKR calculates the amount of AUM as of any date as the sum of: (i) the fair value of the investments of KKR's investment funds; (ii) uncalled capital commitments from these funds, including uncalled capital commitments from which KKR is currently not earning management fees or carried interest; (iii) the fair value of investments in KKR's co-investment vehicles; (iv) the par value of outstanding CLOs (excluding CLOs wholly-owned by KKR); (v) KKR's pro rata portion of the AUM of hedge fund and other managers in which KKR holds an ownership interest; (vi) all AUM of the strategic BDC partnership with FS Investments; and (vii) the fair value of other assets managed by KKR. The pro rata portion of the AUM of hedge fund and other managers is calculated based on KKR’s percentage ownership interest in such entities multiplied by such entity’s respective AUM. KKR's definition of AUM is not based on any definition of AUM that may be set forth in the agreements governing the investment funds, vehicles or accounts that it manages or calculated pursuant to any regulatory definitions.
Book assets is a non-GAAP performance measure that represents cash and short-term investments, investments, net unrealized carried interest, tax assets, and other assets of KKR presented on a basis that deconsolidates (i) KKR's investment funds and collateralized financing entities that KKR manages and (ii) other consolidated entities that are not subsidiaries of KKR & Co. Inc. We believe this measure is useful to stockholders as it provides additional insight into the assets of KKR that are used to operate its business lines. As used in this definition, cash and short-term investments represent cash and liquid short-term investments in high-grade, short-duration cash management strategies used by KKR to generate additional yield.
Book liabilities is a non-GAAP performance measure that represents the debt obligations of KKR (including KFN), tax liabilities, and other liabilities of KKR presented on a basis that deconsolidates (i) KKR's investment funds and collateralized financing entities that KKR manages and (ii) other consolidated entities that are not subsidiaries of KKR & Co. Inc. We believe this measure is useful to stockholders as it provides additional insight into the liabilities of KKR excluding the liabilities that are allocated to noncontrolling interest holders and to the holders of the Series A and Series B Preferred Stock.
Page 14
Book value is a non-GAAP performance measure of the net assets of KKR and is used by management primarily in assessing the unrealized value of KKR’s book assets after deducting for book liabilities, noncontrolling interests and Series A and B Preferred Stock. We believe this measure is useful to stockholders as it provides additional insight into the net assets of KKR excluding those net assets that are allocated to noncontrolling interest holders and to the holders of the Series A and B Preferred Stock. KKR's book value includes the net impact of KKR's tax assets and liabilities as prepared under GAAP. Series C Mandatory Convertible Preferred Stock has been included in book value, because the definition of adjusted shares used to calculate book value per adjusted share assumes that all shares of Series C Mandatory Convertible Preferred Stock have been converted to shares of common stock.
Capital invested is the aggregate amount of capital invested by (i) KKR’s investment funds, (ii) KKR's Principal Activities business line as a co-investment, if any, alongside KKR’s investment funds, and (iii) KKR's Principal Activities business line in connection with a syndication transaction conducted by KKR's Capital Markets business line, if any. Capital invested is used as a measure of investment activity at KKR during a given period. We believe this measure is useful to stockholders as it provides a measure of capital deployment across KKR’s business lines. Capital invested includes investments made using investment financing arrangements like credit facilities, as applicable. Capital invested excludes (i) investments in certain leveraged credit strategies, (ii) capital invested by KKR’s Principal Activities business line that is not a co-investment alongside KKR’s investment funds, and (iii) capital invested by KKR’s Principal Activities business line that is not invested in connection with a syndication transaction by KKR’s Capital Markets business line. Capital syndicated by KKR's Capital Markets business line to third parties other than KKR’s investment funds or Principal Activities business line is not included in capital invested. See also syndicated capital.
Distributable revenues is a non-GAAP performance measure that represents the realized revenues (which excludes unrealized carried interest and unrealized net gains (losses)) generated by KKR and is the sum of (i) fees and other, net, (ii) realized performance income (loss) and (iii) realized investment income (loss). KKR believes that distributable revenues is useful to stockholders as it provides insight into the realized revenue generated by KKR's business lines.
Distributable expenses is a non-GAAP performance measure that represents the expenses of KKR and is the sum of (i) compensation and benefits (excluding unrealized performance income compensation), (ii) occupancy and related charges and (iii) other operating expenses. KKR believes that distributable expenses is useful to stockholders as it provides insight into the costs expended in connection with generating KKR's distributable revenues.
Distributable operating earnings is a non-GAAP performance measure that represents after-tax distributable earnings before interest expense, preferred dividends, income (loss) attributable to noncontrolling interests and income taxes paid. We believe distributable operating earnings is useful to stockholders as it provides a supplemental measure of our operating performance without taking into account items that we do not believe relate directly to KKR's operations.
Fee paying AUM ("FPAUM") represents only the AUM from which KKR is entitled to receive management fees. We believe this measure is useful to stockholders as it provides additional insight into the capital base upon which KKR earns management fees. FPAUM is the sum of all of the individual fee bases that are used to calculate KKR's and its hedge fund and BDC partnership management fees and differs from AUM in the following respects: (i) assets and commitments from which KKR is not entitled to receive a management fee are excluded (e.g., assets and commitments with respect to which it is entitled to receive only carried interest or is otherwise not currently entitled to receive a management fee) and (ii) certain assets, primarily in its private equity funds, are reflected based on capital commitments and invested capital as opposed to fair value because fees are not impacted by changes in the fair value of underlying investments.
Fee related earnings is a non-GAAP supplemental performance measure of earnings of KKR before performance income and investment income. KKR believes this measure may be useful to stockholders as it may provide additional insight into the profitability of KKR’s fee generating management companies and capital markets businesses. Fee related earnings is calculated as KKR’s total Fees and Other, Net, multiplied by KKR’s distributable operating margin. For purposes of the fee related earnings calculation, distributable operating margin is calculated as distributable operating earnings, before equity-based compensation, divided by total distributable revenues.
Syndicated capital is the aggregate amount of capital in transactions originated by KKR and its investment funds and carry-yielding co-investment vehicles, which has been distributed to third parties, generally in exchange for a fee. It does not include (i) capital invested in such transactions by KKR investment funds and carry-yielding co-investment vehicles, which is instead reported in capital invested, (ii) debt capital that is arranged as part of the acquisition financing of transactions originated by KKR investment funds, and (iii) debt capital that is either underwritten or arranged on a best efforts basis. Syndicated capital is used as a measure of investment activity for KKR during a given period, and we believe that this measure is useful to stockholders as it provides additional insight into levels of syndication activity in KKR's Capital Markets business line and across KKR's investment platform.
Uncalled commitments is the aggregate amount of unfunded capital commitments that KKR’s investment funds and carry-paying co-investment vehicles have received from partners to contribute capital to fund future investments. We believe this measure is useful to stockholders as it provides additional insight into the amount of capital that is available to KKR’s investment funds to make future investments. Uncalled commitments are not reduced for investments completed using fund-level investment financing arrangements.
Page 15
| EXHIBIT A | |||||||||||||||||||||||
| GAAP COMMON STOCK AND ADJUSTED SHARES (UNAUDITED) | |||||||||||||||||||||||
| The following table provides a reconciliation of KKR's Weighted Average GAAP Shares of Common Stock Outstanding to Weighted Average Adjusted Shares: | |||||||||||||||||||||||
| Quarter Ended | |||||||||||||||||||||||
| December 31, 2020 | September 30, 2020 | December 31, 2019 | |||||||||||||||||||||
| Weighted Average GAAP Shares of Common Stock Outstanding - Basic | 570,818,257 | 562,425,576 | 555,379,973 | ||||||||||||||||||||
| Adjustments: | |||||||||||||||||||||||
Weighted Average KKR Holdings Units (1) | 277,306,865 | 282,692,900 | 292,947,120 | ||||||||||||||||||||
Weighted Average Common Stock - Series C Mandatory Convertible Preferred Stock(2) | 29,092,933 | 16,736,309 | — | ||||||||||||||||||||
Weighted Average Adjusted Shares (3) | 877,218,055 | 861,854,785 | 848,327,093 | ||||||||||||||||||||
| Year Ended | |||||||||||||||||||||||
| December 31, 2020 | December 31, 2019 | ||||||||||||||||||||||
| Weighted Average GAAP Shares of Common Stock Outstanding - Basic | 562,812,883 | 545,096,999 | |||||||||||||||||||||
| Adjustments: | |||||||||||||||||||||||
Weighted Average KKR Holdings Units (1) | 283,633,220 | 296,445,196 | |||||||||||||||||||||
Weighted Average Common Stock - Series C Mandatory Convertible Preferred Stock(2) | 11,048,955 | — | |||||||||||||||||||||
Weighted Average Adjusted Shares (3) | 857,495,058 | 841,542,195 | |||||||||||||||||||||
| The following table provides a reconciliation of KKR's GAAP Shares of Common Stock Outstanding to Adjusted Shares: | |||||||||||||||||||||||
| As of | |||||||||||||||||||||||
| December 31, 2020 | December 31, 2019 | ||||||||||||||||||||||
| GAAP Shares of Common Stock Outstanding | 572,893,738 | 560,007,579 | |||||||||||||||||||||
| Adjustments: | |||||||||||||||||||||||
KKR Holdings Units (1) | 275,626,493 | 290,381,345 | |||||||||||||||||||||
Common Stock - Series C Mandatory Convertible Preferred Stock (2) | 29,092,933 | — | |||||||||||||||||||||
Adjusted Shares (3) | 877,613,164 | 850,388,924 | |||||||||||||||||||||
| Unvested Shares of Common Stock and Other Exchangeable Securities | 23,892,201 | 22,712,604 | |||||||||||||||||||||
(1)Shares that may be issued by KKR & Co. Inc. upon exchange of units in KKR Holdings L.P. for KKR common stock.
(2)Assumes that all shares of Series C Mandatory Convertible Preferred Stock have been converted to shares of KKR & Co. Inc. common stock on December 31, 2020.
(3)Amounts exclude unvested shares granted under the Equity Incentive Plans.
Page 16
| EXHIBIT A (CONTINUED) | ||||||||||||||||||||
| RECONCILIATION OF NET INCOME (LOSS) ATTRIBUTABLE TO KKR & CO. INC. PER SHARE OF COMMON STOCK - BASIC (GAAP BASIS) | ||||||||||||||||||||
| TO AFTER-TAX DISTRIBUTABLE EARNINGS PER ADJUSTED SHARE AND ADJUSTED EBITDA (UNAUDITED) | ||||||||||||||||||||
| (Amounts in thousands, except share and per share amounts) | ||||||||||||||||||||
| Quarter Ended | ||||||||||||||||||||
| December 31, 2020 | September 30, 2020 | December 31, 2019 | ||||||||||||||||||
| Net Income (Loss) Attributable to KKR & Co. Inc. Per Share of Common Stock - Basic | $ | 2.60 | $ | 1.86 | $ | 0.93 | ||||||||||||||
| Weighted Average Shares of Common Stock Outstanding - Basic | 570,818,257 | 562,425,576 | 555,379,973 | |||||||||||||||||
| Net Income (Loss) Available to KKR & Co. Inc. Common Stockholders | $ | 1,485,439 | $ | 1,047,685 | $ | 515,101 | ||||||||||||||
| Accumulated Series C Mandatory Convertible Preferred Dividend | (5,750) | 8,817 | — | |||||||||||||||||
| Net Income (Loss) Attributable to KKR & Co. Inc. Common Stockholders | $ | 1,479,689 | $ | 1,056,502 | $ | 515,101 | ||||||||||||||
| (+) Net Income (Loss) Attributable to Noncontrolling Interests held by KKR Holdings L.P. | 905,988 | 691,730 | 351,844 | |||||||||||||||||
| (+) Equity-based and Other Compensation - KKR Holdings L.P. | 17,143 | 21,802 | 22,836 | |||||||||||||||||
| (+) Amortization of Intangibles and Other, net | 129,831 | 11,211 | 95,230 | |||||||||||||||||
(+) Strategic Corporate Transaction-Related Charges (1) | 9,376 | 10,697 | — | |||||||||||||||||
| (-) Net Unrealized Carried Interest | 1,257,340 | 995,376 | 338,420 | |||||||||||||||||
| (-) Net Unrealized Gains (Losses) | 1,715,789 | 1,088,901 | 502,686 | |||||||||||||||||
| (+) Unrealized Performance Income Compensation | 525,256 | 418,728 | 140,852 | |||||||||||||||||
| (+) Income Tax Expense (Benefit) | 404,137 | 359,375 | 142,626 | |||||||||||||||||
| (-) Income Taxes Paid | 67,187 | 75,413 | 52,242 | |||||||||||||||||
| After-tax Distributable Earnings | $ | 431,104 | $ | 410,355 | $ | 375,141 | ||||||||||||||
| Weighted Average Adjusted Shares | 877,218,055 | 861,854,785 | 848,327,093 | |||||||||||||||||
| After-tax Distributable Earnings Per Adjusted Share | $ | 0.49 | $ | 0.48 | $ | 0.44 | ||||||||||||||
| After-tax Distributable Earnings | $ | 431,104 | $ | 410,355 | $ | 375,141 | ||||||||||||||
| (+) Equity-based Compensation (Equity Incentive Plans) | 112,971 | 42,488 | 49,898 | |||||||||||||||||
| (+) Income (Loss) Attributable to Noncontrolling Interests | 3,042 | 2,709 | 1,803 | |||||||||||||||||
| (+) Income Taxes Paid | 67,187 | 75,413 | 52,242 | |||||||||||||||||
| (+) Series A and B Preferred Dividends | 8,341 | 8,341 | 8,341 | |||||||||||||||||
(+) Core Interest Expense (2) | 45,402 | 41,409 | 30,663 | |||||||||||||||||
| (+) Depreciation and Amortization | 4,437 | 4,568 | 4,699 | |||||||||||||||||
Adjusted EBITDA (3) | $ | 672,484 | $ | 585,283 | $ | 522,787 | ||||||||||||||
(1)Represents transaction costs related to the acquisition of Global Atlantic.
(2)Core interest expense may be used by certain debt investors as an alternative measurement of interest expense incurred by KKR and excludes interest expense related to debt obligations from investment financing arrangements related to certain of KKR’s investment funds, investment vehicles and principal investments and also excludes interest expense incurred by KFN. The financing arrangements excluded from core interest expense are not direct obligations of the general partners of KKR’s private equity funds or its management companies, and in the case of debt obligations of KFN, are non-recourse to KKR beyond the assets of KFN. KKR believes this measure is useful to debt investors as it provides an indication of the amount of interest expense borne by KKR excluding interest expense that is allocated to KKR’s investment funds, other noncontrolling interest holders and KFN. Additionally, we believe this measure is useful for analyzing KKR’s ability to service its debt obligations other than the debt obligations of KFN.
(3)Adjusted EBITDA may be useful to debt investors in evaluating KKR's ability to service its debt and provides insight into the amount of KKR’s distributable earnings before the impact of interest expense, taxes, depreciation and amortization, equity-based compensation, preferred dividends and noncontrolling interests.
Page 17
| EXHIBIT A (CONTINUED) | ||||||||||||||||||||
| RECONCILIATION OF NET INCOME (LOSS) ATTRIBUTABLE TO KKR & CO. INC. PER SHARE OF COMMON STOCK - BASIC (GAAP BASIS) | ||||||||||||||||||||
| TO AFTER-TAX DISTRIBUTABLE EARNINGS PER ADJUSTED SHARE AND ADJUSTED EBITDA (UNAUDITED) | ||||||||||||||||||||
| (Amounts in thousands, except share and per share amounts) | ||||||||||||||||||||
| Year Ended | ||||||||||||||||||||
| December 31, 2020 | December 31, 2019 | |||||||||||||||||||
| Net Income (Loss) Attributable to KKR & Co. Inc. Per Share of Common Stock - Basic | $ | 3.45 | $ | 3.62 | ||||||||||||||||
| Weighted Average Shares of Common Stock Outstanding - Basic | 562,812,883 | 545,096,999 | ||||||||||||||||||
| Net Income (Loss) Available to KKR & Co. Inc. Common Stockholders | $ | 1,942,887 | $ | 1,971,685 | ||||||||||||||||
| (+) Accumulated Series C Mandatory Convertible Preferred Dividend | 3,067 | — | ||||||||||||||||||
| Net Income (Loss) Attributable to KKR & Co. Inc. Common Stockholders | $ | 1,945,954 | $ | 1,971,685 | ||||||||||||||||
| (+) Net Income (Loss) Attributable to Noncontrolling Interests held by KKR Holdings L.P. | 1,207,934 | 1,369,671 | ||||||||||||||||||
| (+) Equity-based and Other Compensation - KKR Holdings L.P. | 80,739 | 91,296 | ||||||||||||||||||
| (+) Amortization of Intangibles and Other, net | 137,285 | 226,422 | ||||||||||||||||||
(+) Strategic Corporate Transaction-Related Charges (1) | 20,073 | — | ||||||||||||||||||
(+) Non-recurring Items (2) | 88,322 | 22,839 | ||||||||||||||||||
| (-) Net Unrealized Carried Interest | 1,070,803 | 1,263,046 | ||||||||||||||||||
| (-) Net Unrealized Gains (Losses) | 1,697,740 | 1,854,867 | ||||||||||||||||||
| (+) Unrealized Performance Income Compensation | 467,485 | 520,033 | ||||||||||||||||||
| (+) Income Tax Expense (Benefit) | 609,097 | 528,750 | ||||||||||||||||||
| (-) Income Taxes Paid | 265,950 | 207,479 | ||||||||||||||||||
| After-tax Distributable Earnings | $ | 1,522,396 | $ | 1,405,304 | ||||||||||||||||
| Weighted Average Adjusted Shares | 857,495,058 | 841,542,195 | ||||||||||||||||||
| After-tax Distributable Earnings Per Adjusted Share | $ | 1.78 | $ | 1.67 | ||||||||||||||||
| After-tax Distributable Earnings | $ | 1,522,396 | $ | 1,405,304 | ||||||||||||||||
| (+) Equity-based Compensation (Equity Incentive Plans) | 246,395 | 207,789 | ||||||||||||||||||
| (+) Income (Loss) Attributable to Noncontrolling Interests | 7,842 | 4,907 | ||||||||||||||||||
| (+) Income Taxes Paid | 265,950 | 207,479 | ||||||||||||||||||
| (+) Series A and B Preferred Dividends | 33,364 | 33,364 | ||||||||||||||||||
(+) Core Interest Expense (3) | 158,186 | 128,387 | ||||||||||||||||||
| (+) Depreciation and Amortization | 18,626 | 17,653 | ||||||||||||||||||
Adjusted EBITDA (4) | $ | 2,252,759 | $ | 2,004,883 | ||||||||||||||||
(1)Represents transaction costs related to the acquisition of Global Atlantic.
(2)Represents a $88.3 million non-recurring impairment charge taken on one of our equity method investments during the year ended December 31, 2020 and a non-recurring $22.8 million make-whole premium associated with KKR’s refinancing of its 2020 Senior Notes for the year ended December 31, 2019.
(3)Core interest expense may be used by certain debt investors as an alternative measurement of interest expense incurred by KKR and excludes interest expense related to debt obligations from investment financing arrangements related to certain of KKR’s investment funds, investment vehicles and principal investments and also excludes interest expense incurred by KFN. The financing arrangements excluded from core interest expense are not direct obligations of the general partners of KKR’s private equity funds or its management companies, and in the case of debt obligations of KFN, are non-recourse to KKR beyond the assets of KFN. KKR believes this measure is useful to debt investors as it provides an indication of the amount of interest expense borne by KKR excluding interest expense that is allocated to KKR’s investment funds, other noncontrolling interest holders and KFN. Additionally, we believe this measure is useful for analyzing KKR’s ability to service its debt obligations other than the debt obligations of KFN.
(4)Adjusted EBITDA may be useful to debt investors in evaluating KKR's ability to service its debt and provides insight into the amount of KKR’s distributable earnings before the impact of interest expense, taxes, depreciation and amortization, equity-based compensation, preferred dividends and noncontrolling interests.
Page 18
| EXHIBIT A (CONTINUED) | ||||||||||||||||||||
| RECONCILIATION OF TOTAL GAAP REVENUES TO TOTAL DISTRIBUTABLE REVENUES (UNAUDITED) | ||||||||||||||||||||
| (Amounts in thousands) | ||||||||||||||||||||
| Quarter Ended | ||||||||||||||||||||
| December 31, 2020 | September 30, 2020 | December 31, 2019 | ||||||||||||||||||
| Total GAAP Revenues | $ | 2,005,164 | $ | 1,895,238 | $ | 1,063,071 | ||||||||||||||
| (+) Management Fees - Consolidated Funds and Other | 240,621 | 121,365 | 115,723 | |||||||||||||||||
| (-) Fee Credits - Consolidated Funds | 33,807 | 25,955 | 20,572 | |||||||||||||||||
| (-) Capital Allocation-Based Income (Loss) (GAAP) | 1,335,758 | 1,331,898 | 580,802 | |||||||||||||||||
| (+) Realized Carried Interest | 117,230 | 217,978 | 232,180 | |||||||||||||||||
| (+) Realized Investment Income (Loss) | 148,755 | 260,415 | 226,470 | |||||||||||||||||
| (-) Revenue Earned by Other Consolidated Entities | — | 6,687 | 25,742 | |||||||||||||||||
| (-) Capstone Fees | 25,910 | 17,429 | — | |||||||||||||||||
| (-) Expense Reimbursements | 48,743 | 44,553 | 48,259 | |||||||||||||||||
| Total Distributable Revenues | $ | 1,067,552 | $ | 1,068,474 | $ | 962,069 | ||||||||||||||
| Year Ended | ||||||||||||||||||||
| December 31, 2020 | December 31, 2019 | |||||||||||||||||||
| Total GAAP Revenues | $ | 4,230,891 | $ | 4,220,900 | ||||||||||||||||
| (+) Management Fees - Consolidated Funds and Other | 603,508 | 464,190 | ||||||||||||||||||
| (-) Fee Credits - Consolidated Funds | 74,229 | 42,041 | ||||||||||||||||||
| (-) Capital Allocation-Based Income (GAAP) | 2,224,100 | 2,430,425 | ||||||||||||||||||
| (+) Realized Carried Interest | 1,042,204 | 1,070,788 | ||||||||||||||||||
| (+) Realized Investment Income (Loss) | 644,659 | 685,773 | ||||||||||||||||||
| (-) Revenue Earned by Other Consolidated Entities | 21,054 | 116,435 | ||||||||||||||||||
| (-) Capstone Fees | 81,452 | — | ||||||||||||||||||
| (-) Expense Reimbursements | 149,522 | 169,416 | ||||||||||||||||||
| Total Distributable Revenues | $ | 3,970,905 | $ | 3,683,334 | ||||||||||||||||
| RECONCILIATION OF TOTAL GAAP EXPENSES TO TOTAL DISTRIBUTABLE EXPENSES (UNAUDITED) | ||||||||||||||||||||
| (Amounts in thousands) | ||||||||||||||||||||
| Quarter Ended | ||||||||||||||||||||
| December 31, 2020 | September 30, 2020 | December 31, 2019 | ||||||||||||||||||
| Total GAAP Expenses | $ | 1,179,057 | $ | 1,093,699 | $ | 751,320 | ||||||||||||||
| (-) Equity-based and Other Compensation - KKR Holdings L.P. | 17,143 | 21,802 | 22,836 | |||||||||||||||||
| (-) Unrealized Performance Income Compensation | 525,256 | 418,728 | 140,852 | |||||||||||||||||
| (-) Amortization of Intangibles | 412 | 399 | 373 | |||||||||||||||||
| (-) Strategic Corporate Transaction-Related Charges | 9,376 | 10,697 | — | |||||||||||||||||
| (-) Reimbursable Expenses | 54,470 | 50,382 | 56,453 | |||||||||||||||||
| (-) Expenses relating to Other Consolidated Entities | 45,346 | 43,268 | 47,808 | |||||||||||||||||
| (-) Capstone Expenses | 19,388 | 14,433 | — | |||||||||||||||||
| (+) Other | (8,149) | (16,792) | (2,823) | |||||||||||||||||
| Total Distributable Expenses | $ | 499,517 | $ | 517,198 | $ | 480,175 | ||||||||||||||
| Year Ended | ||||||||||||||||||||
| December 31, 2020 | December 31, 2019 | |||||||||||||||||||
| Total GAAP Expenses | $ | 2,933,132 | $ | 2,908,431 | ||||||||||||||||
| (-) Equity-based and Other Compensation - KKR Holdings L.P. | 80,739 | 91,921 | ||||||||||||||||||
| (-) Unrealized Performance Income Compensation | 467,485 | 520,033 | ||||||||||||||||||
| (-) Amortization of Intangibles | 1,570 | 1,674 | ||||||||||||||||||
| (-) Strategic Corporate Transaction-Related Charges | 20,073 | — | ||||||||||||||||||
| (-) Reimbursable Expenses | 177,834 | 196,694 | ||||||||||||||||||
| (-) Expenses relating to Other Consolidated Entities | 144,072 | 187,056 | ||||||||||||||||||
| (-) Capstone Expenses | 65,666 | — | ||||||||||||||||||
| (+) Other | (45,377) | (62,455) | ||||||||||||||||||
| Total Distributable Expenses | $ | 1,930,316 | $ | 1,848,598 | ||||||||||||||||
Page 19
| EXHIBIT A (CONTINUED) | ||||||||||||||
| RECONCILIATION OF CERTAIN GAAP TO NON-GAAP BALANCE SHEET MEASURES (UNAUDITED) | ||||||||||||||
| (Amounts in thousands) | ||||||||||||||
| As of | ||||||||||||||
| December 31, 2020 | December 31, 2019 | |||||||||||||
| Total GAAP Assets | $ | 79,806,502 | $ | 60,899,319 | ||||||||||
| (-) Impact of Consolidation of Funds and Other Entities | 49,236,961 | 37,453,629 | ||||||||||||
| (-) Carry Pool Reclassification | 1,916,669 | 1,448,879 | ||||||||||||
| (-) Other Reclassifications | 831,853 | 376,360 | ||||||||||||
| Total Book Assets | $ | 27,821,019 | $ | 21,620,451 | ||||||||||
| As of | ||||||||||||||
| December 31, 2020 | December 31, 2019 | |||||||||||||
| Total GAAP Liabilities | $ | 39,006,586 | $ | 30,396,945 | ||||||||||
| (-) Impact of Consolidation of Funds and Other Entities | 29,233,911 | 23,841,496 | ||||||||||||
| (-) Carry Pool Reclassification | 1,916,669 | 1,448,879 | ||||||||||||
| (-) Other Reclassifications | 831,853 | 376,360 | ||||||||||||
| Total Book Liabilities | $ | 7,024,153 | $ | 4,730,210 | ||||||||||
| As of | ||||||||||||||
| December 31, 2020 | December 31, 2019 | |||||||||||||
| KKR & Co. Inc. Stockholders' Equity - Series I and II Preferred Stock, Common Stock | $ | 12,118,472 | $ | 10,324,936 | ||||||||||
| (+) Impact of Consolidation of Funds and Other Entities | 538,156 | 327,826 | ||||||||||||
| (-) Other Reclassifications | 17,446 | 17,446 | ||||||||||||
| (+) Noncontrolling Interests Held by KKR Holdings L.P. | 6,512,382 | 5,728,634 | ||||||||||||
| (+) Series C Mandatory Convertible Preferred Stock | 1,115,792 | — | ||||||||||||
| Book Value | $ | 20,267,356 | $ | 16,363,950 | ||||||||||
Page 20