Attached files
| file | filename |
|---|---|
| EX-32 - CERTIFICATIONS UNDER SECTION 906 OF THE SARBANES-OXLEY ACT OF 2002 - FASTENAL CO | fast1231202010-kexhibit32.htm |
| EX-31 - CERTIFICATIONS UNDER SECTION 302 OF THE SARBANES-OXLEY ACT OF 2002 - FASTENAL CO | fast1231202010-kexhibit31.htm |
| EX-23 - CONSENT OF INDEPENDENT REGISTERED PUBLIC ACCOUNTING FIRM - FASTENAL CO | fast1231202010-kexhibit23.htm |
| EX-21 - SUBSIDIARIES OF FASTENAL COMPANY - FASTENAL CO | fast1231202010-kexhibit21.htm |
| EX-10.1 - BONUS PROGRAM FOR EXECUTIVE OFFICERS - FASTENAL CO | fast1231202010-kexhibit101.htm |
| EX-4.4 - DESCRIPTION OF CAPITAL STOCK - FASTENAL CO | fast1231202010-kexhibit44.htm |
| 10-K - 10-K - FASTENAL CO | fast-20201231.htm |
2 0 2 0 A N N U A L R E P O R T 2020 AN N U AL R EPO RT
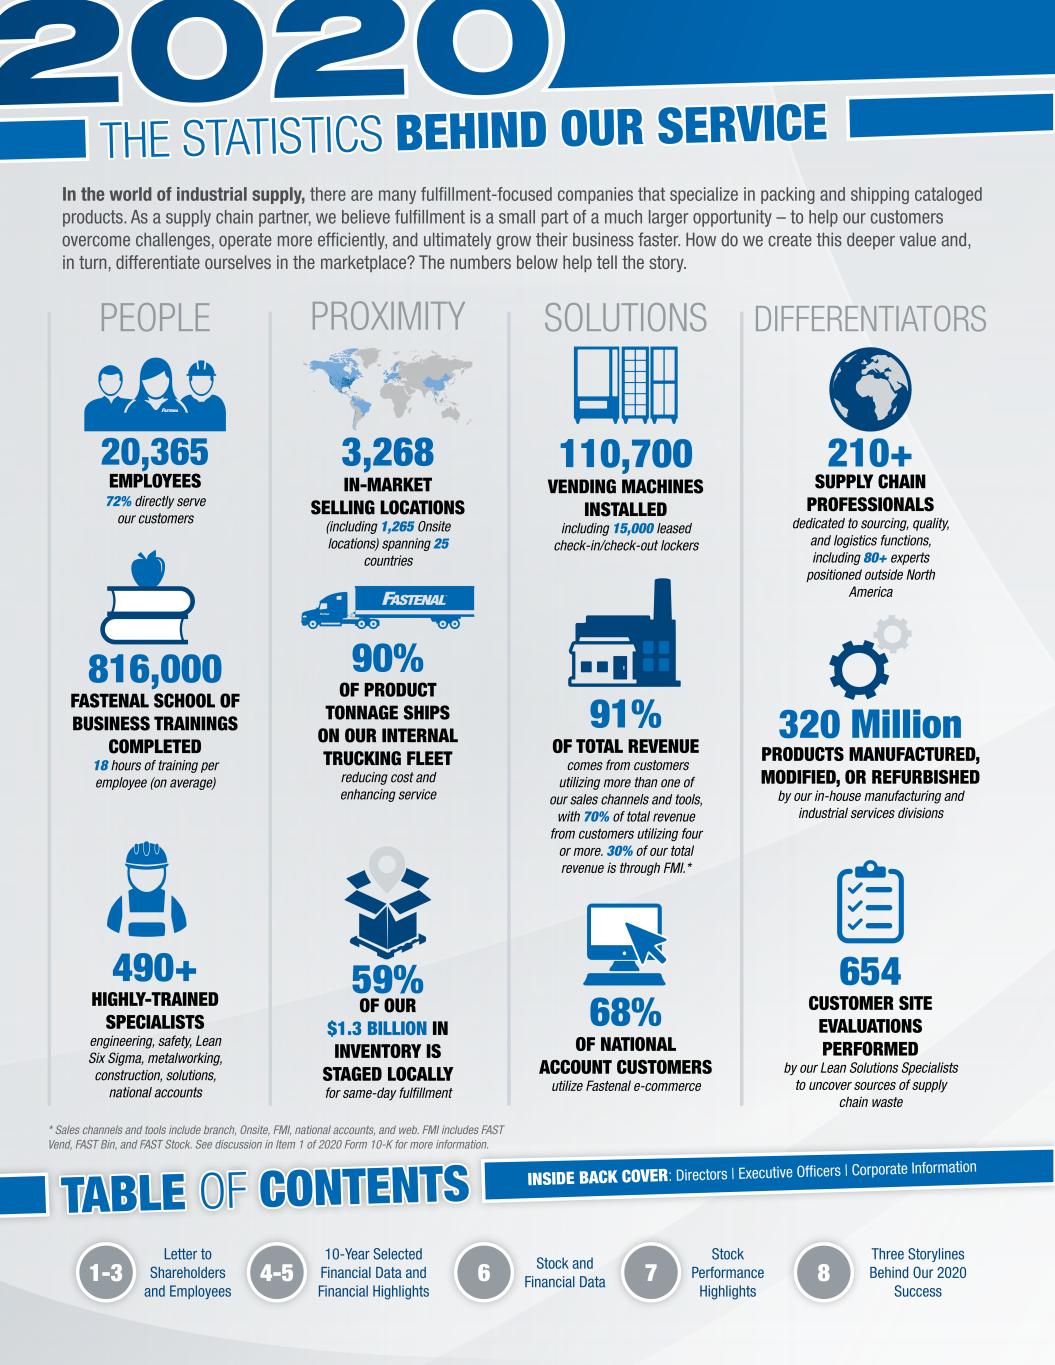
IN-MARKET SELLING LOCATIONS (including 1,265 Onsite locations) spanning 25 countries 3,268 1-3 4-5 6 7 8 Letter to Shareholders and Employees 10-Year Selected Financial Data and Financial Highlights Stock and Financial Data Stock Performance Highlights Three Storylines Behind Our 2020 Success THE STATISTICS BEHIND OUR SERVICE PEOPLE SOLUTIONSPROXIMITY DIFFERENTIATORS In the world of industrial supply, there are many fulfillment-focused companies that specialize in packing and shipping cataloged products. As a supply chain partner, we believe fulfillment is a small part of a much larger opportunity – to help our customers overcome challenges, operate more efficiently, and ultimately grow their business faster. How do we create this deeper value and, in turn, differentiate ourselves in the marketplace? The numbers below help tell the story. 72% directly serve our customers FASTENAL SCHOOL OF BUSINESS TRAININGS COMPLETED 18 hours of training per employee (on average) 816,000 PRODUCTS MANUFACTURED, MODIFIED, OR REFURBISHED by our in-house manufacturing and industrial services divisions 320 Million CUSTOMER SITE EVALUATIONS PERFORMED by our Lean Solutions Specialists to uncover sources of supply chain waste 654 OF PRODUCT TONNAGE SHIPS ON OUR INTERNAL TRUCKING FLEET reducing cost and enhancing service 90% OF OUR $1.3 BILLION IN INVENTORY IS STAGED LOCALLY for same-day fulfillment 59% HIGHLY-TRAINED SPECIALISTS engineering, safety, Lean Six Sigma, metalworking, construction, solutions, national accounts 490+ 68% OF NATIONAL ACCOUNT CUSTOMERS utilize Fastenal e-commerce OF TOTAL REVENUE comes from customers utilizing more than one of our sales channels and tools, with 70% of total revenue from customers utilizing four or more. 30% of our total revenue is through FMI.* 91% VENDING MACHINES INSTALLED including 15,000 leased check-in/check-out lockers 110,700 SUPPLY CHAIN PROFESSIONALS dedicated to sourcing, quality, and logistics functions, including 80+ experts positioned outside North America 210+ TABLE OF CONTENTS 20,365 EMPLOYEES INSIDE BACK COVER: Directors | Executive Officer s | Corporate Information * Sales channels and tools include branch, Onsite, FMI, national accounts, and web. FMI includes FAST Vend, FAST Bin, and FAST Stock. See discussion in Item 1 of 2020 Form 10-K for more information.
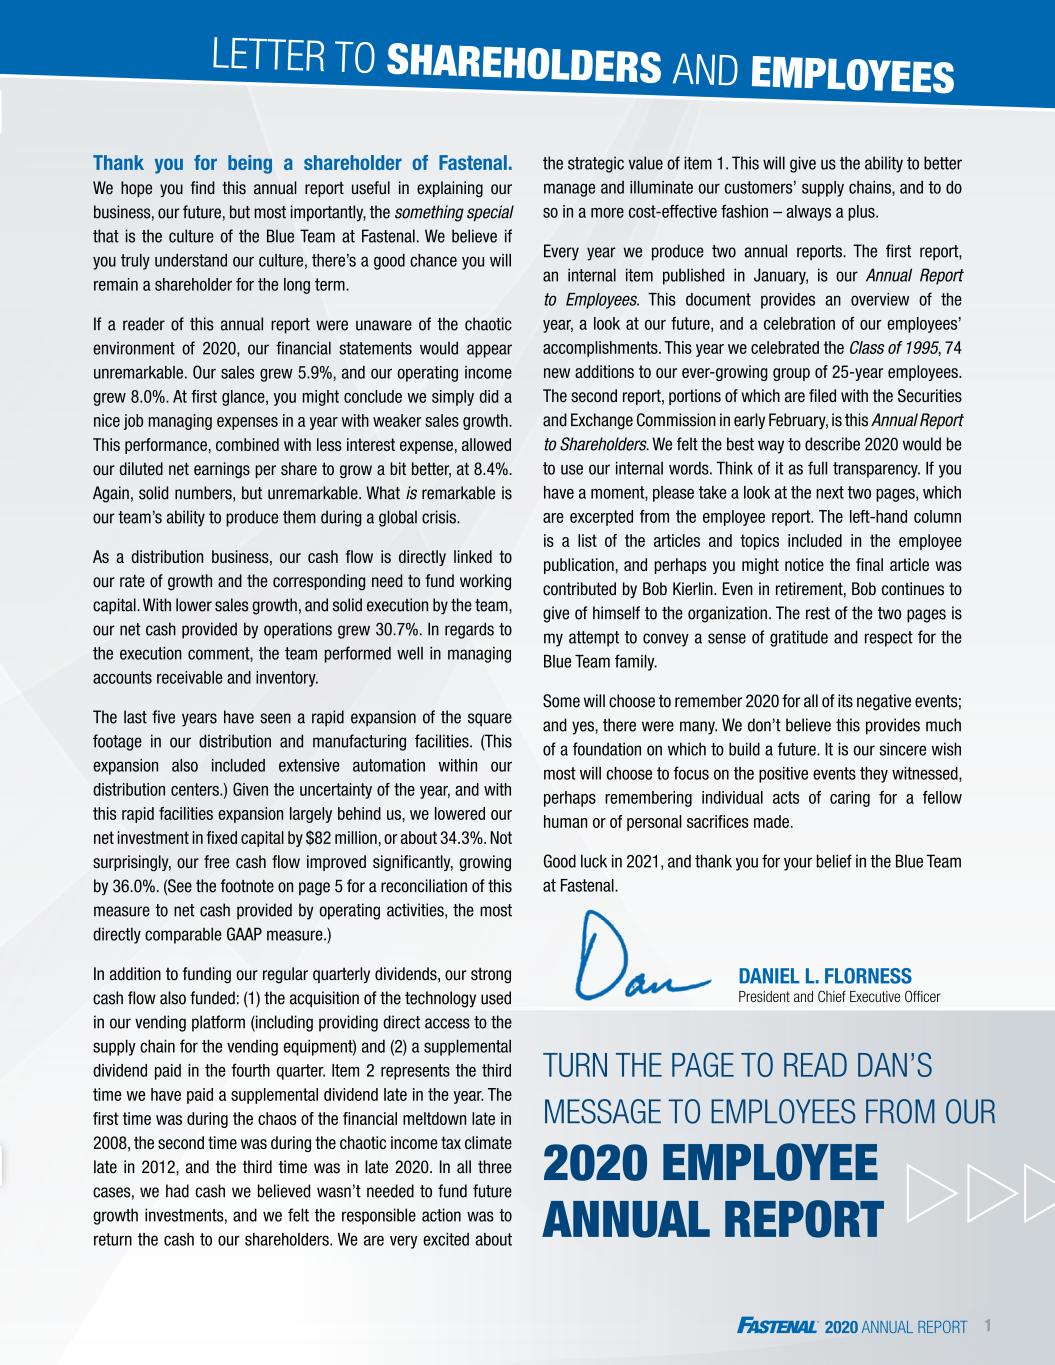
2020 ANNUAL REPORT 1 LETTER TO SHAREHOLDERS AND EMPLOYEES Thank you for being a shareholder of Fastenal. We hope you find this annual report useful in explaining our business, our future, but most importantly, the something special that is the culture of the Blue Team at Fastenal. We believe if you truly understand our culture, there’s a good chance you will remain a shareholder for the long term. If a reader of this annual report were unaware of the chaotic environment of 2020, our financial statements would appear unremarkable. Our sales grew 5.9%, and our operating income grew 8.0%. At first glance, you might conclude we simply did a nice job managing expenses in a year with weaker sales growth. This performance, combined with less interest expense, allowed our diluted net earnings per share to grow a bit better, at 8.4%. Again, solid numbers, but unremarkable. What is remarkable is our team’s ability to produce them during a global crisis. As a distribution business, our cash flow is directly linked to our rate of growth and the corresponding need to fund working capital. With lower sales growth, and solid execution by the team, our net cash provided by operations grew 30.7%. In regards to the execution comment, the team performed well in managing accounts receivable and inventory. The last five years have seen a rapid expansion of the square footage in our distribution and manufacturing facilities. (This expansion also included extensive automation within our distribution centers.) Given the uncertainty of the year, and with this rapid facilities expansion largely behind us, we lowered our net investment in fixed capital by $82 million, or about 34.3%. Not surprisingly, our free cash flow improved significantly, growing by 36.0%. (See the footnote on page 5 for a reconciliation of this measure to net cash provided by operating activities, the most directly comparable GAAP measure.) In addition to funding our regular quarterly dividends, our strong cash flow also funded: (1) the acquisition of the technology used in our vending platform (including providing direct access to the supply chain for the vending equipment) and (2) a supplemental dividend paid in the fourth quarter. Item 2 represents the third time we have paid a supplemental dividend late in the year. The first time was during the chaos of the financial meltdown late in 2008, the second time was during the chaotic income tax climate late in 2012, and the third time was in late 2020. In all three cases, we had cash we believed wasn’t needed to fund future growth investments, and we felt the responsible action was to return the cash to our shareholders. We are very excited about the strategic value of item 1. This will give us the ability to better manage and illuminate our customers’ supply chains, and to do so in a more cost-effective fashion – always a plus. Every year we produce two annual reports. The first report, an internal item published in January, is our Annual Report to Employees. This document provides an overview of the year, a look at our future, and a celebration of our employees’ accomplishments. This year we celebrated the Class of 1995, 74 new additions to our ever-growing group of 25-year employees. The second report, portions of which are filed with the Securities and Exchange Commission in early February, is this Annual Report to Shareholders. We felt the best way to describe 2020 would be to use our internal words. Think of it as full transparency. If you have a moment, please take a look at the next two pages, which are excerpted from the employee report. The left-hand column is a list of the articles and topics included in the employee publication, and perhaps you might notice the final article was contributed by Bob Kierlin. Even in retirement, Bob continues to give of himself to the organization. The rest of the two pages is my attempt to convey a sense of gratitude and respect for the Blue Team family. Some will choose to remember 2020 for all of its negative events; and yes, there were many. We don’t believe this provides much of a foundation on which to build a future. It is our sincere wish most will choose to focus on the positive events they witnessed, perhaps remembering individual acts of caring for a fellow human or of personal sacrifices made. Good luck in 2021, and thank you for your belief in the Blue Team at Fastenal. DANIEL L. FLORNESS President and Chief Executive Officer TURN THE PAGE TO READ DAN’S MESSAGE TO EMPLOYEES FROM OUR 2020 EMPLOYEE ANNUAL REPORT
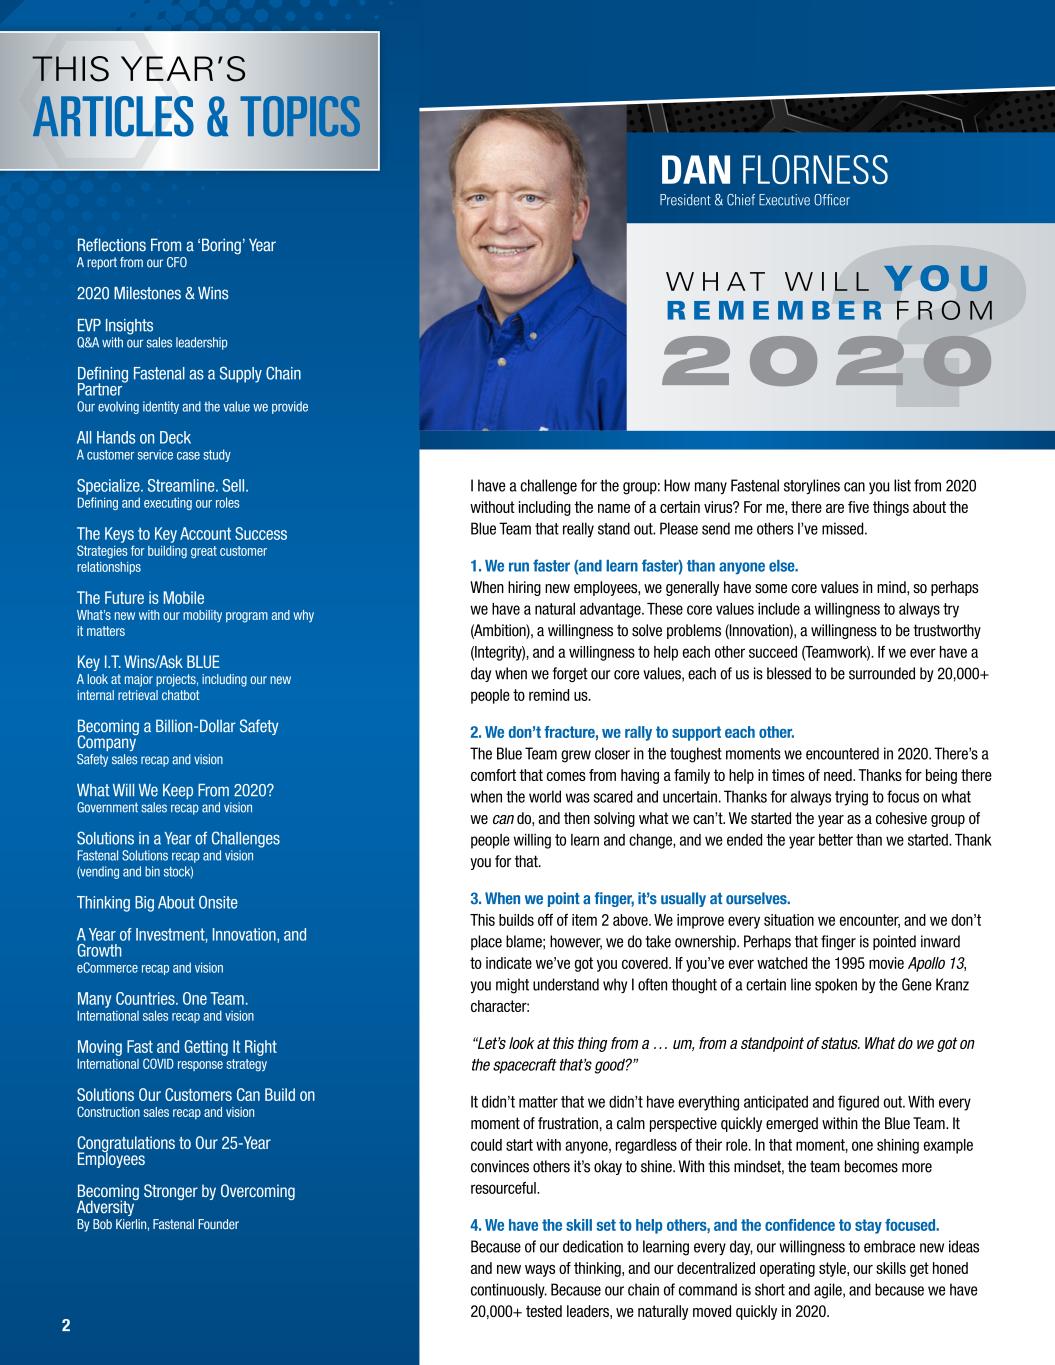
? I have a challenge for the group: How many Fastenal storylines can you list from 2020 without including the name of a certain virus? For me, there are five things about the Blue Team that really stand out. Please send me others I’ve missed. 1. We run faster (and learn faster) than anyone else. When hiring new employees, we generally have some core values in mind, so perhaps we have a natural advantage. These core values include a willingness to always try (Ambition), a willingness to solve problems (Innovation), a willingness to be trustworthy (Integrity), and a willingness to help each other succeed (Teamwork). If we ever have a day when we forget our core values, each of us is blessed to be surrounded by 20,000+ people to remind us. 2. We don’t fracture, we rally to support each other. The Blue Team grew closer in the toughest moments we encountered in 2020. There’s a comfort that comes from having a family to help in times of need. Thanks for being there when the world was scared and uncertain. Thanks for always trying to focus on what we can do, and then solving what we can’t. We started the year as a cohesive group of people willing to learn and change, and we ended the year better than we started. Thank you for that. 3. When we point a finger, it’s usually at ourselves. This builds off of item 2 above. We improve every situation we encounter, and we don’t place blame; however, we do take ownership. Perhaps that finger is pointed inward to indicate we’ve got you covered. If you’ve ever watched the 1995 movie Apollo 13, you might understand why I often thought of a certain line spoken by the Gene Kranz character: “Let’s look at this thing from a … um, from a standpoint of status. What do we got on the spacecraft that’s good?” It didn’t matter that we didn’t have everything anticipated and figured out. With every moment of frustration, a calm perspective quickly emerged within the Blue Team. It could start with anyone, regardless of their role. In that moment, one shining example convinces others it’s okay to shine. With this mindset, the team becomes more resourceful. 4. We have the skill set to help others, and the confidence to stay focused. Because of our dedication to learning every day, our willingness to embrace new ideas and new ways of thinking, and our decentralized operating style, our skills get honed continuously. Because our chain of command is short and agile, and because we have 20,000+ tested leaders, we naturally moved quickly in 2020. 2020 DAN FLORNESS President & Chief Executive Officer REMEMBER W H AT W I L L YOU F R O M Reflections From a ‘Boring’ Year A report from our CFO 2020 Milestones & Wins EVP Insights Q&A with our sales leadership Defining Fastenal as a Supply Chain Partner Our evolving identity and the value we provide All Hands on Deck A customer service case study Specialize. Streamline. Sell. Defining and executing our roles The Keys to Key Account Success Strategies for building great customer relationships The Future is Mobile What’s new with our mobility program and why it matters Key I.T. Wins/Ask BLUE A look at major projects, including our new internal retrieval chatbot Becoming a Billion-Dollar Safety Company Safety sales recap and vision What Will We Keep From 2020? Government sales recap and vision Solutions in a Year of Challenges Fastenal Solutions recap and vision (vending and bin stock) Thinking Big About Onsite A Year of Investment, Innovation, and Growth eCommerce recap and vision Many Countries. One Team. International sales recap and vision Moving Fast and Getting It Right International COVID response strategy Solutions Our Customers Can Build on Construction sales recap and vision Congratulations to Our 25-Year Employees Becoming Stronger by Overcoming Adversity By Bob Kierlin, Fastenal Founder THIS YEAR’S ARTICLES & TOPICS 2
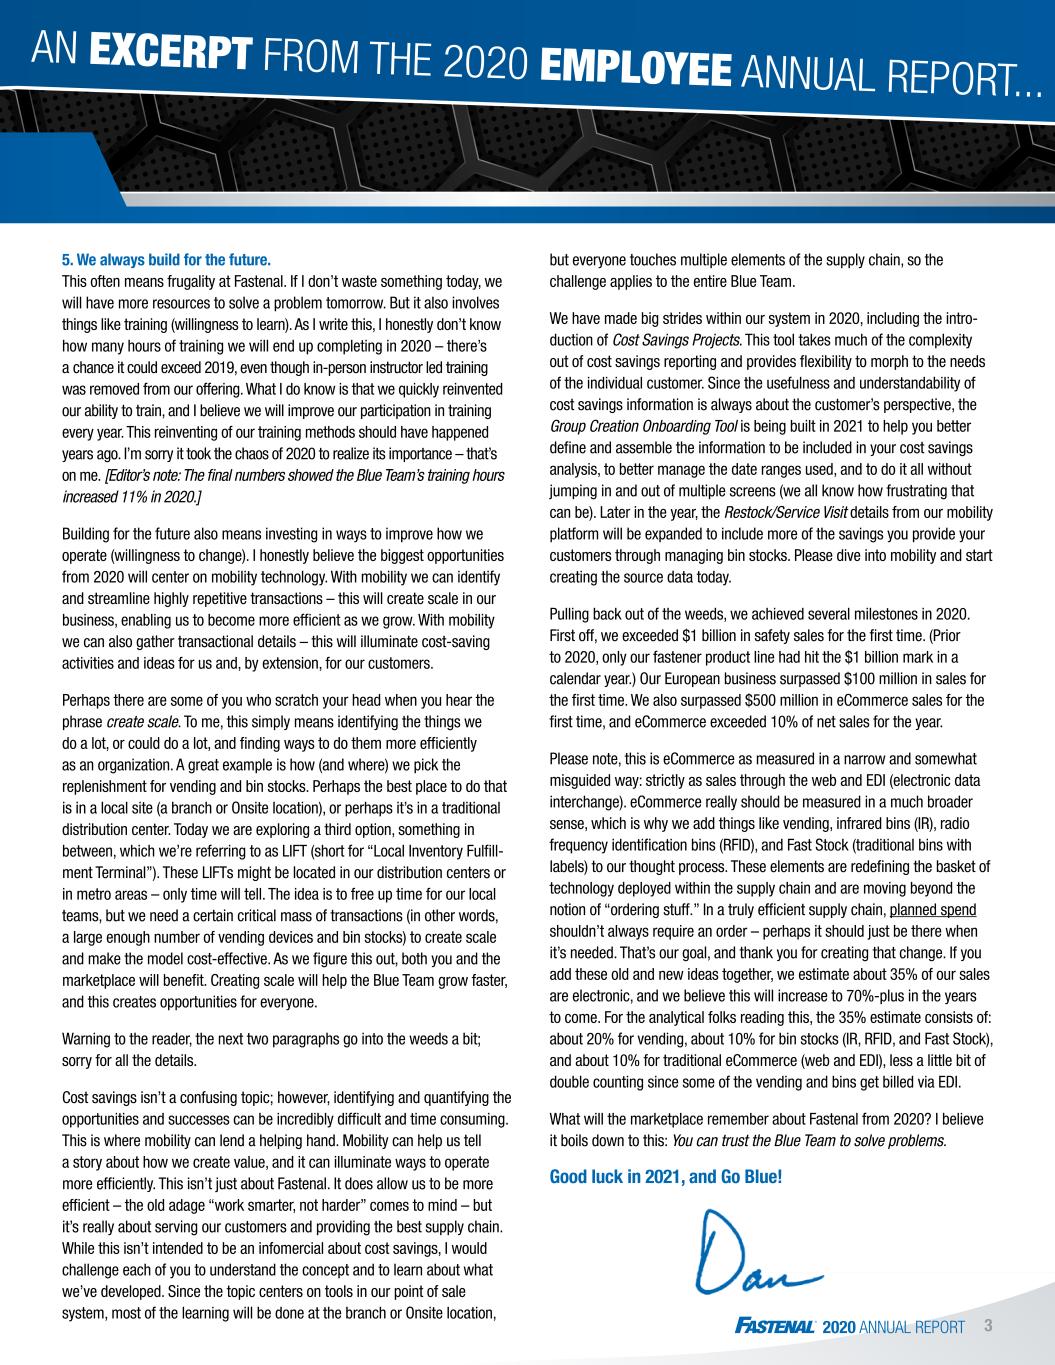
2020 ANNUAL REPORT 3 5. We always build for the future. This often means frugality at Fastenal. If I don’t waste something today, we will have more resources to solve a problem tomorrow. But it also involves things like training (willingness to learn). As I write this, I honestly don’t know how many hours of training we will end up completing in 2020 – there’s a chance it could exceed 2019, even though in-person instructor led training was removed from our offering. What I do know is that we quickly reinvented our ability to train, and I believe we will improve our participation in training every year. This reinventing of our training methods should have happened years ago. I’m sorry it took the chaos of 2020 to realize its importance – that’s on me. [Editor’s note: The final numbers showed the Blue Team’s training hours increased 11% in 2020.] Building for the future also means investing in ways to improve how we operate (willingness to change). I honestly believe the biggest opportunities from 2020 will center on mobility technology. With mobility we can identify and streamline highly repetitive transactions – this will create scale in our business, enabling us to become more efficient as we grow. With mobility we can also gather transactional details – this will illuminate cost-saving activities and ideas for us and, by extension, for our customers. Perhaps there are some of you who scratch your head when you hear the phrase create scale. To me, this simply means identifying the things we do a lot, or could do a lot, and finding ways to do them more efficiently as an organization. A great example is how (and where) we pick the replenishment for vending and bin stocks. Perhaps the best place to do that is in a local site (a branch or Onsite location), or perhaps it’s in a traditional distribution center. Today we are exploring a third option, something in between, which we’re referring to as LIFT (short for “Local Inventory Fulfill- ment Terminal”). These LIFTs might be located in our distribution centers or in metro areas – only time will tell. The idea is to free up time for our local teams, but we need a certain critical mass of transactions (in other words, a large enough number of vending devices and bin stocks) to create scale and make the model cost-effective. As we figure this out, both you and the marketplace will benefit. Creating scale will help the Blue Team grow faster, and this creates opportunities for everyone. Warning to the reader, the next two paragraphs go into the weeds a bit; sorry for all the details. Cost savings isn’t a confusing topic; however, identifying and quantifying the opportunities and successes can be incredibly difficult and time consuming. This is where mobility can lend a helping hand. Mobility can help us tell a story about how we create value, and it can illuminate ways to operate more efficiently. This isn’t just about Fastenal. It does allow us to be more efficient – the old adage “work smarter, not harder” comes to mind – but it’s really about serving our customers and providing the best supply chain. While this isn’t intended to be an infomercial about cost savings, I would challenge each of you to understand the concept and to learn about what we’ve developed. Since the topic centers on tools in our point of sale system, most of the learning will be done at the branch or Onsite location, but everyone touches multiple elements of the supply chain, so the challenge applies to the entire Blue Team. We have made big strides within our system in 2020, including the intro- duction of Cost Savings Projects. This tool takes much of the complexity out of cost savings reporting and provides flexibility to morph to the needs of the individual customer. Since the usefulness and understandability of cost savings information is always about the customer’s perspective, the Group Creation Onboarding Tool is being built in 2021 to help you better define and assemble the information to be included in your cost savings analysis, to better manage the date ranges used, and to do it all without jumping in and out of multiple screens (we all know how frustrating that can be). Later in the year, the Restock/Service Visit details from our mobility platform will be expanded to include more of the savings you provide your customers through managing bin stocks. Please dive into mobility and start creating the source data today. Pulling back out of the weeds, we achieved several milestones in 2020. First off, we exceeded $1 billion in safety sales for the first time. (Prior to 2020, only our fastener product line had hit the $1 billion mark in a calendar year.) Our European business surpassed $100 million in sales for the first time. We also surpassed $500 million in eCommerce sales for the first time, and eCommerce exceeded 10% of net sales for the year. Please note, this is eCommerce as measured in a narrow and somewhat misguided way: strictly as sales through the web and EDI (electronic data interchange). eCommerce really should be measured in a much broader sense, which is why we add things like vending, infrared bins (IR), radio frequency identification bins (RFID), and Fast Stock (traditional bins with labels) to our thought process. These elements are redefining the basket of technology deployed within the supply chain and are moving beyond the notion of “ordering stuff.” In a truly efficient supply chain, planned spend shouldn’t always require an order – perhaps it should just be there when it’s needed. That’s our goal, and thank you for creating that change. If you add these old and new ideas together, we estimate about 35% of our sales are electronic, and we believe this will increase to 70%-plus in the years to come. For the analytical folks reading this, the 35% estimate consists of: about 20% for vending, about 10% for bin stocks (IR, RFID, and Fast Stock), and about 10% for traditional eCommerce (web and EDI), less a little bit of double counting since some of the vending and bins get billed via EDI. What will the marketplace remember about Fastenal from 2020? I believe it boils down to this: You can trust the Blue Team to solve problems. Good luck in 2021, and Go Blue! AN EXCERPT FROM THE 2020 EMPLOYEE ANNUAL REPORT...
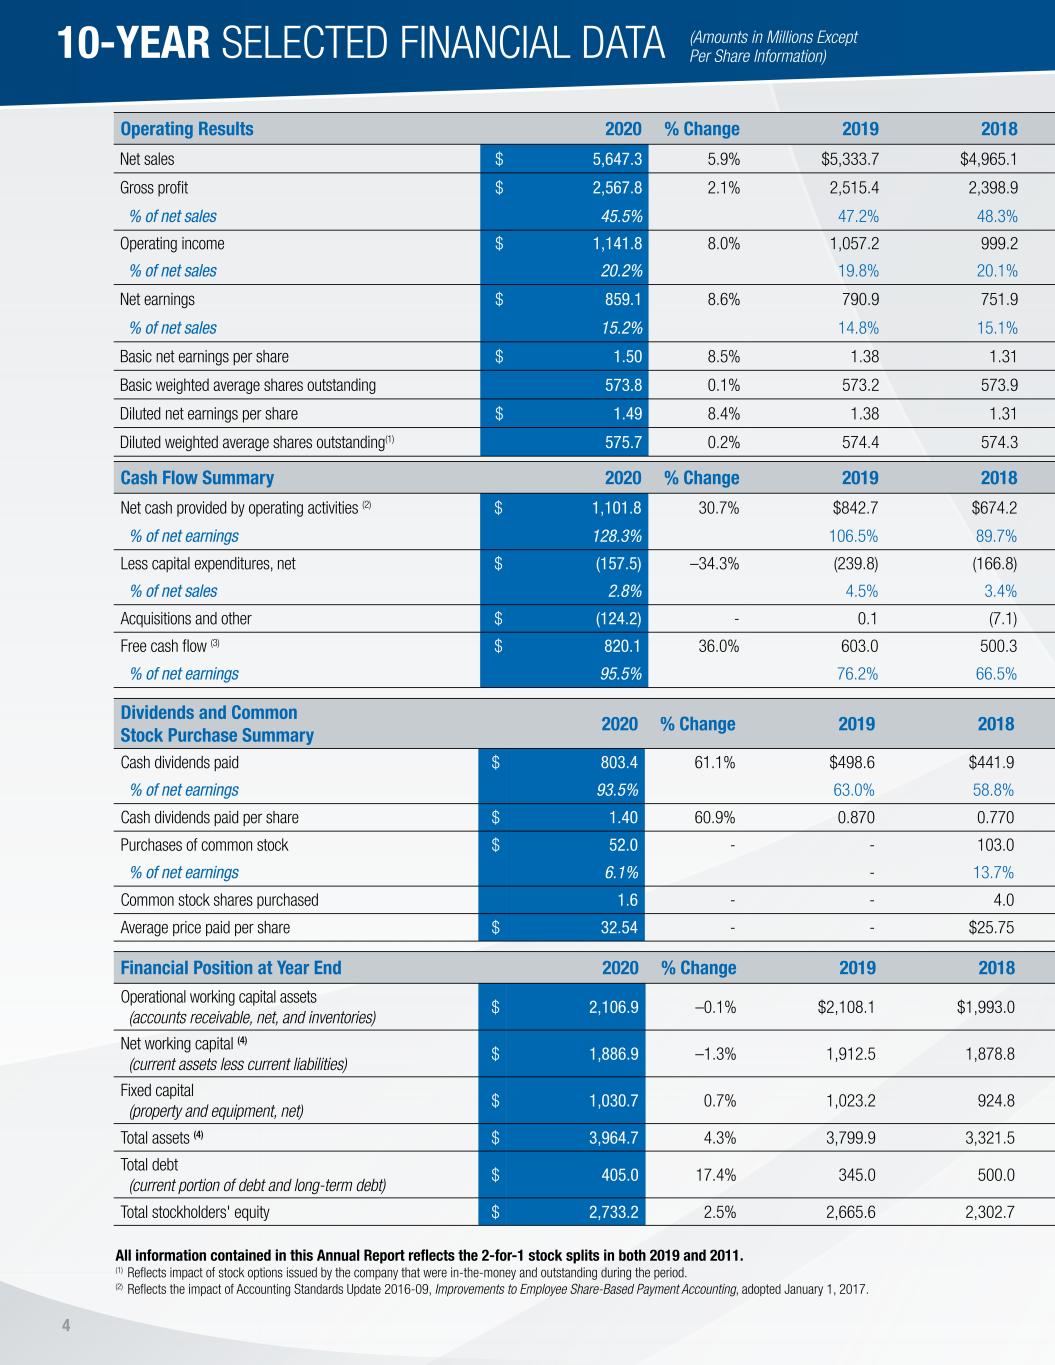
4 Operating Results 2020 % Change 2019 2018 2017 2016 2015 2014 2013 2012 2011 Net sales $ 5,647.3 5.9% $5,333.7 $4,965.1 $4,390.5 $3,962.0 $3,869.2 $3,733.5 $3,326.1 $3,133.6 $2,766.9 Gross profit $ 2,567.8 2.1% 2,515.4 2,398.9 2,163.6 1,964.8 1,948.9 1,897.4 1,719.4 1,614.5 1,434.2 % of net sales 45.5% 47.2% 48.3% 49.3% 49.6% 50.4% 50.8% 51.7% 51.5% 51.8% Operating income $ 1,141.8 8.0% 1,057.2 999.2 881.8 795.8 828.8 787.6 712.7 673.7 574.6 % of net sales 20.2% 19.8% 20.1% 20.1% 20.1% 21.4% 21.1% 21.4% 21.5% 20.8% Net earnings $ 859.1 8.6% 790.9 751.9 578.6 499.4 516.4 494.2 448.6 420.5 357.9 % of net sales 15.2% 14.8% 15.1% 13.2% 12.6% 13.3% 13.2% 13.5% 13.4% 12.9% Basic net earnings per share $ 1.50 8.5% 1.38 1.31 1.00 0.86 0.89 0.83 0.76 0.71 0.61 Basic weighted average shares outstanding 573.8 0.1% 573.2 573.9 576.4 577.9 582.9 593.0 593.5 592.2 590.1 Diluted net earnings per share $ 1.49 8.4% 1.38 1.31 1.00 0.86 0.88 0.83 0.75 0.71 0.60 Diluted weighted average shares outstanding(1) 575.7 0.2% 574.4 574.3 576.7 578.3 584.1 594.6 595.4 594.3 591.7 Dividends and Common Stock Purchase Summary 2020 % Change 2019 2018 2017 2016 2015 2014 2013 2012 2011 Cash dividends paid $ 803.4 61.1% $498.6 $441.9 $369.1 $346.6 $327.1 $296.6 $237.5 $367.3 $191.7 % of net earnings 93.5% 63.0% 58.8% 63.8% 69.4% 63.3% 60.0% 52.9% 87.3% 53.6% Cash dividends paid per share $ 1.40 60.9% 0.870 0.770 0.640 0.600 0.560 0.500 0.400 0.620 0.325 Purchases of common stock $ 52.0 - - 103.0 82.6 59.5 292.9 52.9 9.1 - - % of net earnings 6.1% - 13.7% 14.3% 11.9% 56.7% 10.7% 2.0% - - Common stock shares purchased 1.6 - - 4.0 3.8 3.2 14.2 2.4 0.4 - - Average price paid per share $ 32.54 - - $25.75 $21.72 $18.58 $20.63 $22.06 $22.70 - - Financial Position at Year End 2020 % Change 2019 2018 2017 2016 2015 2014 2013 2012 2011 Operational working capital assets (accounts receivable, net, and inventories) $ 2,106.9 –0.1% $2,108.1 $1,993.0 $1,700.7 $1,492.7 $1,381.6 $1,331.3 $1,198.4 $1,087.5 $984.7 Net working capital (4) (current assets less current liabilities) $ 1,886.9 –1.3% 1,912.5 1,878.8 1,584.8 1,445.1 1,291.6 1,207.9 1,168.6 1,082.5 1,048.3 Fixed capital (property and equipment, net) $ 1,030.7 0.7% 1,023.2 924.8 893.6 899.7 818.9 763.9 654.9 516.4 435.6 Total assets (4) $ 3,964.7 4.3% 3,799.9 3,321.5 2,910.5 2,668.9 2,532.5 2,359.1 2,075.8 1,815.8 1,684.9 Total debt (current portion of debt and long-term debt) $ 405.0 17.4% 345.0 500.0 415.0 390.0 365.0 90.0 - - - Total stockholders' equity $ 2,733.2 2.5% 2,665.6 2,302.7 2,096.9 1,933.1 1,801.3 1,915.2 1,772.7 1,560.4 1,459.0 Cash Flow Summary 2020 % Change 2019 2018 2017 2016 2015 2014 2013 2012 2011 Net cash provided by operating activities (2) $ 1,101.8 30.7% $842.7 $674.2 $585.2 $519.9 $550.3 $501.5 $418.9 $406.4 $268.5 % of net earnings 128.3% 106.5% 89.7% 101.1% 104.1% 106.6% 101.5% 93.4% 96.6% 75.0% Less capital expenditures, net $ (157.5) –34.3% (239.8) (166.8) (112.5) (183.0) (145.3) (183.7) (201.6) (133.9) (116.5) % of net sales 2.8% 4.5% 3.4% 2.6% 4.6% 3.8% 4.9% 6.1% 4.3% 4.2% Acquisitions and other $ (124.2) - 0.1 (7.1) (66.8) (5.1) (35.3) (5.6) (0.1) (0.1) 0.2 Free cash flow (3) $ 820.1 36.0% 603.0 500.3 405.9 331.8 369.7 312.2 217.2 272.4 152.2 % of net earnings 95.5% 76.2% 66.5% 70.2% 66.4% 71.6% 63.2% 48.4% 64.8% 42.5% All information contained in this Annual Report reflects the 2-for-1 stock splits in both 2019 and 2011. (1) Reflects impact of stock options issued by the company that were in-the-money and outstanding during the period. (2) Reflects the impact of Accounting Standards Update 2016-09, Improvements to Employee Share-Based Payment Accounting, adopted January 1, 2017. 10-YEAR SELECTED FINANCIAL DATA (Amounts in Millions ExceptPer Share Information)
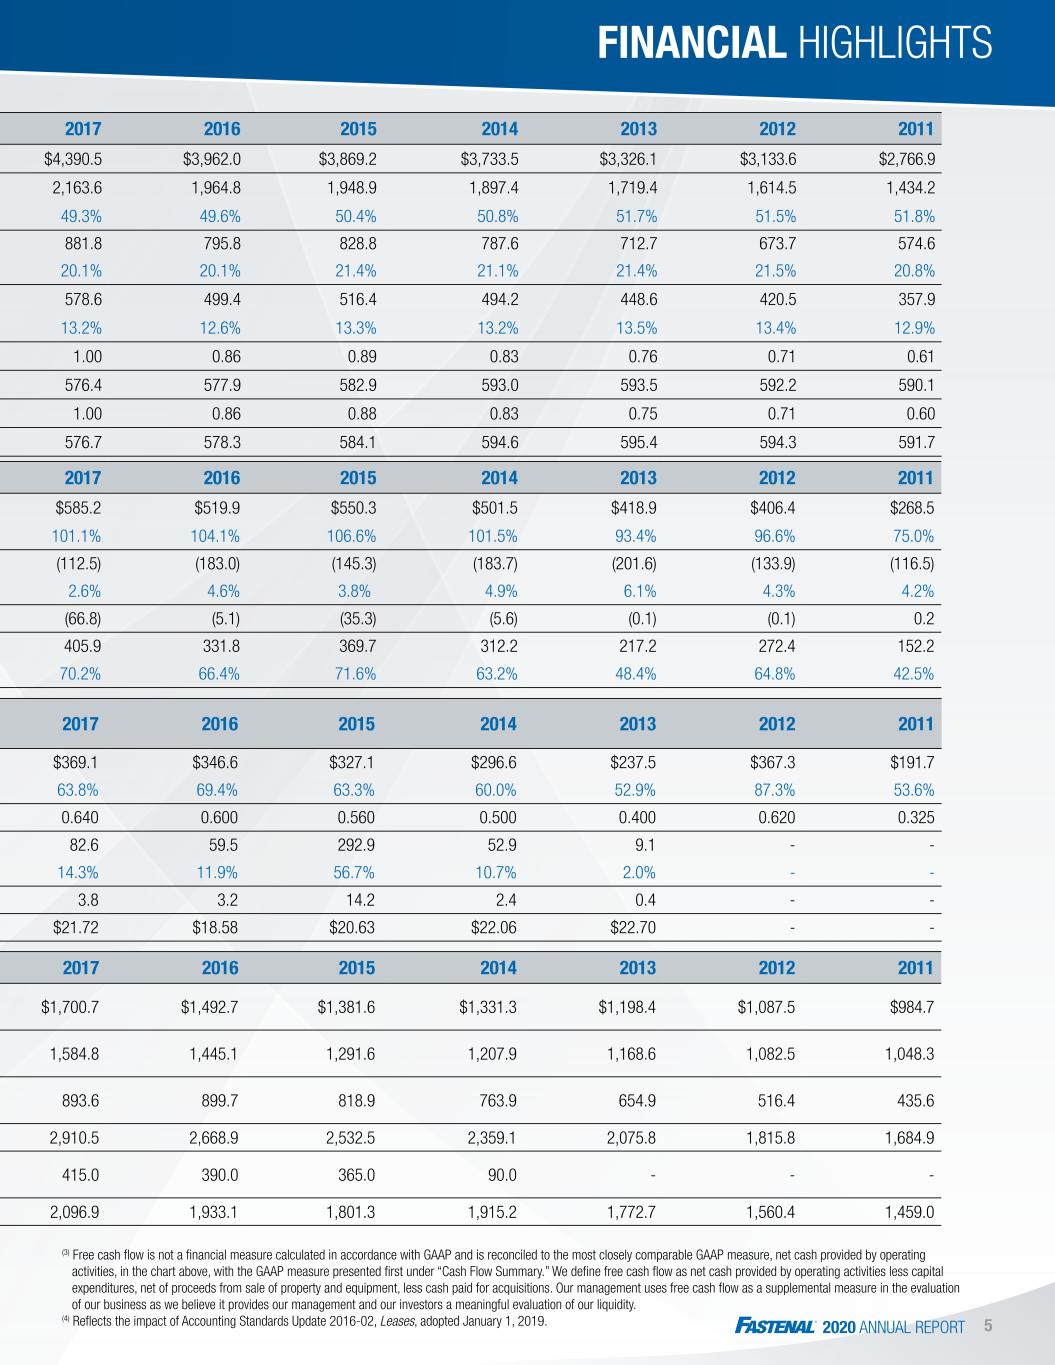
2020 ANNUAL REPORT 5 Operating Results 2020 % Change 2019 2018 2017 2016 2015 2014 2013 2012 2011 Net sales $ 5,647.3 5.9% $5,333.7 $4,965.1 $4,390.5 $3,962.0 $3,869.2 $3,733.5 $3,326.1 $3,133.6 $2,766.9 Gross profit $ 2,567.8 2.1% 2,515.4 2,398.9 2,163.6 1,964.8 1,948.9 1,897.4 1,719.4 1,614.5 1,434.2 % of net sales 45.5% 47.2% 48.3% 49.3% 49.6% 50.4% 50.8% 51.7% 51.5% 51.8% Operating income $ 1,141.8 8.0% 1,057.2 999.2 881.8 795.8 828.8 787.6 712.7 673.7 574.6 % of net sales 20.2% 19.8% 20.1% 20.1% 20.1% 21.4% 21.1% 21.4% 21.5% 20.8% Net earnings $ 859.1 8.6% 790.9 751.9 578.6 499.4 516.4 494.2 448.6 420.5 357.9 % of net sales 15.2% 14.8% 15.1% 13.2% 12.6% 13.3% 13.2% 13.5% 13.4% 12.9% Basic net earnings per share $ 1.50 8.5% 1.38 1.31 1.00 0.86 0.89 0.83 0.76 0.71 0.61 Basic weighted average shares outstanding 573.8 0.1% 573.2 573.9 576.4 577.9 582.9 593.0 593.5 592.2 590.1 Diluted net earnings per share $ 1.49 8.4% 1.38 1.31 1.00 0.86 0.88 0.83 0.75 0.71 0.60 Diluted weighted average shares outstanding(1) 575.7 0.2% 574.4 574.3 576.7 578.3 584.1 594.6 595.4 594.3 591.7 Dividends and Common Stock Purchase Summary 2020 % Change 2019 2018 2017 2016 2015 2014 2013 2012 2011 Cash dividends paid $ 803.4 61.1% $498.6 $441.9 $369.1 $346.6 $327.1 $296.6 $237.5 $367.3 $191.7 % of net earnings 93.5% 63.0% 58.8% 63.8% 69.4% 63.3% 60.0% 52.9% 87.3% 53.6% Cash dividends paid per share $ 1.40 60.9% 0.870 0.770 0.640 0.600 0.560 0.500 0.400 0.620 0.325 Purchases of common stock $ 52.0 - - 103.0 82.6 59.5 292.9 52.9 9.1 - - % of net earnings 6.1% - 13.7% 14.3% 11.9% 56.7% 10.7% 2.0% - - Common stock shares purchased 1.6 - - 4.0 3.8 3.2 14.2 2.4 0.4 - - Average price paid per share $ 32.54 - - $25.75 $21.72 $18.58 $20.63 $22.06 $22.70 - - Financial Position at Year End 2020 % Change 2019 2018 2017 2016 2015 2014 2013 2012 2011 Operational working capital assets (accounts receivable, net, and inventories) $ 2,106.9 –0.1% $2,108.1 $1,993.0 $1,700.7 $1,492.7 $1,381.6 $1,331.3 $1,198.4 $1,087.5 $984.7 Net working capital (4) (current assets less current liabilities) $ 1,886.9 –1.3% 1,912.5 1,878.8 1,584.8 1,445.1 1,291.6 1,207.9 1,168.6 1,082.5 1,048.3 Fixed capital (property and equipment, net) $ 1,030.7 0.7% 1,023.2 924.8 893.6 899.7 818.9 763.9 654.9 516.4 435.6 Total assets (4) $ 3,964.7 4.3% 3,799.9 3,321.5 2,910.5 2,668.9 2,532.5 2,359.1 2,075.8 1,815.8 1,684.9 Total debt (current portion of debt and long-term debt) $ 405.0 17.4% 345.0 500.0 415.0 390.0 365.0 90.0 - - - Total stockholders' equity $ 2,733.2 2.5% 2,665.6 2,302.7 2,096.9 1,933.1 1,801.3 1,915.2 1,772.7 1,560.4 1,459.0 Cash Flow Summary 2020 % Change 2019 2018 2017 2016 2015 2014 2013 2012 2011 Net cash provided by operating activities (2) $ 1,101.8 30.7% $842.7 $674.2 $585.2 $519.9 $550.3 $501.5 $418.9 $406.4 $268.5 % of net earnings 128.3% 106.5% 89.7% 101.1% 104.1% 106.6% 101.5% 93.4% 96.6% 75.0% Less capital expenditures, net $ (157.5) –34.3% (239.8) (166.8) (112.5) (183.0) (145.3) (183.7) (201.6) (133.9) (116.5) % of net sales 2.8% 4.5% 3.4% 2.6% 4.6% 3.8% 4.9% 6.1% 4.3% 4.2% Acquisitions and other $ (124.2) - 0.1 (7.1) (66.8) (5.1) (35.3) (5.6) (0.1) (0.1) 0.2 Free cash flow (3) $ 820.1 36.0% 603.0 500.3 405.9 331.8 369.7 312.2 217.2 272.4 152.2 % of net earnings 95.5% 76.2% 66.5% 70.2% 66.4% 71.6% 63.2% 48.4% 64.8% 42.5% FINANCIAL HIGHLIGHTS (3) Free cash flow is not a financial measure calculated in accordance with GAAP and is reconciled to the most closely comparable GAAP measure, net cash provided by operating activities, in the chart above, with the GAAP measure presented first under “Cash Flow Summary.” We define free cash flow as net cash provided by operating activities less capital expenditures, net of proceeds from sale of property and equipment, less cash paid for acquisitions. Our management uses free cash flow as a supplemental measure in the evaluation of our business as we believe it provides our management and our investors a meaningful evaluation of our liquidity. (4) Reflects the impact of Accounting Standards Update 2016-02, Leases, adopted January 1, 2019.
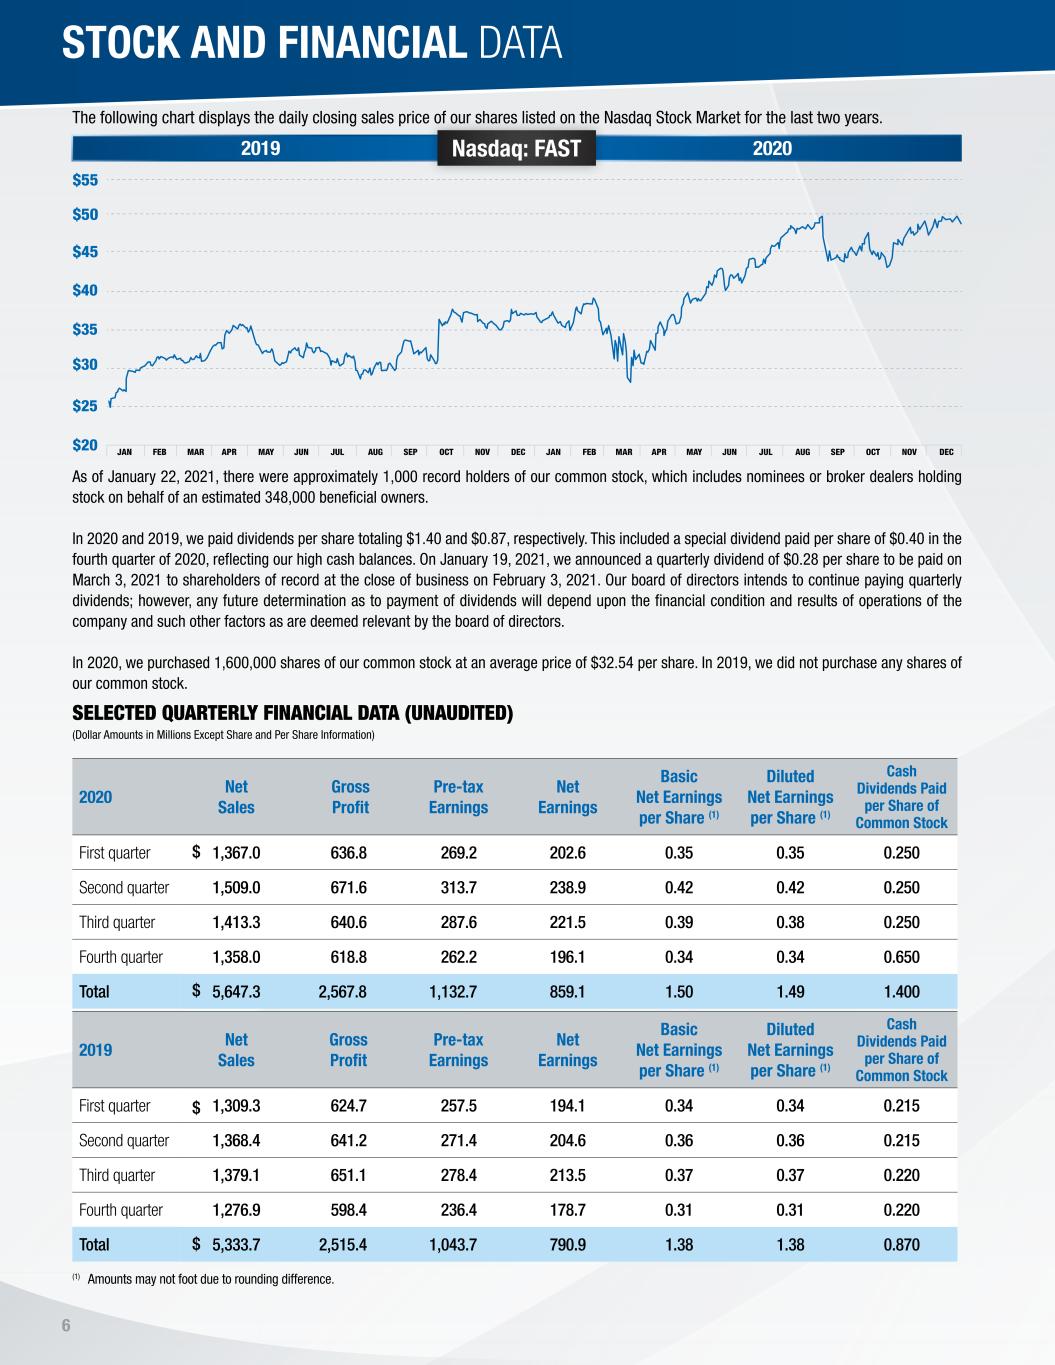
6 As of January 22, 2021, there were approximately 1,000 record holders of our common stock, which includes nominees or broker dealers holding stock on behalf of an estimated 348,000 beneficial owners. In 2020 and 2019, we paid dividends per share totaling $1.40 and $0.87, respectively. This included a special dividend paid per share of $0.40 in the fourth quarter of 2020, reflecting our high cash balances. On January 19, 2021, we announced a quarterly dividend of $0.28 per share to be paid on March 3, 2021 to shareholders of record at the close of business on February 3, 2021. Our board of directors intends to continue paying quarterly dividends; however, any future determination as to payment of dividends will depend upon the financial condition and results of operations of the company and such other factors as are deemed relevant by the board of directors. In 2020, we purchased 1,600,000 shares of our common stock at an average price of $32.54 per share. In 2019, we did not purchase any shares of our common stock. SELECTED QUARTERLY FINANCIAL DATA (UNAUDITED) (Dollar Amounts in Millions Except Share and Per Share Information) The following chart displays the daily closing sales price of our shares listed on the Nasdaq Stock Market for the last two years. (1) Amounts may not foot due to rounding difference. $45 $50 $55 2019 Nasdaq: FAST 2020 $ $ $ 2020 Net Sales Gross Profit Pre-tax Earnings Net Earnings Basic Net Earnings per Share (1) Diluted Net Earnings per Share (1) Cash Dividends Paid per Share of Common Stock First quarter 1,367.0 636.8 269.2 202.6 0.35 0.35 0.250 Second quarter 1,509.0 671.6 313.7 238.9 0.42 0.42 0.250 Third quarter 1,413.3 640.6 287.6 221.5 0.39 0.38 0.250 Fourth quarter 1,358.0 618.8 262.2 196.1 0.34 0.34 0.650 Total 5,647.3 2,567.8 1,132.7 859.1 1.50 1.49 1.400 2019 Net Sales Gross Profit Pre-tax Earnings Net Earnings Basic Net Earnings per Share (1) Diluted Net Earnings per Share (1) Cash Dividends Paid per Share of Common Stock First quarter 1,309.3 624.7 257.5 194.1 0.34 0.34 0.215 Second quarter 1,368.4 641.2 271.4 204.6 0.36 0.36 0.215 Third quarter 1,379.1 651.1 278.4 213.5 0.37 0.37 0.220 Fourth quarter 1,276.9 598.4 236.4 178.7 0.31 0.31 0.220 Total 5,333.7 2,515.4 1,043.7 790.9 1.38 1.38 0.870 $ $ STOCK AND FINANCIAL DATA
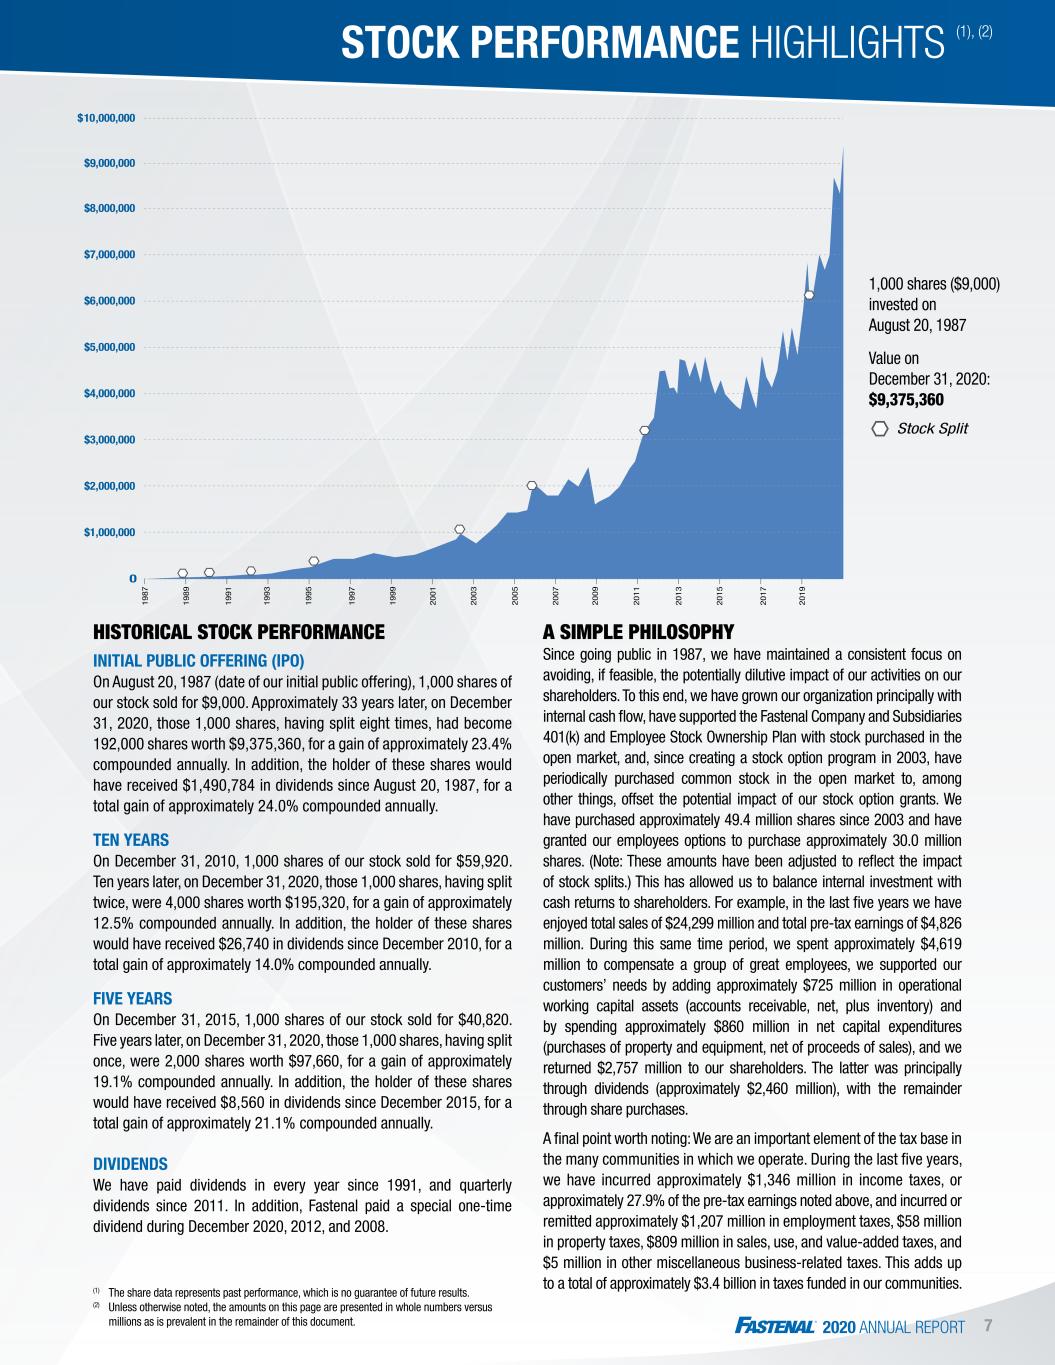
2020 ANNUAL REPORT 7 (1) The share data represents past performance, which is no guarantee of future results. (2) Unless otherwise noted, the amounts on this page are presented in whole numbers versus millions as is prevalent in the remainder of this document. HISTORICAL STOCK PERFORMANCE INITIAL PUBLIC OFFERING (IPO) On August 20, 1987 (date of our initial public offering), 1,000 shares of our stock sold for $9,000. Approximately 33 years later, on December 31, 2020, those 1,000 shares, having split eight times, had become 192,000 shares worth $9,375,360, for a gain of approximately 23.4% compounded annually. In addition, the holder of these shares would have received $1,490,784 in dividends since August 20, 1987, for a total gain of approximately 24.0% compounded annually. TEN YEARS On December 31, 2010, 1,000 shares of our stock sold for $59,920. Ten years later, on December 31, 2020, those 1,000 shares, having split twice, were 4,000 shares worth $195,320, for a gain of approximately 12.5% compounded annually. In addition, the holder of these shares would have received $26,740 in dividends since December 2010, for a total gain of approximately 14.0% compounded annually. FIVE YEARS On December 31, 2015, 1,000 shares of our stock sold for $40,820. Five years later, on December 31, 2020, those 1,000 shares, having split once, were 2,000 shares worth $97,660, for a gain of approximately 19.1% compounded annually. In addition, the holder of these shares would have received $8,560 in dividends since December 2015, for a total gain of approximately 21.1% compounded annually. DIVIDENDS We have paid dividends in every year since 1991, and quarterly dividends since 2011. In addition, Fastenal paid a special one-time dividend during December 2020, 2012, and 2008. A SIMPLE PHILOSOPHY Since going public in 1987, we have maintained a consistent focus on avoiding, if feasible, the potentially dilutive impact of our activities on our shareholders. To this end, we have grown our organization principally with internal cash flow, have supported the Fastenal Company and Subsidiaries 401(k) and Employee Stock Ownership Plan with stock purchased in the open market, and, since creating a stock option program in 2003, have periodically purchased common stock in the open market to, among other things, offset the potential impact of our stock option grants. We have purchased approximately 49.4 million shares since 2003 and have granted our employees options to purchase approximately 30.0 million shares. (Note: These amounts have been adjusted to reflect the impact of stock splits.) This has allowed us to balance internal investment with cash returns to shareholders. For example, in the last five years we have enjoyed total sales of $24,299 million and total pre-tax earnings of $4,826 million. During this same time period, we spent approximately $4,619 million to compensate a group of great employees, we supported our customers’ needs by adding approximately $725 million in operational working capital assets (accounts receivable, net, plus inventory) and by spending approximately $860 million in net capital expenditures (purchases of property and equipment, net of proceeds of sales), and we returned $2,757 million to our shareholders. The latter was principally through dividends (approximately $2,460 million), with the remainder through share purchases. A final point worth noting: We are an important element of the tax base in the many communities in which we operate. During the last five years, we have incurred approximately $1,346 million in income taxes, or approximately 27.9% of the pre-tax earnings noted above, and incurred or remitted approximately $1,207 million in employment taxes, $58 million in property taxes, $809 million in sales, use, and value-added taxes, and $5 million in other miscellaneous business-related taxes. This adds up to a total of approximately $3.4 billion in taxes funded in our communities. 9 1,000 shares ($9,000) invested on August 20, 1987 Value on December 31, 2020: $9,375,360 Stock Split STOCK PERFORMANCE HIGHLIGHTS (1), (2)
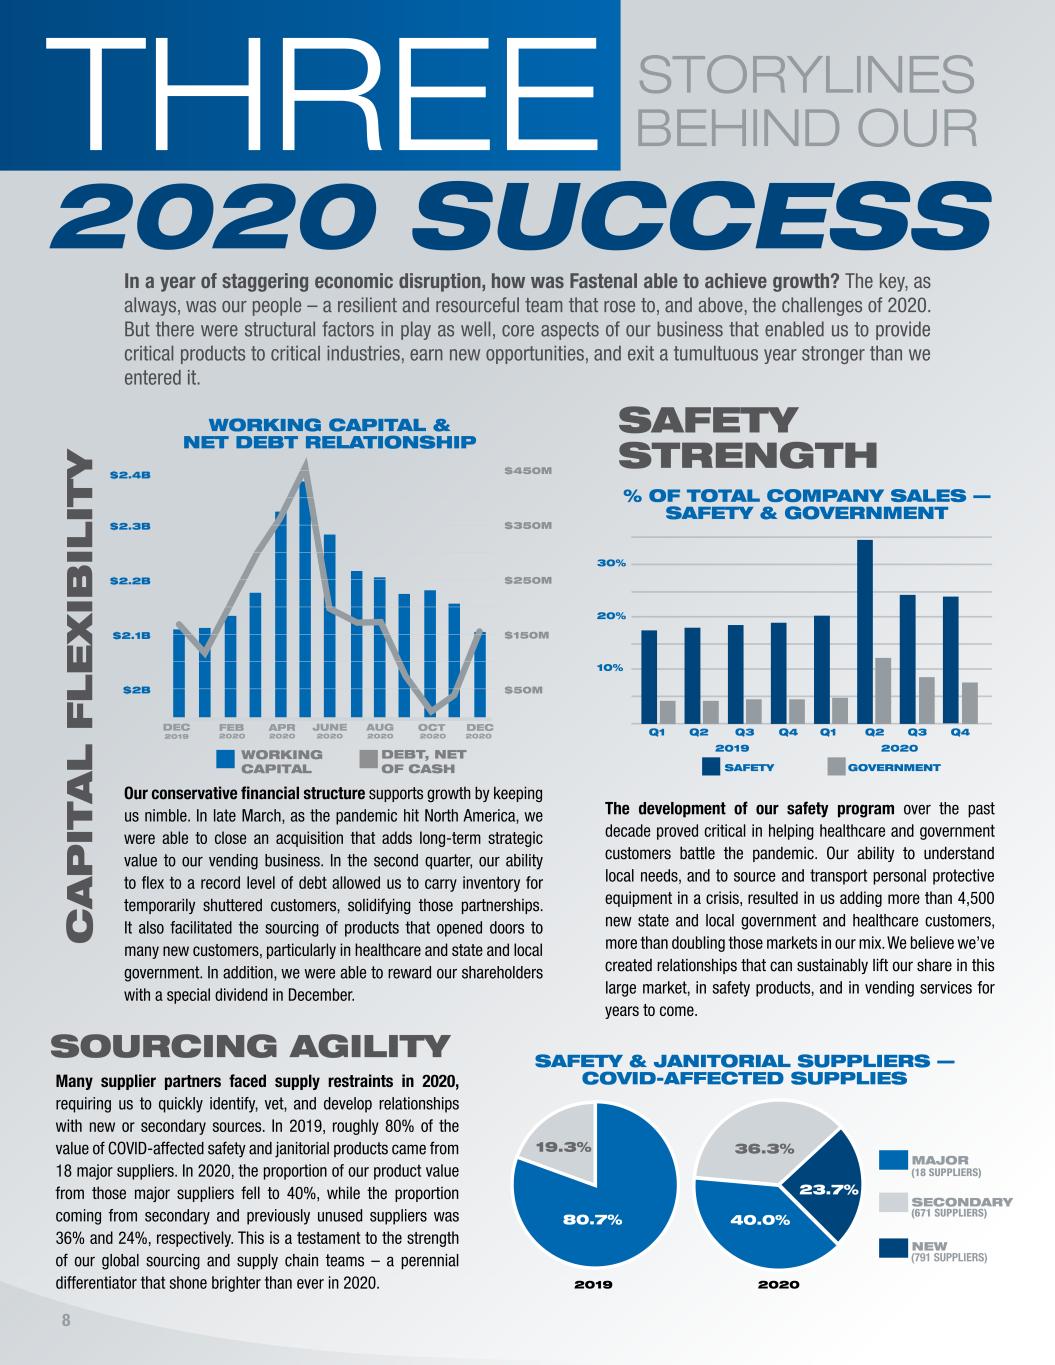
THREE 2020 SUCCESS In a year of staggering economic disruption, how was Fastenal able to achieve growth? The key, as always, was our people – a resilient and resourceful team that rose to, and above, the challenges of 2020. But there were structural factors in play as well, core aspects of our business that enabled us to provide critical products to critical industries, earn new opportunities, and exit a tumultuous year stronger than we entered it. C A P IT A L F L E X IB IL IT Y SOURCING AGILITY Our conservative financial structure supports growth by keeping us nimble. In late March, as the pandemic hit North America, we were able to close an acquisition that adds long-term strategic value to our vending business. In the second quarter, our ability to flex to a record level of debt allowed us to carry inventory for temporarily shuttered customers, solidifying those partnerships. It also facilitated the sourcing of products that opened doors to many new customers, particularly in healthcare and state and local government. In addition, we were able to reward our shareholders with a special dividend in December. Many supplier partners faced supply restraints in 2020, requiring us to quickly identify, vet, and develop relationships with new or secondary sources. In 2019, roughly 80% of the value of COVID-affected safety and janitorial products came from 18 major suppliers. In 2020, the proportion of our product value from those major suppliers fell to 40%, while the proportion coming from secondary and previously unused suppliers was 36% and 24%, respectively. This is a testament to the strength of our global sourcing and supply chain teams – a perennial differentiator that shone brighter than ever in 2020. 8 STORYLINES BEHIND OUR WORKING CAPITAL SAFETY STRENGTH The development of our safety program over the past decade proved critical in helping healthcare and government customers battle the pandemic. Our ability to understand local needs, and to source and transport personal protective equipment in a crisis, resulted in us adding more than 4,500 new state and local government and healthcare customers, more than doubling those markets in our mix. We believe we’ve created relationships that can sustainably lift our share in this large market, in safety products, and in vending services for years to come. 10% 20% 30% Q1 Q2 Q3 Q4 Q4Q1 Q2 Q3 2019 2020 SAFETY GOVERNMENT (671 SUPPLIERS) (18 SUPPLIERS) 2019 2020 SAFETY & JANITORIAL SUPPLIERS — COVID-AFFECTED SUPPLIES % OF TOTAL COMPANY SALES — SAFETY & GOVERNMENT WORKING CAPITAL & NET DEBT RELATIONSHIP DEC 2019 APR 2020 JUNE 2020 2020 2020 2020 AUGFEB 2020 OCT DEC $2B $2.1B $2.2B $2.3B $2.4B $50M $150M $250M $350M $450M 40.0%80.7% 23.7% 36.3% DEBT, NET OF CASH MAJOR SECONDARY NEW 19.3% (791 SUPPLIERS)
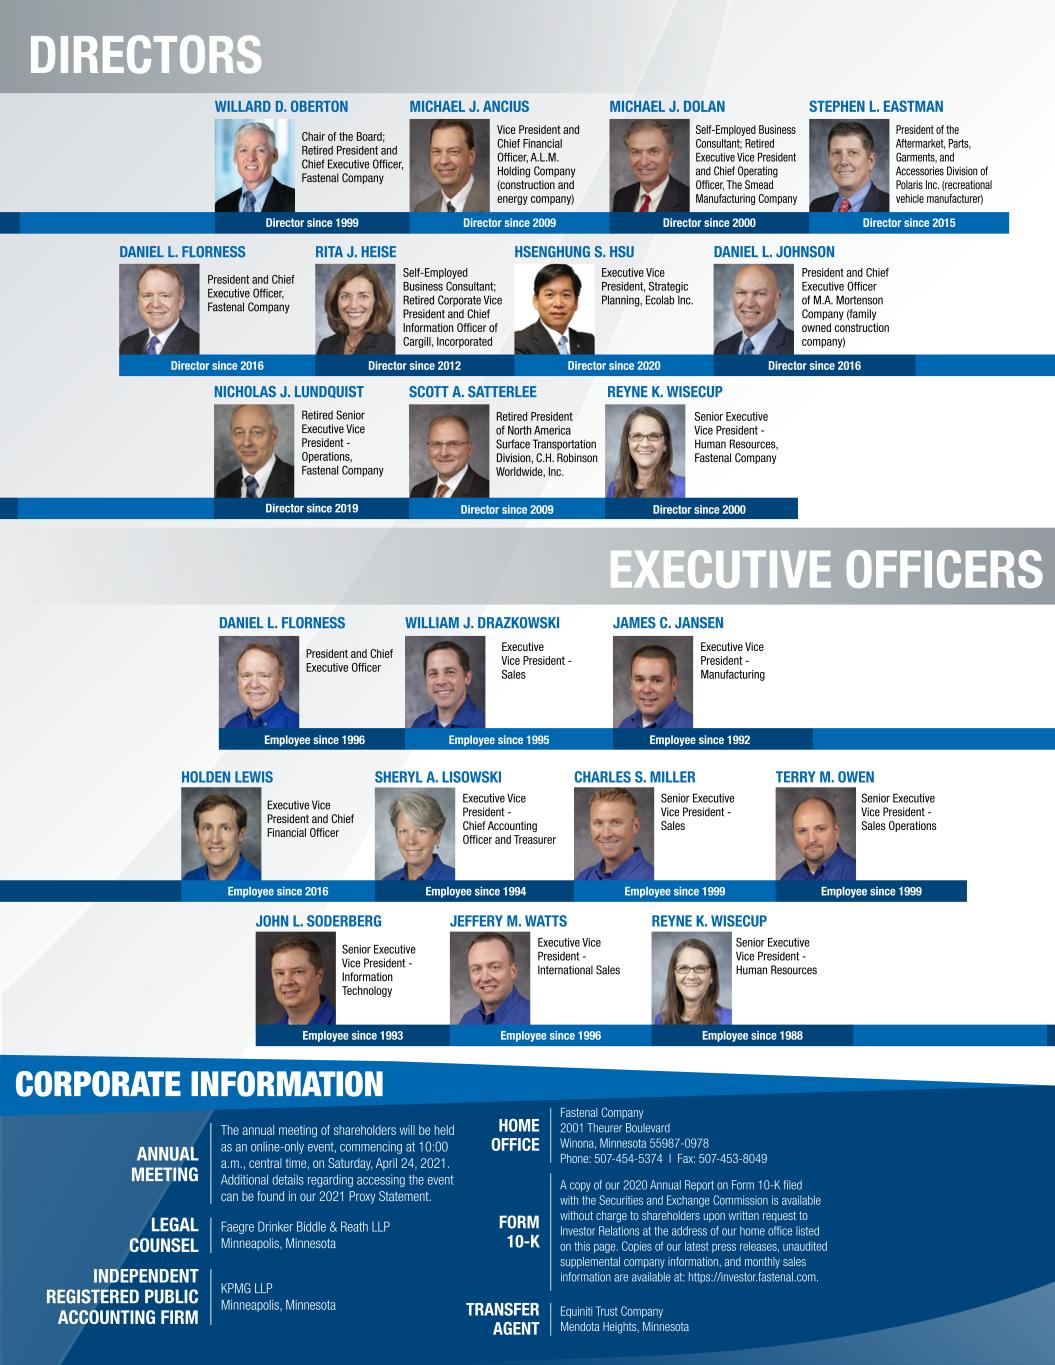
DIRECTORS EXECUTIVE OFFICERS CORPORATE INFORMATION TRANSFER AGENT Equiniti Trust Company Mendota Heights, Minnesota FORM 10-K A copy of our 2020 Annual Report on Form 10-K filed with the Securities and Exchange Commission is available without charge to shareholders upon written request to Investor Relations at the address of our home office listed on this page. Copies of our latest press releases, unaudited supplemental company information, and monthly sales information are available at: https://investor.fastenal.com. HOME OFFICE Fastenal Company 2001 Theurer Boulevard Winona, Minnesota 55987-0978 Phone: 507-454-5374 I Fax: 507-453-8049 INDEPENDENT REGISTERED PUBLIC ACCOUNTING FIRM KPMG LLP Minneapolis, Minnesota ANNUAL MEETING The annual meeting of shareholders will be held as an online-only event, commencing at 10:00 a.m., central time, on Saturday, April 24, 2021. Additional details regarding accessing the event can be found in our 2021 Proxy Statement. LEGAL COUNSEL Faegre Drinker Biddle & Reath LLP Minneapolis, Minnesota Chair of the Board; Retired President and Chief Executive Officer, Fastenal Company President and Chief Executive Officer Executive Vice President and Chief Financial Officer Senior Executive Vice President - Information Technology President and Chief Executive Officer, Fastenal Company Vice President and Chief Financial Officer, A.L.M. Holding Company (construction and energy company) Executive Vice President - Sales Executive Vice President - Chief Accounting Officer and Treasurer Executive Vice President - International Sales Self-Employed Business Consultant; Retired Corporate Vice President and Chief Information Officer of Cargill, Incorporated Retired President of North America Surface Transportation Division, C.H. Robinson Worldwide, Inc. Self-Employed Business Consultant; Retired Executive Vice President and Chief Operating Officer, The Smead Manufacturing Company Senior Executive Vice President - Sales Senior Executive Vice President - Human Resources Executive Vice President, Strategic Planning, Ecolab Inc. Senior Executive Vice President - Human Resources, Fastenal Company President of the Aftermarket, Parts, Garments, and Accessories Division of Polaris Inc. (recreational vehicle manufacturer) Executive Vice President - Manufacturing Senior Executive Vice President - Sales Operations President and Chief Executive Officer of M.A. Mortenson Company (family owned construction company) Retired Senior Executive Vice President - Operations, Fastenal Company Director since 1999 Employee since 1996 Employee since 2016 Employee since 1993 Director since 2016 Director since 2009 Employee since 1995 Employee since 1994 Employee since 1996 Director since 2012 Director since 2009 Director since 2000 Employee since 1999 Employee since 1988 Director since 2020 Director since 2000 Director since 2015 Employee since 1992 Employee since 1999 Director since 2016 Director since 2019 WILLARD D. OBERTON DANIEL L. FLORNESS HOLDEN LEWIS JOHN L. SODERBERG DANIEL L. FLORNESS MICHAEL J. ANCIUS WILLIAM J. DRAZKOWSKI SHERYL A. LISOWSKI JEFFERY M. WATTS RITA J. HEISE SCOTT A. SATTERLEE MICHAEL J. DOLAN CHARLES S. MILLER REYNE K. WISECUP HSENGHUNG S. HSU REYNE K. WISECUP STEPHEN L. EASTMAN JAMES C. JANSEN TERRY M. OWEN DANIEL L. JOHNSON NICHOLAS J. LUNDQUIST
2 0 2 0 A N N U A L R E P O R T 2020 AN N U AL R EPO RT 9706786 | SC | 2.21 | Printed in the USA
