Attached files
| file | filename |
|---|---|
| EX-99.1 - EX-99.1 - Cardiovascular Systems Inc | exhibit991-q221.htm |
| 8-K - 8-K - Cardiovascular Systems Inc | csii-20210203.htm |

©2020 Cardiovascular Systems, Inc. All Rights Reserved. Q2 FY21 Earnings Supplement February 3, 2021

Safe Harbor This presentation contains forward-looking statements within the meaning of the Private Securities Litigation Report Act of 1995, which are provided under the protection of the safe harbor for forward-looking statements provided by that Act. For example, statements in this presentation regarding CSI’s strategy; growth; future financial measurements and investments; product development plans, milestones and introductions; geographic expansion; clinical trials and evidence; professional education efforts; market estimates and opportunities; and developments related to the COVID-19 pandemic are forward-looking statements. These statements involve risks and uncertainties that could cause results differ materially from those projected, including, but not limited to, those described in CSI’s filings with the Securities and Exchange Commission, including its most recent annual report on Form 10-K and subsequent quarterly and annual reports. CSI encourages you to consider all of these risks, uncertainties and other factors carefully in evaluating the forward-looking statements contained in this presentation. As a result of these matters, changes in facts, assumptions not being realized or other circumstances, CSI’s actual results may differ materially from the expected results discussed in the forward-looking statements contained in this presentation. The forward-looking statements contained in this presentation are made only as of the date of this presentation, and CSI undertakes no obligation to update them to reflect subsequent events or circumstances. 2 FORWARD LOOKING STATEMENTS FINANCIAL INFORMATION This presentation includes calculations or figures that have been prepared internally and have not been reviewed or audited by CSI’s independent registered accounting firm. Use of different methods for preparing, calculating or presenting information may lead to differences, which may be material. In addition, this presentation also includes certain non-GAAP financial measures, such as Adjusted EBITDA. Reconciliations of the non-GAAP financial measures used in this presentation to the most comparable U.S. GAAP measures for the respective periods can be found in tables in the appendix to this presentation. Non-GAAP financial measures have limitations as analytical tools and should not be considered in isolation or as a substitute for CSI's financial results prepared in accordance with GAAP.

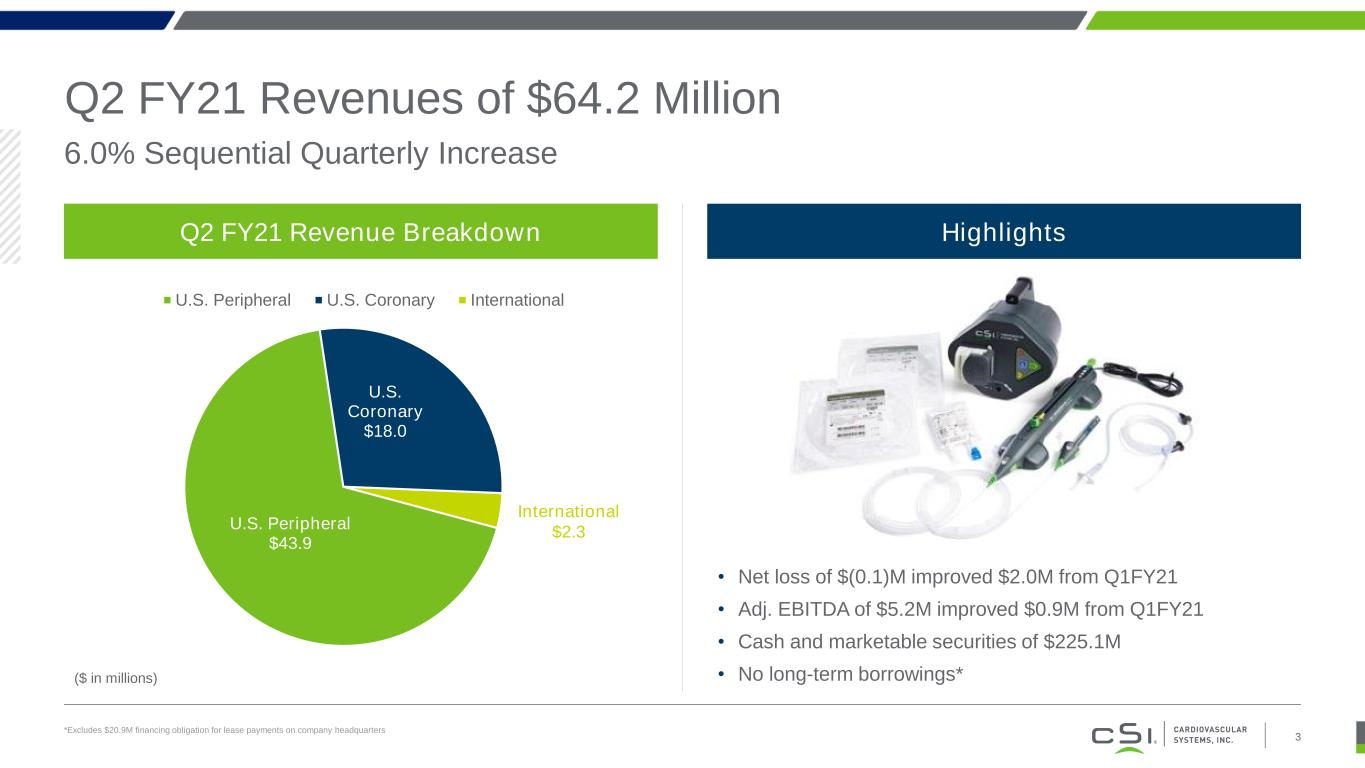
6.0% Sequential Quarterly Increase Q2 FY21 Revenues of $64.2 Million *Excludes $20.9M financing obligation for lease payments on company headquarters Q2 FY21 Revenue Breakdown U.S. Peripheral $43.9 U.S. Coronary $18.0 U.S. Peripheral U.S. Coronary International ($ in millions) International $2.3 • Net loss of $(0.1)M improved $2.0M from Q1FY21 • Adj. EBITDA of $5.2M improved $0.9M from Q1FY21 • Cash and marketable securities of $225.1M • No long-term borrowings* Highlights 3

Q2 FY21: New Information Introduced 4 Slides 5 and 6 show Orbital Atherectomy System revenue, Interventional Support Device (ISD) revenue and U.S. Revenue by peripheral and coronary franchise Similar to coronary, we anticipate the launch of peripheral ISDs will become a key growth driver We provided retroactive breakout of domestic peripheral and coronary quarterly results for comparative purposes In an effort to enhance our investors’ understanding of our domestic peripheral and coronary businesses, we will now provide additional breakout of revenue:

Q2 FY21: U.S. Peripheral 1 Is the total of Orbital Atherectomy System Revenue plus Interventional Support Device Revenue. 2 Includes peripheral orbital atherectomy devices, ViperWire, ViperSlide, Exchangeable cartridges, ViperTrack and other 3 ViperCath and Zilient Guidewires Continued strength in office-based lab procedures 5 U.S. Peripheral revenue increased 2.3% sequentially • Peripheral franchise was led by 9% year-over-year unit growth in the OBL segment • Total peripheral units sold were 98% of Q2FY20 • Exchangeable OAS represents 20% of peripheral volume • Targeting launch of peripheral support products in Q4 FY21 U.S Peripheral Revenue1 ($ in 000) Q1 Q2 Q3 Q4 Total FY19 $41,051 $43,426 $44,632 $48,207 $177,316 FY20 $45,272 $47,463 $42,134 $30,667 $165,536 FY21 $42,932 $43,924 - - $86,856 Orbital Atherectomy System Revenue2 ($ in 000) Q1 Q2 Q3 Q4 Total FY19 $40,839 $43,191 $44,384 $47,905 $176,318 FY20 $44,944 $47,159 $41,839 $30,465 $164,407 FY21 $42,657 $43,625 - - $86,282 Interventional Support Device Revenue3 ($ in 000) Q1 Q2 Q3 Q4 Total FY19 $212 $235 $248 $302 $998 FY20 $328 $304 $295 $202 $1,129 FY21 $275 $299 - - $574

Q2 FY21: U.S. Coronary 1 Is the total of Orbital Atherectomy System Revenue plus Interventional Support Device Revenue. 2 Includes coronary orbital atherectomy devices, Coronary Guidewire, ViperSlide and other 3 Includes Sapphire angioplasty balloons and Teleport microcatheters Strong recovery in coronary procedures 6 U.S. Coronary revenue increased 13.1% sequentially • Coronary OAS units increased 14% compared to Q1FY21 and were 95% of Q2FY20 • Continued adoption of coronary toolkit featuring OAS with GlideAssist, 1.0mm Sapphire angioplasty balloons, Teleport Microcatheter and nitinol ViperWire with Flex Tip drove $542 of incremental revenue for every coronary OAS sold in Q2 • ECLIPSE enrollment resumed October 1, 2020 – now over 1,450 enrolled U.S Coronary Revenue1 ($ in 000) Q1 Q2 Q3 Q4 Total FY19 $13,873 $15,170 $16,265 $17,490 $62,798 FY20 $16,257 $18,497 $15,988 $9,785 $60,527 FY21 $15,899 $17,983 - - $33,882 Orbital Atherectomy System Revenue2 ($ in 000) Q1 Q2 Q3 Q4 Total FY19 $13,514 $14,686 $15,402 $16,160 $59,762 FY20 $14,669 $16,490 $14,058 $8,651 $53,868 FY21 $13,952 $15,762 - - $29,714 Interventional Support Device Revenue3 ($ in 000) Q1 Q2 Q3 Q4 Total FY19 $359 $484 $863 $1,330 $3,036 FY20 $1,588 $2,007 $1,930 $1,134 $6,659 FY21 $1,947 $2,221 - - $4,168

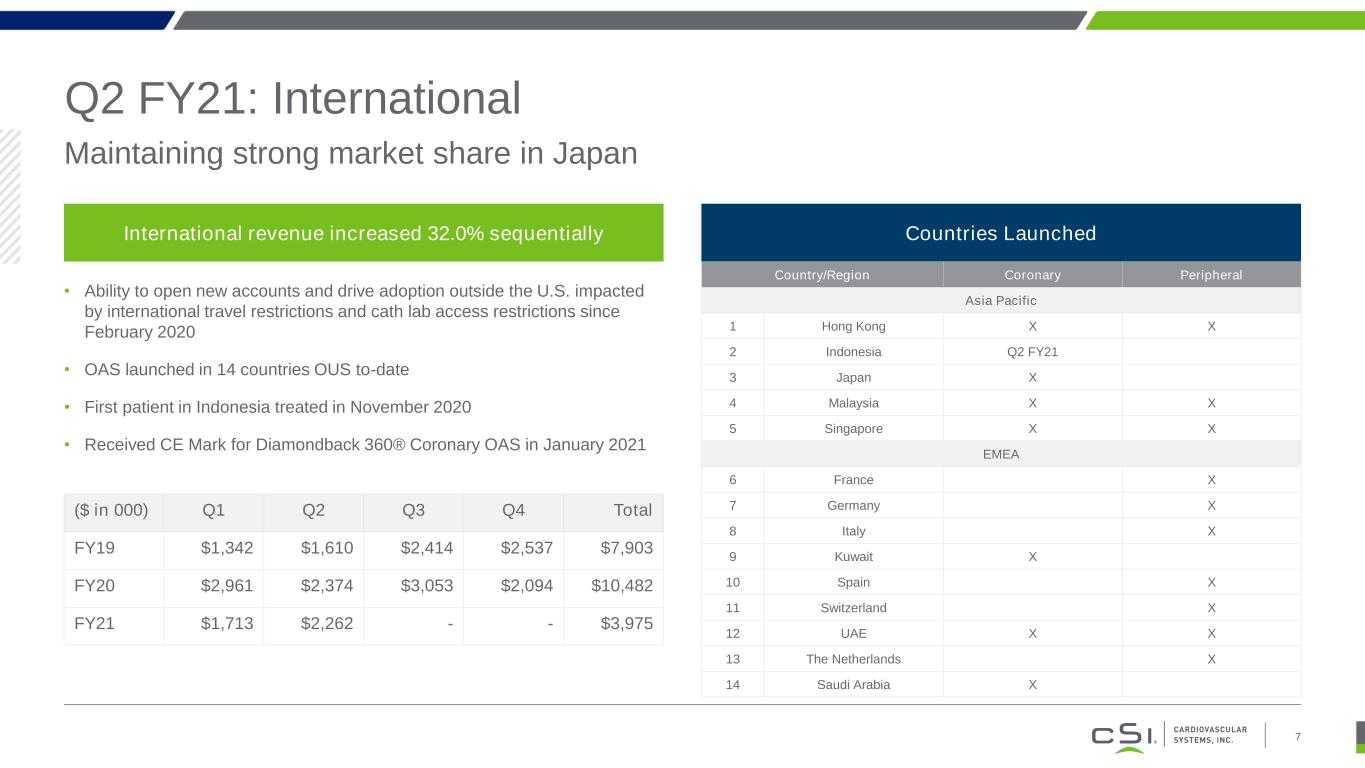
Q2 FY21: International Maintaining strong market share in Japan 7 International revenue increased 32.0% sequentially • Ability to open new accounts and drive adoption outside the U.S. impacted by international travel restrictions and cath lab access restrictions since February 2020 • OAS launched in 14 countries OUS to-date • First patient in Indonesia treated in November 2020 • Received CE Mark for Diamondback 360® Coronary OAS in January 2021 ($ in 000) Q1 Q2 Q3 Q4 Total FY19 $1,342 $1,610 $2,414 $2,537 $7,903 FY20 $2,961 $2,374 $3,053 $2,094 $10,482 FY21 $1,713 $2,262 - - $3,975 Countries Launched Country/Region Coronary Peripheral Asia Pacific 1 Hong Kong X X 2 Indonesia Q2 FY21 3 Japan X 4 Malaysia X X 5 Singapore X X EMEA 6 France X 7 Germany X 8 Italy X 9 Kuwait X 10 Spain X 11 Switzerland X 12 UAE X X 13 The Netherlands X 14 Saudi Arabia X

Q2 FY21 vs. Q1 FY21 and Q2 FY20 Dollars in thousands 8 Q2 FY21 Q/Q Change Y/Y Change Total Revenue $64,169 6.0% -6.1% Worldwide Peripheral Revenue $43,956 2.4% -7.6% Worldwide Coronary Revenue $20,213 14.8% -2.6% US Revenue $61,907 5.2% -6.1% US Peripheral Revenue $43,924 2.3% -7.5% US Coronary Revenue $17,983 13.1% -2.8% International Revenue $2,262 32.0% -4.7% US Peripheral Units - 7.5% -2.3% US Coronary Units - 14.3% -5.1%

Q2 FY21: Select Financial Information Dollars in thousands, except earnings per share 9 Q2 FY21 Q1 FY21 Q/Q Change Q2 FY20 Y/Y Change Net revenues $64,169 $60,544 $3,625 $68,334 ($4,165) Cost of goods sold 13,920 12,564 1,356 13,718 202 Gross Margin 78.3% 79.2% Declined 90 BP 79.9% Declined 160 BP Selling, general and administrative 40,061 40,282 (221) 46,867 (6,806) % of sales 62.4% 66.5% Improved 410 BP 68.6% Improved 620 BP Research and development 9,601 9,052 549 10,786 (1,185) % of sales 15.0% 15.0% Flat 15.8% Declined 80 BP Amortization of intangible assets 304 304 - 337 (33) Income (loss) from operations 283 (1,658) 1,941 (3,374) 3,657 Other (income) and expense, net 276 355 (79) (17) (312) Provision for income taxes 63 63 Flat 44 (19) Net income (loss) $(56) $(2,076) $2,020 $(3,401) $3,345 Basic and diluted earnings per share - $(0.05) $0.05 $(0.10) $0.10 Basic and diluted weighted average shares outstanding 38,808,980 38,683,839 125,141 34,069,412 4,739,568

2H FY21 Timeline O p e ra ti o n s In v e s to rs Q3 FY21 Announced partnership to develop new DCBs February 1 First patient in Europe treated with Diamondback 360® Coronary OAS February Q2 Earnings February 3 SVBLeerink Conference February 25 Raymond James Conference March 2 EU Launch Q3 Oppenheimer Conference March 16 U.S. Launch Q4 Needham Conference April 13 Q3 Earnings May 6 Bank of America Conference May 11 Q4 FY21 Barclays Conference March 9 U.S. Launch Q4 10 Announced CE Mark for Diamondback 360® Coronary OAS January 18

Q3 FY21: Guidance For the fiscal 2021 third quarter ending March 31, 2021, CSI anticipates: Revenue of $60 million to $65 million, representing 98% to 106% of revenue from Q3 FY2020; Gross profit as a percentage of revenues in the 77% to 78% range; Operating expenses in a range of $52 to $54 million; Net loss in a range of $3.5 to $6.0 million; and Near neutral Adjusted EBITDA 11

Non-GAAP Financial Measures 12 CSI uses Adjusted EBITDA as a supplemental measure of performance and believes this measure facilitates operating performance comparisons from period to period and company to company by factoring out potential differences caused by depreciation and amortization expense and non-cash charges such as stock based compensation. CSI's management uses Adjusted EBITDA to analyze the underlying trends in CSI's business, assess the performance of CSI's core operations, establish operational goals and forecasts that are used to allocate resources and evaluate CSI's performance period over period and in relation to its competitors' operating results. Additionally, CSI's management is evaluated on the basis of Adjusted EBITDA when determining achievement of their incentive compensation performance targets. CSI believes that presenting Adjusted EBITDA provides investors greater transparency to the information used by CSI's management for its financial and operational decision-making and allows investors to see CSI's results "through the eyes" of management. CSI also believes that providing this information better enables CSI's investors to understand CSI's operating performance and evaluate the methodology used by CSI's management to evaluate and measure such performance. ($ in thousands) Q2 FY20 Q3 FY20 Q4 FY20 Q1 FY21 Q2 FY21 Net income (loss) $3,401 $(2,889) $(15,166) $(2,076) $(56) Less: Other (income) and expense, net (17) 107 334 355 276 Less: Provision for income taxes 44 47 102 63 63 Income (loss) from operations (3,374) (2,735) (14,730) (1,658) 283 Add: Stock-based compensation 3,290 3,273 3,143 4,907 3,877 Add: Depreciation and amortization 1,090 1,088 1,027 1,029 1,058 Adjusted EBITDA $1,006 $1,626 $(10,560) $4,278 $5,218 Use and Economic Substance of Non-GAAP Financial Measures Used by CSI and Usefulness of Such Non-GAAP Financial Measures to Investors

Investor Contact: Jack Nielsen 651-202-4919 j.nielsen@csi360.com CSI®, Diamondback®, Diamondback 360®, GlideAssist®, ViperWire®, WIRION® and ViperWire Advance® are trademarks of Cardiovascular Systems, Inc. © 2021 Cardiovascular Systems, Inc. OrbusNeich®, Teleport® and Sapphire® are trademarks of OrbusNeich Medical, Inc. For more information: www.csi360.com Cardiovascular Systems, Inc. CSII @csi360 13

