Attached files
| file | filename |
|---|---|
| 8-K - 8-K - Bank of Marin Bancorp | brmc-20210203.htm |

Banking with discipline and financial strength The Janney CEO Forum February 3-4, 2021 Exhibit 99.1

2 Nasdaq: BMRC Forward-Looking Statements This presentation may contain certain forward-looking statements that are based on management's current expectations regarding economic, legislative, and regulatory issues that may impact Bancorp's earnings in future periods. Forward-looking statements can be identified by the fact that they do not relate strictly to historical or current facts. They often include the words “believe,” “expect,” “intend,” “estimate” or words of similar meaning, or future or conditional verbs such as “will,” “would,” “should,” “could” or “may.” Factors that could cause future results to vary materially from current management expectations include, but are not limited to, natural disasters (such as wildfires and earthquakes), our borrowers’ actual payment performance as loan deferrals related to the COVID-19 pandemic expire, changes to statutes, regulations, or regulatory policies or practices as a result of, or in response to COVID-19, including the potential adverse impact of loan modifications and payment deferrals implemented consistent with recent regulatory guidance, general economic conditions, economic uncertainty in the United States and abroad, changes in interest rates, deposit flows, real estate values, costs or effects of acquisitions, competition, changes in accounting principles, policies or guidelines, legislation or regulation (including the Coronavirus Aid, Relief and Economic Security Act of 2020, as amended, and the Economic Aid to Hard-Hit Small Businesses, Nonprofits and Venues Act of 2020), interruptions of utility service in our markets for sustained periods, and other economic, competitive, governmental, regulatory and technological factors (including external fraud and cybersecurity threats) affecting Bancorp's operations, pricing, products and services. These and other important factors are detailed in various securities law filings made periodically by Bancorp, copies of which are available from Bancorp without charge. Bancorp undertakes no obligation to release publicly the result of any revisions to these forward-looking statements that may be made to reflect events or circumstances after the date of this presentation or to reflect the occurrence of unanticipated events.

Bank of Marin Bancorp Recent awards: FIVE STAR BANK BAUER 3 Nasdaq: BMRC Headquarters Novato, California Marin County, North of San Francisco Employees, full-time equivalent 289 Assets $2.9 billion Market capitalization $539 million (As of 1/25/21) Total loans $2.1 billion Total deposits $2.5 billion Footprint 25 locations in San Francisco Bay Area Ticker BMRC (Nasdaq Capital Markets) Founded 1989 First branch opened in 1990 As of December 31, 2020 COMMUNTY BANKERS CUP AWARD 2014 - 2015 - 2016

Russell A. Colombo President, Chief Executive Officer • 46 years in banking • Comerica Bank, Imperial Bank, Security Pacific, Union Bank Tim Myers EVP, Chief Operating Officer • 25 years in finance and banking • U.S. Bank, Comerica Bank, Imperial Bank Rich Lewis EVP, Chief Information Officer • 25 years in financial services • Mechanics Bank, Luther Burbank Savings, Tamalpais Bank, Exchange Bank Tani Girton EVP, Chief Financial Officer • 35 years in financial services • Bank of the West, Charles Schwab, CalFed Bank Over 270 Years of Combined Management Experience Through Various Economic Cycles 4 Nasdaq: BMRC Brandi Campbell SVP, Retail Banking • 31 years in banking • Bank of America Beth Reizman EVP, Chief Credit Officer • 38 years in banking • Bank of California, Hibernia Bank, Crocker Bank Nancy Rinaldi Boatright SVP, Corporate Secretary • 48 years in banking • Business Bank of California, Westamerica Bank Bob Gotelli EVP, Human Resources • 27 years experience • Ralphs Grocery

$1.18 $26.54 $1.30 $34.34 0 5 10 15 20 25 30 35 40 45 50 1990 1992 1994 1996 1998 2000 2002 2004 2006 2008 2010 2012 2014 2016 2018 2020 Book Value per Common Share Closing Stock Price 5 Nasdaq: BMRC Balanced Approach to Growth Creates Long-Term Value 5 year average annual return: 7.3%1 1As of December 31, 2020 10 year average annual return: 9.0%1 Total annual shareholder return averages 11.0% over 20 years1 As of 1/25/21 the stock price was $39.94

6 Nasdaq: BMRC • 21 retail branches, 5 commercial banking offices and 2 loan production offices located across 7 Bay Area counties. • Sound underwriting produces a high-quality loan portfolio with industry-leading credit metrics even in challenging economic periods. • Prudent lending paired with low- cost deposit base drives consistent earnings. Leading Community and Commercial Bank Serving the San Francisco Bay Area (loan production office) San Mateo (loan production office)

Steady Loan Growth: Prudent, Sustainable Growth Model 7 Nasdaq: BMRC ($ billions) Five-year compound annual loan growth rate: 7.6% (4.4% excluding PPP loans) 1 1 Compounded annual growth rate from December 31, 2015 to December 31, 2020. PPP Loans: $291.6 million Excluding PPP Loans $1.45 $1.49 $1.68 $1.76 $1.84 $1.80 2015 2016 2017 2018 2019 2020 $2.09

Non-Interest Bearing DDA 54% (up from 45% at 12/31/2015) Savings 8% Money Market 27% Time Deposits 4% Interest Bearing DDA 7% Low-Cost Deposit Base: A Key Competitive Advantage ($ billions) 8 Nasdaq: BMRC 1 Compounded annual growth rate from December 31, 2015 to December 31, 2020. Q4 2020 Cost of Deposits 0.07% $1.73 $1.77 $2.15 $2.19 $2.37 $2.67 Five-year compound annual deposit growth rate: 7.7% (9.1% including off-balance sheet deposits) 1 On-Balance Sheet Deposits Off-Balance Sheet Deposits 2015 2016 2017 2018 2019 2020

Asset Quality: Disciplined Underwriting Standards Mitigate Risk and Produce Strong Asset Quality Through Economic Cycles NPAs / Total Assets NCO / Average Loans 9 Nasdaq: BMRC 0.13% 0.03% 0.02% 0.03% 0.01% 0.32% 2015 2016 2017 2018 2019 2020 0.04% -0.16% 0.01% -0.00% -0.00%0.00% 2015 2016 2017 2018 2019 2020 2016 Net Charge-offs [ Net Recoveries [

10 NASDAQ: BMRC COVID-19 Response – Payment Relief Program Status Update Bank of Marin provided payment relief for 269 loans totaling $403 million since the onset of the pandemic, most of which have resumed normal payments or been paid off. 21 borrowing relationships with 29 loans accounted for the outstanding loan balance as of December 31, 2020: Payment Relief by Type Industry/Collateral type Outstanding Loan Balance 12/31/20 (in thousands) Weighted Average LTV Education $17,580 26% Health Clubs 16,551 38% Office and Mixed Use 15,883 44% Hospitality 12,439 49% Retail Related CRE 6,899 52% Auto Dealership 393 49% Non-CRE Related 121 N/A Residential Real Estate 1,130 60% Payment Relief Totals $70,996 40%

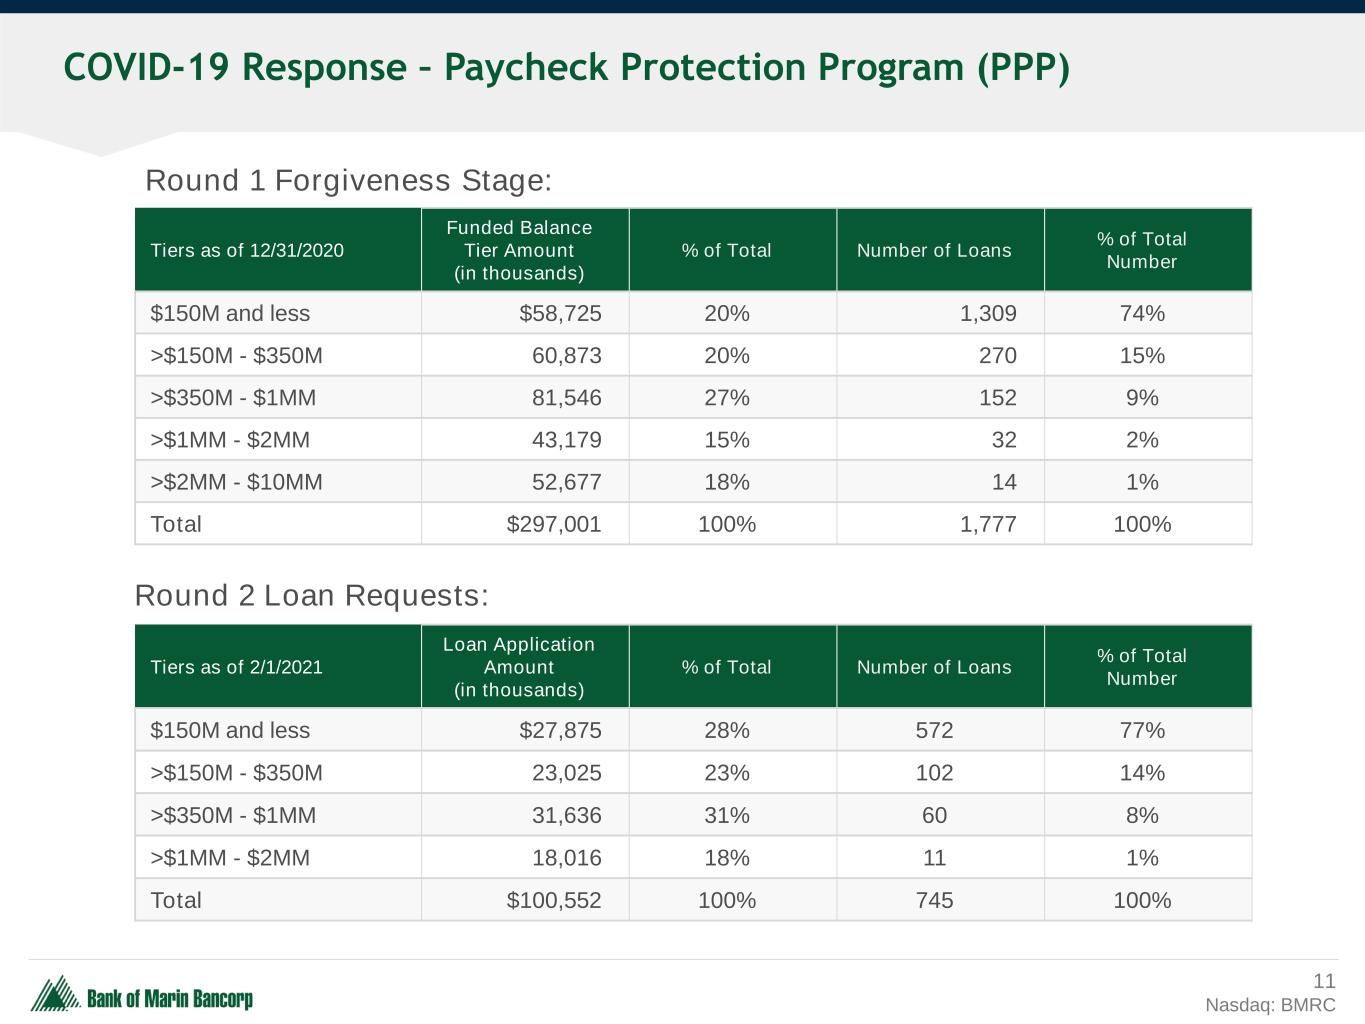
11 Nasdaq: BMRC COVID-19 Response – Paycheck Protection Program (PPP) Tiers as of 12/31/2020 Funded Balance Tier Amount (in thousands) % of Total Number of Loans % of Total Number $150M and less $58,725 20% 1,309 74% >$150M - $350M 60,873 20% 270 15% >$350M - $1MM 81,546 27% 152 9% >$1MM - $2MM 43,179 15% 32 2% >$2MM - $10MM 52,677 18% 14 1% Total $297,001 100% 1,777 100% Tiers as of 2/1/2021 Loan Application Amount (in thousands) % of Total Number of Loans % of Total Number $150M and less $27,875 28% 572 77% >$150M - $350M 23,025 23% 102 14% >$350M - $1MM 31,636 31% 60 8% >$1MM - $2MM 18,016 18% 11 1% Total $100,552 100% 745 100% Round 2 Loan Requests: Round 1 Forgiveness Stage:

2020 Results 12 NASDAQ: BMRC As of, and for the quarter and year ended, December 31, 2020 Q4’20 FY’20 Δ FY’19 Earnings $8.1MM $30.2MM ($4.0MM) Diluted EPS $0.60 $2.22 ($0.26) Deposit Cost 0.07% 0.11% 9bps Total Deposits $2,504MM $2,504MM $168MM Total Loans $2,089MM $2,089MM $245MM Tax Equivalent NIM 3.40% 3.55% (43bps) Efficiency Ratio 59.70% 57.06% (173bps) Return on Assets 1.09% 1.04% (30bps) Return on Equity 8.98% 8.60% (189bps)

Net Interest Margin 13 Nasdaq: BMRC 3.83% 3.91% 3.80% 3.90% 3.98% 3.88% 3.53% 3.44% 3.40% 3.84% 3.80% 3.79% 4.10% 4.10% 3.88% 3.57% 3.40% 2.50% 3.00% 3.50% 4.00% 4.50% 2015 2016 2017 2018 2019 Q1'20 Q2'20 Q3'20 Q4'20 Bank of Marin Bancorp Peer Group Median 1 Peer group includes major exchange-traded Western region banks with assets of $1 billion to $6.5 billion. * Latest available peer data as of Q3 2020. 1 *

14 NASDAQ: BMRC • Continually reviewing interest rate risk management strategies • Adapting to changes in customer behavior due to digital banking enhancements and pandemic safety protocols • Assessing our branch footprint to best align with changes in customer behavior due to increased utilization of digital channels • Exploring flexible remote work options that may impact future investments in office space Expense Control and Net Interest Margin Compression

15 Nasdaq BMRC Low Efficiency Ratio Demonstrates Disciplined Expense Control 61.5% 57.9% 64.7% 57.3% 55.3% 56.8% 54.0% 57.8% 59.7% 66.2% 64.9% 62.5% 61.4% 61.1% 63.3% 59.2% 57.6% 50.0% 52.0% 54.0% 56.0% 58.0% 60.0% 62.0% 64.0% 66.0% 68.0% 2015 2016 2017 2018 2019 Q1'20 Q2'20 Q3'20 Q4'20 Bank of Marin Bancorp Peer Group Median 1 Peer group includes major exchange-traded Western region banks with assets of $1 billion to $6.5 billion. * Latest available peer data as of Q3 2020. 1 Bank of Napa *

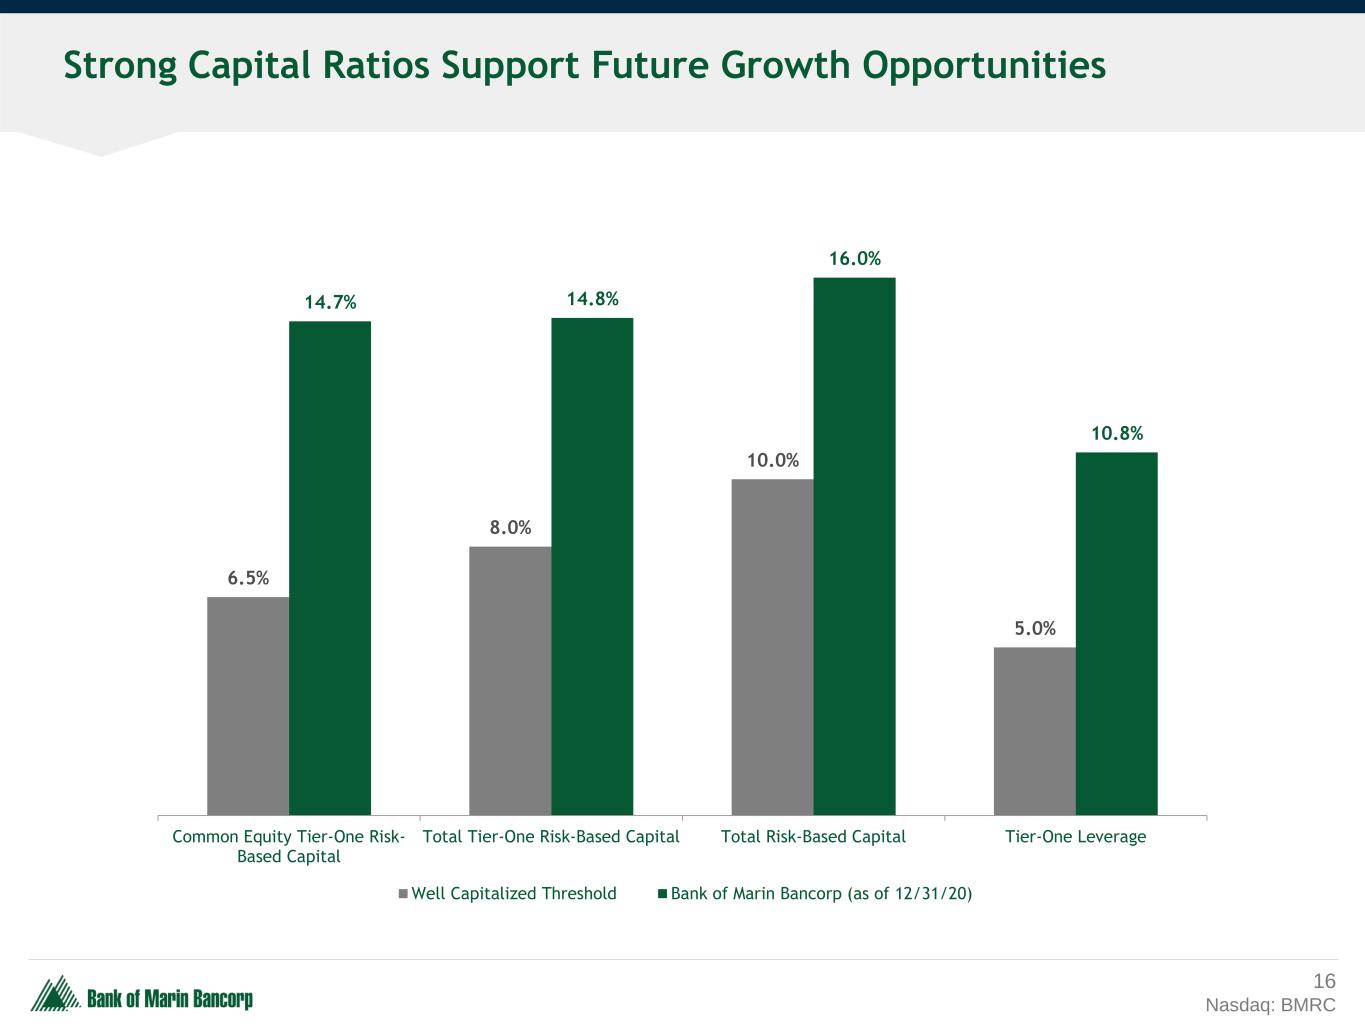
Strong Capital Ratios Support Future Growth Opportunities 16 Nasdaq: BMRC 6.5% 8.0% 10.0% 5.0% 14.7% 14.8% 16.0% 10.8% Common Equity Tier-One Risk- Based Capital Total Tier-One Risk-Based Capital Total Risk-Based Capital Tier-One Leverage Well Capitalized Threshold Bank of Marin Bancorp (as of 12/31/20)

Peer Comparison 17 Nasdaq: BMRC BMRC Q3 2020 Peer Median Percentile Non-Interest Bearing/Total Deposits 53.9% 37.6% 100% Gross Loan Growth Rate (year over year) 17.2% 16.4% 53.6% NPAs/Assets 0.05% 0.32% 96.6% Efficiency Ratio 57.8% 57.6% 48.9% Return on Average Assets 0.98% 1.04% 31.2% Return on Average Equity 8.37% 12.19% 31.8% Tangible Common Equity/ Tangible Assets 11.0% 9.37% 97.9% Net Income/FTE Annualized $102.97 $84.50 64.5% Peers are major exchange-traded U.S. Western-region banks with $1 billion to $6.5 billion in assets. Source: Peer Median and Percentile obtained from S&P Global Market Intelligence as of Q3 2020.

Dependable Earnings and Dividend Growth 18 Nasdaq: BMRC 1 Prior period share and per share data have been adjusted to reflect the two-for-one stock split effective in 2018. 11 D o ll a rs p e r s h a re $ M M $1.52 $1.89 $1.27 $2.33 $2.48 $2.22 $0.45 $0.51 $0.56 $0.64 $0.80 $0.92 $18.4 $30.2 $0.0 $5.0 $10.0 $15.0 $20.0 $25.0 $30.0 $35.0 $40.0 $0.00 $0.50 $1.00 $1.50 $2.00 $2.50 $3.00 2015 2016 2017 2018 2019 2020 Earnings per Share Dividends per Share Net Income

Executing Bank of Marin’s Growth Strategy 19 Nasdaq: BMRC • Economic impacts of the pandemic will likely persist through the first half of 2021. The Bank will focus on customer retention, maintaining credit quality, and new business development. • As economic conditions improve, our offices are fully staffed and we are poised for growth in our newest regional offices in Walnut Creek and San Mateo as well as across our footprint. • We anticipate a return of robust M&A activity. With our capital position, strong share price and proven history of successful acquisitions, we will continue to assess potential opportunities as they arise.

Contact Us 20 Nasdaq: BMRC Russell A. Colombo President & Chief Executive Officer (415) 763-4521 russcolombo@bankofmarin.com Tani Girton EVP, Chief Financial Officer (415) 884-7781 tanigirton@bankofmarin.com Tim Myers EVP, Chief Operating Officer (415) 763-4970 timmyers@bankofmarin.com Media Requests: Beth Drummey VP, Marketing & Corporate Communications (415) 328-3063 bethdrummey@bankofmarin.com
