Attached files
| file | filename |
|---|---|
| EX-32.01 - EXHIBIT 32.01 - Bank of Marin Bancorp | bmrc-ex3201_20171231.htm |
| EX-31.02 - EXHIBIT 31.02 - Bank of Marin Bancorp | bmrc-ex3102_20171231.htm |
| EX-31.01 - EXHIBIT 31.01 - Bank of Marin Bancorp | bmrc-ex3101_20171231.htm |
| EX-23.01 - EXHIBIT 23.01 - Bank of Marin Bancorp | bmrc-ex2301_20171231.htm |
UNITED STATES
SECURITIES AND EXCHANGE COMMISSION
Washington, D.C. 20549
FORM 10-K
(Mark One)
x ANNUAL REPORT PURSUANT TO SECTION 13 OR 15(d) OF THE SECURITIES EXCHANGE ACT OF 1934
For the fiscal year ended December 31, 2017
OR
o TRANSITION REPORT PURSUANT TO SECTION 13 OR 15(d) OF THE SECURITIES EXCHANGE ACT OF 1934
For the transition period from __________________ to __________________
Commission File Number 001-33572
Bank of Marin Bancorp
(Exact name of Registrant as specified in its charter)
California | 20-8859754 | |
(State or other jurisdiction of incorporation) | (IRS Employer Identification No.) | |
504 Redwood Boulevard, Suite 100, Novato, CA | 94947 | |
(Address of principal executive office) | (Zip Code) | |
Registrant’s telephone number, including area code: (415) 763-4520
Securities registered pursuant to Section 12 (b) of the Act:
None
Securities registered pursuant to section 12(g) of the Act:
Common Stock, No Par Value, | ||
and attached Share Purchase Rights | NASDAQ Capital Market | |
(Title of each class) | (Name of each exchange on which registered) | |
Indicate by check mark if the registrant is a well-known seasoned issuer, as defined in Rule 405 of the Securities Act.
Yes o No x
Indicate by check mark if the registrant is not required to file reports pursuant to Section 13 or Section 15(d) of the Act.
Yes o No x
Note - checking the box above will not relieve any registrant required to file reports pursuant to Section 13 or 15(d) of the Exchange Act from their obligations under these sections.
Indicate by check mark whether the registrant (1) has filed all reports to be filed by Section 13 or 15(d) of the Securities Exchange Act of 1934 during the preceding 12 months (or for such shorter period that the registrant was required to file such reports), and (2) has been subject to such filing requirements for the past 90 days.
Yes x No o
Indicate by check mark whether the registrant has submitted electronically and posted on its corporate web site, if any, every Interactive Data File required to be submitted and posted pursuant to Rule 405 of Regulation S-T during the preceding 12 months (or for such shorter period that the registrant was required to submit and post such files).
Yes x No o
Indicate by check mark if disclosure of delinquent filers pursuant to Item 405 of Regulation S-K is not contained herein, and will not be contained, to the best of the registrant's knowledge, in definitive proxy or information statements incorporated by reference in Part III of this form 10-K or any amendment to this Form 10-K.
x
Indicate by check mark whether the registrant is a large accelerated filer, an accelerated filer, a non-accelerated filer, smaller reporting company, or an emerging growth company. See the definitions of “large accelerated filer,” “accelerated filer”, “smaller reporting company,” and "emerging growth company" in Rule 12b-2 of the Exchange Act.
Large accelerated filer o | Accelerated filer x | |
Non-accelerated filer o | (Do not check if a smaller reporting company) | Smaller reporting company o |
Emerging growth company o | ||
If an emerging growth company, indicate by check mark if the registrant has elected not to use the extended transition period for complying with any new or revised financial accounting standards provided pursuant to Section 13(a) of the Exchange Act.
o
Indicate by check mark if the registrant is a shell company, as defined in Rule 12b-2 of the Exchange Act.
Yes o No x
As of June 30, 2017, the last business day of the registrant's most recently completed second fiscal quarter, the aggregate market value of the voting common equity held by non-affiliates, based upon the closing price per share of the registrant's common stock as reported by the NASDAQ, was approximately $396 million. For the purpose of this response, directors and certain officers of the Registrant are considered the affiliates at that date.
As of February 28, 2018, there were 6,970,446 shares of common stock outstanding.
DOCUMENTS INCORPORATED BY REFERENCE
Portions of the registrant's Proxy Statement for the Annual Meeting of Shareholders to be held on May 22, 2018 are incorporated by reference into Part III.
TABLE OF CONTENTS
PART I | ||
Forward-Looking Statements | ||
ITEM 1. | BUSINESS | |
ITEM 1A. | RISK FACTORS | |
ITEM 1B. | UNRESOLVED STAFF COMMENTS | |
ITEM 2. | PROPERTIES | |
ITEM 3. | LEGAL PROCEEDINGS | |
ITEM 4. | MINE SAFETY DISCLOSURES | |
PART II | ||
ITEM 5. | MARKET FOR REGISTRANT'S COMMON EQUITY, RELATED STOCKHOLDER MATTERS AND ISSUER PURCHASES OF EQUITY SECURITIES | |
ITEM 6. | SELECTED FINANCIAL DATA | |
ITEM 7. | MANAGEMENT'S DISCUSSION AND ANALYSIS OF FINANCIAL CONDITION AND RESULTS OF OPERATIONS | |
Forward-Looking Statements | ||
Executive Summary | ||
Critical Accounting Policies | ||
RESULTS OF OPERATIONS | ||
Net Interest Income | ||
Provision for Loan Losses | ||
Non-Interest Income | ||
Non-Interest Expense | ||
Provision for Income Taxes | ||
FINANCIAL CONDITION | ||
Investment Securities | ||
Loans | ||
Allowance for Loan Losses | ||
Other Assets | ||
Deposits | ||
Borrowings | ||
Deferred Compensation Obligations | ||
Off Balance Sheet Arrangements and Commitments | ||
Capital Adequacy | ||
Liquidity | ||
Selected Quarterly Financial Data | ||
ITEM 7A. | QUANTITATIVE AND QUALITATIVE DISCLOSURES ABOUT MARKET RISK | |
ITEM 8. | FINANCIAL STATEMENTS AND SUPPLEMENTARY DATA | |
Page-2
NOTES TO CONSOLIDATED FINANCIAL STATEMENTS | ||
Note 1: Summary of Significant Accounting Policies | ||
Note 2: Investment Securities | ||
Note 3: Loans and Allowance for Loan Losses | ||
Note 4: Bank Premises and Equipment | ||
Note 5: Bank Owned Life Insurance | ||
Note 6: Deposits | ||
Note 7: Borrowings | ||
Note 8: Stockholders' Equity and Stock Plans | ||
Note 9: Fair Value of Assets and Liabilities | ||
Note 10: Benefit Plans | ||
Note 11: Income Taxes | ||
Note 12: Commitments and Contingencies | ||
Note 13: Concentrations of Credit Risk | ||
Note 14: Derivative Financial Instruments and Hedging Activities | ||
Note 15: Regulatory Matters | ||
Note 16: Financial Instruments with Off-Balance Sheet Risk | ||
Note 17: Condensed Bank of Marin Bancorp Parent Only Financial Statements | ||
Note 18: Acquisition | ||
ITEM 9. | CHANGES IN AND DISAGREEMENTS WITH ACCOUNTANTS ON ACCOUNTING AND FINANCIAL DISCLOSURE | |
ITEM 9A. | CONTROLS AND PROCEDURES | |
ITEM 9B. | OTHER INFORMATION | |
PART III | ||
ITEM 10. | DIRECTORS, EXECUTIVE OFFICERS AND CORPORATE GOVERNANCE | |
ITEM 11. | EXECUTIVE COMPENSATION | |
ITEM 12. | SECURITY OWNERSHIP OF CERTAIN BENEFICIAL OWNERS AND MANAGEMENT AND RELATED STOCKHOLDER MATTERS | |
ITEM 13. | CERTAIN RELATIONSHIPS AND RELATED TRANSACTIONS, AND DIRECTOR INDEPENDENCE | |
ITEM 14. | PRINCIPAL ACCOUNTANT FEES AND SERVICES | |
PART IV | ||
ITEM 15. | EXHIBITS AND FINANCIAL STATEMENT SCHEDULES | |
ITEM 16. | FORM 10-K SUMMARY | |
SIGNATURES | ||
Page-3
PART I
Forward-Looking Statements
This discussion of financial results includes forward-looking statements within the meaning of Section 27A of the Securities Act of 1933, as amended, (the "1933 Act") and Section 21E of the Securities Exchange Act of 1934, as amended, (the "1934 Act"). Those sections of the 1933 Act and 1934 Act provide a "safe harbor" for forward-looking statements to encourage companies to provide prospective information about their financial performance so long as they provide meaningful, cautionary statements identifying important factors that could cause actual results to differ significantly from projected results.
Our forward-looking statements include descriptions of plans or objectives of Management for future operations, products or services, and forecasts of revenues, earnings or other measures of economic performance. Forward-looking statements can be identified by the fact that they do not relate strictly to historical or current facts. They often include the words "believe," "expect," "intend," "estimate" or words of similar meaning, or future or conditional verbs preceded by "will," "would," "should," "could" or "may."
Forward-looking statements are based on Management's current expectations regarding economic, legislative, and regulatory issues, and the successful integration of acquisitions that may affect our earnings in future periods. A number of factors, many of which are beyond Management’s control, could cause future results to vary materially from current Management expectations. Such factors include, but are not limited to, general economic conditions and the economic uncertainty in the United States and abroad, including changes in interest rates, deposit flows, real estate values, and expected future cash flows on loans and securities; costs or effects of acquisitions; competition; changes in accounting principles, policies or guidelines; changes in legislation or regulation (including the Tax Cuts and Jobs Act of 2017); natural disasters (such as the recent wildfires in our area); adverse weather conditions; and other economic, competitive, governmental, regulatory and technological factors (including external fraud and cyber-security threats) affecting our operations, pricing, products and services.
Important factors that could cause results or performance to materially differ from those expressed in our prior forward-looking statements are detailed in ITEM 1A. Risk Factors of this report. Forward-looking statements speak only as of the date they are made. We do not undertake to update forward-looking statements to reflect circumstances or events that occur after the date the forward-looking statements are made or to reflect the occurrence of unanticipated events.
ITEM 1 BUSINESS
Bank of Marin (the “Bank”) was incorporated in August 1989, received its charter from the California Superintendent of Banks (now the California Department of Business Oversight or "DBO") and commenced operations in January 1990. The Bank is an insured bank by the Federal Deposit Insurance Corporation (“FDIC”). On July 1, 2007 (the “Effective Date”), a bank holding company reorganization was completed whereby Bank of Marin Bancorp (“Bancorp”) became the parent holding company for the Bank, the sole and wholly-owned subsidiary of Bancorp. On the Effective Date, each outstanding share of Bank of Marin common stock was converted into one share of Bank of Marin Bancorp common stock. Bancorp is listed at NASDAQ under the ticker symbol BMRC, which was formerly used by the Bank. Prior to the Effective Date, the Bank filed reports and proxy statements with the FDIC pursuant to Section 12 of the 1934 Act. Upon formation of the holding company, Bancorp became subject to regulation under the Bank Holding Company Act of 1956, as amended, and reporting and examination requirements by the Board of Governors of the Federal Reserve System ("Federal Reserve"). Bancorp files periodic reports and proxy statements with the Securities and Exchange Commission pursuant to the Securities Exchange Act of 1934, as amended.
References in this report to “Bancorp” mean Bank of Marin Bancorp, parent holding company for the Bank. References to “we,” “our,” “us” mean the holding company and the Bank that are consolidated for financial reporting purposes.
Virtually all of our business is conducted through Bancorp's subsidiary, Bank of Marin, which is headquartered in Novato, California. In addition to our headquarters, we operate twenty-three offices in Marin, Sonoma, San Francisco, Napa and Alameda counties, with a strong emphasis on supporting the local communities. Our customer base is made up of business and personal banking relationships from the communities near the branch office locations. Our business banking focus is on small to medium-sized businesses, professionals and not-for-profit organizations.
Page-4
We offer a broad range of commercial and retail deposit and lending programs designed to meet the needs of our target markets. Our lending categories include commercial real estate loans, commercial and industrial loans, construction financing, consumer loans, and home equity lines of credit. Merchant card services are available for our business customers. Through third party vendors, we offer a consumer Visa® credit card product combined with a rewards program to our customers, a Business Visa® program, an American Express® credit card program, a leasing program for commercial equipment financing, and cash management sweep services.
We offer a variety of personal and business checking and savings accounts, and a number of time deposit alternatives, including time certificates of deposit, Individual Retirement Accounts (“IRAs”), Health Savings Accounts, Certificate of Deposit Account Registry Service® ("CDARS"), Insured Cash Sweep® ("ICS"), and Demand Deposit MarketplaceSM ("DDM Sweep") accounts. CDARS, ICS and DDM Sweep accounts are networks through which we offer full FDIC insurance coverage in excess of the regulatory maximum by placing deposits in multiple banks participating in the networks. We also offer deposit options including mobile deposit, remote deposit capture, Automated Clearing House services (“ACH”), wire transfers, and image lockbox services. A valet pick-up service is available for non-cash deposits to our professional and business clients.
Other products and services include Apple Pay®, Samsung Pay®, Android Pay®, SurePayroll®, Positive Pay fraud detection tool, and cash management solutions including Cash Vault and SafePoint.
Automated teller machines (“ATM's”) are available at most retail branch locations. Our ATM network is linked to the PLUS, CIRRUS and NYCE networks, as well as to a network of nation-wide surcharge-free ATM's called MoneyPass. We also offer our depositors 24-hour access to their accounts by telephone and through our internet and mobile banking services available to personal and business account holders.
We offer Wealth Management and Trust Services (“WMTS”) which include customized investment portfolio management, trust administration, estate settlement and custody services. We also offer 401(k) plan services to small and medium-sized businesses through a third party vendor.
We make international banking services available to our customers indirectly through other financial institutions with whom we have correspondent banking relationships.
We hold no patents, licenses (other than licenses required by the appropriate banking regulatory agencies), franchises or concessions. The Bank has registered the service marks "The Spirit of Marin", the words “Bank of Marin”, the Bank of Marin logo, and the Bank of Marin tagline “Committed to your business and our community” with the United States Patent & Trademark Office. In addition, Bancorp has registered the service marks for the words “Bank of Marin Bancorp” and for the Bank of Marin Bancorp logo with the United States Patent & Trademark Office.
All service marks registered by Bancorp or the Bank are registered on the United States Patent & Trademark Office Principal Register, with the exception of the words "Bank of Marin Bancorp" which is registered on the United States Patent & Trademark Office Supplemental Register.
Market Area
Our primary market area consists of Marin, San Francisco, Napa, Sonoma and Alameda counties. Our customer base is primarily made up of business, not-for-profit and personal banking relationships within these market areas.
As discussed in Note 18 to the Consolidated Financial Statements in ITEM 8 of this report, in November 2017, we expanded our presence in Napa County through the acquisition of Bank of Napa, N.A. This resulted in the addition of $302.1 million of assets and the assumption of $251.9 million of liabilities as well as the addition of two branch offices serving the city of Napa. As a result, Bank of Marin is the largest community bank in Napa County based on deposit share1.
We attract deposit relationships from small to medium-sized businesses, not-for-profit organizations and professionals, merchants and individuals who live and/or work in the communities comprising our market areas. As of December 31,
_________________________________________________________________________________________
1 We obtained the FDIC deposit market share data from S&P Global Market Intelligence of New York, New York.
Page-5
2017, approximately 67% of our deposits are in Marin County and southern Sonoma County, and approximately 55% of our deposits are from businesses and 45% from individuals.
Competition
The banking business in California generally, and in our market area specifically, is highly competitive with respect to attracting both loan and deposit relationships. The increasingly competitive environment is affected by changes in regulation, interest rates, technology and product delivery systems, and consolidation among financial service providers. The banking industry is seeing strong competition for quality loans, with larger banks expanding their activities to attract businesses that are traditionally community bank customers. In all of our five counties, we have significant competition from nationwide banks with much larger branch networks and greater financial resources, as well as credit unions and other local and regional banks. Nationwide banks have the competitive advantages of national advertising campaigns and technology infrastructure to achieve economies of scale. Large commercial banks also have substantially greater lending limits and the ability to offer certain services, which are not offered directly by us. Other competitors for depositors' funds are money market mutual funds and non-bank financial institutions such as brokerage firms and insurance companies.
In order to compete with the numerous, and often larger, financial institutions in our primary market area, we use, to the fullest extent possible, the flexibility and rapid response capabilities that derive from our local leadership and decision making. Our competitive advantages also include an emphasis on personalized service, extensive community involvement, philanthropic giving, local promotional activities and strong relationships with our customers.
In Marin County, we have the third largest market share of total deposits at 10.4%, based upon FDIC deposit market share data as of June 30, 20172. A significant driver of our franchise value is the growth and stability of our checking deposits, a low-cost funding source for our loan portfolio.
Employees
At December 31, 2017, we employed 291 full-time equivalent (“FTE”) staff. The actual number of employees, including part-time employees, at year-end 2017 included seven executive officers, 123 other corporate officers and 183 staff. None of our employees are presently represented by a union or covered by a collective bargaining agreement. We believe that our employee relations are good. We have consistently been recognized as one of the “Best Places to Work” by the North Bay Business Journal and as a "Top Corporate Philanthropist” by the San Francisco Business Times.
SUPERVISION AND REGULATION
Bank holding companies and banks are extensively regulated under both federal and state law. The following discussion summarizes certain significant laws, rules and regulations affecting Bancorp and the Bank.
Bank Holding Company Regulation
Upon formation of the bank holding company on July 1, 2007, we became subject to regulation under the Bank Holding Company Act of 1956, as amended (“BHCA”) which subjects Bancorp to Federal Reserve reporting and examination requirements. Under the Federal Reserve regulations, a bank holding company is required to serve as a source of financial and managerial strength to its subsidiary banks. Under this requirement, we are expected to commit resources to support the Bank, including at times when we may not be in a financial position to provide such resources, and it may not be in our, or our shareholders’ or creditors’, best interests to do so. In addition, any capital loans we make to the Bank are subordinate in right of payment to depositors and to certain other indebtedness of the Bank. The BHCA regulates the activities of holding companies including acquisitions, mergers and consolidations and, together with the Gramm-Leach Bliley Act of 1999, the scope of allowable banking activities. Bancorp is also a bank holding company within the meaning of the California Financial Code. As such, Bancorp and its subsidiaries are subject to examination by, and may be required to file reports with, the DBO.
_________________________________________________________________________________________
2 Source: S&P Global Market Intelligence of New York, New York
Page-6
Bank Regulation
Banking regulations are primarily intended to protect consumers, depositors' funds, federal deposit insurance funds and the banking system as a whole. These regulations affect our lending practices, consumer protections, capital structure, investment practices and dividend policy.
As a state chartered bank, we are subject to regulation, supervision and examination by the DBO. We are also subject to regulation, supervision and periodic examination by the FDIC. If, as a result of an examination of the Bank, the FDIC or the DBO should determine that the financial condition, capital resources, asset quality, earnings prospects, management, liquidity, or other aspects of our operations are unsatisfactory, or that we have violated any law or regulation, various remedies are available to those regulators including issuing a “cease and desist” order, monetary penalties, restitution, restricting our growth or removing officers and directors.
The Bank addresses the many state and federal regulations it is subject to through a comprehensive compliance program that addresses the various risks associated with these issues.
Dividends
The payment of cash dividends by the Bank to Bancorp is subject to restrictions set forth in the California Financial Code (the “Code”) in addition to regulations and policy statements of the Federal Reserve. Prior to any distribution from the Bank to Bancorp, a calculation is made to ensure compliance with the provisions of the Code and to ensure that the Bank remains within capital guidelines set forth by the DBO and the FDIC. See also Note 8 to the Consolidated Financial Statements, under the heading “Dividends” in ITEM 8 of this report.
FDIC Insurance Assessments
The FDIC insures our customers' deposits to the maximum amount permitted by law, which is currently $250,000 per depositor, based on the 2010 Dodd-Frank Wall Street Reform and Consumer Protection Act (the “Dodd-Frank Act”).
Our FDIC insurance assessment base is quarterly average consolidated total assets minus average tangible equity, defined as Common Equity Tier 1 Capital. The FDIC has reduced the deposit insurance assessment rates since the Deposit Insurance Fund Reserve Ratio reached its target level as of June 30, 2016. Assessment rates are currently between 1.5 and 40 basis points annually on the assessment base for banks in all risk categories. In deriving the risk categories, the FDIC uses a bank's capital level, supervisory ratios and other financial measures to determine a bank's ability to withstand financial stress.
Community Reinvestment Act
Congress enacted the Community Reinvestment Act (“CRA”) in 1977 to encourage financial institutions to meet the credit needs of the communities in which they are located. All banks and thrifts have a continuing and affirmative obligation, consistent with safe and sound operations, to help meet the credit needs of their entire communities, including low and moderate income neighborhoods. Regulatory agencies rate each bank's performance in assessing and meeting these credit needs. The Bank is committed to serving the credit needs of the communities in which we do business, and it is our policy to respond to all creditworthy segments of our market. As part of its CRA commitment, the Bank maintains strong philanthropic ties to the community. We invest in affordable housing projects that help economically disadvantaged individuals and residents of low- and moderate-income census tracts, in each case consistent with our long-established prudent underwriting practices. We also donate to, invest in and volunteer with organizations that serve the communities in which we do business, especially low- and moderate-income individuals. These organizations offer educational and health programs to economically disadvantaged students and families, community development services and affordable housing programs. We offer CRA reportable small business, small farm and community development loans within our assessment areas. The CRA requires a depository institution's primary federal regulator, in connection with its examination of the institution, to assess the institution's record in meeting CRA requirements. The regulatory agency's assessment of the institution's record is made available to the public. This record is taken into consideration when the institution establishes a new branch that accepts deposits, relocates an office, applies to merge or consolidate, or expands into other activities. The FDIC assigned a “Satisfactory” rating to its CRA performance examination completed in May 2015, which was performed under the large bank requirements. The FDIC completed a performance examination in January 2018, the report of which is pending.
Page-7
Anti-Money-Laundering Regulations
A series of banking laws and regulations beginning with the Bank Secrecy Act in 1970 requires banks to prevent, detect, and report illicit or illegal financial activities to the federal government to prevent money laundering, international drug trafficking, and terrorism. Under the Uniting and Strengthening America by Providing Appropriate Tools Required to Intercept and Obstruct Terrorism Act of 2001, financial institutions are subject to prohibitions against specified financial transactions and account relationships, requirements regarding the Customer Identification Program, as well as enhanced due diligence and “know your customer” standards in their dealings with high risk customers, foreign financial institutions, and foreign individuals and entities.
Privacy and Data Security
The Gramm-Leach Bliley Act (“GLBA”) of 1999 imposes requirements on financial institutions with respect to consumer privacy. The GLBA generally prohibits disclosure of consumer information to non-affiliated third parties unless the consumer has been given the opportunity to object and has not objected to such disclosure. Financial institutions are further required to disclose their privacy policies to consumers annually. The GLBA also directs federal regulators, including the FDIC, to prescribe standards for the security of consumer information. We are subject to such standards, as well as standards for notifying consumers in the event of a security breach. We must disclose our privacy policy to consumers and permit consumers to “opt out” of having non-public customer information disclosed to third parties. We are required to have an information security program to safeguard the confidentiality and security of customer information and to ensure proper disposal of information that is no longer needed. We notify our customers when unauthorized disclosure involves sensitive customer information that may be misused.
Consumer Protection Regulations
Our lending activities are subject to a variety of statutes and regulations designed to protect consumers, including the CRA, Home Mortgage Disclosure Act, Fair Credit Reporting Act, Fair Lending, Fair Debt Collection Practices Act, Flood Disaster Protection Act, Equal Credit Opportunity Act, the Fair Housing Act, Truth-in-Lending Act ("TILA"), the Real Estate Settlement Procedures Act ("RESPA"), and the Secure and Fair Enforcement for Mortgage Licensing Act ("SAFE"). Our deposit operations are also subject to laws and regulations that protect consumer rights including Expedited Funds Availability, Truth in Savings, and Electronic Funds Transfers. Other regulatory requirements include: the Unfair, Deceptive or Abusive Acts and Practices ("UDAAP"), Dodd-Frank Act, Right to Financial Privacy and Privacy of Consumer Financial Information. Additional rules govern check writing ability on certain interest earning accounts and prescribe procedures for complying with administrative subpoenas of financial records.
Restriction on Transactions between Bank's Affiliates
Transactions between Bancorp and the Bank are quantitatively and qualitatively restricted under Sections 23A and 23B of the Federal Reserve Act and Federal Reserve Regulation W. Section 23A places restrictions on the Bank's “covered transactions” with Bancorp, including loans and other extensions of credit, investments in the securities of, and purchases of assets from Bancorp. Section 23B requires that certain transactions, including all covered transactions, be on market terms and conditions. Federal Reserve Regulation W combines statutory restrictions on transactions between the Bank and Bancorp with Federal Reserve interpretations in an effort to simplify compliance with Sections 23A and 23B.
Capital Requirements
The Federal Reserve and the FDIC have adopted risk-based capital guidelines for bank holding companies and banks. Bancorp's ratios exceed the required minimum ratios for capital adequacy purposes and the Bank meets the definition for "well capitalized." Undercapitalized depository institutions may be subject to significant restrictions. Banks that are categorized as "critically undercapitalized" under applicable FDIC regulations are subject to dividend restrictions.
In July 2013, the federal banking regulators approved a final rule to implement the revised capital adequacy standards of the Basel Committee on Banking Supervision, commonly called Basel III. The final rule strengthens the definition of regulatory capital, increases risk-based capital requirements, makes selected changes to the calculation of risk-weighted assets, and adjusts the prompt corrective action thresholds. We became subject to the new rule on January 1,
Page-8
2015 and certain provisions of the new rule will be phased in over the period of 2015 through 2019. In August 2017, the federal banking regulators published a final rule, halting the phase-in of certain Basel III capital rules. The rule extends the regulatory capital treatment applicable during 2017 under the regulatory capital rules for certain items. This effectively pauses the full transition to the Basel III treatment of certain assets until the federal banking regulators pursue more extensive rulemaking to simplify the treatment of those assets. We have modeled our ratios under the finalized Basel III rules and we do not expect that we will be required to raise additional capital when the new rules fully phase in. For further information on our risk-based capital positions and the effect of the new Basel III rules, see Note 15 to the Consolidated Financial Statements in ITEM 8 of this report.
The Dodd-Frank Wall Street Reform and Consumer Protection Act
The Dodd-Frank Act, a landmark financial reform bill comprised of voluminous new rules and restrictions on bank operations, included provisions aimed at preventing a repeat of the 2008 financial crisis and a new process for winding down failing, systemically important institutions in a manner as close to a controlled bankruptcy as possible. Among other things, the Dodd-Frank Act established new government oversight responsibilities, enhanced capital adequacy requirements for certain institutions, established consumer protection laws and regulations, and placed limitations on certain banking activities. The current Presidential Administration ("Administration") issued an executive order to consider reforming the Dodd-Frank Act in order to reduce the regulatory burden on U.S. companies, including financial institutions. At this time, no details on the proposed reforms have been published and we are uncertain whether the intended deregulation will have a significant impact on us.
Notice and Approval Requirements Related to Control
Banking laws impose notice, approval and ongoing regulatory requirements on any shareholder or other party that seeks to acquire direct or indirect "control" of an FDIC-insured depository institution. These laws include the BHCA and the Change in Bank Control Act. Among other things, these laws require regulatory filings by a shareholder or other party that seeks to acquire direct or indirect "control" of an FDIC-insured depository institution or bank holding company. The determination whether an investor "controls" a depository institution is based on all of the facts and circumstances surrounding the investment. As a general matter, a party is deemed to control a depository institution or other company if the party owns or controls 25% or more of any class of voting stock. Subject to rebuttal, a party may be presumed to control a depository institution or other company if the investor owns or controls 10% or more of any class of voting stock. Ownership by family members, affiliated parties, or parties acting in concert, is typically aggregated for these purposes. If a party's ownership of the Company were to exceed certain thresholds, the investor could be deemed to "control" the Company for regulatory purposes. This could subject the investor to regulatory filings or other regulatory consequences.
In addition, except under limited circumstances, bank holding companies are prohibited from acquiring, without prior approval: 1) control of any other bank or bank holding company or all or substantially all the assets thereof; or 2) more than 5% of the voting shares of a bank or bank holding company that is not already a subsidiary.
Incentive Compensation
The Dodd-Frank Act required federal bank regulators and the Securities and Exchange Commission ("SEC") to establish joint regulations or guidelines prohibiting incentive-based payment arrangements that encourage inappropriate risks by providing an executive officer, employee, director or principal stockholder with excessive compensation, fees, or benefits or that could lead to material financial loss to the entity. These regulations apply to institutions having at least $1 billion in total assets. In addition, regulators must establish regulations or guidelines requiring enhanced disclosure to regulators of incentive-based compensation arrangements. The agencies have not finalized regulations proposed in April 2011. If the agencies adopt the regulations in the form initially proposed, they will impose limitations on the manner in which we may structure compensation for our executives.
The Federal Reserve will review, as part of the regular, risk-focused examination process, the incentive compensation arrangements of banking organizations, such as us, that are not “large, complex banking organizations.” The Federal Reserve will tailor their reviews for each organization based on the scope and complexity of the organization’s activities and the prevalence of incentive compensation arrangements. The findings of the supervisory initiatives will be included in reports of examination. Deficiencies will be incorporated into the organization’s supervisory ratings, which can affect the organization’s ability to make acquisitions and take other actions. Enforcement actions may be taken against a
Page-9
banking organization if its incentive compensation arrangements, or related risk management control or governance processes, pose a risk to the organization’s safety and soundness and the organization is not taking prompt and effective measures to correct the deficiencies.
Available Information
On our Internet web site, www.bankofmarin.com, we post the following filings as soon as reasonably practical after they are filed with or furnished to the Securities and Exchange Commission: Annual Report to Shareholders, Form 10-K, Proxy Statement for the Annual Meeting of Shareholders, quarterly reports on Form 10-Q, current reports on Form 8-K, and any amendments to those reports filed or furnished pursuant to Section 13(a) or 15(d) of the Securities and Exchange Act of 1934. All such materials on our website are available free of charge. This website address is for information only and is not intended to be an active link, or to incorporate any website information into this document. In addition, copies of our filings are available by requesting them in writing or by phone from:
Corporate Secretary
Bank of Marin Bancorp
504 Redwood Boulevard, Suite 100
Novato, CA 94947
415-763-4523
ITEM 1A RISK FACTORS
We assume and manage a certain degree of risk in order to conduct our business. The material risks and uncertainties that Management believes may affect our business are listed below and in ITEM 7A, Quantitative and Qualitative Disclosure about Market Risk. The list is not exhaustive; additional risks and uncertainties that Management is not aware of, or focused on, or currently deems immaterial may also impair business operations. If any of the following risks, or risks that have not been identified, actually occur, our financial condition, results of operations, and stock trading price could be materially and adversely affected. We manage these risks by promoting sound corporate governance practices, which includes but is not limited to, establishing policies and internal controls, and implementing internal review processes. Before making an investment decision, investors should carefully consider the risks, together with all of the other information included or incorporated by reference in this Annual Report on Form 10-K and our other filings with the SEC. This report is qualified in its entirety by these risk factors.
Earnings are Significantly Influenced by General Business and Economic Conditions
Our success depends, to a certain extent, on local, national and global economic and political conditions. While labor market conditions continue to strengthen, real gross domestic product rose at a solid pace during the second half of 2017, and household spending had been expanding at a moderate pace, there is no assurance that these improvements are sustainable. Economic pressure on consumers and uncertainty regarding the sustainability of the economic improvements may result in changes in consumer and business spending, borrowing and savings habits, which may affect the demand for loans and other products and services we offer. Our success also depends on the general economic conditions of the State of California, particularly the local markets in which we operate within the San Francisco Bay Area. Unlike larger national or other regional banks that are more geographically diversified, we provide banking and financial services to customers in the greater Bay Area. The local economic conditions in these areas have a significant impact on the demand for our products and services as well as the ability of our customers to repay loans, the value of the collateral securing loans and the stability of our deposit funding sources. In addition, oil price volatility, the level of U.S. debt and global economic conditions could destabilize financial markets. Lastly, the pro-growth fiscal policy could cause the inflation rate to rise faster than expected, compelling the Federal Open Market Committee ("FOMC") of the Federal Reserve to raise interest rates rapidly to combat inflation and causing stock market volatility, which we observed in early 2018.
In general, weakness in commercial and residential real estate values and home sale volumes, financial stress on borrowers, increases in unemployment rates1, and customers' inability to pay debt could adversely affect our financial condition and results of operations in the following ways:
____________________________________________________________________________________________
1 According to the California Employment Development Department's December 2017 labor reports, the unemployment rates in Marin, San Francisco, Sonoma, Alameda and Napa counties were 2.3%, 2.4%, 2.8%, 3.0% and 3.6%, respectively, compared to the state of California record low of 4.3%, which was down from 5.2% at the end of 2016.
Page-10
• | Demand for our products and services may decline; |
• | Low cost or non-interest bearing deposits may decrease; |
• | Collateral for our loans, especially real estate, may decline in value; |
• | Loan delinquencies, problem assets and foreclosures may increase as a result of a deterioration of our borrowers' creditworthiness; and |
• | Investment securities may become impaired. |
Interest Rate Risk is Inherent in Our Business
Our earnings are largely dependent upon our net interest income, which is the difference between interest income earned on interest-earning assets, such as loans and securities, and interest expense paid on interest-bearing liabilities, such as deposits and borrowed funds. Interest rates are sensitive to many factors outside of our control, including general economic conditions and the policies of various governmental and regulatory agencies and, in particular, the FOMC, which regulates the supply of money and credit in the United States. Changes in monetary policy, including changes in interest rates, can influence not only the interest we receive on loans and securities and interest we pay on deposits and borrowings, but can also affect (i) our ability to originate loans and obtain deposits, (ii) the fair value of our financial assets and liabilities, and (iii) the average duration of our securities and loan portfolios. Our portfolio of loans and securities will generally decline in value if market interest rates increase, and increase in value if market interest rates decline. In addition, our loans and callable mortgage-backed securities are also subject to prepayment risk when interest rates fall, and the borrowers' credit risk may increase in rising rate environments.
The FOMC increased the federal funds target rate by 25 basis points (basis points are equal to one hundredth of a percentage point) each in March, June and December 2017 to a current range of 1.25% to 1.50%. While there was no interest rate action in the first meeting of 2018, the FOMC indicated that it may consider further gradual adjustments in 2018 in light of strong labor markets and expectations that inflation will reach the targeted two percent inflation rate over the medium term. Additionally, other factors such as productivity, oil prices, the strength of the U.S. dollar, and global demand play a role in the FOMC's consideration of future rate hikes. Our net interest income is vulnerable to a falling or flat rate environment and will benefit if the prevailing market interest rates increase.
However, a rise in index rates leads to lower debt service coverage of variable rate loans if the borrower's operating cash flow does not also rise. This creates a paradox of an improving economy (leading to higher interest rates) with increased credit risk as short-term rates move up faster than the cash flow or income of the borrowers. Higher interest rates may also depress loan demand, making it more difficult for us to grow loans.
See the sections captioned “Net Interest Income” in Management's Discussion and Analysis of Financial Condition and Results of Operations in ITEM 7 and Quantitative and Qualitative Disclosures about Market Risk in ITEM 7A of this report for further discussion related to management of interest rate risk.
Banks and Bank Holding Companies are Subject to Extensive Government Regulation and Supervision
Bancorp and the Bank are subject to extensive federal and state governmental supervision, regulation and control. Holding company regulations affect the range of activities in which Bancorp is engaged. Banking regulations affect the Bank's lending practices, capital structure, investment practices and dividend policy, and compliance costs among other things. Future legislative changes or interpretations may also alter the structure and competitive relationship among financial institutions.
Disruptions in the financial marketplace have led to additional regulations in an attempt to reform financial markets. This reform included, among other things, regulations over consumer financial products, capital adequacy, and the creation of a regime for regulating systemic risk across all types of financial service firms. Further restrictions on financial service companies may adversely affect our results of operations and financial condition, as well as increase our compliance risk. While regulations for higher capital requirements have been postponed and there are discussions to deregulate further the financial industry under the current Administration, the nature and extent of future legislative and regulatory changes from both the federal and California legislatures affecting us are unpredictable at this time.
Compliance risk is the current and prospective risk to earnings or capital arising from violations of, or non-conformance with, laws, rules, regulations, prescribed practices, internal policies and procedures, or ethical standards set forth by regulators. Compliance risk also arises in situations where the laws or rules governing certain bank products or activities
Page-11
of our clients may be ambiguous or untested. This risk exposes Bancorp and the Bank to potential fines, civil money penalties, payment of damages and the voiding of contracts. Compliance risk can lead to diminished reputation, reduced franchise value, limited business opportunities, reduced expansion potential and an inability to enforce contracts.
For further information on supervision and regulation, see the section captioned “Supervision and Regulation” in ITEM 1 above.
Intense Competition with Other Financial Institutions to Attract and Retain Banking Customers
We are facing significant competition for customers from other banks and financial institutions located in the markets that we serve. We compete with commercial banks, saving institutions, credit unions, non-bank financial services companies, including financial technology firms, and other financial institutions operating within or near our service areas. Some of our non-bank competitors and peer-to-peer lenders may not be subject to the same extensive regulations as we are, giving them greater flexibility in competing for business. We anticipate intense competition will continue for the coming year due to the consolidation of many financial institutions and more changes in legislature, regulation and technology. National and regional banks much larger than our size have entered our market through acquisitions and they may be able to benefit from economies of scale through their wider branch networks, more prominent national advertising campaigns, lower cost of borrowing, capital market access and sophisticated technology infrastructures. Further, intense competition for creditworthy borrowers could lead to pressure for loan rate concessions and affect our ability to generate profitable loans.
Going forward, we may see continued competition in the industry as competitors seek to expand market share in our core markets. Further, our customers may withdraw deposits to pursue alternative investment opportunities in the recent bullish equity market. Technology and other changes have made it more convenient for bank customers to transfer funds into alternative investments or other deposit accounts such as online virtual banks and non-bank service providers. Efforts and initiatives we may undertake to retain and increase deposits, including deposit pricing, can increase our costs. Based on our current strong liquidity position, our adjustment to deposit pricing may lag the market in a rising interest rate environment. If our customers move money into higher yielding deposits or alternative investments, we may lose a relatively inexpensive source of funds, thus increasing our funding costs through more expensive wholesale borrowings.
Activities of Our Large Borrowers and Depositors May Cause Unexpected Volatilities in Our Loan and Deposit Balances, as well as Net Interest Margin
Rising real estate values in the Bay Area market have motivated some of our borrowers to sell real estate that collateralized our loans, contributing to loan payoff activity. We experienced loan payoffs of $133 million and $158 million in 2017 and 2016, respectively. These payoffs approximated nine and eleven percent annual turnover of our loan portfolio in 2017 and 2016, respectively. Payoffs of loans originated during a higher interest rate environment may be replaced by new loans with lower interest rates, causing downward pressure on our net interest margin.
In addition, the top ten depositor relationships account for approximately nine percent of our total deposit balances. The business models and cash cycles of some of our large commercial depositors may also cause short-term volatility in their deposit balances held with us. As our customers' businesses grow, the dollar value of their daily activities may also grow leading to larger fluctuations in daily balances. Any long-term decline in deposit funding would adversely affect our liquidity. For additional information on our management of deposit volatility, refer to the Liquidity section of ITEM 7, Management's Discussion and Analysis, of this report.
Negative Conditions Affecting Real Estate May Harm Our Business and Our Commercial Real Estate ("CRE") Concentration May Heighten Such Risk
Concentration of our lending activities in the California real estate sector could negatively affect our results of operations if adverse changes in our lending area occur. Although we do not offer traditional first mortgages, nor have sub-prime or Alt-A residential loans or significant amounts of securities backed by such loans in the portfolio, we are not immune to volatility in those markets. Approximately 87% of our loans were secured by real estate at December 31, 2017, of which 70% were secured by CRE and the remaining 17% by residential real estate. Real estate valuations are influenced by demand, and demand is driven by economic factors such as employment rates and interest rates.
Page-12
Loans secured by CRE include those secured by office buildings, owner-user office/warehouses, mixed-use residential/commercial properties and retail properties. There can be no assurance that the companies or properties securing our loans will generate sufficient cash flows to allow borrowers to make full and timely loan payments to us. In the event of default, the collateral value may not cover the outstanding amount due to us, especially during real estate market downturns.
Rising CRE lending concentrations may expose institutions to unanticipated earnings and capital volatility in the event of adverse changes in the CRE market. The FDIC applies two criteria for identifying institutions that are potentially exposed to significant CRE concentration risk. The first criterion looks at whether non-owner occupied commercial real estate loans, as defined by the guidelines, exceed 300% of the Bank's total capital. As of December 31, 2017, our non-owner occupied CRE loans represented 317% of the Bank's capital, which declined from 332% as of December 31, 2016. The second criterion measures whether the non-owner occupied CRE growth rate during the prior thirty six months exceeds 50%. Since December 31, 2014, our non-owner occupied CRE portfolio has grown by 22%, below the 50% growth rate per the regulatory guideline. We maintain heightened review and analyses of our concentrations and have regular conversations with regulators to avoid unexpected regulatory risk.
Severe Weather, Natural Disasters or Other Climate Change Related Matters Could Significantly Affect Our Business
Our primary market is located in an earthquake-prone zone in northern California, which is also subject to other weather or disasters, such as severe rainstorms, wildfire, drought or flood. These events could interrupt our business operations unexpectedly. Climate-related physical changes and hazards could also pose credit risks for us. For example, our borrowers may have collateral properties or operations located in coastal areas at risk to rising sea levels and erosion or subject to the risk of drought in California. The properties pledged as collateral on our loan portfolio could also be damaged by tsunamis, landslides, floods, earthquakes or wildfires and thereby the recoverability of loans could be impaired. A number of factors can affect credit losses, including the extent of damage to the collateral, the extent of damage not covered by insurance, the extent to which unemployment and other economic conditions caused by the natural disaster adversely affect the ability of borrowers to repay their loans, and the cost of collection and foreclosure to us. Lastly, there could be increased insurance premiums and deductibles, or a decrease in the availability of coverage, due to severe weather-related losses. The ultimate outcome on our business of a natural disaster, whether or not caused by climate change, is difficult to predict.
In October 2017, much of the North Bay region of Northern California was struck by widespread and destructive wildfires. Fortunately, there was no damage to bank facilities and no significant impairment to services. Management has assessed the impact of the fires on our loan and investment portfolios; including mapping client addresses and locations of municipal bond issuers to areas affected by the fires and evaluating any known damage to collateral and businesses. Based on our assessment, the loss to properties and businesses located in the affected areas that are pledged as collateral to our loans or bonds is minimal. However, the long-term impact to the Napa and Sonoma regional economies is uncertain. Management is monitoring the situation and will continue to respond to the needs of customers and employees during the rebuilding process.
We are Subject to Significant Credit Risk and Loan Losses May Exceed Our Allowance for Loan Losses in the Future
We maintain an allowance for loan losses, which is a reserve established through provisions for loan losses charged to expense, that represents Management's best estimate of probable losses that may be incurred within the existing portfolio of loans (the "incurred loss model"). The level of the allowance reflects Management's continuing evaluation of specific credit risks, loan loss experience, current loan portfolio quality and present economic, political and regulatory conditions. The determination of the appropriate level of the allowance for loan losses inherently involves a high degree of subjectivity and requires us to make significant estimates of current credit risks and future trends, all of which may undergo material changes. Further, we generally rely on appraisals of the collateral or comparable sales data to determine the level of specific reserve and/or the charge-off amount on certain collateral dependent loans. Inaccurate assumptions in the appraisals or an inappropriate choice of the valuation techniques may lead to an inadequate level of specific reserve or charge-offs.
Changes in economic conditions affecting borrowers, new information regarding existing loans and their collateral, identification of additional problem loans, and other factors may require an increase in our allowance for loan losses.
Page-13
In addition, bank regulatory agencies periodically review our allowance for loan losses and may require an increase in the provision for loan losses or the recognition of further loan charge-offs. If charge-offs in future periods exceed the allowance for loan losses or cash flows from acquired loans do not perform as expected, we will need to record additional provision for loan losses.
In June 2016, the FASB issued ASU No. 2016-13, Financial Instruments - Credit Losses (Topic 326): Measurement of Credit Losses on Financial Instruments. Under the new guidance, entities will be required to measure expected credit losses by utilizing forward-looking information to assess an entity's allowance for credit losses. The measurement of expected credit losses will be based on historical experience, current conditions and reasonable and supportable forecasts that affect the collectability of a credit over its remaining life. In addition, the ASU amends the accounting for potential credit losses on available-for-sale debt securities and purchased financial assets with credit deterioration. ASU 2016-13 is effective for fiscal years beginning after December 15, 2019, including interim periods within those fiscal years. Early adoption is permitted for fiscal years beginning after December 15, 2018, including interim periods within those fiscal years. We have formed an internal Current Expected Credit Loss ("CECL") committee and are working with our third party vendor to determine the appropriate methodologies and resources to utilize in preparation for transition to the new accounting standards. Refer to Note 1 to the Consolidated Financial Statements in ITEM 8 for further discussion.
Non-performing Assets Take Significant Time to Resolve and Adversely Affect Results of Operations and Financial Condition.
While our non-performing assets are currently at a low level, there can be no assurance that we will not experience increases in non-performing assets in the future. Generally, interest income is not recognized on non-performing loans and the administrative costs on these loans are higher than performing loans. We might incur losses if the creditworthiness of our borrowers deteriorates to a point when we need to take collateral in foreclosures and similar proceedings, resulting in possible mark down of the loans to the fair value of the collateral. While we have managed our problem assets through workouts, restructurings and other proactive credit management practices that mitigate credit losses, decreases in the value of the underlying collateral, or deterioration in borrowers' performance or financial conditions, whether or not due to economic and market conditions beyond our control, could adversely affect our business, results of operations and financial condition. In addition, the resolution of non-performing assets can distract Management from other responsibilities.
Securities May Lose Value due to Credit Quality of the Issuers
We invest in significant portions of investment securities issued by government-sponsored enterprises ("GSE"), such as Federal Home Loan Bank ("FHLB"), Federal National Mortgage Association (“FNMA”), Federal Home Loan Mortgage Corporation ("FHLMC"), and Federal Farm Credit Bank. We also hold mortgage-backed securities (“MBS”) securities issued by FNMA and FHLMC. While we consider these securities to have low credit risk as they carry the backing of the U.S. Government, they are not direct obligations of the U.S. Government. GSE debt is sponsored but not guaranteed by the federal government, whereas government agencies such as Government National Mortgage Association ("GNMA") are divisions of the government whose securities are backed by the full faith and credit of the United States.
Since 2008, both FNMA and FHLMC have been under a U.S. Government conservatorship. As a result, securities issued by FNMA and FHLMC have benefited from this government support. However, housing finance reform may be introduced to end GSE status, place FNMA and FHLMC into receivership and replace them with multiple mortgage guarantors, which could impact the fair value of our securities issued or guaranteed by these entities. In October 2017, the FOMC initiated the balance sheet normalization program, in which it intends to reduce the Federal Reserve's holdings of Treasury and agency securities by gradually decreasing its reinvestment of the principal payments it receives from securities. If the U.S. Government stops reinvesting or starts selling their holdings in U.S. Treasury or MBS issued by the GSE; if the government support is phased-out or completely withdrawn; or if either FNMA or FHLMC comes under financial stress or suffers creditworthiness deterioration, the value of our investments may be significantly impacted.
We also invest in tax exempt obligations of state and political subdivisions whose value have been affected by tax rate reductions from the Tax Cuts and Jobs Act of 2017. Additionally, while we generally seek to minimize our exposure by diversifying the geographic location of our portfolio and investing in investment grade securities, there is no guarantee that the issuers will remain financially sound or continue their payments on these debentures.
Page-14
Unexpected Early Termination of Interest Rate Swap Agreements May Affect Earnings
We have entered into interest-rate swap agreements, primarily as an asset/liability risk management tool, in order to mitigate the changes in the fair value of specified long-term fixed-rate loans and firm commitments to enter into long-term fixed-rate loans caused by changes in interest rates. These hedges allow us to offer long-term, fixed-rate loans to customers without assuming the interest rate risk of a long-term asset by swapping our fixed-rate interest stream for a floating-rate interest stream. In the event of default by the borrowers on our hedged loans, we may have to terminate these designated interest-rate swap agreements early, resulting in prepayment penalties charged by our counterparties and negatively affect our earnings.
Growth Strategy or Potential Future Acquisitions May Produce Unfavorable Outcomes
We seek to expand our franchise safely and consistently. A successful growth strategy requires us to manage multiple aspects of the business simultaneously, such as following adequate loan underwriting standards, balancing loan and deposit growth without increasing interest rate risk or compressing our net interest margin, maintaining sufficient capital, and recruiting, training and retaining qualified professionals.
Our strategic plan also includes merger and acquisition possibilities that either enhance our market presence or have potential for improved profitability through financial management, economies of scale or expanded services, such as the Bank of Napa acquisition in 2017. We may incur significant acquisition related expenses either during the due diligence phase of acquisition targets or during integration of the acquirees. These expenses have and may continue to negatively impact our earnings prior to realizing the benefits of acquisitions. We may also be exposed to difficulties in combining the operations of acquired institutions into our own operations, which may prevent us from achieving the expected benefits from our acquisition activities. Our earnings, financial condition and prospects after the merger may affect our stock price and will depend in part on our ability to integrate the operations and management of the acquired institution while continuing to implement other aspects of our business plan. Inherent uncertainties exist in integrating the operations of an acquired institution and there is no assurance that we will be able to do so successfully. Among the issues that we could face are:
• | unexpected problems with operations, personnel, technology or credit; |
• | loss of customers and employees of the acquiree; |
• | difficulty in working with the acquiree's employees and customers; |
• | the assimilation of the acquiree's operations, culture and personnel; |
• | instituting and maintaining uniform standards, controls, procedures and policies; and |
• | litigation risk not discovered during the due diligence period. |
Undiscovered factors as a result of an acquisition could bring liabilities against us, our management and the management of the institutions we acquire. These factors could contribute to our not achieving the expected benefits from our acquisitions within desired time frames, if at all. Further, although we generally anticipate cost savings from acquisitions, we may not be able to fully realize those savings. Any cost savings may be offset by losses in revenues or other charges to earnings.
We May Not Be Able to Attract and Retain Key Employees
Our success depends, in large part, on our ability to attract and retain key people. Competition for the best people in most activities engaged by us has been intense, especially in light of the recent improvement in the job market, and we may not be able to hire skilled people or retain them. We do not have non-compete agreements with any of our senior officers. The unexpected loss of key personnel could have an unfavorable effect on our business because of the skills, knowledge of our market, years of industry experience and difficulty of promptly finding qualified replacement personnel.
Accounting Estimates and Risk Management Processes Rely on Analytical and Forecasting Models
The processes we use to estimate probable loan losses and to measure the fair value of financial instruments, as well as the processes used to estimate the effects of changing interest rates and other market measures on our financial condition and results of operations, depends upon the use of analytical and forecasting models. These models reflect assumptions that may not be accurate, particularly in times of market stress or other unforeseen circumstances. Even
Page-15
if these assumptions are adequate, the models may prove to be inadequate or inaccurate because of other flaws in their design or their implementation. If the models we use for interest rate risk and asset-liability management are inadequate, we may incur increased or unexpected losses upon changes in market interest rates or other market measures. If the models we use for determining our probable loan losses are inadequate, the allowance for loan losses may not be sufficient to support future charge-offs. If the models we use to measure the fair value of financial instruments are inadequate, the fair value of such financial instruments may fluctuate unexpectedly or may not accurately reflect what we could realize upon sale or settlement of such financial instruments. Any such failure in our analytical or forecasting models could have a material adverse effect on our business, financial condition and results of operations.
The Value of Goodwill and Other Intangible Assets May Decline in the Future
As of December 31, 2017, we had goodwill totaling $30.1 million and a core deposit intangible asset totaling $6.5 million from business acquisitions. A significant decline in expected future cash flows, a significant adverse change in the business climate, slower growth rates or a significant and sustained decline in the price of our common stock could necessitate taking charges in the future related to the impairment of goodwill or other intangible assets. If we were to conclude that a future write-down of goodwill or other intangible assets is necessary, we would record the appropriate charge, which could have a material adverse effect on our business, financial condition and results of operations.
We May Take Filing Positions or Follow Tax Strategies That May Be Subject to Challenge
We provide for current and deferred tax provision in our consolidated financial statements based on our results of operations, business activities and business combinations, legal structure and federal and state legislation and regulations, which is still evolving from the December 2017 enactment of the Tax Cuts and Jobs Act of 2017. We may take filing positions or follow tax strategies that are subject to interpretation of tax statutes. Our net income may be reduced if a federal, state or local authority were to assess charges for taxes that have not been provided for in our consolidated financial statements. Taxing authorities could change applicable tax laws and interpretations, challenge filing positions or assess new taxes and interest charges. If taxing authorities take any of these actions, our business, results of operations or financial condition could be significantly affected.
The Financial Services Industry is Undergoing Rapid Technological Changes and, As a Result, We Have a Continuing Need to Stay Current with Those Changes to Compete Effectively and Increase Our Efficiencies. We May Not Have the Resources to Implement New Technology to Stay Current with These Changes
The financial services industry is undergoing technological changes with frequent introductions of new technology-driven products and services. In addition to providing better client service, the effective use of technology increases efficiency and reduces operational costs. Our future success will depend in part upon our ability to use technology to provide products and services that will satisfy client demands securely and cost-effectively. In connection with implementing new technology enhancements and/or products, we may experience operational challenges (e.g. human error, system error, incompatibility) which could result in us not fully realizing the anticipated benefits from such new technology or require us to incur significant costs to remedy any such challenges in a timely manner.
Risks Associated with Cyber Security Could Negatively Affect Our Earnings and Reputation
Our business requires the secure management of sensitive client and bank information. We work diligently to implement security measures that intend to make our communications and information systems safe to conduct business. Cyber threats such as social engineering, ransomware, and phishing emails are more prevalent now than ever before. These incidents include intentional and unintentional events that may present threats designed to disrupt operations, corrupt data, release sensitive information or cause denial-of-service attacks. A cyber security breach of systems operated by the Bank, merchants, vendors, customers, or externally publicized breaches of other financial institutions may significantly harm our reputation, result in a loss of customer business, subject us to regulatory scrutiny, or expose us to civil litigation and financial liability. While we have systems and procedures designed to prevent security breaches, we cannot be certain that advances in criminal capabilities, physical system or network break-ins or inappropriate access will not compromise or breach the technology protecting our networks or proprietary client information.
Page-16
We Rely on Third-Party Vendors for Important Aspects of Our Operation
We depend on the accuracy and completeness of information and systems provided by certain key vendors, including but not limited to data processing, payroll processing, technology support, investment safekeeping and accounting. For example, we outsource core processing to Fidelity Information Services ("FIS") and wire processing to Finastra, which are leading financial services solution providers that allow us access to competitive technology offerings without having to invest in their development. Our ability to operate, as well as our financial condition and results of operations, could be negatively affected in the event of an interruption of an information system, an undetected error, a cyber-breach, or in the event of a natural disaster whereby certain vendors are unable to maintain business continuity.
Failure of Correspondent Banks May Affect Liquidity
Financial services institutions are highly interrelated because of clearing and exchange, counterparty, and other business relationships. In particular, the financial services industry in general was materially and adversely affected by the recent credit crisis, including the failure and consolidation of banks in the industry in recent years. While we regularly monitor the financial health of our correspondent banks and we have diverse sources of liquidity, should any one of our correspondent banks become financially impaired, our available credit may decline and/or they may be unable to honor their commitments.
Deterioration of Credit Quality or Insolvency of Insurance Companies May Impede Our Ability to Recover Losses
We have property, casualty and financial institution risk coverage underwritten by several insurance companies, who may not avoid insolvency risk inherent in the insurance industry. In addition, some of our investments in obligations of state and political subdivisions are insured by insurance companies. While we closely monitor the credit ratings of our insurers and the insurers of our municipal securities and we are poised to make quick changes if needed, we cannot predict an unexpected inability to honor commitments. We also invest in bank-owned life insurance policies on certain members of Management, which may lose value in the event of a carrier's insolvency. In the event that a bank-owned life insurance policy carrier's credit ratings fall below investment grade, we may exchange policies to other carriers at a cost charged by the original carrier, or we may terminate the policies, which may result in adverse tax consequences.
Our loan portfolio is secured primarily by properties located in earthquake or fire-prone zones. In the event of a disaster that causes pervasive damage to the region in which we operate, not only the Bank, but also the loan collateral may suffer losses not recoverable by insurance.
Bancorp Relies on Dividends from the Bank to Pay Cash Dividends to Shareholders
Bancorp is a separate legal entity from its subsidiary, the Bank. Bancorp receives substantially all of its cash stream from the Bank in the form of dividends, which is Bancorp's principal source of funds to pay cash dividends to Bancorp's common shareholders, service subordinated debt, and cover operational expenses of the holding company. Various federal and state laws and regulations limit the amount of dividends that the Bank may pay to Bancorp. In the event that the Bank is unable to pay dividends to Bancorp, Bancorp may not be able to pay dividends to its shareholders or pay interest on the subordinated debentures. As a result, it could have an adverse effect on Bancorp's stock price and investment value.
Federal law would prohibit capital distributions from the Bank, with limited exceptions, if the Bank were categorized as "undercapitalized" under applicable Federal Reserve or FDIC regulations. In addition, as a California bank, Bank of Marin is subject to state law restrictions on the payment of dividends. For further information on the distribution limit from the Bank to Bancorp, see the section captioned “Bank Regulation” in ITEM 1 above and “Dividends” in Note 8 to the Consolidated Financial Statements in ITEM 8 of this report.
The Trading Volume of Bancorp's Common Stock is Less than That of Other, Larger Financial Services Companies
Our common stock is listed on the NASDAQ Capital Market exchange. Our trading volume is less than that of nationwide or larger regional financial institutions. A public trading market having the desired characteristics of depth, liquidity
Page-17
and orderliness depends on the presence of willing buyers and sellers of common stock at any given time. This presence depends on the individual decisions of investors and general economic and market conditions over which we have no control. Given the low trading volume of our common stock, significant trades of our stock in a given time, or the expectations of these trades, could cause volatility in the stock price.
We may need to Raise Additional Capital in the Future, and if we Fail to Maintain Sufficient Capital, Whether due to Losses, an Inability to Raise Additional Capital or Otherwise, our Financial Condition, Liquidity and Results of Operations, as well as our Ability to Maintain Regulatory Compliance, Could be Adversely Affected
We face significant capital and other regulatory requirements as a financial institution. We may need to raise additional capital in the future to provide us with sufficient capital resources and liquidity to meet our commitments and business needs, which could include the possibility of financing acquisitions. In addition, Bancorp, on a consolidated basis, and the Bank, on a stand-alone basis, must meet certain regulatory capital requirements and maintain sufficient liquidity. Importantly, as discussed below, regulatory capital requirements could increase from current levels, which could require us to raise additional capital or contract our operations. Our ability to raise additional capital depends on conditions in the capital markets, economic conditions and a number of other factors, including investor perceptions regarding the banking industry, market conditions and governmental activities, and on our financial condition and performance. Accordingly, we cannot assure that we will be able to raise additional capital if needed or on terms acceptable to us. If we fail to maintain capital to meet regulatory requirements, our liquidity, business, financial condition and results of operations could be materially and adversely affected.
We may be Subject to more Stringent Capital Requirements in the Future
We are subject to regulatory requirements specifying minimum amounts and types of capital that we must maintain. From time to time, the regulators change these regulatory capital adequacy guidelines. If we fail to meet these minimum capital guidelines and other regulatory requirements, Bancorp or the Bank may be restricted in the types of activities we may conduct and we may be prohibited from taking certain capital actions, such as paying dividends and repurchasing or redeeming capital securities. If we become subject to annual stress testing requirements, our stress test results may have the effect of requiring us to comply with even greater capital requirements. While we currently meet the requirements of the Basel III-based capital rules on a fully implemented basis, we may eventually fail to do so. In addition, these requirements could negatively affect our ability to lend, grow deposit balances, make acquisitions or make capital distributions in the form of dividends or share repurchases. Higher capital levels could also lower our return on equity.
We may be Subject to Environmental Liabilities in Connection with the Foreclosure on Real Estate Assets Securing our Loan Portfolio
Hazardous or toxic substances or other environmental hazards may be located on the properties that secure our loans. If we acquire such properties as a result of foreclosure or otherwise, we could become subject to various environmental liabilities. For example, we could be held liable for the cost of cleaning up or otherwise addressing contamination at or from these properties. We could also be held liable to a governmental entity or third party for property damage, personal injury or other claims relating to any environmental contamination at or from these properties. In addition, we own and operate certain properties that may be subject to similar environmental liability risks. Although we have policies and procedures that are designed to mitigate against certain environmental risks, we may not detect all environmental hazards associated with these properties. If we ever became subject to significant environmental liabilities, our business, financial condition and results of operations could be adversely affected.
The Small to Medium-sized Businesses that we Lend to may have Fewer Resources to Weather Adverse Business Developments, which may Impair a Borrower's Ability to Repay a Loan, and such Impairment could Adversely Affect our Results of Operations and Financial Condition
We focus our business development and marketing strategy primarily on small to medium-sized businesses. Small to medium-sized businesses frequently have smaller market shares than their competition, may be more vulnerable to economic downturns, often need substantial additional capital to expand or compete and may experience substantial volatility in operating results, any of which may impair a borrower's ability to repay a loan. In addition, the success of a small and medium-sized business often depends on the management talents and efforts of one or two people or a small group of people, and the death, disability or resignation of one or more of these people could adversely affect
Page-18
the business and its ability to repay its loan. If general economic conditions negatively affect the California markets in which we operate and small to medium-sized businesses are adversely affected or our borrowers are otherwise affected by adverse business developments, our business, financial condition and results of operations may be negatively affected.
A Lack of Liquidity could Adversely Affect our Operations and Jeopardize our Business, Financial Condition and Results of Operations
Liquidity is essential to our business. We rely on our ability to generate deposits and effectively manage the repayment and maturity schedules of our loans and investment securities, respectively, to ensure that we have adequate liquidity to fund our operations. An inability to raise funds through deposits, borrowings, securities sales, Federal Home Loan Bank advances, the sale of loans and other sources could have a substantial negative effect on our liquidity. Our most important source of funds consists of deposits. Deposit balances can decrease when customers perceive alternative investments as providing a better risk/return tradeoff. If customers move money out of bank deposits and into other investments, then we would lose a relatively low-cost source of funds, increasing our funding costs and reducing our net interest income and net income.
Other primary sources of funds consist of cash flows from operations, investment maturities and sales, loan repayments, and proceeds from the issuance and sale of any equity and debt securities to investors. Additional liquidity is provided by the ability to borrow from the Federal Reserve Bank of San Francisco and the Federal Home Loan Bank and our ability to raise brokered deposits. We also may borrow funds from third-party lenders, such as other financial institutions. Our access to funding sources in amounts adequate to finance or capitalize our activities, or on terms that are acceptable to us, could be impaired by factors that affect us directly or the bank or non-bank financial services industries or the economy in general, such as disruptions in the financial markets or negative views and expectations about the prospects for the bank or non-bank financial services industries.
Based on experience, we believe that our deposit accounts are relatively stable sources of funds. If we increase interest rates paid to retain deposits, our earnings may be adversely affected, which could have an adverse effect on our business, financial condition and results of operations.
Any decline in available funding could adversely affect our ability to originate loans, invest in securities, meet our expenses, and pay dividends to our shareholders or fulfill obligations such as repaying our borrowings or meeting deposit withdrawal demands, any of which could have a material adverse impact on our liquidity, business, financial condition and results of operations.
Changes to, or Elimination of, London Interbank Offered Rate (“LIBOR”) Could Adversely Affect our Financial Instruments with Interest Rates Currently Indexed to LIBOR
Regulators and law-enforcement agencies from a number of governments, including entities in the United States, Japan, Canada and the United Kingdom, have been conducting civil and criminal investigations into whether the banks that contributed to the British Bankers’ Association (the “BBA”) in connection with the calculation of daily LIBOR may have underreported or otherwise manipulated or attempted to manipulate LIBOR. Based on a review conducted by the Financial Conduct Authority of the United Kingdom (the “FCA”) and a consultation conducted by the European Commission, proposals have been made for governance and institutional reform, regulation, technical changes and contingency planning. In particular: (a) new legislation has been enacted in the United Kingdom pursuant to which LIBOR submissions and administration are now “regulated activities” and manipulation of LIBOR has been brought within the scope of the market abuse regime; (b) legislation has been proposed which if implemented would, among other things, alter the manner in which LIBOR is determined, compel more banks to provide LIBOR submissions, and require these submissions to be based on actual transaction data; and (c) LIBOR rates for certain currencies and maturities are no longer published daily. In addition, pursuant to authorization from the FCA, the ICE Benchmark Administration Limited (the “IBA”) took over the administration of LIBOR from the BBA on February 1, 2014.
In a speech on July 27, 2017, Andrew Bailey, the Chief Executive of the FCA, announced the FCA’s intention to cease sustaining LIBOR after 2021. The FCA has statutory powers to require panel banks to contribute to LIBOR where necessary. The FCA has decided not to ask, or to require, that panel banks continue to submit contributions to LIBOR beyond the end of 2021. The FCA has indicated that it expects that the current panel banks will voluntarily sustain LIBOR until the end of 2021. The FCA’s intention is that after 2021, it will no longer be necessary for the FCA to ask,
Page-19
or to require, banks to submit contributions to LIBOR. The FCA does not intend to sustain LIBOR through using its influence or legal powers beyond that date. While it is possible that the IBA and the panel banks could continue to produce LIBOR on the current basis after 2021, there is no assurance that LIBOR will survive in its current form, or at all.
We have floating rate loans and investment securities, interest rate swap agreements and subordinated debentures whose interest rates are indexed to LIBOR. We cannot predict the effect of the FCA’s decision not to sustain LIBOR or, if changes are ultimately made to LIBOR, the effect of those changes. In addition, we cannot predict what alternative index would be chosen, should this occur. If LIBOR in its current form does not survive or if an alternative index is chosen, the market value and/or liquidity of our financial instruments currently indexed to LIBOR could be adversely affected.
ITEM 1B UNRESOLVED STAFF COMMENTS
None
ITEM 2 PROPERTIES
We lease our corporate headquarters building in Novato, California, which houses substantial loan production, operations and administration. We also lease other branch or office facilities within our primary market areas in the cities of Corte Madera, San Rafael, Novato, Sausalito, Mill Valley, Tiburon, Greenbrae, Petaluma, Santa Rosa, Healdsburg, Sonoma, Napa, San Francisco, Alameda and Oakland. We consider our properties to be suitable and adequate for our needs. For additional information on properties, see Notes 4 and 12 to the Consolidated Financial Statements included in ITEM 8 of this report.
ITEM 3 LEGAL PROCEEDINGS
We may be party to legal actions that arise from time to time as part of the normal course of our business. We believe, after consultation with legal counsel, that we have meritorious defenses in these actions, and that litigation contingent liability, if any, will not have a material adverse effect on our financial position, results of operations, or cash flows.
We are responsible for our proportionate share of certain litigation indemnifications provided to Visa U.S.A. by its member banks in connection with lawsuits related to anti-trust charges and interchange fees. For further details, see Note 12 to the Consolidated Financial Statements in ITEM 8 of this report.
ITEM 4 MINE SAFETY DISCLOSURES
Not applicable.
Page-20
PART II
ITEM 5 MARKET FOR REGISTRANT'S COMMON EQUITY, RELATED STOCKHOLDER MATTERS AND ISSUER PURCHASES OF EQUITY SECURITIES
Bancorp common stock trades on the NASDAQ Capital Market under the symbol BMRC. At February 28, 2018, 6,970,446 shares of Bancorp's common stock, no par value, were outstanding and held by approximately 2,900 holders of record and beneficial owners. The following table sets forth, for the periods indicated, the range of high and low intra-day sales prices of Bancorp's common stock.
Calendar | 2017 | 2016 | ||||||||||
Quarter | High | Low | High | Low | ||||||||
1st Quarter | $ | 72.50 | $ | 63.25 | $ | 54.50 | $ | 45.65 | ||||
2nd Quarter | $ | 69.95 | $ | 59.05 | $ | 51.61 | $ | 47.16 | ||||
3rd Quarter | $ | 70.75 | $ | 60.95 | $ | 52.47 | $ | 47.25 | ||||
4th Quarter | $ | 77.90 | $ | 63.90 | $ | 75.05 | $ | 49.25 | ||||
The table below shows cash dividends paid to common shareholders on a quarterly basis in the last two fiscal years.
Calendar | 2017 | 2016 | ||||||||||
Quarter | Per Share | Dollars | Per Share | Dollars | ||||||||
1st Quarter | $ | 0.27 | $ | 1,655 | $ | 0.25 | $ | 1,518 | ||||
2nd Quarter | $ | 0.27 | $ | 1,661 | $ | 0.25 | $ | 1,526 | ||||
3rd Quarter | $ | 0.29 | $ | 1,788 | $ | 0.25 | $ | 1,528 | ||||
4th Quarter | $ | 0.29 | $ | 1,792 | $ | 0.27 | $ | 1,651 | ||||
$ | 1.12 | $ | 6,896 | $ | 1.02 | $ | 6,223 | |||||
On January 19, 2018, the Board of Directors declared a cash dividend of $0.29 per share, payable on February 9, 2018 to shareholders of record at the close of business on February 2, 2018. For additional information regarding our ability to pay dividends, see discussion in Note 8 to the Consolidated Financial Statements, under the heading “Dividends,” in ITEM 8 of this report.
There were no purchases made by or on behalf of Bancorp or any “affiliated purchaser” (as defined in Rule 10b-18(a)(3) under the Securities Exchange Act of 1934) of the Bancorp's common stock during the fourth quarter of 2017.
On July 6, 2017, Bancorp executed a shareholder rights agreement (“Rights Agreement”), which expires July 23, 2022, designed to discourage takeovers that involve abusive tactics or do not provide fair value to shareholders. For further information, see Note 8 to the Consolidated Financial Statements, under the heading “Preferred Stock and Shareholder Rights Plan” in ITEM 8 of this report.
Securities Authorized for Issuance under Equity Compensation Plans
The following table summarizes information as of December 31, 2017, with respect to equity compensation plans. All plans have been approved by the shareholders.
Shares to be issued upon exercise of outstanding options1 | Weighted average exercise price of outstanding options | Shares remaining available for future issuance 2 | ||||
Equity compensation plans approved by shareholders | 258,968 | $ | 40.84 | 219,414 | ||
1 Represents shares of common stock issuable upon exercise of outstanding options under the Bank of Marin Bancorp 2017 Equity Plan and 2007 Equity Plan.
2 Represents remaining shares of common stock available for future grants under the 2017 Equity Plan and the 2010 Director Stock Plan, excluding 258,968 shares to be issued upon exercise of outstanding options and 192,453 shares available to be issued under the Employee Stock Purchase Plan.
Page-21
Five-Year Stock Price Performance Graph
The following graph, compiled by S&P Global Market Intelligence of New York, New York, shows a comparison of cumulative total shareholder return on our common stock during the five fiscal years ended December 31, 2017 compared to the Russell 2000 Stock index and the SNL Bank $1B - $5B Index. The comparison assumes the investment of $100 in our common stock on December 31, 2012 and the reinvestment of all dividends. The graph represents past performance and does not indicate future performance. In addition, total return performance results vary depending on the length of the performance period.
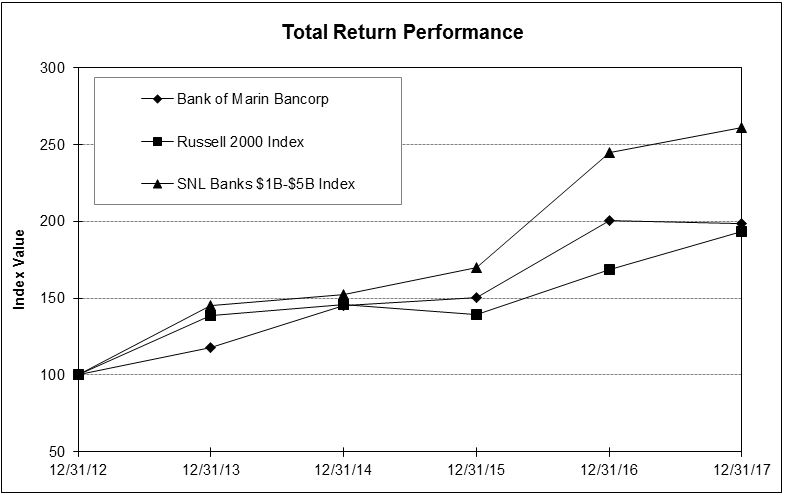
2012 | 2013 | 2014 | 2015 | 2016 | 2017 | |||||||
Bank of Marin Bancorp (BMRC) | 100.00 | 117.90 | 145.42 | 150.33 | 200.41 | 198.70 | ||||||
Russell 2000 Index | 100.00 | 138.82 | 145.62 | 139.19 | 168.85 | 193.58 | ||||||
SNL Bank $1B - $5B Index 1 | 100.00 | 145.41 | 152.04 | 170.20 | 244.85 | 261.04 | ||||||
Source: S&P Global Market Intelligence | ||||||||||||
1 Includes all Major Exchange (NYSE, NYSE MKT, and Nasdaq) banks in S&P Global's coverage universe with $1 billion to $5 billion in assets as of the most recent available financial data.
Page-22
ITEM 6 SELECTED FINANCIAL DATA
The following data has been derived from the audited consolidated financial statements of Bank of Marin Bancorp. For additional information, refer to ITEM 7, Management's Discussion and Analysis of Financial Condition and Results of Operations, and ITEM 8, Financial Statements and Supplementary Data.
At December 31, | |||||||||||||||
(in thousands) | 2017 | 2016 | 2015 | 2014 | 2013 | ||||||||||
Selected financial condition data: | |||||||||||||||
Total assets | $ | 2,468,154 | $ | 2,023,493 | $ | 2,031,134 | $ | 1,787,130 | $ | 1,805,194 | |||||
Loans, net | 1,663,246 | 1,471,174 | 1,436,299 | 1,348,252 | 1,255,098 | ||||||||||
Deposits | 2,148,670 | 1,772,700 | 1,728,226 | 1,551,619 | 1,587,102 | ||||||||||
Borrowings | 5,739 | 5,586 | 72,395 | 20,185 | 19,969 | ||||||||||
Stockholders' equity | 297,025 | 230,563 | 214,473 | 200,026 | 180,887 | ||||||||||
For the Years Ended December 31, | |||||||||||||||
(dollars in thousands, except per share data) | 2017 | 2016 | 2015 | 2014 | 2013 | ||||||||||
Selected operating data: | |||||||||||||||
Net interest income | $ | 74,852 | $ | 73,161 | $ | 67,187 | $ | 70,441 | $ | 58,775 | |||||
Provision for (reversal of) loan losses | 500 | (1,850 | ) | 500 | 750 | 540 | |||||||||
Non-interest income | 8,268 | 9,161 | 9,193 | 9,041 | 8,066 | ||||||||||
Non-interest expense 1 | 53,782 | 47,692 | 46,949 | 47,263 | 44,092 | ||||||||||
Net income 1 | 15,976 | 23,134 | 18,441 | 19,771 | 14,270 | ||||||||||
Net income per common share: | |||||||||||||||
Basic | $ | 2.58 | $ | 3.81 | $ | 3.09 | $ | 3.35 | $ | 2.62 | |||||
Diluted | $ | 2.55 | $ | 3.78 | $ | 3.04 | $ | 3.29 | $ | 2.57 | |||||
At or for the Years Ended December 31, | |||||||||||||||
2017 | 2016 | 2015 | 2014 | 2013 | |||||||||||
Performance and other financial ratios: | |||||||||||||||
Return on average assets | 0.75 | % | 1.15 | % | 0.98 | % | 1.08 | % | 0.96 | % | |||||
Return on average equity | 6.49 | % | 10.23 | % | 8.84 | % | 10.31 | % | 8.86 | % | |||||
Tax-equivalent net interest margin | 3.80 | % | 3.91 | % | 3.83 | % | 4.13 | % | 4.20 | % | |||||
Efficiency ratio | 64.70 | % | 57.93 | % | 61.47 | % | 59.46 | % | 65.97 | % | |||||
Loan-to-deposit ratio | 78.14 | % | 83.86 | % | 83.97 | % | 87.87 | % | 79.98 | % | |||||
Cash dividend payout ratio on common stock 2 | 43.41 | % | 26.77 | % | 29.10 | % | 23.90 | % | 27.90 | % | |||||
Cash dividends per common share | $ | 1.12 | $ | 1.02 | $ | 0.90 | $ | 0.80 | $ | 0.73 | |||||
Asset quality ratios: | |||||||||||||||
Allowance for loan losses to total loans | 0.94 | % | 1.04 | % | 1.03 | % | 1.11 | % | 1.12 | % | |||||
Allowance for loan losses to non-performing loans 3 | 38.88x | 106.5x | 6.88x | 1.61x | 1.22x | ||||||||||
Non-performing loans to total loans 3 | 0.02 | % | 0.01 | % | 0.15 | % | 0.69 | % | 0.92 | % | |||||
Capital ratios: | |||||||||||||||
Equity to total assets ratio | 12.03 | % | 11.39 | % | 10.60 | % | 11.20 | % | 10.00 | % | |||||
Total capital (to risk-weighted assets) | 14.91 | % | 14.32 | % | 13.37 | % | 13.94 | % | 13.21 | % | |||||
Tier 1 capital (to risk-weighted assets) | 14.04 | % | 13.37 | % | 12.44 | % | 12.87 | % | 12.18 | % | |||||
Tier 1 capital (to average assets) | 12.13 | % | 11.39 | % | 10.67 | % | 10.62 | % | 10.78 | % | |||||
Common equity Tier 1 capital (to risk-weighted assets) | 13.75 | % | 13.07 | % | 12.16 | % | N/A | N/A | |||||||
Other data: | |||||||||||||||
Number of full service offices | 23 | 20 | 20 | 21 | 21 | ||||||||||
Full time equivalent employees | 291 | 262 | 259 | 260 | 281 | ||||||||||
1 2017, 2014 and 2013 included $2.2 million, $746 thousand and $3.7 million, respectively, in merger-related expenses.
2 Calculated as dividends on common shares divided by basic net income per common share.
3 Non-performing loans include loans on non-accrual status and loans past due 90 days or more and still accruing interest.
Page-23
ITEM 7 MANAGEMENT'S DISCUSSION AND ANALYSIS OF FINANCIAL CONDITION AND RESULTS OF OPERATIONS
The following discussion of financial condition as of December 31, 2017 and 2016 and results of operations for each of the years in the three-year period ended December 31, 2017 should be read in conjunction with our consolidated financial statements and related notes thereto, included in Part II ITEM 8 of this report. Average balances, including balances used in calculating certain financial ratios, are generally comprised of average daily balances.
Forward-Looking Statements
The disclosures set forth in this item are qualified by important factors detailed in Part I captioned Forward-Looking Statements and ITEM 1A captioned Risk Factors of this report and other cautionary statements set forth elsewhere in the report.
Critical Accounting Policies and Estimates
Critical accounting policies are those that are both very important to the portrayal of our financial condition and results of operations and require Management's most difficult, subjective, or complex judgments, often because of the need to make estimates about the effect of matters that are inherently uncertain and imprecise.
Management has determined the following four accounting policies to be critical:
Allowance for Loan Losses: For information regarding our ALLL methodology, the related provision for loan losses, risks related to asset quality and lending activity, see ITEM 1A - Risk Factors, ITEM 7 - Management's Discussion and Analysis of Financial Condition and Results of Operations, and Note 1 - Summary of Significant Accounting Policies and Note 3 - Loans and Allowance for Loan Losses in ITEM 8 - Financial Statements and Supplementary Data of this Form 10-K.
Other-than-temporary Impairment of Investment Securities: For information regarding our investment securities, investment activity, and related risks, see ITEM 1A - Risk Factors, ITEM 7 - Management's Discussion and Analysis of Financial Condition and Results of Operations, Note 1 - Summary of Significant Accounting Policies and Note 2 - Investment Securities in ITEM 8 - Financial Statements and Supplementary Data of this Form 10-K.
Accounting for Income Taxes: For information on our tax assets and liabilities, and related provision for income taxes, see Note 1 - Summary of Significant Accounting Policies and Note 11 - Income Taxes in ITEM 8 - Financial Statements and Supplementary Data of this Form 10-K.
Fair Value Measurements: For information on our use of fair value measurements and our related valuation methodologies, see Note 1 - Summary of Significant Accounting Policies and Note 9 - Fair Value of Assets and Liabilities in ITEM 8 - Financial Statements and Supplementary Data of this Form 10-K.
Page-24
Executive Summary
Annual earnings were $16.0 million in 2017 compared to $23.1 million in 2016. Diluted earnings were $2.55 per share for the year ended December 31, 2017, compared to $3.78 per share in the same period of 2016.
The following are highlights of operating and financial performance for the year ended December 31, 2017:
• | In 2017, Bank of Marin acquired Bank of Napa. As a result, Bank of Marin is the largest community bank in Napa County by deposit share. This is the third acquisition in the past six years that strengthens the Bank’s presence in the San Francisco Bay Area. Additionally, we expanded our presence in Sonoma County by opening our Healdsburg office. |
• | Earnings in 2017 included a $3.0 million one-time deferred tax asset write-down due to the enactment of the new federal tax law on December 22, 2017, and expenses related to the acquisition of Bank of Napa. Without these expenses, diluted earnings per share ("EPS") would have been $3.28 for the full year, and net income would have been $20.5 million for the year ended December 31, 2017. Refer to table on the following page for a detailed reconciliation of these financial measures presented according to the Generally Accepted Accounting Principles (“GAAP”) vs. non-GAAP. Additionally, annual earnings in 2016 were higher than 2017 due to loan recoveries and early payoff of several acquired loans purchased at a discount, which positively impacted the 2016 EPS by $0.47. |
• | The Bank achieved organic loan growth of $59.5 million, or 4.0% in 2017. Including loans acquired from Bank of Napa, the total loan portfolio grew 12.9% from $1,486.6 million at December 31, 2016 to $1,679.0 million at December 31, 2017. In early 2018, we are funding loans carried over from the prior year as we continue to rebuild our pipeline. |
• | Organic deposit growth was $144.5 million, or 8.2% for the year. Combined organic growth and deposits acquired from Bank of Napa resulted in 21.2% total deposit growth to $2,148.7 million at December 31, 2017, compared to $1,772.7 million at December 31, 2016. Non-interest bearing deposits, including those acquired, grew by $197.1 million in 2017 and made up 47% of total deposits at year end. Cost of total deposits remained low at 0.07% despite three short-term interest rate increases by the Federal Reserve Open Market Committee in 2017. |
• | Strong credit quality remains a cornerstone of the Bank’s consistent performance. Non-accrual loans represent 0.02% of the Bank's loan portfolio as of December 31, 2017. A $500 thousand provision for loan losses was recorded in the fourth quarter due to continuing loan growth and elevated risk factors associated with the unknown long-term impacts of the 2017 North Bay wildfires and effects of the Bank of Napa acquisition. |
• | While the long-term impact of the October 2017 wildfires on the North Bay economy is still unknown, the immediate impact to our loan portfolio and to our customer base was minimal. Bank of Marin is committed to helping our customers and our communities recover and rebuild. |
• | Net interest income totaled $74.9 million and $73.2 million in 2017 and 2016, respectively. The increase of $1.7 million in 2017 is primarily due to an increase in earning assets of $114.4 million, partially offset by a decrease in gains on payoffs and accretion on purchased loans, and a $1.4 million interest recovery in 2016. The tax equivalent net interest margin decreased to 3.80% in 2017 compared to 3.91% in 2016 for the same reasons. Refer to the Net Interest Income section below for information on the tax equivalent net interest margin and the reported net interest margin. |
• | The effective tax rate of 44.6% for the year was elevated by 10.5 percentage points due to the deferred tax asset write-down. Without this charge, the effective tax rate would have been slightly lower than the previous years. |
• | The efficiency ratio was 64.7% for the full year, up from 57.9% in 2016. Acquisition expenses increased the efficiency ratio by 2.7 percentage points for the year. We expect approximately $1.0 million in additional acquisition-related expenses in 2018. |
Page-25
• | For the year ended December 31, 2017, return on assets ("ROA") was 0.75% and return on equity ("ROE") was 6.49%. Acquisition expenses and the deferred tax asset write-down reduced ROA by 0.22 percentage points and ROE by 1.86 percentage points. |
• | All capital ratios are well above regulatory requirements for a well-capitalized institution. The total risk-based capital ratio for Bancorp was 14.9% at December 31, 2017, compared to 14.3% at December 31, 2016. |
Looking forward into the new year, the investments we made in both organic growth and the Bank of Napa acquisition in 2017 should position us very well for 2018.
• | The reduced tax rate resulting from the Tax Cuts and Jobs Act of 2017 presents an opportunity for the Bank to consider or accelerate certain strategies, including potential value-added investments, changes to our dividend policy or other capital actions. Additionally, in January 2018, the Bank awarded special bonuses to staff in recognition of their consistent contributions to the Bank's ongoing success. |
• | We have ample liquidity and capital to support organic growth and acquisitions in coming years. |
• | As part of its organic growth plan, the Bank expanded its executive and lending teams with several strategic hires in 2017, including a Chief Operating Officer and a Commercial Banking Regional Manager for the Bank’s Napa and Sonoma markets. |
• | Acquisitions remain a component of our strategic plan and we will continue to evaluate merger and acquisition opportunities that fit with our culture and add value for our shareholders. |
• | Our disciplined credit culture and relationship-focused banking continue to be critical components of our success. |
Statement regarding use of non-GAAP financial measures
Management believes that presentation of operating results using non-GAAP financial measures provides useful supplemental information to investors and facilitates the analysis of Bancorp's core operating results and comparison of operating results across reporting periods. Management also uses non-GAAP financial measures to establish budgets and manage Bancorp's business. A reconciliation of the GAAP financial results to non-GAAP financial results is included in the following table.
Reconciliation of GAAP and Non-GAAP Financial Measures | |||||||||
Years ended | |||||||||
(in thousands, unaudited) | December 31, 2017 | December 31, 2016 | December 31, 2015 | ||||||
Net income (GAAP) | $ | 15,976 | $ | 23,134 | $ | 18,441 | |||
Acquisition-related expenses | 2,209 | — | — | ||||||
Tax effect associated with acquisition-related expenses | (657) | — | — | ||||||
Deferred tax asset write-down | 3,017 | — | — | ||||||
Comparable net income (Non-GAAP) | $ | 20,545 | $ | 23,134 | $ | 18,441 | |||
Diluted earnings per share (GAAP) | $ | 2.55 | $ | 3.78 | $ | 3.04 | |||
Acquisition-related expenses | 0.35 | — | — | ||||||
Tax effect associated with acquisition-related expenses | (0.10) | — | — | ||||||
Deferred tax asset write-down | 0.48 | — | — | ||||||
Comparable diluted earnings per share (Non-GAAP) | $ | 3.28 | $ | 3.78 | $ | 3.04 | |||
Following is a description of the adjustments made to GAAP financial measures:
• | Acquisition-related costs: Costs related to closing and integration of the acquired bank. |
• | Tax expense associated with write-down of the net deferred tax assets due to the Tax Cuts and Jobs Act of 2017 discussed earlier. |
Page-26
RESULTS OF OPERATIONS
Net Interest Income
Net interest income is the difference between the interest earned on loans, investments and other interest-earning assets and the interest expense incurred on deposits and other interest-bearing liabilities. Net interest income is affected by changes in general market interest rates and by changes in the amounts and composition of interest-earning assets and interest-bearing liabilities. Interest rate changes can create fluctuations in net interest income and/or margin due to an imbalance in the timing of repricing or maturity of assets or liabilities. We manage interest rate risk exposure with the goal of minimizing the effect of interest rate volatility on net interest income.
Net interest margin is expressed as net interest income divided by average interest-earning assets. Net interest rate spread is the difference between the average rate earned on total interest-earning assets and the average rate incurred on total interest-bearing liabilities. Both of these measures are reported on a taxable-equivalent basis. Net interest margin is the higher of the two because it reflects interest income earned on assets funded with non-interest-bearing sources of funds, which include demand deposits and stockholders’ equity.
The following table, Average Statements of Condition and Analysis of Net Interest Income, compares interest income, average interest-earning assets, interest expense, and average interest-bearing liabilities for the periods presented. The table also presents net interest income, net interest margin and net interest rate spread for the years indicated.
Table 1 Average Statements of Condition and Analysis of Net Interest Income | |||||||||||||||||||||||||||
Year ended | Year ended | Year ended | |||||||||||||||||||||||||
December 31, 2017 | December 31, 2016 | December 31, 2015 | |||||||||||||||||||||||||
Interest | Interest | Interest | |||||||||||||||||||||||||
Average | Income/ | Yield/ | Average | Income/ | Yield/ | Average | Income/ | Yield/ | |||||||||||||||||||
(dollars in thousands; unaudited) | Balance | Expense | Rate | Balance | Expense | Rate | Balance | Expense | Rate | ||||||||||||||||||
Assets | |||||||||||||||||||||||||||
Interest-bearing due from banks 1 | $ | 80,351 | $ | 995 | 1.22 | % | $ | 38,314 | $ | 209 | 0.54 | % | $ | 52,004 | $ | 135 | 0.26 | % | |||||||||
Investment securities 2, 3 | 419,873 | 9,732 | 2.32 | % | 406,640 | 8,671 | 2.13 | % | 370,730 | 8,255 | 2.23 | % | |||||||||||||||
Loans 1, 3, 4 | 1,511,503 | 68,562 | 4.47 | % | 1,452,357 | 68,794 | 4.66 | % | 1,354,564 | 62,953 | 4.58 | % | |||||||||||||||
Total interest-earning assets 1 | 2,011,727 | 79,289 | 3.89 | % | 1,897,311 | 77,674 | 4.03 | % | 1,777,298 | 71,343 | 3.96 | % | |||||||||||||||
Cash and non-interest-bearing due from banks | 42,511 | 42,150 | 44,543 | ||||||||||||||||||||||||
Bank premises and equipment, net | 8,411 | 8,836 | 9,705 | ||||||||||||||||||||||||
Interest receivable and other assets, net | 63,301 | 59,989 | 58,201 | ||||||||||||||||||||||||
Total assets | $ | 2,125,950 | $ | 2,008,286 | $ | 1,889,747 | |||||||||||||||||||||
Liabilities and Stockholders' Equity | |||||||||||||||||||||||||||
Interest-bearing transaction accounts | $ | 105,544 | $ | 108 | 0.10 | % | $ | 94,252 | $ | 109 | 0.12 | % | $ | 95,662 | $ | 115 | 0.12 | % | |||||||||
Savings accounts | 167,190 | 66 | 0.04 | % | 151,214 | 58 | 0.04 | % | 134,997 | 50 | 0.04 | % | |||||||||||||||
Money market accounts | 542,592 | 555 | 0.10 | % | 524,989 | 445 | 0.08 | % | 505,280 | 495 | 0.10 | % | |||||||||||||||
Time accounts, including CDARS | 146,069 | 576 | 0.39 | % | 158,878 | 742 | 0.47 | % | 156,316 | 853 | 0.55 | % | |||||||||||||||
Overnight borrowings 1 | 1 | — | 1.75 | % | 5,383 | 23 | 0.42 | % | 784 | 3 | 0.38 | % | |||||||||||||||
FHLB fixed-rate advances 1 | — | — | — | % | 6,803 | 456 | 6.59 | % | 15,000 | 315 | 2.07 | % | |||||||||||||||
Subordinated debentures 1 | 5,664 | 439 | 7.65 | % | 5,493 | 436 | 7.80 | % | 5,288 | 420 | 7.94 | % | |||||||||||||||
Total interest-bearing liabilities | 967,060 | 1,744 | 0.18 | % | 947,012 | 2,269 | 0.24 | % | 913,327 | 2,251 | 0.25 | % | |||||||||||||||
Demand accounts | 899,289 | 819,916 | 753,038 | ||||||||||||||||||||||||
Interest payable and other liabilities | 13,506 | 15,142 | 14,856 | ||||||||||||||||||||||||
Stockholders' equity | 246,095 | 226,216 | 208,526 | ||||||||||||||||||||||||
Total liabilities & stockholders' equity | $ | 2,125,950 | $ | 2,008,286 | $ | 1,889,747 | |||||||||||||||||||||
Tax-equivalent net interest income/margin 1 | $ | 77,545 | 3.80 | % | $ | 75,405 | 3.91 | % | $ | 69,092 | 3.83 | % | |||||||||||||||
Reported net interest income/margin 1 | $ | 74,852 | 3.67 | % | $ | 73,161 | 3.79 | % | $ | 67,187 | 3.73 | % | |||||||||||||||
Tax-equivalent net interest rate spread | 3.71 | % | 3.79 | % | 3.71 | % | |||||||||||||||||||||
1 Interest income/expense is divided by actual number of days in the period times 360 days to correspond to stated interest rate terms, where applicable. | |||||||||||||||||||||||||||
2 Yields on available-for-sale securities are calculated based on amortized cost balances rather than fair value, as changes in fair value are reflected as a component of stockholders' equity. Investment security interest is earned on 30/360 day basis monthly. | |||||||||||||||||||||||||||
3 Yields and interest income on tax-exempt securities and loans are presented on a taxable-equivalent basis using the Federal statutory rate of 35 percent. | |||||||||||||||||||||||||||
4 Average balances on loans outstanding include non-performing loans. The amortized portion of net loan origination fees is included in interest income on loans, representing an adjustment to the yield. | |||||||||||||||||||||||||||
Page-27
Table 2 Analysis of Changes in Net Interest Income
The following table presents the effects of changes in average balances (volume) or changes in average rates on net interest income for the years indicated. Volume variances are equal to the increase or decrease in average balances multiplied by prior period rates. Rate variances are equal to the increase or decrease in rates multiplied by prior period average balances. Mix variances are attributable to the change in yields or rates multiplied by the change in average balances.
2017 compared to 2016 | 2016 compared to 2015 | |||||||||||||||||||||||
(in thousands, unaudited) | Volume | Yield/Rate | Mix | Total | Volume | Yield/Rate | Mix | Total | ||||||||||||||||
Interest-bearing due from banks | $ | 229 | $ | 266 | $ | 291 | $ | 786 | $ | (36 | ) | $ | 149 | $ | (39 | ) | $ | 74 | ||||||
Investment securities 1 | 282 | 754 | 25 | 1,061 | 800 | (350 | ) | (34 | ) | 416 | ||||||||||||||
Loans 1 | 2,802 | (2,915 | ) | (119 | ) | (232 | ) | 4,545 | 1,209 | 87 | 5,841 | |||||||||||||
Total interest-earning assets | 3,313 | (1,895 | ) | 197 | 1,615 | 5,309 | 1,008 | 14 | 6,331 | |||||||||||||||
Interest-bearing transaction accounts | 13 | (13 | ) | (1 | ) | (1 | ) | (2 | ) | (4 | ) | — | (6 | ) | ||||||||||
Savings accounts | 6 | 2 | — | 8 | 6 | 2 | — | 8 | ||||||||||||||||
Money market accounts | 15 | 91 | 4 | 110 | 19 | (67 | ) | (3 | ) | (51 | ) | |||||||||||||
Time accounts, including CDARS | (60 | ) | (115 | ) | 9 | (166 | ) | 14 | (123 | ) | (2 | ) | (111 | ) | ||||||||||
FHLB borrowings and overnight borrowings | (479 | ) | — | — | (479 | ) | (155 | ) | 690 | (374 | ) | 161 | ||||||||||||
Subordinated debentures | 14 | (10 | ) | (1 | ) | 3 | 17 | — | — | 17 | ||||||||||||||
Total interest-bearing liabilities | (491 | ) | (45 | ) | 11 | (525 | ) | (101 | ) | 498 | (379 | ) | 18 | |||||||||||
$ | 3,804 | $ | (1,850 | ) | $ | 186 | $ | 2,140 | $ | 5,410 | $ | 510 | $ | 393 | $ | 6,313 | ||||||||
1 Yields and interest income on tax-exempt securities and loans are presented on a taxable-equivalent basis using the federal statutory rate of 35%. | ||||||||||||||||||||||||
2017 Compared with 2016
Net interest income totaled $74.9 million and $73.2 million in 2017 and 2016, respectively. The increase of $1.7 million in 2017 is primarily due to an increase in earning assets of $114.4 million, partially offset by a decrease in gains on payoffs and accretion on purchased loans, and a $1.4 million interest recovery in 2016. The tax-equivalent net interest margin was 3.80% in 2017, compared to 3.91% in 2016. The decrease of eleven basis points was primarily due to a $1.4 million interest recovery upon payoff of a problem credit in 2016. Other factors that affected the net interest margin during 2017 included a decline in gains on payoffs and accretion on purchased loans and a shift in the mix of earning assets. These factors were partially offset by higher average yields on investment securities and cash in 2017, and prepayment fees of $312 thousand on FHLB borrowings in 2016. The net interest spread decreased eight basis points over the same period for the same reasons.
The yield on average interest-earning assets decreased fourteen basis points in 2017 compared to 2016 for the reasons listed above. The loan portfolio as a percentage of average interest-earning assets, decreased to 75.1% in 2017, from 76.6% in 2016. Cash was 4.0% and 2.0% of average interest-earning assets in 2017 and 2016, respectively. Total average interest-earning assets increased $114.4 million, or 6.0%, in 2017 compared to 2016.
2016 Compared with 2015
The tax-equivalent net interest margin was 3.91% in 2016, compared to 3.83% in 2015. The increase of eight basis points was primarily due to a $1.4 million interest recovery upon payoff of a problem credit in 2016. Other factors that affected the net interest margin during 2016 included greater gains on payoffs and accretion on purchased loans and a shift to higher yielding earning assets, partially offset by lower average rates on loans and investment securities and prepayment fees of $312 thousand on FHLB borrowings. The net interest spread increased eight basis points over the same period for the same reasons.
The yield on average interest-earning assets increased seven basis points in 2016 compared to 2015 for the reasons listed above. The loan portfolio as a percentage of average interest-earning assets, increased to 76.6% in 2016, from 76.2% in 2015. The investment securities were 21.4% and 20.9% of average interest-earning assets in 2016 and 2015, respectively. Total average interest-earning assets increased $120.0 million, or 6.8%, in 2016 compared to 2015.
Page-28
Market Interest Rates
Market interest rates are, in part, based on the target federal funds interest rate (the interest rate banks charge each other for short-term borrowings) implemented by the Federal Reserve Open Market Committee ("FOMC"). Actions by the FOMC to increase the target federal funds rate by 25 basis points in December 2015, December 2016, March 2017, June 2017 and December 2017, have positively impacted yields on our rate sensitive interest-earning assets. The increase in June 2017, to the current target range for the federal funds rate of 1.25% to 1.50%, was the fifth rate hike since 2008. If interest rates continue to rise, we anticipate that our net interest income will increase. While short-term interest rates have risen and improved the Bank’s yields on prime-rate adjustable assets, there has been little movement in longer-term rates that influence competitive pricing for fixed-rate lending activities.
Impact of Acquired Loans on Net Interest Margin
Early payoffs or prepayments of our acquired loans with significant unamortized purchase discount/premium could result in volatility in our net interest margin. Accretions and gains on payoffs of purchased loans are recorded in interest income. The loans acquired from Bank of Napa are not expected to significantly increase the accretion of purchased loans. As our acquired loans from prior acquisitions continue to pay off, we expect accretion income from these loans to continue to decline. The positive affect on our net interest margin during the past three years was as follows:
Years ended December 31, | ||||||||||||||
2017 | 2016 | 2015 | ||||||||||||
(dollars in thousands; unaudited) | Dollar Amount | Basis point affect on net interest margin | Dollar Amount | Basis point affect on net interest margin | Dollar Amount | Basis point affect on net interest margin | ||||||||
Accretion on purchased credit impaired ("PCI") loans | $ | 331 | 2 bps | $ | 364 | 2 bps | $ | 495 | 3 bps | |||||
Accretion on non-PCI loans | $ | 571 | 3 bps | $ | 1,411 | 7 bps | $ | 1,389 | 8 bps | |||||
Gains on payoffs of PCI loans | $ | 184 | 1 bps | $ | 1,027 | 5 bps | $ | 44 | 0 bps | |||||
Provision for Loan Losses
Management assesses the adequacy of the allowance for loan losses quarterly based on several factors including growth of the loan portfolio, analysis of probable losses in the portfolio, historical loss experience and the current economic climate. Actual losses on loans are charged against the allowance, and the allowance is increased by loss recoveries and provisions for loan losses charged to expense. For further discussion, see Note 1 to the Consolidated Financial Statements in ITEM 8 of this report.
We recorded a $500 thousand provision for loan losses in 2017, consistent with our organic loan growth and changing risk factors, compared to a reversal of loan losses of $1.9 million in 2016 due to the resolution and payoff of a problem commercial real estate credit. The provision for loan losses totaled $500 thousand in 2015. The allowance for loan losses was 0.94%, 1.04% and 1.03% of loans at December 31, 2017, 2016 and 2015, respectively. The decline in ratio compared to the prior year was primarily due to loans acquired from Bank of Napa in November 2017 that were recorded at fair value upon acquisition requiring no allowance as of December 31, 2017. The allowance for loan losses, excluding acquired loans, was 1.06%, 1.10% and 1.12% of loans at December 31, 2017, 2016 and 2015, respectively. Net charge-offs totaled $175 thousand in 2017, compared to net recoveries of $2.3 million in 2016, primarily related to the resolution of the problem commercial real estate credit. Net charge-offs totaled $600 thousand in 2015, primarily relating to a land development loan sold in 2015. See the section captioned “Allowance for Loan Losses” below for further analysis of the provision for loan losses.
Page-29
Non-interest Income
The table below details the components of non-interest income.
Table 3 Components of Non-Interest Income | ||||||||||||||||||||
Years ended | 2017 compared to 2016 | 2016 compared to 2015 | ||||||||||||||||||
December 31, | Amount | Percent | Amount | Percent | ||||||||||||||||
(dollars in thousands; unaudited) | 2017 | 2016 | 2015 | Increase (Decrease) | Increase (Decrease) | Increase (Decrease) | Increase (Decrease) | |||||||||||||
Service charges on deposit accounts | $ | 1,784 | $ | 1,789 | $ | 1,979 | $ | (5 | ) | (0.3 | )% | $ | (190 | ) | (9.6 | )% | ||||
Wealth Management and Trust Services | 2,090 | 2,090 | 2,391 | — | — | % | (301 | ) | (12.6 | )% | ||||||||||
Debit card interchange fees | 1,531 | 1,503 | 1,445 | 28 | 1.9 | % | 58 | 4.0 | % | |||||||||||
Merchant interchange fees | 398 | 449 | 545 | (51 | ) | (11.4 | )% | (96 | ) | (17.6 | )% | |||||||||
Earnings on bank-owned life insurance | 845 | 844 | 814 | 1 | 0.1 | % | 30 | 3.7 | % | |||||||||||
Dividends on FHLB stock | 766 | 1,153 | 1,003 | (387 | ) | (33.6 | )% | 150 | 15.0 | % | ||||||||||
Gains on investment securities, net | (185 | ) | 425 | 79 | (610 | ) | (143.5 | )% | 346 | 438.0 | % | |||||||||
Other income | 1,039 | 908 | 937 | 131 | 14.4 | % | (29 | ) | (3.1 | )% | ||||||||||
Total non-interest income | $ | 8,268 | $ | 9,161 | $ | 9,193 | $ | (893 | ) | (9.7 | )% | $ | (32 | ) | (0.3 | )% | ||||
2017 Compared with 2016
Non-interest income totaled $8.3 million and $9.2 million in 2017 and 2016, respectively. The decrease compared to the prior year primarily relates to a special FHLB dividend of $347 thousand and $425 thousand net gains on the sale of investment securities recorded in 2016. Additionally, merchant interchange fees continue to trend down as we transitioned our merchant customers to a new service provider with different contract arrangements in 2016 and 2017.
2016 Compared with 2015
Non-interest income totaled $9.2 million in both 2016 and 2015, respectively. Non-interest income in 2016 included higher gains on the sale of investment securities, higher dividends on FHLB stock as we purchased $1.8 million in capital stock due to an increase in the total asset base used to calculate our membership stock requirement, and received a $347 thousand special dividend, compared to a $305 thousand special dividend in 2015. These increases were offset by lower service charges on business analysis accounts due to higher average deposit balances and lower wealth management and trust related fees due to the settlement of several large estates in 2015 and early 2016. Additionally, merchant interchange fees continue to trend down as we transition our merchant customers to a new service provider with different contract arrangements.
Page-30
Non-interest Expense
The table below details the components of non-interest expense.
Table 4 Components of Non-Interest Expense | |||||||||||||||||||
Years ended | 2017 compared to 2016 | 2016 compared to 2015 | |||||||||||||||||
December 31, | Amount | Percent | Amount | Percent | |||||||||||||||
(dollars in thousands; unaudited) | 2017 | 2016 | 2015 | Increase (Decrease) | Increase (Decrease) | Increase (Decrease) | Increase (Decrease) | ||||||||||||
Salaries and related benefits | $ | 29,958 | $ | 26,663 | $ | 25,764 | $ | 3,295 | 12.4 | % | $ | 899 | 3.5 | % | |||||
Occupancy and equipment | 5,472 | 5,081 | 5,498 | 391 | 7.7 | % | (417 | ) | (7.6 | )% | |||||||||
Depreciation and amortization | 1,941 | 1,822 | 1,968 | 119 | 6.5 | % | (146 | ) | (7.4 | )% | |||||||||
FDIC insurance | 666 | 825 | 997 | (159 | ) | (19.3 | )% | (172 | ) | (17.3 | )% | ||||||||
Data processing | 4,906 | 3,625 | 3,318 | 1,281 | 35.3 | % | 307 | 9.3 | % | ||||||||||
Professional services | 2,858 | 2,044 | 2,121 | 814 | 39.8 | % | (77 | ) | (3.6 | )% | |||||||||
Directors' expense | 720 | 553 | 826 | 167 | 30.2 | % | (273 | ) | (33.1 | )% | |||||||||
Information technology | 769 | 862 | 736 | (93 | ) | (10.8 | )% | 126 | 17.1 | % | |||||||||
Provision for (reversal of) losses on off-balance sheet commitments | 57 | 150 | (263 | ) | (93 | ) | (62.0 | )% | 413 | (157.0 | )% | ||||||||
Other non-interest expense: | |||||||||||||||||||
Advertising | 567 | 565 | 334 | 2 | 0.4 | % | 231 | 69.2 | % | ||||||||||
Amortization of core deposit intangible | 528 | 533 | 619 | (5 | ) | (0.9 | )% | (86 | ) | (13.9 | )% | ||||||||
Other expense | 5,340 | 4,969 | 5,031 | 371 | 7.5 | % | (62 | ) | (1.2 | )% | |||||||||
Total other non-interest expense | 6,435 | 6,067 | 5,984 | 368 | 6.1 | % | 83 | 1.4 | % | ||||||||||
Total non-interest expense | $ | 53,782 | $ | 47,692 | $ | 46,949 | $ | 6,090 | 12.8 | % | $ | 743 | 1.6 | % | |||||
2017 Compared with 2016
In 2017, non-interest expense increased by $6.1 million to $53.8 million. The increase primarily relates to higher salaries and benefits due to additional full-time equivalent personnel, annual merit increases, and higher employee insurance. The number of average FTE employees totaled 269 in 2017 and 258 in 2016. The increase also relates to $2.2 million in acquisition expenses ($1.1 million in data processing, $952 thousand in professional services, $35 thousand in personnel severance and $114 thousand in other expense), as well as higher occupancy and equipment expenses related to rent increases, new branches and higher maintenance costs.
These increases were partially offset by lower FDIC assessments due to lower assessment rates. For additional information on the acquisition related expenses, see Note 18 to the Consolidated Financial Statements in ITEM 8 of this report.
2016 Compared with 2015
In 2016, non-interest expense increased by $743 thousand to $47.7 million. The increase primarily relates to higher salaries and benefits due to annual merit increases, higher employee insurance and stock-based compensation expense, partially offset by the effect of job vacancies during the year. The number of average FTE employees totaled 258 in 2016 and 260 in 2015. The increase also relates to a higher reserve for losses on off-balance sheet commitments, as unused commitments increased in 2016, and 2015 included a one-time adjustment (reversal) related to a refinement in methodology (see discussion below). Data processing costs also increased due to higher transaction volume and the addition of new products and services.
These increases were partially offset by a decrease in occupancy and equipment expenses from cost savings related to the relocation of offices in 2016 and lease accounting adjustments recorded in 2015, lower director expense resulting from fewer board members, as well as lower FDIC assessment expense due to lower assessment rates.
Page-31
Provision for Income Taxes
The provision for income taxes totaled $12.9 million at an effective tax rate of 44.6% in 2017, compared to $13.3 million at an effective tax rate of 36.6% in 2016 and $10.5 million at an effective tax rate of 36.3% in 2015. The 2017 provision for income taxes included a $3.0 million write-down of net deferred tax assets related to the enactment of the Tax Cuts and Jobs Act of 2017 on December 22, 2017, which reduced the federal corporate income tax rate to 21% at which the temporary difference of tax items are expected to reverse in the future. The deferred tax write-down in 2017 raised the effective tax rate by 10.5%. We incurred non-deductible acquisition related expenses in 2017, which also increased our effective tax rate by 0.8% compared to the prior year. Additionally, discrete tax benefits from the exercise of stock options and vesting of restricted stock increased in 2017 as a result of the adoption of FASB Accounting Standards Codification ("ASU") No. 2016-09, Compensation - Stock Compensation (Topic 718): Improvements to Employee Share-Based Payment Accounting ("ASU 2016-09"), as discussed in Note 1 to the Consolidated Financial Statements in ITEM 8 of this report. Income tax provisions reflect accruals for taxes at the applicable rates for federal income tax and California franchise tax based upon reported pre-tax income, and adjusted for the effects of all permanent differences between income for tax and financial reporting purposes (such as earnings on tax exempt loans and municipal securities, bank owned life insurance ("BOLI") and low income housing credits). Additional fluctuations in the effective rate from period to period are due to the relationship of net permanent differences to income before tax.
We file a consolidated return in the U.S. Federal tax jurisdiction and a combined return in the State of California tax jurisdiction. There were no ongoing federal or state income tax examinations at the issuance of this report. In June 2015, the State of California completed its examination of the 2011 and 2012 corporate income tax returns, resulting in a minor adjustment. At December 31, 2017 and 2016, neither the Bank nor Bancorp had accruals for interest or penalties related to unrecognized tax benefits.
The Tax Cuts and Jobs Act of 2017 includes numerous uncertainties, which will likely require the issuance of new regulations or other interpretive guidance for clarification. Although we believe our assumptions, judgments and estimates are reasonable, changes in tax laws and their interpretation could significantly affect the amounts provided for income taxes in our consolidated financial statements. We estimate that the reduction in the federal statutory tax rate for corporations like us effective January 1, 2018 from 35% to 21% will reduce our effective tax rate for 2018 to approximately 24%. However, there can be no assurance as to the actual amount because the provision for income taxes is dependent upon the nature and amount of future income and expenses as well as transactions with discrete tax effects such as the exercise of stock options. The Tax Cuts and Jobs Act of 2017 has provisions that will have an unfavorable impact to our tax expenses, including but not limited to 1) elimination or reductions to the deductibility of certain meals, entertainment, parking and transportation expenses, 2) elimination of the exception for performance-based executive compensation resulting in our inability to deduct executive compensation exceeding $1.0 million, and 3) clarification of the definition of a covered employee for excessive employee compensation purposes.
FINANCIAL CONDITION
Our assets increased $445 million from December 31, 2016 to December 31, 2017. Increases of $376 million in deposits and $192 million in loans reflected both organic growth and the acquisition of Bank of Napa. The influx of deposits also raised our cash level by $155 million.
Investment Securities
We maintain an investment securities portfolio to provide liquidity and to generate earnings on funds that have not been loaned to customers. Management determines the maturities and types of securities to be purchased based on liquidity, the interest rate risk position, and the desire to attain a reasonable investment yield balanced with risk exposure. Table 5 shows the composition of the debt securities portfolio by expected maturity at December 31, 2017 and 2016. Expected maturities differ from contractual maturities because the issuers of the securities may have the right to call or prepay obligations with or without call or prepayment penalties. We estimate and update expected maturity dates regularly based on current and historical prepayment speeds. The weighted average life of the investment portfolio at December 31, 2017 and 2016 was approximately five years and four years, respectively.
Page-32
Table 5 Investment Securities
December 31, 2017 | Within 1 Year | 1-5 Years | 5-10 Years | After 10 Years | Total | |||||||||||||||||||||||||||
(dollars in thousands; unaudited) | AmortizedCost1 | Average Yield2 | AmortizedCost1 | Average Yield2 | AmortizedCost1 | Average Yield2 | AmortizedCost1 | Average Yield2 | AmortizedCost1 | Fair Value | Average Yield2 | |||||||||||||||||||||
Held-to-maturity: | ||||||||||||||||||||||||||||||||
State and municipal3 | $ | 7,606 | 4.64 | % | $ | 11,293 | 4.02 | % | $ | 747 | 5.18 | % | $ | — | — | % | $ | 19,646 | $ | 19,998 | 4.31 | % | ||||||||||
MBS/CMOs issued by U.S. government agencies | — | — | 26,245 | 2.18 | 101,291 | 2.26 | 3,850 | 2.64 | 131,386 | 131,034 | 2.26 | |||||||||||||||||||||
Total held-to-maturity | 7,606 | 4.64 | 37,538 | 2.74 | 102,038 | 2.28 | 3,850 | 2.64 | 151,032 | 151,032 | 2.52 | |||||||||||||||||||||
Available-for-sale: | ||||||||||||||||||||||||||||||||
MBS/CMOs issued by U.S. government agencies | 800 | 1.81 | 118,125 | 2.19 | 45,739 | 2.54 | 24,702 | 2.75 | 189,366 | 188,061 | 2.34 | |||||||||||||||||||||
SBA backed securities | 167 | 5.23 | 1,759 | 2.12 | 22,554 | 2.57 | 1,499 | 3.09 | 25,979 | 25,982 | 2.59 | |||||||||||||||||||||
State and municipal3 | 7,192 | 1.84 | 51,832 | 2.09 | 36,984 | 2.39 | 2,019 | 4.53 | 98,027 | 97,491 | 2.24 | |||||||||||||||||||||
Debentures of government sponsored agencies | 1,495 | 1.55 | 11,445 | 2.06 | — | — | — | — | 12,940 | 12,938 | 2.00 | |||||||||||||||||||||
Privately issued CMOs | 121 | 3.35 | 1,311 | 2.53 | — | — | — | — | 1,432 | 1,431 | 2.60 | |||||||||||||||||||||
Corporate bonds | 4,531 | 1.94 | 2,010 | 2.88 | — | — | — | — | 6,541 | 6,564 | 2.23 | |||||||||||||||||||||
Total available-for-sale | 14,306 | 1.89 | 186,482 | 2.16 | 105,277 | 2.50 | 28,220 | 2.90 | 334,285 | 332,467 | 2.32 | |||||||||||||||||||||
Total | $ | 21,912 | 2.84 | % | $ | 224,020 | 2.26 | % | $ | 207,315 | 2.39 | % | $ | 32,070 | 2.87 | % | $ | 485,317 | $ | 483,499 | 2.38 | % | ||||||||||
December 31, 2016 | Within 1 Year | 1-5 Years | 5-10 Years | After 10 Years | Total | |||||||||||||||||||||||||||
(dollars in thousands; unaudited) | AmortizedCost1 | Average Yield2 | AmortizedCost1 | Average Yield2 | AmortizedCost1 | Average Yield2 | AmortizedCost1 | Average Yield2 | AmortizedCost1 | Fair Value | Average Yield2 | |||||||||||||||||||||
Held-to-maturity: | ||||||||||||||||||||||||||||||||
State and municipal3 | $ | 9,954 | 3.18 | % | $ | 18,925 | 5.33 | % | $ | 1,977 | 6.85 | % | $ | — | — | % | $ | 30,856 | $ | 31,544 | 4.73 | % | ||||||||||
Corporate bonds | 3,519 | 1.07 | — | — | — | — | — | — | 3,519 | 3,518 | 1.07 | |||||||||||||||||||||
MBS/CMOs issued by U.S. government agencies | — | — | 4,051 | 3.50 | 6,012 | 3.32 | — | — | 10,063 | 10,035 | 3.39 | |||||||||||||||||||||
Total held-to-maturity | 13,473 | 2.63 | 22,976 | 5.01 | 7,989 | 4.19 | — | — | 44,438 | 45,097 | 4.14 | |||||||||||||||||||||
Available-for-sale: | ||||||||||||||||||||||||||||||||
MBS/CMOs issued by U.S. government agencies | 11,609 | 1.65 | 142,602 | 2.03 | 103,260 | 1.92 | — | — | 257,471 | 253,434 | 1.97 | |||||||||||||||||||||
SBA backed securities | — | — | 614 | 5.21 | — | — | — | — | 614 | 607 | 5.21 | |||||||||||||||||||||
State and municipal3 | 4,027 | 1.93 | 31,929 | 2.35 | 41,980 | 3.07 | 1,369 | 5.46 | 79,305 | 77,701 | 2.76 | |||||||||||||||||||||
Debentures of government sponsored agencies | 5,000 | 1.00 | 30,486 | 1.13 | — | — | — | — | 35,486 | 35,403 | 1.11 | |||||||||||||||||||||
Privately issued CMOs | 265 | 1.62 | 154 | 3.01 | — | — | — | — | 419 | 419 | 2.13 | |||||||||||||||||||||
Corporate bonds | — | — | 3,965 | 1.97 | 994 | 1.99 | — | — | 4,959 | 5,016 | 1.97 | |||||||||||||||||||||
Total available-for-sale | 20,901 | 1.55 | 209,750 | 1.96 | 146,234 | 2.25 | 1,369 | 5.46 | 378,254 | 372,580 | 2.06 | |||||||||||||||||||||
Total | $ | 34,374 | 1.97 | % | $ | 232,726 | 2.26 | % | $ | 154,223 | 2.35 | % | $ | 1,369 | 5.46 | % | $ | 422,692 | $ | 417,677 | 2.28 | % | ||||||||||
1 Book value reflects cost, adjusted for accumulated amortization and accretion.
2 Weighted average calculation is based on amortized cost of securities.
3 Yields on tax-exempt municipal bonds are presented on a taxable equivalent basis, using federal tax rate of 21% for 2017 data and 35% for
2016 data.
The amortized cost of our investment securities portfolio increased $62.6 million or 14.8% during 2017. We purchased $123.2 million in securities in 2017, including $4.5 million designated as held-to-maturity and $118.7 million designated as available-for-sale to provide flexibility for liquidity and interest rate risk management. In addition, we acquired $75.5 million of investment securities from the Bank of Napa acquisition. These purchases were partially offset by $74.9 million of paydowns, calls and maturities, and $56 million of sales during 2017. Sales of securities were mainly due to changes in credit and tax law implications.
During 2017, we purchased $10 million in agency debentures issued by FHLMC, $4.5 million in mortgage pass-through securities, $88 million in collateralized mortgage obligations ("CMOs"), and $20.7 million in Small Business Administration backed securities ("SBAs"). We consider agency debentures, mortgage-backed securities, and CMOs issued by U.S. government sponsored entities to have low credit risk as they carry the credit support of the U.S. federal government. The debentures and MBS issued by the U.S. government sponsored agencies, state and municipal
Page-33
securities, SBAs and corporate bonds, made up 68.8%, 24.2%, 5.4% and 1.4% of the portfolio at December 31, 2017, compared to 71.7%, 26.1%, 0.2% and 2.0%, respectively at December 31, 2016. See the discussion in the section captioned “Securities May Lose Value due to Credit Quality of the Issuers” in ITEM 1A Risk Factors above.
At December 31, 2017, distribution of our investment in obligations of state and political subdivisions was as follows:
December 31, 2017 | December 31, 2016 | |||||||||||||||
(dollars in thousands; unaudited) | Amortized Cost | Fair Value | % of state and municipal securities | Amortized Cost | Fair Value | % of state and municipal securities | ||||||||||
Within California: | ||||||||||||||||
General obligation bonds | $ | 19,634 | $ | 19,678 | 16.7 | % | $ | 15,777 | $ | 15,660 | 14.3 | % | ||||
Revenue bonds | 11,660 | 11,776 | 9.9 | 10,895 | 11,127 | 9.9 | ||||||||||
Tax allocation bonds | 6,099 | 6,234 | 5.2 | 4,043 | 4,178 | 3.7 | ||||||||||
Total within California | 37,393 | 37,688 | 31.8 | 30,715 | 30,965 | 27.9 | ||||||||||
Outside California: | ||||||||||||||||
General obligation bonds | 68,890 | 68,454 | 58.5 | 71,534 | 70,376 | 64.9 | ||||||||||
Revenue bonds | 11,390 | 11,346 | 9.7 | 7,913 | 7,904 | 7.2 | ||||||||||
Total outside California | 80,280 | 79,800 | 68.2 | 79,447 | 78,280 | 72.1 | ||||||||||
Total obligations of state and political subdivisions | $ | 117,673 | $ | 117,488 | 100.0 | % | $ | 110,162 | $ | 109,245 | 100.0 | % | ||||
The portion of the portfolio outside the state of California is distributed among 28 states. The largest concentrations outside California are in Washington (12.1%), Texas (11.4%), and Minnesota (7.7%). Revenue bonds, both within and outside California, primarily consisted of bonds relating to essential services (such as transportation, infrastructure, public services, education and utilities).
Investments in states, municipalities and political subdivisions are subject to an initial pre-purchase credit assessment and ongoing monitoring. Key considerations include:
• | The soundness of a municipality’s budgetary position and stability of its tax revenues |
• | Debt profile and level of unfunded liabilities, diversity of revenue sources, taxing authority of the issuer |
• | Local demographics/economics including unemployment data, largest local taxpayers and employers, income indices and home values |
• | For revenue bonds, the source and strength of revenue for municipal authorities including obligors' financial condition and reserve levels, annual debt service and debt coverage ratio, and credit enhancement (such as insurer’s strength) |
• | Credit ratings by major credit rating agencies. |
Page-34
Loans
Table 6 Loans Outstanding by Type at December 31
(in thousands; unaudited) | 2017 | 2016 | 2015 | 2014 | 2013 | ||||||||||
Commercial loans | $ | 235,835 | $ | 218,615 | $ | 219,452 | $ | 210,223 | $ | 183,291 | |||||
Real estate | |||||||||||||||
Commercial owner-occupied | 300,963 | 247,713 | 242,309 | 230,605 | 241,113 | ||||||||||
Commercial investor | 822,984 | 724,228 | 715,879 | 673,499 | 625,019 | ||||||||||
Construction | 63,828 | 74,809 | 65,495 | 48,413 | 31,577 | ||||||||||
Home equity | 132,467 | 117,207 | 112,300 | 110,788 | 98,469 | ||||||||||
Other residential 1 | 95,526 | 78,549 | 73,134 | 73,035 | 72,634 | ||||||||||
Installment and other consumer loans | 27,410 | 25,495 | 22,639 | 16,788 | 17,219 | ||||||||||
Total loans | 1,679,013 | 1,486,616 | 1,451,208 | 1,363,351 | 1,269,322 | ||||||||||
Allowance for loan losses | (15,767 | ) | (15,442 | ) | (14,999 | ) | (15,099 | ) | (14,224 | ) | |||||
Total net loans | $ | 1,663,246 | $ | 1,471,174 | $ | 1,436,209 | $ | 1,348,252 | $ | 1,255,098 | |||||
1 Our residential loan portfolio includes no sub-prime loans, nor is it our normal practice to underwrite loans commonly referred to as "Alt-A mortgages", the characteristics of which are loans lacking full documentation, borrowers having low FICO scores or collateral compositions reflecting high loan-to-value ratios. Substantially all of our residential loans are indexed to Treasury Constant Maturity Rates and have provisions to reset five years after their origination dates. | |||||||||||||||
We continued to strengthen market presence throughout our footprint in 2017, including the acquisition of Bank of Napa, which added $134.7 million to our loan portfolio in November 2017. New organic loan volume totaled approximately $173.1 million in 2017, compared to approximately $191.8 million in 2016. Approximately 87% and 85% of our outstanding loans were secured by real estate at December 31, 2017 and 2016, respectively. Also, see ITEM 1A, Risk Factors, regarding our loan concentration risk.
At both December 31, 2017 and 2016, approximately 2.0% of our total loans contained an interest-only feature as part of the loan terms. All of these loans were current with their payments as of December 31, 2017. Except for two loans to one borrowing relationship totaling $7.0 million as of December 31, 2017 and 2016, all were considered to have low credit risk (graded "Pass").
As of December 31, 2017 and 2016, approximately $40.8 million and $48.7 million, respectively, of our loans had interest reserves, all of which were construction loans. When we determine a loan is impaired before the depletion of the interest reserve, we apply the interest funded by the interest reserve against loan principal. As of December 31, 2017 and 2016, no loans having interest reserve balances were determined to be impaired.
The following table summarizes our commercial real estate loan portfolio by the geographic location in which the property is located as of December 31, 2017 and 2016.
Table 7 Commercial Real Estate Loans Outstanding by Geographic Location
December 31, 2017 | December 31, 2016 | ||||||||||
(dollars in thousands; unaudited) | Amount | % of Commercial real estate loans | Amount | % of Commercial real estate loans | |||||||
Marin | $ | 341,827 | 30.4 | % | $ | 310,286 | 31.9 | % | |||
Sonoma | 167,014 | 14.9 | 155,066 | 16.0 | |||||||
Napa | 151,778 | 13.5 | 79,872 | 8.2 | |||||||
San Francisco | 150,376 | 13.4 | 143,975 | 14.8 | |||||||
Alameda | 143,939 | 12.8 | 121,467 | 12.5 | |||||||
Contra Costa | 42,093 | 3.7 | 41,808 | 4.3 | |||||||
San Mateo | 20,481 | 1.8 | 22,360 | 2.3 | |||||||
Solano | 18,071 | 1.6 | 10,606 | 1.1 | |||||||
El Dorado | 13,860 | 1.2 | 14,146 | 1.5 | |||||||
Sacramento | 11,030 | 1.0 | 11,083 | 1.1 | |||||||
Other | 63,478 | 5.7 | 61,272 | 6.3 | |||||||
Total | $ | 1,123,947 | 100.0 | % | $ | 971,941 | 100.0 | % | |||
Page-35
Commercial real estate loans increased by $152.0 million in 2017 and $13.8 million in 2016. The increase in 2017 included $92.3 million from the Bank of Napa acquisition, as well as lending activities in Marin and Alameda Counties. Of the commercial real estate loans at December 31, 2017, 73% were non-owner occupied and 27% were owner occupied. Almost the entire commercial real estate loan portfolio is comprised of term loans for which the primary source of repayment is the operating cash flow from the leasing activities of the real estate collateral. Originated loans are subject to our conservative credit underwriting standards and both the acquired and originated loans are actively managed.
The following table shows an analysis of construction loans by type and location as of December 31, 2017 and 2016.
Table 8 Construction Loans Outstanding by Type and Geographic Location
(dollars in thousands; unaudited) | December 31, 2017 | December 31, 2016 | |||||||||
Construction loans by type | Amount | % of Construction Loans | Amount | % of Construction Loans | |||||||
1-4 Single family residential | $ | 22,780 | 35.7 | % | $ | 41,106 | 55.0 | % | |||
Commercial real estate | 20,935 | 32.8 | 19,861 | 26.6 | |||||||
Apartments and multifamily | 14,878 | 23.3 | 9,088 | 12.1 | |||||||
Land - improved | 3,668 | 5.7 | 3,245 | 4.3 | |||||||
Land - unimproved | 1,567 | 2.5 | 1,509 | 2.0 | |||||||
Total | $ | 63,828 | 100.0 | % | $ | 74,809 | 100.0 | % | |||
(dollars in thousands; unaudited) | December 31, 2017 | December 31, 2016 | |||||||||
Construction loans by geographic location | Amount | % of Construction Loans | Amount | % of Construction Loans | |||||||
San Francisco | $ | 21,664 | 33.9 | % | $ | 31,256 | 41.8 | % | |||
Napa | 12,072 | 18.9 | 3,363 | 4.5 | |||||||
Marin | 9,750 | 15.3 | 19,354 | 25.9 | |||||||
Alameda | 7,783 | 12.2 | 14,905 | 19.9 | |||||||
Sonoma | 4,683 | 7.3 | 2,609 | 3.5 | |||||||
San Mateo | 3,495 | 5.5 | — | — | |||||||
Riverside | 2,969 | 4.7 | 3,224 | 4.3 | |||||||
Other | 1,412 | 2.2 | 98 | 0.1 | |||||||
Total | $ | 63,828 | 100.0 | % | $ | 74,809 | 100.0 | % | |||
Construction loans decreased by $11.0 million in 2017 and increased by $9.3 million in 2016. The decrease in 2017 was due to payoffs from completed construction projects, partially offset by $3.2 million in constructions loans from the Bank of Napa acquisition. The increase in 2016 was due to draws on both new and existing single-family development construction projects as well as on mixed-use commercial and owner-occupied construction projects. The increases in construction fundings were partially offset by payoffs related to completed construction projects. The improving economy resulted in a number of new financing opportunities for existing customers who had successfully completed construction projects in the past.
The following table presents the maturity distribution of our commercial and construction loans as of December 31, 2017 based on their contractual maturity dates and does not include scheduled payments or potential prepayments.
Table 9A Commercial and Construction Loan Maturity Distribution
Due within | Due after 1 but | Due after | ||||||||||
(in thousands; unaudited) | 1 year | within 5 years | 5 years | Total | ||||||||
Maturity distribution: | ||||||||||||
Commercial | $ | 93,686 | $ | 80,554 | $ | 61,595 | $ | 235,835 | ||||
Construction | 46,892 | 15,916 | 1,020 | 63,828 | ||||||||
Total | $ | 140,578 | $ | 96,470 | $ | 62,615 | $ | 299,663 | ||||
Page-36
The following table shows the mix of variable-rate loans to fixed-rate loans for commercial and construction loans. The large majority of the variable-rate loans are tied to independent indices (such as the Wall Street Journal prime rate or a Treasury Constant Maturity Rate). Most loans with original terms of more than five years have provisions for the fixed rates to reset, or convert to variable rates, after one, three or five years. These loans are included in variable rate balances.
Table 9B Commercial and Construction Loan Interest Rate Sensitivity
(in thousands; unaudited) | Fixed | Variable | Total | ||||||
Commercial | $ | 111,978 | $ | 123,857 | $ | 235,835 | |||
Construction | 2,457 | 61,371 | 63,828 | ||||||
Total | $ | 114,435 | $ | 185,228 | $ | 299,663 | |||
Allowance for Loan Losses
Credit risk is inherent in the business of lending. As a result, we maintain an allowance for loan losses to absorb probable losses in our loan portfolio through a provision for loan losses charged against earnings. All specifically identifiable and quantifiable losses are charged off against the allowance. The balance of our allowance for loan losses is Management's best estimate of the remaining probable losses in the portfolio. The ultimate adequacy of the allowance is dependent upon a variety of factors beyond our control, including the real estate market, changes in interest rates and economic and political environments. Based on the current conditions of the loan portfolio, Management believes that the $15.8 million allowance for loan losses at December 31, 2017 is adequate to absorb losses in our loan portfolio. However, we can provide no assurance that adverse economic conditions or other circumstances will not result in increased losses in the portfolio.
The Components of the Allowance for Loan Losses
As stated in Note 1 to the Consolidated Financial Statements in ITEM 8 of this report, the overall allowance consists of 1) specific allowances for individually identified impaired loans ("ASC 310-10") and 2) general allowances for pools of loans ("ASC 450-20"), which incorporate quantitative (e.g., loan loss rates) and qualitative risk factors (e.g., portfolio growth and trends, credit concentrations, economic and regulatory factors, etc.).
The first component, specific allowances, results from the analysis of identified problem credits and the evaluation of sources of repayment including collateral, as applicable. Management evaluates these loans individually for impairment. Management considers an originated loan to be impaired when it is probable we will be unable to collect all amounts due according to the contractual terms of the loan agreement. For PCI loans, specific allowances are established to account for credit deterioration subsequent to acquisition if we have probable decreases in cash flows expected to be collected. For loans determined to be impaired, the extent of the impairment is measured based on the present value of expected future cash flows discounted at the loan's effective interest rate at origination (for originated loans), based on the loan's observable market price, or based on the fair value of the collateral if the loan is collateral dependent or if foreclosure is imminent. Generally, with problem credits that are collateral dependent, we obtain appraisals of the collateral at least annually. We may obtain appraisals more frequently if we believe the collateral is subject to market volatility, if a specific event has occurred to the collateral, or if we believe foreclosure is imminent. Impaired loan balances decreased to $16.9 at December 31, 2017 from $18.3 million at December 31, 2016. The specific allowance for impaired loans decreased to $513 thousand at December 31, 2017 from $991 thousand at December 31, 2016. The decreases in impaired loan balances and related reserves primarily relate to payoffs and paydowns, charge-off of an unsecured commercial loan, and changes to valuation assumptions on existing impaired loans.
The second component is an estimate of the probable inherent losses in each loan pool with similar risk characteristics. This analysis encompasses the entire loan portfolio, excluding individually identified impaired loans and acquired loans whose purchase discount has not been fully accreted. Under our allowance model, loans are evaluated on a pool basis by federal regulatory reporting codes ("CALL codes" or "segments"), which are further delineated by assigned credit risk ratings, as described in Note 3 to the Consolidated Financial Statements in ITEM 8 of this report. At December 31, 2017 and 2016, the allowance allocated for the second component totaled $15.3 million and $14.5 million, respectively. The increase from 2016 to 2017 primarily relates to an $84.3 million increase in loans subject to general allowances for pools of loans and elevated qualitative risk factors associated with unknown long-term impacts of the 2017 North Bay wildfires and the Bank of Napa acquisition.
Page-37
Table 10 shows the allocation of the allowance by loan type as well as the percentage of total loans in each of the same loan types.
Table 10 Allocation of Allowance for Loan Losses
December 31, 2017 | December 31, 2016 | December 31, 2015 | December 31, 2014 | December 31, 2013 | |||||||||||||||||||||||||
(dollars in thousands; unaudited) | Allowance balance allocation | Loans as a percent of total loans | Allowance balance allocation | Loans as a percent of total loans | Allowance balance allocation | Loans as a percent of total loans | Allowance balance allocation | Loans as a percent of total loans | Allowance balance allocation | Loans as a percent of total loans | |||||||||||||||||||
Commercial loans | $ | 3,654 | 14.0 | % | $ | 3,248 | 14.7 | % | $ | 3,023 | 15.1 | % | $ | 2,837 | 15.4 | % | $ | 3,056 | 14.4 | % | |||||||||
Real Estate: | |||||||||||||||||||||||||||||
Commercial, owner-occupied | 2,294 | 17.9 | 1,753 | 16.7 | 2,249 | 16.7 | 1,924 | 16.9 | 2,012 | 19.0 | |||||||||||||||||||
Commercial, investor | 6,475 | 49.1 | 6,320 | 48.7 | 6,178 | 49.4 | 6,672 | 49.4 | 6,196 | 49.2 | |||||||||||||||||||
Construction | 681 | 3.8 | 781 | 5.0 | 724 | 4.5 | 839 | 3.6 | 633 | 2.5 | |||||||||||||||||||
Home Equity | 1,031 | 7.9 | 973 | 7.9 | 910 | 7.7 | 859 | 8.1 | 875 | 7.8 | |||||||||||||||||||
Other residential | 536 | 5.7 | 454 | 5.3 | 394 | 5.0 | 433 | 5.4 | 317 | 5.7 | |||||||||||||||||||
Installment and other consumer | 378 | 1.6 | 372 | 1.7 | 425 | 1.6 | 566 | 1.2 | 629 | 1.4 | |||||||||||||||||||
Unallocated allowance | 718 | N/A | 1,541 | N/A | 1,096 | N/A | 969 | N/A | 506 | N/A | |||||||||||||||||||
Total allowance for loan losses | $ | 15,767 | $ | 15,442 | $ | 14,999 | $ | 15,099 | $ | 14,224 | |||||||||||||||||||
Total percent | 100.0 | % | 100.0 | % | 100.0 | % | 100.0 | % | 100.0 | % | |||||||||||||||||||
Table 11 shows the activity in the allowance for loan losses for each of the years in the five-year period ended December 31, 2017.
Table 11 Allowance for Loan Losses
(dollars in thousands; unaudited) | 2017 | 2016 | 2015 | 2014 | 2013 | ||||||||||
Beginning balance | $ | 15,442 | $ | 14,999 | $ | 15,099 | $ | 14,224 | $ | 13,661 | |||||
Provision for (reversal of) loan losses | 500 | (1,850 | ) | 500 | 750 | 540 | |||||||||
Loans charged-off: | |||||||||||||||
Commercial | (289 | ) | (11 | ) | (5 | ) | (66 | ) | (672 | ) | |||||
Real Estate: | |||||||||||||||
Commercial, owner occupied | — | (20 | ) | — | — | — | |||||||||
Commercial, investor | — | — | — | — | (156 | ) | |||||||||
Construction | — | — | (839 | ) | (204 | ) | (62 | ) | |||||||
Home equity | — | — | — | — | (176 | ) | |||||||||
Other residential | — | — | — | — | — | ||||||||||
Installment and other consumer | (4 | ) | (5 | ) | (20 | ) | (7 | ) | (88 | ) | |||||
Total loans charged-off | (293 | ) | (36 | ) | (864 | ) | (277 | ) | (1,154 | ) | |||||
Loans recovered: | |||||||||||||||
Commercial | 111 | 143 | 236 | 168 | 1,021 | ||||||||||
Real Estate: | |||||||||||||||
Commercial, owner occupied | — | — | — | 5 | 84 | ||||||||||
Commercial, investor | — | 2,156 | 23 | 45 | 40 | ||||||||||
Construction | — | — | — | 96 | 1 | ||||||||||
Home equity | — | 3 | 3 | 3 | 10 | ||||||||||
Other residential | — | — | — | — | — | ||||||||||
Installment and other consumer | 7 | 27 | 2 | 85 | 21 | ||||||||||
Total loans recovered | 118 | 2,329 | 264 | 402 | 1,177 | ||||||||||
Net loans (charged-off) recovered | (175 | ) | 2,293 | (600 | ) | 125 | 23 | ||||||||
Ending balance | $ | 15,767 | $ | 15,442 | $ | 14,999 | $ | 15,099 | $ | 14,224 | |||||
Total loans outstanding at end of year, before deducting allowance for loan losses | $ | 1,679,013 | $ | 1,486,616 | $ | 1,451,208 | $ | 1,363,351 | $ | 1,269,322 | |||||
Average total loans outstanding during year | $ | 1,511,503 | $ | 1,452,357 | $ | 1,354,564 | $ | 1,317,794 | $ | 1,092,885 | |||||
Ratio of allowance for loan losses to total loans at end of year | 0.94 | % | 1.04 | % | 1.03 | % | 1.11 | % | 1.12 | % | |||||
Net charge-offs (recoveries) to average loans | 0.01 | % | (0.16 | )% | 0.04 | % | (0.01 | )% | — | % | |||||
Ratio of allowance for loan losses to net charge-offs (recoveries) | 9,009.7 | % | (673.4 | )% | 2,499.8 | % | (12,079.2 | )% | (61,843.5 | )% | |||||
Page-38
Net charge-offs totaled $175 thousand in 2017, compared to net recoveries of $2.3 million in 2016. Charge-offs in 2017 primarily included a $283 thousand unsecured commercial loan. Recoveries in 2016 primarily resulted from the resolution and pay-off of a commercial real estate credit. The percentage of net charge-offs (recoveries) to average loans was 0.01% in 2017, compared to (0.16)% in 2016 and 0.04% in 2015, reflecting the factors discussed above.
Table 12 shows non-performing assets and impaired loans for each of the years in the five-year period ended December 31, 2017.
Table 12 Non-performing Assets and Impaired Loans
(dollars in thousands; unaudited) | 2017 | 2016 | 2015 | 2014 | 2013 | ||||||||||
Non-accrual loans: | |||||||||||||||
Commercial | $ | — | $ | — | $ | 21 | $ | — | $ | 1,187 | |||||
Real Estate: | |||||||||||||||
Commercial, owner-occupied | — | — | — | 1,403 | 1,403 | ||||||||||
Commercial, investor | — | — | 1,903 | 2,429 | 2,807 | ||||||||||
Construction | — | — | 1 | 5,134 | 5,218 | ||||||||||
Home equity | 406 | 91 | 171 | 280 | 234 | ||||||||||
Other residential | — | — | — | — | 660 | ||||||||||
Installment and other consumer | — | 54 | 83 | 104 | 169 | ||||||||||
Total non-accrual loans | 406 | 145 | 2,179 | 9,350 | 11,678 | ||||||||||
Other real estate owned | — | 408 | 421 | 461 | 461 | ||||||||||
Total non-performing assets | $ | 406 | $ | 553 | $ | 2,600 | $ | 9,811 | $ | 12,139 | |||||
Accruing restructured loans: | |||||||||||||||
Commercial | $ | 2,165 | $ | 2,207 | $ | 4,562 | $ | 3,584 | $ | 4,514 | |||||
Real Estate: | |||||||||||||||
Commercial, owner-occupied | 6,999 | 6,993 | 6,993 | 7,056 | 534 | ||||||||||
Commercial, investor | 2,171 | 2,256 | 513 | 524 | 2,930 | ||||||||||
Construction | 2,969 | 3,245 | 3,237 | 550 | 1,516 | ||||||||||
Home equity | 347 | 625 | 388 | 414 | 272 | ||||||||||
Other residential | 1,148 | 1,965 | 2,011 | 2,045 | 1,403 | ||||||||||
Installment and other consumer | 721 | 877 | 1,168 | 1,689 | 1,693 | ||||||||||
Total accruing restructured loans | 16,520 | 18,168 | 18,872 | 15,862 | 12,862 | ||||||||||
Accreting impaired PCI loans: 1 | |||||||||||||||
Commercial real estate | — | — | — | — | 1,155 | ||||||||||
Commercial | — | — | 137 | — | — | ||||||||||
Construction | — | — | — | 11 | — | ||||||||||
Total accreting impaired PCI loans | — | — | 137 | 11 | 1,155 | ||||||||||
Total non-accrual loans (from above) | 406 | 145 | 2,179 | 9,350 | 11,678 | ||||||||||
Total impaired loans | $ | 16,926 | $ | 18,313 | $ | 21,188 | $ | 25,223 | $ | 25,695 | |||||
Allowance for loan losses to non-accrual loans at period end | 3,883 | % | 10,650 | % | 688 | % | 162 | % | 122 | % | |||||
Non-accrual loans to total loans | 0.02 | % | 0.01 | % | 0.15 | % | 0.69 | % | 0.92 | % | |||||
1 The expected cash flows on these PCI loans declined post-acquisition, yet continue to accrete interest based on the revised expected cash flows. | |||||||||||||||
Other real estate owned decreased in 2017 from the sale of two properties obtained from a bank acquisition in 2013. The decrease in total impaired loans from 2016 to 2017 primarily relates to pay-offs and paydowns, and the charge-off of an unsecured commercial loan mentioned above, which were partially offset by an increase in non-accrual loans. The decrease in total impaired loans from 2015 to 2016 primarily relates to the resolution and pay-off of a commercial real estate credit. The decrease in total impaired loans from 2014 to 2015 primarily relates to a previously non-accrual loan that returned to accrual status, the pay-off of a commercial real estate loan, and the sale of a land development loan. The decrease in total impaired loans from 2013 to 2014 primarily relates to the successful resolution of several problem loans that led to pay offs, pay downs or the return of loans to accrual status, partially offset by in increase in accruing troubled debt restructured loans.
Troubled debt restructured loans, whose contractual terms were restructured in a manner that granted a concession to a borrower experiencing financial difficulties, totaled $16.5 million and $18.2 million as of December 31, 2017 and 2016, respectively. The decrease from 2016 to 2017 primarily relates to the same reasons mentioned above. The
Page-39
decrease from 2015 to 2016 primarily relates to loan pay-offs and paydowns, net of loans modified as TDRs during 2016. The decrease from 2014 to 2015 primarily relates to five loans that were removed from TDR designation, one sold TDR loan and pay-offs and paydowns of several other TDR loans. For more information, refer to Note 3 to the Consolidated Financial Statements in ITEM 8, under “Troubled Debt Restructuring”.
Other Assets
BOLI totaled $38.1 million at December 31, 2017, compared to $32.4 million at December 31, 2016, and is recorded in other assets. The increase primarily relates to $4.8 million in BOLI acquired from the Bank of Napa acquisition.
Other assets also included net deferred tax assets of $8.8 million and $15.3 million at December 31, 2017 and 2016, respectively. Deferred tax assets consist primarily of tax benefits expected to be realized in future periods related to temporary differences such as allowance for loan losses and off-balance sheet credit commitments, net operating loss carryforwards, deferred compensation plan and salary continuation plan, and net unrealized loss on available-for-sale securities. The decrease in 2017 primarily relates to a $3.0 million write-down of net deferred tax assets due to the enactment of the Tax Cuts and Jobs Act of 2017 on December 22, 2017. There were other fluctuations in our net deferred tax asset balances due to the Bank of Napa acquisition and other tax planning strategies. Management believes deferred tax assets will be realizable due to our consistent record of earnings and the expectation that earnings will continue at a level adequate to realize such benefits. Therefore, no valuation allowance was established as of December 31, 2017 or 2016. For additional information, refer to Note 11 to the Consolidated Financial Statements in ITEM 8 of this report.
In addition, we held $11.1 million and $10.2 million of FHLB stock recorded at cost in other assets at December 31, 2017 and 2016, respectively. The increase is due to $918 thousand in FHLB capital stock acquired from the Bank of Napa acquisition. The FHLB paid $766 thousand and $1.2 million in cash dividends in 2017 and 2016, respectively. On February 21, 2018, the FHLB declared a cash dividend for the fourth quarter of 2017 at an annualized dividend rate of 7.00%.
Deposits
Organic deposits increased $144.5 million, or 8.2%, in 2017. Combined organic growth and deposits acquired from the Bank of Napa resulted in 21.2% total deposit growth to $2,148.7 million at December 31, 2017, compared to $1,772.7 million at December 31, 2016. Non-interest bearing deposits, including those acquired, grew by $197.1 million in 2017 and made up 47.2% of total deposits at year-end. No individual customer accounted for more than 5% of deposits. Also, see ITEM 1A. Risk Factors, for a discussion risks associated with volatility due to activity of our large deposit customers.
Table 13 Distribution of Average Deposits
Table 13 shows the relative composition of our average deposits for the years 2017, 2016 and 2015. For average rates paid on deposits, refer to Table 1 in ITEM 7- Management's Discussion and Analysis of Financial Condition and Results of Operations.
Years ended December 31, | |||||||||||||||||
2017 | 2016 | 2015 | |||||||||||||||
(dollars in thousands; unaudited) | Amount | Percent | Amount | Percent | Amount | Percent | |||||||||||
Non-interest bearing | $ | 899,289 | 48.3 | % | $ | 819,916 | 46.9 | % | $ | 753,038 | 45.8 | % | |||||
Interest bearing transaction | 105,544 | 5.6 | 94,252 | 5.4 | 95,662 | 5.8 | |||||||||||
Savings | 167,190 | 9.0 | 151,214 | 8.6 | 134,997 | 8.2 | |||||||||||
Money market 1 | 542,592 | 29.2 | 524,989 | 30.0 | 505,280 | 30.7 | |||||||||||
Time deposits, including CDARS: | |||||||||||||||||
Less than $100,000 | 35,136 | 1.9 | 37,359 | 2.2 | 39,666 | 2.4 | |||||||||||
$100,000 or more | 110,933 | 6.0 | 121,519 | 6.9 | 116,650 | 7.1 | |||||||||||
Total time deposits | 146,069 | 7.9 | 158,878 | 9.1 | 156,316 | 9.5 | |||||||||||
Total average deposits | $ | 1,860,684 | 100.0 | % | $ | 1,749,249 | 100.0 | % | $ | 1,645,293 | 100.0 | % | |||||
1 Included in money market balances are Insured Cash Sweep® ("ICS") balances and Demand Deposit MarketplaceSM ("DDM") defined in Note 6
to the Consolidated Financial Statements in ITEM 8 of this report.
Page-40
Table 14 Maturities of Time Deposits of $100,000 or more at December 31
Table 14 below shows the maturity groupings for time deposits of $100,000 or more at December 31, 2017, 2016 and 2015.
December 31, | |||||||||
(in thousands; unaudited) | 2017 | 2016 | 2015 | ||||||
Three months or less | $ | 36,669 | $ | 34,212 | $ | 29,694 | |||
Over three months through six months | 20,617 | 17,482 | 18,525 | ||||||
Over six months through twelve months | 22,638 | 26,301 | 35,735 | ||||||
Over twelve months | 40,481 | 37,122 | 37,969 | ||||||
Total | $ | 120,405 | $ | 115,117 | $ | 121,923 | |||
Borrowings
As of December 31, 2017 and 2016, respectively, we had $538.9 million and $513.7 million in secured lines of credit with FHLB and $52.1 million and $43.1 million with the Federal Reserve Bank of San Francisco (“FRBSF”). We also had $100.4 million (including $8.4 million assumed from Bank of Napa) and $92.0 million in unsecured lines with correspondent banks to cover any short or long-term borrowing needs at December 31, 2017 and 2016, respectively.
There were no FHLB overnight borrowings as of December 31, 2017 or 2016. On February 5, 2008, the Bank entered into a ten-year borrowing agreement under the same FHLB line of credit for $15.0 million at a fixed rate of 2.07%. On June 15, 2016, the Bank repaid the $15.0 million early and incurred a prepayment fee of $312 thousand recorded in interest expense. At December 31, 2017 and 2016, respectively, $538.9 million and $513.7 million were remaining as available for borrowing from the FHLB. The FRBSF and correspondent bank lines were not utilized at December 31, 2017 and 2016.
As part of a bank acquisition in 2013, we assumed two subordinated debentures due to the NorCal Community Bancorp Trusts I and II at fair values totaling $5.0 million at the acquisition date, which are being accreted up to the contractual values totaling $8.2 million over the remaining terms of the debentures. The subordinated debentures had been accreted up to $5.7 million and $5.6 million as of December 31, 2017 and 2016, respectively.
For additional information, see Note 7 to the Consolidated Financial Statements in ITEM 8 of this report.
Deferred Compensation Obligations
We maintain a non-qualified, unfunded deferred compensation plan for certain key management personnel. Under this plan, participating employees may defer compensation, which will entitle them to receive certain payments for up to fifteen years commencing upon retirement, death, disability or termination of employment. The participating employee may elect to receive payments over periods not to exceed fifteen years. At December 31, 2017 and 2016, our aggregate payment obligations under this plan totaled $3.4 million and $3.2 million, respectively.
We established a Salary Continuation Plan on January 1, 2011. The plan was to provide a percentage of salary continuation benefits to a select group of Executive Management upon retirement at age sixty-five and reduced benefits upon early retirement. At December 31, 2017 and 2016, our liability under the Salary Continuation Plan was $2.5 million (including $1.2 million assumed from Bank of Napa) and $1.0 million, respectively, and is recorded in interest payable and other liabilities in the Consolidated Statements of Condition. This Plan is unfunded and non-qualified for tax purposes and for purposes of Title I of the Employee Retirement Income Security Act of 1974.
For additional information, see Note 10 to the Consolidated Financial Statements in ITEM 8 of this report.
Off-Balance Sheet Arrangements, Commitments and Contractual Obligations
We make commitments to extend credit in the normal course of business to meet the financing needs of our customers. For additional information, see Note 16 to the Consolidated Financial Statements in ITEM 8 of this report. The following is a summary of our contractual obligations as of December 31, 2017.
Page-41
Table 15 Contractual Obligations at December 31, 2017
Payments due by period | |||||||||||||||
(in thousands; unaudited) | <1 year | 1-3 years | 4-5 years | >5 years | Total | ||||||||||
Operating leases | $ | 4,444 | $ | 7,956 | $ | 3,468 | $ | 2,904 | $ | 18,772 | |||||
Subordinated debentures | — | — | — | 8,248 | 8,248 | ||||||||||
Certificates of deposit | 108,352 | 23,511 | 28,252 | 1 | 160,116 | ||||||||||
Other long term liabilities (salary continuation payments)1 | 68 | 62 | 214 | 1,652 | 1,996 | ||||||||||
Total | $ | 112,864 | $ | 31,529 | $ | 31,934 | $ | 12,805 | $ | 189,132 | |||||
1 Includes $1.96 million in future benefit payments under executive salary continuation agreements assumed from the Bank of Napa acquisition whereby participants will receive payments after reaching the age of 65. Amounts exclude future benefit payment obligations totaling $4.2 million under executive salary continuation agreements whereby the participants will receive payments upon retirement. For additional information, see Note 10 to the Consolidated Financial Statements in ITEM 8 of this report.
The contractual amount of loan commitments not reflected on the consolidated statements of condition was $453.2 million and $422.3 million at December 31, 2017 and 2016, respectively.
As permitted or required under California law and to the maximum extent allowable under that law, we have certain obligations to indemnify our current and former officers and directors for certain events or occurrences while the officer or director is, or was serving, at our request in such capacity. These indemnification obligations are valid as long as the director or officer acted in good faith and in a manner the person reasonably believed to be in, or not opposed to, our best interests, and with respect to any criminal action or proceeding, had no reasonable cause to believe his or her conduct was unlawful. The maximum potential amount of future payments we could be required to make under these indemnification obligations is unlimited; however, we have a director and officer insurance policy that mitigates our exposure and enables us to recover a portion of any future amounts paid. As we believe the possibility of potential claims to be remote and any amounts under the indemnifications would be covered by the insurance policy, we have not recorded an indemnification obligation.
Capital Adequacy
As discussed in Note 15 to the Consolidated Financial Statements in ITEM 8 of this report, the Bank's capital ratios are above regulatory guidelines to be considered "well capitalized" and Bancorp's ratios exceed the required minimum ratios for capital adequacy purposes. The Bank's total risk-based capital ratio increased from 14.1% at December 31, 2016 to 14.7% at December 31, 2017, primarily due to stock issued in the Bank of Napa acquisition and accumulation of undistributed net income of the Bank in 2017 of $9.6 million, partially offset by increased risk weighted assets resulting from the Bank of Napa acquisition. Bancorp's total risk-based capital ratio increased from 14.3% at December 31, 2016 to 14.9% at December 31, 2017, primarily due to stock issued in the Bank of Napa acquisition and the accumulation of undistributed net income of $9.1 million in 2017, partially offset by increased risk weighted assets resulting from the Bank of Napa acquisition.
We expect to maintain strong capital levels. Our anticipated sources of capital in 2018 include future earnings and shares issued under the stock-based compensation program.
Liquidity
The goal of liquidity management is to provide adequate funds to meet loan demand and to fund operating activities and deposit withdrawals. We accomplish this goal by maintaining an appropriate level of liquid assets and formal lines of credit with the FHLB, FRBSF and correspondent banks that enable us to borrow funds as discussed in Note 7 to the Consolidated Financial Statement in ITEM 8 of this report. Our Asset Liability Management Committee ("ALCO"), which is comprised of certain Bank directors, is responsible for approving and monitoring our liquidity targets and strategies. ALCO has adopted a contingency funding plan that provides early detection of potential liquidity issues in the market or the Bank and institutes prompt responses that may prevent or alleviate a potential liquidity crisis. Management monitors liquidity daily and regularly adjusts our position based on current and future liquidity needs. We also have relationships with third party deposit networks and can adjust the placement of our deposits via reciprocal or one-way sales as part of our cash management strategy.
Page-42
We obtain funds from the repayment and maturity of loans, deposit inflows, investment security maturities and paydowns, federal funds purchases, FHLB advances, other borrowings, and cash flow from operations. Our primary uses of funds are the origination of loans, the purchase of investment securities, withdrawals of deposits, maturity of certificates of deposit, repayment of borrowings, and dividends to common stockholders.
The most significant factor in our daily liquidity position has been the level of customer deposits. We attract and retain new deposits, which depends upon the variety and effectiveness of our customer account products, service and convenience, and rates paid to customers, as well as our financial strength. The cash cycles of some of our large commercial depositors may cause short-term fluctuations in their deposit balances held with us.
At December 31, 2017 our liquid assets, which included unencumbered available-for-sale securities and cash, totaled $501.9 million, an increase of $187.1 million from December 31, 2016. Our cash and cash equivalents increased $154.7 million from December 31, 2016. The primary sources of funds during 2017 included $130.3 million in proceeds from sales, paydowns and maturities of investment securities, an increase in net deposits of $126.1 million, $59.8 million cash acquired, net of cash paid, from the Bank of Napa acquisition and $26.9 million net cash provided by operating activities. The primary uses of liquidity during 2017 were $123.2 million in investment securities purchases, $57.2 million in loan originated (net of loan principal collections) and $6.9 million cash dividends paid on common stock to our shareholders. Management anticipates our current strong liquidity position and core deposit base will provide adequate liquidity to fund our operations.
Undrawn credit commitments, as discussed in Note 16 to the Consolidated Financial Statements in ITEM 8 of this report, totaled $453.2 million at December 31, 2017. These commitments, to the extent used, are expected to be funded primarily through the repayment of existing loans, deposit growth and liquid assets. Over the next twelve months, $108.4 million of time deposits will mature. We expect these funds to be replaced with new deposits. Our emphasis on local deposits combined with our well capitalized equity position, provides a very stable funding base.
Since Bancorp is a holding company and does not conduct regular banking operations, its primary sources of liquidity are dividends from the Bank. Under the California Financial Code, payment of a dividend from the Bank to Bancorp without advance regulatory approval is restricted to the lesser of the Bank’s retained earnings or the amount of the Bank’s net profits from the previous three fiscal years less the amount of dividends paid during that period. The primary uses of funds for Bancorp are shareholder dividends and ordinary operating expenses. Bancorp held $3.2 million of cash at December 31, 2017. In January 2018, Bancorp obtained a dividend distribution from the Bank totaling $6.3 million, which is deemed sufficient to cover Bancorp's operational needs and cash dividends to shareholders through the end of 2018. Management anticipates that there will be sufficient earnings at the Bank to provide dividends to Bancorp to meet its funding requirements for the foreseeable future.
Page-43
Quarterly Financial Data
Table 16 Summary of Quarterly Financial Data
2017 Quarters Ended | 2016 Quarters Ended | ||||||||||||||||||||||||
(dollars in thousands; unaudited) | Dec. 31 | Sept. 30 | Jun. 30 | Mar. 31 | Dec. 31 | Sept. 30 | Jun. 30 | Mar. 31 | |||||||||||||||||
Interest income | $ | 20,650 | $ | 19,211 | $ | 18,703 | $ | 18,032 | $ | 18,408 | $ | 19,834 | $ | 17,993 | $ | 19,195 | |||||||||
Interest expense | 511 | 423 | 399 | 411 | 432 | 453 | 827 | 557 | |||||||||||||||||
Net interest income | 20,139 | 18,788 | 18,304 | 17,621 | 17,976 | 19,381 | 17,166 | 18,638 | |||||||||||||||||
Provision for (reversal of) loan losses | 500 | — | — | — | (300 | ) | (1,550 | ) | — | — | |||||||||||||||
Net interest income after provision for | |||||||||||||||||||||||||
(reversal of) loan losses | 19,639 | 18,788 | 18,304 | 17,621 | 18,276 | 20,931 | 17,166 | 18,638 | |||||||||||||||||
Non-interest income | 1,991 | 2,066 | 2,096 | 2,115 | 2,463 | 2,114 | 2,421 | 2,163 | |||||||||||||||||
Non-interest expense | 15,104 | 13,036 | 12,631 | 13,011 | 11,755 | 11,910 | 12,017 | 12,010 | |||||||||||||||||
Income before provision for income taxes | 6,526 | 7,818 | 7,769 | 6,725 | 8,984 | 11,135 | 7,570 | 8,791 | |||||||||||||||||
Provision for income taxes | 5,416 | 2,686 | 2,583 | 2,177 | 3,297 | 4,171 | 2,733 | 3,145 | |||||||||||||||||
Net income | $ | 1,110 | $ | 5,132 | $ | 5,186 | $ | 4,548 | $ | 5,687 | $ | 6,964 | $ | 4,837 | $ | 5,646 | |||||||||
Net income available to common stockholders | $ | 1,110 | $ | 5,132 | $ | 5,186 | $ | 4,548 | $ | 5,687 | $ | 6,964 | $ | 4,837 | $ | 5,646 | |||||||||
Net income per common share: | |||||||||||||||||||||||||
Basic | $ | 0.17 | $ | 0.84 | $ | 0.85 | $ | 0.75 | $ | 0.93 | $ | 1.14 | $ | 0.80 | $ | 0.93 | |||||||||
Diluted | $ | 0.17 | $ | 0.83 | $ | 0.84 | $ | 0.74 | $ | 0.93 | $ | 1.14 | $ | 0.79 | $ | 0.93 | |||||||||
Refer to the Executive Summary section above for a discussion of items that affected the financial results for the quarter ended December 31, 2017, including a one-time deferred tax asset write-down due to the enactment of the new federal tax law on December 22, 2017, and expenses related to the acquisition of Bank of Napa.
ITEM 7A. Quantitative and Qualitative Disclosure about Market Risk
Market risk is defined as the risk of loss arising from an adverse change in the market value (or prices) of financial instruments. A significant form of market risk is interest rate risk, which is inherent in our investment, borrowing, lending and deposit gathering activities. The Bank manages interest rate sensitivity to minimize the exposure of our net interest margin, earnings, and capital to changes in interest rates. Interest rate changes can create fluctuations in the net interest margin due to an imbalance in the timing of repricing or maturity of assets or liabilities.
To mitigate interest rate risk, the structure of the Consolidated Statement of Condition is managed with the objective of correlating the effects of interest rate changes on loans and investments with those of deposits and borrowings. The asset liability management policy sets limits on the acceptable amount of change to net interest income and economic value of equity in different interest rate environments.
From time to time, we enter into interest rate swap contracts to mitigate the changes in the fair value of specified long-term fixed-rate loans and firm commitments to enter into long-term fixed-rate loans caused by changes in interest rates. See Note 14 to the Consolidated Financial Statements in ITEM 8 of this report.
Exposure to interest rate risk is reviewed at least quarterly by ALCO and the Board of Directors. Simulation models are used to measure interest rate risk and to evaluate strategies to improve profitability. A simplified statement of condition is prepared on a quarterly basis as a starting point, using instrument level data of our actual loans, investments, borrowings and deposits as inputs. If potential changes to net equity value and net interest income resulting from hypothetical interest rate changes are not within the limits established by the Board of Directors, Management may adjust the asset and liability mix to bring the risk position within approved limits.
The Bank currently is slightly asset sensitive. Our net interest margin is expected to increase if rates go up, primarily due to our cash earning the Federal Funds rate, adjustable rate loans and our significant non-interest bearing deposit base. Our net interest income remains most vulnerable to a falling interest rate environment.
The following table estimates the effect of interest rate changes in all points of the yield curve as measured against a flat rate scenario. The interest rate risk is within policy guidelines established by ALCO and the Board of Directors.
Page-44
Table 17 Effect of Interest Rate Change on Net Interest Income (NII) at December 31, 2017 | ||
Immediate Changes in Interest Rates (in basis points) | Estimated Change in NII in Year 1 (as percent of NII) | Estimated Change in NII in Year 2 (as percent of NII) |
up 400 | 3.1% | 12.9% |
up 300 | 2.5% | 10.1% |
up 200 | 1.9% | 7.1% |
up 100 | 1.3% | 4.4% |
down 100 | (6.8)% | (11.5)% |
Interest rate sensitivity is a function of the repricing characteristics of our assets and liabilities. The Bank runs a combination of scenarios and sensitivities in its attempt to capture the range of interest rate risk. As with any simulation model or other method of measuring interest rate risk, limitations are inherent in the process and dependent on assumptions. For example, if we choose to pay interest on certain business deposits that are currently non-interest bearing, causing these deposits to become rate sensitive in the future, we would become less asset sensitive than the model currently indicates. Assets and liabilities may react differently to changes in market interest rates in terms of both timing and responsiveness to market rate movements. Further, the actual rates and timing of prepayments on loans and investment securities, and the behavior of depositors, could vary significantly from the assumptions applied in the various scenarios. Lastly, changes in U.S. Treasury rates accompanied by a change in the shape of the yield curve could produce different results from those presented in the table. Accordingly, the results presented should not be relied upon as indicative of actual results in the event of changing market interest rates.
Page-45
ITEM 8. FINANCIAL STATEMENTS AND SUPPLEMENTARY DATA
Report of Independent Registered Public Accounting Firm
The Board of Directors and Shareholders
Bank of Marin Bancorp
Opinions on the Financial Statements and Internal Control over Financial Reporting
We have audited the accompanying consolidated statements of condition of Bank of Marin Bancorp and subsidiary, (the “Company”) as of December 31, 2017 and 2016, the related consolidated statements of comprehensive income, changes in stockholders’ equity and cash flows for each of the three years in the period ended December 31, 2017, and the related notes (collectively referred to as the “consolidated financial statements”). We also have audited the Company’s internal control over financial reporting as of December 31, 2017, based on criteria established in Internal Control - Integrated Framework 2013 issued by the Committee of Sponsoring Organizations of the Treadway Commission (COSO).
In our opinion, the consolidated financial statements referred to above present fairly, in all material respects, the consolidated financial position of the Company as of December 31, 2017 and 2016, and the consolidated results of their operations and their cash flows for each of the three years in the period ended December 31, 2017, in conformity with accounting principles generally accepted in the United States of America. Also in our opinion, the Company maintained, in all material respects, effective internal control over financial reporting as of December 31, 2017, based on criteria established in Internal Control - Integrated Framework 2013 issued by COSO.
Basis for Opinions
The Company’s management is responsible for these consolidated financial statements, for maintaining effective internal control over financial reporting, and for its assessment of the effectiveness of internal control over financial reporting, included in the accompanying: Management Report on Internal Control over Financial Reporting included in ITEM 8. Our responsibility is to express an opinion on the Company’s consolidated financial statements and an opinion on the Company’s internal control over financial reporting based on our audits. We are a public accounting firm registered with the Public Company Accounting Oversight Board (United States) (“PCAOB”) and are required to be independent with respect to the Company in accordance with the U.S. federal securities laws and the applicable rules and regulations of the Securities and Exchange Commission and the PCAOB.
We conducted our audits in accordance with the standards of the PCAOB. Those standards require that we plan and perform the audits to obtain reasonable assurance about whether the consolidated financial statements are free of material misstatement, whether due to error or fraud, and whether effective internal control over financial reporting was maintained in all material respects.
Our audits of the consolidated financial statements included performing procedures to assess the risks of material misstatement of the consolidated financial statements, whether due to error or fraud, and performing procedures to respond to those risks. Such procedures included examining, on a test basis, evidence regarding the amounts and disclosures in the consolidated financial statements. Our audits also included evaluating the accounting principles used and significant estimates made by management, as well as evaluating the overall presentation of the consolidated financial statements. Our audit of internal control over financial reporting included obtaining an understanding of internal control over financial reporting, assessing the risk that a material weakness exists, and testing and evaluating the design and operating effectiveness of internal control based on the assessed risk. Our audits also included performing such other procedures as we considered necessary in the circumstances. We believe that our audits provide a reasonable basis for our opinions.
Definition and Limitations of Internal Control Over Financial Reporting
A company’s internal control over financial reporting is a process designed to provide reasonable assurance regarding the reliability of financial reporting and the preparation of financial statements for external purposes in accordance with generally accepted accounting principles. A company’s internal control over financial reporting includes those policies and procedures that (1) pertain to the maintenance of records that, in reasonable detail, accurately and fairly reflect the transactions and dispositions of the assets of the company; (2) provide reasonable assurance that transactions
Page-46
are recorded as necessary to permit preparation of financial statements in accordance with generally accepted accounting principles, and that receipts and expenditures of the company are being made only in accordance with authorizations of management and directors of the company; and (3) provide reasonable assurance regarding prevention or timely detection of unauthorized acquisition, use, or disposition of the company’s assets that could have a material effect on the consolidated financial statements.
Because of its inherent limitations, internal control over financial reporting may not prevent or detect misstatements. Also, projections of any evaluation of effectiveness to future periods are subject to the risk that controls may become inadequate because of changes in conditions, or that the degree of compliance with the policies or procedures may deteriorate.
/s/ Moss Adams LLP
San Francisco, California
March 14, 2018
We have served as the Company's auditor since 2004.
Page-47
March 14, 2018
Management's Report on Internal Control over Financial Reporting
Management of Bank of Marin Bancorp and subsidiary, (the "Company") is responsible for establishing and maintaining adequate internal control over financial reporting. Internal control over financial reporting is a process designed to provide reasonable assurance regarding the reliability of financial reporting and the preparation of financial statements for external purposes in accordance with U.S. generally accepted accounting principles ("GAAP"). The Company's internal control over financial reporting includes those policies and procedures that (1) pertain to the maintenance of records that, in reasonable detail, accurately and fairly reflect the transactions and dispositions of the Company's assets; (2) provide reasonable assurance that transactions are recorded as necessary to permit preparation of financial statements in accordance with GAAP, and that receipts and expenditures are being made only in accordance with authorizations of management and board of directors; and (3) provide reasonable assurance regarding prevention, or timely detection and correction of unauthorized acquisition, use, or disposition of the Company's assets that could have a material effect on the financial statements.
Management conducted an assessment of the effectiveness of internal control over financial reporting as of December 31, 2017, utilizing the framework established in Internal Control - Integrated Framework (2013) issued by the Committee of Sponsoring Organizations of the Treadway Commission (COSO). Based on this assessment, Management has concluded that the Company maintained effective internal control over financial reporting as of December 31, 2017.
The Company's independent registered public accounting firm, Moss Adams LLP, has issued an attestation report on our internal control over financial reporting, which appears on the previous page.
/s/ Russell A. Colombo
Russell A. Colombo, President and Chief Executive Officer
/s/ Tani Girton
Tani Girton, EVP and Chief Financial Officer
Page-48
BANK OF MARIN BANCORP CONSOLIDATED STATEMENTS OF CONDITION |
December 31, 2017 and 2016 |
(in thousands, except share data) | 2017 | 2016 | ||||
Assets | ||||||
Cash and due from banks | $ | 203,545 | $ | 48,804 | ||
Investment securities | ||||||
Held-to-maturity, at amortized cost | 151,032 | 44,438 | ||||
Available-for-sale, at fair value | 332,467 | 372,580 | ||||
Total investment securities | 483,499 | 417,018 | ||||
Loans, net of allowance for loan losses of $15,767 and $15,442 at December 31, 2017 and 2016, respectively | 1,663,246 | 1,471,174 | ||||
Bank premises and equipment, net | 8,612 | 8,520 | ||||
Goodwill | 30,140 | 6,436 | ||||
Core deposit intangible | 6,492 | 2,580 | ||||
Interest receivable and other assets | 72,620 | 68,961 | ||||
Total assets | $ | 2,468,154 | $ | 2,023,493 | ||
Liabilities and Stockholders' Equity | ||||||
Liabilities | ||||||
Deposits | ||||||
Non-interest bearing | $ | 1,014,103 | $ | 817,031 | ||
Interest bearing | ||||||
Transaction accounts | 169,195 | 100,723 | ||||
Savings accounts | 178,473 | 163,516 | ||||
Money market accounts | 626,783 | 539,967 | ||||
Time accounts | 160,116 | 151,463 | ||||
Total deposits | 2,148,670 | 1,772,700 | ||||
Subordinated debentures | 5,739 | 5,586 | ||||
Interest payable and other liabilities | 16,720 | 14,644 | ||||
Total liabilities | 2,171,129 | 1,792,930 | ||||
Stockholders' Equity | ||||||
Preferred stock, no par value, Authorized - 5,000,000 shares, none issued | — | — | ||||
Common stock, no par value, Authorized - 15,000,000 shares; Issued and outstanding - 6,921,542 and 6,127,314 at December 31, 2017 and 2016, respectively | 143,967 | 87,392 | ||||
Retained earnings | 155,544 | 146,464 | ||||
Accumulated other comprehensive loss, net | (2,486 | ) | (3,293 | ) | ||
Total stockholders' equity | 297,025 | 230,563 | ||||
Total liabilities and stockholders' equity | $ | 2,468,154 | $ | 2,023,493 | ||
The accompanying notes are an integral part of these consolidated financial statements.
Page-49
BANK OF MARIN BANCORP CONSOLIDATED STATEMENTS OF COMPREHENSIVE INCOME |
Years ended December 31, 2017, 2016 and 2015 |
(in thousands, except per share amounts) | 2017 | 2016 | 2015 | ||||||
Interest income | |||||||||
Interest and fees on loans | $ | 66,799 | $ | 67,472 | $ | 61,754 | |||
Interest on investment securities | |||||||||
Securities of U.S. government agencies | 6,463 | 5,155 | 4,709 | ||||||
Obligations of state and political subdivisions | 2,195 | 2,339 | 2,155 | ||||||
Corporate debt securities and other | 144 | 256 | 685 | ||||||
Interest on federal funds sold and due from banks | 995 | 208 | 135 | ||||||
Total interest income | 76,596 | 75,430 | 69,438 | ||||||
Interest expense | |||||||||
Interest on interest-bearing transaction accounts | 108 | 109 | 115 | ||||||
Interest on savings accounts | 66 | 58 | 51 | ||||||
Interest on money market accounts | 555 | 445 | 495 | ||||||
Interest on time accounts | 576 | 743 | 853 | ||||||
Interest on FHLB and overnight borrowings | — | 478 | 317 | ||||||
Interest on subordinated debentures | 439 | 436 | 420 | ||||||
Total interest expense | 1,744 | 2,269 | 2,251 | ||||||
Net interest income | 74,852 | 73,161 | 67,187 | ||||||
Provision for (reversal of) loan losses | 500 | (1,850 | ) | 500 | |||||
Net interest income after provision for loan losses | 74,352 | 75,011 | 66,687 | ||||||
Non-interest income | |||||||||
Service charges on deposit accounts | 1,784 | 1,789 | 1,979 | ||||||
Wealth Management and Trust Services | 2,090 | 2,090 | 2,391 | ||||||
Debit card interchange fees | 1,531 | 1,503 | 1,445 | ||||||
Merchant interchange fees | 398 | 449 | 545 | ||||||
Earnings on bank-owned life Insurance | 845 | 844 | 814 | ||||||
Dividends on FHLB stock | 766 | 1,153 | 1,003 | ||||||
(Losses) gains on investment securities, net | (185 | ) | 425 | 79 | |||||
Other income | 1,039 | 908 | 937 | ||||||
Total non-interest income | 8,268 | 9,161 | 9,193 | ||||||
Non-interest expense | |||||||||
Salaries and related benefits | 29,958 | 26,663 | 25,764 | ||||||
Occupancy and equipment | 5,472 | 5,081 | 5,498 | ||||||
Depreciation and amortization | 1,941 | 1,822 | 1,968 | ||||||
Federal Deposit Insurance Corporation insurance | 666 | 825 | 997 | ||||||
Data processing | 4,906 | 3,625 | 3,318 | ||||||
Professional services | 2,858 | 2,044 | 2,121 | ||||||
Directors' expense | 720 | 553 | 826 | ||||||
Information technology | 769 | 862 | 736 | ||||||
Provision for losses on off-balance sheet commitments | 57 | 150 | (263 | ) | |||||
Other expense | 6,435 | 6,067 | 5,984 | ||||||
Total non-interest expense | 53,782 | 47,692 | 46,949 | ||||||
Income before provision for income taxes | 28,838 | 36,480 | 28,931 | ||||||
Provision for income taxes | 12,862 | 13,346 | 10,490 | ||||||
Net income | $ | 15,976 | $ | 23,134 | $ | 18,441 | |||
Net income per common share: | |||||||||
Basic | $ | 2.58 | $ | 3.81 | $ | 3.09 | |||
Diluted | $ | 2.55 | $ | 3.78 | $ | 3.04 | |||
Weighted average shares: | |||||||||
Basic | 6,196 | 6,073 | 5,966 | ||||||
Diluted | 6,273 | 6,115 | 6,065 | ||||||
Dividends declared per common share | $ | 1.12 | $ | 1.02 | $ | 0.90 | |||
Comprehensive income: | |||||||||
Net income | $ | 15,976 | $ | 23,134 | $ | 18,441 | |||
Other comprehensive income (loss): | |||||||||
Change in net unrealized gain or loss on available-for-sale securities | 3,671 | (5,679 | ) | (1,481 | ) | ||||
Reclassification adjustment for losses (gains) on available-for-sale securities in net income | 185 | (394 | ) | (6 | ) | ||||
Net unrealized loss on securities transferred from available-for-sale to held-to-maturity | (3,036 | ) | — | — | |||||
Amortization of net unrealized losses on securities transferred from available-for-sale to held-to-maturity | 426 | 21 | 61 | ||||||
Subtotal | 1,246 | (6,052 | ) | (1,426 | ) | ||||
Deferred tax expense (benefit) | 439 | (2,566 | ) | (531 | ) | ||||
Other comprehensive income (loss), net of tax | 807 | (3,486 | ) | (895 | ) | ||||
Comprehensive income | $ | 16,783 | $ | 19,648 | $ | 17,546 | |||
The accompanying notes are an integral part of these consolidated financial statements.
Page-50
BANK OF MARIN BANCORP CONSOLIDATED STATEMENTS OF CHANGES IN STOCKHOLDERS' EQUITY |
Years ended December 31, 2017, 2016 and 2015 |
(in thousands, except share data) | Common Stock | Retained Earnings | Accumulated Other Comprehensive Income (Loss), Net of Taxes | Total | ||||||||||
Shares | Amount | |||||||||||||
Balance at December 31, 2014 | 5,939,482 | $ | 82,436 | $ | 116,502 | $ | 1,088 | $ | 200,026 | |||||
Net income | — | — | 18,441 | — | 18,441 | |||||||||
Other comprehensive loss | — | — | — | (895 | ) | (895 | ) | |||||||
Stock options exercised | 37,071 | 1,139 | — | — | 1,139 | |||||||||
Excess tax benefit - stock-based compensation | — | 212 | — | — | 212 | |||||||||
Stock issued under employee stock purchase plan | 339 | 17 | — | — | 17 | |||||||||
Restricted stock granted | 15,970 | — | — | — | — | |||||||||
Restricted stock forfeited / cancelled | (450 | ) | — | — | — | — | ||||||||
Stock-based compensation - stock options | — | 252 | — | — | 252 | |||||||||
Stock-based compensation - restricted stock | — | 384 | — | — | 384 | |||||||||
Cash dividends paid on common stock | — | — | (5,390 | ) | — | (5,390 | ) | |||||||
Stock purchased by directors under director stock plan | 245 | 12 | — | — | 12 | |||||||||
Stock issued in payment of director fees | 5,295 | 275 | — | — | 275 | |||||||||
Stock issued from exercise of warrants | 70,591 | — | — | — | — | |||||||||
Balance at December 31, 2015 | 6,068,543 | $ | 84,727 | $ | 129,553 | $ | 193 | $ | 214,473 | |||||
Net income | — | — | 23,134 | — | 23,134 | |||||||||
Other comprehensive loss | — | — | — | (3,486 | ) | (3,486 | ) | |||||||
Stock options exercised | 36,117 | 1,227 | — | — | 1,227 | |||||||||
Excess tax benefit - stock-based compensation | — | 161 | — | — | 161 | |||||||||
Stock issued under employee stock purchase plan | 621 | 32 | — | — | 32 | |||||||||
Restricted stock granted | 16,910 | — | — | — | — | |||||||||
Stock-based compensation - stock options | — | 347 | — | — | 347 | |||||||||
Stock-based compensation - restricted stock | — | 638 | — | — | 638 | |||||||||
Cash dividends paid on common stock | — | — | (6,223 | ) | — | (6,223 | ) | |||||||
Stock purchased by directors under director stock plan | 516 | 26 | — | — | 26 | |||||||||
Stock issued in payment of director fees | 4,607 | 234 | — | — | 234 | |||||||||
Balance at December 31, 2016 | 6,127,314 | $ | 87,392 | $ | 146,464 | $ | (3,293 | ) | $ | 230,563 | ||||
Net income | — | — | 15,976 | — | 15,976 | |||||||||
Other comprehensive income | — | — | — | 807 | 807 | |||||||||
Stock options exercised, net of shares surrendered for cashless exercises and tax withholdings | 9,266 | 28 | — | — | 28 | |||||||||
Stock issued under employee stock purchase plan | 512 | 32 | — | — | 32 | |||||||||
Stock issued under employee stock ownership plan ("ESOP") | 29,547 | 1,850 | — | — | 1,850 | |||||||||
Restricted stock granted | 16,230 | — | — | — | — | |||||||||
Stock-based compensation - stock options | — | 529 | — | — | 529 | |||||||||
Stock-based compensation - restricted stock | — | 742 | — | — | 742 | |||||||||
Cash dividends paid on common stock | — | — | (6,896 | ) | — | (6,896 | ) | |||||||
Stock purchased by directors under director stock plan | 531 | 35 | — | — | 35 | |||||||||
Stock issued in payment of director fees | 2,878 | 188 | — | — | 188 | |||||||||
Stock and stock options issued to Bank of Napa shareholders (net of payment for fractional shares of $14 thousand) | 735,264 | 53,171 | — | — | 53,171 | |||||||||
Balance at December 31, 2017 | 6,921,542 | $ | 143,967 | $ | 155,544 | $ | (2,486 | ) | $ | 297,025 | ||||
The accompanying notes are an integral part of these consolidated financial statements.
Page-51
BANK OF MARIN BANCORP CONSOLIDATED STATEMENTS OF CASH FLOWS |
Years ended December 31, 2017, 2016 and 2015 |
(in thousands) | 2017 | 2016 | 2015 | ||||||
Cash Flows from Operating Activities: | |||||||||
Net income | $ | 15,976 | $ | 23,134 | $ | 18,441 | |||
Adjustments to reconcile net income to net cash provided by operating activities: | |||||||||
Provision for (reversal of) loan losses | 500 | (1,850 | ) | 500 | |||||
Provision for (reversal of) losses on off-balance sheet commitments | 57 | 150 | (263 | ) | |||||
Write-down of deferred tax assets, net | 3,017 | — | — | ||||||
Noncash contribution expense to employee stock ownership plan | 1,152 | — | — | ||||||
Noncash director compensation expense-common stock | 197 | 180 | 274 | ||||||
Stock-based compensation expense | 1,271 | 985 | 636 | ||||||
Amortization of core deposit intangible | 529 | 533 | 619 | ||||||
Amortization of investment security premiums, net of accretion of discounts | 2,912 | 3,212 | 2,825 | ||||||
Accretion of discount on acquired loans | (902 | ) | (1,775 | ) | (1,883 | ) | |||
Accretion of discount on subordinated debentures | 153 | 191 | 210 | ||||||
Net amortization of deferred loan origination costs/fees | 65 | 114 | (281 | ) | |||||
(Gain on sale) write-down of other real estate owned | (6 | ) | 13 | 40 | |||||
Loss (gain) on sale of investment securities | 185 | (425 | ) | (79 | ) | ||||
Depreciation and amortization | 1,941 | 1,822 | 1,968 | ||||||
Loss on disposal of premises and equipment | — | 3 | 4 | ||||||
Earnings on bank owned life insurance policies | (845 | ) | (844 | ) | (814 | ) | |||
Net change in operating assets and liabilities: | |||||||||
Deferred rent and other rent-related expenses | (12 | ) | (254 | ) | (4 | ) | |||
Interest receivable and other assets | (278 | ) | 581 | 347 | |||||
Interest payable and other liabilities | 1,035 | (324 | ) | 1,142 | |||||
Net cash provided by operating activities | 26,947 | 25,446 | 23,682 | ||||||
Cash Flows from Investing Activities: | |||||||||
Purchase of held-to-maturity securities | (4,497 | ) | (2,424 | ) | (2,375 | ) | |||
Purchase of available-for-sale securities | (118,666 | ) | (161,374 | ) | (287,144 | ) | |||
Proceeds from sale of available-for-sale securities | 55,408 | 68,673 | 2,099 | ||||||
Proceeds from sale of held-to-maturity securities | — | 1,265 | 1,015 | ||||||
Proceeds from paydowns/maturities of held-to-maturity securities | 48,559 | 25,779 | 47,181 | ||||||
Proceeds from paydowns/maturities of available-for-sale securities | 26,333 | 129,669 | 64,839 | ||||||
Loans originated and principal collected, net | (57,181 | ) | (32,005 | ) | (88,123 | ) | |||
Purchase of bank owned life insurance policies | — | (2,133 | ) | — | |||||
Purchase of premises and equipment | (1,434 | ) | (1,040 | ) | (1,418 | ) | |||
Proceeds from sale of loan | — | — | 1,502 | ||||||
Proceeds from sale of other real estate owned | 414 | — | — | ||||||
Cash acquired from the Bank of Napa acquisition | 59,779 | — | — | ||||||
Purchase of Federal Home Loan Bank stock | — | (1,791 | ) | (136 | ) | ||||
Cash paid for low income housing investment | (902 | ) | (301 | ) | (718 | ) | |||
Net cash provided by (used in) investing activities | 7,813 | 24,318 | (263,278 | ) | |||||
Cash Flows from Financing Activities: | |||||||||
Net increase in deposits | 126,084 | 44,474 | 176,607 | ||||||
Proceeds from stock options exercised | 88 | 1,388 | 1,326 | ||||||
Payment of tax withholding for stock options exercised | (60 | ) | — | — | |||||
Federal Home Loan Bank (repayments) borrowings | — | (67,000 | ) | 52,000 | |||||
Cash dividends paid on common stock | (6,896 | ) | (6,223 | ) | (5,390 | ) | |||
Proceeds from stock issued under employee and director stock purchase plans and ESOP | 765 | 58 | 29 | ||||||
Net cash provided by (used in) financing activities | 119,981 | (27,303 | ) | 224,572 | |||||
Net increase (decrease) in cash and cash equivalents | 154,741 | 22,461 | (15,024 | ) | |||||
Cash and cash equivalents at beginning of period | 48,804 | 26,343 | 41,367 | ||||||
Cash and cash equivalents at end of period | $ | 203,545 | $ | 48,804 | $ | 26,343 | |||
Supplemental disclosure of cash flow items, non-cash investing and financing activities: | |||||||||
Cash paid in interest | $ | 1,535 | $ | 2,131 | $ | 2,066 | |||
Cash paid in income taxes | $ | 9,761 | $ | 13,365 | $ | 9,068 | |||
Change in unrealized gain on available-for-sale securities | $ | 1,246 | $ | (6,052 | ) | $ | (1,426 | ) | |
Stock issued in payment of director fees and to ESOP | $ | 1,340 | $ | 234 | $ | 275 | |||
Subscription in low income housing tax credit investment | $ | — | $ | — | $ | 1,023 | |||
Securities transferred from available-for-sale to held-to-maturity | $ | 128,965 | $ | — | $ | — | |||
Transfer of loan to loans held-for-sale at fair value | $ | — | $ | — | $ | 1,502 | |||
Acquisition: Merger consideration - stock and stock options issued to the Bank of Napa shareholders | $ | 53,185 | $ | — | $ | — | |||
Fair value of assets acquired, excluding cash acquired | $ | 245,342 | $ | — | $ | — | |||
Fair value of liabilities assumed | $ | 251,938 | $ | — | $ | — | |||
The accompanying notes are an integral part of these consolidated financial statements.
Page-52
NOTES TO CONSOLIDATED FINANCIAL STATEMENTS
Note 1: Summary of Significant Accounting Policies
Basis of Presentation: The consolidated financial statements include the accounts of Bank of Marin Bancorp (“Bancorp”), a bank holding company, and its wholly-owned bank subsidiary, Bank of Marin (the “Bank”), a California state-chartered commercial bank. References to “we,” “our,” “us” mean Bancorp and the Bank that are consolidated for financial reporting purposes. All material intercompany transactions have been eliminated. We have evaluated subsequent events through the date of filing with the Securities and Exchange Commission (“SEC”) and have determined that there are no subsequent events that require additional recognition or disclosure.
The NorCal Community Bancorp Trusts I and II, respectively (the "Trusts"), were formed for the sole purpose of issuing trust preferred securities. Bancorp is not considered the primary beneficiary of the Trusts (variable interest entities), therefore the Trusts are not consolidated in our consolidated financial statements, but rather the subordinated debentures are shown as a liability on our consolidated statements of condition (See Note 7, Borrowings). Bancorp's investment in the securities of the Trusts is accounted for under the equity method and is included in interest receivable and other assets on the consolidated statements of condition.
Nature of Operations: Bancorp, headquartered in Novato, CA, conducts business primarily through its wholly-owned subsidiary, the Bank, which provides a wide range of financial services to customers, who are predominantly professionals, small and middle-market businesses, and individuals who work and/or reside in Marin, Sonoma, Napa, San Francisco and Alameda counties. Besides the headquarters office in Novato, CA, the Bank operates ten branches in Marin County, three in Napa County, one in San Francisco, six in Sonoma County and three in Alameda County. Our accounting and reporting policies conform to generally accepted accounting principles, general practice, and regulatory guidance within the banking industry. A summary of our significant policies follows.
Cash and Cash Equivalents include cash, due from banks, federal funds sold and other short-term investments with maturity less than three months at the time of origination.
Investment Securities are classified as "held-to-maturity," "trading securities" or "available-for-sale." Investments classified as held-to-maturity are those that we have the ability and intent to hold until maturity and are reported at cost, adjusted for the amortization or accretion of premiums or discounts. Investments held for resale in anticipation of short-term market movements are classified as trading securities and are reported at fair value, with unrealized gains and losses included in earnings. Investments that are neither held-to-maturity nor trading are classified as available-for-sale and are reported at fair value. Unrealized gains and losses for available-for-sale securities, net of related tax, are reported as a separate component of comprehensive income and included in stockholders' equity until realized. For discussion of our methodology in determining fair value, see Note 9, Fair Value of Assets and Liabilities.
Securities transferred from the available-for-sale category to the held-to-maturity category are recorded at fair value at the date of transfer. Unrealized holding gains or losses associated with the transfer of securities from available-for-sale to held-to-maturity are included in the balance of accumulated other comprehensive income (loss), net of tax, in the consolidated balance sheets. These unrealized holding gains or losses are amortized over the remaining life of the security as a yield adjustment in a manner consistent with the amortization or accretion of the original purchase premium or discount on the associated security.
At each financial statement date, we assess whether declines in the fair value of held-to-maturity and available-for-sale securities below their costs are deemed to be other-than-temporary. We consider, among other things, (i) the length of time and the extent to which the fair value has been less than cost, (ii) the financial condition and near-term prospects of the issuer, and (iii) our intent and ability to retain the investment for a period of time sufficient to allow for any anticipated recovery in fair value. Evidence evaluated includes, but is not limited to, the remaining payment terms of the instrument and economic factors that are relevant to the collectability of the instrument, such as: current prepayment speeds, the current financial condition of the issuer(s), industry analyst reports, credit ratings, credit default rates, interest rate trends, the quality of any credit enhancement and the value of any underlying collateral.
For each security in an unrealized loss position ("impaired security"), we assess whether we intend to sell the security or if it is more likely than not that we will be required to sell the security before recovery of its amortized cost basis. If we intend to sell the security or it is more likely than not we will be required to sell the security before recovery of its
Page-53
amortized cost basis, the entire difference between the investment’s amortized cost basis and its fair value at the balance sheet date is recognized against earnings.
For impaired securities that are not intended for sale and will not be required to be sold prior to recovery of our amortized cost basis, we determine if the impairment has a credit loss component. For both held-to-maturity and available-for-sale securities, if the amount of cash flows expected to be collected are less than the amortized cost, an other-than-temporary impairment shall be considered to have occurred and the credit loss component is recognized against earnings as the difference between present value of the expected future cash flows and the amortized cost. In determining the present value of the expected cash flows, we discount the expected cash flows at the effective interest rate implicit in the security at the date of purchase. The remaining difference between the fair value and the amortized basis is deemed to be due to factors that are not credit related and is recognized in other comprehensive income, net of applicable taxes.
For held-to-maturity securities, if there is no credit loss component, no impairment is recognized. The portion of other-than-temporary impairment recognized in other comprehensive income for credit impaired debt securities classified as held-to-maturity is accreted from other comprehensive income to the amortized cost of the debt security over the remaining life of the debt security in a prospective manner on the basis of the amount and timing of future estimated cash flows.
Premiums and discounts are amortized or accreted over the life of the related security as an adjustment to yield using the effective interest method. In March 2017, the Financial Accounting Standards Board ("FASB") issued ASU No. 2017-08, Receivables - Nonrefundable Fees and Other Costs (Subtopic 310-20): Premium Amortization on Purchased Callable Debt Securities. The amendments in this ASU shorten the amortization period for certain callable debt securities purchased at a premium and require the premium to be amortized to the earliest call date. The ASU is effective for annual periods beginning after December 15, 2018, including interim periods within those periods. We early adopted this ASU effective January 1, 2017, which did not have a material impact on our financial condition and results of operations.
Dividend and interest income are recognized when earned. Realized gains and losses on the sale of securities and credit losses related to other-than-temporary impairment on available-for-sale and held-to-maturity securities are included in non-interest income as gains (losses) on investment securities, net. The specific identification method is used to calculate realized gains and losses on sales of securities.
Originated Loans are reported at the principal amount outstanding net of deferred fees (costs), charge-offs and the allowance for loan losses (“ALLL”). Interest income is accrued daily using the simple interest method. Loans are placed on non-accrual status when Management believes that there is doubt as to the collection of principal or interest, generally when they become contractually past due by ninety days or more with respect to principal or interest, except for loans that are well-secured and in the process of collection. When loans are placed on non-accrual status, any accrued but uncollected interest is reversed from current-period interest income. Non-accrual loans may be returned to accrual status when one of the following occurs:
• | The borrower has resumed paying the full amount of the principal and interest and we are satisfied with the borrower's financial position. In order to meet this test, we must have received repayment of all past due principal and interest unless the amounts contractually due are reasonably assured of repayment within a reasonable period of time, and there has been a sustained period of repayment performance (generally, six consecutive monthly payments), according to the original contractual terms or modified terms for loans whose contractual terms have been restructured in a manner which grants a concession to a borrower experiencing financial difficulties (“troubled debt restructuring”). |
• | The loan has become well secured and is in the process of collection. |
Loan origination fees and commitment fees, offset by certain direct loan origination costs, are deferred and amortized as yield adjustments over the contractual lives of the related loans.
Loan Charge-Off Policy: For all loan types excluding overdraft accounts, we generally make a charge-off determination at or before 90 days past due. A collateral-dependent loan is partially charged down to the fair value of collateral securing it if: (1) it is deemed uncollectable, or (2) it has been classified as a loss by either our internal loan review
Page-54
process or external examiners. A non-collateral-dependent loan is partially charged down to its net realizable value under the same circumstances. Overdraft accounts are generally charged off when they exceed 60 days past due.
Acquired Loans: Acquired loans are recorded at their estimated fair values at acquisition date in accordance with Accounting Standards Code ("ASC") 805, Business Combinations, factoring in credit losses expected to be incurred over the life of the loan. Accordingly, an allowance for loan losses is not carried over or recorded for acquired loans as of the acquisition date.
We estimated the fair value of acquired loans at the acquisition date based on a discounted cash flow methodology that considered factors including the type of loan and related collateral, risk classification, fixed or variable interest rate, term of loan, whether or not the loan was amortizing, and current discount rates. Loans, except for purchased credit impaired ("PCI") loans, were grouped together according to similar risk characteristics and treated in the aggregate when applying various valuation techniques. Expected cash flows incorporated our best estimate of key assumptions at the time, such as property values, default rates, loss severity and prepayment speeds. Discount rates were based on market rates for new originations of comparable loans, where available, and included adjustments for liquidity factors. To the extent comparable market rates were not readily available, a discount rate was derived based on the assumptions of market participants' cost of funds, servicing costs and return requirements for comparable risk assets. In either case, the discount rate did not include a factor for credit losses, as that had been considered in estimating the cash flows. The process of calculating fair values of acquired loans, including estimates of losses expected to be incurred over the estimated remaining lives of the loans at acquisition date and ongoing updates to Management's expectation of future cash flows, requires significant subjective judgments and assumptions. The economic environment and lack of market liquidity and transparency are factors that have influenced, and may continue to affect, these assumptions and estimates.
We acquired loans with evidence of significant credit quality deterioration subsequent to their origination and for which it was probable, at acquisition, that we would be unable to collect all contractually required payments. Management applied significant subjective judgment in determining which loans were PCI loans. Evidence of credit quality deterioration as of the purchase date may include data such as past due and nonaccrual status, risk grades and charge-off history.
The difference between the undiscounted expected cash flows expected to be collected and the fair value at acquisition date ("accretable difference") is accreted into interest income at a level yield of return over the estimated remaining life of the PCI loan, provided that the timing and amount of future cash flows is reasonably estimable. The accretable yield is affected by:
• | Changes in interest rate indices for variable rate loans – Expected future cash flows are based on the variable rates in effect at the time of the regular evaluations of cash flows expected to be collected; |
• | Changes in prepayment assumptions – Prepayments affect the estimated life of the loans which may change the amount of interest income, and possibly principal, expected to be collected; and |
• | Changes in the expected principal and interest payments over the estimated life – Updates to expected cash flows are driven by the credit outlook and actions taken with borrowers. Changes in expected future cash flows from loan modifications are included in the regular evaluations of cash flows expected to be collected. |
The cash flows expected to be collected are updated each quarter based on current assumptions regarding default rates, loss severities, and other factors that are reflective of current financial conditions of the borrowers and the market conditions. Probable decreases in expected cash flows after acquisition result in impairment recorded as a specific allowance for loan losses or a charge-off to the allowance. Impairment is calculated as the present value of the expected future cash flows on the PCI loan, discounted at the loan's effective interest rate implicit in the loan.
The nonaccretable difference on the date of acquisition is defined as the difference between the contractually required payments and the cash flows expected to be collected, considering the result of prepayments, and is not recorded.
For purposes of accounting for the PCI loans from past business combinations, we elected not to apply the pooling method but to account for these loans individually. Disposals of loans, which may include sales of loans to third parties, receipt of payments in full by the borrower, or foreclosure of the collateral, result in removal of the loan from the PCI
Page-55
loan portfolio at its carrying amount. If a PCI loan pays off earlier than expected, a gain is recorded as interest income when the payoff amount exceeds the recorded investment.
For acquired loans not considered credit impaired ("non-PCI"), we recognize the entire fair value discount accretion to interest income, based on contractual cash flows using an effective interest rate method for term loans, and on a straight line basis for revolving lines. When a non-PCI loan is placed on non-accrual status subsequent to acquisition, accretion stops until the loan is returned to accrual status. The level of accretion on non-PCI loans varies from period to period due to maturities and early pay-offs of these loans during the reporting periods. Subsequent to acquisition, if the probable and estimable losses for non-PCI loans exceed the amount of the remaining unaccreted discount, the excess is established as an allowance for loan losses.
For further information regarding our acquired loans, see Note 3, Loans and Allowance for Loan Losses.
Allowance for Loan Losses is based upon estimates of loan losses and is maintained at a level considered adequate to provide for probable losses inherent in the loan portfolio. The allowance is increased by provisions for loan losses charged against earnings and reduced by charge-offs, net of recoveries.
In periodic evaluations of the adequacy of the allowance balance, Management considers current economic conditions, known and inherent risks in the portfolio, adverse situations that may affect the borrower's ability to repay, the estimated value of any underlying collateral, our past loan loss experience and other factors. The ALLL is based on estimates, and ultimate losses may vary from current estimates. Our Board of Directors' Asset/Liability Management Committee (“ALCO”) reviews the adequacy of the ALLL at least quarterly.
The overall allowance consists of 1) specific allowances for individually identified impaired loans ("ASC 310-10") and 2) general allowances for pools of loans ("ASC 450-20"), which incorporate quantitative (e.g., historical loan loss rates) and qualitative risk factors (e.g., portfolio growth and trends, credit concentrations, economic and regulatory factors, etc.).
The first component, specific allowances, results from the analysis of identified problem credits and the evaluation of sources of repayment including collateral, as applicable. Through Management's ongoing loan grading and credit monitoring process, individual loans are identified that have conditions indicating the borrower may be unable to pay all amounts due in accordance with the contractual terms. These loans are evaluated for impairment individually by Management. Management considers an originated loan to be impaired when it is probable we will be unable to collect all amounts due according to the contractual terms of the loan agreement. When the fair value of the impaired loan is less than the recorded investment in the loan, the difference is recorded as an impairment through the establishment of a specific allowance. For loans determined to be impaired, the extent of the impairment is measured based on the present value of expected future cash flows discounted at the loan's effective interest rate at origination (for originated loans), based on the loan's observable market price, or based on the fair value of the collateral if the loan is collateral dependent or if foreclosure is imminent. Generally, with problem credits that are collateral dependent, we obtain appraisals of the collateral at least annually. We may obtain appraisals more frequently if we believe the collateral value is subject to market volatility, if a specific event has occurred to the collateral, or if we believe foreclosure is imminent.
The second component is an estimate of the probable inherent losses in each loan pool with similar characteristics. This analysis encompasses the entire loan portfolio, excluding individually identified impaired loans and acquired loans whose purchase discount has not been fully accreted. Under our allowance model, loans are evaluated on a pool basis by federal regulatory reporting codes ("CALL codes" or "segments"), which are further delineated by assigned credit risk ratings, as described in Note 3, Loans and Allowance for Loan Losses. Segments include the following:
• | Loans secured by real estate: |
- 1-4 family residential construction loans
- Other construction loans and all land development and other land loans
- Secured by farmland (including residential and other improvements)
- Revolving, open-end loans secured by 1-4 family residential properties and extended under lines of credit
- Closed-end loans secured by 1-4 family residential properties, secured by first liens
- Closed-end loans secured by 1-4 family residential properties, secured by junior liens
- Secured by multifamily (5 or more) residential properties
Page-56
- Loans secured by owner-occupied non-farm nonresidential properties
- Loans secured by other non-farm nonresidential properties
• | Loans to finance agricultural production and other loans to farmers |
• | Commercial and industrial loans |
• | Loans to individuals for household, family and other personal expenditures (i.e., consumer loans) |
• | Other loans |
The model determines general allowances by loan segment based on quantitative (loss history) and qualitative risk factors. Qualitative internal and external risk factors include, but are not limited to, the following:
• | Changes in the nature and volume of the loan portfolio. |
• | Changes in the volume and severity of past due loans, the volume of non-accruals loans, and the volume and severity of adversely classified or graded loans. |
• | The existence and effect of individual loan and loan segment concentrations. |
• | Changes in lending policies and procedures, including changes in underwriting standards and collection, charge-off, and recovery practices not considered elsewhere. |
• | Changes in the experience, ability, and depth of lending management and other relevant staff. |
• | Changes in the quality of our systematic loan review processes. |
• | Changes in economic and business conditions, and developments that affect the collectability of the portfolio. |
• | Changes in the value of underlying collateral, where applicable. |
• | The effect of other external factors such as legal and regulatory requirements on the level of estimated credit losses in the portfolio. |
• | The effect of acquisitions of other loan portfolios on our infrastructure, including risk associated with entering new geographic areas as a result of such acquisitions. |
• | The presence of specialized lending segments in the portfolio. |
Beginning with the quarter ended March 31, 2016, Management enhanced its methodology for determining the quantitative and qualitative risk factors assigned to unimpaired loans in order to capture historical loss information at the loan level, track loss migration through risk grade deterioration, increase efficiencies related to performing the calculations, and refine how we incorporate environmental and other unique risk elements into our estimation of credit losses. The changes in methodology did not result in a material difference in general allowances. Prior to March 31, 2016, under the Bank's allowance model, each segment was assigned a quantitative loss factor that was primarily based on a rolling twenty-quarter look-back at our historical losses for that particular segment, as well as a number of other assumptions. Under the current methodology, the quantitative risk factor for each segment utilizes the greater of either the historical loss method or migration analysis loss method based on loss history beginning March 2010.
Under the historical loss method, quarterly loss rates are calculated for each segment by dividing annualized net charge-offs during each quarter by the quarter's average segment balances. The quarterly loss rates are averaged over the entire loss history period. Under the migration analysis method, loss rates are calculated at the risk grade and segment levels by dividing the net charge-off amount by the total segment balance at the beginning of each migration period where the charged-off loan in question was present. Migration loss rates are averaged for each risk grade and segment for the entire loss history period. For each segment, the loss rates that result in the larger of the migration loss reserves or segment historical loss reserves are applied to the current loan balances. Qualitative factors are combined with these quantitative factors at the segment level to arrive at the overall general allowances.
We establish specific allowances to account for credit deterioration for probable decreases in cash flows for PCI loans subsequent to acquisition. The estimated cash flows expected to be collected on PCI loans is updated quarterly and requires the use of key assumptions and estimates based on factors such as the current economic environment, changes in collateral values, loan workout plans, changes in the probability of default, loss severities, and prepayments. Probable decreases in expected cash flows after acquisition result in impairment recorded as a specific allowance for loan losses or a charge-off to the allowance. Impairment is calculated as the present value of the expected future cash flows on the PCI loan, discounted at the loan's effective interest rate implicit in the loan.
While we believe we use the best information available to determine the allowance for loan losses, our results of operations could be significantly affected if circumstances differ substantially from the assumptions used in determining the allowance. A decline in local and national economic conditions, or significant changes in other assumptions, could result in a material increase in the allowance for loan losses and may adversely affect our financial condition and results
Page-57
of operations. In addition, the determination of the amount of the allowance for loan losses is subject to review by bank regulators as part of their routine examination process, which may result in the establishment of additional allowance for loan losses based upon their judgment of information available to them at the time of their examination.
For further information regarding the allowance for loan losses, see Note 3, Loans and Allowance for Loan Losses.
Allowance for Losses on Off-Balance Sheet Commitments: We make commitments to extend credit to meet the financing needs of our customers in the form of loans or standby letters of credit. We are exposed to credit loss in the event that a decline in credit quality of the borrower leads to nonperformance. We record an allowance for losses on these off-balance sheet commitments based on estimates of probability that these commitments will be drawn upon according to our historical utilization experience on different types of commitments and expected loss severity. This allowance is included in interest payable and other liabilities on the consolidated statements of condition.
Transfers of Financial Assets: We have entered into certain participation agreements with other organizations. We account for these transfers of financial assets as sales when control over the transferred financial assets has been surrendered. Control over transferred assets is deemed to be surrendered when (1) the assets and liabilities have been isolated from us, (2) the transferee has the right to pledge or exchange the assets (or beneficial interests) it received, free of conditions that constrain it from taking advantage of that right, beyond a trivial benefit and (3) we do not maintain effective control over the transferred financial assets or third-party beneficial interests related to those transferred assets. No gain or loss has been recognized by us on the sale of these participation interests in 2017, 2016 and 2015.
Premises and Equipment: Premises and equipment consist of leasehold improvements, furniture, fixtures, software and equipment and are stated at cost, less accumulated depreciation and amortization, which are calculated on a straight-line basis. Furniture and fixtures are depreciated over eight years and equipment is generally depreciated over three to twenty years. Leasehold improvements are amortized over the lesser of their estimated useful lives or the terms of the leases. When assets are sold or otherwise disposed of, the cost and related accumulated depreciation or amortization are removed from the accounts and any resulting gain or loss is recognized in income for the period. The cost of maintenance and repairs is charged to expense as incurred.
Business Combinations: Business combinations are accounted for under the acquisition method of accounting in accordance with ASC 805, Business Combinations. Under the acquisition method the acquiring entity in a business combination recognizes the acquired assets and assumed liabilities at their estimated fair values as of the date of acquisition. Any excess of the purchase price over the fair value of net assets and other identifiable intangible assets acquired is recorded as goodwill. To the extent the fair value of net assets acquired, including other identifiable assets, exceed the purchase price, a bargain purchase gain is recognized. Assets acquired and liabilities assumed from contingencies must also be recognized at fair value, if the fair value can be determined during the measurement period. Results of operations of an acquired business are included in the consolidated statements of operations from the date of acquisition. Acquisition-related costs, including conversion and restructuring charges, are expensed as incurred.
Goodwill and Other Intangible Assets: Goodwill is determined as the excess of the fair value of the consideration transferred, plus the fair value of any noncontrolling interests in the acquiree, over the fair value of the net assets acquired and liabilities assumed as of the acquisition date. Goodwill that arises from a business combination is periodically evaluated for impairment at the reporting unit level, at least annually. Intangible assets with definite useful lives are amortized over their estimated useful lives to their estimated residual values. Core deposit intangible ("CDI") represents the estimated future benefit of deposits related to an acquisition and is booked separately from the related deposits and evaluated periodically for impairment. The CDI asset is amortized on an accelerated method over its estimated useful life of ten years. At December 31, 2017, the future estimated amortization expense for the CDI arising from our past acquisitions is as follows:
(in thousands) | 2018 | 2019 | 2020 | 2021 | 2022 | Thereafter | Total | ||||||||||||||
Core deposit intangible amortization | $ | 921 | $ | 887 | $ | 853 | $ | 818 | $ | 782 | $ | 2,231 | $ | 6,492 | |||||||
We make a qualitative assessment of whether it is more likely than not that the fair value of a reporting unit where goodwill is assigned is less than its carrying amount. If we conclude that it is more likely than not that the fair value is more than its carrying amount, no impairment is recorded. Goodwill is tested for impairment on an interim basis if circumstances change or an event occurs between annual tests that would more likely than not reduce the fair value
Page-58
of the reporting unit below its carrying amount. The qualitative assessment includes adverse events or circumstances identified that could negatively affect the reporting units’ fair value as well as positive and mitigating events. Such indicators may include, among others, a significant change in legal factors or in the general business climate, significant change in our stock price and market capitalization, unanticipated competition, and an action or assessment by a regulator. If the fair value of a reporting unit is less than its carrying amount, an impairment charge for the amount by which the carrying amount exceeds the reporting unit's fair value is recognized. The loss recognized should not exceed the total amount of goodwill allocated to that reporting unit.
In January 2017, the FASB issued ASU No. 2017-04, Intangibles - Goodwill and Other (Topic 350): Simplifying the Test for Goodwill Impairment. The ASU is effective for fiscal years beginning after December 15, 2019. Early adoption is permitted for interim or annual goodwill impairment tests performed on testing dates after January 1, 2017. We early adopted this ASU effective January 1, 2017, which did not have a material impact on our financial condition and results of operations.
Other Real Estate Owned ("OREO"): OREO is comprised of property acquired through foreclosure, in substance repossession or acceptance of deeds-in-lieu of foreclosure when the related loan receivable is de-recognized. OREO is recorded at fair value of the collateral less estimated costs to sell, establishing a new cost basis, and subsequently accounted for at the lower of cost or fair value less estimated costs to sell. Any shortfall of collateral value from the recorded investment of the related loan is recognized as loss at the time of foreclosure and is charged against the allowance for loan losses. Fair value of collateral is generally based on an independent appraisal of the property. Revenues and expenses associated with OREO, and subsequent adjustments to the fair value of the property and to the estimated costs of disposal, are realized and reported as a component of non-interest income and expense when incurred.
Bank Owned Life Insurance ("BOLI"): The Bank owns life insurance policies on certain key current and former officers. BOLI is recorded in interest receivable and other assets on the consolidated statements of condition at the amount that can be realized under the insurance contract at the period end, which is the cash surrender value adjusted for other charges or amounts due that are probable at settlement.
Federal Home Loan Bank of San Francisco ("FHLB") Stock: The Bank is a member of the FHLB. Members are required to own a certain amount of stock based on the level of borrowings and other factors. Our investment in FHLB stock is carried at cost and is included as part of interest receivable and other assets on the consolidated statements of condition. We periodically evaluate FHLB stock for impairment based on ultimate recovery of par value. Both cash and stock dividends are reported as non-interest income.
Investments in Low Income Housing Tax Credit Funds: We have invested in limited partnerships that were formed to develop and operate affordable housing projects for low or moderate-income tenants throughout California. Our ownership in each limited partnership is less than two percent. We account for the investments in qualified affordable housing tax credit funds using the proportional amortization method, where the initial cost of the investment is amortized in proportion to the tax credits and other tax benefits received and the net investment performance is recognized as part of income tax expense (benefit). Each of the partnerships must meet the regulatory minimum requirements for affordable housing for a minimum 15-year compliance period to fully utilize the tax credits. If the partnerships cease to qualify during the compliance period, the credit may be denied for any period in which the project is not in compliance and a portion of the credit previously taken is subject to recapture with interest. We record an impairment charge if the value of the future tax benefits is less than the carrying value of the investments.
Employee Stock Ownership Plan (“ESOP”): We recognize compensation cost of the ESOP contribution when funds become committed for the purchase of Bancorp's common shares into the ESOP in the year in which the employees render service entitling them to the contribution. If we contribute stock, the compensation cost is the fair value of the shares when they are committed to be released (i.e., when the number of shares becomes known and formally approved). In 2017, the Bank made only stock contributions to the ESOP. In 2016 and 2015, the Bank made only cash contributions to the ESOP without leveraging.
Income Taxes: Income taxes reported in the consolidated financial statements are computed based on an asset and liability approach. We recognize the amount of taxes payable or refundable for the current year and we record deferred tax assets and liabilities for future tax consequences attributable to differences between the financial statement carrying amount of existing assets and liabilities and their respective tax bases using enacted tax rates in effect for the year in
Page-59
which the temporary differences are expected to reverse. We record net deferred tax assets to the extent it is more likely than not that they will be realized. In evaluating our ability to recover the deferred tax assets and the need to establish a valuation allowance against the deferred tax assets, Management considers all available positive and negative evidence, including scheduled reversals of deferred tax liabilities, projected future taxable income, and tax planning strategies. In projecting future taxable income, Management develops assumptions including the amount of future state and federal pretax operating income, the reversal of temporary differences, and the implementation of feasible and prudent tax planning strategies. These assumptions require significant judgment about the forecasts of future taxable income and are consistent with the plans and estimates being used to manage the underlying business. Bancorp files consolidated federal and combined state income tax returns.
We recognize the financial statement effect of a tax position when it is more likely than not, based on the technical merits and all available evidence, that the position will be sustained upon examination, including the resolution through protests, appeals or litigation processes. For tax positions that meet the more-likely-than-not threshold, we measure and record the largest amount of tax benefit that is greater than fifty percent likely of being realized upon ultimate settlement with the taxing authority. The remainder of the benefits associated with tax positions taken is recorded as unrecognized tax benefits, along with any related interest and penalties. Interest and penalties related to unrecognized tax benefits are recorded in tax expense.
In deciding whether or not our tax positions taken meet the more-likely-than-not recognition threshold, we must make judgments and interpretations about the application of inherently complex state and federal tax laws. To the extent tax authorities disagree with tax positions taken by us, our effective tax rates could be materially affected in the period of settlement with the taxing authorities. Revision of our estimate of accrued income taxes also may result from our own income tax planning, which may affect effective tax rates and results of operations for any reporting period.
We present an unrecognized tax benefit as a reduction of a deferred tax asset for a net operating loss ("NOL") carryforward, or similar tax loss or tax credit carryforward, rather than as a liability, when (1) the uncertain tax position would reduce the NOL or other carryforward under the tax law of the applicable jurisdiction and (2) we intend to and are able to use the deferred tax asset for that purpose. Otherwise, the unrecognized tax benefit is presented as a liability instead of being netted with deferred tax assets.
Earnings per share (“EPS”) are based upon the weighted average number of common shares outstanding during each year. The following table shows: 1) weighted average basic shares, 2) potentially dilutive weighted average common shares related to stock options, unvested restricted stock awards and stock warrant, and 3) weighted average diluted shares. Basic EPS are calculated by dividing net income by the weighted average number of common shares outstanding during each annual period, excluding unvested restricted stock awards. Diluted EPS are calculated using the weighted average number of potentially dilutive common shares. The number of potentially dilutive common shares included in year-to-date diluted EPS is a year-to-date weighted average of potentially dilutive common shares included in each quarterly diluted EPS computation. In computing diluted EPS, we exclude anti-dilutive shares such as options whose exercise prices exceed the current common stock price as they would not reduce EPS under the treasury method. We have two forms of our outstanding common stock: common stock and unvested restricted stock awards. Holders of unvested restricted stock awards receive non-forfeitable dividends at the same rate as common shareholders and they both share equally in undistributed earnings. Under the two-class method, the difference in EPS is nominal for these participating securities.
(in thousands, except per share data) | 2017 | 2016 | 2015 | ||||||
Weighted average basic shares outstanding | 6,196 | 6,073 | 5,966 | ||||||
Potentially dilutive common shares related to: | |||||||||
Stock options | 62 | 34 | 41 | ||||||
Unvested restricted stock awards | 15 | 8 | 5 | ||||||
Warrant | — | — | 53 | ||||||
Weighted average diluted shares outstanding | 6,273 | 6,115 | 6,065 | ||||||
Net income | $ | 15,976 | $ | 23,134 | $ | 18,441 | |||
Basic EPS | $ | 2.58 | $ | 3.81 | $ | 3.09 | |||
Diluted EPS | $ | 2.55 | $ | 3.78 | $ | 3.04 | |||
Weighted average anti-dilutive shares not included in the calculation of diluted EPS | 21 | 64 | 36 | ||||||
Page-60
Share-Based Compensation: All share-based payments, including stock options and restricted stock, are recognized as stock-based compensation expense in the statements of comprehensive income based on the grant-date fair value of the award with a corresponding increase in common stock. The grant-date fair value of the award is amortized on a straight-line basis over the requisite service period, which is generally the vesting period. The stock-based compensation expense excludes stock grants to directors as compensation for their services, which are recognized as director expenses separately based on the grant-date value of the stock. See Note 8, Stockholders' Equity and Stock Option Plans for further discussion.
We determine fair value of stock options at the grant date using a Black-Scholes pricing model that takes into account the stock price at the grant date, the exercise price, the expected life of the option, the volatility of the underlying stock, the expected dividend yield and the risk-free interest rate over the expected life of the option. The expected term of options granted is derived from historical data on employee exercises and post-vesting employment termination behavior. The risk-free rate for periods within the expected life of the option is based on the U.S. Treasury yield curve in effect at the time of the grant. Expected volatility is based on the historical volatility of the common stock over the most recent period that is generally commensurate with the expected life of the options. The Black-Scholes option valuation model requires the input of highly subjective assumptions, including the expected life of the stock-based award and stock price volatility. The assumptions used represent Management's best estimates based on historical information, but these estimates involve inherent uncertainties and the application of Management's judgment. As a result, if other assumptions had been used, the recorded stock-based compensation expense could have been materially different from that recorded in the consolidated financial statements. The fair value of restricted stock is based on the stock price on grant date.
In March 2016, the FASB issued ASU No. 2016-09, Compensation - Stock Compensation (Topic 718): Improvements to Employee Share-Based Payment Accounting ("ASU 2016-09"). This ASU identifies areas for simplification involving several aspects of accounting for share-based payment transactions, including the income tax consequences, classification of awards as equity or liabilities, forfeiture accounting, and classifications on the statement of cash flows. We adopted the requirements of this ASU effective January 1, 2017, which impacted the following areas:
Forfeiture rates: We have elected to account for forfeitures as they occur. Previously, we accounted for forfeitures based on an estimate of the number of awards expected to vest. The policy change was applied using a modified retrospective approach and did not have a material effect on our financial condition or results of operations.
Income taxes: We have recorded excess tax benefits (deficiencies) resulting from the exercise of non-qualified stock options, the disqualifying disposition of incentive stock options and vesting of restricted stock awards as tax benefits (expense) in the consolidated statements of comprehensive income with a corresponding decrease (increase) to current taxes payable. Prior to the adoption of this ASU, excess tax benefits (deficiencies) were recognized as an increase (decrease) to common stock in the consolidated statements of changes in stockholders' equity. In addition, we have reflected excess tax benefits as an operating activity in the consolidated statements of cash flows. Prior to the adoption of this ASU, excess tax benefits were reflected as a financing activity. We applied the amendment prospectively and did not reclassify cash flows from operating and financing activities in the prior period consolidated financial statements. For the year ended December 31, 2017, we recognized $214 thousand in excess tax benefits recorded as a reduction to income tax expense.
Statutory tax withholding: Cash paid for tax withholdings when shares are surrendered in a cashless stock option exchange has been classified as a financing activity in the consolidated statements of cash flows. There were no shares surrendered for tax withholdings prior to the adoption of ASU 2016-09.
Derivative Financial Instruments and Hedging Activities - Fair Value Hedges: All of our interest rate swap contracts are designated and qualified as fair value hedges. The terms of our interest rate swap contracts are closely aligned to the terms of the designated fixed-rate loans. The hedging relationships are tested for effectiveness on a quarterly basis. The interest rate swaps are carried on the consolidated statements of condition at their fair value in other assets (when the fair value is positive) or in other liabilities (when the fair value is negative). The changes in the fair value of the interest rate swaps are recorded in interest income. The unrealized gains or losses due to changes in fair value of the hedged fixed-rate loans are recorded as an adjustment to the hedged loans and offset in interest income. For derivative instruments executed with the same counterparty under a master netting arrangement, we do not offset fair value amounts of interest rate swaps in liability positions with the ones in asset positions.
Page-61
From time to time, we make firm commitments to enter into long-term fixed-rate loans with borrowers backed by yield maintenance agreements and simultaneously enter into forward interest rate swap agreements with correspondent banks to mitigate the change in fair value of the yield maintenance agreement. Prior to loan funding, yield maintenance agreements with net settlement features that meet the definition of a derivative are considered as non-designated hedges and are carried on the consolidated statements of condition at their fair value in other assets (when the fair value is positive) or in other liabilities (when the fair value is negative). The offsetting changes in the fair value of the forward swap and the yield maintenance agreement are recorded in interest income. When the fixed-rate loans are originated, the forward swaps are designated to offset the change in fair value in the loans. Subsequent to the point of the swap designations, the fair value of the related yield maintenance agreements at the designation date was recorded in other assets and is amortized using the effective yield method over the life of the respective designated loans.
The net effect of the change in fair value of interest rate swaps, the amortization of the yield maintenance agreement and the change in the fair value of the hedged loans result in an insignificant amount of hedge ineffectiveness recognized in interest income. For further detail, see Note 14, Derivative Financial Instruments and Hedging Activities.
Advertising Costs are expensed as incurred. For the years ended December 31, 2017, 2016, and 2015, advertising costs totaled $567 thousand, $565 thousand, and $334 thousand, respectively.
Comprehensive Income includes net income, changes in the unrealized gains or losses on available-for-sale investment securities, and amortization of net unrealized gains or losses on securities transferred from available-for-sale to held-to-maturity, net of related taxes, reported on the consolidated statements of comprehensive income and as components of stockholders' equity.
Fair Value Measurements: We use fair value measurements to record fair value adjustments to certain assets and liabilities and to determine fair value disclosures. We base our fair values on the price that would be received to sell an asset or paid to transfer a liability in an orderly transaction between market participants at the measurement date. Securities available-for-sale and derivatives are recorded at fair value on a recurring basis. Additionally, from time to time, we may be required to record certain assets and liabilities at fair value on a non-recurring basis, such as purchased loans and acquired deposits recorded at acquisition date, certain impaired loans, other real estate owned and securities held-to-maturity that are other-than-temporarily impaired. These non-recurring fair value adjustments typically involve write-downs of individual assets due to application of lower-of-cost or market accounting.
When we develop our fair value measurement process, we maximize the use of observable inputs. Whenever there is no readily available market data, we use our best estimates and assumptions in determining fair value, but these estimates involve inherent uncertainties and the application of Management's judgment. As a result, if other assumptions had been used, our recorded earnings or disclosures could have been materially different from those reflected in these consolidated financial statements.
For detailed information on our use of fair value measurements and our related valuation methodologies, see Note 9, Fair Value of Assets and Liabilities.
Use of Estimates: The preparation of financial statements in conformity with generally accepted accounting principles in the United States of America requires Management to make estimates and assumptions that affect the reported amounts of assets and liabilities and disclosure of contingent amounts of revenues and expenses during the reporting period. Actual results could differ from those estimates. Significant accounting estimates reflected in the consolidated financial statements include ALLL, other-than-temporary impairment of investment securities, accrued liabilities, accounting for income taxes and fair value measurements (including fair values of acquired assets and assumed liabilities at acquisition dates) as discussed in the Notes herein.
Recently Issued Accounting Standards
In May 2014, the FASB issued ASU No. 2014-09, Revenue from Contracts with Customers (Topic 606). This ASU is a converged standard involving FASB and International Financial Reporting Standards that provides a single comprehensive revenue recognition model for all contracts with customers across transactions and industries. The core principle of the guidance is that an entity should recognize revenue to depict the transfer of promised goods or services to customers in an amount and at a time that reflects the consideration to which the entity expects to be
Page-62
entitled in exchange for those goods or services. Subsequent updates related to Revenue from Contracts with Customers (Topic 606) are as follows:
• | August 2015 ASU No. 2015-14 - Deferral of the Effective Date, institutes a one-year deferral of the effective date of this amendment to interim and annual reporting periods beginning after December 15, 2017. Early application is permitted only as of annual periods beginning after December 15, 2016, including interim reporting periods within that reporting period. |
• | March 2016 ASU No. 2016-08 - Principal versus Agent Considerations (Reporting Revenue Gross versus Net), clarifies the implementation guidance on principal versus agent considerations and on the use of indicators that assist an entity in determining whether it controls a specified good or service before it is transferred to the customer. |
• | April 2016 ASU No. 2016-10 - Identifying Performance Obligations and Licensing, provides guidance in determining performance obligations in a contract with a customer and clarifies whether a promise to grant a license provides a right to access or the right to use intellectual property. |
• | May 2016 ASU No. 2016-12 - Narrow Scope Improvements and Practical Expedients, gives further guidance on assessing collectability, presentation of sales taxes, noncash consideration, and completed contracts and contract modifications at transition. |
• | December 2016 ASU No. 2016-20 - Technical Corrections and Improvements to Topic 606, further clarifies specific aspects of previously issued guidance or corrects unintended application of the guidance. |
Our revenue is mainly comprised of interest income on financial instruments, which is explicitly excluded from the scope of ASU 2014-09. We have identified applicable sources of non-interest income and are gathering and reviewing related contracts and evaluating their potential impact to our revenue recognition under the new standards. While the recognition of certain components of our non-interest income may be affected by the ASU, we do not expect it to have a material impact on our financial condition and results of operations.
In January 2016, the FASB issued ASU No. 2016-01, Financial Instruments - Overall (Subtopic 825-10): Recognition and Measurement of Financial Assets and Financial Liabilities. The amendments in this ASU make improvements to accounting standards related to financial instruments, including the following:
• | Requires equity investments, except for those accounted for under the equity method of accounting or those that result in consolidation of the investee, to be measured at fair value with changes in fair value recognized in net income. However, an entity may choose to measure equity investments that do not have readily determinable fair values at cost minus impairment, if any, plus or minus changes resulting from observable price changes in orderly transactions for the identical or a similar investment of the same issuer. |
• | Simplifies the impairment assessment of equity investments without readily determinable fair values by requiring a qualitative assessment to identify impairment. When impairment exists, an entity is required to measure the investment at fair value. |
• | Eliminates the requirement to disclose the method(s) and significant assumptions used to estimate the fair value that is currently required to be disclosed for financial instruments measured at amortized cost on the consolidated balance sheet. |
• | Requires public companies to use the exit price notion when measuring the fair value of financial instruments for disclosure purposes. |
• | Requires separate presentation of financial assets and financial liabilities by measurement category and form of financial asset (i.e., securities or loans and receivables) on the balance sheet or the accompanying notes to the financial statements. |
• | Clarifies that an entity should evaluate the need for a valuation allowance on a deferred tax asset related to available-for-sale securities in combination with the entity's other deferred tax assets. |
ASU 2016-01 is effective for fiscal years beginning after December 15, 2017, including interim periods within those fiscal years. This ASU may affect our financial statement presentation and related footnotes, but we do not expect it to have a material impact on our financial condition or results of operations.
Page-63
In February 2016, the FASB issued ASU No. 2016-02, Leases (Topic 842). The amendments in this ASU intend to increase transparency and comparability among organizations by recognizing an asset, which represents the right to use the asset for the lease term, and a lease liability, which is a lessee's obligation to make lease payments measured on a discounted basis. This ASU generally applies to leasing arrangements exceeding a twelve month term. ASU 2016-02 is effective for annual periods, including interim periods within those annual periods beginning after December 15, 2018 and requires a modified retrospective method of adoption. Early application of the amendments is permitted. We intend to adopt this ASU during the first quarter of 2019, as required, and are continuing to evaluate our lease agreements and potential accounting software solutions as they become available. As of December 31, 2017, our undiscounted operating lease obligations that were off-balance sheet totaled $18.8 million (See Note 12, Commitments and Contingencies). Upon adoption of this ASU, the present values of leases currently classified as operating leases will be recognized as lease assets and liabilities on our consolidated balance sheets. Additional disclosures of key information about our leasing arrangements will also be required. We do not expect that the ASU will have a material impact on our capital ratios or return on average assets when adopted and we are currently evaluating the effect that the ASU will have on other components of our financial condition and results of operations.
In June 2016, the FASB issued ASU No. 2016-13, Financial Instruments - Credit Losses (Topic 326): Measurement of Credit Losses on Financial Instruments. Under the new guidance, entities will be required to measure expected credit losses by utilizing forward-looking information to assess an entity's allowance for credit losses. The measurement of expected credit losses will be based on historical experience, current conditions and reasonable and supportable forecasts that affect the collectability of a credit over its remaining life. In addition, the ASU amends the accounting for potential credit losses on available-for-sale debt securities and purchased financial assets with credit deterioration. ASU 2016-13 is effective for fiscal years beginning after December 15, 2019, including interim periods within those fiscal years. Early adoption is permitted for fiscal years beginning after December 15, 2018, including interim periods within those fiscal years. We have formed an internal Current Expected Credit Loss ("CECL") committee and are working with our third party vendor to determine the appropriate methodologies and resources to utilize in preparation for transition to the new accounting standards.
In August 2016, the FASB issued ASU No. 2016-15, Statement of Cash Flows (Topic 230): Classification of Certain Cash Receipts and Cash Payments. This ASU provides guidance on how to present and classify eight specific cash flow topics in the statement of cash flows. The ASU is effective for fiscal years beginning after December 15, 2017, and interim periods within those fiscal years. Early adoption is permitted, including adoption in an interim period. The amendments should be applied using a retrospective transition method to each period presented, if practical. This ASU may affect our presentation of certain cash flows and their categorization as operating, investing or financing activities in the consolidated statements of cash flows, but we do not expect it to have a material impact on our financial condition or results of operations.
In January 2017, the FASB issued ASU No. 2017-01, Business Combinations (Topic 805): Clarifying the Definition of a Business. The amendments are intended to help companies evaluate whether transactions should be accounted for as acquisitions (or disposals) of assets or businesses and provide a more robust framework to use in determining when a set of assets and activities is a business. The amendments are effective for annual periods after December 31, 2017, including interim periods within those periods. The amendments will be adopted prospectively. We will consider these amendments in our evaluation of the accounting for any future business acquisitions or asset disposals.
In May 2017, the FASB issued ASU No. 2017-09, Compensation - Stock Compensation (Topic 718): Scope of Modification Accounting. This ASU applies to entities that change the terms or conditions of a share-based payment award. The FASB adopted this ASU to provide clarity in what constitutes a modification and to reduce diversity in practice in applying Topic 718. In order for a change to a share-based arrangement to not require Topic 718 modification accounting treatment, all of the following must be met: no change in fair value, no change in vesting conditions and no change in the balance sheet classification of the modified award. The ASU is effective for fiscal years beginning after December 15, 2017, including interim periods within those periods. Early adoption is permitted, including adoption in an interim period. The amendments should be applied prospectively to an award modified on or after the adoption date. We do not expect this ASU to have a material impact on our financial condition or results of operations.
In August 2017, the FASB issued ASU No. 2017-12, Derivatives and Hedging (Topic 815): Targeted Improvements to Accounting for Hedging Activities. This amendment changes both the designation and measurement guidance for qualifying hedging relationships and the presentation of hedge results. It is intended to more closely align hedge accounting with companies' risk management strategies, simplify the application of hedge accounting, and increase
Page-64
transparency as to the scope and results of hedging programs. The ASU is effective for fiscal years beginning after December 15, 2018, and interim periods within those fiscal years. Early adoption is permitted, including adoption in an interim period. The amended presentation and disclosure guidance will be required prospectively. We expect this amendment to affect the presentation of our hedging activities, but we do not expect it to have a material impact on our financial condition or results of operations.
In February 2018, the FASB issued ASU No. 2018-02, Income Statement - Reporting Comprehensive Income (Topic 220): Reclassification of Certain Tax Effects from Accumulated Other Comprehensive Income. This amendment helps organizations address certain stranded income tax effects in accumulated other comprehensive income (AOCI) resulting from the enactment of the Tax Cuts and Jobs Act of 2017. The ASU requires financial statement preparers to disclose a description of the accounting policy for releasing income tax effects from AOCI, whether they elect to reclassify the stranded income tax effects from the Tax Cuts and Jobs Act of 2017 and information about the other income tax effects that are reclassified. The amendments are effective for all organizations for fiscal years beginning after December 15, 2018, and interim periods within those fiscal years. Early adoption is permitted. The amendments in this ASU should be applied either in the period of adoption or retrospectively to each period (or periods) in which the effect of the change in the U.S. federal corporate tax rate in the Tax Cuts and Jobs Act of 2017 is recognized. We are early adopting this ASU in the first quarter of 2018 by reclassifying $637 thousand from AOCI to retained earnings. This amount represents the stranded income tax effects related to the unrealized loss on available-for-sale securities in AOCI on the date of the enactment of the Tax Cuts and Jobs Act of 2017.
Note 2: Investment Securities
Our investment securities portfolio consists of obligations of state and political subdivisions, corporate bonds, U.S. government agency securities, including mortgage-backed securities (“MBS”) and collateralized mortgage obligations (“CMOs”) issued or guaranteed by Federal National Mortgage Association ("FNMA"), Federal Home Loan Mortgage Corporation ("FHLMC"), or Government National Mortgage Association ("GNMA"), Small Business Administration ("SBA") backed securities, debentures issued by government-sponsored agencies such as FNMA, Federal Farm Credit Bureau, FHLB and FHLMC, as well as privately issued CMOs, as reflected in the table below:
December 31, 2017 | December 31, 2016 | |||||||||||||||||||||||
Amortized | Fair | Gross Unrealized | Amortized | Fair | Gross Unrealized | |||||||||||||||||||
(in thousands) | Cost | Value | Gains | (Losses) | Cost | Value | Gains | (Losses) | ||||||||||||||||
Held-to-maturity: | ||||||||||||||||||||||||
Obligations of state and political subdivisions | $ | 19,646 | $ | 19,998 | $ | 383 | $ | (31 | ) | $ | 30,856 | $ | 31,544 | $ | 694 | $ | (6 | ) | ||||||
Corporate bonds | — | — | — | — | 3,519 | 3,518 | — | (1 | ) | |||||||||||||||
MBS pass-through securities issued by FHLMC and FNMA | 100,376 | 100,096 | 234 | (514 | ) | 10,063 | 10,035 | 126 | (154 | ) | ||||||||||||||
CMOs issued by FHLMC | 31,010 | 30,938 | 2 | (74 | ) | — | — | — | — | |||||||||||||||
Total held-to-maturity | 151,032 | 151,032 | 619 | (619 | ) | 44,438 | 45,097 | 820 | (161 | ) | ||||||||||||||
Available-for-sale: | ||||||||||||||||||||||||
Securities of U.S. government agencies: | ||||||||||||||||||||||||
MBS pass-through securities issued by FHLMC and FNMA | 65,559 | 65,262 | 126 | (423 | ) | 193,384 | 189,959 | 145 | (3,570 | ) | ||||||||||||||
SBA-backed securities | 25,979 | 25,982 | 58 | (55 | ) | 614 | 607 | — | (7 | ) | ||||||||||||||
CMOs issued by FNMA | 35,340 | 35,125 | 33 | (248 | ) | 13,790 | 13,772 | 91 | (109 | ) | ||||||||||||||
CMOs issued by FHLMC | 70,514 | 69,889 | 3 | (628 | ) | 43,452 | 42,758 | 37 | (731 | ) | ||||||||||||||
CMOs issued by GNMA | 17,953 | 17,785 | 26 | (194 | ) | 6,844 | 6,945 | 102 | (1 | ) | ||||||||||||||
Debentures of government- sponsored agencies | 12,940 | 12,938 | 3 | (5 | ) | 35,486 | 35,403 | 7 | (90 | ) | ||||||||||||||
Privately issued CMOs | 1,432 | 1,431 | 1 | (2 | ) | 419 | 419 | 1 | (1 | ) | ||||||||||||||
Obligations of state and political subdivisions | 98,027 | 97,491 | 298 | (834 | ) | 79,306 | 77,701 | 135 | (1,740 | ) | ||||||||||||||
Corporate bonds | 6,541 | 6,564 | 26 | (3 | ) | 4,959 | 5,016 | 57 | — | |||||||||||||||
Total available-for-sale | 334,285 | 332,467 | 574 | (2,392 | ) | 378,254 | 372,580 | 575 | (6,249 | ) | ||||||||||||||
Total investment securities | $ | 485,317 | $ | 483,499 | $ | 1,193 | $ | (3,011 | ) | $ | 422,692 | $ | 417,677 | $ | 1,395 | $ | (6,410 | ) | ||||||
Page-65
The amortized cost and fair value of investment debt securities by contractual maturity at December 31, 2017 are shown below. Expected maturities may differ from contractual maturities if the issuers of the securities have the right to call or prepay obligations with or without call or prepayment penalties.
December 31, 2017 | December 31, 2016 | |||||||||||||||||||||||
Held-to-Maturity | Available-for-Sale | Held-to-Maturity | Available-for-Sale | |||||||||||||||||||||
(in thousands) | Amortized Cost | Fair Value | Amortized Cost | Fair Value | Amortized Cost | Fair Value | Amortized Cost | Fair Value | ||||||||||||||||
Within one year | $ | 2,151 | $ | 2,172 | $ | 10,268 | $ | 10,272 | $ | 13,473 | $ | 13,506 | $ | 20,136 | $ | 20,109 | ||||||||
After one but within five years | 15,577 | 15,791 | 71,576 | 71,237 | 16,706 | 17,150 | 58,334 | 58,267 | ||||||||||||||||
After five years through ten years | 54,641 | 54,554 | 129,723 | 128,954 | 3,000 | 3,125 | 113,576 | 110,842 | ||||||||||||||||
After ten years | 78,663 | 78,515 | 122,718 | 122,004 | 11,259 | 11,316 | 186,208 | 183,362 | ||||||||||||||||
Total | $ | 151,032 | $ | 151,032 | $ | 334,285 | $ | 332,467 | $ | 44,438 | $ | 45,097 | $ | 378,254 | $ | 372,580 | ||||||||
Sales of investment securities and gross gains and losses are shown in the following table.
(in thousands) | 2017 | 2016 | 2015 | ||||||
Available-for-sale: | |||||||||
Sales proceeds | $ | 55,408 | $ | 68,673 | $ | 2,099 | |||
Gross realized gains | $ | 46 | $ | 458 | $ | 7 | |||
Gross realized losses | $ | (231 | ) | $ | (64 | ) | $ | (1 | ) |
Held-to-maturity: | |||||||||
Sales proceeds | $ | — | $ | 1,265 | $ | 1,015 | |||
Gross realized gains | $ | — | $ | 32 | $ | 73 | |||
Gross realized losses | $ | — | $ | — | $ | — | |||
Pledged investment securities are shown in the following table:
(in thousands) | December 31, 2017 | December 31, 2016 | ||||
Pledged to the State of California: | ||||||
Secure public deposits in compliance with the Local Agency Security Program | $ | 107,829 | $ | 108,304 | ||
Collateral for trust deposits | 761 | 822 | ||||
Total investment securities pledged to the State of California | $ | 108,590 | $ | 109,126 | ||
Collateral for Wealth Management and Trust Services ("WMTS') checking account | $ | 2,026 | $ | 2,146 | ||
As part of our ongoing review of our investment securities portfolio, we reassessed the classification of certain MBS pass-through and CMOs securities issued by FHLMC and FNMA. During 2017, we transferred $129 million of these securities, which we intend and have the ability to hold to maturity, from available-for-sale securities to held-to-maturity at fair value. The net unrealized pre-tax losses of $3.0 million at the date of transfer remained in accumulated other comprehensive income and are amortized over the remaining lives of the securities. Amortization of the net unrealized pre-tax losses totaled $426 thousand in 2017, and $21 thousand and $61 thousand in 2016 and 2015, respectively, for securities transferred from available-for-sale to held-to-maturity in 2014. There were no securities transferred from available-for-sale to held to maturity in 2016 or 2015.
Other-Than-Temporarily Impaired ("OTTI") Debt Securities
We have evaluated the credit of our investment securities and their issuers and/or insurers. Based on our evaluation, Management has determined that no investment security in our investment portfolio is other-than-temporarily impaired as of December 31, 2017. We do not have the intent and it is more likely than not that we will not have to sell the remaining securities temporarily impaired at December 31, 2017 before recovery of the amortized cost basis.
Page-66
There were 198 and 134 securities in unrealized loss positions at December 31, 2017 and 2016, respectively. Those securities are summarized and classified according to the duration of the loss period in the tables below:
December 31, 2017 | < 12 continuous months | ≥ 12 continuous months | Total securities in a loss position | |||||||||||||||||
(in thousands) | Fair value | Unrealized loss | Fair value | Unrealized loss | Fair value | Unrealized loss | ||||||||||||||
Held-to-maturity: | ||||||||||||||||||||
MBS pass-through securities issued by FHLMC and FNMA | $ | 16,337 | $ | (143 | ) | $ | 46,845 | $ | (371 | ) | $ | 63,182 | $ | (514 | ) | |||||
Obligations of state and political subdivisions | 3,648 | (31 | ) | — | — | 3,648 | (31 | ) | ||||||||||||
CMOs issued by FHLMC | 11,066 | (31 | ) | 13,824 | (43 | ) | 24,890 | (74 | ) | |||||||||||
Total held-to-maturity | 31,051 | (205 | ) | 60,669 | (414 | ) | 91,720 | (619 | ) | |||||||||||
Available-for-sale: | ||||||||||||||||||||
MBS pass-through securities issued by FHLMC and FNMA | 32,189 | (121 | ) | 15,325 | (302 | ) | 47,514 | (423 | ) | |||||||||||
SBA-backed securities | 11,028 | (53 | ) | 165 | (2 | ) | 11,193 | (55 | ) | |||||||||||
CMOs issued by FNMA | 26,401 | (171 | ) | 5,440 | (77 | ) | 31,841 | (248 | ) | |||||||||||
CMOs issued by FHLMC | 69,276 | (628 | ) | — | — | 69,276 | (628 | ) | ||||||||||||
CMOs issued by GNMA | 14,230 | (194 | ) | — | — | 14,230 | (194 | ) | ||||||||||||
Debentures of government-sponsored agencies | 2,984 | (5 | ) | — | — | 2,984 | (5 | ) | ||||||||||||
Obligations of state and political subdivisions | 52,197 | (288 | ) | 19,548 | (546 | ) | 71,745 | (834 | ) | |||||||||||
Corporate bonds | 3,060 | (3 | ) | 3,060 | (3 | ) | ||||||||||||||
Privately issued CMO's | 1,310 | (2 | ) | — | — | 1,310 | (2 | ) | ||||||||||||
Total available-for-sale | 212,675 | (1,465 | ) | 40,478 | (927 | ) | 253,153 | (2,392 | ) | |||||||||||
Total temporarily impaired securities | $ | 243,726 | $ | (1,670 | ) | $ | 101,147 | $ | (1,341 | ) | $ | 344,873 | $ | (3,011 | ) | |||||
December 31, 2016 | < 12 continuous months | > 12 continuous months | Total securities in a loss position | |||||||||||||||||
(in thousands) | Fair value | Unrealized loss | Fair value | Unrealized loss | Fair value | Unrealized loss | ||||||||||||||
Held-to-maturity: | ||||||||||||||||||||
MBS pass-through securities issued by FHLMC and FNMA | $ | 2,250 | $ | (154 | ) | $ | — | $ | — | $ | 2,250 | $ | (154 | ) | ||||||
Obligations of state and political subdivisions | 3,362 | (6 | ) | — | — | 3,362 | (6 | ) | ||||||||||||
Corporate bonds | 3,518 | (1 | ) | — | — | 3,518 | (1 | ) | ||||||||||||
Total held-to-maturity | 9,130 | (161 | ) | — | — | 9,130 | (161 | ) | ||||||||||||
Available-for-sale: | ||||||||||||||||||||
MBS pass-through securities issued by FHLMC and FNMA | 161,409 | (3,570 | ) | — | — | 161,409 | (3,570 | ) | ||||||||||||
SBA-backed securities | 607 | (7 | ) | — | — | 607 | (7 | ) | ||||||||||||
CMOs issued by FNMA | 9,498 | (109 | ) | — | — | 9,498 | (109 | ) | ||||||||||||
CMOs issued by FHLMC | 31,545 | (731 | ) | — | — | 31,545 | (731 | ) | ||||||||||||
CMOs issued by GNMA | 1,583 | (1 | ) | — | — | 1,583 | (1 | ) | ||||||||||||
Debentures of government- sponsored agencies | 19,951 | (38 | ) | 9,946 | (52 | ) | 29,897 | (90 | ) | |||||||||||
Obligations of state and political subdivisions | 59,567 | (1,740 | ) | — | — | 59,567 | (1,740 | ) | ||||||||||||
Corporate bonds | 154 | (1 | ) | — | — | 154 | (1 | ) | ||||||||||||
Total available-for-sale | 284,314 | (6,197 | ) | 9,946 | (52 | ) | 294,260 | (6,249 | ) | |||||||||||
Total temporarily impaired securities | $ | 293,444 | $ | (6,358 | ) | $ | 9,946 | $ | (52 | ) | $ | 303,390 | $ | (6,410 | ) | |||||
Page-67
As of December 31, 2017, fifty-five investment securities in our portfolio had been in a continuous loss position for twelve months or more. They consisted of thirty-two obligations of U.S. state and political subdivisions, four CMOs issued by FHLMC, three CMOs issued by FNMA and sixteen agency MBS securities. We have evaluated each issuer's financial information as well as credit enhancement and guarantees, and believe that the decline in fair value is primarily driven by factors other than credit. It is probable that we will be able to collect all amounts due according to the contractual terms and no other-than-temporary impairment exists on these securities. Based upon our assessment of the credit fundamentals, we concluded that these securities were not other-than-temporarily impaired at December 31, 2017.
There were one hundred forty-three investment securities in our portfolio that had been in temporary loss positions for less than twelve months as of December 31, 2017, and their temporary loss positions mainly arose from changes in interest rates since purchase. They consisted of eighty-one obligations of U.S. state and political subdivisions, five corporate bonds, sixteen agency MBS securities, thirty-four agency CMOs, two privately issued CMOs and five debentures of government-sponsored agencies. Securities of government-sponsored agencies are supported by the U.S. Federal Government, which protects us from credit losses. Other temporarily impaired securities are deemed creditworthy after internal analysis of the issuers' latest financial information and credit enhancement. Additionally, all are rated as investment grade by at least one major rating agency. As a result of this impairment analysis, we concluded that these securities were not other-than-temporarily impaired at December 31, 2017.
Non-Marketable Securities
As a member of the FHLB, we are required to maintain a minimum investment in FHLB capital stock determined by the Board of Directors of the FHLB. The minimum investment requirements can increase in the event we increase our total asset size or borrowings with the FHLB. Shares cannot be purchased or sold except between the FHLB and its members at the $100 per share par value. We held $11.1 million and $10.2 million of FHLB stock recorded at cost in other assets on the consolidated statements of condition at December 31, 2017 and 2016, respectively. The carrying amounts of these investments are reasonable estimates of fair value because the securities are restricted to member banks and they do not have a readily determinable market value. Management does not believe that the FHLB stock is other-than-temporarily-impaired, due to FHLB's current financial position. On February 21, 2018, FHLB announced a cash dividend for the fourth quarter of 2017 at an annualized dividend rate of 7.00% to be distributed in mid-March 2018. Cash dividends paid on FHLB capital stock are recorded as non-interest income.
As a member bank of Visa U.S.A., we hold 16,939 shares of Visa Inc. Class B common stock with a carrying value of zero, which is equal to our cost basis. These shares are restricted from resale until their conversion into Class A (voting) shares upon the termination of Visa Inc.'s Covered Litigation escrow account. As a result of the restriction, these shares are not considered available-for-sale and are not carried at fair value. When converting this Class B common stock to Class A common stock under the conversion rate of 1.6483, as of the latest SEC Form 10-Q filed by Visa, Inc. on February 1, 2018, and the closing stock price of Class A shares, the value of our shares of Class B common stock would have been $3.2 million and $2.2 million at December 31, 2017 and 2016, respectively. The conversion rate is subject to further reduction upon the final settlement of the covered litigation against Visa Inc. and its member banks. See Note 12, Commitments and Contingencies herein.
We invest in low income housing tax credit funds as a limited partner, which totaled $2.1 million and $2.5 million recorded in other assets as of December 31, 2017 and 2016, respectively. In 2017, we recognized $332 thousand of low income housing tax credits and other tax benefits, net of $331 thousand of amortization expense of low income housing tax credit investment, as a component of income tax expense. As of December 31, 2017, our unfunded commitments for these low income housing tax credit funds totaled $546 thousand. We did not recognize any impairment losses on these low income housing tax credit investments during 2017 or 2016, as the value of the future tax benefits exceeds the carrying value of the investments.
On December 22, 2017, the Tax Cuts and Jobs Act of 2017 was signed into law, which reduces the federal corporate income tax rate from 35% to 21% for tax years beginning 2018. Due to the tax rate change, we revised the amortization schedule according to the proportional amortization method for the tax deduction benefits on these low income housing tax credit investments starting in 2018 using the 21% federal tax rate and recorded a catch-up amortization expense of $67 thousand in 2017 as a component of income tax expense.
Page-68
Note 3: Loans and Allowance for Loan Losses
Credit Quality of Loans
Virtually all of our loans are from customers located in California, primarily in Marin, Alameda, Sonoma, San Francisco and Napa counties. Approximately 87% and 85% of total loans were secured by real estate at December 31, 2017 and 2016, respectively. At December 31, 2017, 67% of our loans were for commercial real estate, 85% of which were secured by real estate located in Marin, Sonoma, Alameda, San Francisco and Napa counties (California).
The following table shows outstanding loans by class and payment aging as of December 31, 2017 and 2016.
Loan Aging Analysis by Class | ||||||||||||||||||||||||
(in thousands) | Commercial and industrial | Commercial real estate, owner-occupied | Commercial real estate, investor | Construction | Home equity | Other residential 1 | Installment and other consumer | Total | ||||||||||||||||
December 31, 2017 | ||||||||||||||||||||||||
30-59 days past due | $ | — | $ | — | $ | — | $ | — | $ | 99 | $ | 255 | $ | 330 | $ | 684 | ||||||||
60-89 days past due | 1,340 | — | — | — | — | — | — | 1,340 | ||||||||||||||||
90 days or more past due | — | — | — | — | 307 | — | — | 307 | ||||||||||||||||
Total past due | 1,340 | — | — | — | 406 | 255 | 330 | 2,331 | ||||||||||||||||
Current | 234,495 | 300,963 | 822,984 | 63,828 | 132,061 | 95,271 | 27,080 | 1,676,682 | ||||||||||||||||
Total loans 3 | $ | 235,835 | $ | 300,963 | $ | 822,984 | $ | 63,828 | $ | 132,467 | $ | 95,526 | $ | 27,410 | $ | 1,679,013 | ||||||||
Non-accrual loans 2 | $ | — | $ | — | $ | — | $ | — | $ | 406 | $ | — | $ | — | $ | 406 | ||||||||
December 31, 2016 | ||||||||||||||||||||||||
30-59 days past due | $ | 283 | $ | — | $ | — | $ | — | $ | 77 | $ | — | $ | 2 | $ | 362 | ||||||||
60-89 days past due | — | — | — | — | — | — | 49 | 49 | ||||||||||||||||
90 days or more past due | — | — | — | — | 91 | — | — | 91 | ||||||||||||||||
Total past due | 283 | — | — | — | 168 | — | 51 | 502 | ||||||||||||||||
Current | 218,332 | 247,713 | 724,228 | 74,809 | 117,039 | 78,549 | 25,444 | 1,486,114 | ||||||||||||||||
Total loans 3 | $ | 218,615 | $ | 247,713 | $ | 724,228 | $ | 74,809 | $ | 117,207 | $ | 78,549 | $ | 25,495 | $ | 1,486,616 | ||||||||
Non-accrual loans 2 | $ | — | $ | — | $ | — | $ | — | $ | 91 | $ | — | $ | 54 | $ | 145 | ||||||||
1 Our residential loan portfolio does not include sub-prime loans, nor is it our practice to underwrite loans commonly referred to as "Alt-A mortgages," the characteristics of which are loans lacking full documentation, borrowers having low FICO scores or higher loan-to-value ratios.
2 There were three purchased credit impaired ("PCI") loans with unpaid balances totaling $131 thousand and no carrying values that had stopped accreting interest at December 31, 2017. There were no PCI loans that had stopped accreting interest at December 31, 2016. Amounts exclude accreting PCI loans of $2.1 million and $2.9 million at December 31, 2017 and 2016, respectively, as we have a reasonable expectation about future cash flows to be collected and we continue to recognize accretable yield on these loans in interest income. There were no accruing loans past due more than ninety days at December 31, 2017 or 2016.
3 Amounts include net deferred loan origination costs of $818 thousand and $883 thousand at December 31, 2017 and 2016, respectively. Amounts are also net of unaccreted purchase discounts on non-PCI loans of $1.2 million and $1.8 million at December 31, 2017 and 2016, respectively.
Our commercial loans are generally made to established small and mid-sized businesses to provide financing for their growth and working capital needs, equipment purchases and acquisitions. Management examines historical, current, and projected cash flows to determine the ability of the borrower to repay obligations as agreed. Commercial loans are made based primarily on the identified cash flows of the borrower and secondarily on the underlying collateral and guarantor support. The cash flows of borrowers, however, may not occur as expected, and the collateral securing these loans may fluctuate in value. Most commercial and industrial loans are secured by the assets being financed, such as accounts receivable and inventory, and typically include a personal guarantee. We target stable businesses with guarantors who provide additional sources of repayment and have proven to be resilient in periods of economic stress.
Commercial real estate loans are subject to underwriting standards and processes similar to commercial loans discussed above. We underwrite these loans to be repaid from cash flow and to be supported by real property collateral. Underwriting standards for commercial real estate loans include, but are not limited to, debt coverage and loan-to-value ratios. Furthermore, substantially all of our loans are guaranteed by the owners of the properties. Commercial real estate loans may be adversely affected by conditions in the real estate markets or in the general economy. In the event of a vacancy, guarantors are expected to carry the loans until a replacement tenant can be found. The owner's substantial equity investment provides a strong economic incentive to continue to support the commercial real estate projects. As such, we have generally experienced a relatively low level of loss and delinquencies in this portfolio.
Page-69
Construction loans are generally made to developers and builders to finance construction, renovation and occasionally land acquisitions in anticipation of near-term development. These loans are underwritten after evaluation of the borrower's financial strength, reputation, prior track record, and independent appraisals. The construction industry can be affected by significant events, including: the inherent volatility of real estate markets and vulnerability to delays due to weather, change orders, inability to obtain construction permits, labor or material shortages, and price changes. Estimates of construction costs and value associated with the completed project may be inaccurate. Repayment of construction loans is largely dependent on the ultimate success of the project.
Consumer loans primarily consist of home equity lines of credit and other residential tenancy-in-common fractional interest loans ("TIC"), floating homes and mobile homes along with a small number of installment loans. We originate consumer loans utilizing credit score information, debt-to-income ratio and loan-to-value ratio analysis. Diversification among consumer loan types, coupled with relatively small loan amounts that are spread across many individual borrowers, mitigates risk. Our other residential loans include TIC units located almost entirely in San Francisco County.
We use a risk rating system to evaluate asset quality, and to identify and monitor credit risk in individual loans, and in the loan portfolio. Definitions of loans that are risk graded “Special Mention” or worse are consistent with those used by the Federal Deposit Insurance Corporation ("FDIC"). Our internally assigned grades are as follows:
Pass and Watch: Loans to borrowers of acceptable or better credit quality. Borrowers in this category demonstrate fundamentally sound financial positions, repayment capacity, credit history and management expertise. Loans in this category must have an identifiable and stable source of repayment and meet the Bank’s policy regarding debt service coverage ratios. These borrowers are capable of sustaining normal economic, market or operational setbacks without significant financial consequences. Negative external industry factors are generally not present. The loan may be secured, unsecured or supported by non-real estate collateral for which the value is more difficult to determine and/or marketability is more uncertain. This category also includes “Watch” loans, where the primary source of repayment has been delayed. “Watch” is intended to be a transitional grade, with either an upgrade or downgrade within a reasonable period.
Special Mention: Potential weaknesses that deserve close attention. If left uncorrected, those potential weaknesses may result in deterioration of the payment prospects for the asset. Special Mention assets do not present sufficient risk to warrant adverse classification.
Substandard: Inadequately protected by either the current sound worth and paying capacity of the obligor or the collateral pledged, if any. A Substandard asset has a well-defined weakness or weaknesses that jeopardize(s) the liquidation of the debt. Substandard assets are characterized by the distinct possibility that we will sustain some loss if such weaknesses or deficiencies are not corrected. Well-defined weaknesses include adverse trends or developments of the borrower’s financial condition, managerial weaknesses and/or significant collateral deficiencies.
Doubtful: Critical weaknesses that make collection or liquidation in full improbable. There may be specific pending events that work to strengthen the asset; however, the amount or timing of the loss may not be determinable. Pending events generally occur within one year of the asset being classified as Doubtful. Examples include: merger, acquisition, or liquidation; capital injection; guarantee; perfecting liens on additional collateral; and refinancing. Such loans are placed on non-accrual status and usually are collateral-dependent.
We regularly review our credits for accuracy of risk grades whenever new information is received. Borrowers are required to submit financial information at regular intervals. Generally, commercial borrowers with lines of credit are required to submit financial information with reporting intervals ranging from monthly to annually depending on credit size, risk and complexity. Investor commercial real estate borrowers are generally required to submit rent rolls or property income statements annually. Construction loans are monitored monthly, and reviewed on an ongoing basis. Home equity and other consumer loans are reviewed based on delinquency. Loans graded “Watch” or worse, regardless of loan type, are reviewed no less than quarterly.
The following table represents an analysis of the carrying amount in loans, net of deferred fees and costs and purchase premiums or discounts, by internally assigned risk grades, including PCI loans, at December 31, 2017 and 2016.
Page-70
Credit Risk Profile by Internally Assigned Risk Grade | |||||||||||||||||||||||||||
(in thousands) | Commercial and industrial | Commercial real estate, owner-occupied | Commercial real estate, investor | Construction | Home equity | Other residential | Installment and other consumer | Purchased credit-impaired | Total | ||||||||||||||||||
December 31, 2017 | |||||||||||||||||||||||||||
Pass | $ | 214,636 | $ | 281,104 | $ | 818,570 | $ | 60,859 | $ | 130,558 | $ | 95,526 | $ | 27,287 | $ | 1,325 | $ | 1,629,865 | |||||||||
Special Mention | 9,318 | 9,284 | 1,850 | — | — | — | — | 790 | 21,242 | ||||||||||||||||||
Substandard | 11,816 | 9,409 | 1,774 | 2,969 | 1,815 | — | 123 | — | 27,906 | ||||||||||||||||||
Total loans | $ | 235,770 | $ | 299,797 | $ | 822,194 | $ | 63,828 | $ | 132,373 | $ | 95,526 | $ | 27,410 | $ | 2,115 | $ | 1,679,013 | |||||||||
December 31, 2016 | |||||||||||||||||||||||||||
Pass | $ | 201,987 | $ | 234,849 | $ | 720,417 | $ | 71,564 | $ | 115,680 | $ | 78,549 | $ | 25,083 | $ | 2,920 | $ | 1,451,049 | |||||||||
Special Mention | 9,197 | 4,799 | 607 | — | 1,334 | — | — | — | 15,937 | ||||||||||||||||||
Substandard | 7,391 | 6,993 | 1,498 | 3,245 | 91 | — | 412 | — | 19,630 | ||||||||||||||||||
Total loans | $ | 218,575 | $ | 246,641 | $ | 722,522 | $ | 74,809 | $ | 117,105 | $ | 78,549 | $ | 25,495 | $ | 2,920 | $ | 1,486,616 | |||||||||
Troubled Debt Restructuring
Our loan portfolio includes certain loans that have been modified in a troubled debt restructuring (“TDR”), where economic concessions have been granted to borrowers experiencing financial difficulties. These concessions typically result from our loss mitigation activities and could include reductions in the interest rate, payment extensions, forgiveness of principal, forbearance or other actions. TDRs on non-accrual status at the time of restructure may be returned to accruing status after Management considers the borrower’s sustained repayment performance for a reasonable period, generally six months, and obtains reasonable assurance of repayment and performance.
A loan may no longer be reported as a TDR if all of the following conditions are met:
• | The loan is subsequently refinanced or restructured at current market interest rates and the new terms are consistent with the treatment of creditworthy borrowers under regular underwriting standards; |
• | The borrower is no longer considered to be in financial difficulty; |
• | Performance on the loan is reasonably assured, and; |
• | Existing loan did not have any forgiveness of principal or interest. |
The removal of TDR status must be approved by the same Management level that approved the upgrading of the loan classification.
There were no loans removed from TDR designation during 2017 or 2016. During 2015, five loans with a recorded investment totaling $1.6 million were removed from TDR designation, after meeting all of the conditions noted above.
The following table summarizes the carrying amount of TDR loans by loan class as of December 31, 2017 and December 31, 2016.
(in thousands) | As of | |||||
Recorded investment in Troubled Debt Restructurings 1 | December 31, 2017 | December 31, 2016 | ||||
Commercial and industrial | $ | 2,165 | $ | 2,207 | ||
Commercial real estate, owner-occupied | 6,999 | 6,993 | ||||
Commercial real estate, investor | 2,171 | 2,256 | ||||
Construction | 2,969 | 3,245 | ||||
Home equity | 347 | 625 | ||||
Other residential | 1,148 | 1,965 | ||||
Installment and other consumer | 721 | 877 | ||||
Total | $ | 16,520 | $ | 18,168 | ||
1 There were no TDR loans on non-accrual status at December 31, 2017 or December 31, 2016. Includes no acquired TDR loans as of December 31, 2017 or December 31, 2016.
The following table presents information for loans modified in a TDR during the presented periods, including the number of contracts modified, the recorded investment in the loans prior to modification, and the recorded investment in the loans at period end after being restructured. The table excludes fully charged-off TDR loans and loans modified in a TDR and subsequently paid-off during the years presented.
Page-71
(dollars in thousands) | Number of Contracts Modified | Pre-Modification Outstanding Recorded Investment | Post-Modification Outstanding Recorded Investment | Post-Modification Outstanding Recorded Investment at Period End | |||||||
TDRs modified during 2017: | |||||||||||
Installment and other consumer | 1 | $ | 50 | $ | 50 | $ | 47 | ||||
TDRs modified during 2016: | |||||||||||
Commercial real estate, investor | 2 | $ | 1,830 | $ | 1,826 | $ | 1,752 | ||||
Home equity 1 | 1 | 87 | 222 | 245 | |||||||
Installment and other consumer | 1 | 68 | 67 | 66 | |||||||
Total | 4 | $ | 1,985 | $ | 2,115 | $ | 2,063 | ||||
1 The home equity line of credit modified in 2016 included debt consolidation, which increased the post-modification balance. | |||||||||||
TDRs modified during 2015: | |||||||||||
Commercial and industrial | 7 | $ | 3,271 | $ | 3,251 | $ | 2,811 | ||||
The modifications during 2017, 2016 and 2015 primarily involved maturity or payment extensions, interest rate concessions, renewals, and other changes to loan terms. During 2017, 2016 and 2015, there were no defaults on loans that had been modified in a TDR within the prior twelve-month period. We report defaulted TDRs based on a payment default definition of more than ninety days past due.
Impaired Loans
The following tables summarize information by class on impaired loans and their related allowances. Total impaired loans include non-accrual loans, accruing TDR loans and accreting PCI loans that have experienced post-acquisition declines in cash flows expected to be collected.
(in thousands) | Commercial and industrial | Commercial real estate, owner-occupied | Commercial real estate, investor | Construction | Home equity | Other residential | Installment and other consumer | Total | ||||||||||||||||
December 31, 2017 | ||||||||||||||||||||||||
Recorded investment in impaired loans: | ||||||||||||||||||||||||
With no specific allowance recorded | $ | 309 | $ | — | $ | — | $ | 2,689 | $ | 406 | $ | 995 | $ | 46 | $ | 4,445 | ||||||||
With a specific allowance recorded | 1,856 | 6,999 | 2,171 | 280 | 347 | 153 | 675 | 12,481 | ||||||||||||||||
Total recorded investment in impaired loans | $ | 2,165 | $ | 6,999 | $ | 2,171 | $ | 2,969 | $ | 753 | $ | 1,148 | $ | 721 | $ | 16,926 | ||||||||
Unpaid principal balance of impaired loans | $ | 2,278 | $ | 6,993 | $ | 2,168 | $ | 2,963 | $ | 750 | $ | 1,147 | $ | 720 | $ | 17,019 | ||||||||
Specific allowance | $ | 50 | $ | 188 | $ | 159 | $ | 7 | $ | 6 | $ | 1 | $ | 102 | $ | 513 | ||||||||
Average recorded investment in impaired loans during 2017 | $ | 2,113 | $ | 6,998 | $ | 2,842 | $ | 3,132 | $ | 679 | $ | 1,324 | $ | 841 | $ | 17,929 | ||||||||
Interest income recognized on impaired loans during 2017 1 | $ | 202 | $ | 266 | $ | 87 | $ | 147 | $ | 24 | $ | 62 | $ | 37 | $ | 825 | ||||||||
December 31, 2016 | ||||||||||||||||||||||||
Recorded investment in impaired loans: | ||||||||||||||||||||||||
With no specific allowance recorded | $ | 315 | $ | — | $ | — | $ | 2,692 | $ | 91 | $ | 1,008 | $ | 103 | $ | 4,209 | ||||||||
With a specific allowance recorded | 1,892 | 6,993 | 2,256 | 553 | 624 | 957 | 829 | 14,104 | ||||||||||||||||
Total recorded investment in impaired loans | $ | 2,207 | $ | 6,993 | $ | 2,256 | $ | 3,245 | $ | 715 | $ | 1,965 | $ | 932 | $ | 18,313 | ||||||||
Unpaid principal balance of impaired loans | $ | 2,177 | $ | 6,993 | $ | 2,252 | $ | 3,238 | $ | 713 | $ | 1,965 | $ | 932 | $ | 18,270 | ||||||||
Specific allowance | $ | 285 | $ | 163 | $ | 375 | $ | 8 | $ | 7 | $ | 55 | $ | 98 | $ | 991 | ||||||||
Average recorded investment in impaired loans during 2016 | $ | 3,514 | $ | 7,069 | $ | 2,950 | $ | 3,242 | $ | 945 | $ | 1,988 | $ | 1,127 | $ | 20,835 | ||||||||
Interest income recognized on impaired loans during 2016 1 | $ | 175 | $ | 199 | $ | 1,514 | $ | 137 | $ | 60 | $ | 90 | $ | 48 | $ | 2,223 | ||||||||
Average recorded investment in impaired loans during 2015 | $ | 4,237 | $ | 7,886 | $ | 2,833 | $ | 4,164 | $ | 602 | $ | 2,028 | $ | 1,523 | $ | 23,273 | ||||||||
Interest income recognized on impaired loans during 2015 1 | $ | 238 | $ | 295 | $ | 33 | $ | 86 | $ | 18 | $ | 92 | $ | 64 | $ | 826 | ||||||||
1 Interest income recognized on a cash basis totaled $100 thousand in 2017 and was primarily related to the pay-off of a commercial non-accrual PCI loan in the fourth quarter. Interest income recognized on a cash basis totaled $1.4 million in 2016 and was primarily related to the interest recovery upon the pay-off of a partially charged off non-accrual commercial real estate loan during the third quarter. No interest income on impaired loans was recognized on a cash basis in 2015. | ||||||||||||||||||||||||
Management monitors delinquent loans continuously and identifies problem loans, generally loans graded substandard or worse, loans on non-accrual status and loans modified in a TDR, to be evaluated individually for impairment testing.
Page-72
Generally, the recorded investment in impaired loans is net of any charge-offs from estimated losses related to specifically-identified impaired loans when they are deemed uncollectible. There were no charged-off portions of impaired loans outstanding at December 31, 2017 and 2016. In addition, the recorded investment in impaired loans is net of purchase discounts or premiums on acquired loans and deferred fees and costs. At December 31, 2017 and 2016, outstanding commitments to extend credit on impaired loans, including performing loans to borrowers whose terms have been modified in TDRs, totaled $935 thousand and $1.6 million, respectively.
The following tables disclose activity in the allowance for loan losses ("ALLL") and the recorded investment in loans by class, as well as the related ALLL disaggregated by impairment evaluation method.
Allowance for Loan Losses Rollforward for the Year Ended | |||||||||||||||||||||||||||
(in thousands) | Commercial and industrial | Commercial real estate, owner-occupied | Commercial real estate, investor | Construction | Home equity | Other residential | Installment and other consumer | Unallocated | Total | ||||||||||||||||||
Year ended December 31, 2017 | |||||||||||||||||||||||||||
Beginning balance | $ | 3,248 | $ | 1,753 | $ | 6,320 | $ | 781 | $ | 973 | $ | 454 | $ | 372 | $ | 1,541 | $ | 15,442 | |||||||||
Provision (reversal) | 584 | 541 | 155 | (100 | ) | 58 | 82 | 3 | (823 | ) | 500 | ||||||||||||||||
Charge-offs | (289 | ) | — | — | — | — | — | (4 | ) | — | (293 | ) | |||||||||||||||
Recoveries | 111 | — | — | — | — | — | 7 | — | 118 | ||||||||||||||||||
Ending balance | $ | 3,654 | $ | 2,294 | $ | 6,475 | $ | 681 | $ | 1,031 | $ | 536 | $ | 378 | $ | 718 | $ | 15,767 | |||||||||
Year ended December 31, 2016 | |||||||||||||||||||||||||||
Beginning balance | $ | 3,023 | $ | 2,249 | $ | 6,178 | $ | 724 | $ | 910 | $ | 394 | $ | 425 | $ | 1,096 | $ | 14,999 | |||||||||
Provision (reversal) | 93 | (476 | ) | (2,014 | ) | 57 | 60 | 60 | (75 | ) | 445 | (1,850 | ) | ||||||||||||||
Charge-offs | (11 | ) | (20 | ) | — | — | — | — | (5 | ) | — | (36 | ) | ||||||||||||||
Recoveries | 143 | — | 2,156 | — | 3 | — | 27 | — | 2,329 | ||||||||||||||||||
Ending balance | $ | 3,248 | $ | 1,753 | $ | 6,320 | $ | 781 | $ | 973 | $ | 454 | $ | 372 | $ | 1,541 | $ | 15,442 | |||||||||
Year ended December 31, 2015 | |||||||||||||||||||||||||||
Beginning balance | $ | 2,837 | $ | 1,924 | $ | 6,672 | $ | 839 | $ | 859 | $ | 433 | $ | 566 | $ | 969 | $ | 15,099 | |||||||||
Provision (reversal) | (45 | ) | 325 | (517 | ) | 724 | 48 | (39 | ) | (123 | ) | 127 | 500 | ||||||||||||||
Charge-offs | (5 | ) | — | — | (839 | ) | — | — | (20 | ) | — | (864 | ) | ||||||||||||||
Recoveries | 236 | — | 23 | — | 3 | — | 2 | — | 264 | ||||||||||||||||||
Ending balance | $ | 3,023 | $ | 2,249 | $ | 6,178 | $ | 724 | $ | 910 | $ | 394 | $ | 425 | $ | 1,096 | $ | 14,999 | |||||||||
Allowance for Loan Losses and Recorded Investment In Loans | |||||||||||||||||||||||||||
(dollars in thousands) | Commercial and industrial | Commercial real estate, owner-occupied | Commercial real estate, investor | Construction | Home equity | Other residential | Installment and other consumer | Unallocated | Total | ||||||||||||||||||
December 31, 2017 | |||||||||||||||||||||||||||
Ending ALLL related to loans collectively evaluated for impairment | $ | 3,604 | $ | 2,106 | $ | 6,316 | $ | 674 | $ | 1,025 | $ | 535 | $ | 276 | $ | 718 | $ | 15,254 | |||||||||
Ending ALLL related to loans individually evaluated for impairment | 50 | 188 | 159 | 7 | 6 | 1 | 102 | — | 513 | ||||||||||||||||||
Ending ALLL related to purchased credit-impaired loans | — | — | — | — | — | — | — | — | — | ||||||||||||||||||
Ending balance | $ | 3,654 | $ | 2,294 | $ | 6,475 | $ | 681 | $ | 1,031 | $ | 536 | $ | 378 | $ | 718 | $ | 15,767 | |||||||||
Recorded Investment: | |||||||||||||||||||||||||||
Collectively evaluated for impairment | $ | 233,605 | $ | 292,798 | $ | 820,023 | $ | 60,859 | $ | 131,620 | $ | 94,378 | $ | 26,689 | $ | — | $ | 1,659,972 | |||||||||
Individually evaluated for impairment | 2,165 | 6,999 | 2,171 | 2,969 | 753 | 1,148 | 721 | — | 16,926 | ||||||||||||||||||
Purchased credit-impaired | 65 | 1,166 | 790 | — | 94 | — | — | — | 2,115 | ||||||||||||||||||
Total | $ | 235,835 | $ | 300,963 | $ | 822,984 | $ | 63,828 | $ | 132,467 | $ | 95,526 | $ | 27,410 | $ | — | $ | 1,679,013 | |||||||||
Ratio of allowance for loan losses to total loans | 1.55 | % | 0.76 | % | 0.79 | % | 1.07 | % | 0.78 | % | 0.56 | % | 1.38 | % | NM | 0.94 | % | ||||||||||
Allowance for loan losses to non-accrual loans | NM | NM | NM | NM | 254 | % | NM | NM | NM | 3,883 | % | ||||||||||||||||
Page-73
Allowance for Loan Losses and Recorded Investment In Loans | |||||||||||||||||||||||||||
(dollars in thousands) | Commercial and industrial | Commercial real estate, owner-occupied | Commercial real estate, investor | Construction | Home equity | Other residential | Installment and other consumer | Unallocated | Total | ||||||||||||||||||
December 31, 2016 | |||||||||||||||||||||||||||
Ending ALLL related to loans collectively evaluated for impairment | $ | 2,963 | $ | 1,590 | $ | 5,945 | $ | 773 | $ | 966 | $ | 399 | $ | 274 | $ | 1,541 | $ | 14,451 | |||||||||
Ending ALLL related to loans individually evaluated for impairment | 285 | 163 | 375 | 8 | 7 | 55 | 98 | — | 991 | ||||||||||||||||||
Ending ALLL related to purchased credit-impaired loans | — | — | — | — | — | — | — | — | — | ||||||||||||||||||
Ending balance | $ | 3,248 | $ | 1,753 | $ | 6,320 | $ | 781 | $ | 973 | $ | 454 | $ | 372 | $ | 1,541 | $ | 15,442 | |||||||||
Loans outstanding: | |||||||||||||||||||||||||||
Collectively evaluated for impairment | $ | 216,368 | $ | 239,648 | $ | 720,266 | $ | 71,564 | $ | 116,390 | $ | 76,584 | $ | 24,563 | $ | — | $ | 1,465,383 | |||||||||
Individually evaluated for impairment | 2,207 | 6,993 | 2,256 | 3,245 | 715 | 1,965 | 932 | — | 18,313 | ||||||||||||||||||
Purchased credit-impaired | 40 | 1,072 | 1,706 | — | 102 | — | — | — | 2,920 | ||||||||||||||||||
Total | $ | 218,615 | $ | 247,713 | $ | 724,228 | $ | 74,809 | $ | 117,207 | $ | 78,549 | $ | 25,495 | $ | — | $ | 1,486,616 | |||||||||
Ratio of allowance for loan losses to total loans | 1.49 | % | 0.71 | % | 0.87 | % | 1.04 | % | 0.83 | % | 0.58 | % | 1.46 | % | NM | 1.04 | % | ||||||||||
Allowance for loan losses to non-accrual loans | NM | NM | NM | NM | 1,071 | % | NM | 683 | % | NM | 10,650 | % | |||||||||||||||
NM - Not Meaningful
Purchased Credit-Impaired Loans
Acquired loans are considered credit-impaired if there is evidence of significant deterioration of credit quality since origination and it is probable, at the acquisition date, that we will be unable to collect all contractually required payments receivable. Management has determined certain loans purchased in our two bank acquisitions to be PCI loans based on credit indicators such as nonaccrual status, past due status, loan risk grade, loan-to-value ratio, etc. Revolving credit agreements (e.g., home equity lines of credit and revolving commercial loans) are not considered PCI loans as cash flows cannot be reasonably estimated.
The following table reflects the unpaid principal balance and related carrying value of PCI loans:
PCI Loans | December 31, 2017 | December 31, 2016 | ||||||||||
(in thousands) | Unpaid Principal Balance | Carrying Value | Unpaid Principal Balance | Carrying Value | ||||||||
Commercial and industrial | $ | 276 | $ | 65 | $ | 45 | $ | 40 | ||||
Commercial real estate, owner occupied | 1,297 | 1,166 | 1,344 | 1,072 | ||||||||
Commercial real estate, investor | 1,064 | 790 | 1,713 | 1,706 | ||||||||
Construction | — | — | — | — | ||||||||
Home equity | 231 | 94 | 248 | 102 | ||||||||
Total purchased credit-impaired loans | $ | 2,868 | $ | 2,115 | $ | 3,350 | $ | 2,920 | ||||
The activities in the accretable yield, or income expected to be earned over the remaining lives of the PCI loans were as follows:
Accretable Yield | Years ended | ||||||||
(in thousands) | December 31, 2017 | December 31, 2016 | December 31, 2015 | ||||||
Balance at beginning of period | $ | 1,476 | $ | 2,618 | $ | 4,027 | |||
Additions | 109 | — | — | ||||||
Removals 1 | — | (778 | ) | (914 | ) | ||||
Accretion | (331 | ) | (364 | ) | (495 | ) | |||
Balance at end of period | $ | 1,254 | $ | 1,476 | $ | 2,618 | |||
1 Represents the accretable difference that is relieved when a loan exits the PCI population due to payoff, full charge-off, or transfer to repossessed assets, etc. | |||||||||
Page-74
Pledged Loans
Our FHLB line of credit is secured under terms of a blanket collateral agreement by a pledge of certain qualifying loans with unpaid principal balances of $887.9 million and $869.2 million at December 31, 2017 and 2016, respectively. In addition, we pledge a certain residential loan portfolio, which totaled $67.6 million and $54.6 million at December 31, 2017 and 2016, respectively, to secure our borrowing capacity with the Federal Reserve Bank of San Francisco (“FRBSF”). Also, see Note 7, Borrowings.
Related Party Loans
The Bank has, and expects to have in the future, banking transactions in the ordinary course of its business with directors, officers, principal shareholders and their businesses or associates. These transactions, including loans, are granted on substantially the same terms, including interest rates and collateral on loans, as those prevailing at the same time for comparable transactions with persons not related to us. Likewise, these transactions do not involve more than the normal risk of collectability or present other unfavorable features. During the first and fourth quarters of 2017, two new directors joined our Board of Directors resulting in the reclassification of existing loans to those directors and their businesses as related party status.
An analysis of net loans to related parties for each of the three years ended December 31, 2017, 2016 and 2015 is as follows:
(in thousands) | 2017 | 2016 | 2015 | ||||||
Balance at beginning of year | $ | 1,988 | $ | 2,562 | $ | 3,329 | |||
Additions | 3,186 | — | — | ||||||
Advances | 74 | — | 165 | ||||||
Repayments | (128 | ) | (574 | ) | (390 | ) | |||
Reclassified due to a change in borrower status | 6,732 | — | (542 | ) | |||||
Balance at end of year | $ | 11,852 | $ | 1,988 | $ | 2,562 | |||
Undisbursed commitments to related parties totaled $9.1 million and $1.1 million as of December 31, 2017 and 2016, respectively.
Note 4: Bank Premises and Equipment
A summary of Bank premises and equipment at December 31 follows:
(in thousands) | 2017 | 2016 | ||||
Leasehold improvements | $ | 14,937 | $ | 13,883 | ||
Furniture and equipment | 11,113 | 10,627 | ||||
Subtotal | 26,050 | 24,510 | ||||
Accumulated depreciation and amortization | (17,438 | ) | (15,990 | ) | ||
Bank premises and equipment, net | $ | 8,612 | $ | 8,520 | ||
The amount of depreciation and amortization totaled $1.9 million, $1.8 million, and $2.0 million for the years ended December 31, 2017, 2016 and 2015, respectively.
Note 5: Bank Owned Life Insurance
We own life insurance policies on the lives of certain officers designated by the Board of Directors to fund our employee benefit programs, and death benefits provided under the specific terms of these insurance policies are estimated to be $81.9 million at December 31, 2017. The benefits to employees' beneficiaries are limited to the employee's active service period. The investment in bank owned life insurance policies are reported in interest receivable and other assets at their cash surrender value of $38.1 million and $32.4 million at December 31, 2017 and 2016, respectively. The cash surrender value includes both the original premiums paid for the life insurance policies and the accumulated accretion of policy income since inception of the policies. Income of $845 thousand, $844 thousand and $814 thousand
Page-75
was recognized on the life insurance policies in 2017, 2016 and 2015, respectively. We regularly monitor the credit ratings of our insurance carriers to ensure that they comply with our policy.
Note 6: Deposits
A stratification of time deposits at December 31, 2017 and 2016 is presented in the following table:
(in thousands) | December 31, 2017 | December 31, 2016 | ||||
Time deposits of less than $100 thousand | $ | 39,361 | $ | 36,346 | ||
Time deposits of $100 thousand to $250 thousand | 68,391 | 66,092 | ||||
Time deposits of more than $250 thousand | 52,364 | 49,025 | ||||
Total time deposits | $ | 160,116 | $ | 151,463 | ||
Interest on time deposits was $576 thousand, $743 thousand and $853 thousand in 2017, 2016 and 2015, respectively.
Scheduled maturities of time deposits at December 31, 2017 are presented as follows:
(in thousands) | 2018 | 2019 | 2020 | 2021 | 2022 | Thereafter | Total | ||||||||||||||
Scheduled maturities of time deposits | $ | 108,352 | $ | 13,000 | $ | 10,511 | $ | 18,976 | $ | 9,276 | $ | 1 | $ | 160,116 | |||||||
As of December 31, 2017, $107.8 million in securities held-to-maturity were pledged as collateral for our local agency deposits.
Our deposit portfolio includes deposits offered through the Promontory Interfinancial Network that are comprised of Certificate of Deposit Account Registry Service® ("CDARS") balances included in time deposits and Insured Cash Sweep® ("ICS") balances included in money market deposits. In addition, in 2016, we began offering deposits through Reich & Tang Deposit Networks, LLC, comprised of Demand Deposit MarketplaceSM ("DDM") balances, mostly in money market deposits. Through these two networks we are able to offer our customers access to FDIC-insured deposit products in aggregate amounts exceeding current insurance limits. When we place funds through CDARS, ICS and DDM, on behalf of a customer, we have the option of receiving matching deposits through the network's reciprocal deposit program. We consider the reciprocal deposits to be in-market deposits as distinguished from traditional out-of-market brokered deposits. We had $13.5 million and $15.1 million in CDARS and $41.0 million and $29.0 million in ICS balances in the reciprocal deposit program at December 31, 2017 and 2016, respectively. In addition, we had $29.2 million and $36.4 million in DDM balances in the reciprocal deposit program at December 31, 2017 and 2016, respectively. We also have the ability to place deposits through the networks for which we receive no matching deposits ("one-way" deposits). One-way CDARS and ICS deposits totaled $4.2 million and $361 thousand at December 31, 2017 and 2016, respectively.
The aggregate amount of deposit overdrafts that have been reclassified as loan balances was $224 thousand and $229 thousand at December 31, 2017 and 2016, respectively. Collectability of these overdrafts is subject to the same credit review process as other loans.
The Bank accepts deposits from shareholders, directors and employees in the normal course of business, and the terms are comparable to those with non-affiliated parties. The total deposits from directors and their businesses, and executive officers were $29.9 million and $7.3 million at December 31, 2017 and 2016, respectively.
Note 7: Borrowings
Federal Funds Purchased – The Bank had unsecured lines of credit with correspondent banks for overnight borrowings totaling $100.4 million at December 31, 2017 (including $8.4 million assumed from Bank of Napa) and $92.0 million at December 31, 2016. In general, interest rates on these lines approximate the federal funds target rate. We had no overnight borrowings under these credit facilities at December 31, 2017 and December 31, 2016.
Federal Home Loan Bank Borrowings – As of December 31, 2017 and 2016, the Bank had lines of credit with the FHLB totaling $538.9 million and $513.7 million, respectively, based on eligible collateral of certain loans. There were no FHLB overnight borrowings at December 31, 2017 or 2016. On February 5, 2008, the Bank entered into a ten-year
Page-76
borrowing agreement under the same FHLB line of credit for $15.0 million at a fixed rate of 2.07%. On June 15, 2016, the Bank repaid the $15.0 million early and incurred a prepayment fee of $312 thousand recorded in interest expense. At December 31, 2017 and 2016, $538.9 million and $513.7 million, respectively, were remaining as available for borrowing from the FHLB.
Federal Reserve Line of Credit – The Bank has a line of credit with the FRBSF secured by certain residential loans. At December 31, 2017 and 2016, the Bank had borrowing capacity under this line totaling $52.1 million and $43.1 million, respectively, and had no outstanding borrowings with the FRBSF.
As part of an acquisition, Bancorp assumed two subordinated debentures due to NorCal Community Bancorp Trusts I and II (the "Trusts"), established for the sole purpose of issuing trust preferred securities on September 22, 2003 and December 29, 2005, respectively. The subordinated debentures were recorded at fair values totaling $4.95 million at acquisition date with contractual values totaling $8.2 million. The difference between the contractual balance and the fair value at acquisition date is accreted into interest expense over the lives of the debentures. Accretion on the subordinated debentures totaled $153 thousand, $191 thousand and $210 thousand in 2017, 2016 and 2015, respectively. Bancorp has the option to defer payment of the interest on the subordinated debentures for a period of up to five years, as long as there is no default on the subordinated debentures. In the event of interest deferral, dividends to Bancorp common stockholders are prohibited. The trust preferred securities were sold and issued in private transactions pursuant to an exemption from registration under the Securities Act of 1933, as amended. Bancorp has guaranteed, on a subordinated basis, distributions and other payments due on trust preferred securities totaling $8.0 million issued by the Trusts, which have identical maturity, repricing and payment terms as the subordinated debentures.
The following is a summary of the contractual terms of the subordinated debentures due to the Trusts as of December 31, 2017:
(in thousands) | |||
Subordinated debentures due to NorCal Community Bancorp Trust I on October 7, 2033 with interest payable quarterly, based on 3-month LIBOR plus 3.05%, repricing quarterly (4.41% as of December 31, 2017), redeemable, in whole or in part, on any interest payment date | $ | 4,124 | |
Subordinated debentures due to NorCal Community Bancorp Trust II on March 15, 2036 with interest payable quarterly, based on 3-month LIBOR plus 1.40%, repricing quarterly (2.99% as of December 31, 2017), redeemable, in whole or in part, on any interest payment date | 4,124 | ||
Total | $ | 8,248 | |
Borrowings at December 31, 2017 and 2016 are summarized as follows:
2017 | 2016 | |||||||||||||||||
(dollars in thousands) | Carrying Value | Average Balance | Average Rate | Carrying Value | Average Balance | Average Rate | ||||||||||||
FHLB overnight borrowings | $ | — | $ | 1 | 1.75 | % | $ | — | $ | 5,383 | 0.42 | % | ||||||
FHLB fixed-rate advances | $ | — | $ | — | — | % | $ | — | $ | 6,803 | 6.59 | % | 1 | |||||
Subordinated debentures | $ | 5,739 | $ | 5,664 | 7.65 | % | $ | 5,586 | $ | 5,493 | 7.80 | % | ||||||
1 Average rate includes the impact of the $312 thousand prepayment fee in 2016 discussed above.
Note 8: Stockholders' Equity and Stock Plans
Share-Based Awards
On May 11, 2010, our shareholders approved the 2010 Director Stock Plan to pay director fees in shares of Bancorp common stock up to 150,000 shares. In addition to cash compensation, we issued 2,878, 4,607 and 5,295 shares of common under the 2010 Director Stock Plan to directors in 2017, 2016 and 2015, respectively. As of December 31, 2017, 110,433 shares were available for future grants under this plan.
On September 27, 2017, the Board of Directors adopted the 2017 Employee Stock Purchase Plan, effective July 1, 2017, which replaced the 2007 Employee Stock Purchase Plan. Under the plan, our employees may purchase Bancorp common shares through payroll deductions of between one percent and fifteen percent of pay in each pay period. Shares are purchased quarterly at a five percent discount from the closing market price on the last day of the quarter.
Page-77
Of the 200,000 common shares set aside for employee purchases, there were 192,453 shares available for future grants under the plan as of December 31, 2017. Shares purchased under the 2017 plan are restricted until the plan is approved by our shareholders.
On March 17, 2017, the Board of Directors approved the 2017 Equity Plan, which was affirmed by Bancorp's shareholders on May 16, 2017 and replaced the 2007 Equity Plan. As of the 2017 Equity Plan's effective date, there were 118,668 shares of common stock available for future grants to employees, advisors and non-employee directors. As of December 31, 2017, there were 108,981 shares available for future grants under the 2017 Equity Plan. The Compensation Committee of the Board of Directors has the discretion to determine which employees, advisors and non-employee directors will receive an award, the timing of awards, the vesting schedule for each award, the type of award to be granted, the number of shares of Bancorp stock to be subject to each option and restricted stock award, and any other terms and conditions.
Options are issued at an exercise price equal to the fair value of the stock at the date of grant. Options and restricted stock awarded to officers and employees during 2006 through 2014 vest 20% on each anniversary of the grant date for five years and expire ten years from the grant date. Options granted to non-employee directors prior to 2016 vest 20% immediately and 20% on each anniversary of the grant date for four years and expire seven years from the grant date. In general, options granted after 2014 for employees and after 2015 for non-employee directors generally vest by one-third on each anniversary of the grant for three years and expire ten years from the grant date. Options issued as replacement awards in connection with the Bank of Napa acquisition were fully vested as part of the merger agreement with Bank of Napa.
Stock options may be net settled by a reduction in the number of shares otherwise deliverable upon exercise in satisfaction of the exercise payment and applicable tax withholding requirements. During 2017, we withheld 12,208 shares totaling $801 thousand at a weighted-average price of $65.63 for cashless stock option exercises. There were no stock options exercised under net settlement arrangements in 2016 or 2015. Shares withheld under net settlement arrangements are available for future grants.
Beginning in 2015, performance-based stock awards were issued to a selected group of employees. Stock award vesting is contingent upon the achievement of pre-established long-term performance goals set by the Compensation Committee of the Board of Directors. Performance is measured over a three-year period and cliff vested. These performance-based stock awards were granted at a maximum opportunity level, and based on the achievement of the pre-established goals, the actual payouts can range from 0% to 200% of the target award. For performance-based stock awards, an estimate is made of the number of shares expected to vest based on the probability that the performance criteria will be achieved to determine the amount of compensation expense to be recognized. The estimate is re-evaluated quarterly and total compensation expense is adjusted for any change in the current period.
A summary of activity for stock options for the years ended December 31, 2017, 2016 and 2015 is presented below. The intrinsic value of options outstanding and exercisable is calculated as the number of in-the-money options times the difference between the market price of our stock as of each year-end presented and the exercise prices of the in-the-money options.
Page-78
Number of Shares | Weighted Average Exercise Price | Aggregate Intrinsic Value (in thousands) | Weighted Average Grant-Date Fair Value | Weighted Average Remaining Contractual Term (in years) | ||||||||
Options outstanding at December 31, 2014 | 194,672 | $ | 35.14 | $ | 3,398 | 4.48 | ||||||
Granted | 28,320 | 50.70 | $ | 12.21 | ||||||||
Cancelled, expired or forfeited | (652 | ) | 48.38 | |||||||||
Exercised | (37,071 | ) | 30.72 | 755 | ||||||||
Options outstanding at December 31, 2015 | 185,269 | 38.35 | 2,788 | 5.00 | ||||||||
Exercisable (vested) at December 31, 2015 | 114,581 | 34.12 | 2,209 | 3.21 | ||||||||
Options outstanding at December 31, 2015 | 185,269 | 38.35 | 2,788 | 5.00 | ||||||||
Granted | 32,637 | 49.37 | 10.11 | |||||||||
Exercised | (36,117 | ) | 33.98 | 661 | ||||||||
Options outstanding at December 31, 2016 | 181,789 | 41.20 | 5,190 | 5.77 | ||||||||
Exercisable (vested) at December 31, 2016 | 103,211 | 36.65 | 3,416 | 4.18 | ||||||||
Options outstanding at December 31, 2016 | 181,789 | 41.20 | 5,190 | 5.77 | ||||||||
Granted 1 | 100,664 | 39.78 | 32.61 | |||||||||
Cancelled, expired or forfeited | (2,011 | ) | 43.97 | |||||||||
Exercised | (21,474 | ) | 38.62 | 585 | ||||||||
Options outstanding at December 31, 2017 | 258,968 | 40.84 | 7,075 | 5.34 | ||||||||
Exercisable (vested) at December 31, 2017 | 192,172 | 35.69 | 6,212 | 4.42 | ||||||||
1 Includes 70,145 replacement stock option awards issued in the Acquisition with a $27.20 weighted average exercise price and a $40.71 weighted average grant-date fair value. See Note 18, Acquisition.
The following table summarizes non-vested restricted stock awards and changes during the years ended December 31, 2017, 2016 and 2015.
Number of Shares | Weighted Average Grant-Date Fair Value | ||||
Non-vested awards at December 31, 2014 | 22,423 | $ | 41.25 | ||
Granted | 15,970 | 50.75 | |||
Vested | (6,555 | ) | 40.00 | ||
Forfeited | (450 | ) | 48.45 | ||
Non-vested awards at December 31, 2015 | 31,388 | 46.24 | |||
Granted | 16,910 | 49.65 | |||
Vested | (8,599 | ) | 44.14 | ||
Non-vested awards at December 31, 2016 | 39,699 | 48.15 | |||
Granted | 16,230 | 69.59 | |||
Vested | (10,321 | ) | 45.78 | ||
Non-vested awards at December 31, 2017 | 45,608 | 56.31 | |||
A summary of the options outstanding and exercisable by price range as of December 31, 2017 is presented in the following table:
Stock Options Outstanding as of December 31, 2017 | Stock Options Exercisable as of December 31, 2017 | |||||||||||
Range of Exercise Prices | Stock Options Outstanding | Remaining Contractual Life (in years) | Weighted Average Exercise Price | Stock Options Exercisable | Weighted Average Exercise Price | |||||||
$10.00 - $20.00 | 14,120 | 2.1 | $ | 17.74 | 14,120 | $ | 17.74 | |||||
$20.01 - $30.00 | 51,731 | 1.1 | 26.05 | 51,731 | 26.05 | |||||||
$30.01 - $40.00 | 70,363 | 5.3 | 35.53 | 68,238 | 35.41 | |||||||
$40.01 - $50.00 | 64,511 | 7.1 | 46.14 | 33,224 | 44.73 | |||||||
$50.01 - $60.00 | 27,724 | 6.9 | 50.70 | 18,200 | 50.70 | |||||||
$60.01 - $70.00 | 30,519 | 9.3 | 68.68 | 6,659 | 65.46 | |||||||
258,968 | 192,172 | |||||||||||
Page-79
We determine the fair value of stock options at the grant date using the Black-Scholes pricing model that takes into account the stock price at the grant date, the exercise price, and the following assumptions (weighted-average shown).
Years ended December 31, | ||||||
2017 | 2016 | 2015 | ||||
Risk-free interest rate | 1.66 | % | 1.37 | % | 1.67 | % |
Expected dividend yield on common stock | 1.70 | % | 2.02 | % | 1.75 | % |
Expected life in years | 2.4 | 6.0 | 6.0 | |||
Expected price volatility | 25.58 | % | 25.56 | % | 28.06 | % |
The fair value of stock options on the grant date is recorded as a stock-based compensation expense in the consolidated statements of comprehensive income over the requisite service period with a corresponding increase in common stock. Stock-based compensation also includes compensation expense related to the issuance of restricted stock awards. The grant-date fair value of the restricted stock awards, which equals intrinsic value on that date, is being recorded as compensation expense over the requisite service period. Total compensation cost for these share-based payment arrangements was $1.3 million, $994 thousand and $636 thousand during 2017, 2016 and 2015, respectively, and the total recognized deferred tax benefits related thereto were $293 thousand, $318 thousand and $194 thousand, respectively.
As of December 31, 2017, there was $1.5 million of total unrecognized compensation expense related to non-vested stock options and restricted stock awards. This cost is expected to be recognized over a weighted-average period of approximately 2.1 years. The total grant-date fair value of stock options vested during the years ended December 31, 2017, 2016 and 2015 was $449 thousand, $282 thousand and $202 thousand, respectively. The total grant-date fair value of restricted stock awards vested during 2017, 2016 and 2015 was $473 thousand, $380 thousand and $262 thousand, respectively.
We adopted ASU No. 2016-09, Compensation - Stock Compensation (Topic 718): Improvements to Employee Share-Based Payment Accounting effective January 1, 2017 as discussed in Note 1, which requires us to record excess tax benefits (deficiencies) resulting from the exercise of non-qualified stock options, the disqualifying disposition of incentive stock options and vesting of restricted stock awards as income tax benefits (expense) in the consolidated statements of comprehensive income with a corresponding decrease (increase) to current taxes payable. For the year ended December 31, 2017, we recognized $214 thousand in excess tax benefits recorded as a reduction to income tax expense related to these types of transactions. Prior to the adoption of this ASU, excess tax benefits (deficiencies) were recognized as an increase (decrease) to common stock in the consolidated statements of changes in stockholders' equity. The tax benefits realized from disqualifying dispositions of incentive stock options were recognized in tax expense to the extent of the book compensation cost recorded. Total tax benefits from disqualifying dispositions of incentive stock options recognized during 2016 and 2015 were $70 thousand and $49 thousand, respectively.
Dividends
Presented below is a summary of cash dividends paid to common shareholders, recorded as a reduction of retained earnings. On January 19, 2018, the Board of Directors declared a cash dividend of $0.29 per share, payable on February 9, 2018 to shareholders of record at the close of business on February 2, 2018.
Years ended December 31, | |||||||||
(in thousands except per share data) | 2017 | 2016 | 2015 | ||||||
Cash dividends to common stockholders | $ | 6,896 | $ | 6,223 | $ | 5,390 | |||
Cash dividends per common share | $ | 1.12 | $ | 1.02 | $ | 0.90 | |||
The holders of unvested restricted stock awards and performance-based stock awards are entitled to dividends on the same per-share ratio as holders of common stock. Upon the adoption of ASU No. 2016-09, tax benefits on dividends paid on unvested restricted stock awards are recorded as tax benefits in the consolidated statements of comprehensive income with a corresponding decrease to current taxes payable. Dividends on forfeited awards are included in stock-based compensation expense. Prior to the adoption of ASU No. 2016-09, tax benefits on dividends were recognized as an increase to common stock in the consolidated statements of changes in stockholders' equity.
Page-80
Under the California Corporations Code, payment of dividends by Bancorp to its shareholders is restricted to the amount of retained earnings immediately prior to the distribution or the amount of assets that exceeds the total liabilities immediately after the distribution. As of December 31, 2017, Bancorp's retained earnings and the amount of assets that exceeds the total liabilities were $155.5 million and $297.0 million, respectively.
Under the California Financial Code, payment of dividends by the Bank to Bancorp is restricted to the lesser of retained earnings or the amount of undistributed net profits of the Bank from the three most recent fiscal years. Under this restriction, approximately $39.9 million of the Bank's retained earnings balance was available for payment of dividends to Bancorp as of December 31, 2017. Bancorp held $3.2 million in cash at December 31, 2017. This cash, combined with the $39.9 million dividends available to be distributed from the Bank, is expected to be adequate to cover Bancorp's estimated operational needs and cash dividends to shareholders for 2018.
Preferred Stock and Shareholder Rights Plan
On July 6, 2017, Bancorp adopted a new shareholder rights agreement (“Rights Agreement”), which replaced the existing Rights Agreement that expired on July 23, 2017. The Rights Agreement, which expires on July 23, 2022, is designed to discourage takeovers that involve abusive tactics or do not provide fair value to shareholders. The Rights Agreement defines the percentage of share ownership of an "acquiring person" as 10% of the outstanding common shares. Each right entitles the registered holder to purchase from Bancorp one one-hundredth of a share of Series A Junior Participating Preferred Stock, no par value, of Bancorp at an initial price of $90 per one one-hundredth of a preferred share, subject to adjustment upon the occurrence of certain events. As of December 31, 2017, Bancorp was authorized to issue five million shares of preferred stock with no par value, one million shares of which have been designated as Series A Junior Participating Preferred Stock, with no par value under the Rights Agreement. In the event of a proposed merger, tender offer or other attempt to gain control of Bancorp that the Board of Directors does not approve, the Board of Directors may authorize the issuance of shares of common or preferred stock that would impede the completion of such a transaction. An effect of the possible issuance of common or preferred stock, therefore, may be to deter a future takeover attempt. The Board of Directors has no present plans or understandings for the issuance of any common or preferred stock in connection with the Rights Agreement.
Warrant
Under the United States Department of the Treasury Capital Purchase Program (the “TCPP”), Bancorp issued to the U.S. Treasury a warrant to purchase 154,242 shares of common stock at a per share exercise price of $27.23. The warrant was immediately exercisable and was subsequently auctioned to two institutional investors in November 2011. The warrant, as adjusted, represented the right to purchase 157,711 shares of common stock at $26.63 per share when it was exercised in September 2015 and the cashless exercise resulted in the issuance of 70,591 shares of common stock.
Page-81
Note 9: Fair Value of Assets and Liabilities
Fair Value Hierarchy and Fair Value Measurement
We group our assets and liabilities that are measured at fair value in three levels within the fair value hierarchy, based on the markets in which the assets and liabilities are traded and the reliability of the assumptions used to determine fair value. These levels are:
Level 1: Valuations are based on unadjusted quoted prices in active markets for identical assets or liabilities.
Level 2: Valuations are based on quoted prices for similar instruments in active markets, quoted prices for identical or similar instruments in markets that are not active and model-based valuations for which all significant assumptions are observable or can be corroborated by observable market data.
Level 3: Valuations are based on unobservable inputs that are supported by little or no market activity and that are significant to the fair value of the assets or liabilities. Values are determined using pricing models and discounted cash flow models and may include significant Management judgment and estimation.
Transfers between levels of the fair value hierarchy are recognized through our monthly and/or quarterly valuation process in the reporting period during which the event or circumstances that caused the transfer occurred.
The following table summarizes our assets and liabilities that were required to be recorded at fair value on a recurring basis.
(in thousands) Description of Financial Instruments | Carrying Value | Quoted Prices in Active Markets for Identical Assets (Level 1) | Significant Other Observable Inputs (Level 2) | Significant Unobservable Inputs (Level 3) | ||||||||
December 31, 2017 | ||||||||||||
Securities available for sale: | ||||||||||||
Mortgage-backed securities and collateralized mortgage obligations issued by U.S. government agencies | $ | 188,061 | $ | — | $ | 188,061 | $ | — | ||||
SBA-backed securities | $ | 25,982 | $ | — | $ | 25,817 | $ | 165 | ||||
Debentures of government sponsored agencies | $ | 12,938 | $ | — | $ | 12,938 | $ | — | ||||
Privately-issued collateralized mortgage obligations | $ | 1,431 | $ | — | $ | 1,431 | $ | — | ||||
Obligations of state and political subdivisions | $ | 97,491 | $ | — | $ | 97,491 | $ | — | ||||
Corporate bonds | $ | 6,564 | $ | — | $ | 6,564 | $ | — | ||||
Derivative financial assets (interest rate contracts) | $ | 74 | $ | — | $ | 74 | $ | — | ||||
Derivative financial liabilities (interest rate contracts) | $ | 740 | $ | — | $ | 740 | $ | — | ||||
December 31, 2016 | ||||||||||||
Securities available for sale: | ||||||||||||
Mortgage-backed securities and collateralized mortgage obligations issued by U.S. government agencies | $ | 253,434 | $ | — | $ | 253,434 | $ | — | ||||
SBA-backed securities | $ | 607 | $ | — | $ | — | $ | 607 | ||||
Debentures of government sponsored agencies | $ | 35,403 | $ | — | $ | 35,403 | $ | — | ||||
Privately-issued collateralized mortgage obligations | $ | 419 | $ | — | $ | 419 | $ | — | ||||
Obligations of state and political subdivisions | $ | 77,701 | $ | — | $ | 77,701 | $ | — | ||||
Corporate bonds | $ | 5,016 | $ | — | $ | 5,016 | $ | — | ||||
Derivative financial assets (interest rate contracts) | $ | 55 | $ | — | $ | 55 | $ | — | ||||
Derivative financial liabilities (interest rate contracts) | $ | 933 | $ | — | $ | 933 | $ | — | ||||
Securities available-for-sale are recorded at fair value on a recurring basis. When available, quoted market prices (Level 1) are used to determine the fair value of securities available-for-sale. If quoted market prices are not available, we obtain pricing information from a reputable third-party service provider, who may utilize valuation techniques that
Page-82
use current market-based or independently sourced parameters, such as bid/ask prices, dealer-quoted prices, interest rates, benchmark yield curves, prepayment speeds, probability of default, loss severity and credit spreads (Level 2). Level 2 securities include obligations of state and political subdivisions, U.S. agencies or government-sponsored agencies' debt securities, mortgage-backed securities, government agency-issued, privately-issued collateralized mortgage obligations and corporate bonds. As of December 31, 2017 and 2016, there were no securities that were considered Level 1 securities. As of December 31, 2017, we have one available-for-sale security that is considered a Level 3 security. The security is a U.S. government agency obligation collateralized by a small number of business equipment loans guaranteed by the Small Business Administration ("SBA") program. This security is not actively traded and is owned only by a few investors. The significant unobservable data that is reflected in the fair value measurement include dealer quotes, projected prepayment speeds/average life and credit information, among other things. The unrealized loss on this SBA-guaranteed security decreased by $6 thousand in 2017 recorded as part of other comprehensive income.
Securities held-to-maturity may be written down to fair value (determined using the same techniques discussed above for securities available-for-sale) as a result of an other-than-temporary impairment, and we did not record any write-downs during 2017 or 2016.
On a recurring basis, derivative financial instruments are recorded at fair value, which is based on the income approach using observable Level 2 market inputs, reflecting market expectations of future interest rates as of the measurement date. Standard valuation techniques are used to calculate the present value of the future expected cash flows assuming an orderly transaction. Valuation adjustments may be made to reflect both our own credit risk and the counterparties’ credit risk in determining the fair value of the derivatives. Level 2 inputs for the valuations are limited to observable market prices for London Interbank Offered Rate (“LIBOR”) and Overnight Index Swap ("OIS") rates (for the very short term), quoted prices for LIBOR futures contracts, observable market prices for LIBOR and OIS swap rates, and one-month and three-month LIBOR basis spreads at commonly quoted intervals. Mid-market pricing of the inputs is used as a practical expedient in the fair value measurements. We project spot rates at reset days specified by each swap contract to determine future cash flows, then discount to present value using either LIBOR or OIS curves depending on whether the swap positions are fully collateralized as of the measurement date. When the value of any collateral placed with counterparties is less than the interest rate derivative liability, a credit valuation adjustment ("CVA") is applied to reflect the credit risk we pose to counterparties. We have used the spread between the Standard & Poor's BBB rated U.S. Bank Composite rate and LIBOR for the closest maturity term corresponding to the duration of the swaps to derive the CVA. A similar credit risk adjustment, correlated to the credit standing of the counterparty, is made when collateral posted by the counterparty does not fully cover their liability to the Bank. For further discussion on our methodology in valuing our derivative financial instruments, refer to Note 14, Derivative Financial Instruments and Hedging Activities.
Certain financial assets may be measured at fair value on a non-recurring basis. These assets can be subject to fair value adjustments that result from the application of the lower of cost or fair value accounting or write-downs of individual assets, such as impaired loans and other real estate owned ("OREO"). In addition, assets acquired or liabilities assumed from business combinations are measured at fair value at the date of acquisition. Refer to Note 18 for details of fair value measurement used in association with business combinations.
The following table presents the carrying value of assets and liabilities measured at fair value on a non-recurring basis and that were held in the consolidated statements of condition at each respective period end, by level within the fair value hierarchy as of December 31, 2017 and 2016.
(in thousands) Description of Financial Instruments | Carrying Value | Quoted Prices in Active Markets for Identical Assets (Level 1) | Significant Other Observable Inputs (Level 2) | Significant Unobservable Inputs (Level 3) | ||||||||
December 31, 2017 | ||||||||||||
None | $ | — | $ | — | $ | — | $ | — | ||||
December 31, 2016 | ||||||||||||
Other real estate | $ | 408 | $ | — | $ | — | $ | 408 | ||||
Page-83
When a loan is identified as impaired, it is reported at the lower of cost or fair value, measured based on the loan's observable market price (Level 1) or the current net realizable value of the underlying collateral securing the loan, if the loan is collateral dependent (Level 3). Net realizable value of the underlying collateral is the fair value of the collateral less estimated selling costs and any prior liens. Appraisals, recent comparable sales, offers and listing prices are factored in when valuing the collateral. We review and verify the qualifications and licenses of the certified general appraisers used for appraising commercial properties or certified residential appraisers for residential properties. Real estate appraisals may utilize a combination of approaches including replacement cost, sales comparison and the income approach. Comparable sales and income data are analyzed by the appraisers and adjusted to reflect differences between them and the subject property such as property characteristics, leasing status and physical condition. When appraisals are received, Management reviews the underlying assumptions and methodology utilized, as well as the overall resulting value in conjunction with independent data sources such as recent market data and industry-wide statistics. We generally use a 6% discount for selling costs which is applied to all properties, regardless of size. Appraised values may be adjusted to reflect changes in market conditions that have occurred subsequent to the appraisal date, or for revised estimates regarding the timing or cost of the property sale. These adjustments are based on qualitative judgments made by Management on a case-by-case basis and are generally unobservable valuation inputs as they are specific to the underlying collateral. There have been no significant changes in the valuation techniques during 2017.
OREO represents collateral acquired through foreclosure and is initially recorded at fair value as established by a current appraisal, adjusted for disposition costs. Subsequently, OREO is measured at lower of cost or fair value. OREO values are reviewed on an ongoing basis and any subsequent decline in fair value is recorded as a foreclosed asset expense in the current period. The value of OREO is determined based on independent appraisals, similar to the process used for impaired loans, discussed above, and is classified as Level 3. All OREO had been acquired through business combinations and were sold as of December 31, 2017.
Disclosures about Fair Value of Financial Instruments
The table below is a summary of fair value estimates for financial instruments as of December 31, 2017 and 2016, excluding financial instruments recorded at fair value on a recurring basis (summarized in the first table in this note). The carrying amounts in the following table are recorded in the consolidated statements of condition under the indicated captions. Further, we have not disclosed the fair value of financial instruments specifically excluded from disclosure requirements of the Financial Instruments Topic of the Codification (ASC 825-10-50-8), such as BOLI. Additionally, we hold shares of FHLB stock and Visa Inc. Class B common stock at cost. These shares are restricted from resale and their values were discussed in Note 2, Investment Securities, above.
December 31, 2017 | December 31, 2016 | ||||||||||||||
(in thousands) | Carrying Amounts | Fair Value | Fair Value Hierarchy | Carrying Amounts | Fair Value | Fair Value Hierarchy | |||||||||
Financial assets: | |||||||||||||||
Cash and cash equivalents | $ | 203,545 | $ | 203,545 | Level 1 | $ | 48,804 | $ | 48,804 | Level 1 | |||||
Investment securities held-to-maturity | 151,032 | 151,032 | Level 2 | 44,438 | 45,097 | Level 2 | |||||||||
Loans, net | 1,663,246 | 1,650,198 | Level 3 | 1,471,174 | 1,473,360 | Level 3 | |||||||||
Interest receivable | 7,501 | 7,501 | Level 2 | 6,319 | 6,319 | Level 2 | |||||||||
Financial liabilities: | |||||||||||||||
Deposits | 2,148,670 | 2,148,050 | Level 2 | 1,772,700 | 1,773,102 | Level 2 | |||||||||
Subordinated debentures | 5,739 | 5,118 | Level 3 | 5,586 | 5,083 | Level 3 | |||||||||
Interest payable | 191 | 191 | Level 2 | 134 | 134 | Level 2 | |||||||||
Following is a description of methods and assumptions used to estimate the fair value of each class of financial instrument not recorded at fair value but required for disclosure purposes:
Cash and Cash Equivalents - The carrying amounts of cash and cash equivalents approximate their fair value because of the short-term nature of these instruments.
Held-to-maturity Securities - Held-to-maturity securities, which generally consist of obligations of state and political subdivisions and corporate bonds, are recorded at their amortized cost. Their fair value for disclosure purposes is
Page-84
determined using methodologies similar to those described above for available-for-sale securities using Level 2 inputs. If Level 2 inputs are not available, we may utilize pricing models that incorporate unobservable inputs that are supported by little or no market activity and that are significant to the fair value of the assets or liabilities (Level 3). As of December 31, 2017 and 2016, we did not hold any held-to-maturity securities whose fair value was measured using significant unobservable inputs.
Loans - The fair value of loans with variable interest rates approximates their current carrying value, because their rates are regularly adjusted to current market rates. The fair value of fixed rate loans or variable loans at negotiated interest rate floors or ceilings with remaining maturities in excess of one year is estimated by discounting the future cash flows using current market rates at which similar loans would be made to borrowers with similar creditworthiness and similar remaining maturities. The allowance for loan losses (“ALLL”) is considered to be a reasonable estimate of the portion of loan discount attributable to credit risks.
Interest Receivable and Payable - The interest receivable and payable balances approximate their fair value due to the short-term nature of their settlement dates.
Deposits - The fair value of deposits without stated maturity, such as transaction accounts, savings accounts and money market accounts, is the amount payable on demand at the reporting date. The fair value of time deposits is estimated by discounting the future cash flows using current rates offered for deposits of similar remaining maturities.
Subordinated Debentures - The fair values of the subordinated debentures were estimated by discounting the future cash flows (interest payment at a rate of three-month LIBOR plus 3.05% and 1.40%) to their present values using current market rates at which similar bonds would be issued with similar credit ratings as ours and similar remaining maturities. Each interest payment was discounted at the spot rate of the corresponding term, determined based on the yields and terms of comparable trust preferred securities, plus a liquidity premium. In July 2010, the Dodd-Frank Act was signed into law and limits the ability of certain bank holding companies to treat trust preferred security debt issuances as Tier 1 capital. This law effectively closed the trust-preferred securities markets for new issuances and led to the absence of observable or comparable transactions in the market place. Due to the use of unobservable inputs of trust preferred securities, we consider the fair value to be a Level 3 measurement. See Note 7, Borrowings for further information.
Commitments - The value of unrecognized financial instruments is estimated based on the fee income associated with the commitments which, in the absence of credit exposure, is considered to approximate their settlement value. The fair value of commitment fees was not material as of December 31, 2017 and 2016, respectively.
Note 10: Benefit Plans
In 2003, we established a Deferred Compensation Plan that allows certain key Management personnel designated by the Board of Directors of the Bank to defer up to 80% of their salary and 100% of their annual bonus. The plan was amended in 2007 in order to comply with the most recent Internal Revenue Code Section 409A changes. Under the amended plan, amounts deferred earn interest that is equal to the prime rate as published in the Wall Street Journal, on the first business day of the year, which was 3.75% on January 1, 2017, 3.50% on January 1, 2016 and 3.25% on January 1, 2015. Our deferred compensation obligation totaled $3.4 million and $3.2 million at December 31, 2017 and 2016, respectively, and is included in interest payable and other liabilities.
Our 401(k) Defined Contribution Plan (the “401(k) Plan”) commenced in May 1990 and is available to all regular employees at least eighteen years of age who complete ninety days of service, and enter the plan during one of the four open enrollment dates (January 1, April 1, July 1, and October 1) of each year. Under the 401(k) Plan, employees can defer between 1% and 50% of their eligible compensation, up to the maximum amount allowed by the Internal Revenue Code. Contributions to the 401(k) Plan for the employer match are vested at a rate of 20% per year over a five year period. In 2015 and 2016, the Bank matched 60% of each participant's contribution, with a maximum of $4 thousand of matching contribution per participant per year. In 2017, the Bank increased the match to 70% of each participant's contribution, with a maximum of $5 thousand of matching contribution per participant per year. Employer contributions totaled $765 thousand, $589 thousand and $555 thousand for the years ended December 31, 2017, 2016 and 2015, respectively.
Page-85
In 1999, the 401(k) Plan was amended to include an employee stock ownership component and was renamed the Bank of Marin Employee Stock Ownership and Savings Plan (the “Plan”). Under the terms of the Plan, as amended, the Board of Directors determines a specific portion of the Bank's profits to be contributed to the employee stock ownership each year either in common stock or in cash for the purchase of Bancorp stock to be allocated to all eligible employees based on a percentage of their salaries, regardless of whether an employee is participating in the 401(k) plan or not. In January 2010, the Bank of Marin Employee Stock Ownership and Savings Plan was split into two plans: Bank of Marin 401(k) Plan and Bank of Marin Employee Stock Ownership Plan ("ESOP"). The same eligibility criteria apply under the ESOP, while employees' contributions are not permitted. For all participants, employer contributions vest over a five year period of service. After five years of service, all employer contributions vest immediately. The Bank of Marin 401(k) Plan was amended in early 2016 to incorporate recent changes in the pension laws, and was amended again in November 2016 to include a Roth 401(k) option.
The Bank contributed cash in the amount of $1.2 million in 2016 and $1.1 million in 2015 to the ESOP, which purchased Bancorp stock at market prices. Starting in 2017, Bancorp issued shares of common stock and contributed them to the ESOP and recognized $1.2 million in expense, based on the quoted market price on the date of contribution. Cash dividends paid on Bancorp stock held by the ESOP are used to purchase additional shares in the open market. All shares of Bancorp stock held by the ESOP are included in the calculations of basic and diluted earnings per share. The employer contributions to the ESOP and the 401(k) Plan are included in salaries and benefits expense.
On January 1, 2011, we established a Salary Continuation Plan for a select group of Executive Management, who will receive twenty-five percent of their estimated salary at retirement as salary continuation benefit payments upon retirement. Each participant will need to participate in this plan for five years before vesting begins. After five years, the participant will vest ratably in the benefit over the remaining period until age 65. This Plan is unfunded and nonqualified for tax purposes and for purposes of Title I of the Employee Retirement Income Security Act of 1974. As part of the acquisition of Bank of Napa in November 2017, we assumed the salary continuation agreements for four former executive officers of Bank of Napa. Under these agreements, fixed annual retirement benefit payments will be made for ten years beginning the first day of the month following the executive reaching the age of 65. At December 31, 2017 and 2016, respectively, our liability under the Salary Continuation Plan was $2.5 million (including $1.2 million assumed from Bank of Napa) and $1.0 million recorded in interest payable and other liabilities.
Note 11: Income Taxes
The current and deferred components of the income tax provision for each of the three years ended December 31 are as follows:
(in thousands) | 2017 | 2016 | 2015 | ||||||
Current tax provision | |||||||||
Federal | $ | 5,379 | $ | 9,710 | $ | 7,097 | |||
State | 2,623 | 3,794 | 2,931 | ||||||
Total current | 8,002 | 13,504 | 10,028 | ||||||
Deferred tax provision (benefit) | |||||||||
Federal | 4,444 | (206 | ) | 382 | |||||
State | 416 | 48 | 80 | ||||||
Total deferred | 4,860 | (158 | ) | 462 | |||||
Total income tax provision | $ | 12,862 | $ | 13,346 | $ | 10,490 | |||
On December 22, 2017, the Tax Cuts and Jobs Act of 2017 was signed into law. The law reduces the federal corporate income tax rate to 21% for tax years beginning on or after January 1, 2018. Due to the enactment of the Tax Cuts and Jobs Act of 2017, the Bank has valued all of its deferred tax assets and liabilities at the 21% rate. The adjustment to the net deferred tax assets valuation as of December 22, 2017 was $3.0 million and has been recorded in the provision for income taxes in the fourth quarter of 2017.
Page-86
The following table shows the tax effect of our cumulative temporary differences as of December 31:
(in thousands) | 2017 | 2016 | ||||
Deferred tax assets: | ||||||
Allowance for loan losses and off-balance sheet credit commitments | $ | 4,945 | $ | 6,871 | ||
Net operating loss carryforwards | 2,629 | 3,582 | ||||
Net unrealized loss on securities available-for-sale | 1,405 | 2,543 | ||||
Deferred compensation plan and salary continuation plan | 1,744 | 1,773 | ||||
State franchise tax | 557 | 1,300 | ||||
Accrued but unpaid expenses | 212 | 1,251 | ||||
Fair value adjustment on acquired loans | 570 | 799 | ||||
Deferred rent and other lease incentives | 328 | 547 | ||||
Depreciation and disposals on premises and equipment | 632 | 528 | ||||
Other real estate owned | — | 448 | ||||
Stock-based compensation | 463 | 398 | ||||
Interest received on non-accrual loans | 130 | 185 | ||||
Other | 266 | 196 | ||||
Total gross deferred tax assets | 13,881 | 20,421 | ||||
Deferred tax liabilities: | ||||||
Deferred loan origination costs and fees | (2,153 | ) | (2,784 | ) | ||
Unaccreted discount on subordinated debentures | (742 | ) | (1,119 | ) | ||
Core deposit intangible asset | (1,919 | ) | (1,085 | ) | ||
Accretion on investment securities | (56 | ) | (54 | ) | ||
Other | (221 | ) | (42 | ) | ||
Total gross deferred tax liabilities | (5,091 | ) | (5,084 | ) | ||
Net deferred tax assets | $ | 8,790 | $ | 15,337 | ||
As of December 31, 2017, federal and California net operating loss carryforwards ("NOLs") of $5.1 million and $18.1 million, respectively, corresponded to the total $2.6 million deferred tax asset above. If not fully utilized, the federal NOLs will begin to expire in 2030, and the California NOLs will begin to expire in 2028. Based upon the level of historical taxable income and projections for future taxable income over the periods during which the deferred tax assets are expected to be deductible, Management believes it is more likely than not we will realize the benefit of the remaining deferred tax assets. Accordingly, no valuation allowance has been established as of December 31, 2017 or 2016.
The effective tax rate for 2017, 2016 and 2015 differs from the current federal statutory income tax rate as follows:
2017 | 2016 | 2015 | ||||
Federal statutory income tax rate | 35.0 | % | 35.0 | % | 35.0 | % |
Increase (decrease) due to: | ||||||
California franchise tax, net of federal tax benefit | 6.9 | % | 6.8 | % | 6.8 | % |
Write down of federal deferred tax assets, net 1 | 10.5 | % | — | % | — | % |
Tax exempt interest on municipal securities and loans | (6.1 | )% | (4.0 | )% | (4.2 | )% |
Tax exempt earnings on bank owned life insurance | (1.0 | )% | (0.8 | )% | (1.0 | )% |
Non-deductible acquisition related expenses | 0.8 | % | — | % | — | % |
Low income housing and qualified zone academy bond tax credits | (0.4 | )% | (0.3 | )% | (0.2 | )% |
Stock-based compensation excess tax benefit 2 | (0.3 | )% | — | % | — | % |
Other | (0.8 | )% | (0.1 | )% | (0.1 | )% |
Effective Tax Rate | 44.6 | % | 36.6 | % | 36.3 | % |
1 Due to the enactment of the Tax Cuts and Jobs Act of 2017, which reduces the federal corporate income tax rate to 21% for tax years beginning on or after January 1, 2018, we wrote down net deferred tax assets as of December 22, 2017 by $3.0 million and has been recorded in income tax expense in 2017.
2 Due to the adoption of ASU 2016-09 in 2017, all excess (or deficient) tax benefits associated with stock-based compensation awards are recognized as income tax benefit (expense).
Bancorp and the Bank have entered into a tax allocation agreement, which provides that income taxes shall be allocated between the parties on a separate entity basis. The intent of this agreement is that each member of the consolidated group will incur no greater tax liability than it would have incurred on a stand-alone basis.
Page-87
We file a consolidated return in the U.S. Federal tax jurisdiction and a combined return in the State of California tax jurisdiction. There were no ongoing federal or state income tax examinations at the issuance of this report. We are no longer subject to examinations by tax authorities for years before 2014 for federal income tax and before 2013 for California. At December 31, 2017 and 2016, there were no unrecognized tax benefits, and neither the Bank nor Bancorp had accruals for interest and penalties related to unrecognized tax benefits.
Note 12: Commitments and Contingencies
We rent certain premises under long-term, non-cancelable operating leases expiring at various dates through the year 2032. Most of the leases contain certain renewal options and escalation clauses. At December 31, 2017, the approximate minimum future commitments payable under non-cancelable contracts for leased premises are as follows:
(in thousands) | 2018 | 2019 | 2020 | 2021 | 2022 | Thereafter | Total | ||||||||||||||
Operating leases1 | $ | 4,444 | $ | 4,198 | $ | 3,758 | $ | 2,138 | $ | 1,330 | $ | 2,904 | $ | 18,772 | |||||||
1 Minimum payments have not been reduced by minimum sublease rentals of $51 thousand due in the future under non-cancelable subleases.
Rent expense included in occupancy expense totaled $4.1 million in 2017 and $3.9 million in 2016 and $4.2 million 2015.
Litigation Matters
We may be party to legal actions, which arise from time to time as part of the normal course of our business. We believe, after consultation with legal counsel, that we have meritorious defenses in these actions, and that litigation contingent liability, if any, will not have a material adverse effect on our financial position, results of operations, or cash flows.
We are responsible for our proportionate share of certain litigation indemnifications provided to Visa U.S.A. ("Visa") by its member banks in connection with lawsuits related to anti-trust charges and interchange fees ("Covered Litigation"). In 2012, Visa had reached a $4.0 billion interchange multidistrict litigation class settlement agreement for which it maintains an escrow account to be used for settlements or judgments in the Covered Litigation. At December 31, 2017, according to Visa's Form 10-Q filed on February 1, 2018, the escrow account balance was $828 million. While the accrued liability related to the Covered Litigation could be higher or lower than the litigation escrow account balance, Visa did not record an additional accrual for the Covered Litigation during 2017. In 2017, a number of class plaintiffs filed amended complaints for damages or filed new class complaints against Visa for injunctive relief. In addition, Wal-Mart Stores, Inc. entered into a new, unconditional settlement agreement with Visa in October 2017. As of the date of Visa's filing, it had reached settlement agreements with individual merchants representing 51% of the Visa-branded payment card sales volume of merchants who opted out of the 2012 settlement agreement. Litigation is ongoing and until the appeal process is complete, Visa is uncertain whether it will resolve the claims as contemplated by the settlement agreement and additional lawsuits may arise. The conversion rate of Visa Class B common stock held by us to Class A common stock (as discussed in Note 2, Investment Securities) may decrease if Visa makes more Covered Litigation settlement payments in the future, and the full effect on member banks is still uncertain. However, we are not aware of significant future cash settlement payments required by us on the Covered Litigation.
Note 13: Concentrations of Credit Risk
Concentration of credit risk is the risk associated with a lack of diversification, such as having substantial investments in a few individual issuers, thereby exposing us to greater risks resulting from adverse economic, political, regulatory, geographic, industrial or credit developments. Financial instruments that potentially subject us to concentrations of credit risk consist primarily of cash and cash equivalents, investment securities and loans.
Our cash in correspondent bank accounts, at times, may exceed FDIC insured limits. We place cash and cash equivalents with high quality financial institutions, periodically monitor their credit worthiness and limit the amount of credit exposure with any one institution according to regulations. Concentrations of credit risk with respect to investment securities are limited to the U.S. Government, its agencies and Government Sponsored Enterprises ("GSEs") and was $358.4 million, or 74% of our total investment portfolio at December 31, 2017 and $299.5 million, or 72% at December 31, 2016.
Page-88
We also manage our credit exposure related to our loan portfolio to avoid the risk of undue concentration of credits in a particular industry by reducing significant exposure to highly leveraged transactions or to any individual customer or counterparty, and by obtaining collateral as appropriate. No individual borrower accounts for more than 2% of loans held in the portfolio. The largest loan concentration group by industry of the borrowers is real estate, which accounts for 81% and 79% of our loan portfolio at December 31, 2017 and 2016, respectively.
Note 14: Derivative Financial Instruments and Hedging Activities
We have entered into interest rate swap agreements, primarily as an asset/liability management strategy, in order to mitigate the changes in the fair value of specified long-term fixed-rate loans (or firm commitments to enter into long-term fixed-rate loans) caused by changes in interest rates. These hedges allow us to offer long-term fixed rate loans to customers without assuming the interest rate risk of a long-term asset. Converting our fixed-rate interest payments to floating-rate interest payments, generally benchmarked to the one-month U.S. dollar LIBOR index, protects us against changes in the fair value of our loans associated with fluctuating interest rates.
Our credit exposure, if any, on interest rate swap asset positions is limited to the fair value (net of any collateral pledged to us) and interest payments of all swaps by each counterparty. Conversely, when an interest rate swap is in a liability position exceeding a certain threshold, we may be required to post collateral to the counterparty in an amount determined by the agreements. Collateral levels are monitored and adjusted on a regular basis for changes in interest rate swap values.
As of December 31, 2017, we had five interest rate swap agreements, which are scheduled to mature in June 2031, October 2031, July 2032, August 2037 and October 2037. All of our derivatives are accounted for as fair value hedges. The notional amounts of the interest rate contracts are equal to the notional amounts of the hedged loans. Our interest rate swap payments are settled monthly with counterparties. Accrued interest on the swaps totaled $8 thousand and $13 thousand as of December 31, 2017 and 2016, respectively. Information on our derivatives follows:
Asset derivatives | Liability derivatives | |||||||||||
(in thousands) | December 31, 2017 | December 31, 2016 | December 31, 2017 | December 31, 2016 | ||||||||
Fair value hedges: | ||||||||||||
Interest rate contracts notional amount | $ | 4,019 | $ | 4,217 | $ | 14,810 | $ | 15,495 | ||||
Interest rate contracts fair value 1 | $ | 74 | $ | 55 | $ | 740 | $ | 933 | ||||
Years ended December 31, | |||||||||
(in thousands) | 2017 | 2016 | 2015 | ||||||
Increase in value of designated interest rate swaps due to LIBOR interest rate movements recognized in interest income | $ | 212 | $ | 778 | $ | 280 | |||
Payment on interest rate swaps recorded in interest income | (333 | ) | (556 | ) | (918 | ) | |||
Decrease in value of hedged loans recognized in interest income | (166 | ) | (571 | ) | (308 | ) | |||
Decrease in value of yield maintenance agreement recognized against interest income | (15 | ) | (94 | ) | (52 | ) | |||
Net loss on derivatives recognized against interest income 2 | $ | (302 | ) | $ | (443 | ) | $ | (998 | ) |
1 See Note 9, Fair Value of Assets and Liabilities for valuation methodology.
2 Includes hedge ineffectiveness gain of $31 thousand, gain of $113 thousand and loss of $80 thousand for the years December 31, 2017, 2016 and 2015, respectively. Changes in value of swaps were included in the assessment of hedge effectiveness. Hedge ineffectiveness is the measure of the extent to which the change in the fair value of the hedging instruments does not exactly offset the change in the fair value of the hedged items from period to period.
Our derivative transactions with counterparties are under International Swaps and Derivative Association (“ISDA”) master agreements that include “right of set-off” provisions. “Right of set-off” provisions are legally enforceable rights to offset recognized amounts and there may be an intention to settle such amounts on a net basis. We do not offset such financial instruments for financial reporting purposes.
Page-89
Information on financial instruments that are eligible for offset in the consolidated statements of condition follows:
Offsetting of Financial Assets and Derivative Assets | ||||||||||||||||||
Gross Amounts Not Offset in the Statements of Condition | ||||||||||||||||||
Gross Amounts | Net Amounts | |||||||||||||||||
Gross Amounts | Offset in the | of Assets Presented | ||||||||||||||||
of Recognized | Statements of | in the Statements | Financial | Cash Collateral | ||||||||||||||
(in thousands) | Assets1 | Condition | of Condition1 | Instruments | Received | Net Amount | ||||||||||||
December 31, 2017 | ||||||||||||||||||
Derivatives by Counterparty: | ||||||||||||||||||
Counterparty A | $ | 74 | $ | 74 | $ | (74 | ) | $ | — | |||||||||
Total | $ | 74 | $ | — | $ | 74 | $ | (74 | ) | $ | — | $ | — | |||||
December 31, 2016 | ||||||||||||||||||
Derivatives by Counterparty: | ||||||||||||||||||
Counterparty A | $ | 55 | $ | — | $ | 55 | $ | (55 | ) | $ | — | $ | — | |||||
Total | $ | 55 | $ | — | $ | 55 | $ | (55 | ) | $ | — | $ | — | |||||
1 Amounts exclude accrued interest totaling $0.3 thousand and $1 thousand at December 31, 2017 and December 31, 2016, respectively.
Offsetting of Financial Liabilities and Derivative Liabilities | ||||||||||||||||||
Gross Amounts Not Offset in the Statements of Condition | ||||||||||||||||||
Gross Amounts | Net Amounts of | |||||||||||||||||
Gross Amounts | Offset in the | Liabilities Presented | ||||||||||||||||
of Recognized | Statements of | in the Statements of | Financial | Cash Collateral | ||||||||||||||
(in thousands) | Liabilities2 | Condition | Condition2 | Instruments | Pledged | Net Amount | ||||||||||||
December 31, 2017 | ||||||||||||||||||
Derivatives by Counterparty: | ||||||||||||||||||
Counterparty A | $ | 740 | $ | 740 | $ | (74 | ) | (666 | ) | $ | — | |||||||
Total | $ | 740 | $ | — | $ | 740 | $ | (74 | ) | $ | (666 | ) | $ | — | ||||
December 31, 2016 | ||||||||||||||||||
Derivatives by Counterparty: | ||||||||||||||||||
Counterparty A | $ | 933 | $ | — | $ | 933 | $ | (55 | ) | $ | (878 | ) | $ | — | ||||
Total | $ | 933 | $ | — | $ | 933 | $ | (55 | ) | $ | (878 | ) | $ | — | ||||
2 Amounts exclude accrued interest totaling $8 thousand and $12 thousand at December 31, 2017 and December 31, 2016, respectively.
Note 15: Regulatory Matters
We are subject to various regulatory capital requirements administered by the federal banking agencies. Failure to meet minimum capital requirements as set forth in the tables below can initiate certain mandatory and possibly additional discretionary actions by regulators that, if undertaken, could have a material effect on our consolidated financial statements. Under capital adequacy guidelines and the regulatory framework for prompt corrective action, we must meet specific capital guidelines that involve quantitative measures of our assets, liabilities, and certain off-balance sheet items as calculated under regulatory accounting practices. The capital amounts and the Bank’s prompt corrective action classification are also subject to qualitative judgments by the regulators about components of capital, risk weightings and other factors.
Capital ratios are reviewed by Management on a regular basis to ensure that capital exceeds the prescribed regulatory minimums and is adequate to meet our anticipated future needs. For all periods presented, the Bank’s ratios exceed the regulatory definition of “well capitalized” under the regulatory framework for prompt corrective action and Bancorp’s ratios exceed the required minimum ratios to be considered a well capitalized bank holding company. In addition, the most recent notification from the FDIC categorized the Bank as well capitalized under the regulatory framework for prompt corrective action as of December 31, 2017. There are no conditions or events since that notification that
Page-90
Management believes have changed the Bank’s categories and we expect the Bank to remain well capitalized for prompt corrective action purposes.
In July 2013, the Board of Governors of the Federal Reserve System, the Federal Deposit Insurance Corporation and the Office of the Comptroller of the Currency ("Agencies") finalized regulatory capital rules known as “Basel III.” The rules became effective beginning January 2015, and will be fully phased-in by January 2019. The guidelines, among other things, changed the minimum capital requirements of banks and bank holding companies, by increasing the Tier 1 capital to risk-weighted assets ratio to 6%, and introduced a new requirement to maintain a minimum ratio of common equity Tier 1 capital to risk-weighted assets of 4.5%. By 2019, when fully phased in, the rules will require further increases to certain minimum capital requirements and a capital conservation buffer of an additional 2.5% of risk-weighted assets.
In August 2017, the Agencies published a final rule ("transitions NPR") halting the phase-in of certain Basel III capital rules for banks not using the Basel advanced approaches. The rule extends the regulatory capital treatment applicable during 2017 under the regulatory capital rules for certain items. These items include regulatory capital deductions, risk weights, and certain minority interest limitations. This effectively pauses the full transition to the Basel III treatment of mortgage servicing assets, certain deferred tax assets, investments in the capital of unconsolidated financial institutions and minority interests while the Agencies pursue more extensive rulemaking to simplify the treatment of assets. The transitions NPR that was effective January 1, 2018 does not apply to Bank of Marin.
We have modeled our ratios under fully phased-in Basel III rules and, based on present facts, we do not expect that we will be required to raise additional capital as a result of the fully phased-in rules.
The Bancorp’s and Bank's capital adequacy ratios as of December 31, 2017 and 2016 are presented in the following tables. Bancorp's Tier 1 capital includes the subordinated debentures, which are not included at the Bank level. We continued to build capital in 2017 through stock issued in the Bank of Napa acquisition and the accumulation of net income.
Capital Ratios for Bancorp (dollars in thousands) | Actual Ratio | Adequately Capitalized Threshold 1 | Ratio to be a Well Capitalized Bank Holding Company | ||||||||||||||
December 31, 2017 | Amount | Ratio | Amount | Ratio | Amount | Ratio | |||||||||||
Total Capital (to risk-weighted assets) | $ | 287,435 | 14.91 | % | ≥ $ | 178,323 | ≥ 9.250 | % | ≥ $ | 192,782 | ≥ 10.000 | % | |||||
Tier 1 Capital (to risk-weighted assets) | $ | 270,710 | 14.04 | % | ≥ $ | 139,767 | ≥ 7.250 | % | ≥ $ | 154,225 | ≥ 8.000 | % | |||||
Tier 1 Capital (to average assets) | $ | 270,710 | 12.13 | % | ≥ $ | 89,285 | ≥ 4.000 | % | ≥ $ | 111,607 | ≥ 5.000 | % | |||||
Common Equity Tier 1 (to risk-weighted assets) | $ | 265,119 | 13.75 | % | ≥ $ | 110,849 | ≥ 5.750 | % | ≥ $ | 125,308 | ≥ 6.500 | % | |||||
December 31, 2016 | |||||||||||||||||
Total Capital (to risk-weighted assets) | $ | 247,453 | 14.32 | % | ≥ $ | 149,039 | ≥ 8.625 | % | ≥ $ | 172,799 | ≥ 10.000 | % | |||||
Tier 1 Capital (to risk-weighted assets) | $ | 231,111 | 13.37 | % | ≥ $ | 114,479 | ≥ 6.625 | % | ≥ $ | 138,239 | ≥ 8.000 | % | |||||
Tier 1 Capital (to average assets) | $ | 231,111 | 11.39 | % | ≥ $ | 81,189 | ≥ 4.000 | % | ≥ $ | 101,486 | ≥ 5.000 | % | |||||
Common Equity Tier 1 (to risk-weighted assets) | $ | 225,925 | 13.07 | % | ≥ $ | 88,559 | ≥ 5.125 | % | ≥ $ | 112,319 | ≥ 6.500 | % | |||||
1 The 2017 and 2016 adequately capitalized thresholds include the capital conservation buffer that was effective January 1, 2016 and January 1, 2017, respectively. These ratios are not reflected on a fully phased-in basis. | |||||||||||||||||
Page-91
Capital Ratios for the Bank (dollars in thousands) | Actual Ratio | Adequately Capitalized Threshold 1 | Ratio to be Well Capitalized under Prompt Corrective Action Provisions | ||||||||||||||
December 31, 2017 | Amount | Ratio | Amount | Ratio | Amount | Ratio | |||||||||||
Total Capital (to risk-weighted assets) | $ | 283,885 | 14.73 | % | ≥ $ | 178,281 | ≥ 9.250 | % | ≥ $ | 192,737 | ≥ 10.000 | % | |||||
Tier 1 Capital (to risk-weighted assets) | $ | 267,160 | 13.86 | % | ≥ $ | 139,734 | ≥ 7.250 | % | ≥ $ | 154,189 | ≥ 8.000 | % | |||||
Tier 1 Capital (to average assets) | $ | 267,160 | 11.97 | % | ≥ $ | 89,275 | ≥ 4.000 | % | ≥ $ | 111,593 | ≥ 5.000 | % | |||||
Common Equity Tier 1 (to risk-weighted assets) | $ | 267,160 | 13.86 | % | ≥ $ | 110,824 | ≥ 5.750 | % | ≥ $ | 125,279 | ≥ 6.500 | % | |||||
December 31, 2016 | |||||||||||||||||
Total Capital (to risk-weighted assets) | $ | 243,468 | 14.09 | % | ≥ $ | 149,016 | ≥ 8.625 | % | ≥ $ | 172,772 | ≥ 10.000 | % | |||||
Tier 1 Capital (to risk-weighted assets) | $ | 222,127 | 13.15 | % | ≥ $ | 114,462 | ≥ 6.625 | % | ≥ $ | 138,218 | ≥ 8.000 | % | |||||
Tier 1 Capital (to average assets) | $ | 222,127 | 11.19 | % | ≥ $ | 81,176 | ≥ 4.000 | % | ≥ $ | 101,469 | ≥ 5.000 | % | |||||
Common Equity Tier 1 (to risk-weighted assets) | $ | 222,127 | 13.15 | % | ≥ $ | 88,546 | ≥ 5.125 | % | ≥ $ | 112,302 | ≥ 6.500 | % | |||||
1 The 2017 and 2016 adequately capitalized thresholds include the capital conservation buffer that was effective January 1, 2016 and January 1, 2017, respectively. These ratios are not reflected on a fully phased-in basis. | |||||||||||||||||
Note 16: Financial Instruments with Off-Balance Sheet Risk
We make commitments to extend credit in the normal course of business to meet the financing needs of our customers. These financial instruments include commitments to extend credit in the form of loans or through standby letters of credit. Commitments to extend credit are agreements to lend to a customer as long as there is no violation of any condition established in the contract. Commitments generally have fixed expiration dates or other termination clauses and may require payment of a fee. Because various commitments will expire without being fully drawn upon, the total commitment amount does not necessarily represent future cash requirements.
We are exposed to credit loss equal to the contractual amount of the commitment in the event of nonperformance by the borrower. We use the same credit underwriting criteria for all credit exposure. The amount of collateral obtained, if deemed necessary by us, is based on Management's credit evaluation of the borrower. Collateral types pledged may include accounts receivable, inventory, other personal property and real property.
The contractual amount of undrawn loan commitments and standby letters of credit not reflected on the consolidated statements of condition are as follows:
(in thousands) | December 31, 2017 | December 31, 2016 | ||||
Commercial lines of credit | $ | 224,370 | $ | 216,774 | ||
Revolving home equity lines | 177,678 | 148,143 | ||||
Undisbursed construction loans | 35,322 | 44,798 | ||||
Personal and other lines of credit | 11,758 | 10,635 | ||||
Standby letters of credit | 4,074 | 1,939 | ||||
Total commitments and standby letters of credit | $ | 453,202 | $ | 422,289 | ||
We record an allowance for losses on these off-balance sheet commitments based on an estimate of probabilities of these commitments being drawn upon according to the historical utilization experience on different types of commitments and expected loss. We set aside an allowance for losses on off-balance sheet commitments in the amount of $958 thousand and $899 thousand as of December 31, 2017 and 2016, respectively, which is recorded in interest payable and other liabilities on the consolidated statements of condition. Approximately 44% of the commitments expire in 2018, approximately 41% expire between 2019 and 2025 and approximately 15% expire thereafter.
Page-92
Note 17: Condensed Bank of Marin Bancorp Parent Only Financial Statements
Presented below is financial information for Bank of Marin Bancorp, parent holding company only.
CONDENSED UNCONSOLIDATED STATEMENTS OF CONDITION | ||||||
December 31, 2017 and 2016 | ||||||
(in thousands) | 2017 | 2016 | ||||
Assets | ||||||
Cash and due from Bank of Marin | $ | 3,246 | $ | 3,568 | ||
Investment in bank subsidiary | 299,486 | 232,431 | ||||
Other assets | 586 | 670 | ||||
Total assets | $ | 303,318 | $ | 236,669 | ||
Liabilities and Stockholders' Equity | ||||||
Subordinated debentures | $ | 5,739 | $ | 5,586 | ||
Accrued expenses payable | 146 | 96 | ||||
Other liabilities | 408 | 424 | ||||
Total liabilities | 6,293 | 6,106 | ||||
Stockholders' equity | 297,025 | 230,563 | ||||
Total liabilities and stockholders' equity | $ | 303,318 | $ | 236,669 | ||
CONDENSED UNCONSOLIDATED STATEMENTS OF INCOME | |||||||||
Years ended December 31, 2017, 2016 and 2015 | |||||||||
(in thousands) | 2017 | 2016 | 2015 | ||||||
Income | |||||||||
Dividends from bank subsidiary | $ | 8,000 | $ | 6,400 | $ | 6,500 | |||
Miscellaneous Income | 8 | 7 | 6 | ||||||
Total income | 8,008 | 6,407 | 6,506 | ||||||
Expense | |||||||||
Interest expense | 439 | 435 | 420 | ||||||
Non-interest expense | 2,087 | 984 | 973 | ||||||
Total expense | 2,526 | 1,419 | 1,393 | ||||||
Income (loss) before income taxes and equity in undistributed net income of subsidiary | 5,482 | 4,988 | 5,113 | ||||||
Income tax benefit | 876 | 594 | 583 | ||||||
Income (loss) before equity in undistributed net income of subsidiary | 6,358 | 5,582 | 5,696 | ||||||
Earnings of bank subsidiary greater (less) than dividends received from bank subsidiary | 9,618 | 17,552 | 12,745 | ||||||
Net income | $ | 15,976 | $ | 23,134 | $ | 18,441 | |||
Page-93
CONDENSED UNCONSOLIDATED STATEMENTS OF CASH FLOWS | |||||||||
Years ended December 31, 2017, 2016 and 2015 | |||||||||
(in thousands) | 2017 | 2016 | 2015 | ||||||
Cash Flows from Operating Activities: | |||||||||
Net income | $ | 15,976 | $ | 23,134 | $ | 18,441 | |||
Adjustments to reconcile net income to net cash provided by (used in) operating activities: | |||||||||
Earnings of bank subsidiary greater than dividends received from bank subsidiary | (9,618 | ) | (17,552 | ) | (12,745 | ) | |||
Net change in operating assets and liabilities: | |||||||||
Accretion of discount on subordinated debentures | 153 | 191 | 210 | ||||||
Other assets | 92 | 353 | (298 | ) | |||||
Intercompany receivable | (40 | ) | 171 | (18 | ) | ||||
Other liabilities | 51 | (302 | ) | 368 | |||||
Noncash director compensation expense - common stock | 20 | — | — | ||||||
Net cash provided by operating activities | 6,634 | 5,995 | 5,958 | ||||||
Cash Flows from Investing Activities: | |||||||||
Capital contribution to subsidiary | (853 | ) | (1,285 | ) | (1,156 | ) | |||
Net cash used in investing activities | (853 | ) | (1,285 | ) | (1,156 | ) | |||
Cash Flows from Financing Activities: | |||||||||
Proceeds from stock options exercised and stock issued under employee and director stock purchase plans and ESOP | 853 | 1,285 | 1,156 | ||||||
Payment of tax withholdings for stock options exercised | (60 | ) | — | — | |||||
Dividends paid on common stock | (6,896 | ) | (6,223 | ) | (5,390 | ) | |||
Net cash used by financing activities | (6,103 | ) | (4,938 | ) | (4,234 | ) | |||
Net (decrease) increase in cash and cash equivalents | (322 | ) | (228 | ) | 568 | ||||
Cash and cash equivalents at beginning of period | 3,568 | 3,796 | 3,228 | ||||||
Cash and cash equivalents at end of period | $ | 3,246 | $ | 3,568 | $ | 3,796 | |||
Supplemental schedule of non-cash investing and financing activities: | |||||||||
Stock issued in payment of director fees | $ | 188 | $ | 234 | $ | 275 | |||
Page-94
Note 18: Acquisition
On November 21, 2017, we completed the merger of Bank of Napa, N.A. (OTCQB: BNNP), to enhance our market presence in Napa, California. Bank of Napa was a national bank with two branch offices serving Napa. The acquisition added $134.7 million in loans, $249.9 million in deposits and $75.5 million in investment securities to Bank of Marin as of the acquisition date. Bank of Napa shareholders received 0.307 shares of Bancorp common stock for each share of Bank of Napa common stock outstanding. The acquisition of Bank of Napa constituted a business combination and has been accounted for using the acquisition method of accounting. The assets acquired and liabilities assumed, both tangible and intangible, were recorded at their fair values as of the acquisition date in accordance with ASC 805, Business Combinations. The acquisition was treated as a "reorganization" within the definition of section 368(a) of the Internal Revenue Code and is generally considered tax-free for U.S. federal income tax purposes.
The following table reflects the estimated fair values of the assets acquired and liabilities assumed related to the acquisition:
(dollars in thousands) | Acquisition Date November 21, 2017 | ||
Assets: | |||
Cash and cash equivalents | $ | 59,779 | |
Investment securities | 75,469 | ||
Loans | 134,720 | ||
Core deposit intangible | 4,441 | ||
Goodwill | 23,705 | ||
Bank premises and equipment | 599 | ||
Other assets | 6,408 | ||
Total assets acquired | $ | 305,121 | |
Liabilities: | |||
Deposits: | |||
Non-interest bearing | $ | 77,266 | |
Interest bearing | |||
Transaction accounts | 50,080 | ||
Savings accounts | 12,157 | ||
Money market accounts | 85,045 | ||
Other time accounts | 25,338 | ||
Total deposits | 249,886 | ||
Other liabilities | 2,050 | ||
Total liabilities assumed | $ | 251,936 | |
Merger consideration of $53,185 (735,264 common shares and 70,145 shares of replacement stock options issued by Bank of Marin Bancorp). | $ | 53,185 | |
The following table presents the net assets acquired from Bank of Napa, consideration paid and the estimated fair value adjustments:
(dollars in thousands) | Acquisition Date November 21, 2017 | ||
Book value of net assets acquired from Bank of Napa | $ | 26,152 | |
Fair value adjustments: | |||
Loans | 1,301 | ||
Core deposit intangible asset | 4,441 | ||
Total purchase accounting adjustments | 5,742 | ||
Deferred tax liabilities (tax effect of purchase accounting adjustments at 42.05%) | (2,414 | ) | |
Fair value of net assets acquired from Bank of Napa | $ | 29,480 | |
Merger consideration | $ | 53,185 | |
Less: fair value of net assets acquired | (29,480 | ) | |
Goodwill | $ | 23,705 | |
Page-95
Goodwill
As a result of the Bank of Napa acquisition, we recorded $23.7 million in goodwill, which represents the excess of the total purchase price paid over the fair value of the assets acquired, net of the fair values of liabilities assumed. Goodwill mainly reflects expected value created through the combined operations of Bank of Napa and Bank of Marin. It is evaluated for impairment annually. We determined that the fair value of our traditional community banking activities (provided through our branch network) exceeded the carrying amount of the bank-level reporting unit. Therefore, no impairment on goodwill was recorded in 2017. The goodwill is not deductible for tax purposes.
The following is a description of the methods used to determine the fair values of significant assets and liabilities whose fair values are different from their carrying amounts on Bank of Napa's books at acquisition date presented above.
Loans
The fair values for acquired loans were developed based upon the present values of the expected cash flows utilizing market-derived discount rates. Expected cash flows for each acquired loan were projected based on contractual cash flows adjusted for expected prepayment, expected default (i.e. probability of default and loss severity), and principal recovery.
Prepayment rates were applied to the principal outstanding based on the type of loan, where appropriate. Prepayments were based on a constant prepayment rate (“CPR”) applied across the life of a loan. For performing loans, we used annual CPRs between 5 percent and 27 percent, depending on the characteristics of the loan pool (e.g. construction, commercial real estate, etc.). For classified loans, no prepayment was assumed and applied.
Non-PCI loans were valued on a loan-by-loan basis when applying the discount rate on the expected cash flows. The discount rates used were based on current market rates for new originations of comparable loans, where available, and include adjustments for credit and illiquidity premium. To the extent comparable market rates are not readily available, a discount rate was derived based on the assumptions of a market participant's cost of funds, capital charge, servicing costs, and return requirements for comparable risk assets. PCI loans were also valued on an individual basis.
The following table presents the fair value of loans acquired from Bank of Napa for PCI loans as of the acquisition date (November 21, 2017):
(in thousands) | PCI loans | ||
Contractually required payments including interest | $ | 1,769 | |
Less: contractual cash flows not expected to be collected (nonaccretable difference) | 805 | ||
Cash flows expected to be collected (undiscounted) | 964 | ||
Less: interest component of cash flows expected to be collected (accretable yield) | 109 | ||
Fair value of PCI loans | $ | 855 | |
The following table presents the fair value of loans acquired from Bank of Napa for non-PCI loans as of the acquisition date (November 21, 2017):
(in thousands) | Non-PCI loans | ||
Contractually required payments including interest | $ | 183,833 | |
Contractual cash flows not expected to be collected | $ | 14,227 | |
Fair value of non-PCI loans | $ | 133,865 | |
The following table reflects the outstanding balance and related fair value of PCI loans as of the acquisition date:
PCI Loans (in thousands) | Unpaid principal balance | Fair value | ||||
Commercial | $ | 417 | $ | 70 | ||
Commercial real estate | 1,070 | 785 | ||||
Total purchased credit-impaired loans | $ | 1,487 | $ | 855 | ||
Page-96
Core Deposit Intangible
The core deposit intangible represents the estimated future benefits of acquired deposits and is booked separately from the related deposits. The value of the core deposit intangible asset was determined using a discounted cash flow approach to arrive at the cost differential between the core deposits (non-maturity deposits such as transaction, savings and money market accounts) and alternative funding sources. It was calculated as the present value of the difference in cash flows between maintaining the core deposits (interest and net maintenance costs) and the cost of an equal amount of funds with a similar term from an alternative source. The core deposit intangible is amortized on an accelerated basis over an estimated ten-year life, and is evaluated periodically for impairment. No impairment loss was recognized in 2017.
We recorded a core deposit intangible asset of $4.4 million at acquisition, of which $56 thousand was amortized in 2017. At December 31, 2017, the future estimated amortization expense on the CDI from the Bank of Napa acquisition is as follows:
(in thousands) | 2018 | 2019 | 2020 | 2021 | 2022 | Thereafter | Total | ||||||||||||||
Core deposit intangible amortization | $ | 508 | $ | 499 | $ | 488 | $ | 475 | $ | 460 | $ | 1,955 | $ | 4,385 | |||||||
Pro Forma Results of Operations
The first column of the following table presents the former Bank of Napa's operations and its actual contribution to our net interest income and net income included in our consolidated statement of comprehensive income from the acquisition date (November 21, 2017) through December 31, 2017. The table also presents pro forma information of the combined entity as if the acquisition occurred on January 1, 2016. The pro forma information does not necessarily reflect the results of operations that would have resulted had the acquisition been completed at the beginning of the periods presented, nor is it indicative of the results of operations in future periods. Furthermore, cost savings and other business synergies related to the acquisition are not reflected in the pro forma amounts.
Pro Forma Revenue and Earnings | ||||||||||||
(in thousands) | Actual from acquisition date through December 31, 2017 | 2017 | 2016 | |||||||||
Net interest income | $ | 913 | $ | 82,802 | $ | 80,898 | ||||||
Net (loss) Income | $ | (576 | ) | 1 | $ | 18,898 | 2 | $ | 21,559 | 2 | ||
1 Bank of Napa's net loss from November 21, 2017 through December 31, 2017 includes acquisition-related costs, accretion of the discount on acquired loans and core deposit intangible amortization. | ||||||||||||
2 2017 pro forma combined net income was adjusted to exclude acquisition related costs of $2.2 million incurred by Bank of Marin Bancorp and $2.5 million incurred by Bank of Napa. 2016 pro forma combined earnings were adjusted to include these acquisition related costs as if the merger occurred on January 1, 2016. | ||||||||||||
Acquisition-related expenses are recognized as incurred and continue until all systems have been converted and operational functions become fully integrated. Bank of Marin Bancorp incurred acquisition-related expenses in the consolidated statements of comprehensive income in 2017 for the Bank of Napa acquisition as follows:
(in thousands) | Year Ended December 31, 2017 | ||
Data processing1 | $ | 1,108 | |
Professional services | 952 | ||
Personnel severance | 35 | ||
Other | 114 | ||
Total | $ | 2,209 | |
1 Primarily relates to Bank of Napa's core processing system contract termination and deconversion fees. | |||
End of 2017 Audited Consolidated Financial Statements
Page-97
ITEM 9. | CHANGES IN AND DISAGREEMENTS WITH ACCOUNTANTS ON ACCOUNTING AND FINANCIAL DISCLOSURE |
None.
ITEM 9A. CONTROLS AND PROCEDURES
(A) Evaluation of Disclosure Controls and Procedures
Bank of Marin Bancorp and its subsidiary (the "Company") conducted an evaluation under the supervision and with the participation of our Management, including our Chief Executive Officer and Chief Financial Officer, of the effectiveness of the design and operation of our disclosure controls and procedures (as defined in Rule 13a-15(e) or 15d-15(e) under the Exchange Act of 1934 (the “Act”)) as of the end of the period covered by this report. The term disclosure controls and procedures means controls and other procedures that are designed to ensure that information required to be disclosed by us in the reports that we file or submit under the Act (15 U.S.C. 78a et seq.) is recorded, processed, summarized and reported within the time periods specified in the Commission's rules and forms. Disclosure controls and procedures include, without limitation, controls and procedures designed to ensure that information required to be disclosed by us in the reports that we file or submit under the Act is accumulated and communicated to our Management, including our principal executive and principal financial officers, or persons performing similar functions, as appropriate to allow timely decisions regarding required disclosure. Based upon that evaluation, our Chief Executive Officer and Chief Financial Officer concluded that our disclosure controls and procedures were effective as of the end of the period covered by this report.
(B) Management's Annual Report on Internal Control over Financial Reporting
Management is responsible for establishing and maintaining effective internal control over financial reporting (as defined in Rules 13a-15(f) promulgated under the 1934 Act). The internal control process has been designed under our supervision to provide reasonable assurance regarding the reliability of financial reporting and the preparation of the Company's financial statements for external reporting purposes in accordance with accounting principles generally accepted in the United States of America. Management conducted an assessment of the effectiveness of internal control over financial reporting as of December 31, 2017, utilizing the framework established in Internal Control - Integrated Framework (2013) issued by the Committee of Sponsoring Organizations of the Treadway Commission (COSO). Based on this assessment, Management has concluded that the Company maintained effective internal control over financial reporting as of December 31, 2017.
There are inherent limitations to the effectiveness of any system of internal control over financial reporting. These limitations include the possibility of human error, the circumvention or overriding of the system and reasonable resource constraints. Because of its inherent limitations, our internal control over financial reporting may not prevent or detect misstatements. Projections of any evaluation of effectiveness to future periods are subject to the risks that controls may become inadequate because of changes in conditions, or that the degree of compliance with the policies or procedures may deteriorate.
Management's report on internal control over financial reporting is set forth in ITEM 8 and is incorporated herein by reference.
(C) Audit Report of the Registered Public Accounting Firm
The Company's independent registered public accounting firm, Moss Adams, LLP, has audited the effectiveness of internal control over financial reporting as of December 31, 2017 as stated in their audit report, which is included in ITEM 8 and incorporated herein by reference.
(D) Changes in Internal Control Over Financial Reporting
As a result of the acquisition of Bank of Napa in November 2017, we continue to integrate and incorporate their business processes and systems into our overall internal control over financial reporting. During the quarter ended December 31, 2017, other than the interim effect of the acquisition noted above, there were no
Page-98
significant changes that materially affected, or are reasonably likely to affect, our internal control over financial reporting identified in connection with the evaluation mentioned in (B) above.
ITEM 9B. OTHER INFORMATION
None.
PART III
ITEM 10. DIRECTORS, EXECUTIVE OFFICERS AND CORPORATE GOVERNANCE
The information required by this Item is incorporated by reference from our Proxy Statement for the 2018 Annual Meeting of Shareholders. Bancorp and the Bank have adopted a Code of Ethics that applies to all staff including the Chief Executive Officer, Chief Financial Officer and Principal Accounting Officer. A copy of the Code of Ethical Conduct, which is also included on our website, will be provided to any person, without charge, upon written request to Corporate Secretary, Bank of Marin Bancorp, 504 Redwood Boulevard, Suite 100, Novato, CA 94947. During 2017 there were no changes in the procedures for the election or nomination of directors.
ITEM 11. EXECUTIVE COMPENSATION
The information required by this Item is incorporated by reference from our Proxy Statement for the 2018 Annual Meeting of Shareholders.
ITEM 12. | SECURITY OWNERSHIP OF CERTAIN BENEFICIAL OWNERS AND MANAGEMENT AND |
RELATED STOCKHOLDER MATTERS
The information required by this Item is incorporated by reference from ITEM 5 above, Note 8 to our audited consolidated financial statements and our Proxy Statement for the 2018 Annual Meeting of Shareholders.
ITEM 13. | CERTAIN RELATIONSHIPS AND RELATED TRANSACTIONS, AND DIRECTOR INDEPENDENCE |
The information required by this Item is incorporated by reference from our Proxy Statement for the 2018 Annual Meeting of Shareholders.
ITEM 14. PRINCIPAL ACCOUNTANT FEES AND SERVICES
The information required by this Item is incorporated by reference from our Proxy Statement for the 2018 Annual Meeting of Shareholders.
Page-99
PART IV
ITEM 15. Exhibits and Financial Statement Schedules
(A) Documents Filed as Part of this Report:
1. Financial Statements
The financial statements and supplementary data listed below are filed as part of this report under ITEM 8, captioned Financial Statements and Supplementary Data.
Report of Independent Registered Public Accounting Firm for the years ended December 31, 2017, 2016 and 2015
Management's Report on Internal Control over Financial Reporting
Consolidated Statements of Condition as of December 31, 2017 and 2016
Consolidated Statements of Comprehensive Income for the years ended December 31, 2017, 2016 and 2015
Consolidated Statement of Changes in Stockholders' Equity for the years ended December 31, 2017, 2016 and 2015
Consolidated Statement of Cash Flows for the years ended December 31, 2017, 2016 and 2015
Notes to Consolidated Financial Statements
2. Financial Statement Schedules
All financial statement schedules have been omitted, as they are inapplicable or the required information is included in the financial statements or notes thereto.
(B) Exhibits Filed:
The following exhibits are filed as part of this report or hereby incorporated by references to filings previously made with the SEC.
Page-100
Incorporated by Reference | ||||||
Exhibit Number | Exhibit Description | Form | File No. | Exhibit | Filing Date | Herewith |
2.01 | 8-K | 001-33572 | 2.1 | August 2, 2017 | ||
3.01 | 10-Q | 001-33572 | 3.01 | November 7, 2007 | ||
3.02 | 10-Q | 001-33572 | 3.02 | May 9, 2011 | ||
3.02a | 8-K | 001-33572 | 3.03 | July 6, 2015 | ||
4.01 | 8-A12B | 001-33572 | 4.1 | July 7, 2017 | ||
10.01 | S-8 | 333-218274 | 4.1 | May 26, 2017 | ||
10.02 | S-8 | 333-221219 | 4.1 | October 30, 2017 | ||
10.03 | S-8 | 333-219067 | 4.1 | June 30, 2017 | ||
10.04 | S-8 | 333-167639 | 4.1 | June 21, 2010 | ||
10.05 | 10-Q | 001-33572 | 10.06 | November 7, 2007 | ||
10.06 | 8-K | 001-33572 | 10.1 | January 26, 2009 | ||
10.07 | 8-K | 001-33572 | 99.1 | October 21, 2010 | ||
10.08 | 8-K | 001-33572 | 10.1 | January 6, 2011 | ||
10.09 | 8-K | 001-33572 | 10.4 | January 6, 2011 | ||
10.10 | 8-K | 001-33572 | 10.2 | November 4, 2014 | ||
10.11 | 8-K | 001-33572 | 10.3 | November 4, 2014 | ||
10.12 | 8-K | 001-33572 | 10.4 | June 2, 2015 | ||
10.13 | 8-K | 001-33572 | 10.1 | October 31, 2007 | ||
10.14 | 8-K | 001-33572 | 10,100 | July 17, 2012 | ||
11.01 | Filed | |||||
14.02 | 10-K | 001-33572 | 14.02 | March 14, 2017 | ||
23.01 | Filed | |||||
31.01 | Filed | |||||
31.02 | Filed | |||||
32.01 | Filed | |||||
101.01* | XBRL Interactive Data File | Furnished | ||||
* As provided in Rule 406T of Regulation S-T, this information is furnished and not filed for purposes of Sections 11 and 12
of the Securities Act of 1933 and Section 18 of the Securities Exchange Act of 1934.
ITEM 16. Form 10-K Summary
None.
Page-101
SIGNATURES
Pursuant to the requirements of Section 13 or 15(d) of the Securities Exchange Act of 1934, the registrant has duly caused this report to be signed on its behalf by the undersigned, thereunto duly authorized.
Bank of Marin Bancorp (registrant) | |||
March 14, 2018 | /s/ Russell A. Colombo | ||
Date | Russell A. Colombo | ||
President & | |||
Chief Executive Officer | |||
(Principal Executive Officer) | |||
March 14, 2018 | /s/ Tani Girton | ||
Date | Tani Girton | ||
Executive Vice President & | |||
Chief Financial Officer | |||
(Principal Financial Officer) | |||
March 14, 2018 | /s/ Cecilia Situ | ||
Date | Cecilia Situ | ||
First Vice President & | |||
Manager of Finance & Treasury | |||
(Principal Accounting Officer) | |||
Page-102
Pursuant to the requirements of the Securities Exchange Act of 1934, this report has been signed below by the following persons on behalf of the registrant and in the capacities and on the dates indicated.
Dated: | March 14, 2018 | /s/ Tani Girton | ||
Tani Girton | ||||
Executive Vice President & Chief Financial Officer | ||||
(Principal Financial Officer) | ||||
Dated: | March 14, 2018 | /s/ Cecilia Situ | ||
Cecilia Situ | ||||
First Vice President & Manager of Finance & Treasury | ||||
(Principal Accounting Officer) | ||||
Members of Bank of Marin Bancorp's Board of Directors | ||||
Dated: | March 14, 2018 | /s/ Brian M. Sobel | ||
Brian M. Sobel | ||||
Chairman of the Board | ||||
Dated: | March 14, 2018 | /s/ Russell A. Colombo | ||
Russell A. Colombo | ||||
President & Chief Executive Officer | ||||
(Principal Executive Officer) | ||||
Dated: | March 14, 2018 | /s/ Steven I. Barlow | ||
Steven I. Barlow | ||||
Dated: | March 14, 2018 | /s/ James C. Hale | ||
James C. Hale | ||||
Dated: | March 14, 2018 | /s/ Robert Heller | ||
Robert Heller | ||||
Dated: | March 14, 2018 | /s/ Norma J. Howard | ||
Norma J. Howard | ||||
Dated: | March 14, 2018 | /s/ Kevin R. Kennedy | ||
Kevin R. Kennedy | ||||
Dated: | March 14, 2018 | /s/ William H. McDevitt, Jr. | ||
William H. McDevitt, Jr. | ||||
Dated: | March 14, 2018 | /s/ Leslie E. Murphy | ||
Leslie E. Murphy | ||||
Dated: | March 14, 2018 | /s/ Joel Sklar | ||
Joel Sklar, M.D. | ||||
Page-103