Attached files
| file | filename |
|---|---|
| EX-99.1 - EX-99.1 - CURO Group Holdings Corp. | flexitipressrelease.htm |
| 8-K - 8-K - CURO Group Holdings Corp. | curo-20210128.htm |

Acquisition of Flexiti adds POS/BNPL Lender to CURO’s Canadian Business February 2021

Disclaimer 2 IMPORTANT: You must read the following information before continuing to the rest of the presentation, which is being provided to you for informational purposes only. Forward-Looking Statements This presentation contains forward-looking statements. These forward-looking statements include statements regarding projections, estimates and assumptions about Flexiti’s 2020 financial and operational performance; the financial and operational impact of the transaction on us, including our belief that the acquisition enhances our long-term growth profile while reducing regulatory risk and drives revenue, cost and capital synergies; pro forma loan balances and revenue; expected dilution of earnings per share; impacts of scale and margin expansion; the timing of accessing the ABS market and closing of the transaction; cash-flow projections; the timing of the closing of the transaction; estimates of addressable market; and Flexiti’s 2021 and 2022 financial and operational outlook. In addition, words such as “guidance,” “estimate,” “anticipate,” “believe,” “forecast,” “step,” “plan,” “predict,” “focused,” “project,” “is likely,” “expect,” “intend,” “should,” “will,” “confident,” variations of such words and similar expressions are intended to identify forward-looking statements. The ability to achieve these forward-looking statements is based on certain assumptions, judgments and other factors, both within and outside of our control, that could cause actual results to differ materially from those in the forward-looking statements, including: the inability of the parties to successfully or timely consummate the proposed transaction, including the risk that any required regulatory approvals are not obtained, are delayed or are subject to unanticipated conditions that could adversely affect the combined company or the expected benefits of the proposed transaction; failure to realize the anticipated benefits of the proposed transaction; risks relating to the uncertainty of projected financial information; the effects of competition on the combined company’s future business; our ability to attract and retain customers; market, financial, political and legal conditions; the impact of COVID-19 pandemic on the combined company’s business and the global economy; our dependence on third-party lenders to provide the cash we need to fund our loans and our ability to affordably access third-party financing; errors in our internal forecasts; our level of indebtedness; our ability to integrate acquired businesses; actions of regulators and the negative impact of those actions on our business; our ability to protect our proprietary technology and analytics and keep up with that of our competitors; disruption of our information technology systems that adversely affect our business operations; ineffective pricing of the credit risk of our prospective or existing customers; inaccurate information supplied by customers or third parties that could lead to errors in judging customers’ qualifications to receive loans; improper disclosure of customer personal data; failure of third parties who provide products, services or support to us; any failure of third-party lenders upon whom we rely to conduct business in certain states; disruption to our relationships with banks and other third-party electronic payment solutions providers as well as other factors discussed in our filings with the Securities and Exchange Commission. These projections, estimates and assumptions may prove to be inaccurate in the future. These forward-looking statements are not guarantees of future performance and involve known and unknown risks and uncertainties that are difficult to predict with regard to timing, extent, likelihood and degree of occurrence. There may be additional risks that we presently do not know or that we currently believe are immaterial that could also cause actual results to differ from those contained in the forward-looking statements. Given these risks and uncertainties, investors should not place undue reliance on forward-looking statements as a prediction of actual future results. We undertake no obligation to update, amend or clarify any forward-looking statement for any reason. In addition to U.S. GAAP reporting and IFRS GAAP reporting, we provide certain information on CURO’s adjusted EPS which does not conform to GAAP. We believe this non-GAAP measure enhances the understanding of our performance. Please refer to footnote 2 on slide 7 for definition of this non-GAAP measure.”

3 Flexible Product Offerings Payments are deferred until the end of the promotional period Terms ranging from 3 to 24 months Split the purchase into equal monthly payments Terms ranging from 3 to 72 months Use the Flexiti account to make everyday purchases No promotional terms, pay off monthly Deferred Payment Option Equal Monthly Payments Regular Credit Purchase Company Overview – Flexiti “Apply and buy” POS/BNPL financing platform Fully automated application process; transact in 3 minutes Revolving credit line for in-network at ~6,000 locations and e-commerce sites Significant acceleration of e-commerce in 2020 Proprietary technology supports omni-channel customer journey Key Company Highlights 2013 Founded 6,000 Merchant locations and e-commerce sites C$1,575 Avg. Transaction Size 738 / C$101k Avg. Origination Risk Score / Income C$266.0 million loan balances with 160,000 active cards as of 12/31/20 C$3.5 billion open to buy with > 1.1 million customers

4 One of Canada’s Fastest-Growing POS/BNPL Lenders Annual Originations (C$ in millions) $49 $182 $254 $292 $475 2017 2018 2019 2020E Q4 2020E Annualized Impressive Merchant Partners Accepting the FlexitiCard Company Overview – Flexiti

CURO now covers all bases for how consumers access credit in the U.S. and Canada Solidifies CURO as Full-Spectrum Consumer Lender 5 21% 15% Direct Store / Branch Online & Mobile Card Credit card / Debit card Point-of-Sale Omni-channel POS financing Consumer Credit Access U.S. Brand(s) Canada Brand(s) 6%

Transaction Benefits to CURO Top-3 non-bank consumer lender in Canada Significantly enhances CURO’s long-term growth profile while reducing regulatory risk Combines two complementary businesses to serve prime and non-prime consumers directly or at point-of- sale (POS) Combined Canadian company has pro forma 12/31/20 loan balances >$535 million and total 2020 revenue of ~$245 million Pro forma for this transaction, ~2/3rds of CURO’s loan balances will be in Canada CURO funding support allows Flexiti to aggressively grow merchant network and originations High-Growth, Full-Spectrum Canadian Consumer Lender Non-prime product expansion, including credit insurance Leverage CURO’s loan servicing experience Cross-sell of CURO and Flexiti products across applicant and customer bases Future access to securitization market diversifies funding and lowers cost of capital Attractive Revenue, Cost and Capital Synergies 6

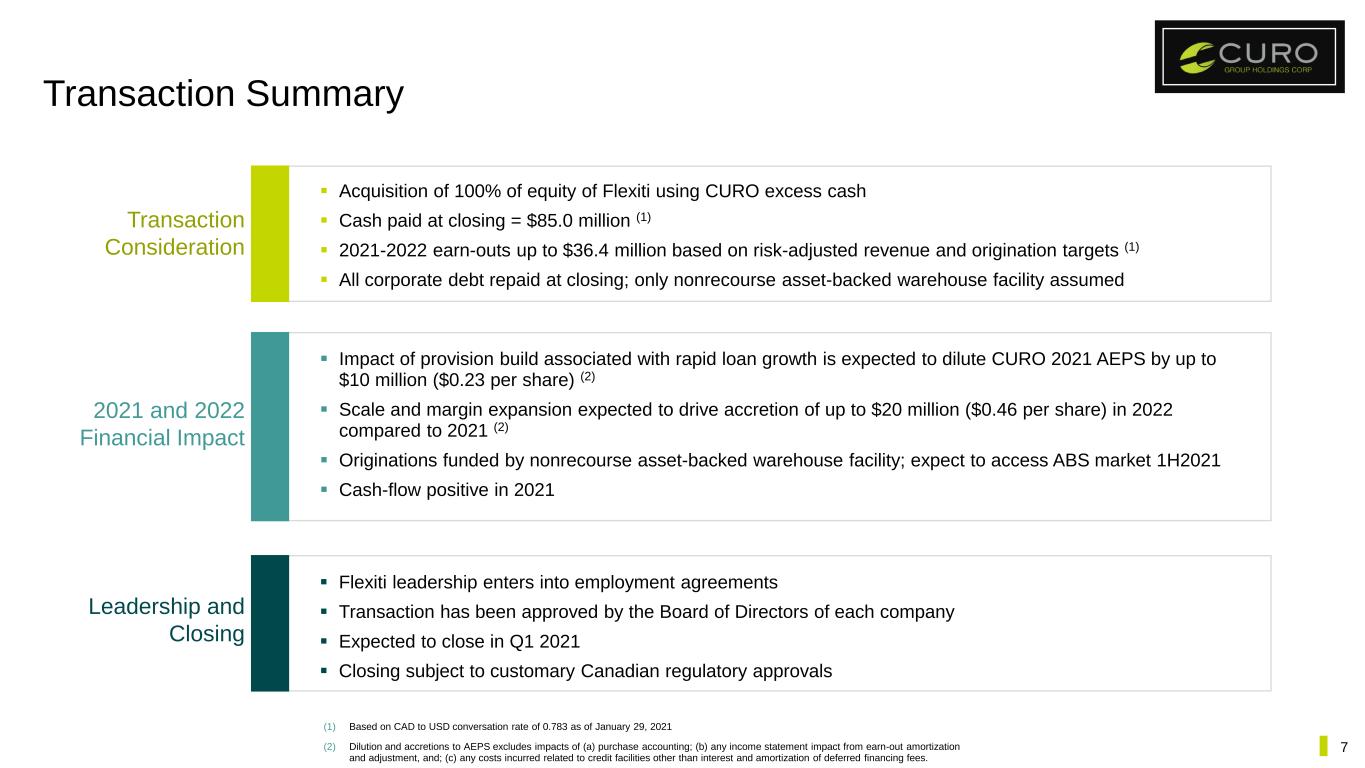
Transaction Summary Acquisition of 100% of equity of Flexiti using CURO excess cash Cash paid at closing = $85.0 million (1) 2021-2022 earn-outs up to $36.4 million based on risk-adjusted revenue and origination targets (1) All corporate debt repaid at closing; only nonrecourse asset-backed warehouse facility assumed Leadership and Closing Impact of provision build associated with rapid loan growth is expected to dilute CURO 2021 AEPS by up to $10 million ($0.23 per share) (2) Scale and margin expansion expected to drive accretion of up to $20 million ($0.46 per share) in 2022 compared to 2021 (2) Originations funded by nonrecourse asset-backed warehouse facility; expect to access ABS market 1H2021 Cash-flow positive in 2021 2021 and 2022 Financial Impact Flexiti leadership enters into employment agreements Transaction has been approved by the Board of Directors of each company Expected to close in Q1 2021 Closing subject to customary Canadian regulatory approvals 7 Transaction Consideration (1) Based on CAD to USD conversation rate of 0.783 as of January 29, 2021 (2) Dilution and accretions to AEPS excludes impacts of (a) purchase accounting; (b) any income statement impact from earn-out amortization and adjustment, and; (c) any costs incurred related to credit facilities other than interest and amortization of deferred financing fees.

8 (1) Market size based on Retail Trade as determined by NAICS ex. autos, services, dining and entertainment and Stats Can (2) Canadian Payment Methods and Trends 2019 (3) Statistics Canada and Company estimates Addressable market estimated at C$498 billion (1) Credit cards are preferred payment method – Nearly 9 out of 10 Canadians have a credit card (2) – 60% of POS transaction value in 2018, up from 47% in 2008 (2) Desjardins’ exit created C$2 billion origination opportunity 2020 accelerated the shift toward e-commerce BNPL helps merchants solve affordability and drives incremental sales Flexiti provides an omni-channel financing solution Competitive Landscape Revolving Credit / Full Lending Capabilities Transaction Based / Installment Lending e-Commerce as a % of Canadian Retail Sales (3) 0% 2% 4% 6% 8% 10% 12% J a n -1 9 F e b -1 9 M a r- 1 9 A p r- 1 9 M a y -1 9 J u n -1 9 J u l- 1 9 A u g -1 9 S e p -1 9 O c t- 1 9 N o v -1 9 D e c -1 9 J a n -2 0 F e b -2 0 M a r- 2 0 A p r- 2 0 M a y -2 0 J u n -2 0 J u l- 2 0 A u g -2 0 S e p -2 0 O c t- 2 0 Flexiti’s Monthly Origination Mix (C$ millions) 0% 5% 10% 15% 20% 25% 30% 35% 40% 45% $0 $5 $10 $15 $20 $25 $30 $35 $40 $45 $50 In store Originations Online Originations Online Percentage Large, Growing Addressable Market with Limited Competition at Scale

Differentiated Customer Journey and Award-Winning Technology 9 RANKED 29TH 2020 Financial Times Fastest Growing Companies Named one of the fastest growing technology companies in the Americas RANKED 6TH 2020 Deloitte Technology Fast 50™ Canada For rapid revenue growth, entrepreneurial spirit and bold innovation RANKED 3RD 2020 Canada’s Top Growing Companies For 5-year revenue growth Sample e-Commerce Customer Journey Adds Selection to merchant e-Cart Start End A Customer receives new couch Customer selects on merchant’s website Flexiti selected as payment method Customer needs a new sofa Applies for financing (new customers only) Approved for financing Returns to e-commerce success page and receives transaction receipt Merchant paid (net of discount) Confirms the transaction Customer Lifecycle “The Flexiti Advantage” Customer receives eBlasts with targeted offers from merchants Customer makes payments through online banking portal Customer reviews Network offers “Finance Your Next Vacation Today” Customer earns loyalty points at select merchants Continue to make purchases across the Flexiti Network Recent FinTech Recognition Installment Loan lifecycle ends here Canada’s Top Growing Companies For 3-year revenue growth RANKED 6TH 2020

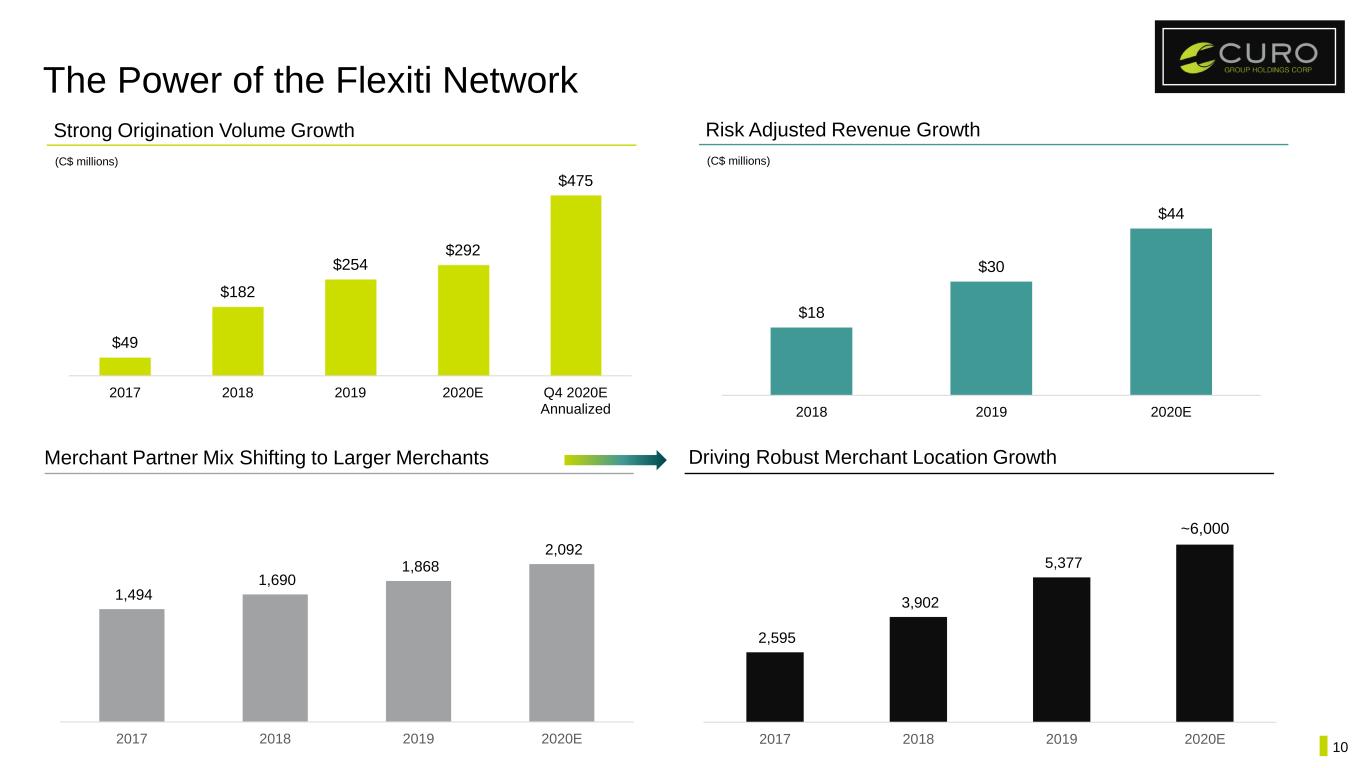
The Power of the Flexiti Network 10 Driving Robust Merchant Location GrowthMerchant Partner Mix Shifting to Larger Merchants 1,494 1,690 1,868 2,092 2017 2018 2019 2020E Strong Origination Volume Growth (C$ millions) $49 $182 $254 $292 $475 2017 2018 2019 2020E Q4 2020E Annualized 2,595 3,902 5,377 2017 2018 2019 2020E ~6,000 Risk Adjusted Revenue Growth (C$ millions) $18 $30 $44 2018 2019 2020E

Flexiti’s Financial Outlook Emerging growth company investing to build scale and drive consistent returns and earnings Robust origination growth (50%+) expected in 2021 Conservative assumptions for new merchant partner success and loan and revenue growth Non-prime expansion and improved servicing efficiency/effectiveness drive margin improvement More merchant wins are dilutive in near term, but result in accelerated growth and higher returns and profitability over the long term 2021 Outlook: investment spend and loss provision build on loan growth generate a net loss of up to $10 million on revenue of $45 million to $55 million 2022 Outlook: normalized loan loss provision build and expanding margins drive net income accretion of up to $20 million compared to 2021 Revenue as a percentage of originations in low 20% range Pre-tax income as a percentage of originations in high- single digits Visibility for annual origination volumes >$750 million in three years Financial Performance Metrics at Scale 11 Near-Term Financial Impact
