Attached files
| file | filename |
|---|---|
| 8-K - 8-K INVESTOR PRESENTATION JAN 2021 - URSTADT BIDDLE PROPERTIES INC | 8kinvestpresjan2021.htm |
EXHIBIT 99.1

Investor PresentationJanuary 2021

Forward-looking Statements and Non-GAAP Financial Measures Some of the statements in this presentation
constitute forward-looking statements within the meaning of Section 27A of the Securities Act and Section 21E of the Exchange Act. Such statements can generally be identified by such words as “anticipate”, “believe”, “can”, “continue”, “could”,
“estimate”, “expect”, “intend”, “may”, “plan”, “seek”, “should”, “will” or variations of such words or other similar expressions and the negatives of such words. All statements included in this report that address activities, events or
developments that we expect, believe or anticipate will or may occur in the future, including such matters as future capital expenditures, dividends and acquisitions (including the amount and nature thereof), business strategies, expansion and
growth of our operations and other such matters, are forward-looking statements. These statements are based on certain assumptions and analyses made by us in light of our experience and our perception of historical trends, current conditions,
expected future developments and other factors we believe are appropriate. Such statements are inherently subject to risks, uncertainties and other factors, many of which cannot be predicted with accuracy and some of which might not even be
anticipated. Future events and actual results, performance or achievements, financial and otherwise, may differ materially from the results, performance or achievements expressed or implied by the forward-looking statements. Risks, uncertainties
and other factors that might cause such differences, some of which could be material, include, but are not limited to: negative impacts from the continued spread of COVID-19, including on the U.S. or global economy or on our business, financial
position or results of operations; economic and other market conditions, including real estate and market conditions, that could impact us, our properties or the financial stability of our tenants; consumer spending and confidence trends, as well
as our ability to anticipate changes in consumer buying practices and the space needs of tenants; our relationships with our tenants and their financial condition and liquidity; any difficulties in renewing leases, filling vacancies or
negotiating improved lease terms; the inability of our properties to generate increased, or even sufficient, revenues to offset expenses, including amounts we are required to pay to municipalities for real estate taxes, payments for common area
maintenance expenses at our properties and salaries for our management team and other employees; the market value of our assets and the supply of, and demand for, retail real estate in which we invest; risks of real estate acquisitions and
dispositions, including our ability to identify and acquire retail real estate that meet our investment standards in our markets, as well as the potential failure of transactions to close; risks of operating properties through joint ventures that
we do not fully control; financing risks, such as the inability to obtain debt or equity financing on favorable terms or the inability to comply with various financial covenants included in our Unsecured Revolving Credit Facility (the "Facility")
or other debt instruments we currently have or may subsequently obtain, as well as the level and volatility of interest rates, which could impact the market price of our common stock and the cost of our borrowings; environmental risk and
regulatory requirements; risks related to our status as a real estate investment trust, including the application of complex federal income tax regulations that are subject to change; legislative and regulatory changes generally that may impact
us or our tenants; as well as other risks identified in our Annual Report on Form 10-K for the fiscal year ended October 31, 2020 under Item 1A. Risk Factors and in the other reports filed by the Company with the Securities and Exchange
Commission (the “SEC”).This presentation may include references to certain non-GAAP financial measures. Reconciliations of these non-GAAP financial measures to the most directly comparable GAAP measures can be found in the Company’s earnings
press releases and SEC reports, which are available on our website at www.ubproperties.com.
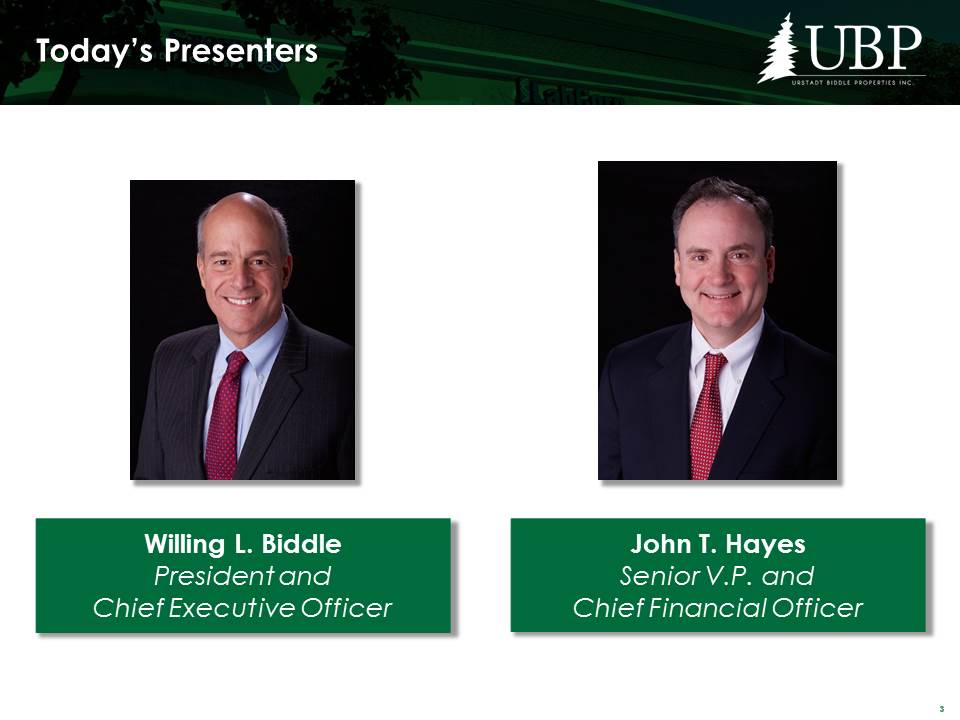
Today’s Presenters John T. HayesSenior V.P. and Chief Financial Officer Willing L. BiddlePresident and
Chief Executive Officer

Company Overview ~84% of GLA anchored by grocery / pharmacy / wholesale club Strong balance sheet and
liquidity profile Attractive dividend yield (4.1% as of 1/4/2021) 81 properties with a total of 5.3 million Gross Leasable Area (GLA) Concentration on quality suburban markets outside New York City Valley Ridge Shopping Center, Wayne
NJ Arcadian Shopping Center, Ossining NY The premier grocery anchored shopping center REIT in the suburban NY Metro Area

One of the strongest demographic profiles among public shopping center REITsThe median household income
within a 3-mile radius of UBA’s properties is ~70% higher than the national average median household income. This metric is one of the highest of all retail REITsHigh barrier to entry and high cost marketsLimited supply in the Company’s dense and
developed core markets Focused Portfolio In Suburban Tri-State Area County % of UBA GLA # Households Avg. household income Fairfield 33% 344,687 $148,753 Westchester 21% 356,232 155,442 Putnam 10% 35,031 139,685 Bergen
9% 344,059 145,784 Litchfield 6% 73,775 109,770 U.S. median $93,707 Percentage of Portfolio in Super Zips(a) Note: Demographics represent a 3-mile radius of UBA properties. U.S. zip codes in the 95th percentile based on education
and income based on property sq. ft.Source: SNL, Company data (21%) (4%) (10%) (33%) (<1%) (2%) (9%) (3%) (5%) (3%) (6%) (2%) (% of GLA)

Attractive Sub-Market Demographics Assets are located in affluent communities with high barriers to entry
and compelling demographics Note: Mean state household income represents FY 2020. Company data (other than UBA) as of September 30, 2020, UBA data as of October 31, 2020. Source: Company filings, SNL
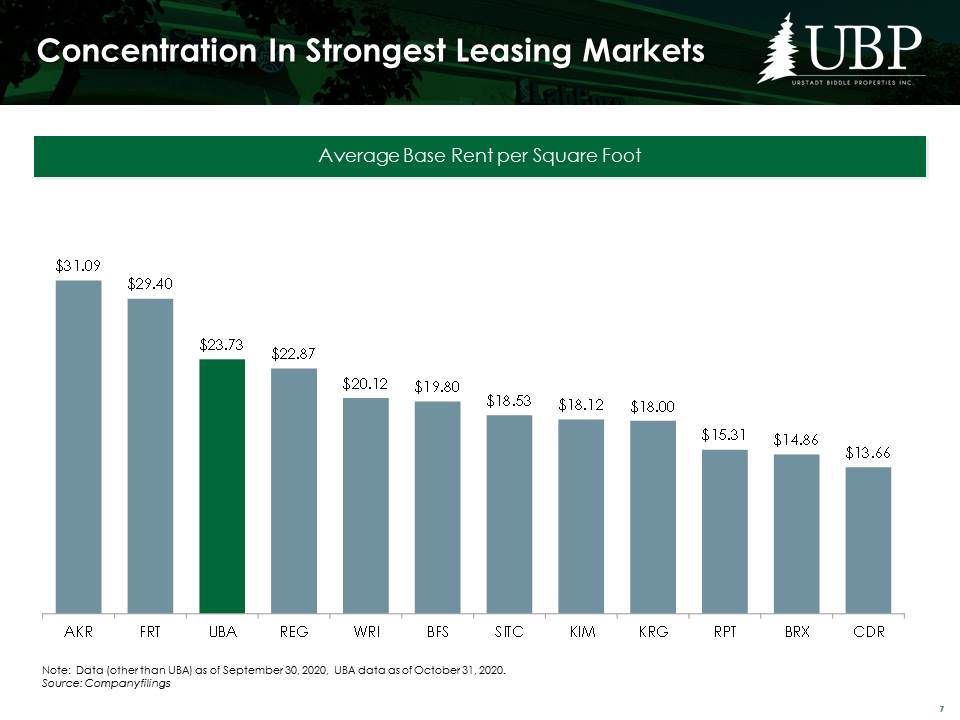
Concentration In Strongest Leasing Markets Note: Data (other than UBA) as of September 30, 2020, UBA data
as of October 31, 2020. Source: Company filings Average Base Rent per Square Foot

Westchester County, NY, Median Home Sales Price October 12, 2020 July 12, 2020 October 19,
2020 Suburban Revival Due To COVID-19 Benefitting Our Communities Fairfield County, CT, Median Home Sales Price COVID-19 driving influx of affluent families and shoppers to our communities Source: The Wall Street Journal, Bloomberg, Douglas
Elliman Research Q3’20 YoY increase: +26% Q3’20 YoY increase: +20%
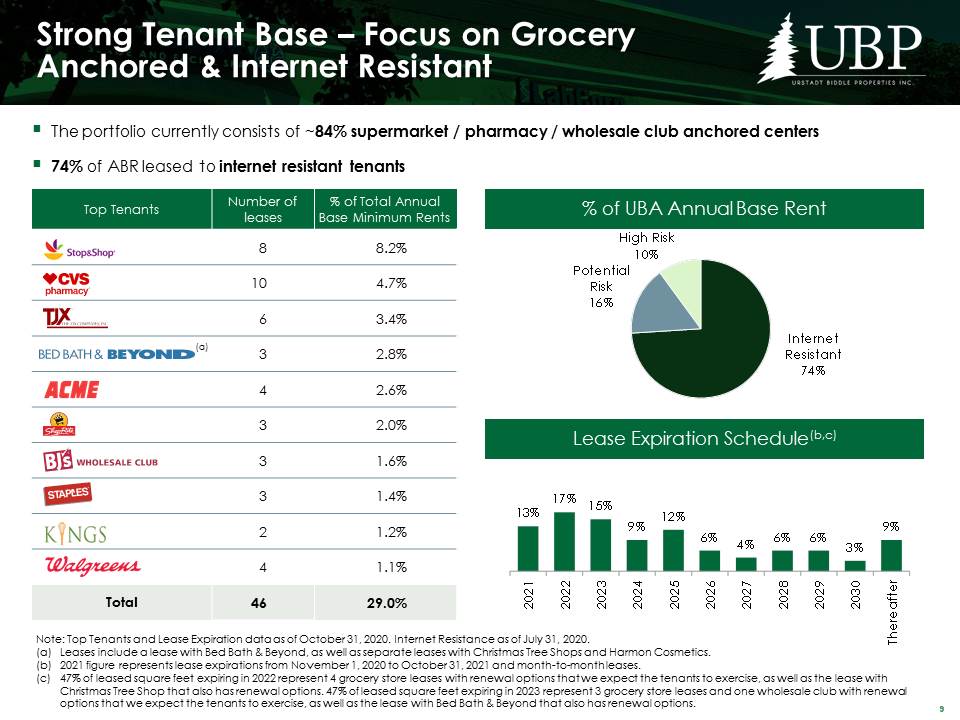
Strong Tenant Base – Focus on Grocery Anchored & Internet Resistant The portfolio currently consists
of ~84% supermarket / pharmacy / wholesale club anchored centers74% of ABR leased to internet resistant tenants Top Tenants Number of leases % of Total Annual Base Minimum
Rents 8 8.2% 10 4.7% 6 3.4% . 3 2.8% 4 2.6% 3 2.0% 3 1.6% 3 1.4% 2 1.2% 4 1.1% Total 46 29.0% Note: Top Tenants and Lease Expiration data as of October 31, 2020. Internet Resistance as of July 31, 2020.
Leases include a lease with Bed Bath & Beyond, as well as separate leases with Christmas Tree Shops and Harmon Cosmetics.2021 figure represents lease expirations from November 1, 2020 to October 31, 2021 and month-to-month leases. 47% of
leased square feet expiring in 2022 represent 4 grocery store leases with renewal options that we expect the tenants to exercise, as well as the lease with Christmas Tree Shop that also has renewal options. 47% of leased square feet expiring in
2023 represent 3 grocery store leases and one wholesale club with renewal options that we expect the tenants to exercise, as well as the lease with Bed Bath & Beyond that also has renewal options. Lease Expiration Schedule(b,c) % of UBA
Annual Base Rent (a)

Dividend Performance 203 uninterrupted quarterly dividend payments Sustainable payout ratio – 87% average
FFO payout ratio over last 10 years 50 consecutive years of uninterrupted dividends Q1’20 Q2’20 Q3’20 Q4’20 Current yield UBP $0.25 $0.06 $0.13 $0.13 4.3% UBA $0.28 $0.07 $0.14 $0.14 4.1% WSR $0.29 $0.11
$0.11 $0.11 5.5% BRX $0.29 Suspended -- $0.22 5.4% REG $0.60 $0.60 $0.60 $0.60 5.4% FRT $1.05 $1.05 $1.06 $1.06 5.2% KIM $0.28 Suspended $0.10 $0.16 4.5% KRG $0.32 $0.05 $0.08 $0.15
4.2% WRI $0.40 $0.18 $0.18 $0.18 3.5% RPAI $0.17 Suspended $0.05 $0.06 2.9% SITC $0.20 Suspended -- $0.05
2.1% ROIC $0.20 Suspended -- -- -- UE $0.22 Suspended -- -- -- AKR $0.29 Suspended -- -- -- RPT $0.22 Suspended -- -- -- 2020 Sector Dividend Summary(a) Strong Annual Dividend Growth (pre-COVID-19) Dividend data
includes common quarterly dividends only and is based on the calendar quarter in which the dividend was announced. Market data as of January 4, 2021. Source: Company filings, SNL
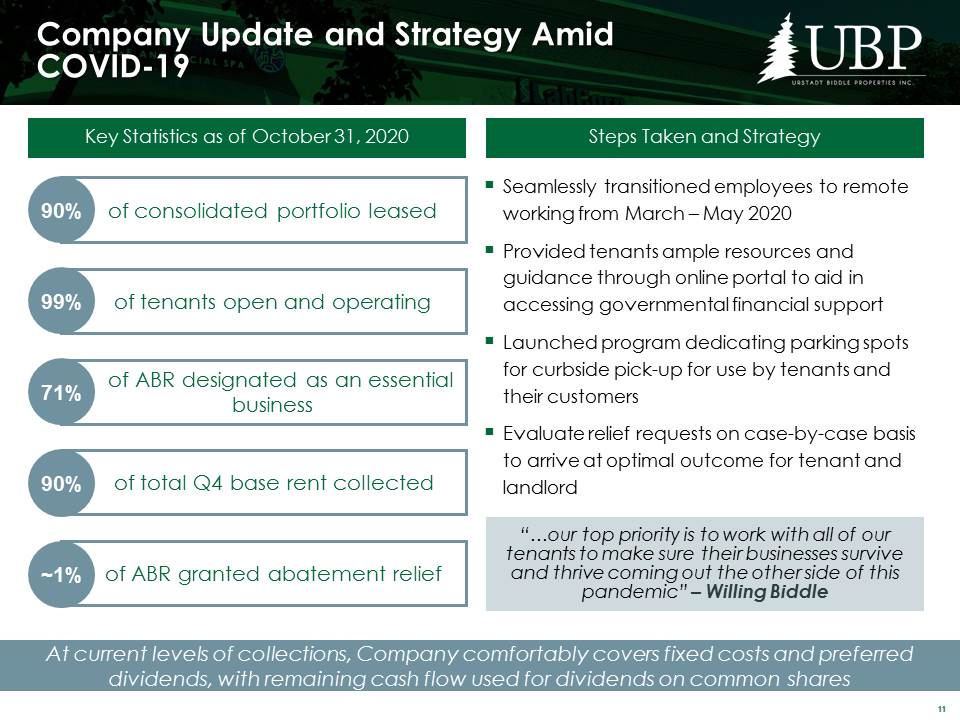
Company Update and Strategy Amid COVID-19 At current levels of collections, Company comfortably covers
fixed costs and preferred dividends, with remaining cash flow used for dividends on common shares of consolidated portfolio leased 90% of tenants open and operating 99% of ABR designated as an essential business 71% of total Q4 base rent
collected 90% of ABR granted abatement relief ~1% Key Statistics as of October 31, 2020 Steps Taken and Strategy Seamlessly transitioned employees to remote working from March – May 2020Provided tenants ample resources and guidance through
online portal to aid in accessing governmental financial support Launched program dedicating parking spots for curbside pick-up for use by tenants and their customersEvaluate relief requests on case-by-case basis to arrive at optimal outcome for
tenant and landlord “…our top priority is to work with all of our tenants to make sure their businesses survive and thrive coming out the other side of this pandemic” – Willing Biddle
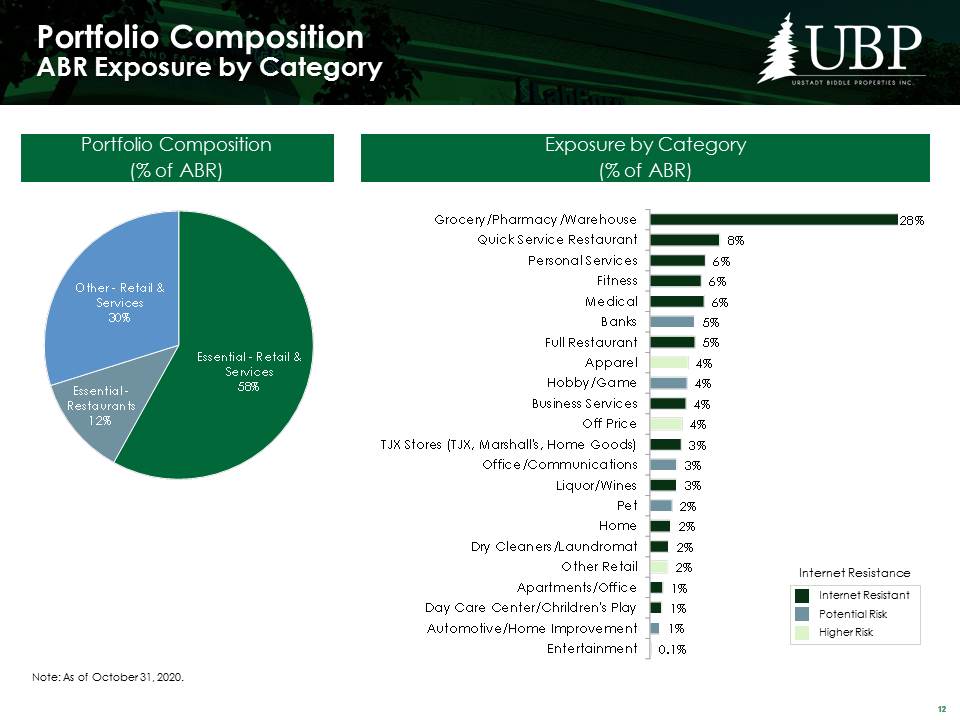
Portfolio CompositionABR Exposure by Category Portfolio Composition(% of ABR) Exposure by Category(% of
ABR) Note: As of October 31, 2020. Internet Resistant Potential Risk Higher Risk Internet Resistance

Operational UpdateTenant Operating Status Tenant Operations(% of ABR) Tenants Open by Category(% of
ABR) Note: As of October 31, 2020.

Operational UpdateTenant Composition and Collections Note: As of October 31, 2020. Base rent collections
as of December 10, 2020. Tenant Composition (% of ABR) Base Rent Collections (% of ABR)
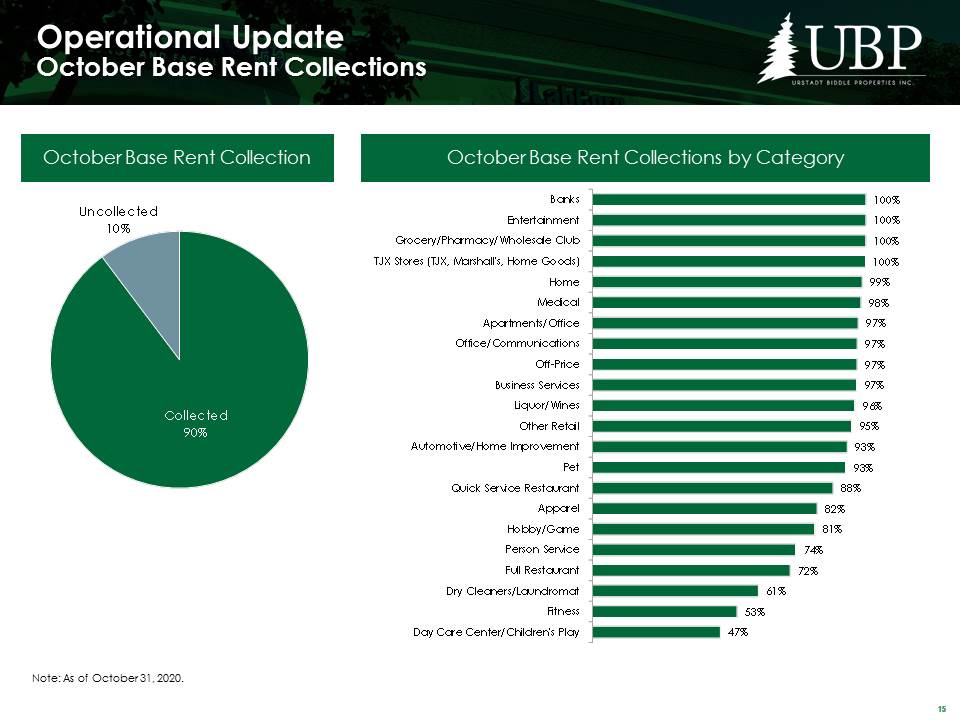
Operational UpdateOctober Base Rent Collections October Base Rent Collection October Base Rent
Collections by Category Note: As of October 31, 2020.
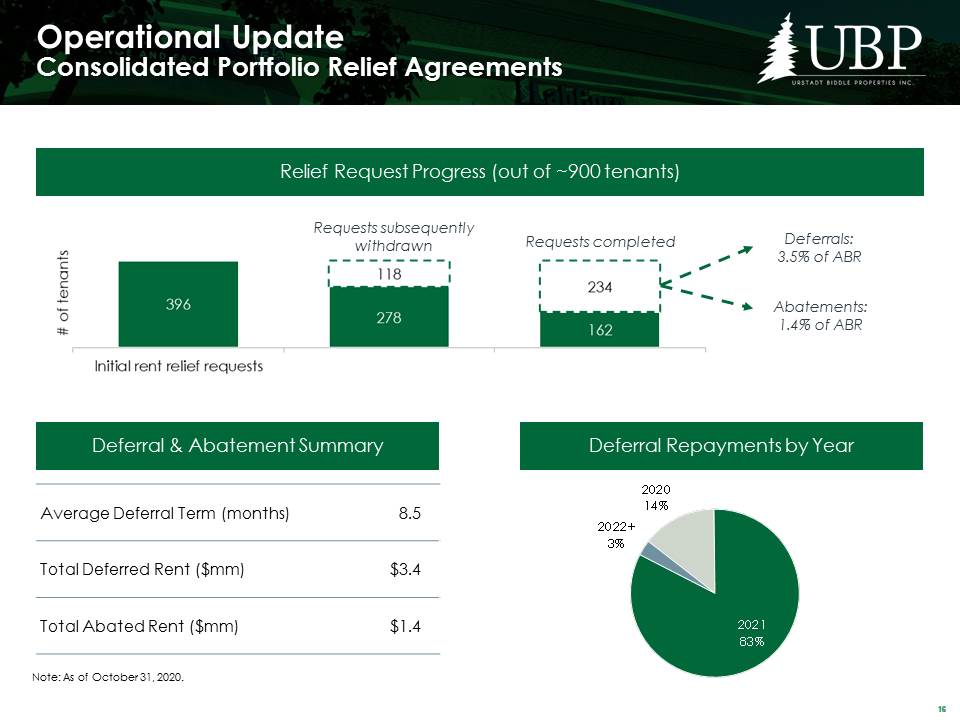
Operational UpdateConsolidated Portfolio Relief Agreements 78% Deferral Repayments by Year Relief
Request Progress (out of ~900 tenants) Note: As of October 31, 2020. Requests subsequently withdrawn Requests completed Deferral & Abatement Summary Average Deferral Term (months) 8.5 Total Deferred Rent ($mm) $3.4 Total Abated Rent
($mm) $1.4 Deferrals: 3.5% of ABR Abatements:1.4% of ABR

Key Elements of Urstadt’s Financial Strategy Maintain a conservative balance sheet with low leverage and
ample liquidityTotal debt to total assets of 33%(a)Fixed charge coverage ratio of 3.3xSmall mortgage rollover risk 2021: None2022: $49.5 million2023: NoneMatch long-term assets with long-term fixed rate debt or equity fundingMaintain access to
diverse sources of capital including:Short-term bank credit line increased to $100 million in capacity in fiscal 2016 ($150 million with accordion)Long-term non-recourse fixed rate mortgagesCommon and preferred equityMaintain stable dividend with
sustainable FFO payout ratio Total capitalization Note: Market data as of January 4, 2021.Based on the current capitalization as of October 31, 2020.

Long-Term Debt Maturity Schedule ($ in millions) Note: As of October 31, 2020. Includes unconsolidated
debt obligations.

Commitment to Corporate Responsibility At Urstadt Biddle Properties Inc., we are committed to
creating long-term value for our stockholders, while serving our communities, investing in our people and positively impacting the environment. Some of the activities undertaken by the Company include: Providing department-specific training,
access to online training seminars and opportunities to participate in industry conferences and UrstadtversityCommitment to the full inclusion of all qualified employees and applicantsFocusing on creating a workplace that values employee health
and safetyIntroducing the next generation of real estate leadersProviding annual reviews and regular feedback to assist in employee development Looking for opportunities to sponsor community-building events and contribute to the vitality of the
neighborhoods the Company servesRollout of curbside pickup at its shopping centers to enhance the safety of customers during the COVID-19 pandemicRegular inspections of shopping centers by its property managers to address any potential safety
issuesContributing to the local economy by partnering with local contractors on local projects when possible Maintaining and adhering to Corporate Governance GuidelinesRequiring vendors to complete a vendor questionnaire and make key governance
and operational representationsFocusing on cybersecurity, with oversight by the Board and circulation of quarterly updates on best practices to employeesAligning the interests of its executives and shareholders by emphasizing long-term stock
ownership and incentives in executive compensationMaintaining and adhering to the Company’s Code of Business Conduct and Ethics Striving to reduce the impact on climate change by reducing its carbon footprint through the generation and use of
solar powerMaintaining wetlands in accordance with regulatory guidanceHelping customers reduce their impact on climate change by making electric vehicle charging stations available at its propertiesIncorporating best practices in water
managementUsing native plants and pollinators at its properties Our People Our Communities Environmental Stewardship Ethics and Governance
