Attached files
| file | filename |
|---|---|
| 8-K - 8-K - Syneos Health, Inc. | synh-8k_20210112.htm |

39th Annual J.P. Morgan Healthcare Conference Alistair Macdonald January 13, 2021 Exhibit 99.1
Forward-Looking Statements Except for historical information, all of the statements, expectations, and assumptions contained in this presentation are forward-looking statements as that term is defined in the Private Securities Litigation Reform Act of 1995, including the expected impact of the COVID-19 pandemic on our business, financial results and financial condition, anticipated financial results for the full year 2020 and 2021, the Company’s strategy, expected R&D expenditures in the industry, market opportunity, client’s potential product launch timelines, our hiring strategy and plans for cost savings and capital deployment. Actual results might differ materially from those explicit or implicit in the forward-looking statements. Important factors that could cause actual results to differ materially include, but are not limited to: reliance on key personnel; principal investigators and patients; general and international economic, political, and other risks, including currency and stock market fluctuations and the uncertain economic environment; risks related to the COVID-19 pandemic; the Company's ability to adequately price its contracts and not overrun cost estimates; any adverse effects from the Company's customer or therapeutic area concentration; the Company's ability to maintain or generate new business awards; the Company's ability to increase its market share, grow its business, and execute its growth strategies; the Company's backlog not being indicative of future revenues and its ability to realize the anticipated future revenue reflected in its backlog; fluctuations in the Company's operating results and effective income tax rate; risks related to the Company's information systems and cybersecurity; changes and costs of compliance with regulations related to data privacy; risks related to the United Kingdom’s withdrawal from the European Union; risks related to the Company's transfer pricing policies; failure to perform services in accordance with contractual requirements, regulatory requirements and ethical considerations; risks relating to litigation and government investigations; risks associated with the Company's early phase clinical facilities; insurance risk; risks of liability resulting from harm to patients; success of investments in the Company's customers’ business or drugs; foreign currency exchange rate fluctuations; risks associated with acquired businesses, including the ability to integrate acquired operations, products, and technologies in our business; risks related to the Company's income tax expense and tax reform; risks relating to the Company's intellectual property; risks associated with the Company's acquisition strategy; failure to realize the full value of goodwill and intangible assets; restructuring risk; potential violations of anti-corruption and anti-bribery laws; risks related to the Company's dependence on third parties; downgrades of the Company's credit ratings; competition in the biopharmaceutical services industry; changes in outsourcing trends; regulatory risks; trends in the Company's customers’ businesses; the Company's ability to keep pace with rapid technological change; risks related to the Company's indebtedness; fluctuations in the Company's financial results and stock price; and other risk factors set forth in the Company's Annual Report on Form 10-K for the fiscal year ended December 31, 2019 as updated by the Company’s Quarterly Report on Form 10-Q for the quarter ended September 30, 2020, and other SEC filings, copies of which are available free of charge on the Company's website at investor.syneoshealth.com. The Company assumes no obligation and does not intend to update these forward-looking statements, except as required by law. Non-GAAP Financial Measures In addition to the financial measures prepared in accordance with U.S. Generally Accepted Accounting Principles ("GAAP"), this presentation contains certain non-GAAP financial measures, including adjusted net income (including adjusted diluted earnings per share), EBITDA, adjusted EBITDA, adjusted EBITDA margin, and non-GAAP effective tax rate. We also include in this presentation non-GAAP financial measures to illustrate our cash flow and leverage profile, including net debt, and net leverage. A “non-GAAP financial measure” is generally defined as a numerical measure of a company’s financial performance that excludes or includes amounts from the most directly comparable measure calculated and presented in accordance with GAAP in the statements of operations, balance sheets, or statements of cash flows of the Company. The Company defines adjusted net income (including adjusted diluted earnings per share) as net income (including diluted earnings per share) excluding amortization; restructuring and other costs; transaction and integration-related expenses; and share-based compensation expense. After giving effect to these items, the Company has also included an adjustment to its income tax rate to reflect the expected long-term income tax rate and impact of the base erosion and anti-abuse tax. EBITDA represents earnings before interest, taxes, depreciation and amortization. The Company defines adjusted EBITDA, both at the company and segment level, as EBITDA, further adjusted to exclude expenses and transactions that the Company believes are not representative of its core operations, namely: restructuring and other costs; transaction and integration-related expenses; and share-based compensation expense. The Company presents EBITDA and adjusted EBITDA because it believes they are useful metrics for investors as they are commonly used by investors, analysts and debt holders to measure the Company's ability to fund capital expenditures and meet working capital requirements. Each of the non-GAAP measures noted above are used by management and the Board to evaluate the Company's core operating results because they exclude certain items whose fluctuations from period-to-period do not necessarily correspond to changes in the core operations of the business. Adjusted net income (including adjusted diluted earnings per share) and adjusted EBITDA are used by management and the Board to assess the performance of the Company's business. Non-GAAP measures have limitations in that they do not reflect all of the amounts associated with the Company's results of operations as determined in accordance with GAAP. Also, other companies might calculate these measures differently. Investors are encouraged to review the reconciliations of the non-GAAP financial measures to their most directly comparable GAAP measures included in the Appendix of this presentation. Forward-Looking Statements and Non-GAAP Financial Measures
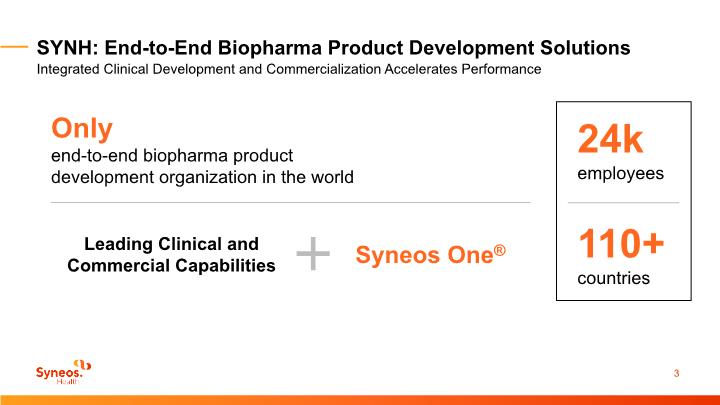
SYNH: End-to-End Biopharma Product Development Solutions Integrated Clinical Development and Commercialization Accelerates Performance Only end-to-end biopharma product development organization in the world Leading Clinical and Commercial Capabilities Syneos One®
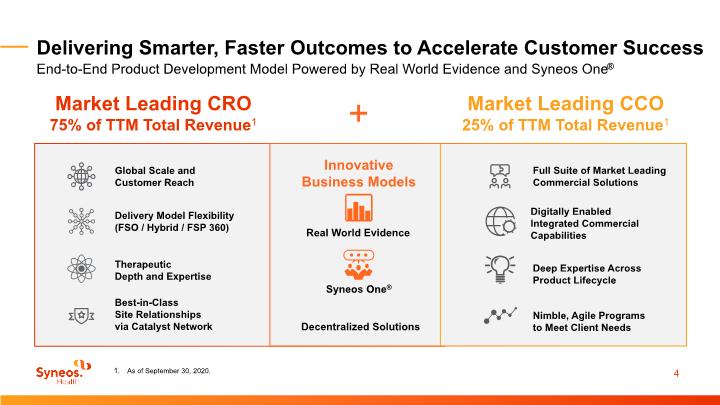
Delivering Smarter, Faster Outcomes to Accelerate Customer Success End-to-End Product Development Model Powered by Real World Evidence and Syneos One® + Market Leading CRO 75% of TTM Total Revenue1 Therapeutic Depth and Expertise Global Scale and Customer Reach Best-in-Class Site Relationships via Catalyst Network Market Leading CCO 25% of TTM Total Revenue1 Innovative Business Models Real World Evidence Syneos One® Delivery Model Flexibility (FSO / Hybrid / FSP 360) Full Suite of Market Leading Commercial Solutions Nimble, Agile Programs to Meet Client Needs Digitally Enabled Integrated Commercial Capabilities Deep Expertise Across Product Lifecycle As of September 30, 2020. Decentralized Solutions
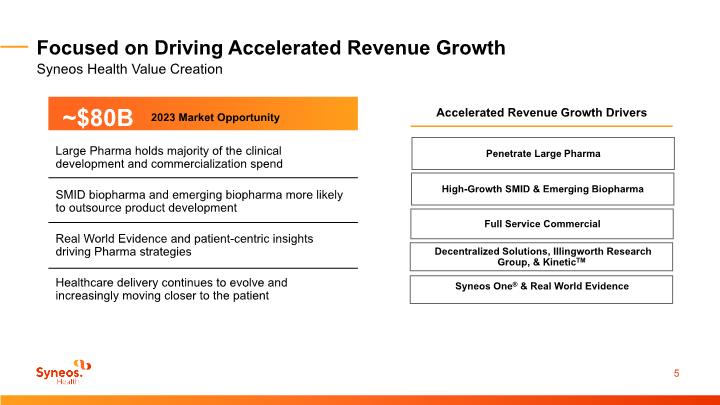
Focused on Driving Accelerated Revenue Growth Syneos Health Value Creation Large Pharma holds majority of the clinical development and commercialization spend SMID biopharma and emerging biopharma more likely to outsource product development Real World Evidence and patient-centric insights driving Pharma strategies Healthcare delivery continues to evolve and increasingly moving closer to the patient Accelerated Revenue Growth Drivers Full Service Commercial Syneos One® & Real World Evidence Decentralized Solutions, Illingworth Research Group, & KineticTM High-Growth SMID & Emerging Biopharma Penetrate Large Pharma
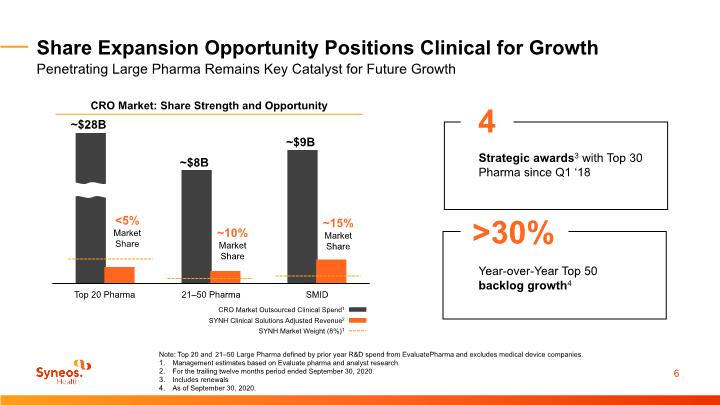
Share Expansion Opportunity Positions Clinical for Growth Penetrating Large Pharma Remains Key Catalyst for Future Growth Note: Top 20 and 21–50 Large Pharma defined by prior year R&D spend from EvaluatePharma and excludes medical device companies. Management estimates based on Evaluate pharma and analyst research. For the trailing twelve months period ended September 30, 2020. Includes renewals As of September 30, 2020. Strategic awards3 with Top 30 Pharma since Q1 ‘18 4 >30% Year-over-Year Top 50 backlog growth4 ~$28B ~$8B ~$9B
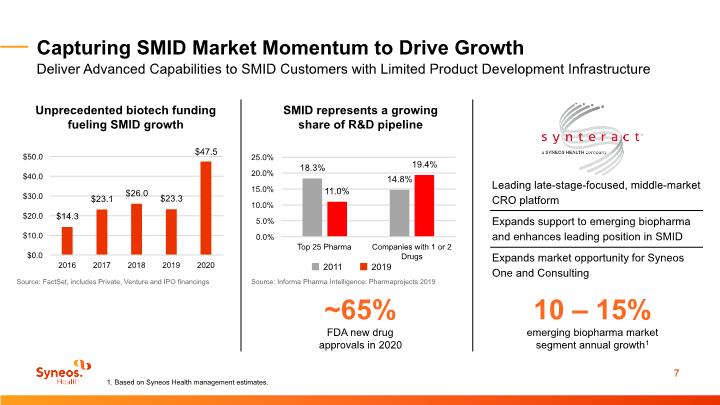
Capturing SMID Market Momentum to Drive Growth Deliver Advanced Capabilities to SMID Customers with Limited Product Development Infrastructure Source: FactSet, includes Private, Venture and IPO financings Unprecedented biotech funding fueling SMID growth Source: Informa Pharma Intelligence: Pharmaprojects 2019 SMID represents a growing share of R&D pipeline ~65% FDA new drug approvals in 2020 1. Based on Syneos Health management estimates. Leading late-stage-focused, middle-market CRO platform Expands support to emerging biopharma and enhances leading position in SMID Expands market opportunity for Syneos One and Consulting 10 – 15% emerging biopharma market segment annual growth1
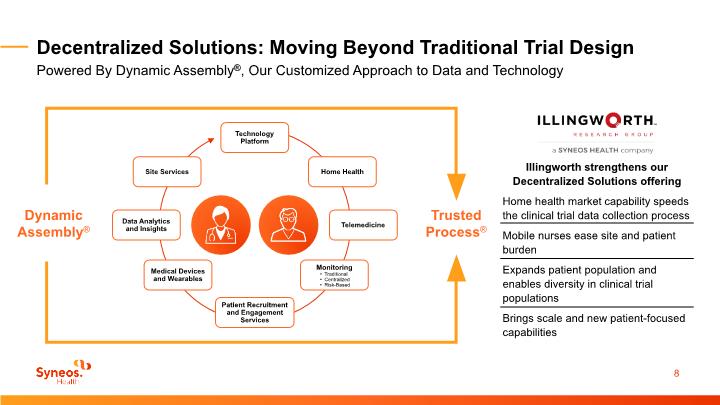
Decentralized Solutions: Moving Beyond Traditional Trial Design Powered By Dynamic Assembly®, Our Customized Approach to Data and Technology Illingworth strengthens our Decentralized Solutions offering Home health market capability speeds the clinical trial data collection process Mobile nurses ease site and patient burden Expands patient population and enables diversity in clinical trial populations Brings scale and new patient-focused capabilities
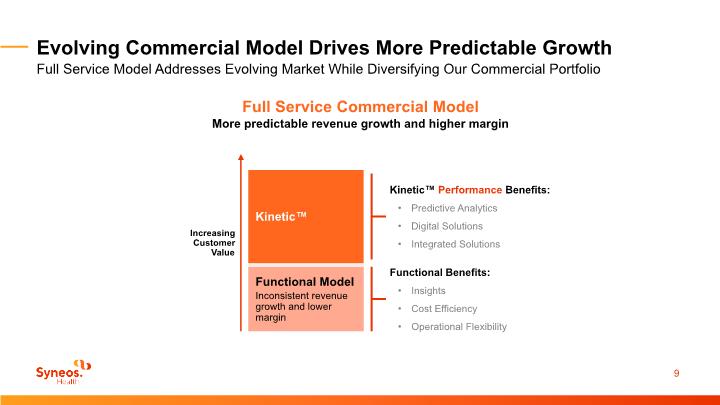
Evolving Commercial Model Drives More Predictable Growth Full Service Model Addresses Evolving Market While Diversifying Our Commercial Portfolio Full Service Commercial Model More predictable revenue growth and higher margin Increasing Customer Value Functional Model Inconsistent revenue growth and lower margin Functional Benefits: Insights Cost Efficiency Operational Flexibility Kinetic™ Kinetic™ Performance Benefits: Predictive Analytics Digital Solutions Integrated Solutions
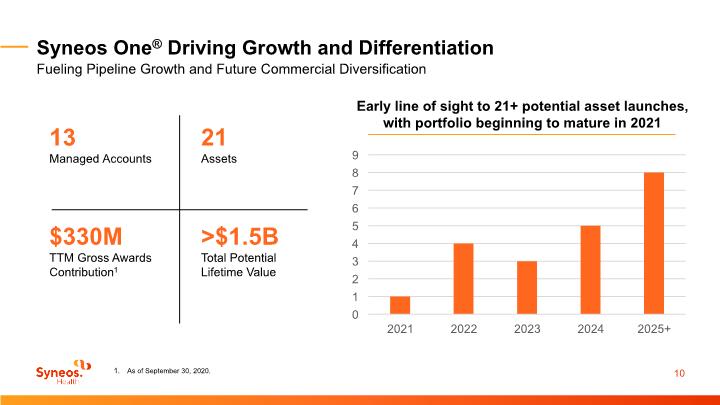
Syneos One® Driving Growth and Differentiation Fueling Pipeline Growth and Future Commercial Diversification As of September 30, 2020.
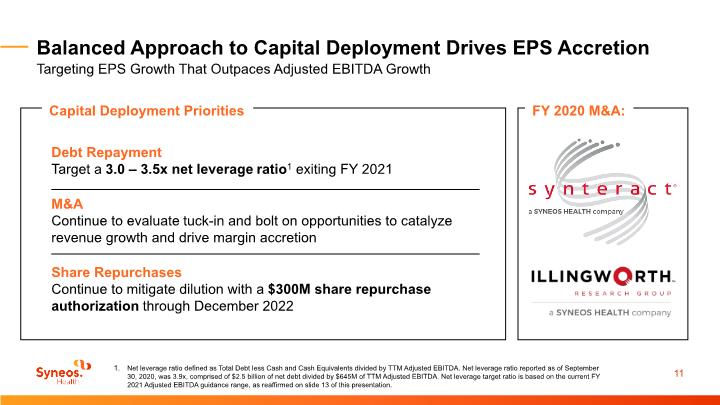
Balanced Approach to Capital Deployment Drives EPS Accretion Targeting EPS Growth That Outpaces Adjusted EBITDA Growth Capital Deployment Priorities FY 2020 M&A: Net leverage ratio defined as Total Debt less Cash and Cash Equivalents divided by TTM Adjusted EBITDA. Net leverage ratio reported as of September 30, 2020, was 3.9x, comprised of $2.5 billion of net debt divided by $645M of TTM Adjusted EBITDA. Net leverage target ratio is based on the current FY 2021 Adjusted EBITDA guidance range, as reaffirmed on slide 13 of this presentation.
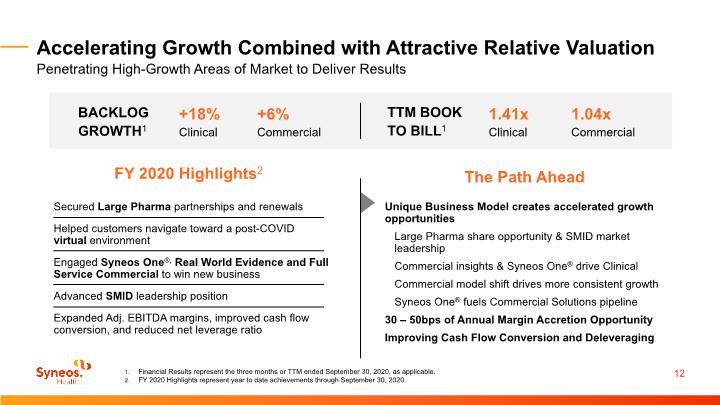
Accelerating Growth Combined with Attractive Relative Valuation Penetrating High-Growth Areas of Market to Deliver Results Financial Results represent the three months or TTM ended September 30, 2020, as applicable. FY 2020 Highlights represent year to date achievements through September 30, 2020. +18% Clinical BACKLOG GROWTH1 TTM BOOK TO BILL1 +6% Commercial 1.41x Clinical 1.04x Commercial Secured Large Pharma partnerships and renewals Helped customers navigate toward a post-COVID virtual environment Engaged Syneos One®, Real World Evidence and Full Service Commercial to win new business Advanced SMID leadership position Expanded Adj. EBITDA margins, improved cash flow conversion, and reduced net leverage ratio FY 2020 Highlights2 Unique Business Model creates accelerated growth opportunities Large Pharma share opportunity & SMID market leadership Commercial insights & Syneos One® drive Clinical Commercial model shift drives more consistent growth Syneos One® fuels Commercial Solutions pipeline 30 – 50bps of Annual Margin Accretion Opportunity Improving Cash Flow Conversion and Deleveraging The Path Ahead
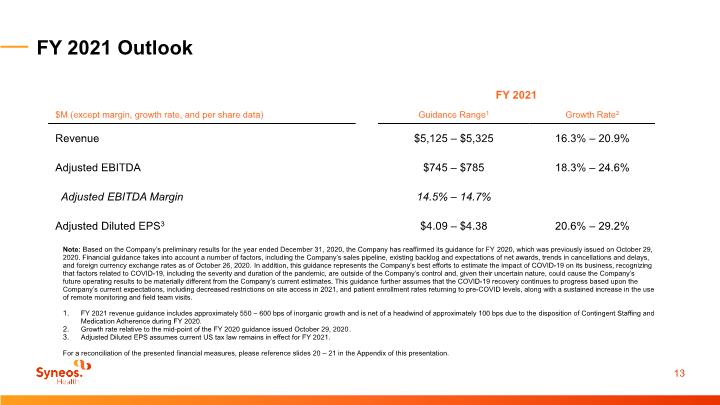
FY 2021 Outlook Note: Based on the Company’s preliminary results for the year ended December 31, 2020, the Company has reaffirmed its guidance for FY 2020, which was previously issued on October 29, 2020. Financial guidance takes into account a number of factors, including the Company’s sales pipeline, existing backlog and expectations of net awards, trends in cancellations and delays, and foreign currency exchange rates as of October 26, 2020. In addition, this guidance represents the Company’s best efforts to estimate the impact of COVID-19 on its business, recognizing that factors related to COVID-19, including the severity and duration of the pandemic, are outside of the Company’s control and, given their uncertain nature, could cause the Company’s future operating results to be materially different from the Company’s current estimates. This guidance further assumes that the COVID-19 recovery continues to progress based upon the Company’s current expectations, including decreased restrictions on site access in 2021, and patient enrollment rates returning to pre-COVID levels, along with a sustained increase in the use of remote monitoring and field team visits. FY 2021 revenue guidance includes approximately 550 – 600 bps of inorganic growth and is net of a headwind of approximately 100 bps due to the disposition of Contingent Staffing and Medication Adherence during FY 2020. Growth rate relative to the mid-point of the FY 2020 guidance issued October 29, 2020. Adjusted Diluted EPS assumes current US tax law remains in effect for FY 2021. For a reconciliation of the presented financial measures, please reference slides 20 – 21 in the Appendix of this presentation.

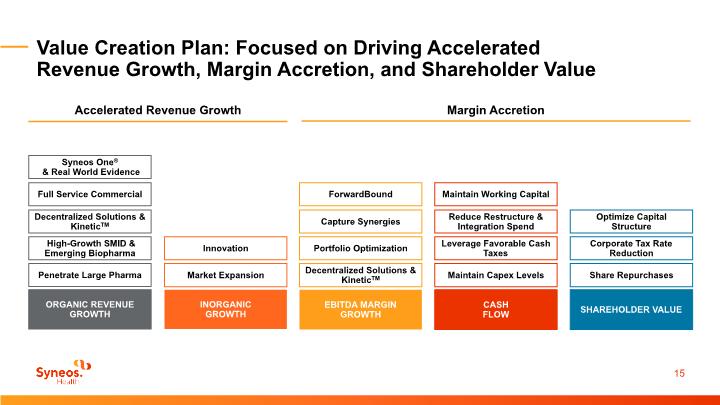
Value Creation Plan: Focused on Driving Accelerated Revenue Growth, Margin Accretion, and Shareholder Value Margin Accretion Optimize Capital Structure SHAREHOLDER VALUE Corporate Tax Rate Reduction Share Repurchases CASH FLOW Reduce Restructure & Integration Spend Maintain Capex Levels Leverage Favorable Cash Taxes Decentralized Solutions & KineticTM Portfolio Optimization Capture Synergies EBITDA MARGIN GROWTH ForwardBound Accelerated Revenue Growth Maintain Working Capital
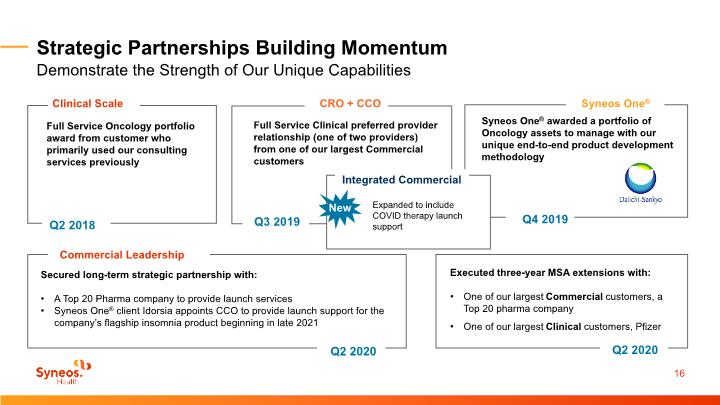
Strategic Partnerships Building Momentum Demonstrate the Strength of Our Unique Capabilities Clinical Scale Full Service Oncology portfolio award from customer who primarily used our consulting services previously Q2 2018 CRO + CCO Full Service Clinical preferred provider relationship (one of two providers) from one of our largest Commercial customers Q3 2019 Syneos One® Syneos One® awarded a portfolio of Oncology assets to manage with our unique end-to-end product development methodology Q4 2019 Executed three-year MSA extensions with: One of our largest Commercial customers, a Top 20 pharma company One of our largest Clinical customers, Pfizer Secured long-term strategic partnership with: A Top 20 Pharma company to provide launch services Syneos One® client Idorsia appoints CCO to provide launch support for the company’s flagship insomnia product beginning in late 2021 Commercial Leadership Q2 2020 Q2 2020 Integrated Commercial Expanded to include COVID therapy launch support New
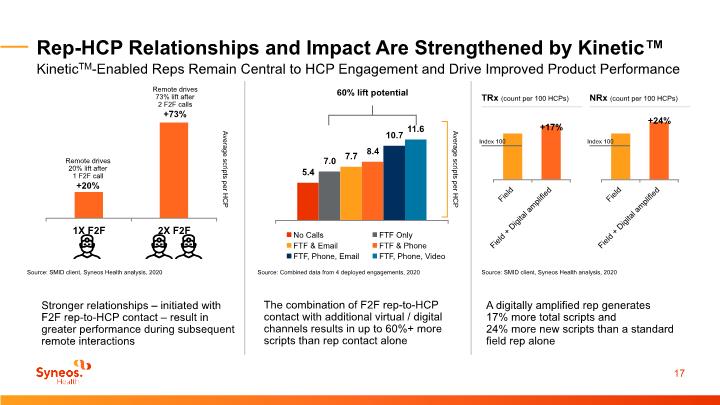
Rep-HCP Relationships and Impact Are Strengthened by Kinetic™ KineticTM-Enabled Reps Remain Central to HCP Engagement and Drive Improved Product Performance
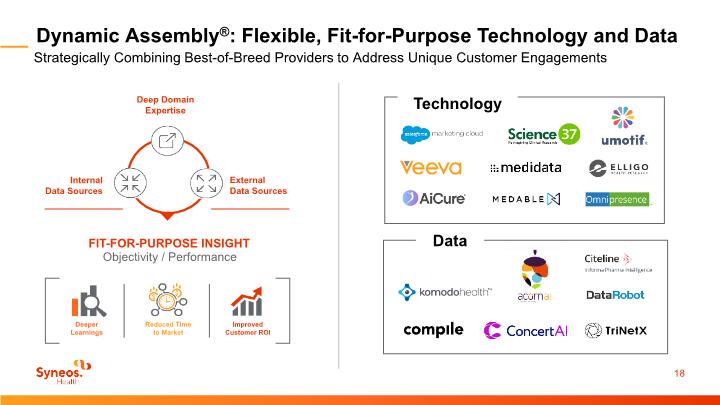
Dynamic Assembly®: Flexible, Fit-for-Purpose Technology and Data Strategically Combining Best-of-Breed Providers to Address Unique Customer Engagements Deeper Learnings Reduced Time to Market Improved Customer ROI Internal Data Sources Deep Domain Expertise External Data Sources FIT-FOR-PURPOSE INSIGHT Objectivity / Performance
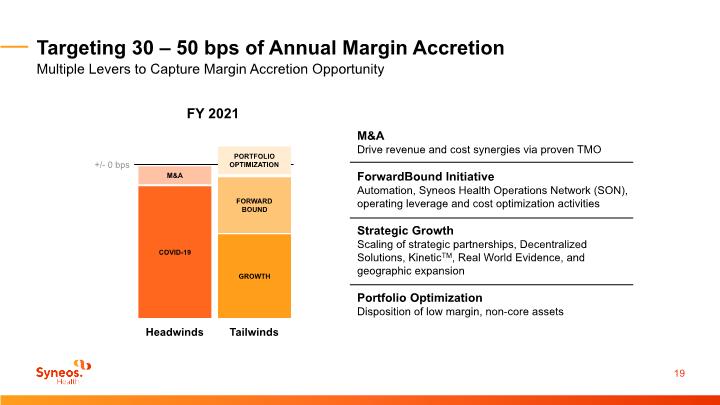
Targeting 30 – 50 bps of Annual Margin Accretion Multiple Levers to Capture Margin Accretion Opportunity
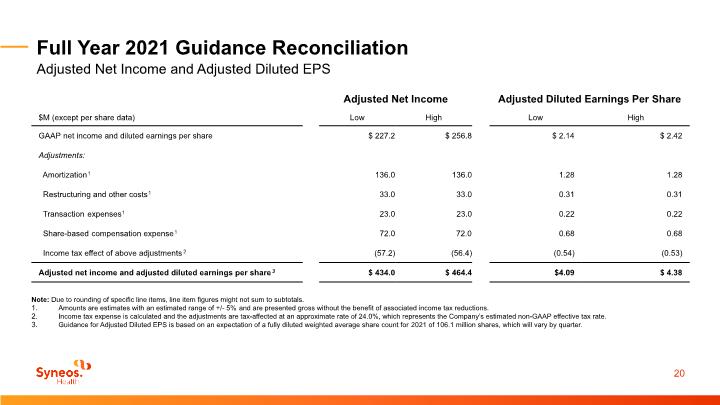
Full Year 2021 Guidance Reconciliation Adjusted Net Income and Adjusted Diluted EPS Note: Due to rounding of specific line items, line item figures might not sum to subtotals. Amounts are estimates with an estimated range of +/- 5% and are presented gross without the benefit of associated income tax reductions. Income tax expense is calculated and the adjustments are tax-affected at an approximate rate of 24.0%, which represents the Company’s estimated non-GAAP effective tax rate. Guidance for Adjusted Diluted EPS is based on an expectation of a fully diluted weighted average share count for 2021 of 106.1 million shares, which will vary by quarter.
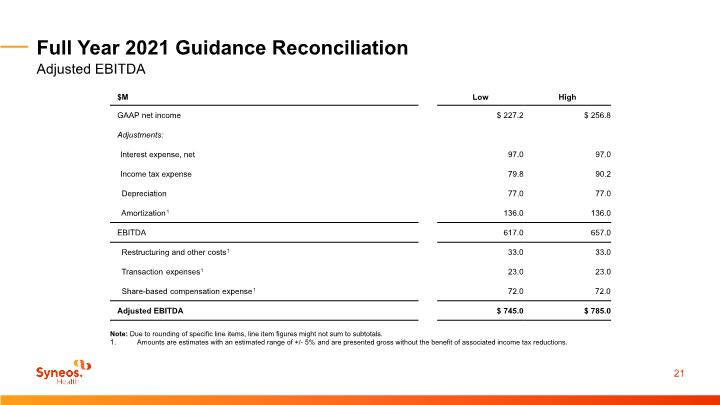
Full Year 2021 Guidance Reconciliation Adjusted EBITDA Note: Due to rounding of specific line items, line item figures might not sum to subtotals. Amounts are estimates with an estimated range of +/- 5% and are presented gross without the benefit of associated income tax reductions.
