Attached files
| file | filename |
|---|---|
| EX-23.1 - EXHIBIT 23.1 CONSENT OF INDEPENDENT REGISTERED PUBLIC ACCOUNTING FIRM - Syneos Health, Inc. | exhibit231_consentxey.htm |
| EX-32.2 - EXHIBIT 32.2 SECTION 906 CFO CERTIFICATION - Syneos Health, Inc. | exhibit322section906cfo_q4.htm |
| EX-32.1 - EXHIBIT 32.1 SECTION 906 CEO CERTIFICATION - Syneos Health, Inc. | exhibit321section906ceo_q4.htm |
| EX-31.2 - EXHIBIT 31.2 SECTION 302 CFO CERTIFICATION - Syneos Health, Inc. | exhibit312section302cfo_q4.htm |
| EX-31.1 - EXHIBIT 31.1 SECTION 302 CEO CERTIFICATION - Syneos Health, Inc. | exhibit311section302ceo_q4.htm |
| EX-23.2 - EXHIBIT 23.2 CONSENT OF INDEPENDENT REGISTERED PUBLIC ACCOUNTING FIRM - Syneos Health, Inc. | exhibit232_consentxdeloitte.htm |
| EX-21.1 - EXHIBIT 21.1 SIGNIFICANT SUBSIDIARIES OF REGISTRANT - Syneos Health, Inc. | exhibit211_significantsubs.htm |
UNITED STATES
SECURITIES AND EXCHANGE COMMISSION
Washington, D.C. 20549
FORM 10-K
(Mark One)
ý | ANNUAL REPORT PURSUANT TO SECTION 13 OR 15(d) OF THE SECURITIES EXCHANGE ACT OF 1934 |
For the fiscal year ended December 31, 2017
or
¨ | TRANSITION REPORT PURSUANT TO SECTION 13 OR 15(d) OF THE SECURITIES EXCHANGE ACT OF 1934 |
For the transition period from _______ to ______
Commission File Number: 001-36730
SYNEOS HEALTH, INC.
(Exact name of registrant as specified in its charter)
Delaware | 27-3403111 | |
(State or other jurisdiction of incorporation or organization) | (I.R.S. Employer Identification No.) | |
3201 Beechleaf Court, Suite 600 Raleigh, North Carolina | 27604-1547 | |
(Address of principal executive offices) | (Zip Code) | |
Registrant’s telephone number, including area code: (919) 876-9300
Securities registered pursuant to Section 12(b) of the Act:
Title of each class | Name of each exchange on which registered | |
Class A Common Stock, par value $0.01 per share | The NASDAQ Stock Market LLC | |
Securities registered pursuant to Section 12(g) of the Act: None
Indicate by check mark if the registrant is a well-known seasoned issuer, as defined in Rule 405 of the Securities Act. Yes ý No ¨
Indicate by check mark if the registrant is not required to file reports pursuant to Section 13 or section 15(d) of the Exchange Act. Yes ¨ No ý
Indicate by check mark whether the registrant (1) has filed all reports required to be filed by Section 13 or 15(d) of the Securities Exchange Act of 1934 during the preceding 12 months (or for such shorter period that the registrant was required to file such reports), and (2) has been subject to such filing requirements for the past 90 days. Yes ý No ¨
Indicate by check mark whether the registrant has submitted electronically and posted on its corporate Web site, if any, every Interactive Data File required to be submitted and posted pursuant to Rule 405 of Regulation S-T during the preceding 12 months (or for such shorter period that the registrant was required to submit and post such files). Yes ý No ¨
Indicate by check mark if disclosure of delinquent filers pursuant to Item 405 of Regulation S-K is not contained herein, and will not be contained, to the best of registrant’s knowledge, in definitive proxy or information statements incorporated by reference in Part III of this Form 10-K or any amendment to this Form 10-K. ¨
Indicate by check mark whether the registrant is a large accelerated filer, an accelerated filer, a non-accelerated filer, or a smaller reporting company. See definition of “large accelerated filer,” “accelerated filer,” “smaller reporting company,” and "emerging growth company" in Rule 12b-2 of the Exchange Act. (Check one):
Large accelerated filer x | Accelerated filer ¨ | |
Non-accelerated filer ¨ (Do not check if a smaller reporting company) | Smaller reporting company ¨ | |
Emerging growth company ¨ | ||
If an emerging growth company, indicate by check mark if the registrant has elected not to use the extended transition period for complying with any new or revised financial accounting standards provided pursuant to Section 13(a) of the Exchange Act. ¨
Indicate by check mark whether the registrant is a shell company (as defined in Rule 12b-2 of the Exchange Act). Yes ¨ No ý
The aggregate market value of the registrant’s common stock held by non-affiliates of the registrant, based on the closing sale price of $58.50 on June 30, 2017, was approximately $3,169,493,379. Common stock held by each officer and director and by each person known to the registrant who owned 10% or more of the outstanding common stock have been excluded in that such persons may be deemed to be affiliates. This determination of affiliate status is not necessarily a conclusive determination for other purposes.
As of February 21, 2018, there were approximately 104,584,053 shares of the registrant's common stock outstanding.
Portions of the registrant’s Proxy Statement for its 2018 Annual Meeting of Stockholders are incorporated by reference into Part III hereof.
SYNEOS HEALTH, INC.
FORM 10-K
For the Fiscal Year Ended December 31, 2017
TABLE OF CONTENTS
Page | ||
Item 1. | ||
Item 1A. | ||
Item 1B. | ||
Item 2. | ||
Item 3. | ||
Item 4. | ||
Item 5. | ||
Item 6 | ||
Item 7. | ||
Item 7A. | ||
Item 8. | ||
Item 9. | ||
Item 9A. | ||
Item 9B. | ||
Item 10. | ||
Item 11. | ||
Item 12. | ||
Item 13. | ||
Item 14. | ||
Item 15. | ||
1
PART I
FORWARD-LOOKING STATEMENTS
This Annual Report on Form 10-K contains forward-looking statements within the meaning of Section 27A of the Securities Act of 1933, as amended, or the Securities Act, and Section 21E of the Securities Exchange Act of 1934, as amended, or the Exchange Act. Such forward-looking statements reflect, among other things, our current expectations and anticipated results of operations, all of which are subject to known and unknown risks, uncertainties and other factors that may cause our actual results, performance or achievements, market trends, or industry results to differ materially from those expressed or implied by such forward-looking statements. Therefore, any statements contained herein that are not statements of historical fact may be forward-looking statements and should be evaluated as such. Without limiting the foregoing, the words “anticipates,” “believes,” "can," "continue," "could," “estimates,” “expects,” “intends,” “may,” "might," “plans,” “projects,” “should,” "would," “targets,” “will” and the negative thereof and similar words and expressions are intended to identify forward-looking statements. These forward-looking statements are subject to a number of risks, uncertainties and assumptions, including those described in Part I, Item 1A, "Risk Factors" in this Annual Report on Form 10-K. Unless legally required, we assume no obligation to update any such forward-looking information to reflect actual results or changes in the factors affecting such forward-looking information.
As used in this report, the terms "Syneos Health, Inc.," "Company," "we," "us," and "our" mean Syneos Health, Inc. and its subsidiaries unless the context indicates otherwise.
Item 1. Business.
Overview
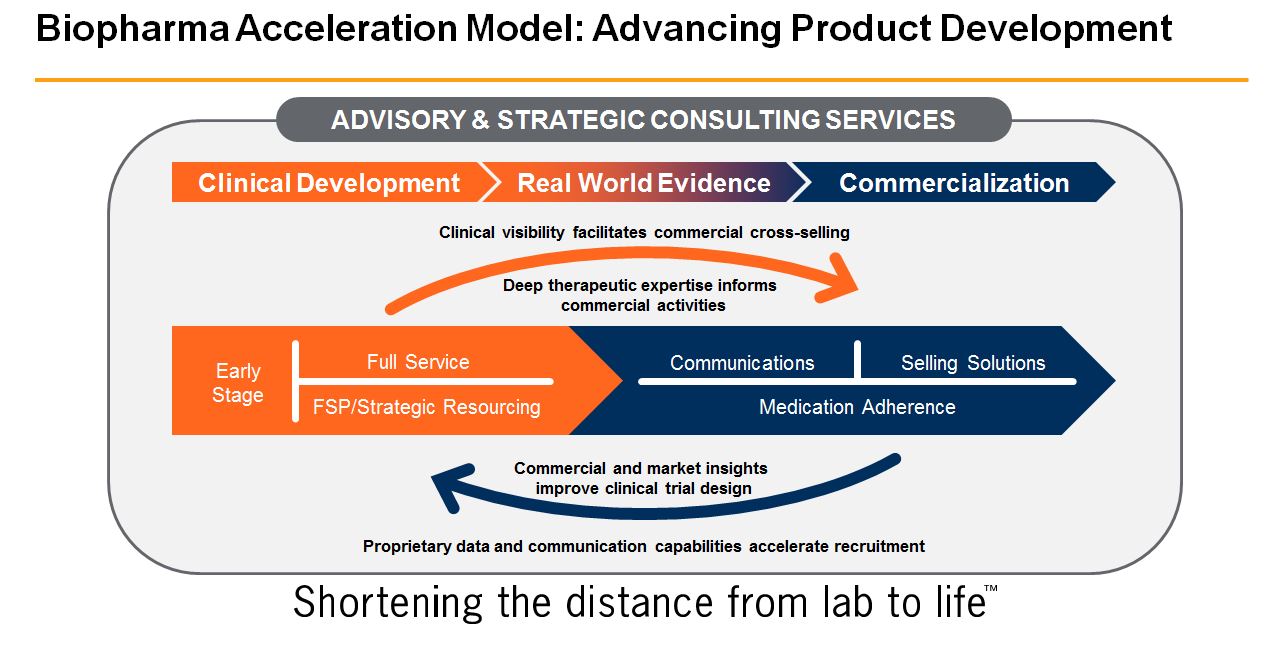
We are a leading global biopharmaceutical services organization providing product development and commercial solutions through our clinical end-to-end contract research organization (“CRO”) and contract commercial organization (“CCO”). We offer both standalone and integrated biopharmaceutical solutions ranging from Early Phase (Phase I) clinical trials to the full commercialization of biopharmaceutical products. Our ability to achieve end-to-end solutions is based on our biopharmaceutical acceleration model ("BAM") where we synchronize our clinical and commercial capabilities – sharing knowledge, data, and insights.
Our customers include large and small to mid-sized companies in the biopharmaceutical, biotechnology, and medical device industries. Our revenue is derived through a broad suite of services designed to enhance our customers’ ability to successfully develop, launch, and market products. Our competitive strengths include our broad continuum of clinical and commercial solutions, with our proprietary Trusted Process® methodology leading to faster, better-informed product development decisions, a focused effort on clinical research site relationships, robust data assets, and clinical trial design fueled by patient-centric commercial insights.
Our organization has been recognized for innovative and best-in-class work. Our Clinical Solutions organization was named the "Top CRO to Work With" among the top global CROs in the 2017 CenterWatch Global Investigative Site Relationship Survey and the 2017 Society for Clinical Research Sites ("SCRS") Eagle Award in the CRO category. In addition, we also participate at the highest level of membership within the SCRS as a Global Impact Partner. Across our Commercial Solutions organization, our consulting business has been recognized by Forbes magazine as one of America’s Best Management Consulting Firms for the past two years, and our communications businesses have won more than 1,000 awards over the last decade. These awards include, among others, the 2017 Medical Marketing & Media Agency of the Year, PM360 Greatest Creators and Trailblazer awards, and SABRE Superior Achievement in Branding, Reputation & Engagement.
Founded more than three decades ago as an academic organization dedicated to central nervous system ("CNS") research, we have translated that expertise into a global organization with deep therapeutic specialties, as well as full data services and regulatory advisory and implementation support capabilities. Over the past decade, we have built our scale and capabilities to become a leading global provider of Phase I to Phase IV clinical development services. We were established as INC Research in 1998, and our corporate
2
headquarters is located in Raleigh, North Carolina. As a result of a corporate reorganization in connection with a business combination transaction, INC Research Holdings, Inc., was incorporated in Delaware in August 2010, and we changed our name to Syneos Health, Inc. after our 2017 Merger with inVentiv Health (the "Merger"). The merger of these two companies combined clinical and commercial expertise, scale, data, and insights to facilitate faster delivery of evidence-based medicines to patients worldwide. With approximately 21,000 employees in more than 60 countries across six continents as of December 31, 2017, our combined broad global presence allows us to deliver our services in more than 110 countries, providing our customers with access to diverse markets and patient populations, local regulatory expertise, and local market knowledge. See further discussion in "Note 3 - Business Combinations" to our consolidated financial statements included in Part II, Item 8, "Financial Statements and Supplementary Data" of this Annual Report on Form 10-K for additional details on the Merger.
Following the Merger, effective August 1, 2017, we realigned our operating segments into two reportable segments: Clinical Solutions and Commercial Solutions to reflect the current structure under which we operate, evaluate our performance, make strategic decisions, and allocate resources.
Our Clinical Solutions segment offers a variety of clinical development services spanning Phase I to Phase IV, including full-service global studies, as well as unbundled service offerings such as clinical monitoring, investigator recruitment, patient recruitment, data management, and study startup to assist customers with their drug development process. Our Commercial Solutions segment provides customers with a full range of commercialization services, including outsourced field selling solutions, medication adherence, communications (advertising and public relations), and consulting services. Our strategic, insights-driven approach provides our customers with a single source, integrated end-to end solution that spans the entire product lifecycle, designed to increase the likelihood of a successful product launch and commercial profitability. We offer those services in either a full service or individual, unbundled basis depending on customers' needs.
Our management reviews segment performance and allocates resources based upon segment revenue and segment operating income. Historical segment reporting has been revised to reflect these changes to our segment structure. Prior to the Merger, our Commercial Solutions segment consisted solely of consulting services. For further information about the Company's reportable segments, please see "Note 14 - Segment Information" in our consolidated financial statements included in Part II, Item 8, "Financial Statements and Supplementary Data” of this Annual Report on Form 10-K. For financial information about our revenue and long-lived assets by geographic area, please see "Note 15 - Operations by Geographic Location" in our consolidated financial statements included in Part II, Item 8, "Financial Statements and Supplementary Data” of this Annual Report on Form 10-K. Our international operations expose us to risks that differ from those applicable to operating in the United States, including foreign currency translation and transaction risks, risks of changes in tax and labor laws, and other risks described further in Part I, Item 1A, "Risk Factors" of this Annual Report on Form 10-K.
For the year ended December 31, 2017, total net service revenue was $1.85 billion, net loss was $138.5 million, Adjusted Net Income was $196.0 million, and Adjusted EBITDA was $391.9 million. For important disclosures about our non-GAAP measures and a reconciliation of Adjusted Net Income and Adjusted EBITDA to our GAAP net income (loss), see Part II, Item 6, "Selected Financial Data" of this Annual Report on Form 10-K. For further information about our consolidated revenues and earnings, see our consolidated financial statements included in Part II, Item 8, "Financial Statements and Supplementary Data" and Part II, Item 7, "Management's Discussion and Analysis of Financial Condition and Results of Operations" of this Annual Report on Form 10-K.
Our Market
The market for our integrated solutions is primarily the biopharmaceutical industry that utilizes outsourced clinical drug development and commercialization services. We believe we are well-positioned to benefit from the following market trends:
Trends in clinical drug development. Biopharmaceutical companies continue to prioritize the outsourcing of Phase I to Phase IV clinical trials, particularly in complex, high-growth therapeutic areas such as CNS,
3
oncology and other complex diseases. Additionally, small and mid-sized biopharmaceutical companies typically have limited infrastructure and therefore are far more likely to outsource their clinical development to CROs. We estimate, based on industry sources (including analysts' reports), and management's knowledge, that the market for CRO services for Phase I to Phase IV clinical development services will grow at an average annual rate of 5% to 7% through 2020, driven by a combination of increased development spending and further outsourcing penetration. In addition, we estimate that total biopharmaceutical spending on drug development in 2017 was approximately $89.0 billion, of which the clinical development market, which is the market for drug development following pre-clinical research, was approximately $77.0 billion. Of the $77.0 billion, we estimate our total addressable market to be $62.0 billion, after excluding $15.0 billion of indirect fees paid to principal investigators and clinical research sites, which are not a part of the CRO market. We estimate that total biopharmaceutical spending on clinical development will grow at a rate of 2% to 4% annually through 2020. In 2017, we estimate biopharmaceutical companies outsourced approximately $31.0 billion of clinical development spending to CROs, representing a 7% increase compared to 2016 and a penetration rate of 49% of our total addressable market. We estimate that this penetration rate will increase to approximately 52% of our total addressable market by 2020.
Within the overall Phase I to Phase IV market segment, the Phase IV/post-approval/Real World Evidence sub-segment represents a large area of spending where outsourcing penetration is lower than traditional clinical development and pharmaceutical industry trends are creating increasing demand.
Trends in commercialization outsourcing.
We believe that, based on industry sources (including analysts' reports), and management's knowledge, that the market for CCO services will grow at an average annual rate of 7% through 2020, driven by a combination of increased sales and marketing spending and further outsourcing penetration. We estimate that the total addressable market for commercialization services was approximately $154.0 billion in 2017, as determined by our analysis of biopharmaceutical selling, general, and administrative ("SG&A") trends and related sales and marketing budgets over the past 10 years. In 2017, we estimate biopharmaceutical companies outsourced approximately $24.0 billion of this commercialization spending to CCOs, representing a penetration rate of approximately 16% of the total addressable commercial market. We estimate that this penetration rate will increase to approximately 19% of our total addressable market by 2020, while the underlying biopharmaceutical sales and marketing spending will grow at a rate of 1% to 3% annually during this same time period. We project that over time this market may follow a similar outsourcing penetration trajectory as the clinical development market, resulting in the potential for long-term revenue growth. We believe this potential for growth is supported by: (i) significant biopharmaceutical sales and marketing budgets – generally at least 10% greater than research and development ("R&D") budgets at large biopharmaceutical companies; (ii) a continuing shift toward specialty and more complex therapies requiring more complex and integrated sales and marketing execution and experience; (iii) a robust funding environment, which provides capital to fuel growth in development and commercialization spending, particularly with small to mid-sized companies that wish to remain independent, (iv) significant outsourcing penetration opportunities; (v) an evolving industry landscape illustrated by a shift to longer and more strategic relationships; and (vi) significant downward pressure on pharmaceutical pricing.
Increasingly challenging development and commercialization environment. The biopharmaceutical industry is currently facing a number of challenges, including: (i) margin deterioration; (ii) reimbursement and provider access hurdles; (iii) the declining attractiveness of non-core brands resulting in fewer blockbuster and higher profitability drugs reaching the market; (iv) continued pressure from generic brand exposure resulting from expiring patents; and (v) the consolidation of payers, health systems, providers, and pharmacies. These challenges are also making physicians and patients more difficult to engage, making new product launches more difficult. At the same time, the industry is experiencing growing demand for specialty drugs, pressure to achieve improvements in R&D productivity, the transition of the healthcare industry worldwide from a volume-based to a value-based reimbursement structure, and growing political and pricing pressures. Existing approaches to address these challenges include reducing overhead costs, optimizing the deployment of marketing and field assets, and refocusing product portfolios around therapeutic areas with depth of presence and expanded market access capabilities.
4
Optimization of biopharmaceutical R&D efficiency. Market forces and healthcare reform, including the Patient Protection and Affordable Care Act, as amended by the Health Care and Education Reconciliation Act, the 21st Century Cures Act, and other governmental initiatives, place significant pressure on biopharmaceutical companies to improve cost efficiency. Companies need to demonstrate the relative improvement in quality, safety, and effectiveness of new therapies as compared to existing approved therapies as early as possible in the development process. CROs can help biopharmaceutical companies deploy capital more efficiently as many biopharmaceutical companies do not have adequate in-house development resources. In response to high clinical trial costs, particularly in therapeutic areas such as CNS and oncology, which we believe present the highest mean cost per patient across all clinical trials, biopharmaceutical companies are streamlining operations and shifting development to external providers to lower fixed costs.
Globalization of clinical trials. Clinical trials have become increasingly global as biopharmaceutical companies seek to accelerate patient recruitment, particularly within protocol-eligible, treatment-naïve patient populations without co-morbidities that could skew clinical outcomes. Biopharmaceutical companies are also increasingly seeking to expand the commercial potential of their products by applying for regulatory approvals in multiple countries, including fast-growing economies that are spending more on healthcare. As part of the biopharmaceutical approval process in newer markets, especially in certain Asian and emerging markets, regulators now often require trials to include specific percentages or numbers of people from local populations, resulting in a combination of multinational and domestic trials.
Management of increasingly complex trials. The biopharmaceutical industry operates in an increasingly sophisticated and highly-regulated environment and has responded to the demands of novel therapeutics by adapting efficient drug development processes. Complex trial design expertise has emerged as a significant competitive advantage for select CROs that have a track record of successfully navigating country-specific regulatory, trial protocol, and patient enrollment barriers, including sometimes subjective, evolving clinical endpoints. In addition, the therapeutic areas where we have significant experience and expertise, including CNS, oncology, and other complex diseases, often require more complicated testing protocols than other disease indications. Many of these studies have longer durations due to these factors resulting in demand for greater clinical trial proficiency and expertise in these therapeutic areas, particularly in light of new methods of testing, such as the use of biomarkers and gene therapy.
Evolving commercialization outsourcing needs for large vs. small to mid-sized pharma. Given the increasingly challenging commercialization environment outlined previously, the needs of biopharmaceutical companies are ever-changing. The needs of large versus small to mid-sized customers are developing differently based upon infrastructure and corporate commercialization goals, requiring diverse approaches and capabilities. Large biopharmaceutical companies tend to have more robust internal resources, and are more often seeking to augment these resources with individual services on a brand-by-brand basis. They are also frequently looking for enterprise vendor relationships that achieve broader cost savings based upon volume considerations of their products. Smaller biopharmaceutical companies typically have a limited number of products, and very limited internal resources and expertise for commercialization, requiring the full spectrum of commercialization capabilities, similar to outsourced clinical development patterns. Historically these commercialization considerations may have required small to mid-sized companies to surrender a significant portion of their long-term economic value in licensing arrangements.
Our Competitive Strengths
We believe that our ability to provide integrated clinical drug development and commercial solutions positions us to address market realities where these disciplines must work together to accelerate the delivery of important therapies to market. Our key competitive strengths are:
Global leadership in biopharmaceutical outsourcing with differentiated positioning. We believe our comprehensive suite of clinical and commercial services differentiates us in the marketplace. We offer our services through a highly skilled staff of approximately 21,000 employees located in more than 60 countries as of December 31, 2017, and have conducted work in more than 110 countries. Over 84% of all new molecular entities approved by the U.S. Food and Drug Administration ("FDA") and 70% of the products
5
granted marketing authorization by the European Medicines Agency ("EMA") over the last five years have been developed or commercialized with our support. We believe our scale, global reach, and breadth of services, coupled with our deep industry expertise and experience, enable us to offer the solutions our customers require to navigate an increasingly complex and evolving market. In addition, we believe our customers are seeking to consolidate their outsourcing to a smaller set of large global providers in order to address changing industry dynamics.
Innovative operating model - the Trusted Process®. Since 2006, we have conducted clinical trials using our innovative Trusted Process® operating model, which is designed to standardize methodologies, increase the predictability of the delivery of our services, and reduce operational risk. We accomplish standardized delivery through support from a company-wide Project Management Office, which defines, maintains, and improves procedures relating to the Trusted Process® and ensures consistent application globally. Since initiation of the Trusted Process®, we have reduced median clinical study start-up time (defined as the period from finalized protocol to first patient enrolled) on new projects. Based on industry sources for the median study start-up time for the biopharmaceutical industry, we believe we achieve this milestone for our customers at a faster pace than the industry, due in part to this proprietary methodology. In addition to the absolute reduction of cycle times in critical path milestones, we believe we provide greater operating efficiency, more predictable project schedules, and a reduction in overall project timelines. The metrics-driven Trusted Process® methodology is divided into four sub-processes which correlate to the key phases of a clinical project:
• | PlanActivation® — the design phase, where a project is analyzed and a strategy developed utilizing our therapeutic and clinical experience, forming the basis of a customized project proposal. The strategy continues to be refined based on discussions with the customer through new business award; |
• | QuickStart® — the initiating phase, which serves to align the customer and our project team to a single set of objectives, create shared expectations and develop a joint plan for project implementation; |
• | ProgramAccelerate® — the execution and control phase, which includes the processes of patient recruitment, clinical monitoring and data management. In this phase, we proactively process and review data to ensure quality and project timelines are actively managed, while maintaining strong relationships with investigative sites; and |
• | QualityFinish® — the closing phase, which is triggered by the first enrolled patient completing the clinical trial. This phase focuses on ensuring high quality, actionable data is used to develop the final deliverables which make up the basis of the documentation necessary for filing with regulatory agencies. |
While initially developed to better manage clinical trial complexity, the Trusted Process® is being actively deployed across our commercial service portfolio to further drive consistency and quality in our integrated operations.
Functional Service Provider Model. Our Functional Service Provider ("FSP") model provides flexible resourcing solutions in the areas of biostatistics and programming, data management, drug safety and pharmacovigilance, medical writing and clinical monitoring. Our model includes a comprehensive plan designed to ensure both speed and quality for operations, relationship management, communication, quality and risk mitigation, and internal processes and tools. We collaborate extensively across functional teams to ensure customer needs are appropriately identified and supported. Additionally, we provide clinical staffing solutions in the areas of contract staffing and direct placement hire.
Adding value across the biopharmaceutical product lifecycle. Our broad suite of services allows us to deliver customized solutions and provide value to biopharmaceutical companies and other key constituents across the healthcare delivery system. We are uniquely positioned to leverage our broad experience and proprietary data assets across our offerings, providing end-to-end solutions that help biopharmaceutical
6
customers optimize execution and reduce costs throughout the product lifecycle using the following capabilities:
• | Superior clinical trial design: We leverage our expanding clinical and commercial knowledge capital and access claims data from over 100 million patients in the United States to inform and enhance clinical trial design. These insights facilitate shorter and more efficient trials intended to improve the likelihood of regulatory and subsequent commercial success. |
• | Enhanced site selection and patient recruitment: We utilize proprietary data assets, behavioral insights, social media and communications capabilities to enhance the speed and success of site selection and patient recruitment. |
• | Proactive pre-launch reimbursement and formulary management: We bridge the gap between clinical development and commercialization by using our diverse capabilities and ability to communicate clinical benefits to payers and Pharmacy Benefit Managers ("PBMs") to help optimize reimbursement and patient access. |
• | Highly effective commercial product launch capabilities: We help our customers navigate the global complexities of launching a product by orchestrating interconnected work streams to develop and execute an effective product launch strategy. |
• | Proprietary programs to improve medication adherence: We have the ability to reach over 193 million patients through multi-channel medication adherence programs designed to mitigate costs related to non-adherence, which are estimated by the Centers for Disease Control and Prevention to exceed $100 billion to $300 billion annually. |
• | Full commercialization solutions: We enable new companies to develop, launch, and commercially support their brands by accessing our comprehensive outsourced services, and acting as their virtual commercialization infrastructure. |
• | Efficient project ramp-up: We scale clinical or commercial projects rapidly and effectively through our recruiting, training, and deployment capabilities, leveraging over 150 dedicated recruiting personnel and our proprietary database of over 700,000 industry professionals. |
Access to robust data assets. We have access to significant data assets through our clinical and commercial operations, our medication adherence services, and a variety of third party providers. These data assets provide insights to our customers to support their product development and commercialization efforts. With more than 50% of all U.S. retail prescriptions ("scripts") and relationships with more than 30 of the top retail pharmacy chains that represent more than 28,750 pharmacies, 193 million patients, and 2.25 billion unique scripts each year, we are able to support all aspects of our end-to-end product development services, including clinical trial protocol design, site selection, patient recruitment, selling solutions program design and management, and pricing and market access consulting, among others. Furthermore, relationships we have in place with third-party partners provide us a breadth of coverage for these insights that reaches Europe and allow us to reach more than 400 million patients throughout North America and the European Union ("EU") and United Kingdom.
We place a high importance on leveraging the insights we derive from our Adheris Health Patient Performance and Outcomes platform to improve our site and investigator interactions. Our market leading commercial capabilities enable our teams to focus their efforts on proactively enhancing planning, driving improved adherence with therapies, and producing more predictable outcomes for our customers. Also, by utilizing our exclusive retail network, we provide patient-level insights that enhance our decision-making and collaboration with our clinical customers who can then leverage these insights to make informed, actionable, and impactful decisions in an increasingly competitive market.
Deep and long-standing therapeutic expertise and organization. We provide our customers with highly-differentiated, specialized teams that leverage our broad offering of world-class therapeutic expertise in both our Clinical Solutions and Commercial Solutions segments. Our therapeutic expertise is managed by our
7
senior leadership and delivered by our senior scientific and medical staff and our clinical research associates ("CRAs") within our various therapeutic areas. Importantly, we believe we are unique in organizing our therapeutic business units down to the CRA level, rather than operating with a broader pool of these resources. We believe this therapeutic alignment improves the effectiveness and efficiency of our customers' clinical trials by ensuring that our clinical staff working at our investigative sites have the therapeutic expertise and experience to manage the trial. Industry analysts have reported that therapeutic expertise is the most influential factor for sponsors of clinical trials in selecting a CRO. We believe that our expertise in managing complex clinical trials differentiates us from our competitors and has played a key role in our growth, our ability to win new clinical trials, and our successful relationship development with clinical research sites. We also believe our specialized therapeutic expertise within our Commercial Solutions segment is unique in our industry and becoming increasingly important to our customers as therapies become more complex and targeted. Our experienced medical and scientific professionals include more than 950 employees with M.D.s, Ph.D.s, or Pharm D.s. These employees apply innovative insights and science to clinical trials as well as to the commercialization of products and support customers across both our Clinical Solutions and Commercial Solutions segments.
Industry-leading principal investigator and clinical research site relationships. We have extensive relationships with principal investigators and clinical research sites. We believe these quality relationships are critical for delivering clinical trial results on time and on budget for our customers. Motivated and engaged investigative sites can facilitate faster patient recruitment, increase retention, maintain safety, ensure compliance with protocols as well as with local and international regulations, and streamline reporting. The ability to recruit and retain principal investigators and patients is an integral part of the clinical trial process. We have dedicated personnel focused on enhancing clinical research site relationships; we work with these sites in collaborative partnerships to improve cycle times and standardize start-up activities to drive efficiency.
Diversified and loyal customer base. We are diversified across our segments, deriving 79% and 21% of our net service revenue during 2017 from our Clinical Solutions and Commercial Solutions segments, respectively. We have a well-diversified, loyal customer base of over 500 customers that includes each of the 50 largest global biopharmaceutical companies (based on annual investment in research and development) as well as high-growth, small and mid-sized biopharmaceutical companies. During 2017, we provided both clinical and commercial services to 64 customers. We have several customers with whom we have achieved "preferred provider" or strategic alliance relationships. We define these customers as relationships from which we generate significant revenue and where we have executed master service agreements in addition to regularly scheduled strategy meetings to discuss the status of our relationship, and for which we serve as a preferred supplier of services. We believe these relationships provide us enhanced opportunities for more business, although they are not a guarantee of future business. Our top five customers accounted for approximately 22% of our net service revenue in 2017.
Our customer base is geographically diverse with well-established relationships in the United States, Europe, and Asia. As of December 31, 2017, our top ten customers had worked with us for an average of 18 years. We believe that the tenure of our customer relationships as well as the depth of penetration of our services reflect our strong reputation and track record. We believe we are uniquely positioned to further penetrate our existing customer base and expand our services across the biopharmaceutical industry, as a significant number of the top 50 biopharmaceutical companies utilize both clinical and commercial services. The flexibility and depth of our services enables us to scale our commercialization solutions to address our customers' needs. We connect and integrate clinical and commercial disciplines, enabling biopharmaceutical companies of all sizes to accelerate the commercialization of assets by bringing market access insights into the clinical trial design, reducing complexity, maximizing speed, and enhancing economic efficiency.
Highly experienced management team with a deep-rooted culture of quality and innovation. We are led by a dedicated and experienced senior management team with significant experience and knowledge focused on the biopharmaceutical industry. Each member of our senior management team has 20 years or more of relevant experience, including experience with biopharmaceutical companies, payers, and health systems. This team has successfully grown our company into a leading biopharmaceutical solutions organization through a combination of organic growth and strategic acquisitions.
8
Our Business Strategy
Our goal is to generate profitable revenue growth, achieve differentiation in the marketplace in both of our segments, and increase margins through operational efficiency initiatives. We believe our end-to-end product development model, where clinical insights inform commercialization and commercial insights improve clinical trial design and execution, is unique to the industry. The key elements of our business strategy include:
Increase market share through our unmatched service offerings and scale. We believe we are uniquely positioned to meet our customers’ evolving needs as the only provider of a full suite of services through the clinical development and commercialization continuum. Our size and scale enable us to provide solutions designed to accelerate our customers’ clinical or commercial projects, driving speed and cost efficiencies. Our ability to engage customers in the early phases of clinical trials with respect to commercial insights allows them to make more informed decisions on clinical trial design and strategies, which we believe is a key differentiator from our competitors. Our Real World and Late Phase offering acts as the critical bridge from clinical effectiveness to commercial viability. The capabilities to move from development to commercialization require a comprehensive approach that integrates strategic, creative, and operational expertise. Our Integrated Solutions Group ("ISG") is comprised of dedicated industry veterans and product strategists with regulatory, clinical, commercial, and real world expertise that uniquely positions us to help our customers determine the right mix of clinical and commercial solutions needed throughout the product life cycle. Our unique integration of strategy and operations results in multiple selling points along the operational timeline of product development.
We intend to leverage our differentiated service offerings to increase our share of the growing market for outsourced clinical and commercialization services. We believe the need for a full suite of services is particularly strong with our small to mid-sized customers, given their rapid growth and limited internal resources. We intend to capitalize on this market opportunity with existing and potential customers through a variety of channels, but primarily through the consultative sales approach of our ISG. The ISG is a dedicated group of industry veterans and product strategists with regulatory, clinical, commercial and Real World Evidence expertise. The ISG is uniquely positioned to determine the appropriate mix of clinical and commercial solutions to help customers optimize the development process for their products and maximize the return on their investment.
Leverage our market leadership position in large and attractive markets. Our Clinical Solutions and Commercial Solutions segments are benefiting from specific industry trends that are expected to drive attractive growth. We believe outsourcing late-stage clinical development services to CROs optimizes returns on invested R&D for biopharmaceutical companies. As business models continue to evolve in the healthcare sector, we believe that the rate of commercial outsourcing may follow a similar long-term path to the clinical development market. Global demand for biopharmaceutical products continues to increase, driven by expanding access to care, increasing life expectancy, and the growing prevalence of chronic conditions in both developed and emerging markets. Higher costs and increased complexity are driving our customers to seek efficiency and expertise through outsourcing services. We intend to capitalize on these trends by continuing to provide the services our customers need. Additionally, we believe that our differentiated approach of investing in highly experienced people, making better use of enabling technology, improving the process of clinical development and commercialization, and integrating our significant data and insights across these disciplines will allow our customers to generate superior returns.
Leverage our expertise in delivering complex clinical trials and deepen our therapeutic expertise in fast-growing areas. We intend to continue to develop and leverage our therapeutic and operational expertise in delivering complex clinical trials. Our extensive use of insights gained from fit-for-purpose data sources and our relationships with principal investigators and clinical research sites with longstanding patient relationships are especially critical in delivering complex clinical trials. This is enhanced by the use of our proprietary Trusted Process® methodology that reduces operational risk and variability by standardizing processes, minimizing delays, instilling quality throughout the clinical development process, and leading customers to more confident, better-informed drug development decisions. We believe this collective expertise, data, and insights into complex clinical trials uniquely informs our customers’ decisions about their regulatory and payer approvals, market access, reimbursement and formulary inclusion, and other steps that are critical to optimizing their returns in the commercialization process.
9
Drive acceleration of commercial outsourcing. We have continuously expanded and invested in our commercial outsourcing capabilities and we intend to leverage our extensive knowledge, experience and broad offerings to drive expansion of the commercial outsourcing opportunity with new and existing customers. We believe the market for our full suite of services is evolving based upon the different needs of large biopharmaceutical companies compared to small to mid-sized companies, based upon their infrastructure and corporate commercialization goals. Large biopharmaceutical companies are often seeking broader cost savings through enterprise vendor relationships that leverage their volume of products. However, smaller biopharmaceutical companies typically require the full spectrum of commercialization capabilities, given their limited internal resources. Historically, this may have required these smaller companies to surrender a significant portion of their long term economic value in a licensing arrangement to achieve commercialization. However, with sufficient capital given today’s funding environment, we believe these companies may be more receptive to commercialization alternatives that allow them to maintain their independence. Although we are well positioned to capitalize on the needs of both customer types, we believe that the market dynamics for these small to mid-sized customers will be a key catalyst to driving further adoption of commercial outsourcing. Our ISG is purpose-built to leverage this market dynamic, using our strong clinical presence and relationships in the small to mid-sized customer segment. We believe that having the capability to provide our customers with a commercialization plan may increase their overall success with the sales of a drug once FDA approval is received.
Increase cross-selling with existing customers. We believe that we have substantial opportunities to expand the reach of our services that we provide to our existing customers. During 2017, 64 customers, of which 43 were also in our top 100 customers, utilized services from both our Clinical Solutions and Commercial Solutions segments demonstrating our belief that there is both market precedent and significant potential to sell additional services to our existing customer base. Given our past success in expanding the scope of services provided to current customers, we intend to further expand our business with our existing customers by cross-selling additional clinical and commercial services. As part of our cross-selling efforts, we market the potential operational and economic efficiencies that customers can achieve by using more of our services throughout the product lifecycle.
Capitalize on our geographic scale. We intend to leverage our global breadth and scale to drive continued growth and target segments of the biopharmaceutical market in which we are underpenetrated. Additionally, we have developed a global platform with a presence in all of the major biopharmaceutical markets in the world and intend to further expand our business outside of the United States. We are focused on replicating our success in the U.S. market to other major biopharmaceutical markets around the world. We have expanded our capabilities, existing relationships, and local regulatory knowledge, which should continue to position us well for new customer wins in a wide array of markets. We have added geographic reach through both acquisitions and organic growth in areas such as Asia-Pacific, Latin America, and the Middle East and Africa, which we believe is critical to obtaining larger new business awards from large and mid-sized biopharmaceutical companies. Our long-term growth opportunities are enhanced by our strong reputation in emerging markets and our proven track record of performance. We may also selectively identify and acquire complementary businesses to enhance our services, capabilities, and geographic presence.
Continue to enhance our Trusted Process® methodology to deliver superior outcomes. We intend to continue the development and enhancement of our Trusted Process® methodology, which has delivered measurable, beneficial results for our customers and improved drug development decisions. While originally developed through years of experience and refinement in our Clinical Solutions segment, we also intend to adapt and deploy the Trusted Process® across our Commercial Solutions segment. We believe our Trusted Process® will continue to lead to high levels of customer satisfaction.
Continue our proven track record of successfully integrating companies to augment our organic growth. Over the past decade, we have developed a systematic approach for integrating operations. We have successfully integrated ten companies, including both strategic and tuck-in acquisitions. These strategic acquisitions have increased our size, scale, and reach, complementing our organic growth profile as we have become a leading biopharmaceutical solutions organization. Our mergers and acquisitions have enabled us to provide fully integrated clinical and commercial solutions to our customers and expand our global service offerings while also allowing us to achieve significant synergies and cost reductions. In the near term, our
10
primary focus will be continuing the successful integration related to the Merger, but we intend to continue evaluating selective tuck-in acquisition opportunities that we believe will enhance our services offerings and geographic presence.
Drive our human capital asset base to grow existing relationships. Our employees are critical to our ability to deliver our innovative operational model by engaging with customers, delivering clinical development services in a complex environment, and supporting and executing our growth strategy. Our recruiting and retention efforts are geared toward maintaining and growing a stable workforce, focused on delivering results for customers. We have a successful track record of integrating talent from prior acquisitions and believe we have a best-in-class pool of highly experienced project management professionals, CRAs, and communications, advertising, and consulting experts. Based on industry reporting, we also believe that our employee retention rates are consistent or better than the industry averages, and we intend to continue fostering an employee-friendly environment that promotes retention.
Our Services
We provide services through two reportable segments: Clinical Solutions and Commercial Solutions. Each reportable segment provides multiple service offerings that – when combined through the sharing of critical insights and data, which we refer to as our Biopharmaceutical Acceleration Model – creates a fully-integrated biopharmaceutical outsourced services provider. Our Clinical Solutions segment offers a variety of clinical development services spanning Phase I to Phase IV, including full-service global studies, unbundled service offerings, and Real World Evidence studies. Our Commercial Solutions segment provides customers with the full range of commercialization solutions, which include outsourced field promotion and medication adherence services, communication solutions (advertising and public relations), and consulting services.
Clinical Solutions
Our extensive range of clinical solutions supports the entire clinical development process from Phase I to Phase IV and allows us to offer our customers an integrated suite of investigative site support and clinical development services. We offer these services across a wide variety of therapeutic areas with deep clinical expertise with a primary focus on Phase II to Phase IV clinical trials. We believe our therapeutic focus and proprietary project management methodology have set us apart within our industry. We have particular strengths in the complex therapeutic areas such as CNS and Oncology which represent the largest and fastest growing therapeutic areas. We provide total biopharmaceutical program development through our Full
11
Service platform, while also providing discrete services for any part of a trial, often known as FSP, primarily through our Strategic Resourcing Group. The combination of service area experts and the depth of clinical capability allows for enhanced protocol design and actionable trial data. Importantly, all of our services in Clinical Solutions operate with the discipline of the Trusted Process®, which we believe improves overall quality, consistency, and delivery timelines. Our comprehensive suite of clinical development services and delivery platforms includes, but is not limited to:
Full Service Clinical Development
Our full service clinical development offering provides comprehensive solutions to address the clinical development needs of our customers, primarily in Phase II-IV. Our solutions can be delivered on a full-service project basis, on a functional or resource basis (see Strategic Resourcing below), or through a combination or hybrid approach depending on the needs of our customers. We are able to customize our services to provide customers support within an individual clinical study, a single function, multiple functions within a single therapeutic area, or across a customer’s entire product portfolio. We can leverage our extensive knowledge capital across both our Clinical Solutions and Commercial Solutions segments to inform clinical development strategy and trial design. Our comprehensive suite of clinical development services includes the following, among others:
• | Patient Recruitment and Retention. Our patient recruitment services group helps identify and manage appropriate vendors, focuses on patient recruitment and retention strategies, and acts as a liaison to media outlets and other vendors that we have validated. |
• | Site Start Up. Our site start up team helps maximize the enrollment period of the study by arranging applicable regulatory authority and ethics committee approvals, site contract negotiation, regulatory authority submissions, and the corresponding oversight of those activities. |
• | Project Management. Our project managers and directors provide customer-focused leadership in managing clinical trials and are accountable for the successful execution of all assigned projects, where success includes on-time, on-budget, and high quality results that lead to satisfied customers. Project managers and directors have the skills, education, experience, and training to support the successful conduct of clinical studies. |
• | Clinical Monitoring. Our clinical monitors oversee the conduct of a clinical trial by working with and monitoring clinical research sites to ensure the quality of the data. The clinical monitor ensures the trial is conducted according to Good Clinical Practice ("GCP"), International Conference on Harmonisation ("ICH") guidelines, and local regulations, to meet the customers' and regulatory authorities' requirements according to the study protocol. CRAs engage with clinical research sites in site initiation, training, and patient recruitment. We deploy and manage clinical monitoring staff in all regions of the globe. By maintaining a therapeutic focus, we attract CRAs who have a strong desire to dedicate themselves to working within a specific therapeutic area, providing an environment where they can further develop their expertise in their chosen area of interest. |
• | Drug Safety/Pharmacovigilance. Our drug safety teams are strategically located across the United States, Europe, Latin America, and Asia-Pacific. We provide global drug safety expertise in all phases of clinical research for serious adverse event/adverse event collection, evaluation, classification, reporting, reconciliation, post-marketing safety, and pharmacovigilance. |
• | Medical Affairs. We have in-house physicians who provide 24/7 medical monitoring, scientific and medical support for project management teams and clinical research sites. These in-house physicians consist of senior clinicians and former clinical researchers with patient care and trial management expertise. |
• | Quality Assurance. Quality control steps are built into all of our processes. We have an independent quality assurance department that, in addition to conducting independent audits of all ongoing projects and processes as part of our internal quality assurance program, offers contracted quality assurance services to customers, including audits of clinical research sites and of various vendors to |
12
the clinical research industry, mock regulatory inspections and clinical research site inspection-readiness training, standard operating procedure development, and quality assurance program development/consultation. Our customers also engage us to conduct third-party audits on behalf of their studies.
• | Regulatory and Medical Writing. We offer regulatory and medical writing expertise across the entire biopharmaceutical product lifecycle. Our team has hands-on regulatory and medical writing knowledge gained through experience from working in large biopharmaceutical companies, as well as high-growth, small and mid-sized biopharmaceutical companies, CROs, and the FDA. Additionally, each member is trained in FDA regulations, including GCP/standard operating practice compliance guidelines and guidelines established by the ICH. |
• | Clinical Data Management. Our clinical data management services allow us to confirm that the clinical trial database is ready, accurately populated, and locked in an expeditious manner, with verification and validation procedures throughout every phase of a clinical trial. This processing is done in synchronization with the clinical team, utilizing the information provided from the trial to help ensure efficient processes are employed, regardless of the data collection method used. |
• | Electronic Data Capture. To compete in today's changing global drug and device development environment, companies must collect and distribute data faster than ever. We have the ability to manage electronic data capture ("EDC") to help our customers take advantage of the efficiencies available through EDC, which include improved access to data, reduced cycle time, increased productivity, and improved relationships with customers, vendors, and other parties. We utilize three leading EDC platforms: Medidata Rave, Oracle Clinical Remote Data Capture, and Oracle Health Sciences InForm products. Our ability to design, build, and deliver high quality databases in all three platforms enables our team to deliver effective EDC solutions. |
• | Biostatistics. Our biostatistics team has a depth of experience with the FDA and EMA which allows our teams to provide customers with guidance on building a statistical plan to meet regulatory and safety requirements as well as a careful analysis of the resulting study data. In addition, we provide support for independent drug safety monitoring boards and a full range of related services. Our biostatisticians are also heavily involved in our Trusted Process® methodology, so that protocol and project development can be grounded in advanced statistical methodology. As part of a project team, our biostatisticians can provide data oversight throughout a clinical trial and address any data or data handling issues that may arise. |
Strategic Resourcing
Our FSP offering helps sponsors review their approach to key functional areas of clinical research, specifically those areas not core to their clinical development business or in areas where they need to augment their own internal resources. We are able to customize our full services offering to provide customers support within an individual clinical study, a single function, multiple functions within a single therapeutic area, or across a customer’s entire product portfolio. Any of our full service clinical solutions outlined above can be delivered on an unbundled or functional basis or on a hybrid approach, based on our customers' specific needs. We believe our FSP service offering provides greater predictability, improved visibility and reporting, and more consistent delivery of services across all protocols. We currently operate FSP hubs in North America, South America, Europe, and Asia.
Early Stage
Our Early Stage offering provides a full range of services for Phase I and Phase IIA clinical trial conduct, bioanalytical analysis assay development, and clinical pharmacology services, including modeling and simulation. We also provide validation and sample analysis services from preclinical development through post-marketing support and purpose-built phase biometrics support from North America and India. We conduct clinical trial studies at our facilities located in Quebec City and Toronto, Canada and Miami, Florida. We have extensive experience in first-in-human, proof-of concept, bioequivalence and bioavailability, biosimilars, and clinical pharmacology study conduct and are a leader in the provision of abuse-liability and
13
dependency studies. We have built direct partnerships with leading hospitals for conduct of early development and clinical pharmacology studies that require access to patients. The combination of our facilities and partnerships can provide access in the North American and Asia-Pacific geographies. We have a large base of available subjects, including patient populations with specific medical conditions and healthy volunteers, which provide efficient and rapid patient recruitment. Furthermore, we can also provide early stage and clinical pharmacology studies through our Asia-Pacific Catalyst Model with Phase I - IIA conduct capabilities in Australia, New Zealand, South Korea, Japan, and China.
Our two bioanalytical laboratories located in Quebec, Canada and Princeton, New Jersey have extensive experience in method development, validation, and bioanalytical analysis support for both small molecule therapeutics and biologics using a variety of analytical techniques and instrumentation platforms, as well as the provision of critical reagents handling services for biologics.
Real World and Late Phase Services
Our Real World and Late Phase group conducts “real world” studies to understand how a treatment, service or method of delivering care works when applied in real world, clinical practice environments. We provide both consultative and operational expertise to our customers in real world data generation, from concept through core development, launch and commercialization. By utilizing our successful drug life cycle management, we ensure we partner with our customers to gain better outcomes for patients, physicians, payers, and regulators. These services allow our customers to make timely and cost effective advances in clinical treatment by providing data about actual experience of doctors and patients outside of the regulated environment of clinical development. We also leverage the data and insights from our experience across the commercialization spectrum to inform the design and conduct of these studies. Our services include patient registries, surveillance and observational studies, patient/health outcomes research, and economic studies.
Commercial Solutions
Our Commercial Solutions business provides a broad suite of complementary commercialization services including selling solutions, communications (advertising and public relations) and consulting services.
Selling Solutions Services
Selling solutions services include field-based promotional and market access solutions, field-based clinical solutions, inside sales and contact center, insight and strategy design, patient support services, training, talent sourcing, end-to-end sales operations, and medication adherence. We provide contract field promotion teams with a broad array of capabilities, support services and non-personal engagement solutions including tele-detailing and electronic detailing (e-detailing) to help our customers accelerate the commercialization of their products. Our field promotion teams are supported by recruiting and training capabilities that are complemented by highly-qualified clinical and scientific professionals who serve as advocates and educators to inform markets of new and novel therapies as well as customized patient behavioral models built on extensive data insights and analytics through our extensive and proprietary data-driven platform. Services offered include market research, commercial analytics, managed markets access, biotechnology and specialty managed markets, integrated commercialization, and medication adherence. Our field promotion teams can be supported by our communications and consulting services.
• | Clinical Field Teams. We are a leading provider of outsourced Clinical Field Team solutions to the biopharmaceutical industry. As Medical Science Liaisons ("MSLs"), Contract US Medical Directors, and/or Clinical Nurse Educators, our Clinical Field Teams deliver education, preparing healthcare professionals, patients, advocacy organizations, and others with the latest evidence-based scientific and practical information about disease states, current treatments, and the use of customers’ products. |
• | Promotional Field Teams and Support. We have the industry-leading, scalable capabilities to recruit, train, target, deploy, and support successful sales teams for our customers to achieve their business goals. As one of the largest providers of outsourced sales teams and sales solutions to the healthcare |
14
industry, we have well-established flexible processes and infrastructure to efficiently build, scale, deploy, execute, and retain a high-performing field sales team.
• | Commercial Recruiting Solutions. We are an exclusive recruiting partner who has experience in the commercial life science industry and a talent network of the top MSL, Nurse Educator, Sales, Sales Management, and Market Access performers. Our proprietary database, industry-leading recruiters and branding and talent assessment process are keys to accelerating our customers’ commercial recruiting success. |
• | Operations Support Services. We maintain a comprehensive set of best-in-class operations support services that include field automation hardware/software, data management, targeting and alignments, analytics and reporting, incentive plan design and implementation, quality management, and help desk. These capabilities are used both individually and collectively to ensure that our deployed field teams perform optimally, respond rapidly to changing marketplace dynamics, and continuously improve. |
• | Medication Adherence. We believe that we have the largest comprehensive network for patient and prescriber access, and provide dynamic patient performance programs that activate patients, improve outcomes, and elevate brand performance. With customized patient behavioral models built on extensive data insights and analytics, we have the ability to communicate with various patient types as they move throughout their individual patient journeys - in the doctor’s office, at the pharmacy, and in their home - through our extensive and proprietary data-driven platform. |
Communications Services
Communications services include healthcare advertising, medical communications, digital marketing, communications planning, public relations, and naming/branding services. We offer a broad array of advertising and public relations services to customers looking to commercialize their products domestically and/or internationally. Communications services are deployed throughout a product’s existence, beginning well before commercial launch, encompassing regulatory approval and market introduction, and continuing throughout the life of a product. Our communications services offering is focused on healthcare, and provides advertising, public relations, interactive digital strategies, and branding and identity consulting services, as well as medical communications and education services.
• | Healthcare Advertising. We believe that we offer the largest independent healthcare communications network in the world. Our advertising teams are immersed in healthcare data and connected to frontline experts who help them delve deep into the real life experience of health, harvesting insights that allow us to create optimal communications strategies for our customers. We help our customers excel at some of the most critical challenges in healthcare, including, but not limited to, brand launch, leveraging mass and personalized media, creating advertising content and campaigns, patient analysis, disease state campaigns, and market perception analysis. Our advertising teams have deep therapeutic expertise, with agencies solely dedicated to oncology, chronic disease care and activation, biologics, and industry innovation. |
• | Public Relations. Our Public Relations teams develop breakthrough creative campaigns grounded in deep customer insight and integrated under a multi-channel strategy. These programs raise awareness and produce meaningful, measurable behavior change among audiences. With a diverse set of healthcare communications specialties under one umbrella, we are able to deliver integrated advice and expert insight from a variety of strategic perspectives. We offer best-in-class capabilities spanning public relations, digital and social media, medical and scientific education, and research and analytics. Our teams create communications that enhance brand perception, drive engagement, activate behavior shifts and deliver on the bottom line. |
• | Medical Communications. Medical Communications helps our customers to frame their product position in a way that clinicians will find relevant, and creates strategies, campaigns and tactics to help these stakeholders at the right time, with the right content. Our Medical Communications team |
15
provides support through strategic planning, publication planning, content development, and peer-to-peer education.
Consulting Services
Consulting services include commercial strategy development and planning, pricing and market access, medical affairs advisory, and risk and program management. We offer specialized practices in business development, managed markets, and brand management, including strategic product launch planning. Consulting services are focused on addressing the needs of the pharmaceutical and biotechnology industries to support critical decision-making throughout the evolution of a product, from licensing, to product and portfolio strategy development, to drug commercialization. Consulting services professionals have a deep, functional knowledge of our customers’ core business, which produces value-added insights and mission-critical solutions, both creative and standard. Consulting services are centered on maximizing the commercial value of a client’s product pipeline, helping clinical leaders better and more strategically deploy resources and improve efficiency, as well as enhance the effectiveness of marketing and sales activities.
• | Commercial Strategy Development and Planning. Our strategic consulting group focuses on maximizing the value of scientific knowledge, intellectual property and portfolio content. The key areas of advisory services include strategic drug development, clinical development plans, registration strategies, exit strategies, transitional clarity, good clinical practice compliance strategies, clinical operations optimization, pricing and reimbursement, and due diligence. Strategic consultants include senior personnel from medical and regulatory affairs, clinical research, biostatistics and data management. These individuals provide expertise gained through hands-on experience as former executives from biopharmaceutical companies, CROs, and regulatory agencies. |
• | Pricing and Market Access. Our team offers a full spectrum of market access solutions and services, including market assessment and analysis, comparative effectiveness research, pricing reimbursement, patient assistance services, and legislative and regulatory analysis. |
• | Medical Affairs Advisory. Our team brings more than 20 years of practical experience and expertise in helping our customers realize medical transformation. Our modular medical transformation solution allows customers to assess where they are in their medical transformation by helping them identify their competitive position, prioritize their needs, understand their brand perception, and inform their market engagement strategy. |
• | Quality Management and Regulatory Compliance Advisory. Our quality and compliance team delivers independent quality management services through audit, inspection and implementation services, and assist our customers with developing and executing a clinical regulatory strategy through regulatory consulting, publishing and submission services globally. |
• | Risk and Program Management. Our communications consultants provide advice and subject matter expertise for risk evaluation on medicine affordability, compassionate use, and litigation and access barriers. We provide an evidence-based approach to avoiding policy, patient, and provider pushback on price; using best practices for how life-sciences companies can deploy effective preventative strategies; implementing compliance strategies to prepare for expanded access and compassionate use inquiries; and executing an Institute for Clinical and Economic Review review strategy to demonstrate product value. |
Customers
We have a well-diversified, loyal customer base that includes each of the world's largest biopharmaceutical companies, which we define as the top 50 biopharmaceutical companies measured by annual R&D spend. We serve over 500 customers, including each of the 20 largest global biopharmaceutical companies, as well as numerous emerging and specialty biotechnology companies, medical device and diagnostics companies. In addition, we have strong relationships with small and mid-sized biopharmaceutical customers that seek our services for our therapeutic expertise and full-service offering.
16
For the year ended December 31, 2017, our net service revenue attributable to large biopharmaceutical companies represented approximately 61% of our total net service revenue and net service revenue attributable to small and mid-sized biopharmaceutical companies represented approximately 39%. Additionally, we serve customers in a variety of locations throughout the world, with approximately 63% of our 2017 net service revenue generated from customers in the United States and Canada; 25% generated from Europe, the Middle East, and Africa; 9% generated from Asia-Pacific; and 3% generated from Latin America. This diversification allows us to grow our business in multiple customer segments and geographies.
For the year ended December 31, 2017, our top five customers accounted for approximately 22% of our net service revenue. No single customer accounted for greater than 10% of our total consolidated net service revenue for the years ended December 31, 2017, 2016 or 2015.
Our top ten customers have worked with us for an average of approximately 18 years as of December 31, 2017. We also have a growing list of "preferred provider" and/or strategic alliance relationships. Further, among the majority of our customers, revenue is diversified by multiple projects and services. For example, during 2017, we provided both clinical and commercial services to 64 customers. We believe that the tenure of our customer relationships as well as the depth of penetration of our services reflects our strong reputation and track record.
New Business Awards and Backlog
In connection with the Merger, we re-evaluated our existing backlog policy for our Clinical Solutions segment. As a result of this evaluation, effective during the third quarter of 2017, we changed our policy for calculating and reporting the amounts of our net new business awards and backlog. Under the new backlog policy for our Clinical Solutions segment, we add new business awards to backlog when we enter into a contract or when we receive a written commitment from the customer selecting us as a service provider, provided that:
• | the customer has received appropriate internal funding approval and collection of the award value is probable; |
• | the project or projects are not contingent upon completion of another trial or event; |
• | the project or projects are expected to commence within the next six months; |
• | the customer has entered or intends to enter into a comprehensive contract as soon as practicable; and |
• | for awards related to our FSP offering, only a maximum of twelve months of services are included. |
In addition, we continually evaluate our backlog to determine if any of the previously awarded work is no longer expected to be performed, regardless of whether we have received formal cancellation notice from the customer. If we determine that any previously awarded work is no longer probable of being performed, we remove the value from our backlog based on risk. We recognize revenue from these awards as services are performed, provided we have entered into a contractual commitment with the customer. The primary changes made to our net new business awards and backlog policy related to reducing the commencement date requirement from twelve months to six months and only recording one year’s worth of an FSP award. These adjustments resulted in a reduction to our backlog of approximately $284.5 million as of September 30, 2017. We have recorded the backlog assumed in the Merger consistently with our new backlog policy.
We do not currently report new business awards or backlog data for our Commercial Solutions segment. Accordingly, all disclosures related to net new service awards and backlog pertain solely to our Clinical Solutions segment.
Our Clinical Solutions backlog consists of anticipated future net service revenue from business awards that have not started but are anticipated to begin in the future, or that are in process and have not been completed. Our backlog also reflects any cancellation or adjustment activity related to these contracts. The average duration of our contracts will fluctuate from period to period in the future based on the contracts
17
comprising our backlog at any given time. The majority of our Clinical Solutions segment contracts can be terminated by the customer with a 30-day notice.
As adjusted for the policy changes discussed above, our new business awards, net of award cancellations, for the years ended December 31, 2017, 2016, and 2015 were $1.82 billion, $1.22 billion, and $1.11 billion, respectively. Additionally, as of December 31, 2017 and 2016, our backlog was $3.80 billion and $1.88 billion, respectively, with prior years adjusted to conform to the policy changes discussed above. Included in our Clinical Solutions backlog at December 31, 2017 is $1.51 billion of backlog assumed in the Merger. We expect approximately $1.88 billion of our Clinical Solutions backlog at December 31, 2017 will be recognized as revenue in 2018, with the remainder expected to be recorded as revenue beyond 2018.
We believe that our backlog and net new business awards might not be consistent indicators of future revenue because they have been, and likely will be, affected by a number of factors, including the variable size and duration of projects, many of which are performed over several years, and cancellations and changes to the scope of work during the course of projects. Additionally, projects may be canceled or delayed by the customer or regulatory authorities. Projects that have been delayed for less than six months generally remain in backlog, but the anticipated timing of the recognition of revenue is uncertain. We generally do not have a contractual right to the full amount of the awards reflected in our backlog. If a customer cancels an award, we might be reimbursed for the costs we have incurred. As we increasingly compete for and enter into large contracts that are more global in nature, we expect that the rate at which our backlog and net new business awards convert into revenue is likely to decrease, and the duration of projects and the period over which related revenue is recognized is likely to increase. No assurance can be given that we will be able to realize the net service revenue that is included in the backlog. See Part I, Item 1A, "Risk Factors - Risks Related to Our Business - Our Clinical Solutions backlog might not be indicative of our future revenues, and we might not realize all the anticipated future revenue reflected in our backlog," and Part II, Item 7, "Management's Discussion and Analysis of Financial Condition and Results of Operations - New Business Awards and Backlog" of this Annual Report on Form 10-K for more information.
Sales and Marketing
We employ a team of business development sales representatives and support staff that promote, market and sell our services to biopharmaceutical companies. In addition to significant selling experience, many of these individuals have technical and/or scientific backgrounds.
Our business development team works with our senior executives, therapeutic and commercial leaders and project team leaders to maintain key customer relationships and engage in business development activities. For many of our largest customer relationships, we have dedicated strategic account management teams to provide customers with a single point of contact to support delivery, cultural and process integration and to facilitate cross-selling opportunities.
We use integrated and customer-focused business development teams to develop joint sales plans for key accounts. We also place our business development personnel with strong operational experience around the globe to help ensure project demands are fulfilled. Each business development employee is generally responsible for a specific group of customers and for strengthening and expanding an effective relationship with that customer. Each individual is responsible for developing his or her customer base on our behalf, responding to customer requests for information, developing and defending proposals, and making presentations to customers.
As part of each customer proposal, our business development personnel consult with potential biopharmaceutical customers early in the project consideration stage in order to determine their requirements. We involve our therapeutic, operational, technical and/or scientific personnel early in each proposal and, accordingly, these individuals along with our business development representatives invest significant time to determine the optimal means to design and execute the potential customer's program requirements. As an example, recommendations we make to a potential customer with respect to a drug development study or commercial launch strategy design and implementation are an integral part of our bid proposal process and an important aspect of the integrated services we offer. Our preliminary efforts relating to the evaluation of a
18
proposed clinical or commercial solution, along with the therapeutic, operational, and technical expertise and advice we provide during this process, enhance the opportunity for accelerated initiation and overall success of the partnership and work.
To drive brand awareness and positioning, our marketing team supports our business development organization through various marketing activities consisting primarily of market and competitive analysis, brand management, market information and collateral development, participation in industry conferences, content-driven thought leadership advertising, e-marketing, publications, and website development and maintenance.
As part of the Syneos Health brand launch, a significant investment has been made to carve out a differentiated positioning based on our unique Biopharmaceutical Acceleration Model where clinical insights inform commercialization and commercial insights inform clinical trial design. From our brand identity that delivers on our ability to “sync” clinical and commercial solutions, to our proprietary tagline, “Shortening the Distance from Lab to Life™,” to curated customer content including commercialization trends impacting real-time outsourcing solutions, all marketing efforts are delivered through multi-channel platforms to reach the right customers at the right time. Over time and with enhanced education and reinforcement, we are confident that brand recognition and our unique value proposition will position us as a preferred strategic outsourcing partner.
Competition
We operate in highly competitive industries. Our competitors include a variety of companies providing services to the biopharmaceutical industry, including large and smaller specialty CROs, large global communications holding companies, smaller specialized communications agencies, and a wide range of consulting companies. Each of our reportable segments faces distinct competitors within the markets they serve.
Clinical Solutions
Our Clinical Solutions segment competes primarily against other full-service CROs and services provided by in-house R&D departments of biopharmaceutical companies, universities and teaching hospitals. Although the CRO industry has experienced increased consolidation over the past three years, the landscape remains fragmented. Our major competitors include ICON plc, IQVIA (formerly Quintiles IMS Holdings, Inc.), Laboratory Corporation of America Holdings (formerly Covance, Inc.), Medpace Holdings, Inc., PAREXEL International Corporation, Pharmaceutical Product Development, LLC, PRA Health Sciences, Inc., and numerous specialty and regional players. We generally compete on the basis of the following factors:
• | experience within specific therapeutic areas; |
• | the quality of staff and services; |
• | the range of services provided; |
• | the ability to recruit principal investigators and patients into studies expeditiously; |
• | the ability to organize and manage large-scale, global clinical trials; |
• | an international presence with strategically located facilities; |
• | medical database management capabilities; |
• | the ability to deploy and integrate IT systems to improve the efficiency of contract research; |
• | experience with a particular customer; |
• | the ability to form strategic partnerships; |
• | speed to completion; |
• | financial strength and stability; |
• | price; and |
19
• | overall value. |
Commercial Solutions
Our Commercial Solutions segment's largest competitors in the outsourced sales market are Ashfield (UDG Healthcare PLC), IQVIA, and Publicis Touchpoint Solutions, Inc. Our primary competitors in the communications market are large global communications holding companies such as: Havas SA, Omnicom Group Inc., Publicis Groupe S.A., The Interpublic Group of Companies, Inc., and WPP Group plc. Our consulting services’ competitors include IQVIA, L.E.K. Consulting LLC, McKinsey & Company, Inc., and ZS Associates, Inc. We also compete in our addressable market with the internal operations of biopharmaceutical companies that choose to perform the clinical development and commercialization tasks we provide internally. We generally compete on the basis of the following factors:
• | experience within the specific therapeutic area; |
• | quality of the staff and services; |
• | creativity of the proposed solution; |
• | perceived "chemistry" with the staff to be deployed; |
• | previous experience with a particular customer; |
• | price; and |
• | overall value. |
Notwithstanding these competitive factors, we believe that our deep therapeutic expertise, global reach and operational strengths differentiate us from our competitors across both of our segments.
Government Regulation
The biopharmaceutical industry is subject to a high degree of governmental regulation in both domestic and international markets. Regardless of the country or region in which approval is being sought, before a marketing application for a drug is ready for submission to regulatory authorities, the candidate drug must undergo rigorous testing in clinical trials. The clinical trial process must be conducted in accordance with the Federal Food, Drug and Cosmetic Act in the United States and similar laws and regulations in the relevant foreign jurisdictions. These laws and regulations require the drug to be tested and studied in certain ways prior to submission for approval.
Regulation of Our Clinical Solutions Segment
In the United States, the FDA regulates the conduct of clinical trials of drug products in human subjects, and the form and content of regulatory applications. The FDA also regulates the development, approval, manufacture, safety, labeling, storage, record keeping, and marketing of drug products. The FDA has similar authority and similar requirements with respect to the clinical testing of biological products and medical devices. In the EU and other jurisdictions where our customers intend to apply for marketing authorization, similar laws and regulations apply. Within the EU, these requirements are enforced by the EMA, and requirements vary slightly from one member state to another. In Canada, clinical trials are regulated by the Health Products Food Branch of Health Canada as well as provincial regulations. Similar requirements also apply in other jurisdictions, including Australia, Japan, and other Asian countries, where we operate or where our customers intend to apply for marketing authorization. Sponsors of clinical trials also follow the ICH GCP guidelines. An addendum to the ICH GCP Guidelines was adopted by the ICH committee in November 2016 and will now be implemented through national and regional guidance in ICH member states. The changes aim to encourage sponsors to implement improved oversight and management of clinical trials, utilizing a Quality Risk Management approach while continuing to ensure protection of human subjects participating in trials and clinical trial data integrity.
20
Our services are subject to various regulatory requirements designed to ensure the quality and integrity of the clinical trial process. In the United States, we must perform our clinical development services in compliance with applicable laws, rules and regulations, including GCP, which govern, among other things, the design, conduct, performance, monitoring, auditing, recording, analysis, and reporting of clinical trials. Before a human clinical trial may begin, the manufacturer or sponsor of the clinical product candidate must file an investigational new drug application ("IND") with the FDA, which contains, among other things, the results of preclinical tests, manufacturer information, and other analytical data. A separate submission to an existing IND must also be made for each successive clinical trial conducted during product development. Each clinical trial must be conducted pursuant to, and in accordance with, an effective IND. In addition, under GCP, each human clinical trial we conduct is subject to the oversight of an independent institutional review board ("IRB") which is an independent committee that has the regulatory authority to review, approve and monitor a clinical trial. The FDA, the IRB, or the sponsor may suspend or terminate a clinical trial at any time on various grounds, including a finding that the study subjects are being exposed to an unacceptable health risk.
Clinical trials conducted outside the United States are subject to the laws and regulations of the country where the trials are conducted. These laws and regulations might not be similar to the laws and regulations administered by the FDA and other laws and regulations regarding the protection of patient safety and privacy and the control of study pharmaceuticals, medical devices or other study materials. Studies conducted outside the United States can also be subject to regulation by the FDA if the studies are conducted pursuant to an IND or an investigational device exemption for a product candidate that will seek FDA approval or clearance. It is the responsibility of the study sponsor or the parties conducting the studies to ensure that all applicable legal and regulatory requirements are fulfilled.
In order to comply with GCP and other regulations, we must, among other things:
• | comply with specific requirements governing the selection of qualified principal investigators and clinical research sites; |
• | obtain specific written commitments from principal investigators; |
• | obtain review, approval and supervision of the clinical trials by an IRB or ethics committee; |
• | obtain favorable opinion from regulatory agencies to commence a clinical trial; |
• | verify that appropriate patient informed consents are obtained before the patient participates in a clinical trial; |
• | ensure that adverse drug reactions resulting from the administration of a drug or biologic during a clinical trial are medically evaluated and reported in a timely manner; |
• | monitor the validity and accuracy of data; |
• | monitor drug or biologic accountability at clinical research sites; and |
• | verify that principal investigators and study staff maintain records and reports and permit appropriate governmental authorities access to data for review. |
Similar guidelines exist in various states and in other countries. We may be subject to regulatory action if we fail to comply with applicable rules and regulations. Failure to comply with certain regulations can also result in the termination of ongoing research and disqualification of data collected during the clinical trials. For example, violations of GCP could result, depending on the nature of the violation and the type of product involved, in the issuance of a warning letter, suspension or termination of a clinical study, refusal of the FDA to approve clinical trial or marketing applications or withdrawal of such applications, injunction, seizure of investigational products, civil penalties, criminal prosecutions, or debarment from assisting in the submission of new drug applications. See Part I, Item 1A, "Risk Factors—Risks Related to Our Business—If we fail to perform our services in accordance with contractual requirements, regulatory standards and ethical considerations, we could be subject to significant costs or liability and our reputation could be harmed" in this Annual Report on Form 10-K.
We monitor our clinical trials to test for compliance with applicable laws and regulations in the United States and the foreign jurisdictions in which we operate. We have adopted standard operating procedures that are
21
designed to satisfy regulatory requirements and serve as a mechanism for controlling and enhancing the quality of our clinical trials. In the United States, our procedures were developed to ensure compliance with GCP and associated guidelines.
In addition to its comprehensive regulation of safety in the workplace, the U.S. Occupational Safety and Health Administration has established extensive requirements relating to workplace safety for healthcare employers whose workers might be exposed to blood-borne pathogens such as HIV and the hepatitis B virus. Furthermore, certain employees might have to receive initial and periodic training to ensure compliance with applicable hazardous materials regulations and health and safety guidelines. We are subject to similar regulations in Canada and Spain.
Regulation of Our Commercial Solutions Segment
Our field personnel are subject to all laws, rules and regulations governing the promotion of pharmaceutical products in the United States and in every other country where such personnel performs work. In particular, these rules and regulations include limitations on the indications for which a product may be promoted and on promotional spending. Violations of these rules may leave us at risk of direct regulatory enforcement action and/or cause us to be in breach of contract with our customers.
Some of our field personnel handle and distribute samples of pharmaceutical products. In the United States, the handling and distribution of prescription drug products are subject to regulation under the Prescription Drug Marketing Act and other applicable federal, state and local laws and regulations and other countries may have similar laws or regulations. These laws and regulations regulate the distribution of drug samples by mandating procedures for storage and record-keeping requirements for drug samples and ban the purchase or sale of drug samples. Further, companies holding or distributing controlled substances are subject to regulation by the U.S. Drug Enforcement Agency.
Our communications solutions offerings are subject to all regulatory risks applicable to similar communications businesses as well as risks that relate specifically to the provision of these services to the biopharmaceutical industry. Such regulatory risks include enforcement by the FDA, Health Canada, the Department of Health in the United Kingdom, EMA and the Federal Trade Commission as well as state agencies and other foreign regulators enforcing laws relating to product advertising, false advertising, and unfair and deceptive trade practices. In addition to enforcement actions initiated by government agencies, there has been an increasing tendency in the United States among biopharmaceutical companies to resort to the courts and industry and self-regulatory bodies to challenge comparative prescription drug advertising on the grounds that the advertising is false and deceptive. There continues to be an expansion of specific rules, prohibitions, media restrictions, labeling disclosures and warning requirements with respect to the advertising for certain products.
Regulation of Patient Information
The confidentiality of patient-specific information and records and the circumstances under which such patient-specific information and records may be released for inclusion in our databases or used in other aspects of our business are heavily regulated. The U.S. Department of Health and Human Services has promulgated rules under the Health Information Technology for Economic and Clinical Health Act in connection with the application of security and privacy provisions under the Health Information Portability and Accountability Act (collectively, "HIPAA"). These regulations govern the use, handling and disclosure of personally identifiable medical information and require the use of standard transactions, privacy and security standards and other administrative simplification provisions by covered entities, which include many healthcare providers, health plans, and healthcare clearinghouses. Although we do not consider that our business activities generally cause us to be subject to HIPAA as a directly covered entity, we endeavor to embrace sound identity protection practices. These regulations also establish procedures for the exercise of an individual's rights and the methods permissible for de-identification of health information. We are also subject to privacy legislation in Canada under the federal Personal Information and Electronic Documents Act, the Act Respecting the Protection of Personal Information in the Private Sector and the Personal Health Information Protection Act, and privacy legislation in the EU under the 95/46/EC Privacy Directive on the protection and free movement of personal data.
22
Intellectual Property
We develop and use a number of proprietary methodologies, analytics, systems, technologies and other intellectual property in the conduct of our business. We rely upon a combination of confidentiality policies, nondisclosure agreements and other contractual arrangements to protect our trade secrets, and copyright and trademark laws to protect other intellectual property rights. We have obtained or applied for trademarks and copyright protection in the United States and in a number of foreign countries. Our material trademarks include Trusted Process®, PlanActivation®, QuickStart®, ProgramAccelerate®, QualityFinish®, "Shortening the distance from lab to life™, Syneos Health, Inc., and other corporate emblems. Although the duration of trademark registrations varies from country to country, trademarks generally may be renewed indefinitely so long as they are in use and/or their registrations are properly maintained, and so long as they have not been found to have become generic. Although we believe the ownership of trademarks is an important factor in our business and that our success does depend in part on the ownership thereof, we rely primarily on the innovative skills, technical competence and marketing abilities of our employees. We do not have any material licenses, franchises or concessions.
Employees
The level of competition among employers in the United States and overseas for skilled personnel is high. We believe that our brand recognition and our multinational presence are advantages in attracting qualified candidates. As of December 31, 2017, we had approximately 21,000 employees worldwide, with approximately 58% located in the United States and Canada, 22% in Europe, 16% in Asia-Pacific, 3% in Latin America and 1% in the Middle East and Africa. The majority of our employees are employed on a full-time basis. None of our employees are covered by a collective bargaining agreement and we believe our overall relations with our employees are good. Employees in certain of our non-U.S. locations are represented by workers' councils as required by local laws.
Indemnification and Insurance
In conjunction with our Clinical Solutions services, we employ or contract with research institutions and, in some jurisdictions, principal investigators and pharmacies on behalf of biopharmaceutical companies to serve as research centers and principal investigators in conducting clinical trials to test new drugs on human volunteers. Such testing creates the risk of liability for personal injury or death of volunteers, particularly to volunteers with life-threatening illnesses, resulting from adverse reactions to the drugs administered. It is possible that we could be held liable for claims and expenses arising from any professional malpractice of the principal investigators with whom we contract or engage, or in the event of personal injury to or death of persons participating in clinical trials. In addition, as a result of our operation of Phase I clinical trial facilities, we could be liable for the general risks associated with clinical trials including, but not limited to, adverse events resulting from the administration of drugs to clinical trial participants or the professional malpractice of medical care providers. We also could be held liable for errors or omissions in connection with the services we perform through each of our service groups. For example, we could be held liable for errors, omissions, or breach of contract, if monitoring obligations have been transferred to us and one of our CRA's inaccurately reports from source documents or fails to adequately monitor a human clinical trial resulting in inaccurately recorded results.
We have sought to reduce our risks by implementing the following where practicable:
• | securing contractual assurances such as indemnification provisions and provisions seeking to limit or exclude liability contained in our contracts with customers, institutions, pharmacies, vendors and principal investigators; |
• | securing contractual and other assurances that adequate insurance will be maintained to the extent applicable by customers, institutions, pharmacies, vendors, principal investigators and us; and |
23
• | complying with various regulatory requirements, including monitoring that the oversight of independent review boards and ethics committees are intact where obligations are transferred to us and monitoring the oversight of the procurement by the principal investigator of each participant's informed consent to participate in the study. |
Our contractual indemnifications generally do not fully protect us against certain of our own actions, such as negligence. Contractual arrangements are subject to negotiation with customers, and the terms and scope of any indemnification, limitation of liability or exclusion of liability varies from customer to customer and from trial to trial. Additionally, financial performance of these indemnities is not secured. Therefore, we bear the risk that any indemnifying party against which we have claims may not have the financial ability to fulfill its indemnification obligations to us.
While we maintain a global insurance program including professional liability and other types of insurance standard to our industry to cover our liability while conducting our business activities and contracted services, including drug safety issues as well as data processing and other errors and omissions, it is possible that we could become subject to claims not covered by insurance or that exceed our coverage limits. We could be materially and adversely affected if we were required to pay damages or bear the costs of defending any claim that is outside the scope of, or in excess of, a contractual indemnification provision, beyond the level of insurance coverage or not covered by insurance, or in the event that an indemnifying party does not fulfill its indemnification obligations.
Executive Officers
The following table sets forth information concerning our executive officers as of December 31, 2017:
Name | Age | Position | ||
Alistair Macdonald | 47 | Chief Executive Officer and Director | ||
Jason Meggs | 42 | Executive Vice President and Interim Chief Financial Officer | ||
Gregory S. Rush | 50 | Former Executive Vice President and Chief Financial Officer | ||
Christopher L. Gaenzle | 51 | Former Chief Administrative Officer, General Counsel and Secretary | ||
The following is a biographical summary of the experience of our executive officers:
Alistair Macdonald - Chief Executive Officer and Director
Alistair Macdonald has been our Chief Executive Officer ("CEO") and a member of our Company's Board of Directors (the "Board") since October 2016. He joined our Company in May 2002 and has served in various senior leadership roles during that time. Prior to his current role, Mr. Macdonald most recently served as President and Chief Operating Officer from January 2015 to September 2016 and Chief Operating Officer from January 2013 to January 2015. He also served as our President, Clinical Development Services from March 2012 to January 2013, Executive Vice President of our Global Oncology Unit from February 2011 to March 2012, Executive Vice President, Strategic Development from October 2009 to February 2011, and Senior Vice President, Biometrics from May 2002 to September 2009. He received his Master of Science in Environmental Diagnostics from Cranfield University.
Jason Meggs - Executive Vice President and Interim Chief Financial Officer
Jason Meggs was appointed Executive Vice President and Interim Chief Financial Officer ("CFO") on February 21, 2018. Prior to his appointment to this role, he served as Executive Vice President and CFO of the Commercial Solutions segment of the Company beginning in August 2017. He also previously served as Executive Vice President, Oncology Operations at the Company from January 2017 to August 2017 and Senior Vice President, Business Finance with the Company from 2014 to 2016. Prior to joining the Company, Mr. Meggs was Global Vice President, Internal Audit, at Quintiles Transnational Corporation from 2013 to 2014 and held a number of finance roles at Quintiles from 2005 to 2013. He began his career as an auditor with Deloitte & Touche LLP and Arthur Anderson LLP, and is a certified public accountant. He received his
24
Bachelor of Science in Business Administration degree with a Major in Accounting from Western Carolina University.
Gregory S. Rush - Former Executive Vice President and Chief Financial Officer
Greg Rush joined our Company in August 2013 as Executive Vice President and Chief Financial Officer ("CFO"). From April 2010 to August 2013, Mr. Rush served as Senior Vice President and Chief Financial Officer of Tekelec, Inc., which was acquired by Oracle Corporation in June 2013, after serving as Interim Chief Financial Officer beginning in March 2010. Mr. Rush joined Tekelec as Vice President and Corporate Controller in May 2005 and served as Vice President, Corporate Controller and Chief Accounting Officer from May 2006 to March 2010. His previous experience also includes roles in various senior financial positions with Siebel Systems, Inc., Quintiles, PricewaterhouseCoopers and Ernst & Young. Mr. Rush received his Bachelor of Science in Business and Master of Accounting degrees from the University of North Carolina at Chapel Hill, graduating with honors, and is a Certified Public Accountant. As disclosed in a Form 8-K filing on February 21, 2018, Mr. Rush stepped down as CFO of the Company and ceased to be an executive officer, he will remain an employee of the Company through April 30, 2018.
Christopher L. Gaenzle - Former Chief Administrative Officer, General Counsel, and Secretary
Chris Gaenzle joined our Company in April 2012 as General Counsel and Secretary. Since August 2013, he has also served as our Chief Administrative Officer. Prior to joining our Company, Mr. Gaenzle served for five years in various senior legal positions at Pfizer Inc., where he was most recently Assistant General Counsel from 2010 to 2012. Prior to Pfizer, Mr. Gaenzle was a partner at Hunton and Williams LLP, where he was a practicing attorney from 1998 to 2007. Mr. Gaenzle has 20 years of private practice and corporate legal experience, the majority of which is in the pharmaceutical, medical and clinical research industries. Mr. Gaenzle received his Bachelor of Arts from Colgate University and his J.D. from Syracuse University. As disclosed in a Form 8-K filing on February 21, 2018, Mr. Gaenzle stepped down as Chief Administrative Officer, General Counsel, and Secretary of the Company and ceased to be an executive officer as of February 19, 2018, he will remain an employee of the Company through April 15, 2018.
Available Information
Our website address is syneoshealth.com. Information on our website is not incorporated by reference herein. Copies of our annual reports on Form 10-K, quarterly reports on Form 10-Q, current reports on Form 8-K and our proxy statements for our annual stockholders meetings, and any amendments to those reports, as well as Section 16 reports filed by our insiders, are available free of charge on our website as soon as reasonably practicable after we file the reports with, or furnish the reports to, the Securities and Exchange Commission (the "SEC"). Our SEC filings are also available for reading and copying at the SEC’s Public Reference Room at 100 F Street, NE, Washington, D.C. 20549. Information on the operation of the Public Reference Room may be obtained by calling the SEC at 1-800-SEC-0330. In addition, the SEC maintains an Internet site (http://www.sec.gov) containing reports, proxy and information statements, and other information regarding issuers that file electronically with the SEC.
25
Item 1A. Risk Factors.
We operate in a rapidly changing environment that involves a number of risks, some of which are beyond our control. In evaluating our company, you should consider carefully the risks and uncertainties described below together with the other information included in this Annual Report on Form 10-K, including our consolidated financial statements and related notes included in Part II, Item 8, "Financial Statements and Supplementary Data" in this Annual Report on Form 10-K. The occurrence of any of the following risks may materially and adversely affect our business, financial condition, results of operations and future prospects.
Risks Related to Our Business
If we do not generate a large number of new business awards, or if new business awards are delayed, terminated, reduced in scope or fail to go to contract, our business, financial condition, results of operations, or cash flows may be materially adversely affected.
Our business is dependent on our ability to generate new business awards from new and existing customers and maintain existing customer contracts. Our inability to generate new business awards on a timely basis and subsequently enter into contracts for such awards could have a material adverse effect on our business, financial condition, results of operations or cash flows.
There is risk of cancelability in both the clinical and commercial businesses. The time between when a clinical study is awarded and when it goes to contract is typically several months, and prior to a new business award going to contract, our customer can cancel the award without notice. Once an award goes to contract, the majority of our customers can terminate the contract with little notice, in many cases 30 days or less. Our contracts may be delayed or terminated by our customers or reduced in scope for a variety of reasons beyond our control, including but not limited to:
• | decisions to forego or terminate a particular trial; |
• | budgetary limits or changing priorities; |
• | actions by regulatory authorities; |
• | production problems resulting in shortages of the drug being tested; |
• | failure of products being tested to satisfy safety requirements or efficacy criteria; |
• | unexpected or undesired clinical results for products; |
• | insufficient patient enrollment in a trial; |
• | insufficient principal investigator recruitment; |
• | production problems resulting in shortages of the product being tested; |
• | the customers’ decision to terminate or scale back the development or commercialization of a product or to end a particular project; |
• | shift of business to a competitor or internal resources; or |
• | product withdrawal following market launch. |
Our commercial services contracts typically have a significantly shorter wind down period than clinical contracts, particularly within our selling solutions offerings. Furthermore, many of our communications services and consulting services projects are tied to a customer’s annual marketing budget or ad hoc service requests, which can lead to seasonal variability in revenue and less predictability in future revenues. In addition, many of our biopharmaceutical selling solutions service contracts provide our customers with the opportunity to internalize the resources provided under the contract and terminate all or a portion of the services we provide under the contract. Our customers may also decide to shift their business to a competitor. Each of these factors results in less visibility to future revenues and higher volatility in future revenues.
Contract terminations, delays and modifications are a regular part of our business across each of our segments. For example, our full-service offering within our Clinical Solutions business has been, and may continue to be, negatively impacted by project delays, which impact near term revenue disproportionately. In
26
addition, project delays, downsizings and cancellations, particularly within our selling solutions and communications offerings, which are part of our Commercial Solutions business, have impacted our results in the past and might impact them in the future. The loss, reduction in scope or delay of a large project or of multiple projects could have a material adverse effect on our business, results of operations and financial condition. In addition, we might not realize the full benefits of our backlog if our customers cancel, delay or reduce their commitments to us.
In the event of termination, our contracts often provide for fees for winding down the project, which include both fees incurred and actual and non-cancellable expenditures and may include a fee to cover a percentage of the remaining professional fees on the project. These fees might not be sufficient for us to maintain our margins, and termination may result in lower resource utilization rates and therefore lower operating margins. In addition, cancellation of a contract or project for the reasons noted above may result in the unwillingness or inability of our customer to satisfy its existing obligations to us such as payments of accounts receivable, which may in turn result in a material impact to our results of operations and cash flow. Historically, cancellations and delays have negatively impacted our operating results, and they might again. In addition, we might not realize the full benefits of our backlog if our customers cancel, delay or reduce their commitments to us, which may occur if, among other things, a customer decides to shift its business to a competitor or revoke our status as a preferred provider. Thus, the loss or delay of a large business award or the loss or delay of multiple awards could adversely affect our service revenues and profitability. Additionally, a change in the timing of a new business award could affect the period over which we recognize revenue and reduce our revenue in any one quarter.
Our Clinical Solutions backlog might not be indicative of our future revenues, and we might not realize all of the anticipated future revenue reflected in our backlog.
Our Clinical Solutions backlog consists of anticipated net service revenue awarded from contract and pre-contract commitments that are supported by written communications. Once work begins on a project, revenue is recognized over the duration of the project, provided the award has gone to contract. Projects may be canceled or delayed by the customer or delayed by regulatory authorities for reasons beyond our control. To the extent projects are delayed, the timing of our revenue could be adversely affected. In addition, if a customer terminates a contract, we typically would be entitled to receive payment for all services performed up to the termination date and subsequent customer-authorized services related to terminating the canceled project. Typically, however, we have no contractual right to the full amount of the future revenue reflected in our Clinical Solutions backlog in the event of a contract termination or subsequent changes in scope that reduce the value of the contract. The duration of the projects included in our Clinical Solutions backlog, and the related revenue recognition, typically range from a few months to several years. Our Clinical Solutions backlog might not be indicative of our future revenues, and we might not realize all the anticipated future revenue reflected in that backlog. A number of factors may affect backlog, including:
• | the size, complexity and duration of projects or strategic relationships; |
• | the cancellation or delay of projects; |
• | the failure of one or more business awards to go to contract; and |
• | changes in the scope of work during the course of projects. |
The rate at which our Clinical Solutions backlog converts to revenue may vary over time. The revenue recognition on larger, more global projects could be slower than on smaller, more regional projects for a variety of reasons, including, but not limited to, an extended period of negotiation between the time the project is awarded to us and the actual execution of the contract, as well as an increased time frame for obtaining the necessary regulatory approvals.
Our Clinical Solutions backlog at December 31, 2017 was $3.80 billion. Although an increase in Clinical Solutions backlog will generally result in an increase in revenues over time, an increase in backlog at a particular point in time does not necessarily correspond directly to an increase in revenues during any particular period, or at all. The extent to which contracts in Clinical Solutions backlog will result in revenue depends on many factors, including, but not limited to, delivery against project schedules, scope changes, contract terminations and the nature, duration and complexity of the contracts, and can vary significantly over time. Subsequent to the August 2017 Merger with inVentiv, our Clinical Solutions segment represents only a
27
portion of our overall business resulting in our reported backlog becoming less meaningful as an indicator of our future total revenues.
We do not currently report new business awards or backlog data for our Commercial Solutions segment.
Failure to adopt the new accounting standard of recognizing revenue from contracts with customers in a timely manner could cause our business, financial condition, results of operations or cash flows to be materially adversely affected.
Effective January 1, 2018, the Company is required to adopt the Financial Accounting Standards Board ("FASB") Accounting Standards Update ("ASU") No. 2014-09, Revenue from Contracts with Customers, the new comprehensive accounting standard for recognizing revenue from contracts with customers. If the Company is unable to accurately and efficiently adopt the new standard effective on January 1, 2018, is unable to adopt the new standard for the combined company after the Merger, is unable to get its information systems and processes in place to facilitate compliance, or is unable to effectively communicate the changes in revenue recognition policy to investors, the Company may lose investor confidence, its ability to raise capital, and/or its business, financial condition, results of operations or cash flows may be materially adversely affected. See "Note 1 - Basis of Presentation and Changes in Significant Accounting Policies" to the consolidated financial statements in Part II, Item 8, "Financial Statements and Supplementary Data” in this Annual Report on Form 10-K for further information regarding ASU 2014-09.
Our operating results have historically fluctuated between fiscal quarters and may continue to fluctuate in the future, which may adversely affect the market price of our stock.
Our operating results have fluctuated in previous quarters and years and may continue to vary significantly from quarter to quarter and are influenced by a variety of factors, such as:
• | timing of contract amendments for changes in scope that could affect the value of a contract and potentially impact the amount of net new business awards and net service revenues from quarter to quarter; |
• | commencement, completion, execution, postponement or termination of large contracts; |
• | contract terms for the recognition of revenue milestones; |
• | progress of ongoing contracts and retention of customers; |
• | timing of and charges associated with completion of acquisitions, integration of acquired businesses, and other events; |
• | changes in the mix of services delivered, both in terms of geography and type of services; |
• | potential customer disputes, penalties or other issues that may impact the revenue we are able to recognize or the collectability of our related accounts receivable; and |
• | exchange rate fluctuations. |
Our operating results for any particular quarter are not necessarily a meaningful indicator of future results and fluctuations in our quarterly operating results could negatively affect the market price and liquidity of our stock.
If we underprice our contracts, overrun our cost estimates or fail to receive approval for or experience delays in documentation of change orders, our business, financial condition, results of operations or cash flows may be materially adversely affected.
We price our contracts based on assumptions regarding the scope of work required and cost to complete the work. We bear the financial risk if we initially underprice our contracts or otherwise overrun our cost estimates, which could adversely affect our cash flows and financial performance. In addition, contracts with our customers are subject to change orders, which occur when the scope of work we perform needs to be modified from that originally contemplated in our contract with the customers. This can occur, for example, when there is a change in a key study assumption or parameter or a significant change in timing. We may be unable to successfully negotiate changes in scope or change orders on a timely basis or at all, which could require us to incur cost outlays ahead of the receipt of any additional revenue. In addition, under generally accepted accounting principles in the United States of America ("GAAP") we cannot recognize additional
28
revenue anticipated from change orders until appropriate documentation is received by us from the customer authorizing the change. However, if we incur additional expense in anticipation of receipt of that documentation, we must recognize the expense as incurred. Any of the foregoing could have a material adverse effect on our business, financial condition, results of operations or cash flows.
Our business depends on the continued effectiveness and availability of our information systems, including the information systems we use to provide services to our customers and to store employee data, and failures of these systems, including cyber-attacks, may materially limit our operations or have an adverse effect on our reputation.
Our information systems are comprised of systems we have purchased or developed, legacy information systems from organizations we have acquired, including inVentiv and, increasingly, web-enabled and other integrated information systems. In using these information systems, we frequently rely on third-party vendors to provide hosting services, where our infrastructure is dependent upon the reliability of their underlying platforms, facilities and communications systems. We also utilize integrated information systems that we provide customers access to or install for our customers in conjunction with our delivery of services.
As the breadth and complexity of our information systems continue to grow, we will increasingly be exposed to the risks inherent in maintaining the stability of our legacy systems due to prior customization, attrition of employees or vendors involved in their development, and obsolescence of the underlying technology as well as risks from the increasing number and scope of external data breaches on multi-national companies. In addition, during 2017 we began a major integration of the legacy inVentiv financial and operational systems to our financial and operating systems. Please refer to the risk factor “Upgrading the information systems that support our operating processes and evolving the technology platform for our services pose risks to our business” below for additional risk related to integrating information technology systems and processes. Because certain customers, clinical trials, and other long-term projects depend upon these legacy systems, we also face an increased level of embedded risk in maintaining the legacy systems and limited options to mitigate such risk. We are also exposed to risks associated with the availability of all our information systems, including:
• | disruption, impairment or failure of data centers, telecommunications facilities or other key infrastructure platforms, including those maintained by our third-party vendors; |
• | security breaches of, cyber-attacks on and other failures or malfunctions in our internal systems, including our employee data and communications, critical application systems or their associated hardware; and |
• | excessive costs, excessive delays or other deficiencies in systems development and deployment. |
The materialization of any of these risks may impede the processing of data, the delivery of databases and services, and the day-to-day management of our business and could result in the corruption, loss or unauthorized disclosure of proprietary, confidential or other data. While we have disaster recovery plans in place, they might not adequately protect us in the event of a system failure. Despite any precautions we take, damage from fire, floods, hurricanes, power loss, telecommunications failures, computer viruses, break-ins and similar events at our various computer facilities or those of our third-party vendors could result in interruptions in the flow of data to us and from us to our customers. Corruption or loss of data may result in the need to repeat a project at no cost to the customer, but at significant cost to us, the termination of a contract or damage to our reputation. Additionally, significant delays in system enhancements or inadequate performance of new or upgraded systems once completed could damage our reputation and harm our business. Finally, long-term disruptions in the infrastructure caused by events such as natural disasters, the outbreak of war, the escalation of hostilities and acts of terrorism, particularly involving cities in which we have offices, and cyber-attacks such as those recently faced by other multi-national companies could adversely affect our businesses. As our business continues to expand globally, these types of risks may be further increased by instability in the geopolitical climate of certain regions, underdeveloped and less stable utilities and communications infrastructure, and other local and regional factors. Although we carry property and business interruption insurance that we believe is customary for our industry, our coverage might not be adequate to compensate us for all losses that may occur.
29
Unauthorized disclosure of sensitive or confidential data, whether through systems failure or employee actions, cyber-attacks, fraud or misappropriation, could damage our reputation and cause us to lose customers. Similarly, we have been and expect that we will continue to be subject to attempts to gain unauthorized access to or through our information systems or those we internally or externally develop for our customers, including a cyber-attack by computer programmers and hackers who may develop and deploy viruses, worms or other malicious software programs, process breakdowns, denial-of-service attacks, malicious social engineering or other malicious activities, or any combination of the foregoing. In addition, we may be susceptible to physical or computer-based attacks by terrorists or hackers due to our role in the biopharmaceutical service industry. These concerns about security are increased when information is transmitted over the Internet. Threats include cyber-attacks such as computer viruses, worms or other destructive or disruptive software, and any of these could result in a degradation or disruption of our services or damage to our properties, equipment and data. They could also compromise data security, including the security of personal data. If such attacks are not detected immediately, their effect could be compounded. To date these attacks have not had a material impact on our operations or financial results. However, successful attacks in the future could result in negative publicity, significant remediation and recovery costs, legal liability and damage to our reputation and could have a material adverse effect on our financial condition, results of operations and cash flows. In addition, our liability insurance might not be sufficient in type or amount to cover us against claims related to security breaches, cyber-attacks and other related breaches.
Additionally, we rely on service providers for the timely transmission of information across our global data network. If a service provider fails to provide the communications capacity or services we require for similar reasons, the failure could interrupt our services. Because of the centrality of our processing systems to our business, any interruption or degradation could adversely affect the perception of our brands' reliability and harm our business. If a service provider experiences the unauthorized disclosure of sensitive or confidential data they are processing on our behalf, whether through systems failure or employee actions, cyber-attacks, fraud, or misappropriation, it could damage our reputation and cause us to lose customers. Similarly, such disclosure could result in negative publicity, significant remediation and recovery costs, legal liability and damage to our reputation, and could have a material adverse effect on our financial condition, results of operations, and cash flows. In addition, contractual indemnity, the service provider’s liability insurance and our liability insurance might not be sufficient in type or amount to cover us against claims related to security breaches, cyber-attacks, and other related breaches.
We are subject to regulation in the areas of consumer privacy and data use and security.
Privacy, data use and security continue to receive heightened legislative and regulatory focus in the United States, Europe and elsewhere. For example, in many jurisdictions victims must be notified in the event of a data breach and those jurisdictions that have these laws are continuing to increase the circumstances and the breadth of these notices. Our failure or the failure of our customers to comply with these laws and regulations could result in fines, sanctions, litigation, damages, cost for mitigation activities and damage to our global reputation and our brands.
Our customer or therapeutic area concentration may have a material adverse effect on our business, financial condition, results of operations or cash flows.
If any large customer decreases or terminates its relationship with us, our business, financial condition, results of operations or cash flows could be materially adversely affected. For the year ended December 31, 2017, our top ten customers based on revenue accounted for approximately 37% of our consolidated net service revenue and our top ten Clinical Solutions customers based on backlog accounted for approximately 39% of our total backlog. No single customer accounted for greater than 10% of our total consolidated net service revenue for the years ended December 31, 2017, 2016 or 2015. It is possible that an even greater portion of our revenues will be attributable to a smaller number of customers in the future, including as a result of our entering into strategic provider relationships with customers. Also, consolidation in our potential customer base results in increased competition for important market segments and fewer available customer accounts.
Additionally, conducting multiple clinical trials for different sponsors in a single therapeutic class involving drugs with the same or similar chemical action may adversely affect our business if some or all of the trials are canceled because of new scientific information or regulatory judgments that affect the drugs as a class. Similarly, marketing and selling products for different sponsors with similar drug action subjects us to risk if
30
new scientific information or regulatory judgment prejudices the products as a class, leading to compelled or voluntary prescription limitations or withdrawal of some or all of the products from the market.
Our business is subject to international economic, political and other risks that could have a material adverse effect on our business, financial condition, results of operations, cash flows or reputation.
We have operations in many foreign countries, including, but not limited to, countries in the Asia-Pacific region, Europe, Latin America and the Middle East and Africa. As of December 31, 2017, approximately 47% of our workforce was located outside of the United States, and for the fiscal year ended December 31, 2017, approximately 39% of our net service revenue was billed to locations outside the United States. Our international operations are subject to risks and uncertainties inherent in operating in these regions, including:
• | conducting a single project across multiple countries is complex, and issues in one country, such as a failure to comply with or unanticipated changes to local regulations or restrictions such as restrictions on import or export of clinical trial material or availability of clinical trial data may affect the progress of the trial in the other countries, resulting in delays or potential termination of contracts, which in turn may result in loss of revenue; |
• | the United States or other countries could enact legislation or impose regulations or other restrictions, including unfavorable labor regulations, tax policies, data protection regulations or economic sanctions, which could have an adverse effect on our ability to conduct business in or expatriate profits from the countries in which we operate; |
• | foreign countries are expanding or may expand their banking regulations that govern international currency transactions, particularly cross-border transfers, which may inhibit our ability to transfer funds into or within a jurisdiction, impeding our ability to pay our principal investigators, vendors and employees, thereby impacting our ability to conduct trials in such jurisdictions; |
• | foreign countries are expanding or may expand their regulatory framework with respect to patient informed consent, protection and compensation in clinical trials, or transparency reporting requirements (similar to the Physician Payments Sunshine Act in the United States), which could delay, inhibit or prohibit our ability to conduct projects in such jurisdictions; |
• | the regulatory or judicial authorities of foreign countries might not enforce legal rights and recognize business procedures in a manner in which we are accustomed or would reasonably expect; |
• | changes in political and economic conditions, including the June 2016 vote by the U.K. to exit from the European Union and the results of the U.S. presidential election, may lead to changes in the business environment in which we operate, as well as changes in inflation and foreign currency exchange rates; |
• | potential violations of applicable anti-bribery/anti-corruption laws, including the United States Foreign Corrupt Practices Act ("FCPA") and the UK Bribery Act of 2010, may cause a material adverse effect on our business, financial condition, results of operations, cash flows or reputation; |
• | customers in foreign jurisdictions may have longer payment cycles, and it may be more difficult to collect receivables in those jurisdictions; |
• | natural disasters, pandemics or international conflict, including terrorist acts, could interrupt our services, endanger our personnel or cause project delays or loss of trial materials or results; |
• | political unrest, such as the current situations in the Middle East, could delay or disrupt the ability to conduct clinical trials or other business; and |
• | foreign governments may enact currency exchange controls that may limit the ability to fund our operations or significantly increase the cost of maintaining operations. |
These risks and uncertainties could negatively impact our ability to, among other things, perform large, global projects for our customers. Furthermore, our ability to deal with these issues could be affected by applicable U.S. laws. Any such risks could have an adverse impact on our business, financial condition, results of operations, cash flows or reputation.
31
Governmental authorities may question our intercompany transfer pricing policies or change their laws in a manner that could increase our effective tax rate or otherwise harm our business.
As a U.S. company doing business in international markets through subsidiaries, we are subject to foreign tax and intercompany pricing laws, including those relating to the flow of funds between legal entities in various international jurisdictions. Tax authorities in the United States and in international markets have the right to examine our corporate structure and how we account for intercompany fund transfers. If such authorities challenge our corporate structure, transfer pricing mechanisms or intercompany transfers and the resulting assessments are upheld, our operations may be negatively impacted and our effective tax rate may increase. Tax rates vary from country to country and if a tax authority determines that our profits in one jurisdiction should be increased, we might not be able to realize the full tax benefits in the event we cannot utilize all foreign tax credits that are generated, or we do not realize a compensating offsetting adjustment in another taxing jurisdiction. The effects of either would increase our effective tax rate. Additionally, the Organization for Economic Cooperation and Development has issued certain guidelines regarding base erosion and profit shifting. As these guidelines continue to be formally adopted by separate taxing jurisdictions, we may need to change our approach to intercompany transfer pricing in order to maintain compliance under the new rules. Our effective tax rate may increase or decrease depending on the current location of global operations at the time of the change. Finally, we might not always be in compliance with all applicable customs, exchange control, Value Added Tax and transfer pricing laws despite our efforts to be aware of and to comply with such laws. If these laws change we may need to adjust our operating procedures and our business could be adversely affected.
If we are unable to successfully increase our market share, our ability to grow our business and execute our growth strategies could be materially adversely affected.
A key element of our growth strategy is increasing our market share within the biopharmaceutical services market, the clinical development market and in the geographic markets in which we operate. In addition, we continue to invest in expanding new services such as our late phase offerings, along with solutions for our medical device customers. As we grow our market share within the biopharmaceutical services and clinical development markets and make investments in growing our newer service offerings, we might not have or adequately build the competencies necessary to perform our services satisfactorily or may face increased competition. If we are unable to succeed in increasing our market share or realize the benefits of our investments in our new service offerings, we may be unable to implement this element of our growth strategy, and our ability to grow our business or maintain our operating margins could be adversely affected.
Upgrading the information systems that support our operating processes and evolving the technology platform for our services pose risks to our business.
Continued efficient operation of our business requires that we implement standardized global business processes and evolve our information systems to enable this implementation, especially in the course of integrating inVentiv into our company. We have continued to undertake significant programs to optimize business processes with respect to our services. Our inability to effectively manage the implementation of new information systems or upgrades and adapt to new processes designed into these new or upgraded systems in a timely and cost-effective manner may result in disruption to our business and negatively affect our operations.
We have entered into agreements with certain vendors to provide systems development, integration, and hosting services that develop or license to us the information technology ("IT") platforms and capacity for programs to optimize our business processes. If such vendors or their products fail to perform as required or if there are substantial delays in developing, implementing, and updating our IT platforms, our customer delivery may be impaired, and we may have to make substantial further investments, internally or with third parties, to achieve our objectives. For example, we rely on an external vendor to provide the clinical trial management software used in managing the completion of our customer clinical trials. If that externally provided system is not properly maintained we might not be able to meet the obligations of our contracts or may need to incur significant costs to replace the system or capability. Additionally, our progress may be limited by parties with existing or claimed patents who seek to enjoin us from using preferred technology or seek license payments from us.
32
Meeting our objectives is dependent on a number of factors which might not take place as we anticipate, including obtaining adequate technology-enabled services, depending upon our third-party vendors to develop and enhance existing applications to adequately support our business, creating IT-enabled services that our customers will find desirable and implementing our business model with respect to these services. Also, increased IT-related expenditures and our potential inability to anticipate increases in service costs may negatively impact our business, financial condition, results of operations or cash flows.
If we fail to perform our services in accordance with contractual requirements, regulatory standards and ethical considerations, we could be subject to significant costs or liability and our reputation could be harmed.
We contract with biopharmaceutical companies to perform a wide range of services to assist them in bringing new drugs to market and to support the commercial activity of products already in the marketplace. Our services include monitoring clinical trials, data and laboratory analysis, EDC, patient recruitment, product launch consulting, selling solutions, advertising, publications and medical communications, and other related services. Such services are complex and subject to contractual requirements, regulatory standards and ethical considerations. For example, we must adhere to applicable regulatory requirements such as those required by the Food and Drug Administration, European Medicines Agency, and current Good Clinical Practice regulations, which govern, among other things, the design, conduct, performance, monitoring, auditing, recording, analysis, and reporting of clinical trials and the promotion, sales and marketing of biopharmaceutical products. If we fail to perform our services in accordance with these requirements, regulatory agencies may take action against us or our customers. Such actions may include sanctions such as injunctions or failure of such regulatory authorities to grant marketing approval of products, imposition of clinical holds or delays, suspension or withdrawal of approvals, rejection of data collected in our studies, license revocation, product seizures or recalls, operational restrictions, civil or criminal penalties or prosecutions, damages or fines. Additionally, there is a risk that actions by regulatory authorities, if they result in significant inspectional observations or other measures, could harm our reputation and cause customers not to award us future contracts or to cancel existing contracts. Any such action could have a material adverse effect on our business, financial condition, results of operations, cash flows or reputation.
Such consequences could arise if, among other things, the following occur:
Improper performance of our services. The performance of our clinical development and other biopharmaceutical services is complex and time-consuming. For example, we may make mistakes in conducting a clinical trial that could negatively impact or obviate the usefulness of the trial or cause the results of the trial to be reported improperly. If the trial results are compromised, we could be subject to significant costs or liability, which could have an adverse impact on our ability to perform our services and our reputation could be harmed. For example:
• | non-compliance generally could result in the termination of ongoing clinical trials or the disqualification of data for submission to regulatory authorities; |
• | compromise of data from a particular trial, such as failure to verify that adequate informed consent was obtained from subjects or improper monitoring of data, could require us to repeat the trial under the terms of our contract at no further cost to our customer, but at a substantial cost to us; and |
• | breach of a contractual term could result in liability for damages or termination of the contract. |
Large clinical trials can cost hundreds of millions of dollars and improper performance of our services could have a material adverse effect on our financial condition, damage our reputation, and result in the termination of current contracts or failure to obtain future contracts from the affected customer or other customers.
Interactive Voice/Web Response Technology malfunction. We develop, maintain, and use third-party computer-based interactive voice/web response systems to automatically manage the randomization of patients in a given clinical trial to different treatment arms and regulate the supply of investigational drugs, all by means of interactive voice/web response systems. An error in the design, programming, or validation of these systems could lead to inappropriate assignment or dosing of patients which could give rise to patient safety issues, invalidation of the trial, or liability claims against us. Furthermore, negative publicity associated with such a malfunction could have an adverse effect on our business and reputation. Additionally, errors in
33
randomization may require us to repeat the trial at no further cost to our customer, but at a substantial cost to us.
Investigation of customers. From time to time, one or more of our customers are audited or investigated by regulatory authorities or enforcement agencies with respect to regulatory compliance of their clinical trials, programs or the marketing and sale of their drugs. In these situations, we have often provided services to our customers with respect to the clinical trials, programs, or activities being audited or investigated, and we are called upon to respond to requests for information by the authorities and agencies. There is a risk that either our customers or regulatory authorities could claim that we performed our services improperly or that we are responsible for clinical trial or program compliance. If our customers or regulatory authorities make such claims against us and prove them, we could be subject to damages, fines, or penalties. In addition, negative publicity regarding regulatory compliance of our customers' clinical trials, programs, or drugs could have an adverse effect on our business and reputation.
Insufficient customer funding to complete a clinical trial. As noted above, clinical trials can cost hundreds of millions of dollars. There is a risk that we may initiate a clinical trial for a customer, and then the customer becomes unwilling or unable to fund the completion of the trial. In such a situation, notwithstanding the customer's ability or willingness to pay for or otherwise facilitate the completion of the trial, we may be ethically bound to complete or wind down the trial at our own expense.
In addition to the above U.S. laws and regulations, we must comply with the laws of all countries where we do business, including laws governing clinical trials in the jurisdiction where the trials are performed. Failure to comply with applicable requirements could subject us to regulatory risk, liability, and potential costs associated with redoing the trials, which could damage our reputation and adversely affect our operating results.
Any future litigation against us could be costly and time-consuming to defend.
We may become subject, from time to time, to legal proceedings and claims that arise in the ordinary course of business or pursuant to governmental or regulatory enforcement activity. While we do not believe that the resolution of any currently pending lawsuits against us will, individually or in the aggregate, have a material adverse effect on our business, financial condition, results of operations, or cash flows, we might be wrong, and future litigation might result in substantial costs and divert management's attention and resources, which might seriously harm our business, financial condition, results of operations, and cash flows. Insurance might not cover such claims, provide sufficient payments to cover all of the costs to resolve one or more such claims, or continue to be available on terms acceptable to us. In particular, any claim could result in potential liability for us if the claim is outside the scope of the indemnification agreement we have with our customers, our customers do not abide by the indemnification agreement as required or the liability exceeds the amount of any applicable indemnification limits or available insurance coverage. A claim brought against us that is uninsured or underinsured could result in unanticipated costs and could have a material adverse effect on our financial condition, results of operations, cash flows, or reputation.
The operation of our early stage (Phase I and IIA) clinical facilities and the services we provide there as well as our clinical trial management, including direct interaction with clinical trial patients or volunteers, could create potential liability that may adversely affect our business, financial condition, results of operations, cash flows, and reputation.
We operate facilities where early stage clinical trials are conducted, which ordinarily involve testing an investigational drug on a limited number of individuals to evaluate a product’s safety, determine a safe dosage range and identify side effects. Additionally, our business involves clinical trial management, which is one of our clinical development service offerings, and includes the testing of new drugs on human volunteers. Some of these trials involve the administration of investigational drugs to known substance abusers or volunteers and patients that are already seriously ill and are at risk for further illness or death. Failure to operate any of our early stage facilities in accordance with applicable regulations could result in that facility being shut down, which could disrupt our operations and adversely affect our business, financial condition, results of operations, cash flows, and reputation.
Additionally, we face risks resulting from the administration of drugs to volunteers, including adverse events, and the professional malpractice of medical care providers, including improper administration of a drug or
34
device. We also directly employ doctors, nurses, and other trained employees who assist in implementing the testing involved in our clinical trials, such as drawing blood from healthy volunteers. Although we attempt to negotiate indemnification arrangements with our customers or vendors, we might not be able to collect under these arrangements and our exposure could exceed any contractual limits on indemnification. Any professional malpractice or negligence by such doctors, nurses, principal investigators, or other employees could potentially result in liability to us in the event of personal injury to or death of a volunteer in clinical trials. This liability, particularly if it were to exceed the limits of any indemnification agreements and insurance coverage we may have, may adversely affect our business and financial condition, results of operations, cash flows, and reputation.
If our insurance does not cover all of our indemnification obligations and other liabilities associated with our operations, our business, financial condition, results of operations, or cash flows may be materially adversely affected.
We maintain insurance designed to provide coverage for ordinary risks associated with our operations and our ordinary indemnification obligations that we believe to be customary for our industry. The coverage provided by such insurance might not be adequate for all claims we make or may be contested by our insurance carriers. If our insurance is not adequate or available to pay all claims or exposures associated with our operations, or if we are unable to purchase adequate insurance at reasonable rates in the future, our business, financial condition, results of operations or cash flows may be materially adversely affected.
If we are unable to attract suitable principal investigators and recruit and enroll patients for clinical trials, our clinical development business might suffer.
The recruitment of principal investigators and patients for clinical trials is essential to our business. Principal investigators are typically located at hospitals, clinics, or other sites and supervise the administration of the investigational drug to patients during the course of a clinical trial. Patients generally include people from the communities in which the clinical trials are conducted. Several of our competitors have purchased site networks or site management organizations as a strategy for priority access to a specific site, which could put us at a competitive disadvantage. Our clinical development business could be adversely affected if we are unable to attract suitable and willing principal investigators or recruit and enroll patients for clinical trials on a consistent basis. The expanding global nature of clinical trials increases the risk associated with attracting suitable principal investigators and patients, especially if these trials are conducted in regions where our resources or experience may be more limited. For example, if we are unable to engage principal investigators to conduct clinical trials as planned or enroll sufficient patients in clinical trials, we might need to expend additional funds to obtain access to more principal investigators and patients than planned or else be compelled to delay or modify the clinical trial plans, which may result in additional costs to us or cancellation of the trial by our customer. If realized, these risks may also inhibit our ability to attract new business, particularly in certain regions.
Our business could result in liability to us if a drug causes harm to a patient. While we are generally indemnified and insured against such risks, we may still suffer financial losses.
When we market drugs under contract for a biopharmaceutical company, we could suffer liability for harm allegedly caused by those drugs, either as a result of a lawsuit against the biopharmaceutical company to which we are joined, a lawsuit naming us or any of our subsidiaries, or an action launched by a regulatory body. While we are generally indemnified by the biopharmaceutical company for the action of the drugs we market on its behalf and carry insurance to cover harm caused by our negligence in performing services, it is possible that we could nonetheless incur financial losses, regulatory penalties, or both. In particular, any claim could result in potential liability for us if the claim is outside the scope of the indemnification agreement we have with the biopharmaceutical company, the biopharmaceutical company does not abide by the indemnification agreement as required, or the liability exceeds the amount of any applicable indemnification limits or available insurance coverage. Such a result could have an adverse impact on our financial condition, results of operations, cash flows, and reputation. Furthermore, negative publicity associated with harm caused by drugs we helped to market could have an adverse effect on our business and reputation.
35
Investments in our customers’ businesses or drugs and our related commercial rights strategies could have a negative impact on our financial performance.
We may enter into arrangements with our customers or other drug companies in which we take on some of the risk of the potential success or failure of their businesses or drugs, including making strategic investments in our customers or other drug companies, providing financing to customers or other drug companies, or acquiring an interest in the revenues from customers’ drugs or in entities developing a limited number of drugs. Before entering into any such arrangements, we carefully analyze and select the customers and drugs with which we are willing to structure our risk-based deals. Our financial results could be adversely affected if these investments or the underlying drugs result in losses, do not achieve the level of success that we anticipate, and/or our return or payment from the drug investment or financing is less than our direct and indirect costs with respect to these arrangements. Additionally, there is a risk that we are not awarded projects by other customers who believe we are in competition with them because of these investments, which would negatively impact future awards.
If we lose the services of key personnel or are unable to recruit experienced personnel, our business, financial condition, results of operations, cash flows, or reputation could be materially adversely affected.
Our success substantially depends on the collective performance, contributions, and expertise of our senior management team and other key personnel including qualified management, professional, scientific, and technical operating staff, and business development personnel, particularly as we integrate inVentiv into our company. There is significant competition for qualified personnel, particularly those with higher educational degrees, in the biopharmaceutical and related services industries. In addition, the close proximity of some of our facilities to offices of our major competitors could adversely impact our ability to successfully recruit and retain key personnel. The departure of any key executive, or our inability to continue to identify, attract and retain qualified personnel or replace any departed personnel in a timely fashion, might impact our ability to grow our business and compete effectively in our industry and might negatively affect our business, financial condition, results of operations, cash flows, or reputation.
Foreign currency exchange rate fluctuations may have a material adverse effect on our financial condition, results of operations, and cash flows.
Approximately 17% of our fiscal year 2017 net service revenues were contracted in currencies other than U.S. dollars and 32% of our direct and operating costs are incurred in countries with functional currencies other than the U.S. dollar. Our financial statements are reported in U.S. dollars and changes in foreign currency exchange rates could significantly affect our financial condition, results of operations, or cash flows. Our primary exposure to fluctuations in foreign currency exchange rates is related to the following risks:
Foreign Currency Risk from Differences in Customer Contract Currency and Operating Costs Currency. The majority of our global contracts are denominated in U.S. dollars or Euros while our operating costs in foreign countries are denominated in various local currencies. Fluctuations in the exchange rates of the currencies we use to contract with our customers and the currencies in which we incur cost to fulfill those contracts can have a significant impact on our results of operations.
Foreign Currency Translation Risk. The revenue and expenses of our international operations are generally denominated in local currencies and translated into U.S. dollars for financial reporting purposes. Accordingly, exchange rate fluctuations between the value of the U.S. dollar versus local currencies will affect the U.S. dollar value of our foreign currency denominated revenue, costs, and results of operations.
Foreign Currency Transaction Risk. We earn revenue from our service contracts over a period of several months and, in many cases, over several years, resulting in timing differences between the consummation and cash settlement of a transaction. Accordingly, profitability of the transactions denominated in foreign currencies is subject to effects of fluctuations in foreign currency exchange rates during the period of time between the consummation and cash settlement of a transaction.
We may seek to limit our exposure to these risks through inclusion of foreign currency exchange rate provisions in our service contracts, and/or by hedging certain exposures with foreign exchange derivative instruments. These measures, however, might not offset or mitigate any, or all of the adverse financial effects of unfavorable movements in foreign currency exchange rates.
36
Unfavorable economic conditions could have a material adverse effect on our business, financial condition, results of operations, or cash flows.
Unfavorable economic conditions and other adverse macroeconomic factors on global and domestic markets might result, among other matters, in tightening in the credit and capital markets, low liquidity, and volatility in fixed income, credit, currency, and equity markets. Such conditions could have a negative effect on our business, financial condition, results of operations, or cash flows. For example, our customers might not be able to raise money to conduct existing clinical trials, or to fund new drug development and related future clinical trials. Resource-sharing customers may also scale back commercial support for their products. In addition, economic or market disruptions could negatively impact our vendors, contractors, or principal investigators which might have a negative effect on our business.
Our effective income tax rate may fluctuate, which may adversely affect our results of operations.
Our effective income tax rate is influenced by our projected profitability in the various taxing jurisdictions in which we operate. Changes in the distribution of profits and losses among taxing jurisdictions may have a significant impact on our effective income tax rate, which in turn could have an adverse effect on our results of operations. Factors that may affect our effective income tax rate include, but are not limited to:
• | the requirement to exclude from our quarterly worldwide effective income tax calculations the benefit for losses in jurisdictions where no income tax benefit can be recognized; |
• | actual and projected full year pre-tax income; |
• | the repatriation of foreign earnings to the United States; |
• | uncertain tax positions; |
• | changes in tax laws in various taxing jurisdictions; |
• | audits by taxing authorities; |
• | the establishment of valuation allowances against deferred income tax assets if we determine that it is more likely than not that future income tax benefits will not be realized; |
• | the release of a previously established valuation allowances against deferred income tax assets if we determine that it is more likely than not that future income tax benefits will be realized; |
• | changes in the relative mix and size of clinical studies in various tax jurisdictions; and |
• | the timing and amount of the vesting and exercising of share-based compensation. |
These changes may cause fluctuations in our effective income tax rate that could adversely affect our results of operations and cause fluctuations in our earnings and earnings per share.
On December 22, 2017, the U.S. government enacted comprehensive tax legislation commonly referred to as the Tax Cuts and Jobs Act (the “Tax Act”). The Tax Act makes broad and complex changes to the U.S. tax code, including, but not limited to: (i) reducing the U.S. federal corporate tax rate from 35% to 21%; (ii) requiring companies to pay a one-time transition tax on certain undistributed earnings of foreign subsidiaries; (iii) generally eliminating U.S. federal income taxes on dividends from foreign subsidiaries; (iv) introducing a new provision designed to tax global intangible low-taxed income ("GILTI"); (v) eliminating the corporate alternative minimum tax ("AMT") and changing how existing AMT credits can be realized; (vi) creating the base erosion anti-abuse tax ("BEAT"), a new minimum tax; (vii) creating a new limitation on deductible interest expense; (viii) introducing limitations on the deductibility of certain executive compensation; and (ix) changing rules related to uses and limitations of net operating loss carryforwards created in tax years beginning after December 31, 2017.
Our effective tax rate may fluctuate as we continue to quantify and implement the various aspects of the Tax Act over the next 12 to 24 months. If any regulations or clarifications about the Tax Act are published that cause us to change how we originally accounted for these new provisions, then our effective tax rate could fluctuate as a result.
37
We have only a limited ability to protect our intellectual property rights, and these rights are important to our success.
We develop, use, and protect our proprietary methodologies, analytics, systems, technologies, and other intellectual property. Existing laws of the various countries in which we provide services or solutions offer only limited protection of our intellectual property rights, and the protection in some countries may be very limited. We rely upon a combination of trade secrets, confidentiality policies, nondisclosure agreements, and other contractual arrangements, as well as copyright and trademark laws, to protect our intellectual property rights. These laws are subject to change at any time and certain agreements might not be fully enforceable, which could further restrict our ability to protect our innovations. Our intellectual property rights might not prevent competitors from independently developing services similar to or duplicative of ours or alleging infringement of their intellectual property rights in certain jurisdictions. The steps we take in this regard might not be adequate to prevent or deter infringement or misappropriation of our intellectual property or claims against us for alleged infringement or misappropriation by competitors, former employees, or other third parties. Furthermore, we might not be able to detect unauthorized use of, or take appropriate and timely steps to enforce, our intellectual property rights. Enforcing our rights might also require considerable time, money, and oversight, and we might not be successful in enforcing our rights.
Our acquisition strategy may present additional risks.
We have historically grown our business both organically and through acquisitions, most recently and notably of inVentiv. We have and will continue to assess the need and opportunity to offer additional services through acquisitions of other companies. Acquisitions involve numerous risks, including the following:
• | ability to identify suitable acquisition opportunities or obtain any necessary financing on commercially acceptable terms; |
• | increased risk to our financial position and liquidity through changes to our capital structure and assumption of acquired liabilities, including any indebtedness incurred to finance the acquisitions and related interest expense; |
• | diversion of management’s attention from normal daily operations of the business; |
• | insufficient revenues to offset increased expenses associated with acquisitions; |
• | assumption of liabilities and exposure to unforeseen liabilities of acquired companies, including liabilities for their failure to comply with healthcare, tax, and other regulations; |
• | inability to achieve identified operating and financial synergies anticipated to result from an acquisition; |
• | ability to integrate acquired operations, products, and technologies into our business; |
• | difficulties integrating acquired personnel and distinct cultures into our business; and |
• | the potential loss of key employees, customers, or projects. |
We may also spend time and money investigating and negotiating with potential acquisition targets but not complete the merger. Any acquisition could involve other risks, including, among others, the assumption of additional liabilities and expenses, difficulties and expenses in connection with integrating the acquired companies and achieving the expected benefits, issuances of potentially dilutive securities or interest-bearing debt, loss of key employees of the acquired companies, transaction expenses, diversion of management's attention from other business concerns, and, with respect to the acquisition of international companies, the inability to overcome differences in international business practices, language and customs. Our failure to successfully integrate inVentiv and potential future acquisitions could have a material adverse effect on our business, financial condition, results of operations, and cash flows.
If we are unable to successfully integrate acquisitions, our business, financial condition, results of operations, and cash flows could be materially adversely affected.
We have completed a number of acquisitions in the past, most recently and notably inVentiv, and anticipate that a portion of our future growth may come from strategic or tuck-in acquisitions. The success of any acquisition will depend upon, among other things, our ability to execute against identified synergies and
38
effectively integrate acquired personnel, operations, products, and technologies into our business, and to retain the key personnel and customers of our acquired businesses. In addition, we may be unable to identify suitable acquisition opportunities or obtain any necessary financing on commercially acceptable terms.
Our relationships with existing or potential customers who are in competition with each other may adversely impact the degree to which other customers or potential customers use our services, which may adversely affect our business, financial condition, results of operations, or cash flows.
The biopharmaceutical industry is highly competitive, with biopharmaceutical companies each seeking to persuade payers, providers, and patients that their drug therapies are better and more cost-effective than competing therapies marketed or being developed by competing firms. In addition to the adverse competitive interests that biopharmaceutical companies have with each other, biopharmaceutical companies also have adverse interests with respect to drug selection and reimbursement with other participants in the healthcare industry, including payers and providers. Biopharmaceutical companies also compete to be first to market with new drug therapies. We regularly provide services to biopharmaceutical companies who compete with each other, and we sometimes provide services to such customers regarding competing drugs in the market and in development. Our existing or future relationships, particularly broader strategic provider and commercial relationships, with our biopharmaceutical customers may therefore deter other biopharmaceutical customers from using our services or may result in our customers seeking to place limits on our ability to serve other biopharmaceutical industry participants. In addition, our further expansion into the broader healthcare market may adversely impact our relationships with biopharmaceutical customers, and such customers may elect not to use our services, reduce the scope of services that we provide to them or seek to place restrictions on our ability to serve customers in the broader healthcare market with interests that are adverse to theirs. Any loss of customers or reductions in the level of revenues from a customer could have a material adverse effect on our business, financial condition, results of operations, or cash flows.
Our results of operations may be adversely affected if we fail to realize the full value of our goodwill and intangible assets.
As of December 31, 2017, our goodwill and net intangible assets were valued at $5.58 billion, which constituted approximately 77% of our total assets.
Our goodwill is principally related to the Merger completed in August 2017. Goodwill is tested for impairment at the reporting unit level, which is one level below the operating segment level. This test requires us to determine if the implied fair value of the reporting unit's goodwill is less than its carrying amount. The impairment analysis requires significant judgments, estimates and assumptions. There is no assurance that the actual future earnings or cash flows of the reporting units will not decline significantly from the projections used in the impairment analysis. Goodwill impairment charges may be recognized in future periods in one or more of the reporting units to the extent changes in factors or circumstances occur, including deterioration in the macroeconomic environment or industry, deterioration in our performance or our future projections, or changes in plans for one or more of our reporting units. As of October 1, 2017 and December 31, 2017, we assigned goodwill to five reporting units. We completed our annual impairment test for potential impairment as of October 1, 2017 for all of our reporting units, determining that there were no impairments.
Intangible assets consist of backlog, customer relationships, and trademarks. We review intangible assets at the end of each reporting period to determine if facts and circumstances indicate that the useful life is shorter than originally estimated or that the carrying amount of the assets might not be recoverable. If such facts and circumstances exist, we assess the recoverability of identified assets by comparing the projected undiscounted net cash flows associated with the related asset or group of assets over their remaining lives to their respective carrying amounts. Impairments, if any, are based on the excess of the carrying amount over the fair value of those assets and occur in the period in which the impairment determination was made. In connection with the Merger we announced our intentions to relaunch our operations under a new brand name in January 2018. As a result, in the third quarter of 2017 we determined that the useful life of our intangible asset related to the INC Research trademark with carrying value of $35.0 million was no longer indefinite and recorded a $30.0 million impairment charge with the remaining value amortized over the remainder of 2017.
39
We face risks arising from the restructuring of our operations, which could adversely affect our financial condition, results of operations, cash flows, or business reputation.
From time to time, we have adopted cost savings initiatives to improve our operating efficiency through various means such as: (i) the reduction of overcapacity, primarily in our costs of services (billable) function; (ii) elimination of non-billable support roles; and (iii) the consolidation or other realignment of our resources. In connection with the Merger, we have established a restructuring plan to eliminate redundant positions and reduce our facility footprint worldwide. We expect to continue the ongoing evaluations of our workforce and facilities infrastructure needs through 2020 in an effort to optimize our resources worldwide. Additionally, in conjunction with the Merger, we assumed certain liabilities related to employee severance and facility closure costs as a result of actions taken by inVentiv prior to the Merger. During the year ended December 31, 2017, we recognized approximately $11.3 million of employee severance and benefit costs, facility closure and lease termination costs of $2.2 million, and other costs of $2.0 million related to the Merger. Additionally, during the year ended December 31, 2017, we recognized approximately $9.4 million of non-Merger related employee severance costs and incurred $1.3 million of non-Merger related facility closure and lease termination costs related to our focus on optimizing our resources worldwide.
Restructuring actions present significant risks that could have a material adverse effect on our operations, financial condition, results of operations, cash flows, or business reputation. Such risks include:
• | a decrease in employee morale and retention of key employees; |
• | a greater number of employment claims; |
• | actual or perceived disruption of service or reduction in service standards to customers; |
• | the failure to preserve supplier relationships and distribution, sales and other important relationships and to resolve conflicts that may arise; |
• | the failure to achieve targeted cost savings; and |
• | the failure to meet operational targets and customer requirements due to the loss of employees and any work stoppages that might occur. |
We operate in many different jurisdictions and we could be adversely affected by violations of the FCPA, UK Bribery Act of 2010, and/or similar worldwide anti-corruption and anti-bribery laws.
The FCPA, UK Bribery Act of 2010, and similar worldwide anti-corruption laws prohibit companies and their intermediaries from making improper payments for the purpose of obtaining or retaining business. Our internal policies mandate compliance with these anti-corruption laws. We operate in many parts of the world that have experienced corruption to some degree and, in certain circumstances, anti-corruption laws have appeared to conflict with local customs and practices. Despite our training and compliance programs, we cannot assure that our internal control policies and procedures will protect us from acts in violation of anti-corruption laws committed by persons associated with us, and our continued expansion outside the United States, including in developing countries, could increase such risk in the future. Violations of the FCPA or other non-U.S. anti-corruption laws, or even allegations of such violations, could disrupt our business and result in a material adverse effect on our financial condition, results of operations, cash flows, and reputation. For example, violations of anti-corruption laws can result in restatements of, or irregularities in, our financial statements as well as severe criminal or civil sanctions. In some cases, companies that violate the FCPA might be debarred by the U.S. government and/or lose their U.S. export privileges. In addition, U.S. or other governments might seek to hold us liable for successor liability FCPA violations or violations of other anti-corruption laws committed by companies that we acquire or in which we invest. Changes in anti-corruption laws or enforcement priorities could also result in increased compliance requirements and related costs which could adversely affect our business, financial condition, results of operations, and cash flows.
The failure of third parties to provide us critical support services could adversely affect our business, financial condition, results of operations, cash flows, or reputation.
We depend on third parties for support services vital to our business. Such support services include, but are not limited to, IT services, laboratory services, third-party transportation and travel providers, freight forwarders and customs brokers, drug depots and distribution centers, suppliers or contract manufacturers of
40
drugs for patients participating in clinical trials, and providers of licensing agreements, maintenance contracts or other services. In addition, we also rely on third-party CROs and other contract clinical personnel for clinical services either in regions where we have limited resources, or in cases where demand cannot be met by our internal staff. The failure of any of these third parties to adequately provide us critical support services could have a material adverse effect on our business, financial condition, results of operations, cash flows or reputation.
We might not be able to utilize certain of our net operating loss carryforwards and certain other tax attributes, which could harm our profitability.
As of December 31, 2017, we had approximately $1.0 billion of net operating loss carry forwards (“NOLs”) available to reduce U.S. federal taxable income in future years. Under Section 382 and similar provisions of the Internal Revenue Code (“the Code”), if a corporation undergoes an “ownership change,” that corporation’s ability to use its pre-change NOL carryforwards and other pre-change tax attributes, such as research tax credits, to offset its post-change income and taxes may be limited for U.S. federal income tax purposes (or similar provisions of other jurisdictions). These limitations may be subject to certain exceptions, including if there is “net unrealized built-in gain” in the assets of the corporation undergoing the ownership change.
inVentiv had significant NOLs for U.S. federal income tax purposes, which, until they expire, generally can be carried forward to reduce taxable income in future years. In addition, certain of inVentiv’s NOLs and tax attributes are subject to existing limitations under Section 382 and similar provisions of the Code as a result of inVentiv’s prior ownership changes. The application of these provisions with respect to inVentiv’s NOLs and other tax attributes, including the determination of the amount of any “net unrealized built-in gain” in inVentiv’s assets, is complex, involving, among other things, certain factual determinations regarding value and built-in gain amounts. Accordingly, no assurance can be given that the IRS (or other taxing authority in a jurisdiction applying similar law) would not assert our ability to utilize inVentiv’s NOLs and other tax attributes is subject to limitations that are different from the limitations as determined by us, or that a court would not agree with such an assertion.
The benefit of the inVentiv NOLs is uncertain even without regard to the Section 382 rules. Due to the corporate income tax rate change pursuant to the Tax Act, the value of our NOLs was significantly decreased. In addition, a portion of inVentiv’s NOLs arise from certain transaction tax deductions associated with Double Eagle’s acquisition of inVentiv on November 9, 2016. Pursuant to that acquisition, inVentiv generally has a contingent obligation to pay former shareholders of inVentiv Group Holdings the value of U.S. federal, state and local tax benefits arising from those transaction tax deductions as such benefits are realized and, consequently, the ability of the combined company to benefit from inVentiv’s NOLs will be limited to the extent of such contingent obligation.
Further, as of December 31, 2017, we assessed both positive and negative evidence in evaluating whether we could support the recognition of our U.S. net deferred tax asset position or if a valuation allowance would be required. A significant piece of objective negative evidence that we considered was the cumulative loss over the three-year period ended December 31, 2017. This objective evidence limited our ability to consider subjective positive evidence, such as forecasted projections of income. Therefore, the Company recorded a charge to income tax expense in the amount of $52.6 million for the net increase in the valuation allowance.
However, given our anticipated future earnings and the new GILTI and BEAT provisions under the Tax Act, we believe there is a reasonable possibility that within the next 12 to 24 months, sufficient positive evidence may become available to allow us to reach a conclusion that a significant portion of the valuation allowance will no longer be needed. Consequently, such release of the valuation allowance would result in the recognition of certain deferred tax assets and a decrease to the tax expense in the period that the release is recorded. However, the exact timing and amount of the valuation allowance release is unknown at this time.
Downgrades of our credit ratings could adversely affect us.
We can be adversely affected by downgrades of our credit ratings because ratings are a factor influencing our ability to access capital and the terms of any new indebtedness, including covenants and interest rates. Our customers and vendors may also consider our credit profile when negotiating contract terms, and if they were to change the terms on which they deal with us, it could have a material adverse effect on our business, results of operations, cash flows, and financial condition.
41
Many of our vendors have the right to declare us in default of our agreements if any such vendor, including the lessors under our vehicle fleet leases, determines that a change in our financial condition poses a substantially increased credit risk. Upon default, the lessors can repossess the vehicles and require us to compensate them for any remaining lease payments in excess of the value of the repossessed vehicles. As of December 31, 2017, we had $36.8 million in capital lease obligations, primarily related to vehicles used in our Selling Solutions offering in the United States. Our Selling Solutions offering may be negatively impacted if we lose the use of vehicles for any period of time.
Our 2017 Credit Agreement contains covenants that may restrict our ability to, among other things, borrow money, pay dividends, make capital expenditures, make strategic acquisitions and effect a consolidation, merger, or disposal of all or substantially all of our assets. Refer to "Risks Related to Our Indebtedness - Covenant restrictions under our 2017 Credit Agreement may limit our ability to operate our business" for further details on our covenant restrictions.
Risks Related to Our Industry
The biopharmaceutical services industry is highly competitive and our business could be materially impacted if we do not compete effectively.
The biopharmaceutical services industry is highly competitive. Our business often competes with other biopharmaceutical services companies, internal discovery departments, development departments, sales and marketing departments, information technology departments, and other departments within our customers, some of which could be considered large biopharmaceutical services companies in their own right with greater resources than ours. We also compete with universities, teaching hospitals, governmental agencies and others. If we do not compete successfully, our business will suffer. The industry is highly fragmented, with numerous smaller specialized companies and a handful of companies with global capabilities similar to certain of our own capabilities. Increased competition has led to price and other forms of competition (such as acceptance of less favorable contract terms) that could adversely affect our operating results. There are few barriers to entry for companies considering offering any one or more of the services we offer. Because of their size and focus, these companies might compete effectively against us, which could have a material adverse impact on our business.
In recent years, our industry has experienced increased consolidation and might continue to, which might put us at risk of growing more slowly than our competitors that make acquisitions. This trend is likely to produce more competition from the resulting larger companies, and ones without the cost pressures of being public, for both customers and acquisition candidates. One specific aspect of this consolidation competition involves CROs entering into transactions to attempt to control more access to clinical trial participants, like acquisition of site networks and data. These trends could make it harder for us to compete successfully.
Our future growth and success will depend on our ability to successfully compete with other companies that provide similar services in the same markets, some of which may have financial, marketing, technical, and other advantages. We also expect that competition will continue to increase as a result of consolidation among these various companies. Large technology companies with substantial resources, technical expertise, and greater brand power could also decide to enter or further expand in the markets where our business operates and compete with us. If one or more of our competitors or potential competitors were to merge or partner with another of our competitors, or if a new entrant emerged with substantial resources, the change in the competitive landscape could adversely affect our ability to compete effectively. We compete on the basis of various factors, including breadth and depth of services, reputation, reliability, quality, innovation, security, price, and industry expertise and experience. In addition, our ability to compete successfully may be impacted by the growing availability of health information from social media, government health information systems, and other free or low-cost sources. In addition, consolidation or integration of wholesalers, retail pharmacies, health networks, payers, or other healthcare stakeholders may lead any of them to provide information services directly to customers or indirectly through a designated service provider, resulting in increased competition from firms that may have lower costs to market (e.g., no data supply costs). Any of the above may result in lower demand for our services, which could result in a material adverse impact on our operating results and financial condition.
42
Outsourcing trends in the biopharmaceutical industry and changes in aggregate spending and research and development budgets could adversely affect our operating results and growth rate.
Our revenues depend on the level of R&D and commercialization expenditures, size of the drug-development pipelines and outsourcing trends of the biopharmaceutical industry, including the amount of such R&D spend that is outsourced and subject to competitive bidding amongst us and our competitors. Accordingly, economic factors and industry trends that affect biopharmaceutical companies affect our business.
Biopharmaceutical companies continue to seek long-term strategic collaborations with global CROs with favorable pricing terms. Competition for these collaborations is intense and we might not be selected, in which case a competitor may enter into the collaboration and our business with the customer, if any, may be limited. Our success depends in part on our ability to establish and maintain preferred provider relationships with large biopharmaceutical companies. Our failure to develop or maintain these preferred provider relationships could have a material adverse effect on our business and results of operations. Furthermore, in order to obtain preferred provider relationships, we may have to reduce the prices for our services, which could negatively impact our gross margin for these services.
In addition, if the biopharmaceutical industry reduces its outsourcing of clinical trials or commercialization services or such outsourcing fails to grow at projected rates, our business, financial condition, results of operations, and cash flows could be materially and adversely affected. We may also be negatively impacted by consolidation and other factors in the biopharmaceutical industry, which may slow decision making by our customers, result in the delay or cancellation of existing projects, cause reductions in overall R&D expenditures, or lead to increased pricing pressures. Further, in the event that one of our customers combines with a company that is using the services of one of our competitors, the combined company could decide to use the services of that competitor or another provider. All of these events could adversely affect our business, financial condition, cash flows or results of operations.
Actions by government regulators or customers to limit a prescription’s scope or withdraw an approved product from the market could adversely affect our business, results of operations, and financial condition.
Government regulators have the authority, after approving a biopharmaceutical product, to limit its scope of prescription or withdraw it from the market completely based on safety concerns. Similarly, customers may act to voluntarily limit the scope of prescription of biopharmaceutical products or withdraw them from the market. Actions by payors to limit a product on a formulary list can influence customer decisions to withdraw or limit market support for a product. In the past, we have provided services with respect to products that have been limited or withdrawn. If we are providing services to customers for products that are limited or withdrawn, we may be required to narrow the scope of or terminate our services with respect to such products, which would prevent us from earning the full amount of revenues anticipated under the related contracts with negative impacts to our business, results of operations, cash flows, and financial condition.
If we fail to comply with federal, state, and foreign healthcare laws, including fraud and abuse laws, we could face substantial penalties and our business, financial condition, results of operations, cash flows, and prospects could be adversely affected.
Even though we do not and will not order healthcare services or bill directly to Medicare, Medicaid, or other third-party payers, certain federal and state healthcare laws and regulations pertaining to fraud and abuse are and will be applicable to our business. We could be subject to healthcare fraud and abuse laws of both the federal government and the states in which we conduct our business. Because of the breadth of these laws and the narrowness of available statutory and regulatory exceptions, it is possible that some of our business activities could be subject to challenge under one or more of such laws. If we or our operations are found to be in violation of any of the laws described above or any other governmental regulations that apply to us, we may be subject to penalties, including civil and criminal penalties, damages, fines, imprisonment, and the curtailment or restructuring of our operations, any of which could materially adversely affect our ability to operate our business and our financial results.
43
We may be affected by healthcare reform and potential additional reforms which may adversely impact the biopharmaceutical industry and reduce the need for our services or negatively impact our profitability.
Numerous government bodies are considering or have adopted healthcare reforms and may undertake, or are in the process of undertaking, efforts to control healthcare costs through legislation, regulation, and agreements with healthcare providers and biopharmaceutical companies, including many of our customers. As governmental administrations change and reforms take place, we are unable to predict what legislative proposals, if any, will be adopted in the future. If regulatory cost-containment efforts limit the profitability of new drugs by, for example, continuing to place downward pressure on pharmaceutical pricing and/or increasing regulatory burdens and operating costs of the biopharmaceutical industry, our customers may reduce their commercialization and R&D spending, which could reduce the business they outsource to us. In addition, if regulatory requirements are relaxed or simplified drug approval procedures are adopted, the demand for our services could decrease.
Government bodies have adopted and may continue to adopt new healthcare legislation or regulations that are more burdensome than existing regulations. For example, product safety concerns and recommendations by the Drug Safety Oversight Board could change the regulatory environment for drug products, and new or heightened regulatory requirements may increase our expenses or limit our ability to offer some of our services. We might have to incur additional costs to comply with these or other new regulations, and failure to comply could harm our financial condition, results or operations, cash flows, and reputation. Additionally, new or heightened regulatory requirements may have a negative impact on the ability of our customers to conduct industry-sponsored clinical trials, which could reduce the need for our post-approval development services.
Current and proposed laws and regulations regarding the protection of personal data could result in increased risks of liability or increased cost to us or could limit our service offerings.
The confidentiality, collection, use, and disclosure of personal data, including clinical trial patient-specific information, are subject to governmental regulation generally in the country in which the personal data was collected or used. For example, U.S. federal regulations under the Health Insurance Portability and Accountability Act of 1996, as amended, ("HIPAA") generally require individuals' written authorization, in addition to any required informed consent, before protected health information ("PHI") may be used for research and such regulations specify standards for de-identification and for limited data sets. We may also be subject to applicable state privacy and security laws and regulations in states in which we operate. We are indirectly affected by the privacy provisions surrounding individual authorizations because many principal investigators with whom we are involved in clinical trials are directly subject to them as a HIPAA "covered entity." In addition, we obtain identifiable health information from third parties that are subject to such regulations. While we do not believe we are a "business associate" under HIPAA, regulatory agencies may disagree. Because of amendments to the HIPAA data security and privacy rules that were promulgated on January 25, 2013, some of which went into effect on March 26, 2013, there are some instances where HIPAA "business associates" of a "covered entity" may be directly liable for breaches of PHI and other HIPAA violations. These amendments may subject "business associates" to HIPAA's enforcement scheme, which, as amended, can yield up to $1.5 million in annual civil penalties for each HIPAA violation.
In the EU and many other data privacy laws outside of the U.S., personal data includes any information that relates to an identified or identifiable natural person, with health, genetic, biometric, and other sensitive personal information carrying additional obligations, including obtaining the explicit consent from the individual for collection, use, or disclosure of the information. In addition, we are subject to EU rules with respect to cross-border transfers of such data out of the EU. The United States, the EU and its member states, and other countries where we have operations, such as Japan, China, South Korea, Malaysia, the Philippines, Russia, and Singapore, continue to issue new privacy and data protection laws, rules, and regulations that relate to personal data and health information. Failure to comply with certain certification/registration and annual re-certification/registration provisions associated with these data protection and privacy laws, rules, and regulations in various jurisdictions, or to resolve any serious privacy or security complaints, could subject us to regulatory sanctions, delays in clinical trials, criminal prosecution, or civil liability. Federal, state, and foreign governments may propose or have adopted additional legislation governing the collection, possession, use, or dissemination of personal data, such as personal health information, and personal financial data as well as security breach notification rules for loss or theft of such data. Additional legislation or regulation of
44
this type might, among other things, require us to implement new security measures and processes or to pseudonymize or de-identify health or other personal data, each of which may require substantial expenditures or limit our ability to offer some of our services. Additionally, if we violate applicable laws, rules, or regulations relating to the collection, use, privacy, or security of personal data, we could be subject to civil liability or criminal prosecution, be forced to alter our business practices and suffer reputational harm. The European General Data Protection Regulation ("GDPR") goes into effect on May 25, 2018, replacing the existing EU data protection framework. The GDPR contains new provisions specifically directed at the processing of health information, rights of data subjects, higher sanctions, and extra-territoriality measures intended to bring non-EU companies under the regulation.
Our customers face intense competition from lower cost generic products and other competing products, which may lower the amount that they spend on our services and could have a material adverse effect on our business, results of operations, cash flows, and financial condition.
Our customers face increasing competition from competing products and, in particular, from lower cost generic products, which in turn may affect their ability to pursue clinical development and commercialization activities. In the United States, the EU and Japan, political pressure to reduce spending on prescription products has led to legislation and other measures which encourage the use of generic products. In addition, proposals emerge from time to time in the United States and other countries for legislation to further encourage the early and rapid approval of generic products. Loss of patent protection for a product typically is followed promptly by generic substitutes, reducing our customers’ sales of that product and their overall profitability. Availability of generic substitutes for our customers’ products or other competing products may cause them to lose market share and, as a result, may adversely affect their results of operations and cash flow, which in turn may mean that they would not have adequate capital to purchase our services. If competition from generic or other products impacts our customers’ finances such that they decide to curtail our services, our net revenues may decline and this could have a material adverse effect on our business, results of operations, and financial condition.
If we do not keep pace with rapid technological change, our services may become less competitive or obsolete.
The biopharmaceutical industry generally, and drug development and clinical research more specifically, are subject to rapid technological change. Our current competitors or other businesses might develop technologies or services that are more effective or commercially attractive than, or render obsolete, our current or future technologies and services. If our competitors introduce superior technologies or services and if we cannot make enhancements to remain competitive, our competitive position would be harmed. If we are unable to compete successfully, we may lose customers or be unable to attract new customers, which could lead to a decrease in our revenue and have an adverse impact on our financial condition.
In addition, the operation of our business relies on IT infrastructure and systems delivered across multiple platforms. The failure of our systems to perform could severely disrupt our business and adversely affect our results of operations. Our systems are also vulnerable to demise from natural or man-made disasters, terrorist attacks, computer viruses or hackers, power loss, or other technology system failures. These events could adversely affect our business or results of operations.
The biopharmaceutical industry has a history of patent and other intellectual property litigation and we might be involved in costly intellectual property lawsuits.
The biopharmaceutical industry has a history of intellectual property litigation and these lawsuits will likely continue in the future. Accordingly, we may face patent infringement suits or be called upon to provide documentation by companies that have patents for similar business processes or other suits alleging infringement of their intellectual property rights. Legal proceedings relating to intellectual property could be expensive, take significant time, and divert management's attention from other business concerns, regardless of the outcome of the litigation. In the event an infringement lawsuit were brought against us and we did not prevail, we might have to pay substantial damages and we could be required to stop infringing activity or obtain a license to use technology on unfavorable terms.
45
Risks Related to Our Indebtedness
Our substantial debt could adversely affect our financial condition and cash flows from operations.
On August 1, 2017, we entered into a credit agreement (the “2017 Credit Agreement”) and used the proceeds to: (i) repay the Company’s and inVentiv’s pre-Merger term loans; (ii) partially redeem inVentiv’s Senior Notes; and (iii) pay certain fees and expenses related to the Merger. As of December 31, 2017, our total principal amount of indebtedness was $2.99 billion, which was comprised of: (i) a $1.0 billion Term Loan A facility; (ii) a $1.55 billion Term Loan B facility; and (iii) $403.0 million of Senior Notes. Our substantial indebtedness could adversely affect our financial condition and cash flows from operations and thus make it more difficult for us to satisfy our obligations with respect to our senior secured facilities. If our cash flow is not sufficient to service our debt and adequately fund our business, we may be required to seek further additional financing or refinancing or dispose of assets. We might not be able to influence any of these alternatives on satisfactory terms or at all. Our substantial indebtedness could also:
• | increase our vulnerability to adverse general economic, industry, or competitive developments; |
• | require us to dedicate a more substantial portion of our cash flows from operations to payments on our indebtedness, thereby reducing the availability of our cash flows to fund working capital, investments, acquisitions, capital expenditures, and other general corporate purposes; |
• | limit our ability to make required payments under our existing contractual commitments, including our existing long-term indebtedness; |
• | limit our ability to fund a change of control offer; |
• | require us to sell certain assets; |
• | restrict us from making strategic investments, including acquisitions, or causing us to make non-strategic divestitures; |
• | limit our flexibility in planning for, or reacting to, changes in our business and the industry in which we operate; |
• | place us at a competitive disadvantage compared to our competitors that have less debt; |
• | cause us to incur substantial fees from time to time in connection with debt amendments or refinancings; |
• | increase our exposure to rising interest rates because a substantial portion of our borrowings is at variable interest rates; and |
• | limit our ability to borrow additional funds or to borrow on terms that are satisfactory to us. |
Despite our level of indebtedness, we are able to incur more debt and undertake additional obligations. Incurring such debt or undertaking such additional obligations could further exacerbate the risks to our financial condition.
We may be able to incur additional indebtedness in the future. Although covenants under our 2017 Credit Agreement limit our ability to incur certain additional indebtedness, these restrictions are subject to a number of qualifications and exceptions, and the indebtedness incurred in compliance with these restrictions could be substantial. To the extent we incur additional indebtedness, the risks associated with our leverage described above, including our possible inability to service our debt obligations, would increase.
46
Servicing our debt will require a significant amount of cash, and our ability to generate sufficient cash depends on many factors, some of which are beyond our control.
Our ability to make payments on and refinance our debt, make strategic acquisitions, and fund capital expenditures depends on our ability to generate cash flow in the future. To some extent, our ability to generate future cash flow is subject to general economic, financial, competitive, and other factors that are beyond our control. We cannot assure you that:
• | our business will generate sufficient cash flow from operations; |
• | we will continue to realize the cost savings, revenue growth, and operating improvements that resulted from the execution of our long-term strategic plan; or |
• | future sources of funding will be available to us in amounts sufficient to enable us to fund our liquidity needs. |
We also may experience difficulties repatriating cash from foreign subsidiaries and accounts due to law, regulation or contracts which could further constrain our liquidity. If we cannot fund our liquidity needs, we will have to take actions such as reducing or delaying capital expenditures, marketing efforts, strategic acquisitions, investments and alliances, selling assets, restructuring or refinancing our debt, or seeking additional equity capital. We cannot assure you that any of these remedies could, if necessary, be effected on commercially reasonable or favorable terms, or at all, or that they would permit us to meet our scheduled debt service obligations. Any inability to generate sufficient cash flow or refinance our debt on favorable terms could have a material adverse effect on our financial condition. In addition, if we incur additional debt, the risks associated with our substantial leverage, including the risk that we will be unable to service our debt or generate enough cash flow to fund our liquidity needs, could increase.
Covenant restrictions under our 2017 Credit Agreement may limit our ability to operate our business.
Our 2017 Credit Agreement contains covenants that may restrict our ability to, among other things, borrow money, pay dividends, make capital expenditures, make strategic acquisitions and effect a consolidation, merger or disposal of all or substantially all of our assets. Although the covenants in our 2017 Credit Agreement are subject to various exceptions, we cannot assure you that these covenants will not adversely affect our ability to finance future operations, capital needs, or to engage in other activities that may be in our best interest. In addition, in certain circumstances, our long-term debt requires us to maintain a specified financial ratio and satisfy certain financial condition tests, which may require that we take action to reduce our debt or to act in a manner contrary to our business objectives. A breach of any of these covenants could result in a default under our senior secured facilities. If an event of default under our 2017 Credit Agreement occurs, the lenders thereunder could elect to declare all amounts outstanding, together with accrued interest, to be immediately due and payable. In such case, we might not have sufficient funds to repay all the outstanding amounts. In addition, our 2017 Credit Agreement is secured by first priority security interests on substantially all of our real and personal property, including the capital stock of certain of our subsidiaries. If an event of default under our 2017 Credit Agreement occurs, the lenders thereunder could exercise their rights under the related security documents. Any acceleration of amounts due under our 2017 Credit Agreement or the substantial exercise by the lenders of their rights under the security documents would likely have a material adverse effect on us.
Under the terms of the lease agreement for our new corporate headquarters in Morrisville, North Carolina we are required to issue a letter of credit ("LOC") to the landlord based on our debt rating issued by Moody’s Investors Service (or other nationally-recognized debt rating agency). From June 14, 2017 through June 14, 2020, if our debt rating is Ba3 or better, no LOC is required, or if our debt rating is B1 or lower, a LOC equal to 25% of the remaining minimum annual rent and estimated operating expenses (or a LOC of approximately $24.2 million as of December 31, 2017) is required to be issued to the landlord. This LOC would remain in effect until our debt rating increased to Ba3 or higher for a twelve-month period. After June 14, 2020, if our debt rating is Ba2 or better, no LOC is required; if our debt rating is Ba3 or lower, a LOC equal to 25% of the then remaining minimum annual rent and estimated operating expenses is required to be issued to the landlord (estimated at approximately $22.0 million as of December 31, 2017); or if our debt rating is B1 or lower, a LOC equal to 100% of the then remaining minimum annual rent and estimated operating expenses is required to be issued to the landlord (estimated at approximately $87.9 million as of December 31, 2017).
47
These letters of credit would remain in effect until our debt rating is back above the required threshold for a twelve-month period.
As of December 31, 2017 (and through the date of this filing), our debt rating was Ba3. As such, no LOC is currently required. Any letters of credit issued in accordance with the aforementioned requirements would be issued under our Revolver, and would reduce our available borrowing capacity by the same amount accordingly.
Interest rate fluctuations may have a material adverse effect on our business, financial condition, results of operations or cash flows.
Because we have substantial variable rate debt, fluctuations in interest rates may affect our business, financial condition, results of operations or cash flows. We currently utilize interest rate swaps to limit our exposure to interest rate fluctuations; however, such instruments may not be effective. At December 31, 2017, we had approximately $2.99 billion of total principal indebtedness comprised of $2.55 billion in term loan debt, $403.0 million in Senior Notes, and $36.8 million of capital leases, of which $2.43 billion was subject to variable interest rates.
Risks Related to Ownership of Our Common Stock
Our stock price is subject to volatility, which could have a material adverse impact on investors and employee retention.
Since our initial public offering in November 2014 (the "IPO"), the price of our stock, as reported by NASDAQ, has ranged from a low of $19.61 on November 7, 2014 to a high of $61.10 on June 19, 2017. In addition, securities markets worldwide have experienced, and are likely to continue to experience, significant price and volume fluctuations. This market volatility, as well as general economic, market or political conditions, could affect stock price in ways that may be unrelated to our operating performance. The trading price of our stock is subject to significant price fluctuations in response to many factors, including:
• | market conditions or trends in our industry, including with respect to the regulatory environment, or the economy as a whole; |
• | fluctuations in quarterly operating results, as well as differences between our actual financial and operating results and those expected by investors, especially as we integrate inVentiv into our company; |
• | future performance guidance, if any, that we provide to the public, any changes in this guidance or our failure to meet this guidance; |
• | changes in financial estimates or ratings by any securities analysts who follow our stock, our failure to meet those estimates or the failure of those analysts to initiate or maintain coverage of our stock; |
• | changes in key personnel; |
• | entry into new markets; |
• | announcements by us or our competitors of new service offerings or significant acquisitions, divestitures, strategic partnerships, joint ventures or capital commitments; |
• | actions by competitors; |
• | changes in operating performance and market valuations of other companies in the industry; |
• | investors' perceptions of our prospects and the prospects of the industry; |
• | investors' perceptions of the investment opportunity associated with our stock relative to other investment alternatives; |
• | the public's reaction to press releases or other public announcements by us or third parties, including our filings with the SEC; |
• | announcements related to litigation; |
48
• | changes in the credit ratings of our debt; |
• | the sustainability of an active trading market for our stock; |
• | future sales of our stock by our significant shareholders, officers and directors; and |
• | other events or factors, including those resulting from system failures and disruptions, cyber-attacks, earthquakes, hurricanes, war, acts of terrorism, other natural disasters or responses to these events. |
These and other factors may cause the market price and demand for shares of our stock to fluctuate substantially, which could result in reduced liquidity and a decline in the price of our stock. When the market price of a stock is volatile, security holders often institute class action litigation against the company that issued the stock. If we become involved in this type of litigation, regardless of the outcome, we could incur substantial legal costs and our management's attention could be diverted from the operation of our business, which could have a material adverse effect on our business, financial condition, results of operations and cash flows.
We do not expect to pay any cash dividends for the foreseeable future.
We do not anticipate that we will pay any dividends to holders of our stock for the foreseeable future. Any payment of cash dividends will be at the discretion of the Board and will depend on our financial condition, capital requirements, legal requirements, earnings and other factors. Our ability to pay dividends is restricted by the terms of our 2017 Credit Agreement and might be restricted by the terms of any indebtedness that we incur in the future. Consequently, you should not rely on dividends in order to receive a return on your investment. For additional information on our dividend policy, see Part II, Item 5, "Market for Registrant's Common Equity, Related Stockholder Matters and Issuer Purchases of Equity Securities" in this Annual Report on Form 10-K.
Future sales of our stock in the public market could cause the market price of our stock to decrease significantly.
As of December 31, 2017, we had 104,435,501 outstanding shares of Class A common stock. In addition, we had 3,425,085 shares of outstanding options and restricted stock units that, if exercised or sold, would result in these additional shares becoming available for sale subject, in some cases, to Rule 144 and Rule 701 under the Securities Act. Our private equity sponsors (the “Sponsors”) together own approximately 46% of our outstanding shares and have contractual rights to cause us to register resales of those shares starting in February 2018.
Sales or issuances of substantial amounts of our stock in the public market by us or our shareholders may cause the market price of our stock to decrease significantly. The perception that such sales or issuances could occur could also depress the market price of our stock. Any such sales or issuances could also create public perception of difficulties or problems with our business and might also make it more difficult for us to raise capital through the sale of equity securities in the future at a time and price that we deem appropriate.
Our Sponsors have significant influence over our company, and their interests may be different from or conflict with those of our other shareholders.
Our Sponsors collectively beneficially own approximately 46% of our outstanding common stock. As a consequence, the Sponsors continue to be able to exert a significant degree of influence over our management, affairs, and matters requiring shareholder approval, including the election of directors, a merger, consolidation or sale of all or substantially all of our assets, and any other significant transaction. Additionally, each of the Sponsors is party to a stockholders agreement with us (the "Stockholders Agreements"). The Stockholders Agreements, among other things, requires such shareholders to vote in favor of certain nominees to our Board. The interests of the Sponsors might not always coincide with our interests or the interests of our other shareholders. For instance, this concentration of ownership and/or the restrictions imposed by the Stockholders Agreements may have the effect of delaying or preventing a change in control of us otherwise favored by our other shareholders and could depress our stock price.
The Sponsors each make investments in companies and may, from time to time, acquire and hold interests in businesses that compete directly or indirectly with us. Each of the Sponsors may also pursue, for its own account, acquisition opportunities that may be complementary to our business, and as a result, those
49
acquisition opportunities might not be available to us. Our organizational documents contain provisions renouncing any interest or expectancy held by our directors affiliated with the Sponsors in certain corporate opportunities. Accordingly, the interests of the Sponsors may supersede ours, causing the Sponsors or their affiliates to compete against us or to pursue opportunities instead of us, for which we have no recourse. Such actions on the part of the Sponsors and inaction on our part could have a material adverse effect on our business, financial condition, results of operations and cash flows.
The Sponsors control four seats on our Board. Since the Sponsors could invest in entities that directly or indirectly compete with us, when conflicts arise between the interests of the Sponsors and the interests of our shareholders, these directors might not be disinterested.
Provisions of our corporate governance documents and Delaware law could make an acquisition of our company more difficult and may prevent attempts by our shareholders to replace or remove our current management, even if beneficial to our shareholders.
Provisions of our certificate of incorporation and our amended and restated bylaws contain provisions that delay, defer or discourage transactions involving an actual or potential change in control of us or change in our management that shareholders may consider favorable, including transactions in which you might otherwise receive a premium for your shares. These provisions could also limit the price that investors might be willing to pay in the future for shares of our stock, thereby depressing the market price of our stock. In addition, these provisions may frustrate or prevent any attempts by our shareholders to replace or remove our current management by making it more difficult for shareholders to replace members of the Board. Because the Board is responsible for appointing the members of our management team, these provisions could in turn affect any attempt to replace current members of our management team. Among others, these provisions include: (i) our ability to issue preferred stock without shareholder approval; (ii) the requirement that our shareholders may not act without a meeting; (iii) requirements for advance notification of shareholder nominations and proposals contained in our bylaws; (iv) the absence of cumulative voting for our directors; (v) requirements for shareholder approval of certain business combinations; and (vi) the limitations on director nominations contained in our Stockholders Agreement.
Additionally, Section 203 of the Delaware General Corporation Law (the "DGCL") prohibits a publicly held Delaware corporation from engaging in a business combination with an interested shareholder, generally a person which together with its affiliates owns, or within the last three years has owned, 15% of our voting stock, for a period of three years after the date of the Merger in which the person became an interested shareholder, unless the business combination is approved in a prescribed manner. The existence of the foregoing provision could also limit the price that investors might be willing to pay in the future for shares of our stock, thereby depressing the market price of our stock.
If securities analysts or industry analysts downgrade our shares, publish negative research or reports, or do not publish reports about our business, stock price, and trading volume could decline.
The trading market for our stock is to some extent influenced by the research and reports that industry or securities analysts publish about us, our business and our industry. If one or more analysts adversely change their recommendation regarding our shares or our competitors' stock, our share price would likely decline. If one or more analysts cease coverage of us or fail to regularly publish reports on us, we might lose visibility in the financial markets, which in turn could cause our share price or trading volume to decline.
We are incurring increased costs and obligations as a result of being a public company.
As a public company, we are required to comply with certain additional corporate governance and financial reporting practices and policies. As a result, due to compliance requirements of the Exchange Act, the Sarbanes-Oxley Act of 2002 ("Sarbanes-Oxley"), the Dodd-Frank Act, the listing requirements of the NASDAQ, and other applicable securities rules and regulations, we have and will continue to incur significant legal, accounting and other expenses. The Exchange Act requires, among other things, that we file annual, quarterly, and current reports with respect to our business and operating results with the SEC. We are also required to ensure that we have the ability to prepare financial statements and other disclosures that are fully compliant with all SEC reporting requirements on a timely basis. Compliance with these rules and regulations has increased and may continue to increase our legal and financial compliance costs, make some activities more difficult, time-consuming, or costly, and increase demand on our systems and resources.
50
We might not be successful in complying with these requirements and the significant amount of resources required to ensure compliance could have a material adverse effect on our business, financial condition, results of operations and cash flows.
Our internal controls over financial reporting are required to meet all the standards of Section 404 of Sarbanes-Oxley, and failure to achieve and maintain effective internal controls over financial reporting could have a material adverse effect on our stock price, reputation, business, financial condition, results of operations and cash flows.
Section 404 of Sarbanes-Oxley requires management and our independent registered public accounting firm to assess and attest to the effectiveness of internal control over financial reporting on an annual basis. The rules governing the standards that must be met to assess our internal control over financial reporting are complex and require significant documentation, testing and possible remediation of our existing controls and could result in incurring significant additional expenditures. We are required to design, implement and test our internal controls over financial reporting in order to comply with this obligation. The effort necessary to meet these requirements is time consuming, costly, and complicated, and we must continually evaluate and refine these processes on an ongoing basis. We might encounter problems or delays in completing the implementation of any required improvements and therefore fail to receive a favorable attestation provided by our independent registered public accounting firm.
As a private company, inVentiv was not subject to the requirements of Section 404 of Sarbanes-Oxley. Now that the Merger has been completed, we must devote significant management time and other resources to ensure that the combined company complies with the requirements of Section 404, and there can be no assurance that it will.
Further, material weaknesses or significant deficiencies in our internal control over financial reporting may exist or otherwise be discovered in the future. If we fail to maintain an effective internal control environment, such failure could limit our ability to report our financial results accurately and timely, resulting in misstatements and/or restatements of our consolidated financial statements, which may cause investors to lose confidence and have a material adverse effect on our stock price, reputation, business, financial condition, results of operations, and cash flows.
We are a holding company and rely on dividends and other payments, advances and transfers of funds from our subsidiaries to meet our obligations and pay any dividends.
We have no direct operations and no significant assets other than ownership of 100% of the capital stock of our subsidiaries. Because we conduct our operations through our subsidiaries, we depend on those entities for dividends and other payments to generate the funds necessary to meet our financial obligations, and to pay any dividends with respect to our stock. Legal and contractual restrictions in our 2017 Credit Agreement and other agreements which may govern future indebtedness of our subsidiaries, as well as the financial condition and operating requirements of our subsidiaries, may limit our ability to obtain cash from our subsidiaries. The earnings from, or other available assets of, our subsidiaries might not be sufficient to pay dividends, make distributions, or loans to enable us to pay any dividends on our stock or other obligations. Any of the foregoing could materially and adversely affect our business, financial condition, results of operations, and cash flows.
Risks Relating to the Merger
We may be unable to fully realize the competitive and operating synergies that are projected to be achieved through the combination of INC Research’s and inVentiv Health’s offerings.
The success of the Merger will depend on, among other things, our ability to combine the business of INC Research with the business of inVentiv Health and to achieve operating synergies. If we are not able to successfully achieve this objective, the anticipated benefits of the Merger might not be realized fully, or at all, or may take longer to realize than expected. The difficulties of combining the operations of the companies include, among others:
• | difficulties in achieving anticipated cost savings, synergies, business opportunities and growth prospects from the combination; |
51
• | challenges in attracting, retaining and replacing key personnel; |
• | challenges in creating a new culture for the combined company and maintaining employee morale throughout the post-Merger period of integration and combining the operations of the two companies; |
• | difficulties in managing the expanded operations of a significantly larger and more complex company; and |
• | potential unknown liabilities and unforeseen increased expenses or delays associated with the Merger. |
For example, we incurred and will incur substantial expenses in connection with consummation of the Merger and combining the businesses, operations, networks, systems, technologies, policies and procedures of the two companies. Many of the expenses incurred and to be incurred, by their nature, are difficult to estimate accurately at the present time and as result may exceed the savings that the combined company expects to achieve from the elimination of duplicative expenses and the realization of economies of scale and cost savings related to the combination of the businesses following the Merger Date.
It is possible that the integration process or other factors could result in the disruption of our ongoing business or inconsistencies in standards, controls, procedures and policies. These transition matters could have an adverse effect on us for an undetermined amount of time after the Merger Date. In addition, events outside of our control, including changes in regulations and laws, as well as economic trends, could adversely affect our ability to realize the expected benefits from the Merger.
We may fail to realize all of the anticipated benefits of the Merger or those benefits may take longer to realize than expected. We may also encounter significant difficulties in integrating the two businesses.
Our ability to realize the anticipated benefits of the Merger will depend, to a large extent, on our ability to integrate the two businesses. The combination of two independent businesses is a complex, costly and time-consuming process. As a result, we are required to devote significant management attention and resources to integrating business practices and operations. The integration process may disrupt the businesses and, if implemented ineffectively, would restrict the realization of the full expected benefits. The failure to meet the challenges involved in integrating the two businesses and to realize the anticipated benefits of the Merger could cause an interruption of, or a loss of momentum in, our activities and could adversely affect our results of operations.
In addition, the overall integration of the businesses may result in material unanticipated problems, expenses, liabilities, competitive responses, loss of customer relationships, and diversion of management’s attention. Further, we may not have identified a significant risk within the inVentiv business that existed at the time of the Merger or that may develop in the future as a result of past practice of inVentiv. These unidentified risks may result in material unanticipated problems, expenses, liabilities, competitive responses, loss of customer relationships, and diversion of management’s attention. The difficulties of combining the operations of the companies include, among others:
• | difficulties in achieving anticipated cost savings, synergies, business opportunities and growth prospects from the combination; |
• | difficulties in the integration of the companies’ businesses; |
• | difficulties in managing the expanded operations of a significantly larger and more complex company; |
• | difficulties in integrating employees from the two companies; |
• | current and prospective employees may experience uncertainty regarding their future roles with our company, which might adversely affect our ability to retain, recruit and motivate key employees; |
• | lost customers and customer awards as a result of customers deciding not to do business with the combined company; |
• | difficulties in managing supplier relationships of both companies and resolving potential conflicts and consolidation issues that may arise; |
52
• | difficulties in systems integration, particularly information technology and finance systems, and conforming standards, controls, procedures and policies, business cultures and compensation structures between the entities; |
• | difficulties in integrating and documenting processes and controls in conformance with the requirements of Section 404 of the Sarbanes-Oxley Act of 2002, which were not applicable to inVentiv prior to the Merger; and |
• | potential unknown liabilities and unforeseen increased expenses and delays associated with the Merger. |
Many of these factors will be outside of our control and any one of them could result in increased costs, decreases in the amount of expected revenues and diversion of management’s time and energy, which could materially impact our business, financial condition and results of operations. In addition, even if the operations of the businesses of INC Research and inVentiv Health are integrated successfully, the full benefits of the Merger might not be realized, including the synergies, cost savings or sales or growth opportunities that are expected. These benefits might not be achieved within the anticipated time frame, or at all. Further, additional unanticipated costs may be incurred in the integration of the businesses of INC Research and inVentiv Health. All of these factors could negatively impact our earnings per share, decrease or delay the expected accretive effect of the Merger and negatively impact the price of our shares. As a result, there is no assurance that the combination of INC Research and inVentiv Health will result in the realization of the full benefits anticipated.
Our future results will suffer if we do not effectively manage our expanded operations following the completion of the Merger.
Following the completion of the Merger, the size of our business increased significantly beyond the former size of either INC Research’s or inVentiv Health’s businesses on a standalone basis. Our Company has no prior experience integrating a business of the size and scale of inVentiv Health. Our future success depends, in part, upon our ability to manage this expanded business, which poses substantial challenges for management, including challenges related to the management and monitoring of new operations and associated increased costs and complexity. If we are unsuccessful in managing our integrated operations, or if we do not realize the expected operating efficiencies, cost savings and other benefits currently anticipated from the Merger, our operations and financial condition could be adversely affected and we might not be able to take advantage of business development opportunities.
Item 1B. Unresolved Staff Comments.
None.
Item 2. Properties.
As of December 31, 2017, we had 146 facilities located in 47 countries. During the year ended December 31, 2017, we utilized approximately 78% of our available facility space; however, as we continue to expand in new locations, the utilization of our facilities may decline in the short term. Most of our facilities consist solely of office space. We lease all of our facilities, with the exception of office space owned in Madrid, Spain. Our headquarters and principal executive offices are located in Raleigh, North Carolina, where we lease space in two locations totaling approximately 187,700 square feet. The leases for both of our Raleigh locations expire in February 2019.
In January 2017, we entered into a 12-year lease for our new corporate headquarters building in Morrisville, North Carolina, where we intend to relocate all employees from our two existing locations in Raleigh, North Carolina. In June 2017, this lease was amended to add additional office space and extend the term of the lease to 13 years. We expect the construction of the new building to be completed in late 2018 and anticipate completing our relocation efforts prior to the current leases expiring in early 2019. In February 2017, we entered into an 11-year lease agreement for new office space in Farnborough, United Kingdom, which is near our existing Camberley site. In January 2018, we replaced our lease agreement for the Farnborough location with a new 10-year lease agreement. The new agreement provides for additional office space to accommodate our operating plans following the Merger. We also anticipate completing our relocation efforts to the Farnborough location prior to the Camberley lease expiring in 2018.
53
In addition, we lease substantial facilities in Columbus, Ohio; Camberley, United Kingdom; Gurgaon, India; Hyderabad, India; Madrid, Spain; Maidenhead, United Kingdom; Mexico City, Mexico; Munich, Germany; New York, New York; Newtown, Pennsylvania; Princeton, New Jersey; Pune, India; Quebec City, Canada; Somerset, New Jersey; Tokyo, Japan; and Toronto, Canada. We also maintain offices in various other Asian-Pacific, European, Latin American and North American locations, including Australia, the Middle East and Africa. None of our leases is individually material to our business model and all either have options to renew or are located in major markets where we believe there are adequate opportunities to continue business operations at terms satisfactory to us.
Item 3. Legal Proceedings.
We are party to legal proceedings incidental to our business. While our management currently believes the ultimate outcome of these proceedings, individually and in the aggregate, will not have a material adverse effect on our consolidated financial statements, litigation is subject to inherent uncertainties. Were an unfavorable ruling to occur, there exists the possibility of a material adverse impact on our financial condition and results of operations.
On December 1, 2017, the first of two virtually identical actions alleging federal securities law claims was filed against us and certain of our officers on behalf of a putative class of our shareholders. The first action, captioned Bermudez v. INC Research, Inc., et al, No. 17-09457 (S.D.N.Y.), names as defendants us, Michael Bell, Alistair MacDonald, Michael Gilbertini and Gregory Rush, and the second action, Vaitkuvienë v. Syneos Health, Inc., et al, No. 18-0029 (E.D.N.C.), names as defendants us, Alistair MacDonald, and Gregory S. Rush. Both complaints allege similar claims under Section 10(b) and Section 20(a) of the Securities Exchange Act of 1934 on behalf of a putative class of purchasers of our common stock between May 10, 2017 and November 8, 2017 (Vaitkuvienë action) and November 9, 2017 (Bermudez action). The complaints allege that we published inaccurate or incomplete information regarding, among other things, the financial performance and business outlook for inVentiv’s business prior to the Merger and with respect to the combined company following the merger. On January 30, 2018, two alleged shareholders of ours filed motions both seeking to be appointed lead plaintiff and approving the selection of lead counsel. These motions remain pending. We and the other defendants deny the allegations in these complaints and intend to defend vigorously against these claims.
Item 4. Mine Safety Disclosures.
Not applicable.
54
PART II
Item 5. Market for Registrants' Common Equity, Related Stockholder Matters, and Issuer Purchases of Equity Securities.
Market Information for Common Stock
The following table sets forth the high and low sales prices per share of our common stock as reported by the NASDAQ for the periods indicated:
High | Low | |||||||
Fiscal Year 2017: | ||||||||
Fourth Quarter | $ | 59.45 | $ | 33.60 | ||||
Third Quarter | $ | 59.80 | $ | 51.00 | ||||
Second Quarter | $ | 61.10 | $ | 40.65 | ||||
First Quarter | $ | 56.88 | $ | 40.85 | ||||
High | Low | |||||||
Fiscal Year 2016: | ||||||||
Fourth Quarter | $ | 52.75 | $ | 41.10 | ||||
Third Quarter | $ | 47.39 | $ | 37.27 | ||||
Second Quarter | $ | 57.11 | $ | 36.70 | ||||
First Quarter | $ | 48.13 | $ | 34.19 | ||||
Holders of Record
On February 21, 2018, there were approximately 72 shareholders of record of our common stock. This number does not include shareholders for whom shares are held in "nominee" or "street" name.
Dividend Policy
Since becoming a public company, we have not declared or paid cash dividends on our common stock, nor do we intend to pay cash dividends on our common stock in the foreseeable future. However, in the future, subject to the factors described below and our future liquidity and capitalization, we may change this policy and choose to pay dividends.
We are a holding company that does not conduct any business operations of our own. As a result, our ability to pay cash dividends on our common stock is dependent upon cash dividends, distributions, and other transfers from our subsidiaries. Our ability to pay dividends is currently restricted by the terms of our 2017 Credit Agreement, and may be further restricted by any future indebtedness we or our subsidiaries incur. In addition, under Delaware law, the Board may declare dividends only to the extent of our surplus (which is defined as total assets at fair market value minus total liabilities, minus statutory capital) or, if there is no surplus, out of our net profits for the then current and/or immediately preceding fiscal year.
Any future determination to pay dividends will be at the discretion of the Board and will take into account restrictions in our debt instruments, including our 2017 Credit Agreement, general economic business conditions, our financial condition, results of operations and cash flows, our capital requirements, our business prospects, the ability of our operating subsidiaries to pay dividends and make distributions to us, legal restrictions, and such other factors as the Board may deem relevant. For additional information on these restrictive covenants, see Part II, Item 7, "Management's Discussion and Analysis of Financial Condition and Results of Operations - Liquidity and Capital Resources" and "Note 4 - Long-Term Debt Obligations" to our audited consolidated financial statements included in Part II, Item 8, "Financial Statements and Supplementary Data" in this Annual Report on Form 10-K.
Recent Sales of Unregistered Securities
We did not have any sales of unregistered securities during 2017.
55
Purchases of Equity Securities by the Issuer
We did not purchase any equity securities during 2017.
Stock Performance Graph
The information included under the heading “Stock Performance Graph” is “furnished” and not “filed” for purposes of Section 18 of the Exchange Act, or otherwise subject to the liabilities of that section, nor shall it be deemed to be “soliciting material” subject to Regulation 14A or incorporated by reference in any filing under the Securities Act of 1933, as amended, or the Exchange Act of 1934, as amended.
In connection with our rebranding under the name Syneos Health, Inc., effective January 8, 2018, our common stock is traded on the NASDAQ under the symbol “SYNH”. From November 7, 2014 through January 7, 2018, our common stock was listed on the NASDAQ under the symbol "INCR". The Stock Price Performance Graph set forth below compares the cumulative total shareholder return on our common stock for the period from November 7, 2014 through December 31, 2017, with the cumulative total return of the Nasdaq Composite Index and the Nasdaq Health Care Index over the same period. The comparison assumes $100 was invested on November 7, 2014 in the common stock of Syneos Health, Inc., in the Nasdaq Composite Index, and in the Nasdaq Health Care Index and assumes reinvestment of dividends, if any.
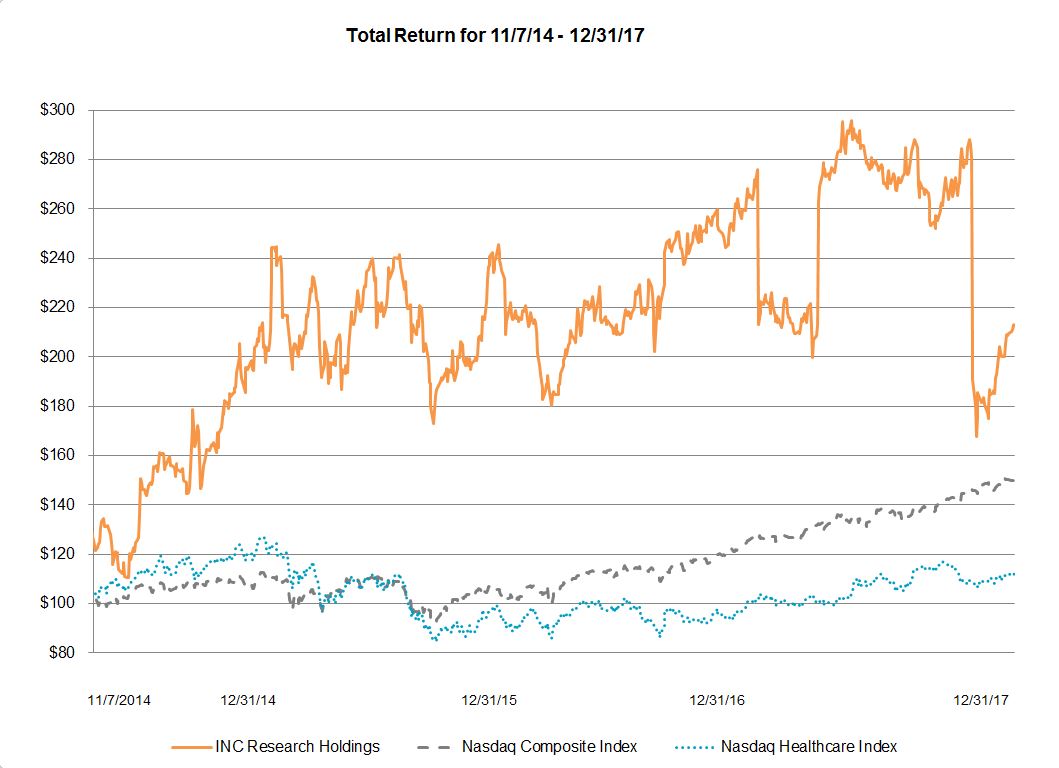
The stock price performance shown on the graph above is not necessarily indicative of future price performance. Information used in the graph was obtained from the Nasdaq Stock Market, a source believed to be reliable, but we are not responsible for any errors or omissions in such information.
56
Equity Compensation Plans
The information required by Part II, Item 5, "Market for Registrant's Common Equity, Related Stockholder Matters and Issuer Purchases of Equity Securities" in this Annual Report on Form 10-K regarding equity compensation plans is incorporated herein by reference to Part III, Item 12, "Security Ownership of Certain Beneficial Owners and Management and Related Stockholder Matters” in this Annual Report on Form 10-K.
57
Item 6. Selected Financial Data.
The following tables set forth our selected consolidated financial data for the periods ending on and as of the dates indicated. We derived the consolidated statements of operations data for the years ended December 31, 2017, 2016 and 2015 and the consolidated balance sheet data as of December 31, 2017 and 2016 from our audited consolidated financial statements included in Part II, Item 8, "Financial Statements and Supplementary Data" in this Annual Report on Form 10-K. We derived the consolidated statements of operations data for the years ended December 31, 2014 and 2013 and the consolidated balance sheet data as of December 31, 2015, 2014, and 2013 from our audited consolidated financial statements not included in this Annual Report on Form 10-K. You should read the consolidated financial data set forth below together with our consolidated financial statements and the related notes thereto included in Part II, Item 8, "Financial Statements and Supplementary Data" and Part II, Item 7 "Management's Discussion and Analysis of Financial Condition and Results of Operations" in this Annual Report on Form 10-K. Our historical results are not necessarily indicative of future results of operations.
Year Ended December 31, | |||||||||||||||||||
2017(a) | 2016 | 2015 | 2014 | 2013 | |||||||||||||||
(in thousands, except per share amounts) | |||||||||||||||||||
Statement of Operations Data: | |||||||||||||||||||
Net service revenue | $ | 1,852,843 | $ | 1,030,337 | $ | 914,740 | $ | 809,728 | $ | 652,418 | |||||||||
Reimbursable out-of-pocket expenses | 819,221 | 580,259 | 484,499 | 369,071 | 342,672 | ||||||||||||||
Total revenue | 2,672,064 | 1,610,596 | 1,399,239 | 1,178,799 | 995,090 | ||||||||||||||
Costs and operating expenses: | |||||||||||||||||||
Direct costs (exclusive of depreciation and amortization) | 1,232,023 | 626,633 | 542,404 | 515,059 | 432,261 | ||||||||||||||
Reimbursable out-of-pocket expenses | 819,221 | 580,259 | 484,499 | 369,071 | 342,672 | ||||||||||||||
Selling, general, and administrative | 282,620 | 172,386 | 156,609 | 145,143 | 117,890 | ||||||||||||||
Restructuring and other costs(b) | 33,315 | 13,612 | 1,785 | 6,192 | 11,828 | ||||||||||||||
Transaction and integration-related expenses(c) | 123,815 | 3,143 | 1,637 | 7,902 | 508 | ||||||||||||||
Asset impairment charges(d) | 30,000 | — | 3,931 | 17,245 | — | ||||||||||||||
Depreciation | 44,407 | 21,353 | 18,140 | 21,619 | 19,175 | ||||||||||||||
Amortization | 135,529 | 37,851 | 37,874 | 32,924 | 39,298 | ||||||||||||||
(Loss) income from operations | (28,866 | ) | 155,359 | 152,360 | 63,644 | 31,458 | |||||||||||||
Other (expense) income, net: | |||||||||||||||||||
Interest expense, net | (62,543 | ) | (11,800 | ) | (15,448 | ) | (52,787 | ) | (60,489 | ) | |||||||||
Loss on extinguishment of debt | (622 | ) | (439 | ) | (9,795 | ) | (46,750 | ) | — | ||||||||||
Other (expense) income, net | (19,846 | ) | (9,002 | ) | 3,857 | 7,689 | (1,649 | ) | |||||||||||
(Loss) income before provision for income taxes | (111,877 | ) | 134,118 | 130,974 | (28,204 | ) | (30,680 | ) | |||||||||||
Income tax (expense) benefit | (26,592 | ) | (21,488 | ) | (13,927 | ) | 4,734 | (10,849 | ) | ||||||||||
Net (loss) income | (138,469 | ) | 112,630 | 117,047 | (23,470 | ) | (41,529 | ) | |||||||||||
Class C common stock dividends | — | — | — | (375 | ) | (500 | ) | ||||||||||||
Redemption of New Class C common stock | — | — | — | (3,375 | ) | — | |||||||||||||
Net (loss) income attributable to common shareholders | $ | (138,469 | ) | $ | 112,630 | $ | 117,047 | $ | (27,220 | ) | $ | (42,029 | ) | ||||||
Earnings per share attributable to common shareholders: | |||||||||||||||||||
Basic | $ | (1.85 | ) | $ | 2.08 | $ | 2.02 | $ | (0.51 | ) | $ | (0.81 | ) | ||||||
Diluted | $ | (1.85 | ) | $ | 2.03 | $ | 1.95 | $ | (0.51 | ) | $ | (0.81 | ) | ||||||
Weighted average common shares outstanding: | |||||||||||||||||||
Basic | 74,913 | 54,031 | 57,888 | 53,301 | 52,009 | ||||||||||||||
Diluted | 74,913 | 55,610 | 60,146 | 53,301 | 52,009 | ||||||||||||||
58
As of December 31, | |||||||||||||||||||
2017(a) | 2016 | 2015 | 2014 | 2013 | |||||||||||||||
(in thousands) | |||||||||||||||||||
Balance Sheet Data: | |||||||||||||||||||
Cash and cash equivalents | $ | 321,262 | $ | 102,471 | $ | 85,011 | $ | 126,453 | $ | 96,972 | |||||||||
Total assets(e) | 7,285,867 | 1,288,507 | 1,211,219 | 1,241,365 | 1,227,455 | ||||||||||||||
Total debt and capital leases(e)(f) | 3,007,724 | 497,724 | 501,839 | 416,257 | 588,823 | ||||||||||||||
Total shareholders' equity | 3,022,579 | 301,473 | 217,434 | 392,209 | 276,207 | ||||||||||||||
Other Financial Data: | |||||||||||||||||||
Backlog(g) | $ | 3,796,444 | $ | 1,878,267 | $ | 1,701,587 | $ | 1,532,051 | $ | 1,433,024 | |||||||||
Net new business awards(g) | 1,819,348 | 1,216,871 | 1,114,065 | 942,283 | 851,234 | ||||||||||||||
Net Book-to-Bill ratio(h) | 1.25x | 1.19x | 1.23x | 1.18x | 1.32x | ||||||||||||||
Year Ended December 31, | |||||||||||||||||||
2017(a) | 2016 | 2015 | 2014 | 2013 | |||||||||||||||
(in thousands) | |||||||||||||||||||
Statement of Cash Flow Data: | |||||||||||||||||||
Net cash provided by (used in): | |||||||||||||||||||
Operating activities | $ | 198,258 | $ | 109,332 | $ | 204,740 | $ | 131,447 | $ | 37,270 | |||||||||
Investing activities | (1,722,907 | ) | (31,353 | ) | (21,111 | ) | (27,853 | ) | (17,714 | ) | |||||||||
Financing activities | 1,734,368 | (53,316 | ) | (211,399 | ) | (67,698 | ) | (6,841 | ) | ||||||||||
Other Financial Data: | |||||||||||||||||||
Capital expenditures | $ | (43,896 | ) | $ | (31,353 | ) | $ | (21,111 | ) | $ | (25,551 | ) | $ | (17,714 | ) | ||||
Dividends paid | — | — | — | (375 | ) | (500 | ) | ||||||||||||
Redemption of New Class C common stock | — | — | — | (3,375 | ) | — | |||||||||||||
Non-GAAP Financial Measures(i): | |||||||||||||||||||
EBITDA | $ | 130,602 | $ | 205,122 | $ | 202,436 | $ | 79,126 | $ | 88,282 | |||||||||
Adjusted Net Service Revenue | 1,885,533 | 1,030,337 | 914,740 | 800,728 | 652,418 | ||||||||||||||
Adjusted EBITDA | 391,899 | 244,506 | 221,360 | 145,276 | 105,521 | ||||||||||||||
Adjusted Net Income | 195,955 | 139,007 | 120,174 | 44,647 | 16,290 | ||||||||||||||
Adjusted Diluted Earnings per share | $ | 2.57 | $ | 2.50 | $ | 2.00 | $ | 0.83 | $ | 0.31 | |||||||||
(a) | We completed our Merger with inVentiv on August 1, 2017. Our consolidated financial results include the financial results of inVentiv as of and since the date of the Merger. |
(b) | Restructuring and other costs consist primarily of: (i) severance costs associated with merger related workforce reductions; (ii) severance costs associated with a reduction/optimization of our workforce in line with our expectations of future business operations; (iii) transition costs associated with the change in our Chief Executive Officer (2016 and 2017 only), (iv) termination costs in connection with abandonment and closure of redundant facilities and other lease-related charges; and (v) consulting costs incurred for the continued consolidation of legal entities and restructuring of our contract management process to meet the requirements of upcoming accounting regulation changes. |
(c) | Transaction and integration-related expenses were $123.8 million for the year ended December 31, 2017 and primarily related legal and professional fees associated with the Merger. Included in transaction and integration-related expenses for 2017 is a benefit of $12.3 million from the reduction in fair value of contingent tax-sharing obligations payable to the former shareholders of inVentiv as a result of the enactment of the Tax Act of 2017. Transaction expenses for the year ended December 31, 2016 were $3.1 million and represented fees associated with secondary stock offerings and the August 2016 stock repurchase, debt refinancing costs and legal fees associated with other corporate transactions. Transaction expenses for the year ended December 31, 2015 were $1.6 million and primarily consisted of fees associated with our secondary stock offerings, debt placement and refinancing and other corporate transactions. Transaction expenses for the year ended December 31, 2014 were $7.9 million and primarily consisted of debt issuance costs and third-party fees associated with our debt refinancings, fees associated with the termination of the Avista Capital Partners, L.P. consulting agreement, and legal fees associated with the MEK Consulting acquisition. Transaction expenses of $0.5 million for the year ended December 31, 2013 related to third-party fees associated with |
59
debt refinancing and the legal fees associated with our acquisition of MEK Consulting which was completed in March 2014.
(d) | During the year ended December 31, 2017, we recorded an impairment charge of $30.0 million related to the impairment of the Company's INC Research tradename in connection with the Company’s announced rebranding. During the year ended December 31, 2015, we recorded a $3.9 million impairment charge related to goodwill and long-lived assets associated with our Phase I Services reporting unit, a component of our Clinical Solutions segment. During the year ended December 31, 2014, we recorded a $17.2 million impairment charge related to intangible assets and goodwill associated with our Global Consulting reporting unit, a component of the Commercial Solutions segment, and Phase I Services reporting unit, a component of our Clinical Solutions segment. |
(e) | Total assets, total debt and capital leases have been reduced by $20.7 million, $2.3 million, $3.2 million, $3.7 million, and $5.7 million of debt issuance costs associated with the Term Loans as of December 31, 2017, 2016, 2015, 2014, and 2013, respectively. |
(f) | Total debt and capital leases include $38.7 million of a premium related to our Senior Notes, net of original issue debt discount for the Term Loan B as of December 31, 2017. Total debt and capital leases include $5.5 million and $4.6 million of unamortized discounts as of December 31, 2014 and 2013, respectively. |
(g) | Backlog consists of anticipated future net service revenue from contract and pre-contract commitments that are supported by written communications. Net new business awards represent the value of future net service revenue awarded during the period. In connection with the Merger, we re-evaluated our existing backlog policy for our Clinical Solutions segment. As a result of this evaluation, effective during the third quarter of 2017, we changed our policy for calculating and reporting the amounts of our net new business awards and backlog. Refer to Part II, Item 7, "Management's Discussion and Analysis - New Business Awards and Backlog" in this Annual Report on Form 10-K for a description of our current policy. The majority of our contracts can be terminated by our customers with 30 days notice. These adjustments resulted in a reduction to our backlog of approximately $284.5 million as of September 30, 2017 and prior periods have been retroactively adjusted for comparability purposes. We have recorded the backlog assumed in the Merger consistent with our new backlog policy. We do not currently report new business awards or backlog data for our Commercial Solutions segment. |
(h) | Net book-to-bill ratio represents "net new business awards" divided by Clinical Solutions net service revenue. We believe net book-to-bill ratio is commonly used in our industry and represents a useful indicator of our potential future revenue growth rate in that it measures the rate at which we are generating net new business awards compared to our current revenues. We cannot assure you that the net book-to-bill ratio is predictive of future financial performance because it will likely be impacted by a number of factors, including the size and duration of projects, which can be performed over several years, project change orders resulting in increases or decreases in project scope, and cancellations. As a result of the policy changes to backlog and net new business awards discussed above, we have retroactively adjusted net book-to-bill ratio for prior periods for comparability purposes. |
(i) | We report our financial results in accordance with U.S. GAAP. To supplement this information, we also use the following non-GAAP financial measures in this report: Adjusted Net Service Revenue, EBITDA, Adjusted EBITDA, Adjusted Net Income and Adjusted Diluted Earnings per share. For a discussion of the non-GAAP financial measures in this Annual Report on Form 10-K, see "Non-GAAP Financial Measures" below. Investors are encouraged to review the following reconciliations of these non-GAAP measures to our closest reported GAAP measures. |
60
Reconciliation of GAAP Measures to Non-GAAP Measures
Year Ended December 31, | |||||||||||||||||||
2017(a) | 2016 | 2015 | 2014 | 2013 | |||||||||||||||
(in thousands, except per share amounts) | |||||||||||||||||||
Net Service Revenue (as reported) | $ | 1,852,843 | $ | 1,030,337 | $ | 914,740 | $ | 809,728 | $ | 652,418 | |||||||||
Acquisition-related revenue adjustments(b) | 32,690 | — | — | — | — | ||||||||||||||
Change order adjustment(c) | — | — | — | (9,000 | ) | — | |||||||||||||
Adjusted Net Service Revenue | $ | 1,885,533 | $ | 1,030,337 | $ | 914,740 | $ | 800,728 | $ | 652,418 | |||||||||
EBITDA and Adjusted EBITDA: | |||||||||||||||||||
Net (loss) income | $ | (138,469 | ) | $ | 112,630 | $ | 117,047 | $ | (23,470 | ) | $ | (41,529 | ) | ||||||
Interest expense, net | 62,543 | 11,800 | 15,448 | 52,787 | 60,489 | ||||||||||||||
Income tax expense (benefit) | 26,592 | 21,488 | 13,927 | (4,734 | ) | 10,849 | |||||||||||||
Depreciation | 44,407 | 21,353 | 18,140 | 21,619 | 19,175 | ||||||||||||||
Amortization | 135,529 | 37,851 | 37,874 | 32,924 | 39,298 | ||||||||||||||
EBITDA | 130,602 | 205,122 | 202,436 | 79,126 | 88,282 | ||||||||||||||
Acquisition-related revenue adjustments(b) | 32,690 | — | — | — | — | ||||||||||||||
Change order adjustment(c) | — | — | — | (9,000 | ) | — | |||||||||||||
Restructuring and other costs(d) | 33,315 | 13,612 | 1,785 | 6,192 | 11,828 | ||||||||||||||
Transaction and integration-related expenses(e) | 123,815 | 3,143 | 1,637 | 7,902 | 508 | ||||||||||||||
Asset impairment charges(f) | 30,000 | — | 3,931 | 17,245 | — | ||||||||||||||
Share-based compensation(g) | 24,577 | 14,020 | 5,074 | 3,370 | 2,419 | ||||||||||||||
Contingent consideration and other expense(h) | — | 1,696 | 559 | 918 | 253 | ||||||||||||||
Monitoring and advisory fees(i) | — | — | — | 462 | 582 | ||||||||||||||
R&D tax credit adjustment(j) | (3,568 | ) | (2,528 | ) | — | — | — | ||||||||||||
Other expense (income)(k) | 19,846 | 9,002 | (3,857 | ) | (7,689 | ) | 1,453 | ||||||||||||
Loss on unconsolidated affiliates(l) | — | — | — | — | 196 | ||||||||||||||
Loss on extinguishment of debt(m) | 622 | 439 | 9,795 | 46,750 | — | ||||||||||||||
Adjusted EBITDA | $ | 391,899 | $ | 244,506 | $ | 221,360 | $ | 145,276 | $ | 105,521 | |||||||||
61
Reconciliation of GAAP Measures to Non-GAAP Measures (continued)
Year Ended December 31, | |||||||||||||||||||
2017(a) | 2016 | 2015 | 2014 | 2013 | |||||||||||||||
(in thousands, except per share amounts) | |||||||||||||||||||
Adjusted Net Income: | |||||||||||||||||||
Net (loss) income | $ | (138,469 | ) | $ | 112,630 | $ | 117,047 | $ | (23,470 | ) | $ | (41,529 | ) | ||||||
Amortization | 135,529 | 37,851 | 37,874 | 32,924 | 39,298 | ||||||||||||||
Acquisition-related revenue adjustments(b) | 32,690 | — | — | — | — | ||||||||||||||
Change order adjustment(c) | — | — | — | (9,000 | ) | — | |||||||||||||
Restructuring and other costs(d) | 33,315 | 13,612 | 1,785 | 6,192 | 11,828 | ||||||||||||||
Transaction and integration-related expenses(e) | 123,815 | 3,143 | 1,637 | 7,902 | 508 | ||||||||||||||
Asset impairment charges(f) | 30,000 | — | 3,931 | 17,245 | — | ||||||||||||||
Share-based compensation(g) | 24,577 | 14,020 | 5,074 | 3,370 | 2,419 | ||||||||||||||
Contingent consideration and other expense(h) | — | 1,696 | 559 | 918 | 253 | ||||||||||||||
Monitoring and advisory fees(i) | — | — | — | 462 | 582 | ||||||||||||||
R&D tax credit adjustment(j) | (3,568 | ) | (2,528 | ) | — | — | — | ||||||||||||
Other expense (income)(k) | 19,846 | 9,002 | (3,857 | ) | (7,689 | ) | 1,453 | ||||||||||||
Loss on unconsolidated affiliates(l) | — | — | — | — | 196 | ||||||||||||||
Loss on extinguishment of debt(m) | 622 | 439 | 9,795 | 46,750 | — | ||||||||||||||
Bridge financing fee(n) | 5,815 | — | — | — | — | ||||||||||||||
Adjust income tax to normalized rate(o) | (162,632 | ) | (50,858 | ) | (53,671 | ) | (30,957 | ) | 1,282 | ||||||||||
Impact of Tax Cut and Jobs Act(p) | 94,415 | — | — | — | — | ||||||||||||||
Adjusted Net Income | $ | 195,955 | $ | 139,007 | $ | 120,174 | $ | 44,647 | $ | 16,290 | |||||||||
Adjusted Diluted Earnings Per Share: | |||||||||||||||||||
Adjusted diluted earnings per share | $ | 2.57 | $ | 2.50 | $ | 2.00 | $ | 0.83 | $ | 0.31 | |||||||||
Adjusted Diluted weighted average common shares outstanding(q) | 76,168 | 55,610 | 60,146 | 53,858 | 52,033 | ||||||||||||||
(a) | We completed our Merger with inVentiv on August 1, 2017. Our consolidated financial results include the financial results of inVentiv as of and since the date of the Merger. |
(b) | Represents non-cash adjustments resulting from the revaluation of deferred revenue and the subsequent elimination of revenue in purchase accounting in connection with business combinations. As a result of the Merger, we conformed inVentiv's revenue recognition accounting policies with ours, which resulted in recognition of additional $6.0 million of revenue in the fourth quarter of 2017. Under revenue recognition accounting policies of inVentiv, this revenue has historically been recognized in the first quarter of each fiscal year. We have eliminated this one-time benefit from our non-GAAP financial measures. |
(c) | During the second and third quarters of 2014, we experienced higher-than-normal change order activity estimated to be between $6 million and $12 million. Adjusted Net Service Revenue, Adjusted EBITDA, Adjusted Net Income, and Adjusted Diluted Earnings per share for 2014 have been adjusted by $9.0 million to remove the impact of this higher-than-normal change order activity. |
(d) | Restructuring and other costs consist of: (i) severance costs associated with merger related workforce reductions; (ii) severance costs associated with a reduction/optimization of our workforce in line with our expectations of future business operations; (iii) transition costs associated with the change in our Chief Executive Officer (2016 and 2017 only); (iv) termination costs in connection with abandonment and closure of redundant facilities and other lease-related charges; and (v) consulting costs incurred for the continued consolidation of legal entities and restructuring of our contract management process to meet the requirements of upcoming accounting regulation changes. |
(e) | Represents fees associated with business combinations, stock repurchases and secondary stock offerings, debt placement and refinancings, IPO costs, and other corporate transactions costs. |
(f) | Represents impairment of goodwill, intangible assets, and long-lived assets. |
(g) | Represents share-based compensation expense related to awards granted under equity incentive plans. |
62
(h) | Consists of contingent consideration expense incurred as a result of acquisitions and other expenses accounted for as compensation expense under U.S. GAAP. |
(i) | Represents monitoring and advisory fees paid to affiliates of Avista Capital Partners, L.P in the periods prior to the initial public offering in November 2014, as well as reimbursements of expenses paid to affiliates of Avista Capital Partners, L.P. and affiliates of Teachers' Private Capital pursuant to the Expense Reimbursement Agreement. These arrangements were terminated upon completion of our initial public offering. |
(j) | Represents research and development tax credits in certain international locations for expenses incurred and recorded as a reduction of direct costs. |
(k) | Represents other expense (income) comprised primarily of foreign exchange gains and losses. |
(l) | Represents losses (gains) associated with unconsolidated affiliates. |
(m) | Represents loss on extinguishment of debt associated with our debt modifications and refinancing activities. |
(n) | Represents bridge financing fees incurred in connection with the Merger related to an unused financing commitment taken out prior to securing our 2017 Credit Agreement. |
(o) | Our effective tax rate has been adjusted to an overall effective rate of 32.6% in 2017, 34% in 2016, 36% in 2015 and 37% in 2014, and 2013. This rate has been adjusted to exclude tax impacts related to valuation allowances recorded against deferred tax assets. |
(p) | Represents the direct and indirect net income tax expense recorded in the three months and year ended December 31, 2017 as a result of the enactment of the Tax Act. For further details on the impact of the Tax Act refer to "Note 12 - Income Taxes" to our consolidated financial statements included in Part II, Item 8, "Financial Statements and Supplementary Data " in this Annual Report on Form 10-K. |
(q) | Diluted weighted average common shares outstanding has been adjusted to give effect to dilutive securities for purposes of calculating adjusted diluted earnings per share by 1,255, 557, and 24 shares for the years ended December 31, 2017, 2014, and 2013, respectively. These shares were excluded from the calculation of GAAP earnings per share as we reported a net loss for the period. |
Non-GAAP Financial Measures
We report our financial results in accordance with U.S. GAAP. To supplement this information, we also use the following non-GAAP financial measures in this Annual Report on Form 10-K: Adjusted Net Service Revenue, EBITDA, Adjusted EBITDA, Adjusted Net Income and Adjusted Diluted Earnings per share. Management believes that these non-GAAP measures provide useful supplemental information to management and investors regarding the underlying performance of our business operations. We use these non-GAAP measures to, among other things, evaluate our operating performance on a consistent basis, calculate incentive compensation for our employees and assess compliance with various metrics associated with our Credit Agreement.
Adjusted Net Service Revenue is the consolidated net service revenue adjusted to: (i) include revenue eliminated under purchase accounting; (ii) exclude revenue due to conforming inVentiv revenue recognition policies; and (iii) reduce revenue to adjust for higher-than-normal change order activity during the period.
EBITDA represents earnings before interest, taxes, depreciation, and amortization. Adjusted EBITDA represents EBITDA, further adjusted to include revenue eliminated under purchase accounting and an increase in revenue due to conforming the legacy inVentiv revenue recognition policy and to exclude the impact of higher-than-normal revenue change order activity, and certain expenses and transactions that we believe are not representative of our core operating results, including: management fees that terminated upon our IPO; restructuring and other costs; transaction and integration-related expenses; non-cash share-based compensation expense; contingent consideration and other expenses; asset impairment charges; loss on extinguishment of debt; R&D tax credit adjustments; results of and gains or losses from the sale of unconsolidated affiliates; and other income (expense).
Adjusted Net Income and Adjusted Diluted Earnings per share represent net income (loss) adjusted to include revenue eliminated under purchase accounting and an increase in revenue due to conforming the legacy
63
inVentiv revenue recognition policy and to exclude the impact of higher-than-normal revenue change order activity and certain expenses and transactions that we believe are not representative of our core operating results, including: acquisition-related amortization; restructuring and other costs; transaction and integration-related expenses; asset impairment charges: non-cash share-based compensation expense; contingent consideration and other expenses; management fees that terminated upon our IPO; R&D tax credit adjustments: other income (expense); results of and gains or losses from the sale of unconsolidated affiliates; loss on extinguishment of debt: bridge financing fees related to unused financing commitments; adjustments to our tax rate to reflect an expected long-term tax rate that excludes the impact of our valuation allowances and historical NOLs; and adjustments related to the estimated of the enactment of the Tax Act.
We believe that EBITDA is a useful metric for investors as it is a common metric used by investors, analysts and debt holders to measure our ability to service our debt obligations, fund capital expenditures and meet working capital requirements.
Each of the non-GAAP measures are used by management and the Board to evaluate our core operating results as it excludes certain items whose fluctuations from period-to-period do not necessarily correspond to changes in the core operations of the business. Adjusted Net Income (including Adjusted Diluted Earnings per Share) are used by management and the Board to assess our business, as well as by investors and analysts, to measure our performance.
These non-GAAP measures are performance measures only and are not measures of our cash flows or liquidity. Adjusted Net Service Revenue, EBITDA, Adjusted EBITDA, Adjusted Net Income and Adjusted Diluted Earnings per share are non-GAAP financial measures that are not in accordance with, or an alternative for, measures of financial performance prepared in accordance with U.S. GAAP and may be different from similarly titled non-GAAP measures used by other companies. Non-GAAP measures have limitations in that they do not reflect all of the amounts associated with our results of operations as determined in accordance with U.S. GAAP. Some of the limitations are:
• | EBITDA and Adjusted EBITDA do not reflect the significant interest expense, or the cash requirements necessary to service interest or principal payments, on our debt; |
• | although depreciation and amortization are non-cash charges, the assets being depreciated and amortized may have to be replaced in the future, and EBITDA, Adjusted EBITDA and Adjusted Net Income do not reflect the cash requirements for such replacements; and |
• | EBITDA, Adjusted EBITDA, and Adjusted Net Income do not reflect our actual tax expense or, in the case of EBITDA and Adjusted EBITDA, the cash requirements to pay our taxes. |
See the consolidated financial statements included in Part II, Item 8, "Financial Statements and Supplementary Data" in this Annual Report on Form 10-K for our GAAP results. Additionally, for reconciliations of Adjusted Net Service Revenue, EBITDA, Adjusted EBITDA, Adjusted Net Income and Adjusted Diluted Earnings per share to our closest reported GAAP measures see "Selected Financial Data - Reconciliation of GAAP Measures to Non-GAAP Measures" above.
64
Item 7. Management's Discussion and Analysis of Financial Condition and Results of Operations.
The following discussion and analysis of our financial condition and results of operations should be read together with Part II, Item 6, "Selected Financial Data" in this Annual Report on Form 10-K and the consolidated financial statements and the related notes included in Part II, Item 8, "Financial Statements and Supplementary Data" in this Annual Report on Form 10-K. This discussion contains forward-looking statements related to future events and our future financial performance that are based on current expectations and subject to risks and uncertainties. Our actual results may differ materially from those anticipated in these forward-looking statements as a result of many factors, including those described in Part I, Item 1A, "Risk Factors" and elsewhere in this Annual Report on Form 10-K.
Overview of Our Business and Services
Syneos Health, Inc. (the “Company,” “we,” “us,” and “our”) is a leading global biopharmaceutical services organization comprised of an end-to-end clinical contract research organization (“CRO”) and contract commercial organization (“CCO”). We offer both standalone and integrated biopharmaceutical development and commercialization services ranging from Phase I to Phase IV clinical trial services to services associated with the commercialization of biopharmaceutical products. Our customers include small, mid-sized, and large companies in the pharmaceutical, biotechnology, and medical device industries, and our revenue is derived through a broad suite of services designed to enhance our customers’ ability to successfully develop, launch, and market their products. We consistently and predictably deliver our services in a complex environment and offer a proprietary, operational approach to the delivery of our projects through our Trusted Process® methodology.
On August 1, 2017, we completed a merger (the “Merger”) with Double Eagle Parent, Inc. (“inVentiv”), the parent company of inVentiv Health, Inc. under the terms of the merger agreement, dated May 10, 2017 (the “Merger Agreement”). Upon closing, inVentiv was merged with and into the Company, and the separate corporate existence of inVentiv ceased. In conjunction with the Merger, we entered into the 2017 Credit Agreement to: (i) repay the Company’s and inVentiv’s pre-Merger term loans; (ii) partially redeem inVentiv’s Senior Unsecured Notes; and (iii) pay fees and expenses related to the Merger. See further discussion in "Note 3 - Business Combinations" to our consolidated financial statements included in Part II, Item 8, "Financial Statements and Supplementary Data" in this Annual Report on Form 10-K for additional details on the Merger.
Following the Merger, we realigned our operating segments to reflect the current structure under which we evaluate our performance, make strategic decisions and allocate resources. As a result of this realignment, effective August 1, 2017, we began managing our business through two reportable segments: Clinical Solutions and Commercial Solutions.
Our Clinical Solutions segment offers a variety of services spanning Phase I to Phase IV of clinical development, including full-service global studies, as well as individual service offerings such as clinical monitoring, investigator recruitment, patient recruitment, data management, and study startup to assist customers with their drug development process. Our Commercial Solutions segment provides the pharmaceutical, biotechnology, and healthcare industries commercialization services, which include outsourced selling solutions, communication solutions (public relations and advertising), and consulting services. Our management reviews segment performance and allocates resources based upon segment revenue and segment operating income. Historical segment reporting has been revised to reflect these changes to our segment structure. Prior to the Merger, our Commercial Solutions segment consisted solely of a consulting offering. See further discussion in "Note 14 - Segment Information" to our consolidated financial statements included in Part II, Item 8, "Financial Statements and Supplementary Data" in this Annual Report on Form 10-K.
For financial information regarding revenue and long-lived assets by geographic areas, see "Note 15 - Operations by Geographic Location" to our consolidated financial statements included in Part II, Item 8, "Financial Statements and Supplementary Data" in this Annual Report on Form 10-K.
65
New Business Awards and Backlog
In connection with the Merger, we re-evaluated our existing backlog policy for our Clinical Solutions segment. As a result of this evaluation, effective during the third quarter of 2017, we changed our policy for calculating and reporting the amounts of our net new business awards and backlog. Under the new backlog policy for our Clinical Solutions segment, we add new business awards to backlog when we enter into a contract or when we receive a written commitment from the customer selecting us as a service provider, provided that:
• | the customer has received appropriate internal funding approval and collection of the award value is probable; |
• | the project or projects are not contingent upon completion of another trial or event; |
• | the project or projects are expected to commence within the next six months; |
• | the customer has entered or intends to enter into a comprehensive contract as soon as practicable; and |
• | for awards related to our FSP offering, only a maximum of twelve months of services are included. |
In addition, we continually evaluate our backlog to determine if any of the previously awarded work is no longer expected to be performed, regardless of whether we have received formal cancellation notice from the customer. If we determine that any previously awarded work is no longer probable of being performed, we remove the value from our backlog based on risk. We recognize revenue from these awards as services are performed, provided we have entered into a contractual commitment with the customer. We recorded the backlog assumed in the Merger consistent with our new backlog policy.
We do not currently report new business awards or backlog data for our Commercial Solutions segment. Accordingly, all disclosures related to net new service awards and backlog pertain solely to our Clinical Solutions segment.
Backlog
Our Clinical Solutions backlog consists of anticipated future net service revenue from business awards that either have not started but are anticipated to begin in the future (as noted above), or that are in process and have not been completed. Our backlog also reflects any cancellation or adjustment activity related to these contracts. The average duration of our contracts will fluctuate from period to period in the future based on the contracts comprising our backlog at any given time. The majority of our Clinical Solutions segment contracts can be terminated by the customer with a 30-day notice.
As of December 31, 2017 and 2016, our Clinical Solutions backlog was $3.80 billion and $1.88 billion, respectively (inVentiv contributed approximately $1.51 billion of our December 31, 2017 Clinical Solutions backlog). We expect approximately $1.88 billion of our Clinical Solutions backlog at December 31, 2017 will be recognized as revenue during 2018, with the remainder expected to be translated into revenue beyond 2018. We adjust the amount of our backlog each quarter for the effects of fluctuations in foreign currency exchange rates. During the year ended December 31, 2017, fluctuations in foreign currency exchange rates resulted in a favorable impact on our December 31, 2017 backlog in the amount of $47.3 million, primarily due to the strengthening of the Euro against the U.S. dollar.
We believe that our backlog and net new business awards might not be consistent indicators of future revenue because they have been, and likely will be, affected by a number of factors, including the variable size and duration of projects, many of which are performed over several years, and cancellations and changes to the scope of work during the course of projects. Additionally, projects may be canceled or delayed by the customer or regulatory authorities. Projects that have been delayed for less than six months generally remain in backlog, but the anticipated timing of the recognition of revenue is uncertain. We generally do not have a contractual right to the full amount of the awards reflected in our backlog. If a customer cancels an award, we might be reimbursed for the costs we have incurred. As we increasingly compete for and enter into large contracts that are more global in nature, we expect that the rate at which our backlog and net new business awards convert into revenue is likely to decrease, and the duration of projects and the period over
66
which related revenue is recognized to lengthen. In addition, our adoption of the new revenue recognition accounting standard on January 1, 2018 might affect our backlog. See "Note 1 - Basis of Presentation and Summary of Principal Accounting Policies - Recently Issued Accounting Standards Not Yet Adopted - Revenue from Contracts with Customers." For more information about risks related to our backlog see Part I, Item 1A "Risk Factors—Risks Related to Our Business—Our backlog might not be indicative of our future revenues, and we might not realize all of the anticipated future revenue reflected in our backlog" in this Annual Report on Form 10-K.
Net New Business Awards
Our new business awards, net of award cancellations, for the years ended December 31, 2017, 2016, and 2015 were $1.82 billion, $1.22 billion, and $1.11 billion, respectively, representing a 49.5% increase from 2016 to 2017 and a 9.2% increase from 2015 to 2016. Net new business awards were higher for the year ended December 31, 2017, due to the Merger and an estimated organic increase in net awards of $76.2 million, or 6.3%. New business awards have varied and may continue to vary significantly from quarter to quarter. Fluctuations in our net new business award levels often result from the fact that we may receive a small number of relatively large orders in any given reporting period. Because of these large orders, our backlog and net new business awards in a reporting period may reach levels that are not sustainable in subsequent reporting periods.
67
Results of Operations
Year Ended December 31, 2017 Compared to the Years Ended December 31, 2016 and 2015
The following table sets forth amounts from our consolidated financial statements along with the percentage change for years ended December 31, 2017, 2016 and 2015 (dollars in thousands):
Years Ended December 31, | Change | ||||||||||||||||||||||||
2017 | 2016 | 2015 | 2017 to 2016 | 2016 to 2015 | |||||||||||||||||||||
Net service revenue | $ | 1,852,843 | $ | 1,030,337 | $ | 914,740 | $ | 822,506 | 79.8 | % | $ | 115,597 | 12.6 | % | |||||||||||
Reimbursable out-of-pocket expenses | 819,221 | 580,259 | 484,499 | 238,962 | 41.2 | % | 95,760 | 19.8 | % | ||||||||||||||||
Total revenue | 2,672,064 | 1,610,596 | 1,399,239 | 1,061,468 | 65.9 | % | 211,357 | 15.1 | % | ||||||||||||||||
Costs and operating expenses: | |||||||||||||||||||||||||
Direct costs (exclusive of depreciation and amortization) | 1,232,023 | 626,633 | 542,404 | 605,390 | 96.6 | % | 84,229 | 15.5 | % | ||||||||||||||||
Reimbursable out-of-pocket expenses | 819,221 | 580,259 | 484,499 | 238,962 | 41.2 | % | 95,760 | 19.8 | % | ||||||||||||||||
Selling, general, and administrative | 282,620 | 172,386 | 156,609 | 110,234 | 63.9 | % | 15,777 | 10.1 | % | ||||||||||||||||
Restructuring and other costs | 33,315 | 13,612 | 1,785 | 19,703 | 144.7 | % | 11,827 | 662.6 | % | ||||||||||||||||
Transaction and integration-related expenses | 123,815 | 3,143 | 1,637 | 120,672 | n/m | 1,506 | 92.0 | % | |||||||||||||||||
Asset impairment charges | 30,000 | — | 3,931 | 30,000 | n/m | (3,931 | ) | (100.0 | )% | ||||||||||||||||
Depreciation and amortization | 179,936 | 59,204 | 56,014 | 120,732 | 203.9 | % | 3,190 | 5.7 | % | ||||||||||||||||
Total operating expenses | 2,700,930 | 1,455,237 | 1,246,879 | 1,245,693 | 85.6 | % | 208,358 | 16.7 | % | ||||||||||||||||
(Loss) income from operations | (28,866 | ) | 155,359 | 152,360 | (184,225 | ) | (118.6 | )% | 2,999 | 2.0 | % | ||||||||||||||
Total other expense, net | (83,011 | ) | (21,241 | ) | (21,386 | ) | (61,770 | ) | (290.8 | )% | 145 | 0.7 | % | ||||||||||||
(Loss) income before provision for income taxes | (111,877 | ) | 134,118 | 130,974 | (245,995 | ) | (183.4 | )% | 3,144 | 2.4 | % | ||||||||||||||
Income tax benefit (expense) | (26,592 | ) | (21,488 | ) | (13,927 | ) | (5,104 | ) | (23.8 | )% | (7,561 | ) | (54.3 | )% | |||||||||||
Net (loss) income | $ | (138,469 | ) | $ | 112,630 | $ | 117,047 | $ | (251,099 | ) | (222.9 | )% | $ | (4,417 | ) | (3.8 | )% | ||||||||
Net Service Revenue
Net service revenue increased by $822.5 million, or 79.8%, to $1,852.8 million for the year ended December 31, 2017 from $1,030.3 million for the year ended December 31, 2016. The increase in our total net service revenue during 2017 was due solely to the Merger with inVentiv in August 2017, which resulted in an increase in total net service revenue of $839.0 million. This increase was partially offset by a year-over-year decline in organic revenues resulting from significant customer, regulatory, and other delays impacting our awarded projects during 2017, and higher than normal levels of cancellations of previously awarded projects. Our net service revenue for the year ended December 31, 2017 was negatively impacted by fluctuations in foreign exchange rates and contractual currency adjustment provisions of $4.8 million, as the U.S. dollar has strengthened compared to the prior year.
Net service revenue increased $115.6 million, or 12.6%, to $1,030.3 million for the year ended December 31, 2016 from $914.7 million for the year ended December 31, 2015. In 2016, our revenue grew across all therapeutic areas and has been particularly strong in the central nervous system, oncology and other complex therapeutic areas. The growth in revenue during 2016 was primarily due to our strong backlog at the beginning of the year, the acceleration of a group of projects with one of our sponsors, revenue mix, and the growth of our functional service provider business. Our net service revenue for the year ended
68
December 31, 2016 was negatively impacted by fluctuations in foreign exchange rates and contractual currency adjustment provisions of $11.7 million, as the U.S. dollar has strengthened compared to the prior year.
We will adopt the new revenue recognition standard on January 1, 2018 using the modified retrospective approach. As a result of adopting the new standard, our future revenue recognition may be delayed at certain phases of the customer contract life cycle, particularly during the first couple of years of the contract as the inclusion of reimbursable costs in the measure of progress may result in a disproportionately lower percentage of costs incurred until those contracts mature. Such deferral of revenue could differ materially from that applied under the revenue recognition standard used in previous years. While we expect our revenue to be deferred in the early stages of the contract, we do not expect any changes in the total revenue or profitability recognized over the life of the contract. Further, any impact from delays in the early stages of the contract may be partially mitigated on an aggregate basis because at any given time, our portfolio consists of contracts in varying stages of completion.
Net service revenue from our top five customers accounted for approximately 22.3%, 33.3% and 33.5% of net service revenue for the years ended December 31, 2017, 2016 and 2015, respectively. No single customer accounted for greater than 10% of our total consolidated net service revenue for the years ended December 31, 2017, 2016 or 2015.
Net service revenue for each of our segments was comprised of the following (in thousands, except percentages):
Years Ended December 31, | Change | ||||||||||||||||||||||||
2017 | 2016 | 2015 | 2017 to 2016 | 2016 to 2015 | |||||||||||||||||||||
Clinical Solutions | $ | 1,459,968 | $ | 1,021,017 | $ | 906,528 | $ | 438,951 | 43.0 | % | $ | 114,489 | 12.6 | % | |||||||||||
% of total | 78.8 | % | 99.1 | % | 99.1 | % | |||||||||||||||||||
Commercial Solutions | 392,875 | 9,320 | 8,212 | 383,555 | n/m | 1,108 | 13.5 | % | |||||||||||||||||
% of total | 21.2 | % | 0.9 | % | 0.9 | % | |||||||||||||||||||
Total net service revenue | $ | 1,852,843 | $ | 1,030,337 | $ | 914,740 | $ | 822,506 | 79.8 | % | $ | 115,597 | 12.6 | % | |||||||||||
Clinical Solutions
Our Clinical Solutions segment is a leading global CRO that is therapeutically-focused and offers a variety of clinical development services spanning Phase I to Phase IV, including full-service global studies, as well as unbundled service offerings such as clinical monitoring, investigator recruitment, patient recruitment, data management, and study startup to assist customers with their drug development process. For the years ended December 31, 2017, 2016 and 2015, our Clinical Solutions segment generated net service revenue of $1,460.0 million, $1,021.0 million, and $906.5 million, respectively, representing approximately 78.8%, 99.1% and 99.1%, respectively, of net service revenue for the periods.
For the year ended December 31, 2017, our net service revenue attributable to the Clinical Solutions segment increased compared to the same period in 2016 solely due to the Merger with inVentiv in August 2017, which resulted in an increase in Clinical Solutions net service revenue of $456.7 million. This increase was partially offset by a decline in organic revenue of $17.8 million as a result of higher than normal customer and regulatory delays and cancellations, among other factors, which impacted our awarded projects during 2017.
For the year ended December 31, 2016, our net service revenue attributable to the Clinical Solutions segment increased compared to the same period in 2015 primarily due to our strong backlog at the beginning of the year, the acceleration of a group of projects with one of our sponsors, and our revenue mix.
69
Commercial Solutions
Our Commercial Solutions segment is a leading provider of a full suite of complementary commercialization services including outsourced field selling solutions, medical adherence, communications (advertising and public relations), and consulting services. For the years ended December 31, 2017, 2016 and 2015, our Commercial Solutions segment generated net service revenue of $392.9 million, $9.3 million, and $8.2 million, respectively, representing approximately 21.2%, 0.9% and 0.9%, respectively, of net service revenue.
For the year ended December 31, 2017, our net service revenue attributable to the Commercial Solutions segment increased compared to the same period in 2016 primarily due to the Merger with inVentiv in August 2017, which resulted in an increase in Commercial Solutions net service revenue of $382.2 million. While our Commercial Solutions net service revenue increased on a comparative basis due to the Merger, net service revenue associated with this segment declined compared to the amounts reported by inVentiv in periods prior to the Merger as a result of project cancellations, particularly within our selling solutions and communications service offerings, lower year-over-year business awards, and lower new drug approval activity during 2016.
For the years ended December 31, 2016 and 2015, our net service revenue attributable to the Commercial Solutions segment was not material and related to our legacy global consulting business.
Direct Costs
Our direct costs consist principally of compensation expense and benefits associated with our employees and other employee-related costs. While we have some ability to manage the majority of these costs relative to the amount of contracted services we have during any given period, direct costs as a percentage of net service revenue can vary from period to period. Such fluctuations are due to a variety of factors, including, among others: (i) the level of staff utilization created by our ability to effectively manage our workforce; (ii) adjustments to the timing of work on specific customer contracts; (iii) the experience mix of personnel assigned to projects; and (iv) the service mix and pricing of our contracts. In addition, as global projects wind down or as delays and cancellations occur, staffing levels in certain countries or functional areas can become misaligned with the current business volume.
Direct costs increased by $605.4 million, or 96.6%, to $1,232.0 million for the year ended December 31, 2017 from $626.6 million for the year ended December 31, 2016. These increases were driven by the Merger with inVentiv, which increased our worldwide employee base by approximately 15,000 employees in August 2017 and resulted in an increase of $596.0 million in direct costs for the year. In addition to the increase in direct costs associated with the Merger, we incurred higher organic compensation and benefits related expense as a result of increased personnel resulting from: (i) new business awarded in the first half of 2017; (ii) our investment in additional personnel to support the bidding process for new business opportunities; and (iii) an increase in underutilized personnel that we retained in anticipation of work that was delayed or canceled. These increases were partially offset by a reduction in direct costs from lower incentive based compensation and a $1.5 million reduction related to foreign currency exchange rate fluctuations during the year ended December 31, 2017 compared to the prior year.
Direct costs increased by $84.2 million, or 15.5%, to $626.6 million for the year ended December 31, 2016 from $542.4 million for the year ended December 31, 2015. These increases were primarily driven by: (i) the growth in our revenues and the resulting need for additional resources; (ii) our need to utilize a higher percentage of third party contractors during 2016 compared to 2015 as the result of our commitment to a customer to accelerate work originally planned for 2017 into 2016; and (iii) one-time benefits received in 2015 related to a favorable resolution of several VAT and other tax items, a change in employee incentive compensation, and favorable resolutions to disputed pass-through costs. The increases were partially offset by a reduction in direct costs of $15.5 million related to fluctuations in foreign currency exchange rates during the year ended December 31, 2016 compared to 2015.
70
Direct costs for each of our segments, excluding share-based compensation expense, were comprised of the following (in thousands, except percentages):
Years Ended December 31, | Change | ||||||||||||||||||||||||
2017 | 2016 | 2015 | 2017 to 2016 | 2016 to 2015 | |||||||||||||||||||||
Clinical Solutions | $ | 930,176 | $ | 612,201 | $ | 533,277 | $ | 317,975 | 51.9 | % | $ | 78,924 | 14.8 | % | |||||||||||
% of related net service revenue | 63.7 | % | 60.0 | % | 58.8 | % | |||||||||||||||||||
Gross margin | 36.3 | % | 40.0 | % | 41.2 | % | |||||||||||||||||||
Commercial Solutions | 291,310 | 7,881 | 6,845 | 283,429 | n/m | 1,036 | 15.1 | % | |||||||||||||||||
% of related net service revenue | 74.1 | % | 84.6 | % | 83.4 | % | |||||||||||||||||||
Gross margin | 25.9 | % | 15.4 | % | 16.6 | % | |||||||||||||||||||
Total direct costs | $ | 1,221,486 | $ | 620,082 | $ | 540,122 | $ | 601,404 | 97.0 | % | $ | 79,960 | 14.8 | % | |||||||||||
% of total net service revenue | 65.9 | % | 60.2 | % | 59.0 | % | |||||||||||||||||||
Clinical Solutions
For the years ended December 31, 2017, 2016 and 2015, direct costs related to our Clinical Solutions segment were $930.2 million, $612.2 million and $533.3 million, respectively, representing approximately 76.2%, 98.7% and 98.7%, respectively, of our total direct costs for the period. Clinical Solutions direct costs as a percentage of related net service revenue for the years ended December 31, 2017, 2016 and 2015, were 63.7%, 60.0% and 58.8%, respectively. The increase in direct costs associated with our Clinical Solutions segment in 2017 compared to 2016 was primarily due to increased personnel costs for the reasons discussed above, particularly increases resulting from the Merger and retention of underutilized staff.
The increase in direct costs associated with our Clinical Solutions segment in 2016 compared to 2015 was primarily due to increased growth in our revenues resulting in the need for additional resources, including third party contractors, and one-time benefits received in 2015, as discussed previously.
Gross margin for the Clinical Solutions segment was 36.3%, 40.0% and 41.2% for the years ended December 31, 2017, 2016 and 2015, respectively. Gross margin declined in 2017 compared to 2016 primarily due to: (i) the mix of customers and services obtained in the Merger having a lower gross margin profile compared to our historical mix of customers and services; (ii) the elimination of $28.6 million of revenue in purchase accounting that otherwise would have been recognized by inVentiv; and (iii) the impact of carrying excess staff throughout 2017. Specifically, inVentiv’s legacy Clinical Solutions business has historically had a higher mix of contracts from the top 20 biopharmaceutical companies and a higher mix of FSP services revenue, both of which typically have a lower margin profile than our historical mix of customers and services.
Commercial Solutions
For the years ended December 31, 2017, 2016 and 2015, direct costs related to our Commercial Solutions segment were $291.3 million, $7.9 million and $6.8 million, respectively, representing approximately 23.8%, 1.3% and 1.3%, respectively, of our total direct costs for the period. Commercial Solutions direct costs as a percentage of related net service revenue for the years ended December 31, 2017, 2016 and 2015, were 74.1%, 84.6% and 83.4%, respectively. The increase in direct costs associated with our Commercial Solutions segment in 2017 compared to 2016 was due to increased personnel costs as a result of the Merger. The increase in direct costs associated with our Commercial Solutions segment in 2016 compared to 2015 was were not material.
Gross margin for the Commercial Solutions segment was 25.9%, 15.4% and 16.6% for the years ended December 31, 2017, 2016 and 2015, respectively. The increase in gross margin in 2017 compared to 2016
71
was due to the Merger, where the services obtained in the Merger have historically had a higher margin profile than our legacy consulting business.
Reimbursable Out-of-Pocket Expenses
Reimbursable out-of-pocket expenses represent expenses typically not associated with our services which are passed through and reimbursed by our customers at actual cost. Such expenses are incurred within both our clinical and commercial businesses and are generally comprised of (i) physician and investigator fees, project management, data management and other site-facing study costs, (ii) travel-related expenses, (iii) certain compensation and bonuses of sales representatives and other project team personnel, and (iv) various vendor and third-party fees related to meetings, transportation, sales, marketing, communication, training, storage and other miscellaneous project expenses incurred under contracts. These expenses fluctuate significantly from period to period based on the timing of program initiation or closeout and the mix of program complexity, and do not necessarily change in direct correlation to net service revenue.
Reimbursable out-of-pocket expenses increased 41.2%, or $239.0 million, to $819.2 million for the year ended December 31, 2017 from $580.3 million for the year ended December 31, 2016. Reimbursable out-of-pocket expenses increased 19.8%, or $95.8 million, to $580.3 million for the year ended December 31, 2016 from $484.5 million for the year ended December 31, 2015. These increases were principally due to the Merger in 2017, overall increases in net service revenue during both periods, and an increase in the number of studies in which we procured principal investigator services. The reimbursable out-of-pocket expenses included in “Total revenue” are offset by an equal amount shown under the same caption in the “Costs and operating expenses” section in our consolidated statements of operations and, accordingly, have no impact on income from operations.
As a result of adopting the new revenue recognition standard, beginning in fiscal year 2018 we will no longer present net service revenue and reimbursable out-of-pocket expenses separately in the statements of operations as, under the new revenue recognition standard, they represent a single performance obligation and such presentation is no longer permitted.
Selling, General and Administrative Expenses
For the years ended December 31, 2017, 2016 and 2015, selling, general and administrative expenses were as follows (dollars in thousands):
Years Ended December 31, | Change | ||||||||||||||||||||||||
2017 | 2016 | 2015 | 2017 to 2016 | 2016 to 2015 | |||||||||||||||||||||
Selling, general and administrative | $ | 282,620 | $ | 172,386 | $ | 156,609 | $ | 110,234 | 63.9 | % | $ | 15,777 | 10.1 | % | |||||||||||
Percent of total net service revenue | 15.3 | % | 16.7 | % | 17.1 | % | |||||||||||||||||||
Selling, general and administrative expenses increased by $110.2 million, or 63.9%, to $282.6 million for the year ended December 31, 2017 from $172.4 million for the year ended December 31, 2016, including a $0.4 million benefit from favorable fluctuations in foreign currency exchange rates compared to the prior year. These increases were primarily due to the Merger with inVentiv, which increased our overall employee base by approximately 15,000 employees in August 2017 and resulted in an increase of approximately $97.1 million in compensation related selling, general, and administrative expenses during 2017 compared to 2016.
Selling, general and administrative expenses increased by $15.8 million, or 10.1%, to $172.4 million for the year ended December 31, 2016 from $156.6 million for the year ended December 31, 2015, including a $4.0 million benefit from favorable fluctuations in foreign currency exchange rates compared to the prior year. The increase was primarily driven by: (i) an increase in salaries, benefits and incentive compensation, principally as a result of the additions in personnel to support the growth of our business and the one-time benefit from settlement of certain employee related liabilities in 2015; (ii) an increase in bad debt expense resulting from an increase in billed and unbilled receivables exposure; and (iii) an increase in travel costs primarily driven by increased headcount. These cost increases were offset by reductions in: (i) professional fees for legal and
72
accounting fees associated with implementing Sarbanes-Oxley and tax planning that occurred in 2015; and (ii) facilities and IT related costs through improved utilization of our existing infrastructure. During the year ended December 31, 2015, our selling, general and administrative expenses were positively impacted by settlement of certain employee related liabilities totaling approximately $1.1 million.
Selling, general and administrative expense as a percentage of total net service revenue has declined to 15.3% from 16.7% and 17.1% for years ended December 31, 2017, 2016 and 2015, respectively. Fluctuations in foreign currency exchange rates could significantly impact our selling, general and administrative expenses as a percentage of revenue in the future.
Restructuring and Other Costs
Restructuring and other costs were $33.3 million for the year ended December 31, 2017. In connection with the Merger, we established a restructuring plan to eliminate redundant positions and reduce our facility footprint worldwide. Accordingly, during the year ended December 31, 2017, we recognized approximately $11.3 million of employee severance and benefit costs, facility closure and lease termination costs of $2.2 million, and other costs of $2.0 million related to the Merger. We expect to incur significant additional costs related to the restructuring of our operations in order to achieve the targeted synergies as a result of the Merger over the next several years. The timing and the estimate of the amount of these costs depends on various factors, including, but not limited to, the identification of synergy opportunities and the execution of the integration of our combined operations.
In addition to costs incurred as a result of the Merger, during the year ended December 31, 2017, we recognized approximately $9.4 million of employee severance costs and incurred $1.3 million of facility closure and lease termination costs related to non-Merger restructuring activities. Included in restructuring and other costs during 2017 are $5.0 million of consulting costs related to the continued consolidation of our legal entities and restructuring of our contract management process to meet the requirements of upcoming accounting regulation changes and $2.1 million of other costs.
Restructuring and other costs were $13.6 million for the year ended December 31, 2016. In March 2016, management approved a global plan to eliminate certain positions worldwide in an effort to ensure that our organizational focus and resources were properly aligned with our strategic goals and to continue strengthening the delivery of our growing backlog to customers. Accordingly, we made changes to our therapeutic unit structure designed to realign with management focus and optimize the efficiency of our resourcing to achieve our strategic plan. As a result, we eliminated approximately 200 positions and incurred $7.0 million related to employee severance costs during the year ended December 31, 2016. All actions under this plan were completed by December 31, 2017. During the third quarter of 2016, we also announced the closure of one of our facilities associated with this restructuring and we incurred facility closure costs of $1.5 million, which were partially offset by unamortized deferred rent of $0.5 million during the year ended December 31, 2016.
On July 27, 2016, we entered into a transition agreement with our former CEO related to the transition to a new CEO as of October 1, 2016. The CEO transition agreement was effective through February 28, 2017. In addition, in mid-September 2016, we entered into retention agreements with certain key employees for various dates through September 2017. For the year ended December 31, 2016, we recognized $4.8 million of costs associated with the CEO transition and retention agreements, which will be paid through August 2018.
Restructuring and other costs were $1.8 million for the year ended December 31, 2015, primarily consisting of employee severance costs of $2.7 million, partially offset by a net reduction in facility closure costs of $0.9 million.
73
Transaction and Integration-Related Expenses
Transaction and integration-related expenses consisted of the following (in thousands):
Years Ended December 31, | |||||||||||
2017 | 2016 | 2015 | |||||||||
Investment banker, professional fees, and other | $ | 68,967 | $ | 2,975 | $ | 1,637 | |||||
Share-based compensation expense | 31,327 | — | — | ||||||||
Debt modification and related expenses | 5,255 | 168 | — | ||||||||
Personnel integration and retention-related costs | 28,616 | — | — | ||||||||
Benefit from change in fair value of contingent tax-sharing obligation | (12,276 | ) | — | — | |||||||
Other | 1,926 | — | — | ||||||||
Total transaction and integration-related expenses | $ | 123,815 | $ | 3,143 | $ | 1,637 | |||||
During the year ended December 31, 2017, we incurred transaction and integration related expenses of $123.8 million. We expect to incur additional expenses associated with the Merger; however, the timing and the amount of these expenses depends on various factors such as, but not limited to, the execution of integration activities and the aggregate amount of synergies we achieve from these activities.
The transaction and integration related costs incurred during 2017 consisted primarily of professional fees of approximately $69.0 million associated with investment banking and other advisory fees incurred, along with costs associated with the related financing of $5.3 million. In addition, the vesting of certain employee stock compensation arrangements was accelerated in accordance with their terms, resulting in additional share-based compensation expense of approximately $31.3 million.
During the year ended December 31, 2017, we also incurred personnel integration and retention-related costs of $28.6 million, consisting primarily of $23.5 million of expenses associated with Merger-related retention agreements with certain key employees. We expect to incur a minimum of $9.2 million of such additional expenses which are expected to be paid in May 2018. Partially offsetting the above expenses is a benefit of $12.3 million from the reduction in the fair value of our contingent tax-sharing obligations payable to the former shareholders of inVentiv as a result of the enactment of the Tax Act of 2017.
During the year ended December 31, 2016, we incurred transaction expenses of $3.1 million, primarily consisting of third-party fees associated with: (i) our secondary stock offerings in May and August 2016; (ii) our stock repurchase and debt amendment in August 2016; and (iii) other corporate projects. During the year ended December 31, 2015, we incurred transaction expenses of $1.6 million, primarily consisting of third-party fees associated with our stock repurchases in May and December of 2015 and our secondary common stock offerings in May, August and December of 2015.
Goodwill and Intangible Asset Impairment Charges
We evaluate goodwill for impairment annually, or more frequently if events or changes in circumstances indicate that goodwill might be impaired. In connection with the Merger, we announced our intention to relaunch our operations under a new brand name in January 2018. As a result, we determined that the useful life of the intangible asset related to the INC Research trademark with a carrying value of $35.0 million was no longer indefinite as of August 1, 2017. Based on this change in circumstances, we tested the asset for impairment as an indefinite-lived intangible asset and recorded a $30.0 million impairment charge during the year ended December 31, 2017. We also determined that the remaining useful life of this asset did not extend beyond the anticipated date of Merger-related rebranding which, as of August 1, 2017, approximated five months. In addition, the Company assigned a value of $8.8 million to the inVentiv Health trade name in connection with the Merger, which was amortized over the same five month period. As of December 31, 2017, these trademarks were fully amortized.
During the first quarter of 2015, we continued to observe deteriorating performance within our Phase I Services reporting unit, a component of the Clinical Solutions segment, due to reduced revenue resulting from
74
cancellations and lower than expected new business awards. This resulted in a triggering event, requiring an evaluation of both long-lived assets and goodwill for potential impairment. As a result of this evaluation, we recorded a total asset impairment charge of $3.9 million, comprised of a long-lived assets impairment charge of $1.0 million and a goodwill impairment charge of $2.9 million, which was the total remaining goodwill balance of our Phase I Services reporting unit, a component of the Clinical Solutions segment, as of the evaluation date. There were no asset impairment charges during 2016.
Depreciation and Amortization Expense
Total depreciation and amortization expense increased to $179.9 million for the year ended December 31, 2017 from $59.2 million for the year ended December 31, 2016. These increases were primarily due to: (i) an increase in amortization expense of $97.7 million primarily related to the assumption of intangible assets as part of the Merger; and (ii) an increase in depreciation expense due to assets obtained in the Merger and our continued investment in information technology and facilities to support growth in our operational capabilities and optimization of our infrastructure.
Total depreciation and amortization expense increased to $59.2 million for the year ended December 31, 2016 from $56.0 million for the year ended December 31, 2015. This increase was a result of an increase in depreciation expense of $3.2 million for the year ended December 31, 2016 as compared to the year ended December 31, 2015, principally due to higher capital expenditures in 2016.
Other Expense, Net
For the years ended December 31, 2017, 2016 and 2015, the components of total other (expense) income, net were as follows (dollars in thousands):
Years Ended December 31, | Change | ||||||||||||||||||||||||
2017 | 2016 | 2015 | 2017 to 2016 | 2016 to 2015 | |||||||||||||||||||||
Interest income | $ | 1,182 | $ | 216 | $ | 192 | $ | 966 | 447.2 | % | $ | 24 | 12.5 | % | |||||||||||
Interest expense | (63,725 | ) | (12,016 | ) | (15,640 | ) | (51,709 | ) | (430.3 | )% | 3,624 | 23.2 | % | ||||||||||||
Loss on extinguishment of debt | (622 | ) | (439 | ) | (9,795 | ) | (183 | ) | (41.7 | )% | 9,356 | 95.5 | % | ||||||||||||
Other (expense) income, net | (19,846 | ) | (9,002 | ) | 3,857 | (10,844 | ) | (120.5 | )% | (12,859 | ) | (333.4 | )% | ||||||||||||
Total other expense, net | $ | (83,011 | ) | $ | (21,241 | ) | $ | (21,386 | ) | $ | (61,770 | ) | (290.8 | )% | $ | 145 | 0.7 | % | |||||||
Total other expense, net was $83.0 million, $21.2 million and $21.4 million for the years ended December 31, 2017, 2016 and 2015, respectively. The increase in 2017 compared to 2016 predominantly relates to: (i) an increase in interest expense due to our increased debt that resulted from the Merger; and (ii) foreign currency losses incurred due to exchange rate fluctuations related to monetary asset balances denominated in currencies other than functional currency.
Interest expense increased by $51.7 million for 2017 compared to 2016, primarily due to our increased leverage as a result of the Merger with inVentiv in August 2017. Interest expense decreased by $3.6 million for 2016 compared to 2015, primarily due to the decreased interest rates as a result of our debt repayment and refinancing activities during the second quarter of 2015 and third quarter of 2016.
The loss on extinguishment of debt was $0.6 million, $0.4 million and $9.8 million for the years ended December 31, 2017, 2016 and 2015, respectively, incurred primarily as a result of our debt prepayments and refinancing transactions.
Other (expense) income, net, increased expense by $10.8 million for 2017 compared to 2016 and by $12.9 million for 2016 compared to 2015. Other (expense) income, net is primarily comprised of foreign currency gains and losses and the changes are principally driven by exchange rate fluctuations related to monetary asset balances denominated in currencies other than functional currency. Strengthening of foreign currencies against the U.S. dollar may create losses in future periods to the extent that our subsidiaries who use local
75
currency as their functional currency maintain net assets and liabilities balances not denominated in their functional currency.
Income Tax Expense
Income tax expense was $26.6 million for the year ended December 31, 2017 on a pre-tax loss of $111.9 million, compared to an expense of $21.5 million for the year ended December 31, 2016, on a pre-tax income of $134.1 million. For the year ended December 31, 2017, variances from the statutory rate of 35% were due to: (i) the direct and indirect impacts of the December 2017 Tax Cuts and Jobs Act (the "Tax Act"), resulting in income tax expense of $94.4 million; (ii) a benefit from the geographical split of pre-tax income from foreign subsidiaries of $16.8 million; (iii) a $8.9 million benefit associated with stock-based compensation; and (iv) research and development tax credits of $5.7 million. With regard to the impact of the Tax Act during the fourth quarter of 2017 we recorded the following: (i) income tax expense of $63.1 million related to our estimated transition tax; (ii) income tax expense of $37.5 million related to the rate change impact on our U.S. deferred tax assets; (iii) income tax expense of $52.6 million related to the net valuation allowance increase on our deferred tax assets; and (iv) income tax benefit of $58.7 million related to the net reversal of the deferred tax liabilities previously accrued on our foreign earnings (consisting of a $112.1 million reversal, net of $53.4 million of taxes accrued), all as described in, "Note 12 - Income Taxes" to our consolidated financial statements included in Part II, Item 8, "Financial Statements and Supplementary Data " in this Annual Report on Form 10-K.
Income tax expense was $21.5 million for the year ended December 31, 2016, compared to $13.9 million for the year ended December 31, 2015, as we achieved our second consecutive year of profitability. For the year ended December 31, 2016, variances from the statutory rate of 35% were due to: (i) an income tax benefit of $12.9 million related to excess tax benefits for share-based compensation; (ii) the release of reserves for uncertain tax positions and valuation allowances on net operating loss carryforwards related to certain international jurisdictions in aggregate totaling $6.6 million; and (iii) the geographical split of pre-tax income, net of deemed dividends from foreign subsidiaries.
Net (Loss) Income
Net loss was $138.5 million for the year ended December 31, 2017 compared to net income of $112.6 million for the year ended December 31, 2016. This year-over-year change from an income to a loss position was primarily due to a decrease in income from operations as a result of the Merger. Specifically, our operating costs increased significantly during the year related to: (i) restructuring and other costs; (ii) transaction and integration-related costs; (iii) depreciation and amortization expense; and (iv) asset impairment charges. Additionally, other expense, net, increased predominantly as a result of higher debt balances, which increased interest expense during 2017 compared to 2016.
Net income was $112.6 million for the year ended December 31, 2016 compared to $117.0 million for the year ended December 31, 2015. The year-over-year decrease was primarily due to increases in: (i) our direct costs as a percentage of net service revenue; (ii) restructuring and other costs; (iii) transaction and integration-related costs; (iv) depreciation expense; (v) foreign exchange losses in 2016 compared to gains in 2015, and (vi) income tax expense. These increases in expenses were offset by: (i) the impact of increased net service revenue; (ii) a decrease in our selling, general and administrative costs as a percentage of net service revenue; (iii) a decrease in asset impairment charges compared to the prior year; (iv) a decrease in loss on extinguishment of debt; and (v) a decrease in interest expense as a result of our 2015 and 2016 debt refinancing activities.
76
Liquidity and Capital Resources
Key measures of our liquidity are as follows (in thousands):
December 31, 2017 | December 31, 2016 | ||||||
Balance sheet statistics: | |||||||
Cash and cash equivalents (a) | $ | 321,262 | $ | 102,471 | |||
Working capital (excluding restricted cash) | 261,903 | 55,295 | |||||
(a) As of December 31, 2017, cash and cash equivalents held by our foreign subsidiaries was $192.0 million. A portion of these cash and cash equivalent balances may be subject to foreign withholding taxation, if repatriated.
As of December 31, 2017, we had $321.3 million of cash and cash equivalents, including $57.3 million of cash acquired as part of the Merger with InVentiv. In addition, we had $481.4 million available for borrowing under our $500.0 million revolving credit facility.
As disclosed in "Note 3 - Business Combinations" in our consolidated financial statements included in Part II, Item 8, in this Annual Report on Form 10-K, in August 2017 we completed the Merger with inVentiv. Concurrently with the completion of the Merger, we entered into the 2017 Credit Agreement for: (i) a $1.0 billion Term Loan A facility that matures on August 1, 2022; (ii) a $1.6 billion Term Loan B facility that matures on August 1, 2024; and (iii) a five- year $500.0 million revolving credit facility. We used the proceeds from the 2017 Credit Agreement to, among other things: (i) repay $445.0 million of outstanding loans and obligations under our previously existing long-term credit facility; (ii) repay $1.7 billion of outstanding obligations under inVentiv’s long-term credit facility, which was treated as Merger consideration; (iii) pay approximately $290.3 million to partially redeem obligations under the Senior Notes assumed in the Merger, which included an early redemption penalty of $20.3 million; and (iv) pay fees, premiums, and other transaction expenses related to the Merger.
We have historically funded our operations and growth, including acquisitions, primarily with our working capital, cash flow from operations and funds available through various borrowing arrangements. Our principal liquidity requirements are to fund our debt service obligations, capital expenditures, expansion of service offerings, possible acquisitions, integration and restructuring costs, geographic expansion, working capital and other general corporate expenses. Based on past performance and current expectations, we believe our cash and cash equivalents, cash generated from operations, and funds available under our revolving credit facility will be sufficient to meet our working capital needs, capital expenditures, scheduled debt and interest payments, income tax obligations and other currently anticipated liquidity requirements for at least the next 12 months.
Indebtedness
As of December 31, 2017, we had approximately $2.99 billion of total principal indebtedness (including $36.8 million of capital leases), comprised of $2.55 billion in term loan debt and $403.0 million in Senior Notes, of which $2.43 billion was subject to variable interest rates. In addition, as of December 31, 2017 we had $481.4 million (net of $18.6 million in outstanding letters of credit) of available borrowings for working capital and other purposes under the Revolver. In addition, as of December 31, 2017, we had $1.2 million of LOCs that were not secured by the Revolver.
Under the terms of the lease for our new corporate headquarters in Morrisville, North Carolina we are required to issue a LOC to the landlord based on our debt rating issued by Moody’s Investors Service (or other nationally-recognized debt rating agency). From June 14, 2017 through June 14, 2020, if our debt rating is Ba3 or better, no LOC is required, or if our debt rating is B1 or lower, a LOC equal to 25% of the remaining minimum annual rent and estimated operating expenses (or a LOC of approximately $24.2 million as of December 31, 2017) is required to be issued to the landlord. This LOC would remain in effect until our debt rating was increased to Ba3 or higher for a 12-month period. After June 14, 2020, if our debt rating is Ba2 or better, no LOC is required; if our debt rating is Ba3 or lower, a LOC equal to 25% of the then remaining minimum annual rent and estimated operating expenses is required to be issued to the landlord; or if our debt rating is B1 or lower, a LOC equal to 100% of the then remaining minimum annual rent and estimated
77
operating expenses is required to be issued to the landlord. These letters of credit would remain in effect until our debt rating is back above the required threshold for a 12-month period.
As of December 31, 2017 (and through the date of this filing), our debt rating was Ba3. As such, no LOC is currently required. Any letters of credit issued in accordance with the aforementioned requirements would be issued under our Revolver, and would reduce its available borrowing capacity by the same amount accordingly.
Our ability to make payments on our indebtedness and to fund planned capital expenditures and necessary working capital will depend on our ability to generate cash in the future. Our ability to meet our cash needs through cash flows from operations will depend on the demand for our services, as well as general economic, financial, competitive and other factors, many of which are beyond our control. Our business might not generate cash flow in an amount sufficient to enable us to pay the principal of, or interest on, our indebtedness, or to fund our other liquidity needs, including working capital, capital expenditures, acquisitions, investments and other general corporate requirements. If we cannot fund our liquidity needs, we will have to take actions such as reducing or delaying capital expenditures, acquisitions or investments, selling assets, restructuring or refinancing our debt, reducing the scope of our operations and growth plans, or seeking additional capital. We cannot assure you that any of these remedies could, if necessary, be affected on commercially reasonable terms, or at all, or that they would permit us to meet our scheduled debt service obligations. Our 2017 Credit Agreement contains covenants that limit our ability to direct the use of proceeds from any disposition of assets and, as a result, we might not be allowed to use all of the proceeds from any such dispositions to satisfy current debt service obligations.
Cash and Cash Equivalents
Our cash flows from operating, investing, and financing activities were as follows (in thousands, except percentages):
Years Ended December 31, | Change | ||||||||||||||||||||||||
2017 | 2016 | 2015 | 2017 to 2016 | 2016 to 2015 | |||||||||||||||||||||
Net cash provided by operating activities | $ | 198,258 | $ | 109,332 | $ | 204,740 | $ | 88,926 | 81.3 | % | $ | (95,408 | ) | (46.6 | )% | ||||||||||
Net cash used in investing activities | (1,722,907 | ) | (31,353 | ) | (21,111 | ) | (1,691,554 | ) | n/m | (10,242 | ) | (48.5 | )% | ||||||||||||
Net cash provided by (used in) financing activities | 1,734,368 | (53,316 | ) | (211,399 | ) | 1,787,684 | n/m | 158,083 | 74.8 | % | |||||||||||||||
Cash Flows from Operating Activities
For the year ended December 31, 2017, our operating activities provided $198.3 million of cash, consisting of a net loss of $138.5 million, adjusted for net non-operating and non-cash items of $289.7 million primarily related to depreciation and amortization, share-based compensation, asset impairment charges, fair value adjustments related to our contingent tax sharing obligations, deferred income tax expense, and foreign currency adjustments. Additionally, cash provided by changes in operating assets and liabilities was $47.0 million (excluding the effects of the Merger), consisting primarily of cash inflow as a result of a decrease in billed and unbilled accounts receivable and an increase in deferred revenue, partially offset by a decrease in accounts payable and accrued expenses. See further discussion in "Note 3 - Business Combinations" to our consolidated financial statements included in Part II, Item 8, "Financial Statements and Supplementary Data" in this Annual Report on Form 10-K for additional details on the net assets acquired in the Merger.
For the year ended December 31, 2016, our operating activities provided $109.3 million in cash flow, consisting of a net income of $112.6 million, adjusted for net non-operating and non-cash items of $75.9 million primarily related to depreciation and amortization of intangible assets, changes in deferred income taxes, foreign currency adjustments, share-based compensation expense, and changes to the provision for doubtful accounts. Offsetting these increases was $79.2 million of cash used by changes in operating assets and liabilities, consisting primarily of an increase in billed and unbilled accounts receivable.
78
For the year ended December 31, 2015, our operating activities provided $204.7 million in cash flow, consisting of a net income of $117.0 million, adjusted for net non-operating and non-cash items of $79.9 million primarily related to depreciation and amortization of intangible assets, loss on extinguishment of debt, share-based compensation and related tax benefits, changes in deferred income taxes, asset impairment charges, stock repurchase costs, amortization of capitalized loan fees, and foreign currency adjustments. In addition, $7.8 million of cash was provided by changes in operating assets and liabilities, consisting primarily of an increase in deferred revenue and accounts payables and accrued expenses, partially offset by the increase in billed and unbilled accounts receivable and other assets and liabilities.
Cash flows from operations increased by $88.9 million during the year ended December 31, 2017 compared to the year ended December 31, 2016, primarily due to an increase of $213.8 million in net non-operating and non-cash items and an increase in cash received from working capital of $126.2 million, partially offset by the decrease in net income of $251.1 million as we incurred a net loss of $138.5 million during 2017 compared to net income of $112.6 million in 2016.
Cash flows from operations decreased by $95.4 million during the year ended December 31, 2016 compared to the year ended December 31, 2015, primarily due to the decline in cash received from working capital of $87.0 million and the decrease in net income of $4.4 million.
The changes in operating assets and liabilities result primarily from the net change in billed and unbilled accounts receivable and deferred revenue, coupled with changes in accrued liabilities. Fluctuations in billed and unbilled receivables and deferred revenue occur on a regular basis as we perform services, achieve milestones or other billing criteria, send invoices to customers and collect outstanding accounts receivable. This activity varies by individual customer and contract. We attempt to negotiate payment terms that provide for payment of services prior to or soon after the provision of services, but the levels of unbilled services and deferred revenue can vary significantly from period to period.
Impact of the Merger on Cash Flows from Operating Activities
As a result of the Merger with inVentiv, our operating cash might be significantly negatively affected in future periods. In particular, we have incurred and continue to incur substantial expenses related to the consummation of the Merger and subsequent integration activities that we anticipate will continue for the next 12 to 18 months. For example, during the year ended December 31, 2017, we incurred $123.8 million in transaction expenses related to the Merger of which $104.8 million has impacted our operating working capital cash flows in 2017 or will impact operating cash flows in the future.
In addition, as a result of the Merger, our total indebtedness (including capital leases) increased by $2.49 billion to $2.99 billion as of December 31, 2017, of which $2.43 billion is subject to variable interest rates, as compared to total indebtedness of $500.0 million as of December 31, 2016. As a result, we anticipate that our interest expense and corresponding operating cash outflows will be significantly higher in future periods on a comparative basis. This additional expense will place further demand on, and might significantly reduce, our cash flows from operations in future periods. Our business might not continue to generate cash from operations in the future sufficient to service and repay our increased debt obligations.
Please refer to the “Risks Related to the Merger” and “Risks Related to Our Indebtedness” sections of Item 1A “Risk Factors” included in this Annual Report on Form 10-K for further information related to risks associated with the Merger that might negatively affect our cash flows from operations.
Cash Flows from Investing Activities
For the years ended December 31, 2017, we used $1.72 billion in cash for investing activities. In particular, as part of the Merger consideration and on behalf of inVentiv, we repaid $1.74 billion of inVentiv’s outstanding long-term debt obligations and associated accrued interest. This cash outflow was partially offset by $57.3 million of cash acquired as part of the Merger. In addition, our capital expenditures related to purchases of property and equipment used $43.9 million of cash during the period.
79
For the years ended December 31, 2016 and 2015 we used $31.4 million, and $21.1 million, respectively, in cash for investing activities, comprised of the purchases of property and equipment primarily related to our ongoing headcount growth and investments to improve the efficiency of our operations and utilization of our facilities.
We continue to closely monitor our capital expenditures while making strategic investments in the development of our information technology infrastructure to meet the needs of our workforce. For 2018, we expect our total capital expenditures to be between approximately $85.0 million to $95.0 million. This estimate includes expenditures associated with planned consolidation of our corporate headquarters facility in Morrisville, North Carolina (and providing for future expansion at this location), as well as expenditures related to a new site in Farnborough, United Kingdom which will replace our Camberley, United Kingdom location. These moves will coincide with the near-term expiration of our existing leases. The new Morrisville location will be our corporate headquarters and the Farnborough office will remain a key international location.
Cash Flows from Financing Activities
For the year ended December 31, 2017, financing activities provided $1.73 billion in cash, consisting primarily of net proceeds of $2.10 billion from the issuance of long-term debt under our 2017 Credit Agreement and proceeds of $19.3 million from the exercise of stock options. These cash inflows were partially offset by: (i) payments of $292.4 million related to the partial redemption of the Senior Notes assumed in the Merger, payments for our Senior Notes repurchased on the open market, and payments of early redemption penalties associated with our Senior Notes; (ii) net repayments of $25.0 million under our Revolver; and (iii) principal Term Loan B prepayments of $50.0 million.
For the year ended December 31, 2016, financing activities used $53.3 million in cash, primarily driven by payments of $64.5 million related to the stock repurchase in August of 2016, net revolver repayments of $5.0 million, debt refinancing costs of $0.9 million and $0.8 million related to payments for tax withholdings related to employee stock option exercises. These cash outflows were partially offset by proceeds of $17.9 million from the exercise of stock options.
For the year ended December 31, 2015, financing activities used $211.4 million in cash, primarily driven by payments of $285.0 million related to the stock repurchases in May and December of 2015, $3.2 million related to payments for tax withholdings related to employee stock option activity, stock repurchase costs of $1.4 million and payments of $1.0 million related to the 2014 MEK Consulting acquisition. These cash outflows were partially offset by net inflows of $79.6 million, consisting primarily of: (i) the proceeds of $95.0 million from the 2015 debt refinancing and $30.0 million under our revolver; and (ii) proceeds of $3.7 million from the exercise of stock options, partially offset by the June 2015 prepayment of $50.0 million of debt principal under the 2017 Credit Agreement.
Inflation
Our long-term contracts, those in excess of one year, generally include inflation or cost of living adjustments for the portion of the services to be performed beyond one year from the contract date. In the event actual inflation rates are greater than our contractual inflation rates or cost of living adjustments, inflation could have a material adverse effect on our operations or financial condition.
80
Contractual Obligations and Commitments
The following table summarizes our expected material contractual obligations as of December 31, 2017 (in thousands):
Payment Due by Period | |||||||||||||||||||
Total | 2018 | 2019 to 2020 | 2021 to 2022 | 2023 and thereafter | |||||||||||||||
Long-term debt | $ | 2,953,000 | $ | 25,000 | $ | 125,000 | $ | 880,000 | $ | 1,923,000 | |||||||||
Interest on long-term debt | 714,749 | 119,990 | 235,796 | 215,008 | 143,955 | ||||||||||||||
Noncancellable purchase commitments | 97,493 | 50,570 | 39,856 | 7,067 | — | ||||||||||||||
Operating leases | 342,312 | 60,671 | 97,356 | 72,173 | 112,112 | ||||||||||||||
Capital leases, including interest | 38,761 | 17,526 | 19,335 | 1,900 | — | ||||||||||||||
Merger retention bonuses | 20,666 | 20,666 | — | — | — | ||||||||||||||
Deferred compensation plan (a) | 15,900 | — | — | — | — | ||||||||||||||
Contingent tax-sharing obligation assumed in business combinations (b) | 50,480 | 22,345 | — | — | 28,135 | ||||||||||||||
Total | $ | 4,233,361 | $ | 316,768 | $ | 517,343 | $ | 1,176,148 | $ | 2,207,202 | |||||||||
(a) The deferred compensation plan liability is recorded in the “Other long-term liabilities” line item on the consolidated balance sheets. The obligations are payable upon retirement or termination of employment. We have established an irrevocable trust to hold assets to partially fund benefit obligations under the deferred compensation plan, but cannot reasonably estimate the amount or timing of payments, if any, which we will make related to this liability.
(b) Due to the uncertainties of our ability to realize certain pre-Merger transaction tax deductions, we are not able to estimate the timing of the assumed contingent tax-sharing obligation payments beyond one year.
The interest payments on long-term debt in the above table are based on interest rates in effect as of December 31, 2017. See "Note 4 - Long-Term Debt Obligations" to our consolidated financial statements included in Part II, Item 8, "Financial Statements and Supplementary Data" in this Annual Report on Form 10-K for further information on the terms and conditions of our 2017 Credit Agreement.
As of December 31, 2017, we have recorded a tax liability for unrecognized tax benefits for uncertain tax positions of $43.7 million which has not been included in the above table due to the uncertainties in the timing of the settlement of the income tax positions.
In January 2018, we replaced our lease agreement for the Farnborough location with a new ten-year lease agreement. The new agreement provides for additional office space to accommodate our operating plans following the Merger and increases our future lease obligations for this location by $11.8 million which has not been reflected in the table above.
We are a party to supplier contracts related to clinical services that if canceled would require payment for services performed and potentially additional services required to protect the safety of subjects. The value of these potential wind-down provisions is not practical to estimate.
Off-balance Sheet Arrangements
We do not have any off-balance sheet arrangements except for operating leases entered into in the normal course of business.
81
Critical Accounting Policies and Estimates
The preparation of financial statements in conformity with U.S. GAAP requires management to make estimates, judgments and assumptions that affect the reported amounts of assets and liabilities, revenues and expenses during the period, as well as disclosures of contingent assets and liabilities at the date of the financial statements. We evaluate our estimates on an ongoing basis, including those related to revenue recognition, share-based compensation, valuation of goodwill and identifiable intangibles, tax-related contingencies and valuation allowances, allowance for doubtful accounts, and litigation contingencies, among others. These estimates are based on the information available to management at the time these estimates, judgments and assumptions are made. Actual results may differ materially from these estimates.
Business Combinations
We account for business combinations in accordance with ASC Topic 805, Business Combinations, using the acquisition method of accounting. The purchase price, or total consideration transferred, is determined as the fair value of assets exchanged, equity instruments issued, and liabilities assumed at the acquisition date. The acquisition method of accounting requires that the identifiable assets acquired, the liabilities assumed, and any non-controlling interest in the acquiree are measured and recorded at their fair values on the date of a business combination. Goodwill represents the excess of the purchase price over the estimated fair value of the net assets acquired, including the amount assigned to identifiable intangible assets. Acquisition-related costs are expensed as incurred. The consolidated financial statements reflect the results of operations of the acquiree from the date of the acquisition. For additional information, see Part II, Item 8, "Financial Statements and Supplemental Data - Note 3 - Business Combinations."
Revenue Recognition
We recognize revenue when all of the following conditions are satisfied: (1) there is persuasive evidence of an arrangement; (2) the service offering has been delivered to the customer; (3) the collection of the fees is reasonably assured; and (4) the arrangement consideration is fixed or determinable. We record revenues net of any tax assessments by governmental authorities, such as value added taxes, that are imposed on and concurrent with specific revenue generating transactions. In some cases, contracts provide for consideration that is contingent upon the occurrence of uncertain future events. We recognize contingent revenue when the contingency has been resolved and all other criteria for revenue recognition have been met.
Our arrangements are primarily service contracts and historically, a majority of the net service revenue has been earned under contracts which range in duration from several months to several years. Most of our contracts can be terminated by the customer with a 30-day notice. In the event of termination, our contracts often provide for fees for winding down the project, which include both fees incurred and actual expenses and non-cancellable expenditures and may include a fee to cover a percentage of the remaining professional fees on the project. We do not recognize revenue with respect to start-up activities including contract and scope negotiation, feasibility analysis and conflict of interest review associated with contracts. The costs for these activities are expensed as incurred.
We recognize revenue from our service contracts either using a fee-for-service method or proportional performance method. The majority of our service contracts represent a single unit of accounting. For fee-for-service contracts, we record revenue as contractual items (i.e., “units”) are delivered to the customer, or, in the event the contract is time and materials based, when labor hours are incurred. We use the proportional performance method when the fees for a service obligation are fixed pursuant to the contractual terms. Revenue is recognized as services are performed and measured on a proportional performance basis, generally using output measures specific to the services provided. We believe the best indicator of effort expended to complete the performance requirement related to a contractual obligation are the actual units delivered to the customer or the incurrence of labor hours when no other pattern of performance exists. In the event we use labor hours as the basis for determining proportional performance, we estimate the number of hours remaining to complete our service obligation. Actual hours incurred to complete the service requirement may differ from our estimate, and any differences are accounted for prospectively. Examples of output measures used by us are site or investigator recruitment, patient enrollment, data management, or other deliverables common to our Clinical Solutions segment.
82
We enter into multiple element arrangements in which we are engaged to provide multiple services under one agreement. In such arrangements, we record revenue as each separate service, or element, is delivered to the customer. Such arrangements reside predominantly within our Commercial Solutions segment where we are engaged to provide recruiting, deployment, and detailing services. These services may be sold individually or in combination with contractual fees based on fixed fees for each element, variable fees for each element, or a combination of both. For the arrangements that include multiple elements, arrangement consideration is allocated at inception to units of accounting based on the relative selling price. The best evidence of selling price of a unit of accounting is vendor-specific objective evidence (“VSOE”), which is the price charged when the deliverable is sold separately. When VSOE is not available to determine selling price, relevant third-party evidence (“TPE”) of selling price is used, if available. When neither VSOE nor TPE of selling price exists, the best estimate of selling price is used, which generally consists of an expected margin on the cost of services.
Changes in the scope of work are common, especially under long-term contracts, and generally result in a renegotiation of future contract pricing terms and change in contract value. If the customer does not agree to contract modification, we could bear the risk of cost overruns. Renegotiated amounts are not included in net revenues until written authorization is received, the amount is earned and realization is assured.
We offer volume rebates to our large customers based on annual volume thresholds. We record an estimate of the annual volume rebate as a reduction of revenue throughout the period based on the estimated total rebate to be earned for the period.
Billed and Unbilled Accounts Receivable
Accounts receivable are recorded at net realizable value. Unbilled accounts receivable arise when services have been rendered for which revenue has been recognized but the customers have not been billed. In general, prerequisites for billings and payments are established by contractual provisions, including predetermined payment schedules, which may or may not correspond to the timing of the performance of services under the contract.
Deferred Revenue
Deferred revenue represents receipts of payments from customers in advance of services being provided and the related revenue being earned or reimbursable expenses being incurred. As the contracted services are subsequently performed and the associated revenue is recognized, the deferred revenue balance is reduced by the amount of the revenue recognized during the period.
Under certain contracts, we are entitled to additional compensation if performance-based criteria are achieved. Because there is substantive uncertainty regarding the ability to realize such amounts at the onset of the arrangements, we do not recognize such revenues until it has met the performance-based criteria and other revenue recognition criteria described above.
Allowance for Doubtful Accounts
We maintain a credit approval process and make judgments in connection with assessing our customers' ability to pay throughout the contractual obligation. Despite this assessment, from time to time, customers are unable to meet their payment obligations. We monitor customers' credit worthiness and apply judgment in establishing a provision for estimated credit losses based on historical experience, current receivables aging, and identified customer-specific circumstances that would affect the customers' ability to meet their obligations.
Goodwill and Intangible Assets
In January 2017, the FASB issued ASU No. 2017-04, Intangibles - Goodwill and Other (Topic 350): Simplifying the Test for Goodwill Impairment, which eliminates the second step of the previous FASB guidance for testing goodwill for impairment and is intended to reduce cost and complexity of goodwill impairment testing. The amendments in this ASU modify the concept of impairment from the condition that exists when the carrying amount of goodwill exceeds its implied fair value to the condition that exists when the
83
carrying amount of a reporting unit exceeds its fair value. After determining if the carrying amount of a reporting unit exceeds its fair value, the entity should take an impairment charge of the same amount to the goodwill for that reporting unit, not to exceed the total goodwill amount for that reporting unit. This eliminates the second step of calculating the implied fair value of goodwill by assigning the fair value of a reporting unit to all of its assets and liabilities as if that reporting unit had been acquired in a business combination. ASU 2017-04 is effective for annual periods beginning after December 15, 2019, including interim periods within those annual periods. Early adoption is permitted for interim or annual goodwill impairment tests performed on testing dates after January 1, 2017. We have elected to early adopt this standard effective January 1, 2017.
Goodwill represents the excess of purchase price over the estimated fair value of net assets acquired, including the amount assigned to identifiable intangible assets, in business combinations. In accordance with ASC Topic 350, Intangibles - Goodwill and Other, goodwill is not subject to amortization but must be tested for impairment annually or more frequently if events or changes in circumstances indicate that goodwill might be impaired. Goodwill is tested for impairment at the reporting unit level, which is one level below the operating segment level. This test requires us to determine if the implied fair value of the reporting unit's goodwill is less than its carrying amount.
We completed our annual impairment test for potential impairment as of October 1, 2017 for all of its reporting units, determining that there were no impairments. As of October 1, 2017 and December 31, 2017, we assigned goodwill to five reporting units. Our goodwill is principally related to the Merger completed in August 2017.
Intangible assets consist of backlog, customer relationships, and trademarks. We amortize intangible assets related to customer relationships and trademarks on a straight-line basis over the estimated useful life of the asset. Intangible assets related to backlog are amortized based on our expectations of when revenue associated with the backlog is expected to be earned.
We review intangible assets at the end of each reporting period to determine if facts and circumstances indicate that the useful life is shorter than originally estimated or that the carrying amount of the assets might not be recoverable. If such facts and circumstances exist, we assess the recoverability of identified assets by comparing the projected undiscounted net cash flows associated with the related asset or group of assets over their remaining lives to their respective carrying amounts. Impairments, if any, are based on the excess of the carrying amount over the fair value of those assets and occur in the period in which the impairment determination was made.
Share-Based Compensation
We measure and recognize compensation expense related to all share-based awards based on the estimated fair value of the awards. The fair value of restricted stock and stock unit awards is measured on the grant date based on the fair market value of our common stock. The fair value of stock option awards and Employee Stock Purchase Plan ("ESPP") awards is estimated on the grant date using the Black-Scholes option-pricing model and is affected by our stock price and a number of highly complex and subjective assumptions. These assumptions include, but are not limited to, the following:
Expected Term - Given our limited history with employee share-based awards, we do not have sufficient company-specific information related to the life of the awards. As permitted by the SEC Staff, we estimate expected term using the "simplified" method which represents the average of the time-to-vest and the contractual life of the options.
Expected Volatility - Beginning in 2017, expected volatility of our stock price is estimated based on (i) the historical volatility of our stock for periods in which we have sufficient information, or (ii) the simple average of the historical stock volatilities of several comparable publicly traded companies from the CRO industry for periods for which we do not have sufficient information. Prior to 2017, due to the limited trading history of our stock, the expected volatility estimate was based solely on the historical stock volatilities of comparable publicly traded companies.
84
Risk-Free Interest Rate - The risk-free interest rate is based on the yield in effect at the time of grant for United States Treasury zero-coupon notes with maturities approximating each grant's expected term.
Expected Dividend Yield - We have not paid and do not anticipate paying cash dividends on our common stock; therefore, the expected dividend yield is assumed to be zero.
Share-based compensation expense is recognized on a straight-line basis over the shorter of the requisite service period or the vesting term. For awards with performance conditions, stock-based compensation expense is recognized when the achievement of each individual performance target becomes probable, and the number of shares expected to vest is adjusted for the weighted probability of attainment of the relevant performance targets.
In March 2016, the FASB issued ASU No. 2016-09, Compensation - Stock Compensation: Improvements to Employee Share-Based Payment Accounting. In accordance with the guidance, the Company elected to early adopt this ASU effective in the first quarter of 2016. The following summarizes the changes made as a result of this adoption:
• | Income taxes - All excess tax benefits and tax deficiencies (including tax benefits of dividends on share-based payment awards) are recognized as income tax expense or benefit in the statement of operations. The tax effects of exercised or vested awards are treated as discrete items in the reporting period in which they occur. We also recognize excess tax benefits regardless of whether the benefit reduces taxes payable in the current period. |
• | Forfeitures - Prior to adoption, share-based compensation expense was recognized on a straight line basis, net of estimated forfeitures, such that expense was recognized only for share-based awards that are expected to vest. A forfeiture rate was estimated annually and revised, if necessary, in subsequent periods if actual forfeitures differed from initial estimates. Upon adoption, we no longer apply a forfeiture rate and instead account for forfeitures as they occur. |
• | Statements of Cash Flows - We historically accounted for excess tax benefits on the consolidated statement of cash flows as a financing activity. Upon adoption of this standard, excess tax benefits are classified along with other income tax cash flows as an operating activity. |
• | Earnings Per Share - We use the treasury stock method to compute diluted earnings per share, unless the effect would be anti-dilutive. Under this method, we are no longer required to estimate the tax rate and apply it to the dilutive share calculation for determining the dilutive earnings per share. |
See "Note 1 - Basis of Presentation and Summary of Significant Accounting Policies" to our consolidated financial statements included in Part II, Item 8, "Financial Statements and Supplementary Data" in this Annual Report on Form 10-K for further information on the impact of this adoption.
Income Taxes
We and our U.S. subsidiaries file a consolidated U.S. federal income tax return. Our other subsidiaries file tax returns in their local jurisdictions.
We provide for income taxes on all transactions that have been recognized in the consolidated financial statements. Specifically, we estimate our tax liability based on current tax laws in the statutory jurisdictions in which we operate. Accordingly, the impact of changes in income tax laws on deferred tax assets and deferred tax liabilities are recognized in net earnings in the period during which such changes are enacted. We record deferred tax assets and liabilities based on temporary differences between the financial statement and tax bases of assets and liabilities and for tax benefit carryforwards using enacted tax rates in effect in the year in which the differences are expected to reverse.
We provide valuation allowances against deferred tax assets for amounts that are not considered more likely than not to be realized. The valuation of the deferred tax asset is dependent on, among other things, our ability to generate a sufficient level of future taxable income. In estimating future taxable income, we have considered both positive and negative evidence, such as historical and forecasted results of operations, and
85
have considered the implementation of prudent and feasible tax planning strategies. If the objectively verifiable negative evidence outweighs any available positive evidence (or the only available positive is subjective and cannot be verified), then a valuation allowance will likely be deemed necessary. If a valuation allowance is deemed to be unnecessary, such allowance is released and any related benefit is recognized in the period of the change.
We recognize a tax benefit from an uncertain tax position only if we believe it is more likely than not to be sustained upon examination based on the technical merits of the position. Judgment is required in determining what constitutes an individual tax position, as well as the assessment of the outcome of each tax position. We consider many factors when evaluating and estimating tax positions and tax benefits. In addition, the calculation of tax liabilities involves dealing with uncertainties in the application of complex tax regulations in domestic and foreign jurisdictions. The amount of the accrual for which an exposure exists is measured as the largest amount of benefit determined on a cumulative probability basis that we believe is more likely than not to be realized upon ultimate settlement of the position. If the calculation of liability related to uncertain tax positions proves to be more or less than the ultimate assessment, a tax expense or benefit, respectively, would result. Unrecognized tax benefits, or a portion of unrecognized tax benefits, are presented as a reduction to a deferred tax asset for a NOL carryforward, a similar tax loss, or a tax credit carryforward.
As a result of the tax reform and the new GILTI and BEAT provisions under the Tax Act, we believe there is a reasonable possibility that within the next 12 to 24 months, sufficient positive evidence may become available to allow the Company to reach a conclusion that a significant portion of the valuation allowance will no longer be needed. Consequently, such release of the valuation allowance would result in the recognition of certain deferred tax assets and a decrease to the income tax expense in the period that the release is recorded.
Recently Issued Accounting Standards
For a description of recently issued accounting pronouncements, including the expected dates of adoption and the estimated effects, if any, on our consolidated financial statements, see "Note 1 - Basis of Presentation and Changes in Significant Accounting Policies" to our consolidated financial statements in Part II, Item 8, "Financial Statements and Supplementary Data" in this Annual Report on Form 10-K.
86
Item 7A. Quantitative and Qualitative Disclosures About Market Risk.
Market risk is the potential loss arising from adverse changes in market rates and prices, such as foreign currency exchange rates, interest rates and other relevant market rate or price changes. In the ordinary course of business, we are exposed to various market risks, including changes in foreign currency exchange rates and interest rates, and we regularly evaluate our exposure to such changes. Our overall risk management strategy seeks to balance the magnitude of the exposure and the cost and availability of appropriate financial instruments. From time to time, we have utilized forward exchange contracts to manage our foreign currency exchange rate and interest rate risk.
Foreign Currency Exchange Rates
Approximately 17%, 21% and 25% of our net service revenues for the years ended December 31, 2017, 2016 and 2015, respectively, were denominated in currencies other than the U.S. dollar. Our financial statements are reported in U.S. dollars and, accordingly, fluctuations in exchange rates will affect the translation of our revenues and expenses denominated in foreign currencies into U.S. dollars for purposes of reporting our consolidated financial results. During 2017, 2016 and 2015, the most significant currency exchange rate exposures were the Euro, British Pound, Canadian Dollar, and Japanese Yen. A hypothetical change of 10% in average exchange rates used to translate all foreign currencies to U.S. dollars would have impacted income before income taxes for 2017 by approximately $22.5 million. The impact of this could be partially offset by exchange rate fluctuation provisions stated in some of our contracts with customers designed to mitigate our exposure to fluctuations in currency exchange rates over the life of the contract. For example during the year ended December 31, 2017, our revenue was reduced by $8.0 million to reflect the reduced operating costs required to fulfill the contracts as a result of the fluctuations in foreign currency exchange rates. We do not have significant operations in countries in which the economy is considered to be highly inflationary.
We are subject to foreign currency transaction risk for fluctuations in exchange rates during the period of time between the consummation and cash settlement of a transaction. Accordingly, exchange rate fluctuations during this period may affect our profitability with respect to such contracts. We are able to partially offset our foreign currency transaction risk through exchange rate fluctuation adjustment provisions stated in our contracts with customers, or we may hedge our transaction risk with foreign currency exchange contracts.
Interest Rates
We are subject to market risk associated with changes in interest rates. At December 31, 2017 and 2016, we had $2.99 billion and $500.0 million, respectively, of total principal indebtedness (including $36.8 million of capital leases), of which $2.43 billion and $241.7 million, was subject to variable interest rates. Each quarter-point increase or decrease in the applicable interest rate at December 31, 2017 and 2016 would change our annual interest expense by approximately $6.1 million and $0.6 million, respectively.
87
Item 8. Financial Statements and Supplementary Data.
Index to Consolidated Financial Statements
Page | |
88
REPORT OF INDEPENDENT REGISTERED PUBLIC ACCOUNTING FIRM
To the shareholders and the Board of Directors of Syneos Health, Inc.
Opinion on the Financial Statements
We have audited the accompanying consolidated balance sheets of Syneos Health, Inc. (formerly INC Research Holdings, Inc.) and subsidiaries (the "Company") as of December 31, 2017 and 2016, the related consolidated statements of operations, comprehensive (loss) income, shareholders’ equity, and cash flows, for each of the two years in the period ended December 31, 2017, and the related notes (collectively referred to as the "financial statements"). In our opinion, the financial statements present fairly, in all material respects, the financial position of the Company as of December 31, 2017 and 2016, and the results of its operations and its cash flows for the two years then ended, in conformity with accounting principles generally accepted in the United States of America.
We have also audited, in accordance with the standards of the Public Company Accounting Oversight Board (United States) (PCAOB), the Company's internal control over financial reporting as of December 31, 2017, based on criteria established in Internal Control - Integrated Framework (2013) issued by the Committee of Sponsoring Organizations of the Treadway Commission and our report dated February 28, 2018, expressed an unqualified opinion on the Company's internal control over financial reporting.
Basis for Opinion
These financial statements are the responsibility of the Company's management. Our responsibility is to express an opinion on the Company's financial statements based on our audits. We are a public accounting firm registered with the PCAOB and are required to be independent with respect to the Company in accordance with the U.S. federal securities laws and the applicable rules and regulations of the Securities and Exchange Commission and the PCAOB.
We conducted our audits in accordance with the standards of the PCAOB. Those standards require that we plan and perform the audit to obtain reasonable assurance about whether the financial statements are free of material misstatement, whether due to error or fraud. Our audits included performing procedures to assess the risks of material misstatement of the financial statements, whether due to error or fraud, and performing procedures that respond to those risks. Such procedures included examining, on a test basis, evidence regarding the amounts and disclosures in the financial statements. Our audits also included evaluating the accounting principles used and significant estimates made by management, as well as evaluating the overall presentation of the financial statements. We believe that our audits provide a reasonable basis for our opinion.
/s/ Deloitte & Touche LLP
Raleigh, North Carolina
February 28, 2018
We have served as the Company's auditor since 2016.
89
REPORT OF INDEPENDENT REGISTERED PUBLIC ACCOUNTING FIRM
To the shareholders and the Board of Directors of Syneos Health, Inc.
Opinion on Internal Control over Financial Reporting
We have audited the internal control over financial reporting of Syneos Health, Inc. (formerly INC Research Holdings, Inc.) and subsidiaries (the “Company”) as of December 31, 2017, based on criteria established in Internal Control - Integrated Framework (2013) issued by the Committee of Sponsoring Organizations of the Treadway Commission (COSO). In our opinion, the Company maintained, in all material respects, effective internal control over financial reporting as of December 31, 2017, based on criteria established in Internal Control - Integrated Framework (2013) issued by COSO.
We have also audited, in accordance with the standards of the Public Company Accounting Oversight Board (United States) (PCAOB), the consolidated financial statements as of and for the year ended December 31, 2017, of the Company and our report dated February 28, 2018, expressed an unqualified opinion on those financial statements.
As described in Management’s Annual Report on Internal Control Over Financial Reporting, management excluded from its assessment the internal control over financial reporting at Double Eagle Parent, Inc. (“inVentiv”), which was acquired on August 1, 2017, and whose financial statements constitute 30% of total assets (excluding goodwill which was included in management’s assessment of internal control over financial reporting as of December 31, 2017), and 41% of total revenues of the consolidated financial statement amounts as of and for the year ended December 31, 2017. Accordingly, our audit did not include the internal control over financial reporting at inVentiv.
Basis for Opinion
The Company’s management is responsible for maintaining effective internal control over financial reporting and for its assessment of the effectiveness of internal control over financial reporting, included in the accompanying Management’s Annual Report on Internal Control Over Financial Reporting. Our responsibility is to express an opinion on the Company’s internal control over financial reporting based on our audit. We are a public accounting firm registered with the PCAOB and are required to be independent with respect to the Company in accordance with the U.S. federal securities laws and the applicable rules and regulations of the Securities and Exchange Commission and the PCAOB.
We conducted our audit in accordance with the standards of the PCAOB. Those standards require that we plan and perform the audit to obtain reasonable assurance about whether effective internal control over financial reporting was maintained in all material respects. Our audit included obtaining an understanding of internal control over financial reporting, assessing the risk that a material weakness exists, testing and evaluating the design and operating effectiveness of internal control based on the assessed risk, and performing such other procedures as we considered necessary in the circumstances. We believe that our audit provides a reasonable basis for our opinion.
Definition and Limitations of Internal Control over Financial Reporting
A company’s internal control over financial reporting is a process designed to provide reasonable assurance regarding the reliability of financial reporting and the preparation of financial statements for external purposes in accordance with generally accepted accounting principles. A company’s internal control over financial reporting includes those policies and procedures that (1) pertain to the maintenance of records that, in reasonable detail, accurately and fairly reflect the transactions and dispositions of the assets of the company; (2) provide reasonable assurance that transactions are recorded as necessary to permit preparation of financial statements in accordance with generally accepted accounting principles, and that receipts and expenditures of the company are being made only in accordance with authorizations of management and directors of the company; and (3) provide reasonable assurance regarding prevention or timely detection of unauthorized acquisition, use, or disposition of the company’s assets that could have a material effect on the financial statements.
Because of its inherent limitations, internal control over financial reporting may not prevent or detect misstatements. Also, projections of any evaluation of effectiveness to future periods are subject to the risk that controls may become inadequate because of changes in conditions, or that the degree of compliance with the policies or procedures may deteriorate.
/s/ Deloitte & Touche LLP
Raleigh, North Carolina
February 28, 2018
90
Report of Independent Registered Public Accounting Firm
The Board of Directors and Shareholders of Syneos Health, Inc.
We have audited the accompanying consolidated statements of operations, comprehensive (loss) income, shareholders' equity, and cash flows of Syneos Health Inc. (formerly INC Research Holdings, Inc.) for the year ended December 31, 2015. These financial statements are the responsibility of the Company's management. Our responsibility is to express an opinion on these financial statements based on our audit.
We conducted our audit in accordance with the standards of the Public Company Accounting Oversight Board (United States). Those standards require that we plan and perform the audit to obtain reasonable assurance about whether the financial statements are free of material misstatement. An audit includes examining, on a test basis, evidence supporting the amounts and disclosures in the financial statements. An audit also includes assessing the accounting principles used and significant estimates made by management, as well as evaluating the overall financial statement presentation. We believe that our audit provides a reasonable basis for our opinion.
In our opinion, the financial statements referred to above present fairly, in all material respects, the consolidated results of operations and cash flows of Syneos Health, Inc. for year ended December 31, 2015, in conformity with U.S. generally accepted accounting principles.
/s/ Ernst & Young LLP
Raleigh, North Carolina
February 24, 2016
except for the effects of the operating segments changes discussed in Note 1 and Note 14 and the changes to the net service revenues by geographic location as discussed in Note 15 as to which the date is
February 28, 2018
91
SYNEOS HEALTH, INC. AND SUBSIDIARIES
CONSOLIDATED STATEMENTS OF OPERATIONS
Year Ended December 31, | |||||||||||
2017 | 2016 | 2015 | |||||||||
(in thousands, except per share data) | |||||||||||
Net service revenue | $ | 1,852,843 | $ | 1,030,337 | $ | 914,740 | |||||
Reimbursable out-of-pocket expenses | 819,221 | 580,259 | 484,499 | ||||||||
Total revenue | 2,672,064 | 1,610,596 | 1,399,239 | ||||||||
Costs and operating expenses: | |||||||||||
Direct costs (exclusive of depreciation and amortization) | 1,232,023 | 626,633 | 542,404 | ||||||||
Reimbursable out-of-pocket expenses | 819,221 | 580,259 | 484,499 | ||||||||
Selling, general, and administrative | 282,620 | 172,386 | 156,609 | ||||||||
Restructuring and other costs | 33,315 | 13,612 | 1,785 | ||||||||
Transaction and integration-related expenses | 123,815 | 3,143 | 1,637 | ||||||||
Asset impairment charges | 30,000 | — | 3,931 | ||||||||
Depreciation | 44,407 | 21,353 | 18,140 | ||||||||
Amortization | 135,529 | 37,851 | 37,874 | ||||||||
Total operating expenses | 2,700,930 | 1,455,237 | 1,246,879 | ||||||||
(Loss) income from operations | (28,866 | ) | 155,359 | 152,360 | |||||||
Other (expense) income, net: | |||||||||||
Interest income | 1,182 | 216 | 192 | ||||||||
Interest expense | (63,725 | ) | (12,016 | ) | (15,640 | ) | |||||
Loss on extinguishment of debt | (622 | ) | (439 | ) | (9,795 | ) | |||||
Other (expense) income, net | (19,846 | ) | (9,002 | ) | 3,857 | ||||||
Total other expense, net | (83,011 | ) | (21,241 | ) | (21,386 | ) | |||||
(Loss) income before provision for income taxes | (111,877 | ) | 134,118 | 130,974 | |||||||
Income tax benefit (expense) | (26,592 | ) | (21,488 | ) | (13,927 | ) | |||||
Net (loss) income | $ | (138,469 | ) | $ | 112,630 | $ | 117,047 | ||||
Earnings per share attributable to common shareholders: | |||||||||||
Basic | $ | (1.85 | ) | $ | 2.08 | $ | 2.02 | ||||
Diluted | $ | (1.85 | ) | $ | 2.03 | $ | 1.95 | ||||
Weighted average common shares outstanding: | |||||||||||
Basic | 74,913 | 54,031 | 57,888 | ||||||||
Diluted | 74,913 | 55,610 | 60,146 | ||||||||
The accompanying notes are an integral part of these consolidated financial statements.
92
SYNEOS HEALTH, INC. AND SUBSIDIARIES
CONSOLIDATED STATEMENTS OF COMPREHENSIVE (LOSS) INCOME
Year Ended December 31, | |||||||||||
2017 | 2016 | 2015 | |||||||||
(in thousands) | |||||||||||
Net (loss) income | $ | (138,469 | ) | $ | 112,630 | $ | 117,047 | ||||
Unrealized gain on derivative instruments, net of income tax benefit (expense) of $10, $(707), and $0, respectively | 23 | 1,106 | — | ||||||||
Foreign currency translation adjustments, net of income tax (expense) of $(9,005), $0, and $0, respectively | 19,842 | (1,813 | ) | (15,343 | ) | ||||||
Comprehensive (loss) income | $ | (118,604 | ) | $ | 111,923 | $ | 101,704 | ||||
The accompanying notes are an integral part of these consolidated financial statements.
93
SYNEOS HEALTH, INC. AND SUBSIDIARIES
CONSOLIDATED BALANCE SHEETS
December 31, | |||||||
2017 | 2016 | ||||||
(in thousands, except share data) | |||||||
ASSETS | |||||||
Current assets: | |||||||
Cash and cash equivalents | $ | 321,262 | $ | 102,471 | |||
Restricted cash | 714 | 607 | |||||
Accounts receivable billed, net | 642,985 | 211,476 | |||||
Accounts receivable unbilled | 373,003 | 173,873 | |||||
Prepaid expenses and other current assets | 84,215 | 34,202 | |||||
Total current assets | 1,422,179 | 522,629 | |||||
Property and equipment, net | 180,412 | 58,306 | |||||
Goodwill | 4,292,571 | 552,502 | |||||
Intangible assets, net | 1,286,050 | 114,486 | |||||
Deferred income tax assets | 20,159 | 14,726 | |||||
Other long-term assets | 84,496 | 25,858 | |||||
Total assets | $ | 7,285,867 | $ | 1,288,507 | |||
LIABILITIES AND SHAREHOLDERS' EQUITY | |||||||
Current liabilities: | |||||||
Accounts payable | $ | 58,575 | $ | 23,693 | |||
Accrued liabilities | 500,303 | 153,559 | |||||
Deferred revenue | 559,270 | 277,600 | |||||
Current portion of capital lease obligations | 16,414 | — | |||||
Current portion of long-term debt | 25,000 | 11,875 | |||||
Total current liabilities | 1,159,562 | 466,727 | |||||
Capital lease obligations, non-current | 20,376 | — | |||||
Long-term debt, non-current | 2,945,934 | 485,849 | |||||
Deferred income tax liabilities | 37,807 | 8,295 | |||||
Other long-term liabilities | 99,609 | 26,163 | |||||
Total liabilities | $ | 4,263,288 | $ | 987,034 | |||
Commitments and contingencies (Note 18) | |||||||
Shareholders' equity: | |||||||
Preferred stock, $0.01 par value; 30,000,000 shares authorized, 0 shares issued and outstanding at December 31, 2017 and 2016, respectively | — | — | |||||
Common stock, $0.01 par value; 600,000,000 shares authorized, 104,435,501 and 53,762,786 shares issued and outstanding at December 31, 2017 and 2016, respectively | 1,044 | 538 | |||||
Additional paid-in capital | 3,414,389 | 573,176 | |||||
Accumulated other comprehensive loss, net of tax | (22,385 | ) | (42,250 | ) | |||
Accumulated deficit | (370,469 | ) | (229,991 | ) | |||
Total shareholders' equity | 3,022,579 | 301,473 | |||||
Total liabilities and shareholders' equity | $ | 7,285,867 | $ | 1,288,507 | |||
The accompanying notes are an integral part of these consolidated financial statements.
94
SYNEOS HEALTH, INC. AND SUBSIDIARIES
CONSOLIDATED STATEMENTS OF CASH FLOWS
Year Ended December 31, | |||||||||||
2017 | 2016 | 2015 | |||||||||
(in thousands) | |||||||||||
Cash flows from operating activities: | |||||||||||
Net (loss) income | $ | (138,469 | ) | $ | 112,630 | $ | 117,047 | ||||
Adjustments to reconcile net (loss) income to net cash provided by operating activities: | |||||||||||
Depreciation and amortization | 179,936 | 59,204 | 56,014 | ||||||||
Stock repurchase costs | — | — | 1,637 | ||||||||
Amortization of capitalized loan fees and original issue discount, net of Senior Notes premium | 500 | 972 | 1,346 | ||||||||
Share-based compensation | 59,696 | 14,020 | 5,074 | ||||||||
Provision for (recovery of) doubtful accounts | 4,167 | 2,570 | (144 | ) | |||||||
Provision for (benefit from) deferred income taxes | 14,431 | (22,260 | ) | 4,134 | |||||||
Foreign currency transaction losses | 7,912 | 20,681 | (795 | ) | |||||||
Asset impairment charges | 30,000 | — | 3,931 | ||||||||
Fair value adjustment of contingent tax-sharing obligation | (12,276 | ) | — | — | |||||||
Loss on extinguishment of debt | 622 | 439 | 9,795 | ||||||||
Excess income tax benefits from share-based awards | — | — | (975 | ) | |||||||
Other non-cash items | 4,712 | 286 | (82 | ) | |||||||
Changes in operating assets and liabilities, net of effect of business combinations: | |||||||||||
Billed and unbilled accounts receivable | 31,656 | (103,748 | ) | (54,073 | ) | ||||||
Accounts payable and accrued expenses | (16,982 | ) | 6,658 | 8,186 | |||||||
Deferred revenue | 28,967 | 4,060 | 68,500 | ||||||||
Other assets and liabilities | 3,386 | 13,820 | (14,855 | ) | |||||||
Net cash provided by operating activities | 198,258 | 109,332 | 204,740 | ||||||||
Cash flows from investing activities: | |||||||||||
Payments associated with business acquisitions, net of cash acquired | (1,678,814 | ) | — | — | |||||||
Purchases of property and equipment | (43,896 | ) | (31,353 | ) | (21,111 | ) | |||||
Other, net | (197 | ) | — | — | |||||||
Net cash used in investing activities | $ | (1,722,907 | ) | $ | (31,353 | ) | $ | (21,111 | ) | ||
The accompanying notes are an integral part of these consolidated financial statements.
95
SYNEOS HEALTH, INC. AND SUBSIDIARIES
CONSOLIDATED STATEMENTS OF CASH FLOWS
(Continued)
Year Ended December 31, | |||||||||||
2017 | 2016 | 2015 | |||||||||
(in thousands) | |||||||||||
Cash flows from financing activities: | |||||||||||
Proceeds from issuance of long-term debt | $ | 2,598,000 | $ | — | $ | 525,000 | |||||
Payments of debt financing costs | (25,476 | ) | (868 | ) | (4,987 | ) | |||||
Repayments of long-term debt | (525,097 | ) | — | (475,001 | ) | ||||||
Proceeds from revolving line of credit | 15,000 | 100,000 | 45,000 | ||||||||
Repayments of revolving line of credit | (40,000 | ) | (105,000 | ) | (15,000 | ) | |||||
Redemption of Senior Notes and associated breakage fees | (292,425 | ) | — | — | |||||||
Payments of contingent consideration related to business combinations | — | — | (973 | ) | |||||||
Payments of capital leases | (8,145 | ) | — | (452 | ) | ||||||
Payments of stock repurchase costs | — | — | (1,423 | ) | |||||||
Payments for repurchase of common stock | — | (64,500 | ) | (285,000 | ) | ||||||
Proceeds from exercise of stock options | 19,335 | 17,891 | 3,656 | ||||||||
Payments related to tax withholding for share-based compensation | (6,824 | ) | (839 | ) | (3,194 | ) | |||||
Excess income tax benefits from share-based awards | — | — | 975 | ||||||||
Net cash provided by (used in) financing activities | 1,734,368 | (53,316 | ) | (211,399 | ) | ||||||
Effect of exchange rate changes on cash and cash equivalents | 9,072 | (7,203 | ) | (13,672 | ) | ||||||
Net change in cash and cash equivalents | 218,791 | 17,460 | (41,442 | ) | |||||||
Cash and cash equivalents, beginning of period | 102,471 | 85,011 | 126,453 | ||||||||
Cash and cash equivalents, end of period | $ | 321,262 | $ | 102,471 | $ | 85,011 | |||||
Supplemental disclosure of cash flow information | |||||||||||
Cash paid for income taxes | $ | 13,300 | $ | 24,337 | $ | 8,251 | |||||
Cash paid for interest | 64,949 | 11,627 | 17,533 | ||||||||
Supplemental disclosure of noncash investing and financing activities | |||||||||||
Fair value of shares issued and share-based awards assumed in business combinations | $ | 2,769,471 | $ | — | $ | — | |||||
Purchases of property and equipment included in liabilities | 14,801 | 7,157 | 2,869 | ||||||||
Vehicles acquired through capital lease agreements | 8,730 | — | — | ||||||||
The accompanying notes are an integral part of these consolidated financial statements.
96
SYNEOS HEALTH, INC. AND SUBSIDIARIES
CONSOLIDATED STATEMENTS OF SHAREHOLDERS' EQUITY
Common Stock | Additional Paid-in Capital | Accumulated Other Comprehensive (Loss) Income | Accumulated Deficit | Total Shareholders' Equity | ||||||||||||||||||
Shares | Amount | |||||||||||||||||||||
(in thousands) | ||||||||||||||||||||||
Balance at December 31, 2014 | 61,234 | $ | 612 | $ | 634,946 | $ | (26,200 | ) | $ | (217,149 | ) | $ | 392,209 | |||||||||
Stock repurchase | (8,054 | ) | (80 | ) | (83,550 | ) | — | (201,370 | ) | (285,000 | ) | |||||||||||
Stock option exercises net of shares for tax withholding | 156 | 2 | (3,196 | ) | — | — | (3,194 | ) | ||||||||||||||
Stock option exercises | 535 | 5 | 5,661 | — | — | 5,666 | ||||||||||||||||
Share-based compensation | — | — | 5,074 | — | — | 5,074 | ||||||||||||||||
Income tax benefit from share-based award activities | — | — | 975 | — | — | 975 | ||||||||||||||||
Net income | — | — | — | — | 117,047 | 117,047 | ||||||||||||||||
Foreign currency translation adjustment | — | — | — | (15,343 | ) | — | (15,343 | ) | ||||||||||||||
Balance at December 31, 2015 | 53,871 | 539 | 559,910 | (41,543 | ) | (301,472 | ) | 217,434 | ||||||||||||||
Impact to Retained Earnings from adoption of ASU 2016-09 | — | — | — | — | 7,554 | 7,554 | ||||||||||||||||
Balance at January 1, 2016 | 53,871 | 539 | 559,910 | (41,543 | ) | (293,918 | ) | 224,988 | ||||||||||||||
Stock repurchase | (1,500 | ) | (15 | ) | (15,782 | ) | — | (48,703 | ) | (64,500 | ) | |||||||||||
RSU distributions net of shares for tax withholding | 33 | — | (839 | ) | — | — | (839 | ) | ||||||||||||||
Stock option exercises | 1,359 | 14 | 15,867 | — | — | 15,881 | ||||||||||||||||
Share-based compensation | — | — | 14,020 | — | — | 14,020 | ||||||||||||||||
Net income | — | — | — | — | 112,630 | 112,630 | ||||||||||||||||
Unrealized gain on derivative instruments, net of tax expense of ($707) | — | — | — | 1,106 | — | 1,106 | ||||||||||||||||
Foreign currency translation adjustment | — | — | — | (1,813 | ) | — | (1,813 | ) | ||||||||||||||
Balance at December 31, 2016 | 53,763 | 538 | 573,176 | (42,250 | ) | (229,991 | ) | 301,473 | ||||||||||||||
Impact to Retained Earnings from adoption of ASU 2016-16 | — | — | — | — | (2,009 | ) | (2,009 | ) | ||||||||||||||
Balance at January 1, 2017 | 53,763 | 538 | 573,176 | (42,250 | ) | (232,000 | ) | 299,464 | ||||||||||||||
Issuance of common stock associated with business combinations | 49,297 | 493 | 2,768,978 | — | — | 2,769,471 | ||||||||||||||||
RSU distributions net of shares for tax withholding | 198 | 2 | (6,826 | ) | — | — | (6,824 | ) | ||||||||||||||
Stock option exercises | 1,178 | 11 | 19,365 | — | — | 19,376 | ||||||||||||||||
Share-based compensation | — | — | 59,696 | — | — | 59,696 | ||||||||||||||||
Net loss | — | — | — | — | (138,469 | ) | (138,469 | ) | ||||||||||||||
Unrealized gain on derivative instruments, net of tax benefit of $10 | — | — | — | 23 | — | 23 | ||||||||||||||||
Foreign currency translation adjustment, net of tax expense of ($9,005) | — | — | — | 19,842 | — | 19,842 | ||||||||||||||||
Balance at December 31, 2017 | 104,436 | $ | 1,044 | $ | 3,414,389 | $ | (22,385 | ) | $ | (370,469 | ) | $ | 3,022,579 | |||||||||
The accompanying notes are an integral part of these consolidated financial statements.
97
Syneos Health, Inc. and Subsidiaries
Notes to Consolidated Financial Statements
1. Basis of Presentation and Summary of Significant Accounting Policies
Principal Business
Syneos Health, Inc. (the “Company”) is a global end-to-end outsourcing biopharmaceutical solutions organization. The Company operates under two reportable segments, Clinical Solutions and Commercial Solutions, and derives its revenue through a suite of services designed to enhance its customers’ ability to successfully develop, launch, and market their products. The Company offers its solutions on both a standalone and integrated basis with biopharmaceutical development and commercialization services ranging from Phase I-IV clinical trial services to services associated with the commercialization of biopharmaceutical products. The Company’s customers include small, mid-sized, and large companies in the pharmaceutical, biotechnology, and medical device industries.
Organization
On August 13, 2010, the Company was incorporated in the State of Delaware for the purpose of acquiring the outstanding equity of INC Research, Inc. through INC Research Intermediate, LLC, ("INC Intermediate") a wholly-owned subsidiary of the Company. On November 7, 2014, in conjunction with the initial public offering ("IPO"), the Company effected a corporate reorganization, whereby INC Intermediate was merged with and into the Company. On August 1, 2017, the Company completed the merger (the “Merger”) with Double Eagle Parent, Inc. (“inVentiv”), the parent company of inVentiv Health, Inc. Upon closing, inVentiv was merged with and into the Company, with the Company continuing as the surviving corporation. Following the Merger, the Company amended and restated its certificate of incorporation to change its name from “INC Research Holdings, Inc.” to “Syneos Health, Inc.” effective as of January 4, 2018. Beginning August 1, 2017, inVentiv’s results of operations are included in the accompanying audited consolidated financial statements. For additional information related to the Merger, see "Note 3 - Business Combinations."
Principles of Consolidation
The accompanying consolidated financial statements have been prepared in accordance with accounting principles generally accepted in the United States of America ("U.S. GAAP"), and include the accounts and results of operations of the Company and its controlled subsidiaries. All intercompany balances and transactions have been eliminated.
Use of Estimates
The preparation of the consolidated financial statements in conformity with U.S. GAAP requires management to make estimates and assumptions. These estimates and assumptions affect the reported amounts of assets and liabilities and the disclosures of contingent assets and liabilities as of the date of the financial statements, and the reported amounts of revenue and expenses for the periods presented in the financial statements. Examples of estimates and assumptions include, but are not limited to, determining the fair value of goodwill and intangible assets and their potential impairment, useful lives of tangible and intangible assets, useful lives of assets subject to capital leases, allowances for doubtful accounts, potential future outcomes of events for which income tax consequences have been recognized in the Company’s consolidated financial statements or tax returns, valuation of allowances for deferred tax assets, fair value of share-based compensation and its recognition period, claims and insurance accruals, loss contingencies, fair value of derivative instruments and related hedge effectiveness, fair value of contingent tax sharing obligations, and judgments related to revenue recognition, among others. In addition, estimates and assumptions are used in the accounting for the Merger and other business combinations, including the fair value and useful lives of acquired tangible and intangible assets and the fair value of assumed liabilities.
The Company evaluates its estimates and assumptions on an ongoing basis and bases its estimates on historical experience, current and expected future conditions, third-party evaluations, and various other assumptions that management believes are reasonable under the circumstances based on the information available to management at the time these estimates and assumptions are made. Actual results and outcomes may differ materially from these estimates and assumptions.
98
Business Combinations
The Company accounts for business combinations in accordance with ASC Topic 805, Business Combinations, using the acquisition method of accounting. The purchase price, or total consideration transferred, is determined as the fair value of assets exchanged, equity instruments issued, and liabilities assumed at the acquisition date. The acquisition method of accounting requires that the identifiable assets acquired, the liabilities assumed, and any non-controlling interest in the acquiree are measured and recorded at their fair values on the date of a business combination. Goodwill represents the excess of the purchase price over the estimated fair value of the net assets acquired, including the amount assigned to identifiable intangible assets. Acquisition-related costs are expensed as incurred. The audited consolidated financial statements reflect the results of operations of the acquiree from the date of the acquisition. For additional information, see "Note 3 - Business Combinations."
Segment Information
The Company discloses financial information concerning its operating segments in accordance with ASC Topic 280, Segment Reporting, which requires segmentation based on the Company's internal organization and reporting of revenues and operating income based upon internal accounting methods commonly referred to as the "management approach." Operating segments are defined as components of an enterprise about which separate financial information is available. This information is evaluated regularly by the Chief Operating Decision Maker (“CODM”) or decision-making group, in deciding how to allocate resources and in assessing performance. The Company's CODM is its Chief Executive Officer (“CEO”).
During the third quarter of 2017, the Company realigned its operating segments as a result of the Merger with inVentiv to reflect the current structure under which performance is evaluated, strategic decisions are made, and resources are allocated. As a result of this realignment, effective August 1, 2017, the Company began evaluating its financial performance based on two reportable segments, Clinical Solutions and Commercial Solutions (see "Note 14 - Segment Information" for further information). The Company has reflected this change to its segment information retrospectively to the earliest period presented. Amounts of net service revenue, direct costs, and contribution margin transferred between segments as a result of this change were immaterial. In addition, this change resulted in the reclassification of gross goodwill and accumulated goodwill impairment losses between segments as discussed in "Note 2 - Financial Statement Details." These changes had no impact on the Company's previously reported total consolidated net service revenue, income from operations, net income, or earnings per share.
Foreign Currency Translation and Transactions
The majority of the Company's foreign subsidiaries maintain their accounting records in their local currency which is determined to be their functional currency. All of the assets and liabilities of these subsidiaries are converted to U.S. dollars at the exchange rate in effect at the balance sheet date, and equity accounts are carried at historical exchange rates. Revenue and expenses are translated at average exchange rates in effect during each reporting period. The net effect of foreign currency translation adjustments is included in shareholder's equity as a component of "Accumulated other comprehensive loss" line item in the accompanying consolidated balance sheets.
Foreign currency transaction gains and losses are the result of exchange rate changes during the period of time between the consummation and cash settlement of transactions denominated in currencies other than the functional currency. Foreign currency transaction gains and losses are recognized in current period earnings as incurred and are included in "Other expense, net" line item in the accompanying consolidated statements of operations.
Comprehensive (Loss) Income
The Company has elected to present comprehensive (loss) income and its components as a separate financial statement. Other comprehensive (loss) income refers to revenue, expenses, gains, and losses that under U.S. GAAP are recorded as an element of shareholders' equity but are excluded from net income (loss). The Company's other comprehensive (loss) income consists of foreign currency translation adjustments, net of applicable taxes, resulting from the translation of foreign subsidiaries with functional
99
currencies other than the U.S. dollar and the effective portions of the unrealized gains or losses associated with derivative instruments designated and accounted for as hedging instruments.
Cash and Cash Equivalents
Cash and cash equivalents consist of demand deposits with banks and other financial institutions and highly liquid investments with an original maturity of three months or less at the date of purchase. Cash and cash equivalents are carried at cost, which approximates their fair value.
Certain of our subsidiaries participate in a notional cash pooling arrangement to manage global liquidity requirements. The parties to the arrangement combine their cash balances in pooling accounts with the ability to offset bank overdrafts of one subsidiary against positive cash account balances maintained in another subsidiary’s bank account at the same financial institution. The net cash balance related to this pooling arrangement is included in the “Cash and cash equivalents” line item in the audited consolidated balance sheet. As of December 31, 2017, the net cash position in the pool was $107.2 million, consisting of the gross cash balance of $195.4 million and gross bank overdraft balances of $88.2 million.
Restricted Cash
Restricted cash represents cash and term deposits held as security over bank deposits, lease guarantees, and insurance obligations that are restricted as to withdrawal or use. Restricted cash is classified as a current or long-term asset based on the timing and nature of when and how the cash is expected to be used or when the restrictions are expected to lapse. The Company includes changes in restricted cash balances as part of investing activities in the consolidated statements of cash flows.
Fair Value
The Company records certain assets and liabilities at fair value in accordance with ASC Topic 820, Fair Value Measurement (see "Note 7 - Fair Value Measurements"). Fair value is defined as the price that would be received to sell an asset or paid to transfer a liability in the principal or most advantageous market for the asset or liability in an orderly transaction between market participants at the measurement date. This guidance also specifies a fair value hierarchy that distinguishes between valuation assumptions developed based on market data obtained from independent external sources and the reporting entity's own assumptions. In accordance with this guidance, fair value measurements are classified under the following hierarchy:
Level 1 — Unadjusted quoted prices in active markets for identical instruments;
Level 2 — Quoted prices for similar instruments in active markets; quoted prices for identical or similar instruments in markets that are not active; and model-derived valuations in which all significant inputs or significant value-drivers are observable in active markets; and
Level 3 — Model-derived valuations in which one or more significant inputs or significant value-drivers are unobservable.
Fair value measurements are classified according to the lowest level input or value-driver that is significant to the valuation. When available, the Company uses quoted market prices to determine fair value and classifies such instruments within the Level 1 category. In cases where market prices are not available, the Company estimates fair value using observable market inputs, in which case the measurements are classified within Level 2. If quoted or observable market prices are not available, fair value estimates are based upon valuation techniques in which one or more significant inputs are unobservable, including internally developed models. These measurements are classified within the Level 3 category.
Derivative Financial Instruments
The Company uses interest rate swaps designated as cash flow hedges to manage exposure to variable interest rates on its debt obligations. The Company designates its interest rate swaps as cash flow hedges because they are executed to hedge the Company's exposure to the variability in expected future cash flows that are attributable to changes in interest rates.
100
Derivative financial instruments are recognized on the accompanying balance sheets in the "Prepaid expenses and other current assets" and "Other long-term assets" line items and are measured at fair value. The fair value of interest rate swaps is determined using the market standard methodology of discounted future variable cash receipts. The variable cash receipts are determined by discounting the future expected cash receipts that would occur if variable interest rates rise above the fixed rate of the swaps. The variable interest rates used in the calculation of projected receipts on the swap are based on an expectation of future interest rates derived from observable market interest rate curves and volatilities. Changes in the fair value of derivative instruments designated as hedging instruments are recorded each period according to the determination of the derivative's effectiveness. The effective portion of changes in the fair value of derivatives designated as cash flow hedges is recorded in accumulated other comprehensive loss and subsequently reclassified into earnings in the period during which the hedged transaction is recognized in earnings. The ineffective portion of the change in fair value of the derivatives is recognized as non-operating income or expense immediately when incurred and included in the "Interest expense" line item in the accompanying consolidated statements of operations.
Billed and Unbilled Accounts Receivable
Accounts receivable are recorded at net realizable value. Unbilled accounts receivable arise when services have been rendered for which revenue has been recognized but the customers have not been billed. In general, prerequisites for billings and payments are established by contractual provisions, including predetermined payment schedules, which may or may not correspond to the timing of the performance of services under the contract.
Deferred Revenue
Deferred revenue represents receipts of payments from customers in advance of services being provided and the related revenue being earned or reimbursable expenses being incurred. As the contracted services are subsequently performed and the associated revenue is recognized, the deferred revenue balance is reduced by the amount of the revenue recognized during the period.
Under certain contracts, the Company is entitled to additional compensation if performance-based criteria are achieved. Because there is substantive uncertainty regarding the ability to realize such amounts at the onset of the arrangements, the Company does not recognize such revenues until it has met the performance-based criteria and other revenue recognition criteria described above.
Allowance for Doubtful Accounts
The Company maintains a credit approval process and makes judgments in connection with assessing its customers' ability to pay throughout the contractual obligation period. Despite this assessment, from time to time, customers are unable to meet their payment obligations. The Company monitors customers' credit worthiness and applies judgment in establishing a provision for estimated credit losses based on historical experience, current receivables aging, and identified customer-specific circumstances that would affect the customers' ability to meet their obligation.
Property and Equipment
Property and equipment is primarily comprised of furniture, vehicles, software, office equipment, computer equipment, and lab equipment. Purchased and constructed property and equipment is initially recorded at historical cost plus the estimated value of any associated legally or contractually required retirement obligations. Property and equipment acquired in a business combination are recorded based on the estimated fair value as of the acquisition date. The Company leases vehicles for certain sales representatives in the Commercial Solutions segment. These leases are classified and accounted for as capital leases in accordance with ASC Topic 840, Leases. For further information about lease arrangements, see "Note 5 - Leases."
101
Property and equipment assets are depreciated using the straight-line method over the respective estimated useful lives as follows:
Useful Life | |
Buildings | 39 years |
Furniture and fixtures | 7 years |
Equipment | 5 to 10 years |
Computer equipment and software | 3 years |
Vehicles | Lesser of lease term or the estimated economic life of the leased asset |
Leasehold improvements | Lesser of remaining life of lease or the useful life of the asset |
Expenditures for repairs and maintenance are expensed as incurred and expenditures for major improvements that increase the functionality or extend the useful life of the asset are capitalized and depreciated over the estimated useful life of the asset.
The Company capitalizes costs of computer software obtained for internal use and amortizes these costs on a straight-line basis over the estimated useful life of the product, not to exceed three years. Software cloud computing arrangements containing a software license are accounted for consistently with the acquisition of other software licenses. In the event such an arrangement does not contain a software license, the Company accounts for the arrangement as a service contract.
The Company reviews property and equipment for impairment whenever facts and circumstances indicate that the carrying amounts of these assets might not be recoverable. For assessment purposes, property and equipment are grouped with other assets and liabilities at the lowest level of which identifiable cash flows are largely independent of the cash flows of other assets and liabilities. Recoverability of the carrying amount of the asset group to be held is assessed by comparing the carrying amount of the asset group to the estimated undiscounted future net cash flows expected to be generated by this asset group. If the carrying value of the asset group is not recoverable and exceeds its fair value, an impairment charge is recognized for the amount by which the carrying amount of the asset group exceeds its fair value.
Leases
The Company accounts for leased properties under the provisions of ASC Topic 840, Leases. The Company evaluates each lease for classification as either a capital lease or an operating lease. The Company performs this evaluation at the inception of the lease and when a modification is made to a lease. Under lease arrangements that are classified as capital leases, the Company records property as part of its property and equipment assets, and a capital lease obligation in an amount equal to the lesser of the present value of the minimum lease payments to be made over the life of the lease at the beginning of the lease term, or the fair value of the leased property. The property under capital lease is amortized on a straight-line basis as a charge to depreciation expense over the lesser of the lease term, as defined, or the economic life of the leased property. During the lease term, as defined, each minimum lease payment is allocated between a reduction of the lease obligation and interest expense so as to produce a constant periodic rate of interest on the remaining balance of the lease obligation. The Company’s capital lease assets consist primarily of vehicles that the Company leases for certain sales representatives in the Commercial Solutions segment.
The majority of the Company's operations are conducted in premises occupied under lease agreements containing predominantly reasonable and standard market terms. The Company, at its option, can renew a substantial portion of the leases at defined terms or at the then fair rental rates for various periods. Office facilities leases are classified and accounted for as operating leases. The Company records rent expense for its operating leases with contractual rent increases on a straight-line basis from the "lease commencement date" as specified in the lease agreement until the end of the lease term.
102
Goodwill and Intangible Assets
Goodwill represents the excess of purchase price over the estimated fair value of net assets acquired, including the amount assigned to identifiable intangible assets, in business combinations. In accordance with ASC Topic 350, Intangibles - Goodwill and Other, goodwill is not subject to amortization but must be tested for impairment annually or more frequently if events or changes in circumstances indicate that goodwill might be impaired. Goodwill is tested for impairment at the reporting unit level, which is one level below the operating segment level. This test requires the Company to determine if the implied fair value of the reporting unit's goodwill is less than its carrying amount.
The Company completed the annual impairment test for potential impairment as of October 1, 2017 for all of its reporting units, determining that there were no impairments. As of October 1, 2017 and December 31, 2017, the Company had assigned goodwill to five reporting units. The Company's goodwill is principally related to the Merger completed in August 2017.
The impairment analysis requires significant judgments, estimates and assumptions. There is no assurance that the actual future earnings or cash flows of the reporting units will not decline significantly from the projections used in the impairment analysis. Goodwill impairment charges may be recognized in future periods in one or more of the reporting units to the extent changes in factors or circumstances occur, including deterioration in the macroeconomic environment, industry, deterioration in the Company’s performance or its future projections, or changes in plans for one or more of its reporting units.
Intangible assets consist primarily of backlog, customer relationships, and trademarks. The Company amortizes intangible assets related to customer relationships and trademarks on a straight-line basis over the estimated useful life of the asset. Intangible assets related to backlog are amortized based on the Company’s expectations of when revenue associated with the backlog is expected to be earned.
The Company reviews intangible assets at the end of each reporting period to determine if facts and circumstances indicate that the useful life is shorter than originally estimated or that the carrying amount of the assets might not be recoverable. If such facts and circumstances exist, the Company assesses the recoverability of identified assets by comparing the projected undiscounted net cash flows associated with the related asset or group of assets over their remaining lives to their respective carrying amounts. Impairments, if any, are based on the excess of the carrying amount over the fair value of those assets and occur in the period in which the impairment determination was made.
As of December 31, 2017 and 2016, the weighted average estimated useful lives of the Company's intangible assets were as follows:
December 31, 2017 | December 31, 2016 | ||
Customer relationships | 9.2 years | 5.0 years | |
Acquired backlog | 2.2 years | — | |
Trademarks | 3.5 years | — | |
Due to the Company’s intention to relaunch its operations under a new brand name in January 2018, the Company determined that the useful life of the intangible asset related to the INC Research trademark with a carrying value of $35.0 million was no longer indefinite as of August 1, 2017. Based on this change in circumstances, the Company tested the asset for impairment as an indefinite-lived intangible asset and recorded a $30.0 million impairment charge during the third quarter of 2017. The Company also determined that the remaining useful life of this asset did not extend beyond the anticipated date of the Merger-related rebranding and, as of August 1, 2017, approximated five months. Therefore, the Company reclassified this intangible asset from the indefinite-lived to the definite-lived category and began amortizing its remaining value on a straight-line basis over its remaining estimated useful life of five months. In addition, the Company assigned a value of $8.8 million to the inVentiv Health trade name in connection with the Merger, which was amortized over the same five month period. As of December 31, 2017, these trademarks were fully amortized. For additional information regarding the carrying values of intangible assets, see "Note 2 - Financial Statement Details."
103
Contingencies
In the normal course of business, the Company periodically becomes involved in various proceedings and claims, including investigations, disputes, litigations, and regulatory matters that are incidental to its business. The Company evaluates the likelihood of an unfavorable outcome of all legal and regulatory matters to which it is a party and records accruals for loss contingencies related to these matters when it is probable that a liability has been incurred and the amount of the loss can be reasonably estimated. Gain contingencies are not recognized until realized. Legal fees are expensed as incurred.
Because these matters are inherently unpredictable, and unfavorable developments or resolutions can occur, assessing contingencies is highly subjective and requires judgments about future events. These judgments and estimates are based, among other factors, on the status of the proceedings, the merits of the Company’s defenses, and the consultation with in-house and external counsel. The Company regularly reviews contingencies to determine whether its accruals and related disclosures are adequate. Although the Company believes that it has substantial defenses in these matters, the amount of losses incurred as a result of actual outcomes may differ significantly from the Company’s estimates.
Self-Insured and Other Insurance Risks Reserves
The Company carries insurance coverage for protection of its assets and operations from certain risks including automobile liability, general liability, real property, workers’ compensation coverage, directors’ and officers’ liability, employee healthcare benefits and other coverages the Company believes are customary to the industry. The Company’s exposure to loss for insurance and benefit claims is generally limited to the per incident deductible under the related insurance policy.
The Company retains the risk with respect to the self-insured portion of the above programs. For the self-insured retention limits, the Company estimates and accrues the liability for unpaid claims and associated expenses, including for losses incurred but not yet reported. The estimates are based on a number of factors, including the number of asserted claims and reported incidents, estimates of losses for these claims based on recent and historical settlement amounts, estimates of incurred but not yet reported claims based on historical experience, and estimates of amounts recoverable under the commercial insurance policies. A significant number of these claims typically take several years to develop and even longer to ultimately settle. Although the Company continuously monitors and considers these factors, the ultimate liability for claims could change materially from the current estimates due to inherent uncertainties and judgments involved in making these estimates. The Company reviews and adjusts its self-insured reserves at each reporting period, with changes recognized in current period earnings. For further information regarding self-insured reserve accruals and balances, see "Note 18 - Commitments and Contingencies."
Revenue Recognition
The Company recognizes revenue when all of the following conditions are satisfied: (i) there is persuasive evidence of an arrangement; (ii) the service offering has been delivered to the customer; (iii) the collection of the fees is reasonably assured; and (iv) the arrangement consideration is fixed or determinable. The Company records revenues net of any tax assessments by governmental authorities, such as value added taxes, that are imposed on and concurrent with specific revenue generating transactions. In some cases, contracts provide for consideration that is contingent upon the occurrence of uncertain future events. The Company recognizes contingent revenue when the contingency has been resolved and all other criteria for revenue recognition have been met.
The Company's arrangements are principally service contracts and historically, a majority of the net service revenue has been earned under contracts that range in duration from a few months to several years. Most of the Company's contracts can be terminated by the customer with a 30-day notice. In the event of termination, the Company's contracts provide that the customer pay the Company for fees earned through the termination date, as well as fees and expenses for winding down the project, which include both fees incurred and actual expenses, as well as non-cancellable expenditures and in some cases may include a fee to cover a portion of the remaining professional fees on the project. The Company does not recognize revenue with respect to
104
start-up activities including contract and scope negotiation, feasibility analysis and conflict of interest reviews. The costs for these activities are expensed as incurred.
The Company recognizes revenue from its service contracts either using a fee-for-service method or proportional performance method. The majority of the Company’s service contracts represent a single unit of accounting. For fee-for-service contracts, the Company records revenue as contractual items (i.e., “units”) are delivered to the customer, or, in the event the contract is time and materials based, when labor hours are incurred. The Company uses the proportional performance method when its fees for a service obligation are fixed pursuant to the contractual terms. Revenue is recognized as services are performed and measured on a proportional performance basis, generally using output measures specific to the services provided. The Company believes the best indicator of effort expended to complete its performance requirement related to its contractual obligation are the actual units delivered to the customer or the incurrence of labor hours when no other pattern of performance exists. In the event the Company uses labor hours as the basis for determining proportional performance, the Company estimates the number of hours remaining to complete its service obligation. Actual hours incurred to complete the service requirement may differ from the Company’s estimate, and any differences are accounted for prospectively. Examples of output measures used by the Company are site or investigator recruitment, patient enrollment, data management, or other deliverables common to its Clinical Solutions segment.
The Company enters into multiple element arrangements in which the Company is engaged to provide multiple services under one agreement. In such arrangements, the Company records revenue as each separate service, or element, is delivered to the customer. Such arrangements reside predominantly within the Company’s Commercial Solutions segment where the Company is engaged to provide recruiting, deployment, and detailing services. These services may be sold individually or in combination with contractual fees based on fixed fees for each element, variable fees for each element, or a combination of both. For the arrangements that include multiple elements, arrangement consideration is allocated at inception to units of accounting based on the relative selling price. The best evidence of selling price of a unit of accounting is vendor-specific objective evidence (“VSOE”), which is the price the Company charges when the deliverable is sold separately. When VSOE is not available to determine selling price, the Company uses relevant third-party evidence (“TPE”) of selling price, if available. When neither VSOE nor TPE of selling price exists, the Company uses its best estimate of selling price, which generally consists of an expected margin on the cost of services.
Changes in the scope of work are common, especially under long-term contracts, and generally result in a renegotiation of future contract pricing terms and change in contract value. If the customer does not agree to contract modification, the Company could bear the risk of cost overruns. Renegotiated amounts are not included in net revenues until written authorization is received, the amount is earned and realization is assured.
The Company offers volume rebates to its large customers based on annual volume thresholds. The Company records an estimate of the annual volume rebate as a reduction of revenue throughout the period based on the estimated total rebate to be earned for the period.
Reimbursable Out-of-Pocket Expenses
In connection with management of multi-site clinical trials, the Company is reimbursed by its customers for fees paid to principal investigators and for other out-of-pocket costs (such as travel expenses for the Company's clinical monitors). The Company includes these costs in total operating expenses, and the related reimbursements are reflected in total revenue, as the Company is deemed to be the primary obligor in the applicable arrangements.
Share-Based Compensation
The Company measures and recognizes compensation expense related to all share-based awards based on the estimated fair value of the awards. The fair value of restricted stock and stock unit awards is measured on the grant date based on the fair market value of the Company's common stock. The fair value of stock option awards and Employee Stock Purchase Plan ("ESPP") awards is estimated on the grant date using the Black-Scholes option-pricing model and is affected by the Company's stock price and a number of highly complex and subjective assumptions. These assumptions include, but are not limited to, the following:
105
Expected Term - Given the Company's limited history with employee share-based awards, the Company does not have sufficient Company-specific information related to the life of the awards. As permitted by the SEC Staff, the Company estimates expected term using the "simplified" method which represents the average of the time-to-vest and the contractual life of the options.
Expected Volatility - Beginning in 2017, expected volatility of the Company's stock price is estimated based on (i) the historical volatility of the Company's stock for periods in which the Company has sufficient information, or (ii) the simple average of the historical stock volatilities of several comparable publicly traded companies from the CRO industry for periods for which the Company does not have sufficient information. Prior to 2017, due to the limited trading history of the Company's stock, the expected volatility estimate was based solely on the historical stock volatilities of comparable publicly traded companies.
Risk-Free Interest Rate - The risk-free interest rate is based on the yield in effect at the time of grant for United States Treasury zero-coupon notes with maturities approximating each grant's expected term.
Expected Dividend Yield - The Company has not paid and does not anticipate paying cash dividends on its common stock; therefore, the expected dividend yield is assumed to be zero.
Share-based compensation expense is recognized on a straight-line basis over the shorter of the requisite service period or the vesting term. For awards with performance conditions, stock-based compensation expense is recognized when the achievement of each individual performance target becomes probable, and the number of shares expected to vest is adjusted for the weighted probability of attainment of the relevant performance targets.
In March 2016, the Financial Accounting Standards Board ("FASB") issued ASU No. 2016-09, Compensation - Stock Compensation: Improvements to Employee Share-Based Payment Accounting. In accordance with the guidance, the Company elected to early adopt this ASU effective in the first quarter of 2016. The following summarizes the effects of the adoption on the Company's consolidated financial statements:
Income taxes - Upon adoption of this standard, all excess tax benefits and tax deficiencies (including tax benefits of dividends on share-based payment awards) are recognized as income tax expense or benefit in the statement of operations. The tax effects of exercised or vested awards are treated as discrete items in the reporting period in which they occur. The Company also recognizes excess tax benefits regardless of whether the benefit reduces taxes payable in the current period. As a result, the Company recognized discrete adjustments to income tax expense for the year ended December 31, 2016 of $12.9 million related to excess tax benefits. The Company applied the modified retrospective adoption approach beginning in 2016 and recorded a cumulative-effect adjustment to retained earnings and reduced its deferred tax liability by $7.6 million. This adjustment related to tax assets that had previously arisen from tax deductions for equity compensation expenses that were greater than the compensation recognized for financial reporting. These assets had been excluded from the deferred tax assets and liabilities totals on the balance sheet as a result of realization requirements previously included in ASC 718, Stock Compensation. Prior periods have not been adjusted.
Forfeitures - Prior to adoption, share-based compensation expense was recognized on a straight line basis, net of estimated forfeitures, such that expense was recognized only for share-based awards that were expected to vest. A forfeiture rate was estimated annually and revised, if necessary, in subsequent periods if actual forfeitures differed from initial estimates. Upon adoption, the Company no longer applies a forfeiture rate and instead accounts for forfeitures as they occur. The Company applied the modified retrospective adoption approach beginning in 2016 and booked an immaterial cumulative-effect adjustment to additional paid-in-capital and share-based compensation expense. Prior periods have not been adjusted.
Statements of Cash Flows - The Company historically accounted for excess tax benefits on the Statement of Cash Flows as a financing activity. Upon adoption of this standard, excess tax benefits are classified along with other income tax cash flows as an operating activity. The Company elected to
106
adopt this portion of the standard on a prospective basis beginning in 2016. Prior periods have not been adjusted.
Earnings Per Share - The Company uses the treasury stock method to compute diluted earnings per share, unless the effect would be anti-dilutive. Under this method, the Company is no longer required to estimate the tax rate and apply it to the dilutive share calculation for determining the dilutive earnings per share. The Company utilized the modified retrospective adoption approach and applied this methodology beginning in 2016. Prior periods have not been adjusted.
Income Taxes
The Company and its United States (U.S.) subsidiaries file a consolidated U.S. federal income tax return. Other subsidiaries of the Company file tax returns in their local jurisdictions.
The Company estimates its tax liability based on current tax laws in the statutory jurisdictions in which it operates. Accordingly, the impact of changes in income tax laws on deferred tax assets and deferred tax liabilities are recognized in net earnings in the period during which such changes are enacted. The Company records deferred tax assets and liabilities based on temporary differences between the financial statement and tax bases of assets and liabilities and for tax benefit carryforwards using enacted tax rates in effect in the year in which the differences are expected to reverse.
Valuation allowances are provided to reduce the related deferred income tax assets to an amount which will, more likely than not, be realized. In estimating future taxable income, the Company has considered both positive and negative evidence, such as historical and forecasted results of operations, and has considered the implementation of prudent and feasible tax planning strategies. If the objectively verifiable negative evidence outweighs any available positive evidence (or the only available positive is subjective and cannot be verified), then a valuation allowance will likely be deemed necessary. If a valuation allowance is deemed to be unnecessary, such allowance is released and any related benefit is recognized in the period of the change.
Judgment is required in determining what constitutes an uncertain tax position, as well as the assessment of the outcome of each tax position. The Company considers many factors when evaluating and estimating tax positions and tax benefits. In addition, the calculation of tax liabilities involves dealing with uncertainties in the application of complex tax regulations in domestic and foreign jurisdictions. If the calculation of the liability related to uncertain tax positions proves to be more or less than the ultimate assessment, a tax expense or benefit to expense, respectively, would result. Unrecognized tax benefits, or a portion of unrecognized tax benefits, are presented as a reduction to a deferred tax asset for a net operating loss ("NOL") carryforward, a similar tax loss, or a tax credit carryforward.
Advertising Costs
Advertising costs include costs incurred to promote the Company's business and are expensed as incurred. Advertising costs were $6.5 million, $5.0 million and $4.4 million for the years ended December 31, 2017, 2016 and 2015, respectively.
Restructuring and Other Costs
Restructuring and other costs primarily consist of one-time employee termination benefits, contract termination costs, CEO transition costs, and other costs associated with an exit or disposal activity. The Company accounts for restructuring costs in accordance with the authoritative guidance in ASC Topic 420, Exit or Disposal Cost Obligations. This guidance requires that a liability for a cost associated with an exit or disposal activity be recognized in the period in which the liability is incurred, as opposed to the period in which management commits to a plan of action for termination. The guidance also requires that the liabilities associated with an exit or disposal activity be measured at the fair value in the period in which the liability is incurred, except for: (i) liabilities related to one-time employee termination benefits, which shall be measured and recognized at the date the entity notifies employees of termination, unless employees are required to render services beyond minimum retention period, in which case the liability is recognized ratably over the future service period; and (ii) liabilities related to an operating lease contract, which shall be measured and
107
recognized when the contract does not have any future economic benefit to the entity (i.e., the entity ceases to utilize the rights conveyed by the contract).
The guidance requires that the fair value of the restructuring liabilities is determined using best available representation of fair value or using other appropriate technique. In determining the fair value of the liabilities associated with contract terminations, the Company considers terms and conditions of the contractual obligations to be terminated, including the type and amount of payments and their anticipated timing. In determining the fair value of the liabilities associated with employee terminations, the Company considers termination notification date and associated legal notification requirements and minimum retention period as stipulated by the applicable laws and regulations, the type and amount of benefits employees will receive upon involuntary termination, as well as the timing of employees' departure.
CEO transition costs consist of CEO separation benefits and retention bonuses granted to key employees. The Company accounts for CEO transition costs in accordance with the authoritative guidance in ASC Topic 712, Compensation - Nonretirement Postemployment Benefits. This guidance requires that (i) a liability for benefits offered as special termination benefits to an employee is recognized when the employee accepts the offer and the amount can be reasonably estimated, (ii) a liability for other contractual termination benefits is recognized when it is probable that employees will be entitled to benefits and the amount can be reasonably estimated, and (iii) a liability for other postemployment benefits are recognized and accounted for in accordance with guidance in ASC Topic 710, Compensation - General.
Restructuring liabilities are included in "Accrued liabilities" and "Other long-term liabilities" in the accompanying consolidated balance sheets.
Earnings Per Share
The Company determines earnings per share in accordance with the authoritative guidance in ASC Topic 260, Earnings Per Share. The Company has one class of common stock for purposes of the earnings per share calculation and therefore computes basic earnings per share by dividing net income (loss) by the weighted average number of common shares outstanding for the applicable period. Diluted earnings per share are computed in the same manner as basic earnings per share, except that the number of shares is increased to assume exercise of potentially dilutive stock options using the treasury stock method, unless the effect of such increase would be anti-dilutive. Under the treasury stock method, the amount the employee must pay for exercising stock options and the amount of compensation cost for future service that the Company has not yet recognized are assumed to be used to repurchase shares.
Subsequent Events
The Company considers events or transactions that occur after the balance sheet date but before the financial statements are issued to provide additional evidence relative to certain estimates or to identify matters that require additional disclosure. The Company evaluated all events and transactions through the date that these financial statements were issued.
Recently Adopted Accounting Standards
Income Taxes. Effective January 1, 2017, the Company elected to early adopt Accounting Standard Update (“ASU”) No. 2016-16, Income Taxes - Intra-Entity Transfers of Assets Other Than Inventory. Under the updated accounting guidance the Company recognizes income tax consequences immediately when the transfer of an inter-entity asset other than inventory occurs across jurisdictions rather than deferring the tax effects of those transactions until a transfer is made to a third party. The Company adopted this standard using the modified retrospective approach and recorded a cumulative-effect adjustment as of January 1, 2017. As a result, the Company recorded (i) a reduction in prepaid income taxes of $11.7 million, (ii) a net increase in deferred income tax assets of $9.7 million, and (iii) a decrease in retained earnings of $2.0 million. Prior periods have not been adjusted.
Goodwill. In January 2017, the Financial Accounting Standards board (“FASB”) issued ASU No. 2017-04, Intangibles - Goodwill and Other (Topic 350): Simplifying the Test for Goodwill Impairment, which eliminates the second step of the previous FASB guidance for testing goodwill for impairment and is intended to reduce cost and complexity of goodwill impairment testing. The amendments in this ASU modify the concept of impairment from the condition that exists when the carrying amount of goodwill exceeds its implied
108
fair value to the condition that exists when the carrying amount of a reporting unit exceeds its fair value. After determining if the carrying amount of a reporting unit exceeds its fair value, the entity should take an impairment charge of the same amount to the goodwill for that reporting unit, not to exceed the total goodwill amount for that reporting unit. This eliminates the second step of calculating the implied fair value of goodwill by assigning the fair value of a reporting unit to all of its assets and liabilities as if that reporting unit had been acquired in a business combination. ASU 2017-04 is effective for annual periods beginning after December 15, 2019, including interim periods within those annual periods. Early adoption is permitted for interim or annual goodwill impairment tests performed on testing dates after January 1, 2017. The Company has elected to early adopt this standard effective January 1, 2017.
Recently Issued Accounting Standards Not Yet Adopted
Income Statement - Reporting Comprehensive Income. In February 2018, the FASB issued ASU No. 2018-02, Income Statement - Reporting Comprehensive Income (Topic 220): Reclassification of Certain Tax Effects from Accumulated Other Comprehensive Income, which allows for the reclassification from accumulated other comprehensive income to retained earnings for stranded tax effects resulting from the Tax Cuts and Jobs Act. The amendments in this update also require entities to disclose their accounting policy for releasing income tax effects from accumulated other comprehensive income. ASU No. 2018-02 is effective for the reporting periods beginning after December 15, 2018, including interim periods within those annual periods. Early adoption is permitted. The Company is currently assessing the potential impact of ASU No. 2018-02 on its consolidated financial statements.
Leases. In February 2016, the FASB issued ASU No. 2016-02, Leases. ASU 2016-02 requires organizations to recognize lease assets and lease liabilities on the balance sheet, including leases that were previously classified as operating leases. The ASU also requires additional disclosures about leasing arrangements related to the amount, timing, and uncertainty of cash flows arising from leases. The amendments in this ASU are effective for financial statements issued for fiscal years beginning after December 15, 2018, and interim periods within those fiscal years. Early adoption of the amendments is permitted and the new guidance will be applied using a modified retrospective approach. The Company plans to adopt this standard on January 1, 2019.
Revenue from Contracts with Customers. In May 2014, FASB issued ASU No. 2014-09, Revenue from Contracts with Customers. ASU 2014-09 eliminates transaction- and industry-specific revenue recognition guidance under current U.S. GAAP and replaces it with a single principles based model for determining revenue recognition. ASU 2014-09 requires that companies recognize revenue when a customer obtains control of promised goods or services. Revenue will be recognized in the amount that reflects the consideration that the entity expects to receive in exchange for those goods or services. The standard also requires disclosure about the nature, amount, timing and uncertainty of revenue and cash flows arising from contracts with customers, including significant judgments and changes in judgments, as well as assets recognized from costs incurred to obtain or fulfill a contract. The FASB issued several amendments to the standard, including clarifications on principal versus agent considerations, identifying performance obligations, disclosure of prior-period performance obligations and accounting for licenses of intellectual property.
For public entities, the standard is effective for reporting periods beginning after December 15, 2017. Earlier adoption is permitted only as of annual reporting periods beginning after December 15, 2016, including interim reporting periods within that reporting period. Entities can adopt the standard either retrospectively to each period presented (full retrospective approach), or retrospectively with the cumulative effect of initially applying the guidance recognized as of the date of adoption (modified retrospective or cumulative effect approach).
In preparation for adoption of the standard, the Company established a project management and implementation team consisting of internal resources and external advisors. The Company reached conclusions on certain key accounting assessments related to the standard and is finalizing its evaluation of the impact of adopting this new standard on its financial reporting and disclosures, accounting policies, business processes and internal controls. In particular, the Company has concluded that under the new standard, the majority of its contracts will contain a single performance obligation. The Company expects to account for the majority of revenue related to customer clinical trials in its Clinical Solutions segment under
109
single performance obligations over time using project costs as an input method to measure progress. The Company anticipates that under the new standard the majority of arrangements in its Commercial Solutions segment will consist of a single performance obligation as the pattern of services delivered are substantially the same over the contract period. Additionally, net service revenue and reimbursable costs represent a single performance obligation and separate presentation on the statement of operations is no longer permitted under the standard.
The Company anticipates that, as a result of adopting the new standard, revenue recognition may be delayed at certain phases of the customer contract life cycle, particularly during the first years of the contract as the inclusion of reimbursable costs in the measure of progress may result in a disproportionately lower percentage of costs incurred until those contracts mature. Such deferral of revenue recognition could differ materially from that applied under the current revenue recognition standard. While the Company expects its revenue to be deferred in the early stages of the contract, such impact may be partially mitigated on an aggregate basis because at any given time, the Company’s portfolio of contracts consists of contracts in varying stages of completion. On our consolidated balance sheet, long-term contracts will be reported in a net contract asset or contract liability position on a contract-by-contract basis at the end of each reporting period. The assessment of our consolidated balance sheet under the new standard will result in some reclassifications among financial statement accounts. The Company continues to gather and track new information to meet the expanded disclosure requirements, and is nearing completion of finalizing the financial impact of adopting this standard on the opening balance of retained earnings. The Company will adopt the new standard effective January 1, 2018 using the modified retrospective approach.
2. Financial Statement Details
Accounts Receivable Billed, net
Accounts receivable, net of allowance for doubtful accounts, consisted of the following (in thousands):
December 31, 2017 | December 31, 2016 | ||||||
Accounts receivable billed | $ | 652,061 | $ | 217,360 | |||
Allowance for doubtful accounts | (9,076 | ) | (5,884 | ) | |||
Accounts receivable billed, net | $ | 642,985 | $ | 211,476 | |||
The following table summarizes the changes in the allowance for doubtful accounts (in thousands):
Years Ended December 31, | |||||||||||
2017 | 2016 | 2015 | |||||||||
Balance at the beginning of the period | $ | (5,884 | ) | $ | (3,557 | ) | $ | (3,727 | ) | ||
Current year (provision) recovery | (4,167 | ) | (2,570 | ) | 144 | ||||||
Write-offs, net of recoveries and the effects of foreign currency exchange | 975 | 243 | 26 | ||||||||
Balance at the end of the period | $ | (9,076 | ) | $ | (5,884 | ) | $ | (3,557 | ) | ||
110
Property and Equipment, net
Property and equipment, net of accumulated depreciation, consisted of the following (in thousands):
December 31, 2017 | December 31, 2016 | ||||||
Software | $ | 65,102 | $ | 52,531 | |||
Vehicles | 38,938 | — | |||||
Computer equipment | 61,659 | 26,311 | |||||
Leasehold improvements | 58,975 | 14,814 | |||||
Office furniture, fixtures, and equipment | 19,317 | 10,894 | |||||
Buildings and land | 4,552 | 4,004 | |||||
Assets not yet placed in service | 29,215 | 13,396 | |||||
Property and equipment, gross | 277,758 | 121,950 | |||||
Less: accumulated depreciation | (97,346 | ) | (63,644 | ) | |||
Property and equipment, net | $ | 180,412 | $ | 58,306 | |||
As of December 31, 2017, the gross book value of vehicles under capital leases was $38.9 million and accumulated depreciation was $7.6 million. Amortization charges related to these assets, net of rebates, were $5.9 million for 2017 and are included in the “Depreciation” line item of the accompanying consolidated statements of operations.
Goodwill and Intangible Assets
Effective August 1, 2017, the Company realigned its segment financial reporting to reflect changes in the organizational structure following the Merger (see "Note 14 - Segment Information" for further information). The Company has reflected this change to its segment information retrospectively to the earliest period presented. The change resulted in the reclassification of gross goodwill and previously recognized accumulated goodwill impairment losses of $8.1 million from the former Phase I Services segment to the Clinical Solutions segment. In addition, gross goodwill and previously recognized accumulated goodwill impairment losses of $8.0 million related to the Global Consulting business unit, which previously had been included in the Clinical Solutions segment was reclassified into the Commercial Solutions segment as a result of the Merger.
111
The changes in carrying amount of goodwill were as follows (in thousands):
Total | Clinical Solutions | Commercial Solutions | |||||||||
Balance at December 31, 2015: | |||||||||||
Gross carrying amount | $ | 569,174 | $ | 561,150 | $ | 8,024 | |||||
Accumulated impairment losses | (16,166 | ) | (8,142 | ) | (8,024 | ) | |||||
Total goodwill and accumulated impairment losses | 553,008 | 553,008 | — | ||||||||
2016 Activity: | |||||||||||
Impact of foreign currency translation and other | (506 | ) | (506 | ) | — | ||||||
Balance at December 31, 2016: | |||||||||||
Gross carrying amount | 568,668 | 560,644 | 8,024 | ||||||||
Accumulated impairment losses (a) | (16,166 | ) | (8,142 | ) | (8,024 | ) | |||||
Goodwill net of accumulated impairment losses | 552,502 | 552,502 | — | ||||||||
2017 Activity: | |||||||||||
Business combinations (b) | 3,733,495 | 2,240,971 | 1,492,524 | ||||||||
Impact of foreign currency translation | 6,574 | 7,360 | (786 | ) | |||||||
Balance at December 31, 2017: | |||||||||||
Gross carrying amount | 4,308,737 | 2,808,975 | 1,499,762 | ||||||||
Accumulated impairment losses (a) | (16,166 | ) | (8,142 | ) | (8,024 | ) | |||||
Goodwill net of accumulated impairment losses | $ | 4,292,571 | $ | 2,800,833 | $ | 1,491,738 | |||||
(a) Accumulated impairment losses associated with the Clinical Solutions segment were recorded in fiscal periods prior to 2017 and related to the former Phase I Services segment, now a component of the Clinical Solutions segment. Accumulated impairment losses associated with the Commercial Solutions segment were recorded in fiscal periods prior to 2017 and related to the former Global Consulting segment, now a component of the Commercial Solutions segment. No impairment of goodwill was recorded for the year ended December 31, 2017.
(b) The 2017 activity represents goodwill recognized in connection with the Merger and is subject to further adjustments before the close of the measurement period. Goodwill associated with the Merger is not deductible for income tax purposes. See "Note 3 - Business Combinations" for further information.
As discussed in "Note 3 - Business Combinations," in conjunction with the Merger, the Company acquired certain intangible assets related to customer relationships, acquired backlog, and trademarks. Additionally, due to the Company’s intention to relaunch its operations under a new brand name in January 2018, the Company determined that the useful life of the intangible asset related to the INC Research trademark with a carrying value of $35.0 million was no longer indefinite as of August 1, 2017. The Company tested the asset for impairment as an indefinite-lived intangible asset and recorded a $30.0 million impairment charge during the three months ended September 30, 2017. The Company also determined that the remaining useful life of this asset did not extend beyond the anticipated date of the rebranding and, as of August 1, 2017, approximated five months. Therefore, the Company reclassified the remaining value of the INC Research trademark from an indefinite-lived intangible asset to a definite-lived intangible asset and began amortizing its remaining value on a straight-line basis over its remaining estimated useful life of five months.
112
Intangible assets, net consisted of the following (in thousands):
December 31, 2017 | December 31, 2016 | ||||||||||||||||||||||
Gross | Accumulated Amortization | Net | Gross | Accumulated Amortization | Net | ||||||||||||||||||
Intangible assets with finite lives: | |||||||||||||||||||||||
Customer relationships | $ | 1,440,178 | $ | (266,158 | ) | $ | 1,174,020 | $ | 267,703 | $ | (188,217 | ) | $ | 79,486 | |||||||||
Acquired backlog | 137,442 | (42,095 | ) | 95,347 | — | — | — | ||||||||||||||||
Trademarks | 32,428 | (15,745 | ) | 16,683 | — | — | — | ||||||||||||||||
Total finite-lived intangibles | 1,610,048 | (323,998 | ) | 1,286,050 | 267,703 | (188,217 | ) | 79,486 | |||||||||||||||
Trademarks — indefinite-lived | — | — | — | 35,000 | — | 35,000 | |||||||||||||||||
Intangible assets, net | $ | 1,610,048 | $ | (323,998 | ) | $ | 1,286,050 | $ | 302,703 | $ | (188,217 | ) | $ | 114,486 | |||||||||
The identifiable intangible assets are amortized over their estimated useful lives. The future estimated amortization expense for intangible assets is expected to be as follows (in thousands):
Fiscal Year Ending: | |||
2018 | $ | 199,586 | |
2019 | 160,664 | ||
2020 | 143,881 | ||
2021 | 126,597 | ||
2022 | 121,080 | ||
2023 and thereafter | 534,242 | ||
Total | $ | 1,286,050 | |
Accrued Liabilities and Other Long-Term Liabilities
Accrued liabilities consisted of the following (in thousands):
December 31, 2017 | December 31, 2016 | ||||||
Compensation, including bonuses, fringe benefits, and payroll taxes | $ | 215,657 | $ | 77,049 | |||
Accrued professional, investigator fees, and pass-through costs | 132,356 | 43,010 | |||||
Accrued rebates to customers | 27,930 | 13,580 | |||||
Contingent tax-sharing obligations assumed through business combinations, current portion | 22,345 | — | |||||
Accrued taxes | 16,810 | 1,072 | |||||
Accrued restructuring and other costs, current portion | 13,280 | 6,084 | |||||
Accrued interest | 9,399 | 72 | |||||
Facility-related obligations | 8,943 | 5,117 | |||||
Other liabilities | 53,583 | 7,575 | |||||
Total accrued liabilities | $ | 500,303 | $ | 153,559 | |||
Other long-term liabilities consisted of the following (in thousands):
December 31, 2017 | December 31, 2016 | ||||||
Uncertain tax positions | $ | 25,033 | $ | 14,813 | |||
Accrued restructuring and other costs, non-current portion | 3,513 | 2,508 | |||||
Contingent tax-sharing obligations assumed through business combinations, non-current portion | 28,135 | — | |||||
Deferred compensation, long-term | 15,900 | — | |||||
Other liabilities | 27,028 | 8,842 | |||||
Total other long-term liabilities | $ | 99,609 | $ | 26,163 | |||
113
Accumulated other comprehensive loss, net of taxes
Accumulated other comprehensive loss, net of taxes consisted of the following (in thousands):
December 31, 2017 | December 31, 2016 | ||||||
Foreign currency translation adjustments, net of tax | $ | (23,514 | ) | $ | (43,356 | ) | |
Unrealized gains on derivative instruments, net of tax | 1,129 | 1,106 | |||||
Accumulated other comprehensive loss, net of tax | $ | (22,385 | ) | $ | (42,250 | ) | |
Changes in accumulated other comprehensive loss, net of tax were as follows (in thousands):
Unrealized gain on derivative instruments, net of tax | Foreign currency translation adjustments, net of tax | Total | |||||||||
Balance at December 31, 2015 | $ | — | $ | (41,543 | ) | $ | (41,543 | ) | |||
Other comprehensive gain before reclassifications | 901 | (1,813 | ) | (912 | ) | ||||||
Amount of gain reclassified from accumulated other comprehensive loss into statement of operations | 205 | — | 205 | ||||||||
Net current period other comprehensive gain (loss), net of tax | 1,106 | (1,813 | ) | (707 | ) | ||||||
Balance at December 31, 2016 | 1,106 | (43,356 | ) | (42,250 | ) | ||||||
Other comprehensive gain before reclassifications | 443 | 19,842 | $ | 20,285 | |||||||
Amount of gain reclassified from accumulated other comprehensive loss into statement of operations | (420 | ) | — | $ | (420 | ) | |||||
Net current period other comprehensive gain, net of tax | 23 | 19,842 | $ | 19,865 | |||||||
Balance at December 31, 2017 | $ | 1,129 | $ | (23,514 | ) | $ | (22,385 | ) | |||
Amounts reported in accumulated other comprehensive loss related to derivatives will be reclassified to interest expense as interest payments are made on the Company’s term loan. Amounts to be reclassified as an increase to interest expense in the next 12 months are expected to be immaterial.
The tax effects allocated to each component of other comprehensive loss for the year ended December 31, 2017 were as follows (in thousands):
Before-Tax Amount | Tax (Expense) or Benefit | Net-of-Tax Amount | |||||||||
Foreign currency translation adjustments | $ | 28,847 | $ | (9,005 | ) | $ | 19,842 | ||||
Unrealized gain on derivative instruments: | |||||||||||
Unrealized gains arising during period | 694 | (251 | ) | 443 | |||||||
Reclassification adjustment for gains realized in net income | (681 | ) | 261 | (420 | ) | ||||||
Net unrealized gain | 13 | 10 | 23 | ||||||||
Other comprehensive income | $ | 28,860 | $ | (8,995 | ) | $ | 19,865 | ||||
114
The tax effects allocated to each component of other comprehensive income for the year ended December 31, 2016 were as follows (in thousands):
Before-Tax Amount | Tax (Expense) or Benefit | Net-of-Tax Amount | |||||||||
Foreign currency translation adjustments | $ | (1,813 | ) | $ | — | $ | (1,813 | ) | |||
Unrealized gain on derivative instruments: | |||||||||||
Unrealized gains arising during period | 1,477 | (576 | ) | 901 | |||||||
Reclassification adjustment for gains realized in net income | 336 | (131 | ) | 205 | |||||||
Net unrealized gain | 1,813 | (707 | ) | $ | 1,106 | ||||||
Other comprehensive income | $ | — | $ | (707 | ) | $ | (707 | ) | |||
Other (Expense) Income, Net
Other (expense) income, net consisted of the following (in thousands):
Years Ended December 31, | |||||||||||
2017 | 2016 | 2015 | |||||||||
Net realized foreign currency (loss) gain | $ | (10,833 | ) | $ | 12,357 | $ | 2,237 | ||||
Net unrealized foreign currency (loss) gain | (7,912 | ) | (20,681 | ) | 795 | ||||||
Other, net | (1,101 | ) | (678 | ) | 825 | ||||||
Total other expense, net | $ | (19,846 | ) | $ | (9,002 | ) | $ | 3,857 | |||
3. Business Combinations
Transaction Overview
On August 1, 2017 (the “Merger Date”), the Company completed the Merger with inVentiv with the Company surviving as the accounting and legal entity acquirer. The Merger was accounted for as a business combination using the acquisition method of accounting in accordance with ASC Topic 805, Business Combinations. The purchase price has been preliminarily allocated to the tangible assets and identifiable intangible assets acquired and liabilities assumed based upon their fair values. The excess of the purchase price over the tangible and intangible assets acquired and liabilities assumed has been recorded as goodwill. The goodwill in connection with the Merger is primarily attributable to the assembled workforce of inVentiv and the expected synergies of the Merger.
At the Merger Date, the shares of inVentiv’s outstanding common stock were converted into 49,297,022 shares of the Company’s common stock at an exchange ratio of 3.4928. In addition, inVentiv equity awards held by current employees and certain members of the former inVentiv board of directors were converted into Company equity awards using the exchange ratio. The value of the Merger consideration was approximately $4.51 billion, as discussed below.
Concurrent with the completion of the Merger, on August 1, 2017, the Company entered into a Credit Agreement (the “2017 Credit Agreement”) for: (i) a $1.0 billion Term Loan A facility that matures on August 1, 2022 (“Term Loan A”); (ii) a $1.6 billion Term Loan B facility that matures on August 1, 2024 (“Term Loan B”); and (iii) a five-year $500.0 million revolving credit facility (the “Revolver”). The Company used available cash and borrowings under the 2017 Credit Agreement to (among other things): (i) repay and extinguish approximately $445.0 million of outstanding loans and obligations under the Company’s existing long-term credit facility; (ii) repay approximately $1.74 billion of outstanding obligations under inVentiv’s long-term borrowings and associated accrued interest, which was treated as Merger consideration; (iii) pay approximately $290.3 million to partially redeem the principal balance of the 7.5% Senior Unsecured Notes due 2024 (“Senior Notes”) assumed in the Merger, which included an early redemption penalty of $20.3 million; and (iv) pay certain fees and other transaction expenses related to the Merger. For additional information related to the 2017 Credit Agreement, see "Note 4 - Long-Term Debt Obligations."
115
For the year ended December 31, 2017, the Company incurred $123.8 million of Merger-related expenses which were accounted for separately from the business combination and expensed as incurred within the “Transaction and integration related expenses” line item of the audited consolidated statements of operations. These costs consisted primarily of investment banker fees, advisory fees, legal costs, accounting and consulting fees, share-based compensation expense, and employee retention bonuses. The Company also incurred approximately $5.8 million of bridge financing fees which are included in the “Interest expense” line item in the audited consolidated statements of operations for the year ended December 31, 2017. The Company deferred $25.5 million of financing costs incurred as a result of the 2017 Credit Agreement. These costs will be amortized over the term of the related debt.
In connection with the Merger, the Company assumed certain contingent tax-sharing obligations of inVentiv. The fair value of the assumed contingent tax-sharing obligation payable to the former shareholders of inVentiv was estimated to be $62.8 million at the Merger Date. The assumed contingent tax-sharing obligation is based on the future realization of certain transaction tax deductions that created net operating losses acquired or generated by the Company in the Merger (the “Acquired NOLs”) which arose in connection with inVentiv’s 2016 acquisition by Double Eagle Parent, Inc. As such transaction tax deductions are realized as a result of reducing federal or state income taxes payable, the Company is obligated to make payments to the former stockholders of inVentiv. The amount of Acquired NOLs are estimated to be approximately $187.8 million ($71.5 million of estimated net tax benefits). However, in no event are the Acquired NOLs permitted to exceed $220.0 million, and the associated net tax benefits will be paid to the former shareholders of inVentiv if and when such deductions reduce income taxes payable.
The tax sharing agreement was contingent consideration of inVentiv that was acquired in the Merger. The fair value of the contingent tax-sharing liability is remeasured at the end of each reporting period, with changes in the estimated fair value reflected in earnings until the liability is fully settled. During 2017, the Company recorded adjustments reducing the fair value of the contingent tax-sharing obligations by $12.3 million, driven primarily by the effect of enactment of the Tax Act which reduced the corporate income tax rate from 35% to 21% effective January 1, 2018. These adjustments have been included in the "Transaction and integration-related expense" line item in the accompanying consolidated statement of operations for the year ended December 31, 2017. As of December 31, 2017, the estimated fair value of the contingent tax-sharing obligations liability was $50.5 million, which is included in the “Accrued liabilities” and “Other long-term liabilities” line items of the accompanying audited consolidated balance sheet.
The results of inVentiv’s operations are included in the Company’s consolidated statements of operations beginning on the Merger Date. For the year ended December 31, 2017, net service revenue attributable to inVentiv was $839.0 million and reimbursable out-of-pocket revenue was $260.0 million. Following the closing of the Merger, the Company began integrating inVentiv’s operations. As a result, computing a separate measure of inVentiv’s stand-alone profitability for the period after the Merger Date is impracticable.
Fair Value of Consideration Transferred
The preliminary Merger Date fair value of the consideration transferred consisted of the following (in thousands, except for share and per share amounts):
Fair value of common stock issued to acquiree stockholders (a) | $ | 2,753,239 | |
Fair value of replacement share-based awards issued to acquiree employees (b) | 16,232 | ||
Repayment of term loan obligations and accrued interest (c) | 1,736,152 | ||
Total consideration transferred | $ | 4,505,623 | |
(a) Represents the fair value of 49,297,022 shares of the Company’s common stock at $55.85 per share, the closing price per share on the Merger closing date of August 1, 2017.
(b) Represents the fair value of replacement share-based awards attributable to pre-combination services. For further information about the valuation of share-based awards, see "Note 10 - Share-Based Compensation."
(c) Represents repayment of inVentiv’s term loan obligations and related accrued interest as part of the Merger consideration on the Merger Date. For further information, see "Note 4 - Long-Term Debt Obligations."
116
Allocation of Consideration Transferred
The following table summarizes the preliminary allocation of the consideration transferred based on management’s estimates of Merger Date fair values of assets acquired and liabilities assumed, with the excess of the purchase price over the estimated fair values of the identifiable net assets acquired recorded as goodwill (in thousands):
Assets acquired: | |||
Cash and cash equivalents | $ | 57,338 | |
Restricted cash | 433 | ||
Accounts receivable | 363,137 | ||
Unbilled accounts receivable | 261,585 | ||
Other current assets | 95,506 | ||
Property and equipment | 113,674 | ||
Intangible assets | 1,334,200 | ||
Other assets | 50,052 | ||
Total assets acquired | 2,275,925 | ||
Liabilities assumed: | |||
Accounts payable | 38,871 | ||
Accrued liabilities | 306,649 | ||
Deferred revenue | 247,474 | ||
Capital leases | 40,928 | ||
Long-term debt, current and non-current | 737,872 | ||
Deferred income taxes, net | 11,382 | ||
Other liabilities | 120,621 | ||
Total liabilities assumed | 1,503,797 | ||
Total identifiable assets acquired, net | 772,128 | ||
Goodwill | $ | 3,733,495 | |
The goodwill recognized in connection with the Merger was $3.73 billion, of which $2.24 billion was assigned to the Clinical Solutions segment and $1.49 billion to the Commercial Solutions segment. Goodwill generated in the Merger is not deductible for income tax purposes. The Company’s assessment of fair value and purchase price allocation are preliminary and subject to change as discussed below. During the fourth quarter of 2017, the Company made certain adjustments to the preliminary fair value of acquired assets and assumed liabilities to reflect additional information obtained in connection with the Merger. The net effect of the adjustments was an increase in goodwill by $25.1 million. Further adjustments may be necessary as additional information related to the fair values of assets acquired and liabilities assumed is assessed during the measurement period (up to one year from the Merger Date).
The following table summarizes the preliminary estimates of the fair value of identified intangible assets and their respective useful lives as of the Merger Date (in thousands, except for estimated useful lives):
Estimated Fair Value | Estimated Useful Life | ||||||
Customer relationships | $ | 1,169,700 | 6 years | - | 11 years | ||
Backlog | 137,100 | 5 months | - | 2 years | |||
Trademarks subject to amortization | 27,400 | 5 months | - | 6 years | |||
Total intangible assets | $ | 1,334,200 | |||||
117
Unaudited Pro Forma Financial Information
The following unaudited pro forma financial information was derived from the historical financial statements of the Company and inVentiv, and presents the combined results of operations as if the Merger had occurred on January 1, 2016. The pro forma financial information is presented for comparative purposes only and is not necessarily indicative of the results that would have actually occurred had the Merger been completed on January 1, 2016. In addition, the unaudited pro forma financial information does not give effect to any anticipated cost savings, operating efficiencies or other synergies that may result from the Merger, or any estimated costs that have been or will be incurred by the Company to integrate the assets and operations of inVentiv. Consequently, actual future results of the Company will differ from the unaudited pro forma financial information presented below (in thousands, except per share data).
December 31, 2017 | December 31, 2016 | ||||||
Pro forma total revenue | $ | 4,221,936 | $ | 4,354,038 | |||
Pro forma net loss | (58,545 | ) | (208,013 | ) | |||
Pro forma loss per share: | |||||||
Basic | $ | (0.64 | ) | $ | (2.01 | ) | |
Diluted | $ | (0.64 | ) | $ | (2.01 | ) | |
The unaudited pro forma adjustments primarily relate to the depreciation of acquired property and equipment, amortization of acquired intangible assets and interest expense and amortization of deferred financing costs related to the new financing arrangements. In addition, the unaudited pro forma net loss for the year ended December 31, 2017 was adjusted to exclude certain merger-related nonrecurring adjustments; these adjustments were included in the year ended December 31, 2016 giving effect to the Merger as if it had occurred on January 1, 2016. The nonrecurring merger-related adjustments include transaction costs, retention and severance payments, share-based compensation expense related to the acceleration of share-based compensation awards and replacement share-based awards, and financing fees. These nonrecurring adjustments to net loss in the aggregate, net of tax effects (where applicable), were $111.8 million and $(111.8) million for the years ended December 31, 2017 and 2016, respectively.
4. Long-Term Debt Obligations
The Company’s debt obligations consisted of the following (in thousands):
December 31, 2017 | December 31, 2016 | ||||||
Secured Debt | |||||||
Term Loan A due August 2021 | $ | — | $ | 475,000 | |||
Revolving credit facility due August 2021 | — | 25,000 | |||||
Term Loan A due August 2022 | 1,000,000 | — | |||||
Term Loan B due August 2024 | 1,550,000 | — | |||||
Revolving credit facility due August 2022 | — | — | |||||
Total secured debt | 2,550,000 | 500,000 | |||||
Unsecured Debt | |||||||
7.5% Senior Unsecured Notes due 2024 | 403,000 | — | |||||
Total debt obligations | 2,953,000 | 500,000 | |||||
Add: unamortized Senior Notes premium, net of original issue debt discount | 38,656 | — | |||||
Less: unamortized deferred issuance costs | (20,722 | ) | (2,276 | ) | |||
Less: current portion of debt | (25,000 | ) | (11,875 | ) | |||
Total debt obligations, non-current portion | $ | 2,945,934 | $ | 485,849 | |||
118
2017 Credit Agreement
Concurrent with the completion of the Merger on August 1, 2017, the Company entered into the 2017 Credit Agreement for: (i) a $1.0 billion Term Loan A facility that matures on August 1, 2022; (ii) a $1.6 billion Term Loan B facility that matures on August 1, 2024; and (iii) a five-year $500.0 million revolving credit facility (the “Revolver”) that matures on August 1, 2022. The Company used available cash and the borrowings under the 2017 Credit Agreement to (among other things); (i) repay and extinguish approximately $445.0 million of outstanding loans and obligations under the Company’s previously existing long-term credit facility; (ii) repay approximately $1.74 billion of outstanding obligations under inVentiv’s long-term credit facility; (iii) pay approximately $290.3 million to partially redeem the principal of the Senior Notes assumed in the Merger, which included an early redemption penalty of $20.3 million; and (iv) pay fees, premiums, and other transaction expenses related to the Merger.
All obligations under the 2017 Credit Agreement are guaranteed by the Company and certain of the Company's direct and indirect wholly-owned domestic subsidiaries. The obligations under the 2017 Credit Agreement are secured by substantially all of the assets of the Company and the guarantors, including 65% of the capital stock of certain controlled foreign subsidiaries.
Beginning on January 31, 2018 through July 31, 2022, the Term Loan A has scheduled quarterly principal payments of the initial principal borrowed of 0.625%, or $6.25 million per quarter in year 1; 1.25%, or $12.5 million per quarter in year 2; 1.875%, or $18.75 million per quarter in year 3; and 2.50%, or $25.0 million per quarter thereafter; with the remaining outstanding principal due on August 1, 2022.
Under the 2017 Credit Agreement, the Company is required to make quarterly principal payments of the initial principal borrowed under the Term Loan B of 0.25%, or $4.0 million per quarter; with the remaining outstanding principal due on August 1, 2024. During 2017, the Company made voluntary prepayments of $50.0 million on the Term Loan B, which was applied against the regularly-scheduled quarterly principal payments. As a result of the prepayments, the Company is not required to make a mandatory principal payment against the Term Loan B until January 31, 2021.
The term loans and the Revolver bear interest at a rate per annum equal to the adjusted Eurocurrency Rate (“Eurocurrency Rate”) plus an applicable rate or an alternate base rate (“Base Rate”) plus an applicable rate. The Company may select among the Eurocurrency Rate or the Base Rate, whichever is lower, except in circumstances where the Company request a loan with less than a three-day notice. In such cases, the Company must use the Base Rate. The Eurocurrency Rate is equal to LIBOR, subject to adjustment for reserve requirements. The Base Rate is equal to the highest of: (i) the federal funds rate plus 0.50%; (ii) the Eurocurrency Rate for an interest period of one month plus 1.00%; (iii) the rate of interest per annum publicly announced from time to time by Credit Suisse as its prime rate; and (iv) 0.00%.
Eurocurrency Rate term loans are one-, two-, three-, or six-month loans (or, with permission, twelve-month loans) and interest is due on the last day of each three-month period of the loans. Base Rate term loans have interest due the last day of each three-month period beginning in January 2018. In advance of the last day of the then-current type of loan, the Company may select a new type of loan, so long as it does not extend beyond the term loan’s maturity date. Additionally, the 2017 Credit Agreement permits the Borrower to increase its term loan or Revolver commitments under the term loan facilities and/or revolving credit facility and/or to request the establishment of one or more new term loan facilities and/or revolving facilities in an aggregate amount to be no less than $725.0 million, if certain net leverage requirements are met. The availability of such additional capacity is subject to, among other things, receipt of commitments from existing lenders or other financial institutions.
119
The applicable margins with respect to Base Rate and Eurocurrency Rate borrowings are determined depending on the “First Lien Leverage Ratio” or the "Secured Net Leverage Ratio" (as defined in the 2017 Credit Agreement) and range as follows:
Base Rate | Eurocurrency Rate | ||||||||
Term Loan A | 0.50 | % | - | 0.75% | 1.50 | % | - | 1.75% | |
Term Loan B | 1.00 | % | - | 1.25% | 2.00 | % | - | 2.25% | |
Revolver | 0.25 | % | - | 0.75% | 1.25 | % | - | 1.75% | |
The Company also pays a quarterly commitment fee between 0.25% and 0.375% on the average daily unused balance of the Revolver depending on the “First Lien Leverage Ratio” at the adjustment date. As of December 31, 2017, the interest rate on the Term Loan A and the Revolver was 3.319% and the interest rate on the Term Loan B was 3.819%.
Letters of Credit
The Revolver includes letters of credit ("LOCs") with a sublimit of $150.0 million. Fees are charged on all outstanding LOCs at an annual rate equal to the margin in effect on Eurocurrency Rate revolving loans plus fronting fees. The fee is payable quarterly in arrears on the last day of the calendar quarter after the issuance date until the underlying LOC expires. As of December 31, 2017, there were no outstanding Revolver borrowings and $18.6 million of LOCs outstanding, leaving $481.4 million in available borrowings under the Revolver. In addition, as of December 31, 2017, the Company had $1.2 million of LOCs that were not secured by the Revolver.
Additionally, the lease for the new corporate headquarters in Morrisville, North Carolina includes a provision which requires the Company to issue a letter of credit ("LOC") in certain amounts to the landlord based on the debt rating of the Company issued by Moody’s Investors Service (or other nationally-recognized debt rating agency). From June 14, 2017 through June 14, 2020, if the debt rating of the Company is Ba3 or better, no LOC is required, or if the debt rating of the Company is B1 or lower, a LOC equal to 25% of the remaining minimum annual rent and estimated operating expenses (approximately $24.2 million as of December 31, 2017) is required to be issued to the landlord. This LOC would remain in effect until the Company’s debt rating was increased to Ba3 and maintained for a twelve-month period. After June 14, 2020, if the debt rating of the Company is Ba2 or better, no LOC is required; if the debt rating is Ba3, a LOC equal to 25% of the then remaining minimum annual rent and estimated operating expenses is required to be issued to the landlord; or if the debt rating of the Company is B1 or lower, a LOC equal to 100% of the then remaining minimum annual rent and estimated operating expenses is required to be issued to the landlord. These LOCs would remain in effect until the Company’s debt rating is Ba2 or better and maintained for a twelve-month period.
As of December 31, 2017 (and through the date of this filing), the Company’s debt rating was Ba3. As such, no LOC is currently required. Any LOCs issued in accordance with the aforementioned requirements would be issued under the Company’s Revolver, and would reduce its available borrowing capacity by the same amount accordingly.
Debt Covenants
The 2017 Credit Agreement contains usual and customary restrictive covenants that, among other things, place limitations on the Company's ability to pay dividends or make other restricted payments; prepay, redeem or purchase debt; incur liens; make loans and investments; incur additional indebtedness; amend or otherwise alter debt and other material arrangements; make acquisitions and dispose of assets; transact with affiliates; and engage in transactions that are not related to the Company's existing business. Each of the restrictive covenants is subject to important exceptions and qualifications that would allow the Company to engage in these activities under certain conditions, including the Company’s ability to: (i) pay dividends each year in an amount up to the greater of (a) 6% of the net cash proceeds received by the Company from any public offering and (b) 5% of the Company’s market capitalization; and (ii) pay unlimited dividends if the Company’s Secured Leverage Ratio is no greater than 3.0 to 1.0. As of December 31, 2017, the Company was in compliance with all applicable debt covenants.
120
In addition, with respect to the Term Loan A and Revolver, the 2017 Credit Agreement requires the Company to maintain a maximum First Lien Leverage Ratio of no more than 5.0 to 1.0 as of the last day of each fiscal quarter ending on or before December 31, 2018 (beginning with the first full fiscal quarter ending after the closing date of the 2017 Credit Agreement), and 4.5 to 1.0 from and after March 31, 2019.
7.5% Senior Unsecured Notes due 2024
As a result of the August 2017 Merger, the Company assumed $675.0 million of principal balance of Senior Unsecured Notes. Upon closing of the Merger, the Company immediately redeemed $270.0 million of the principal balance of Senior Notes and paid $20.3 million of the applicable early redemption penalty.
Interest on the remaining Senior Notes is payable semi-annually on the first day of April and October of each year and are guaranteed by the Company and certain of the Company's direct and indirect wholly-owned domestic subsidiaries. The Senior Notes are unsecured obligations and will (i) rank equal in right of payment to all of the Company’s existing and future senior unsecured obligations, (ii) be effectively subordinated to the Company’s secured indebtedness, including the 2017 Credit Agreement, to the extent of the value of the assets securing such indebtedness, (iii) rank senior in right of payment to any of the Company’s future indebtedness that is expressly subordinated in right of payment to the Senior Notes and the guarantees and (iv) be structurally subordinated to any existing and future obligations of any subsidiaries of the Company that do not guarantee the Senior Notes.
On or after October 1, 2019, the Company may redeem the Senior Notes in whole or in part, at a redemption price equal to the percentage of principal amount set forth below, plus accrued and unpaid interest during the twelve-month period beginning on the first of October of each of the years indicated below:
Year | Percentage |
2019 | 103.750% |
2020 | 101.875% |
2021 and thereafter | 100.000% |
In December 2017, the Company acquired $2.0 million of principal amount of the Senior Notes through an open market purchase for a cash payment of $2.2 million and immediately retired the principal amount.
Maturities of Debt Obligations
As of December 31, 2017, the contractual maturities of the Company’s debt obligations (excluding capital leases which are presented in "Note 5 - Leases") were as follows (in thousands):
2018 | $ | 25,000 | |
2019 | 50,000 | ||
2020 | 75,000 | ||
2021 | 114,000 | ||
2022 | 766,000 | ||
2023 and thereafter | 1,923,000 | ||
Less: deferred issuance costs | (20,722 | ) | |
Senior Notes premium, net of original issue debt discount | 38,656 | ||
Total long-term debt | 2,970,934 | ||
Less: current portion of debt | (25,000 | ) | |
Total debt obligations, non-current portion | $ | 2,945,934 | |
121
Debt Extinguishment Costs and Senior Notes Redemption Penalty
On the Merger Date, the Company paid a contractual early redemption penalty of $20.3 million to redeem 40% of the Senior Notes that were assumed in the Merger. In accordance with ASC Topic 805, Business Combinations, the carrying value of the Senior Notes assumed in the Merger was adjusted to estimated fair value, which resulted in an increase of the amount of the Company’s consolidated debt and recognition of a premium on the Senior Notes, of which $20.3 million was allocated to the redeemed portion of the Senior Notes. This portion of the premium offset the early redemption penalty, resulting in no gain or loss on the extinguishment of the Senior Notes. The remaining balance of the premium associated with the fair value adjustment is being amortized as a component of interest expense using the effective interest rate method over the term of the remaining Senior Notes.
In August 2016, the Company entered into the First Amendment to 2017 Credit Agreement and Increase Revolving Joinder, which amended the 2015 Credit Agreement (as amended, the "2016 Credit Agreement"). The five-year $675.0 million 2016 Credit Agreement was comprised of a $475.0 million term loan and a $200.0 million revolving line of credit. In conjunction with this amendment, the Company recognized a loss on extinguishment of debt of $0.4 million. As of December 31, 2016, $475.0 million was outstanding on the term loan, bearing interest at 2.11%, and $25.0 million was outstanding on the revolving line of credit, bearing interest at 2.11%.
In May 2015, the Company entered into the 2015 Credit Agreement and used the proceeds to repay all of its outstanding obligations under the 2014 Credit Agreement and to pay transaction costs associated with the 2017 Credit Agreement. As a result, the Company recognized a $9.4 million loss on extinguishment of debt related to the 2014 Credit Agreement, which was comprised of $5.1 million of unamortized discount and $4.3 million of unamortized debt issuance costs. In addition, in June 2015 the Company made a prepayment of $50.0 million under the 2015 Credit Agreement and as a result recognized an additional loss on extinguishment of debt of $0.4 million. As of December 31, 2015, $475.0 million was outstanding on the Term Loan, bearing interest at 2.16%, and $30.0 million was outstanding on the revolving line of credit, bearing interest at 4.25%.
Debt Issuance Costs and Debt Discount
The Company recorded debt issuance costs related to its term loans of approximately $20.7 million and $2.3 million as of December 31, 2017 and 2016, respectively. These costs were recorded as a reduction of the principal balance of the associated debt and are being amortized as a component of interest expense using the effective interest method over the term of the term loans.
The Company recorded total debt issuance costs related to its revolving lines of credit of approximately $5.2 million and $1.0 million as of December 31, 2017 and 2016, respectively. Debt issuance costs associated with the revolving line of credit are included in other assets in the consolidated balance sheets. The debt issuance costs are amortized as a component of interest expense using the effective interest method over the term of the Revolver.
Borrowings under the 2017 Credit Agreement were issued net of a discount. As of December 31, 2017, the balance associated with this discount was $1.9 million, which is being accreted as a component of interest expense using the effective interest rate method over the term of the 2017 Credit Agreement.
122
5. Leases
Operating Leases
The Company leases its office facilities, office equipment, and other assets under non-cancellable operating lease agreements. Operating leases are expensed on a straight-line basis over the term of the lease and may include certain renewal options and escalation clauses.
The Company has a lease agreement for its corporate headquarters in Raleigh, North Carolina, that extends through February of 2019. In January 2017, the Company entered into a 12-year lease for a new corporate headquarters building in Morrisville, North Carolina, where it intends to relocate all employees from its two existing locations in Raleigh, North Carolina. In June 2017, this lease was amended to add office space and to extend the term of the lease to 13 years. The Company expects the construction of the new building to be completed in late-2018 and anticipates completing its relocation efforts prior to the current leases expiring in early 2019.
In February 2017, the Company entered into an 11-year lease agreement for new office space in Farnborough, United Kingdom, which is near its existing Camberley site. In January 2018, the Company replaced its lease agreement for the Farnborough location with a new 10-year lease agreement. The new agreement provides for additional office space to accommodate the Company's operating plans following the Merger. Rent payments associated with the new lease agreements are scheduled to commence in May 2019. The new lease agreement increases the Company's future lease obligations for this location by approximately $11.8 million. This amount has not been included in the future minimum lease payments table presented in "Future Minimum Lease Payments" section below. The Company anticipates completing its relocation efforts to the Farnborough location prior to its Camberley lease expiring in 2018.
Rent expense under the operating lease agreements was $40.9 million, $20.7 million, and $18.3 million for the years ended December 31, 2017, 2016, and 2015, respectively.
In connection with the Merger, the Company has established a restructuring plan to consolidate its facilities worldwide. For additional information related to the restructuring activities associated with the Merger, see "Note 8 - Restructuring and Other Costs."
Capital Leases
The Company leases vehicles for certain sales representatives in its Commercial Solutions segment. These lease arrangements are classified and accounted for as capital leases. Certain vendors have the right to declare the Company in default of its agreements if any such vendor, including the lessors under its vehicle leases, determines that a change in the Company’s financial condition poses a substantially increased credit risk.
As of December 31, 2017, the Company had total capital lease obligations related to vehicles under capital leases of $36.8 million. The Company had no lease arrangements classified as capital leases and thus no capital lease obligations as of December 31, 2016.
123
Future Minimum Lease Payments
As of December 31, 2017, future minimum rental payments under the Company’s non-cancellable operating leases with terms in excess of one year, and maturities of the future minimum lease payments under capital lease obligations are summarized as follows (in thousands):
Fiscal Year | Operating Leases | Capital Leases | |||||
2018 | $ | 60,671 | $ | 17,526 | |||
2019 | 52,485 | 13,293 | |||||
2020 | 44,871 | 6,042 | |||||
2021 | 39,710 | 1,900 | |||||
2022 | 32,463 | — | |||||
2023 and thereafter | 112,112 | — | |||||
Total future minimum lease payments (a) (b) | $ | 342,312 | 38,761 | ||||
Less: amounts representing interest and fees (b) | (1,971 | ) | |||||
Present value of capital lease obligations (c) | 36,790 | ||||||
Less: current portion | (16,414 | ) | |||||
Capital lease obligations, non-current portion | $ | 20,376 | |||||
(a) Amounts related to leases that are included within our restructuring accrual as of December 31, 2017 have not been included in the table above. For additional information related to the facility restructuring activities, see "Note 8 - Restructuring and Other Costs."
(b) Future capital lease commitments include interest and management fees, which are not recorded on the consolidated balance sheet as of December 31, 2017 and will be expensed as incurred.
(c) Capital lease obligations have a weighted average imputed interest rate of approximately 3.4% and mature in various installments through December, 2022.
6. Derivatives
In May 2016, the Company entered into interest rate swaps with a combined notional value of $300.0 million in an effort to limit its exposure to variable interest rates on its Term Loan. Interest began accruing on the swaps on June 30, 2016 and the interest rate swaps will expire on June 30, 2018 and May 14, 2020. The material terms of these derivatives are substantially the same as those contained within the 2017 Credit Agreement, including monthly settlements with the swap counterparty.
The fair values of the Company’s interest rate swaps designated as hedging instruments and the line items on the accompanying consolidated balance sheets to which they were recorded are as follows (in thousands):
Balance Sheet Classification | December 31, 2017 | December 31, 2016 | |||||||
Interest rate swaps - current | Prepaid expenses and other current assets | $ | 916 | $ | 461 | ||||
Interest rate swaps - non-current | Other long-term assets | $ | 1,263 | $ | 1,717 | ||||
The amounts of hedge ineffectiveness recorded in net income during the years ended December 31, 2017 and December 31, 2016 were immaterial and were attributable to the inconsistencies in certain terms between the interest rate swaps and the 2017 Credit Agreement.
124
7. Fair Value Measurements
Assets and Liabilities Carried at Fair Value
As of December 31, 2017 and 2016, the Company’s financial assets and liabilities carried at fair value included cash and cash equivalents, restricted cash, trading securities, billed and unbilled accounts receivable, accounts payable, accrued liabilities, and interest rate derivative instruments. As of December 31, 2017, the assumed contingent tax-sharing obligations and capital leases were also included in the Company’s financial assets and liabilities carried at fair value.
The fair value of cash and cash equivalents, restricted cash, billed and unbilled accounts receivable, accounts payable, and accrued liabilities approximates their respective carrying amounts because of the liquidity and short-term nature of these financial instruments.
Financial Instruments Subject to Recurring Fair Value Measurements
As of December 31, 2017, the fair values of the major classes of the Company’s assets and liabilities measured at fair value on a recurring basis were as follows (in thousands):
Level 1 | Level 2 | Level 3 | Total | ||||||||||||
Assets: | |||||||||||||||
Trading securities (a) | $ | 16,318 | $ | — | $ | — | $ | 16,318 | |||||||
Derivative instruments (b) | — | 2,179 | — | 2,179 | |||||||||||
Total assets | $ | 16,318 | $ | 2,179 | $ | — | $ | 18,497 | |||||||
Liabilities: | |||||||||||||||
Contingent tax-sharing obligation assumed through business combinations (c) | $ | — | $ | — | $ | 50,480 | $ | 50,480 | |||||||
Total liabilities | $ | — | $ | — | $ | 50,480 | $ | 50,480 | |||||||
(a) Represents fair value of investments in mutual funds based on quoted market prices which are used to offset the liability associated with the deferred compensation plan (see "Note 13 - Employee Benefit Plans" for further information).
(b) Represents fair value of interest rate swap arrangements.
(c) Represents fair value of contingent tax-sharing obligations assumed as a result of the Merger (see "Note 3 - Business Combinations" for further information). The fair value of this liability is determined based on the Company’s
best estimate of the probable timing and amount of settlement.
As of December 31, 2016, the fair value of the interest rate swaps was as follows (in thousands):
Level 1 | Level 2 | Level 3 | Total | ||||||||||||
Assets: | |||||||||||||||
Derivative instruments | $ | — | $ | 2,178 | $ | — | $ | 2,178 | |||||||
125
The following table presents a reconciliation of changes in the carrying amount of contingent tax-sharing obligations classified as Level 3 category of fair value measurements for the year ended December 31, 2017 (in thousands):
Balance at December 31, 2016 | $ | — | |
Additions (a) | 62,756 | ||
Changes in fair value recognized in earnings (b) | (12,276 | ) | |
Payments | — | ||
Balance at December 31, 2017 | $ | 50,480 | |
(a) Represents the fair value of the contingent tax-sharing obligations in connection with the Merger described in "Note 3 - Business Combinations."
(b) The change in fair value of the contingent tax-sharing arrangement is primarily due to the Tax Act and the resulting US corporate tax rate change from 35% to 21%.
During the years ended December 31, 2017 and 2016, there were no transfers of assets or liabilities between Level 1, Level 2 or Level 3 fair value measurements.
Financial Instruments Subject to Non-Recurring Fair Value Measurements
Certain assets, including goodwill and identifiable intangible assets, are carried on the accompanying audited consolidated balance sheets at cost and are not remeasured to fair value on a recurring basis. These assets are classified as Level 3 fair value measurements within the fair value hierarchy. Goodwill and indefinite-lived intangible assets are tested for impairment annually or more frequently if events or changes in circumstances indicate a triggering event has occurred. The Company tests finite-lived intangible assets for impairment upon the occurrence of certain triggering events. During 2017, the Company recognized approximately $30.0 million of impairment related to intangible assets, as discussed in "Note 2 - Financial Statement Details." As of December 31, 2017 and December 31, 2016, assets carried on the balance sheet and not remeasured to fair value on a recurring basis totaled $5,578.6 million and $667.0 million, respectively.
Fair Value Disclosures for Financial Instruments Not Carried at Fair Value
The Company’s financial instruments not recorded at fair value that are subject to fair value disclosure requirements include long-term borrowings. The estimated fair value of the outstanding term loans and Senior Unsecured Notes is determined based on the market prices for similar financial instruments or model-derived valuations based on observable inputs. These liabilities were considered to be Level 2 fair value measurements. The estimated fair values of the Company’s outstanding term loans, Revolver, and Senior Unsecured Notes were as follows (in thousands):
December 31, 2017 | December 31, 2016 | ||||||||||||||
Carrying Value | Estimated Fair Value | Carrying Value | Estimated Fair Value | ||||||||||||
Term Loan A due August 2021 | $ | — | $ | — | $ | 475,000 | $ | 475,000 | |||||||
Revolving credit facility due August 2021 | — | — | 25,000 | 25,000 | |||||||||||
Term Loan A due August 2022 | 1,000,000 | 1,000,000 | — | — | |||||||||||
Term Loan B due August 2024 (net of original issue debt discount) | 1,548,149 | 1,550,000 | — | — | |||||||||||
7.5% Senior Unsecured Notes due 2024 (inclusive of unamortized premium) | 443,507 | 433,729 | — | — | |||||||||||
126
8. Restructuring and Other Costs
Merger Related Restructuring
In connection with the Merger, the Company has established a restructuring plan to eliminate redundant positions and reduce its facility footprint worldwide. The Company expects to continue the ongoing evaluations of its workforce and facilities infrastructure needs through 2020 in an effort to optimize its resources worldwide. Additionally, in conjunction with the Merger, the Company assumed certain liabilities related to employee severance and facility closure costs as a result of actions taken by inVentiv prior to the Merger. During the year ended December 31, 2017, the Company recognized approximately $11.3 million of employee severance and benefit costs, facility closure and lease termination costs of $2.2 million, and other costs of $2.0 million related to the Merger. The Company expects to incur significant costs related to the restructuring of its operations in order to achieve the targeted synergies as a result of the Merger over the next several years. However, the timing and the estimate of the amount of these costs depends on various factors, including, but not limited to, identifying and realizing synergy opportunities and executing the integration of our combined operations.
2017 Restructuring
In addition to costs incurred as a result of the Merger, during the year ended December 31, 2017, the Company recognized approximately $9.4 million of employee severance costs, including CEO transition costs, and incurred $1.3 million of facility closure and lease termination costs related to the Company’s non-Merger related restructuring activities. Included in restructuring and other costs during the year ended December 31, 2017 are $5.0 million of consulting costs related to the restructuring of its contract management process to meet the requirements of upcoming accounting regulation changes and $2.1 million of other costs.
2016 Realignment Plan and CEO Transition
In March 2016, management approved a global plan to eliminate certain positions worldwide in an effort to ensure that the Company's organizational focus and resources were properly aligned with its strategic goals and to continue strengthening the delivery of its growing backlog to customers. Accordingly, the Company made changes to its therapeutic unit structure designed to realign with management focus and optimize the efficiency of its resourcing to achieve its strategic plan. As a result, the Company eliminated approximately 200 positions and incurred $7.0 million related to employee severance costs during the year ended December 31, 2016. All actions under this plan were completed by December 31, 2017.
During the third quarter of 2016, the Company also announced the closure of one of its facilities associated with this restructuring and incurred facility closure costs of $1.5 million, which were partially offset by unamortized deferred rent of $0.5 million during the year ended December 31, 2016.
In July 2016, the Company entered into a transition agreement with its former Chief Executive Officer ("CEO") related to the transition to a new CEO as of October 1, 2016. The CEO transition agreement is effective through February 28, 2017. In addition, in mid-September 2016, the Company entered into retention agreements with certain key employees for various dates through September 2017. For the year ended December 31, 2016, the Company recognized $4.8 million of costs associated with the CEO transition and retention agreements, which will be paid through August 2018.
2015 Realignment Plan
During the second and fourth quarters of 2015, the Company initiated restructuring activities to better align its resources worldwide. Specifically, the Company initiated a plan to reduce its workforce by approximately 70 employees, primarily in the United States and certain countries in Europe primarily within clinical operations, principally within the Clinical Development Services operations group and several corporate administrative functions. The Company completed the majority of these actions by December 31, 2015. Under this plan, the Company incurred $2.7 million of severance costs related to these activities during 2015.
127
For the year ended December 31, 2015, the Company recorded a net reduction in facility closure expenses of $0.9 million. During the year, the Company reversed previously accrued liabilities as a result of completing negotiations with respect to exiting certain facilities and reduced its exit cost estimates related to certain lease agreements as a result of subleasing a portion of facilities previously exited along with the return of a tenant improvement allowance. These adjustments were partially offset by expenses related to early lease termination fees and accruals for closure of smaller locations as the Company continues to optimize its facilities portfolio.
Accrued Restructuring Liabilities
The following table summarizes activity related to the liabilities associated with restructuring and other costs during the years ended December 31, 2017, 2016 and 2015 (in thousands):
Employee Severance Costs, Including Executive Transition Costs | Facility Closure Charges | Other Charges | Total | ||||||||||||
Balance at December 31, 2014 | $ | — | $ | 6,144 | $ | — | $ | 6,144 | |||||||
Expenses incurred | 2,666 | (881 | ) | — | 1,785 | ||||||||||
Payments made | (1,601 | ) | (1,602 | ) | — | (3,203 | ) | ||||||||
Balance at December 31, 2015 | 1,065 | 3,661 | — | 4,726 | |||||||||||
Expenses incurred | 11,765 | 987 | 860 | 13,612 | |||||||||||
Reclassification of deferred rent | — | 507 | — | 507 | |||||||||||
Payments made | (8,135 | ) | (1,338 | ) | (780 | ) | (10,253 | ) | |||||||
Balance at December 31, 2016 | 4,695 | 3,817 | 80 | 8,592 | |||||||||||
Restructuring liabilities assumed through business combinations | 3,362 | 7,449 | — | 10,811 | |||||||||||
Expenses incurred(a) | 16,878 | 1,749 | 5,801 | 24,428 | |||||||||||
Payments made | (16,077 | ) | (5,604 | ) | (5,357 | ) | (27,038 | ) | |||||||
Balance at December 31, 2017 | $ | 8,858 | $ | 7,411 | $ | 524 | $ | 16,793 | |||||||
(a) Total restructuring and other costs for the year ended December 31, 2017 include $8.9 million of other non-cash expenses that were not recorded as a restructuring liability and are therefore excluded from the roll-forward above.
The Company expects the employee severance costs accrued as of December 31, 2017 will be paid within the next twelve months. Certain facility costs will be paid over the remaining lease terms of the exited facilities which range from 2018 through 2027. Liabilities associated with these costs are included in the “Accrued liabilities” and “Other long-term liabilities” line items in the accompanying audited consolidated balance sheets. Costs recognized in net income during the period related to these activities are included in the “Restructuring and other costs” line item in the consolidated statements of operations. These costs are not allocated to the Company’s reportable segments because they are not part of the segment performance measures regularly reviewed by management.
9. Shareholders' Equity
Merger
On August 1, 2017, the Company completed its Merger with inVentiv. In accordance with the terms of the Merger Agreement, the Company issued 49,297,022 fully diluted shares of the Company’s common stock with a par value of $0.01 per share in exchange for all outstanding inVentiv shares of common stock.
128
Stock Repurchases and Secondary Offerings
In May 2016, the Company's former sponsors sold 8,000,000 shares of the Company's Class A common stock in a registered secondary common stock offering.
In July 2016, the Company announced a stock repurchase program for shares of the Company’s common stock pursuant to which the Company was authorized to repurchase up to $150.0 million of its outstanding common stock in the open market, in block trades, or in privately negotiated transactions. The program commenced on August 1, 2016 and was scheduled to end no later than December 31, 2017. Through this program, in August 2016, the Company repurchased 4,500,000 shares of its common stock in a private transaction for a total purchase price of approximately $64.5 million. The Company immediately retired all of the repurchased common stock and charged the par value of the shares to common stock. The excess of the repurchase price over par was applied on a pro rata basis against additional paid-in-capital, with the remainder applied to accumulated deficit. On July 23, 2017, the Company terminated the repurchase program.
The following is a summary of the Company's authorized, issued and outstanding shares:
December 31, 2017 | December 31, 2016 | ||||
Shares Authorized: | |||||
Class A common stock | 300,000,000 | 300,000,000 | |||
Class B common stock | 300,000,000 | 300,000,000 | |||
Preferred stock | 30,000,000 | 30,000,000 | |||
Total shares authorized | 630,000,000 | 630,000,000 | |||
Shares Issued and Outstanding: | |||||
Class A common stock | 104,435,501 | 53,762,786 | |||
Class B common stock | — | — | |||
Preferred stock | — | — | |||
Total shares issued and outstanding | 104,435,501 | 53,762,786 | |||
Voting Rights and Conversion Rights of the Common Stock
Each share of Class A common stock is entitled to one vote on all matters to be voted on by the shareholders of the Company, including the election of directors. Each share of Class B common stock is entitled to one vote on all matters to be voted on by the shareholders of the Company, except for the right to vote in the election of directors. Additionally, each share of Class B common stock is convertible (on a one-for-one basis) into Class A common stock at any time at the election of the holder.
Dividend Rights and Preferences of the Common Stock
The holders of Class A and Class B common stock are entitled to dividends on a pro rata basis at such time and in such amounts as, if and when declared by Board of Directors (the “Board”). There were no dividends paid during the years ended December 31, 2017, 2016, or 2015.
Liquidation Rights and Preferences of the Common Stock
The holders of Class A and Class B common stock are entitled to participate on a pro rata basis in all distributions made in connection with a voluntary or involuntary liquidation, dissolution or winding up of the affairs of the Company.
2018 Stock Repurchase Program
On February 26, 2018, the Board authorized the repurchase of up to an aggregate of $250.0 million of the Company’s common stock, par value $0.01 per share, from time to time in open market transactions effected through a broker at prevailing market prices, in block trades, or privately negotiated transactions. The stock
129
repurchase program will commence on March 1, 2018 and end no later than December 31, 2019. The Company intends to use cash on hand and future free cash flow to fund the stock repurchase program. The stock repurchase program does not obligate the Company to repurchase any particular amount of the Company’s common stock, and may be modified, extended, suspended or discontinued at any time. The timing and amount of repurchases will be determined by the Company’s management based on a variety of factors such as the market price of the Company’s common stock, the Company’s corporate requirements, and overall market conditions. The stock repurchase program will be subject to applicable legal requirements, including federal and state securities laws. The Company may also repurchase shares of its common stock pursuant to a trading plan meeting the requirements of Rule 10b5-1 under the Securities Exchange Act of 1934, as amended, which would permit shares of the Company’s common stock to be repurchased when the Company might otherwise be precluded from doing so by law.
10. Share-Based Compensation
Overview of Employee Share-Based Compensation Plans
The Company currently has two equity-based compensation plans, the INC Research Holdings, Inc. 2014 Equity Incentive Plan ("2014 Plan") and the INC Research Holdings, Inc. 2016 Employee Stock Purchase Plan ("ESPP"), from which share-based awards are currently granted. In addition, the Company had the INC Research Holdings, Inc. 2010 Equity Incentive Plan ("2010 Plan") that was terminated effective October 30, 2014, except as to outstanding awards. No further awards can be issued under the 2010 Plan. The 2014 Plan was established on November 3, 2014 and permits granting of stock options, stock appreciation rights, restricted stock awards, restricted stock units ("RSUs"), cash performance awards or stock awards to employees, as well as non-employee directors and consultants. The terms of equity-based instruments granted are determined at the time of grant and are typically subject to such conditions as continued employment, passage of time and/or satisfaction of performance criteria. Stock options and RSUs typically vest ratably over three-year to four-year periods from the grant date. The Board and the Compensation Committee have the discretion to determine different vesting schedules. Stock options have a maximum term of ten years. The exercise price per share of stock options may not be less than the fair market value of a share of the Company's common stock on the date of grant. Upon the exercise of stock options or vesting of RSUs, the Company issues new shares of common stock.
On August 1, 2017, the Company filed a Form S-8 Registration Statement for the Double Eagle Parent, Inc. 2016 Omnibus Equity Incentive Plan ("Double Eagle Plan"). The number of shares registered in that filing was 1,500,000. Under this plan, the Company issued replacement awards consisting of options and RSUs. No further awards can be issued under the Double Eagle Plan.
As of December 31, 2017, the Company had equity grants outstanding under the 2010 Plan, 2014 Plan, and the Double Eagle Plan. The maximum number of shares reserved for issuance under the Plans was 8,437,325, of which 2,455,372 shares were available for future grants as of December 31, 2017. In addition, under the 2014 Plan outstanding stock award or stock option grants forfeited prior to vesting or exercise become available for future grants.
Employee Stock Purchase Plan
In March 2016, the Board approved the ESPP, which was also approved by the Company’s shareholders in May 2016. The ESPP allows eligible employees to authorize payroll deductions of up to 10% of their annual base salary or wages to be applied toward the purchase of full shares of the Company’s common stock on the last trading day of the offering period. Participating employees can purchase shares of the Company's common stock at a 15% discount to the lesser of the closing price of the Company's common stock as quoted on the NASDAQ Stock Exchange on (i) the first trading day of the offering period or (ii) the last trading day of the offering period. Offering periods under the ESPP are six months in duration, and the first offering period began on September 1, 2016. Under this plan, the Company recognized share-based compensation expense of $1.7 million and $0.5 million for the years ended December 31, 2017 and 2016, respectively. As of December 31, 2017, there were 125,974 shares issued and 874,026 shares reserved for future issuance under the ESPP.
130
Share-Based Awards Exchanged in Business Combination
As a result of the Merger, the Company assumed the equity incentive plans formerly related to inVentiv. In connection with the Merger, the vesting conditions of certain outstanding time- and performance-based stock option awards and RSUs of inVentiv were modified at the discretion of its board of directors. These modifications were treated as modifications of share-based awards and accounted for according to the provisions of ASC Topic 718, Compensation - Stock Compensation. As provided by the merger agreement, each vested option to purchase shares of inVentiv common stock outstanding immediately prior to the effective date of the Merger was automatically converted into a vested option to acquire shares of the Company’s common stock, on substantially the same terms and conditions, adjusted by the 3.4928 exchange ratio; and each restricted stock unit of inVentiv outstanding immediately prior to the effective date of the Merger was automatically converted into shares of the Company’s common stock at an exchange ratio of 3.4928. The fair value of these awards was allocated to the purchase consideration in the amount of $16.2 million and post-combination expense in the amount of $27.1 million, based on the portion of the vesting period completed prior to the date of the Merger. The assumed awards related to the Merger have been identified as applicable in the tables that follow.
Similarly, at the discretion of the Company’s board of directors, upon the Merger certain share-based awards of the Company outstanding immediately prior to the effective date of the Merger vested, and certain performance-based restricted stock units were converted into time-based restricted stock units at 100% of the target. The outstanding awards of approximately 50 employees were impacted. The aggregate incremental fair value of these awards was approximately $2.7 million, of which approximately $1.5 million was recognized during the year ended December 31, 2017. The remainder of the incremental fair value will be recognized over the remaining requisite service period of approximately 2.0 years.
Stock Option Awards
The following table sets forth the summary of option activity under our Plans for the year ended December 31, 2017:
Number of Options | Weighted Average Exercise Price | Weighted Average Remaining Contractual Life (in years) | Aggregate Intrinsic Value (in thousands)(b) | |||||||||
Outstanding at December 31, 2016 | 2,170,235 | $ | 22.15 | |||||||||
Assumed through business combinations(a) | 1,336,406 | 28.63 | ||||||||||
Granted | 64,899 | 56.32 | ||||||||||
Exercised | (991,894 | ) | 16.50 | |||||||||
Forfeited | (55,484 | ) | 31.77 | |||||||||
Expired | (6,657 | ) | 35.90 | |||||||||
Outstanding at December 31, 2017 | 2,517,505 | $ | 28.45 | 7.41 | $ | 38,993 | ||||||
Vested and expected to vest at December 31, 2017 | 2,517,505 | $ | 28.45 | 7.41 | $ | 38,993 | ||||||
Exercisable at December 31, 2017 | 2,149,974 | $ | 26.01 | 7.31 | $ | 38,660 | ||||||
(a) Represents fully vested stock options issued as replacement awards in connection with the Merger.
(b) Represents the total pre-tax intrinsic value (i.e., the aggregate difference between the closing price of the Company’s common stock on December 31, 2017 of $43.60 and the exercise price for in-the-money options) that would have been received by the holders if all instruments had been exercised on December 31, 2017.
As of December 31, 2017, there was $3.8 million of unrecognized compensation expense related to non-vested stock options, which is expected to be recognized over a weighted average period of 2.0 years.
131
Other information pertaining to the Company's stock option awards is as follows (in thousands, except per share data):
Years Ended December 31, | |||||||||||
2017 | 2016 | 2015 | |||||||||
Weighted average grant date fair value of options granted | $ | 13.88 | $ | 14.26 | $ | 13.80 | |||||
Total intrinsic value of options exercised | $ | 37,928 | $ | 45,126 | $ | 27,560 | |||||
Fair Value Assumptions
The fair value of stock option awards and ESPP offerings was determined using the Black-Scholes valuation model and the following assumptions:
Years Ended December 31, | |||||
2017 | 2016 | 2015 | |||
Expected volatility: | |||||
Stock options | 24.5% - 24.6% | 29.4% - 30.9% | 30.5% - 32.8% | ||
ESPP | 36.0% - 46.5% | 31.4% | — | ||
Risk-free interest rate: | |||||
Stock options | 1.80% | 1.17% - 1.88% | 1.38% - 1.88% | ||
ESPP | 0.79% - 1.08% | 0.47% | — | ||
Expected term (in years): | |||||
Stock options | 4.75 - 5.0 | 6.25 | 6 | ||
ESPP | 0.5 | 0.5 | — | ||
Dividend yield: | |||||
Stock options | —% | —% | —% | ||
ESPP | —% | —% | —% | ||
Restricted Stock Units Awards
The following table sets forth a summary of RSUs outstanding under the 2014 Plan as of December 31, 2017 and changes during the year then ended:
Number of Shares | Weighted Average Grant Date Fair Value | |||||
Non-vested at December 31, 2016 | 708,695 | $ | 42.76 | |||
Assumed through business combinations(a) | 35,752 | 55.85 | ||||
Granted | 628,794 | 52.62 | ||||
Vested | (422,353 | ) | 45.19 | |||
Forfeited | (43,308 | ) | 47.84 | |||
Non-vested at December 31, 2017 | 907,580 | $ | 49.30 | |||
(a) Represents fully vested RSUs issued as replacement awards and immediately converted into shares of the Company’s common stock in connection with the Merger with inVentiv.
At December 31, 2017, there was $30.5 million of unrecognized compensation expense related to unvested RSUs, which is expected to be recognized over a weighted average period of 2.2 years.
Merger-Related Performance-Based Awards
In August 2017, the Board of Directors and Compensation Committee granted certain executive officers a total of 127,917 performance-based RSUs (“PRSUs”). These performance-based awards are subject to the
132
Company achieving a certain level of annual net income growth over the vesting period by reducing operating costs through execution of the cost saving initiatives. These PRSUs will vest on January 1, 2021 provided the performance criteria are met and will settle no later than March 15, 2021. These awards are included in the table above. Compensation expense related to PRSUs is recorded based on the estimated quantity of awards that are expected to vest. At each reporting period, management re-assesses the probability that the performance conditions will be achieved and adjusts compensation expense to reflect any changes in the estimated probability of vesting until the actual level of achievement of the performance targets is known.
Share-Based Compensation Expense
Total share-based compensation expense recognized was as follows (in thousands):
Years Ended December 31, | |||||||||||
2017 | 2016 | 2015 | |||||||||
Direct costs | $ | 10,537 | $ | 6,551 | $ | 2,282 | |||||
Selling, general, and administrative expenses | 14,041 | 7,469 | 2,792 | ||||||||
Restructuring and other costs | 3,791 | — | — | ||||||||
Transaction and integration-related expenses | 31,327 | — | — | ||||||||
Total share-based compensation expense | $ | 59,696 | $ | 14,020 | $ | 5,074 | |||||
The total income tax benefit recognized in the consolidated statements of operations for share-based compensation arrangements was approximately $1.6 million, $4.7 million, and $1.6 million for the years ended December 31, 2017, 2016 and 2015, respectively.
11. Earnings Per Share
The following table provides a reconciliation of the numerators and denominators of the basic and diluted earnings per share computations for the years ended December 31, 2017, 2016 and 2015 (in thousands, except per share data):
Years Ended December 31, | |||||||||||
2017 | 2016 | 2015 | |||||||||
Numerator: | |||||||||||
Net (loss) income | $ | (138,469 | ) | $ | 112,630 | $ | 117,047 | ||||
Denominator: | |||||||||||
Basic weighted average common shares outstanding | 74,913 | 54,031 | 57,888 | ||||||||
Effect of dilutive securities: | |||||||||||
Stock options and other awards under deferred share-based compensation programs | — | 1,579 | 2,258 | ||||||||
Diluted weighted average common shares outstanding | 74,913 | 55,610 | 60,146 | ||||||||
(Loss) earnings per share: | |||||||||||
Basic | $ | (1.85 | ) | $ | 2.08 | $ | 2.02 | ||||
Diluted | $ | (1.85 | ) | $ | 2.03 | $ | 1.95 | ||||
Potential common shares outstanding that are considered anti-dilutive are excluded from the computation of diluted earnings per share. Potential common shares related to stock options and other awards under deferred share-based compensation programs may be determined to be anti-dilutive based on the application of the treasury stock method. Potential common shares are also considered anti-dilutive in the event of net loss from operations.
133
The number of potential shares outstanding that were considered anti-dilutive using the treasury stock method and therefore excluded from the computation of diluted earnings per share, weighted for the portion of the period they were outstanding are as follows (in thousands):
Years Ended December 31, | ||||||||
2017 | 2016 | 2015 | ||||||
Anti-dilutive stock options and other awards | 531 | 788 | 268 | |||||
Anti-dilutive stock options and other awards under deferred share-based compensation programs excluded based on reporting of net loss for the period | 1,255 | — | — | |||||
Total common stock equivalents excluded from diluted earnings per share computation | 1,786 | 788 | 268 | |||||
12. Income Taxes
The components of income (loss) before provision for income taxes were as follows (in thousands):
Years Ended December 31, | |||||||||||
2017 | 2016 | 2015 | |||||||||
Domestic | $ | (204,352 | ) | $ | 53,613 | $ | 61,392 | ||||
Foreign | 92,475 | 80,505 | 69,582 | ||||||||
(Loss) income before provision for income taxes | $ | (111,877 | ) | $ | 134,118 | $ | 130,974 | ||||
The components of income tax (expense) benefit were as follows (in thousands):
Years Ended December 31, | |||||||||||
2017 | 2016 | 2015 | |||||||||
Federal income taxes: | |||||||||||
Current | $ | 6,299 | $ | (30,247 | ) | $ | (3,563 | ) | |||
Deferred | (18,731 | ) | 16,936 | (3,600 | ) | ||||||
Foreign income taxes: | |||||||||||
Current | (18,030 | ) | (10,347 | ) | (5,805 | ) | |||||
Deferred | 312 | 5,178 | (4,314 | ) | |||||||
State income taxes: | |||||||||||
Current | (430 | ) | (3,154 | ) | (425 | ) | |||||
Deferred | 3,988 | 146 | 3,780 | ||||||||
Income tax benefit (expense) | $ | (26,592 | ) | $ | (21,488 | ) | $ | (13,927 | ) | ||
Tax Cuts and Jobs Act of 2017
On December 22, 2017, the U.S. government enacted comprehensive tax legislation commonly referred to as the Tax Cuts and Jobs Act (the “Tax Act”). The Tax Act makes broad and complex changes to the U.S. tax code, including, but not limited to: (i) reducing the U.S. federal corporate tax rate from 35% to 21%; (ii) requiring companies to pay a one-time transition tax on certain undistributed earnings of foreign subsidiaries; (iii) generally eliminating U.S. federal income taxes on dividends from foreign subsidiaries; (iv) introducing a new provision designed to tax global intangible low-taxed income ("GILTI"); (v) eliminating the corporate alternative minimum tax ("AMT") and changing how existing AMT credits can be realized; (vi) creating the base erosion anti-abuse tax ("BEAT"), a new minimum tax; (vii) creating a new limitation on deductible interest expense; (viii) introducing limitations on the deductibility of certain executive compensation; and (ix) changing rules related to uses and limitations of net operating loss carryforwards created in tax years beginning after December 31, 2017.
134
U.S. GAAP requires companies to recognize the effect of tax law changes in the period of enactment. As a result, for the year ended December 31, 2017, the Company recognized income tax expense of $94.4 million comprised of (i) income tax expense of $37.5 million due to the re-measurement of net deferred tax assets; (ii) income tax expense of $63.1 million related to the accrual of the transition tax; (iii) net income tax benefit of $58.7 million from the reversal of previously accrued income taxes on the expected repatriation of foreign earnings (comprised of a $112.1 million reversal, net of $53.4 million accrual); and (iv) income tax expense of $52.6 million for the increase in the valuation allowance on the Company's net deferred tax assets. The accrual of the transition tax and the remeasurement of the net deferred tax assets are provisional and may be adjusted in future periods during 2018 when additional information is obtained. Additional information that may affect these provisional amounts would include, among others: (i) further clarification and guidance regarding how the IRS will implement the Tax Act, (ii) further clarifications and guidance regarding how state tax authorities will implement the Tax Act and the related effect on the Company's state income tax returns, and (iii) potential additional clarifications and guidance from the U.S. Securities and Exchange Commission or the FASB.
In December 2017, the SEC staff issued Staff Accounting Bulletin 118 ("SAB 118"), which provides guidance on accounting for the tax effects of the Tax Act. SAB 118 provides a measurement period that should not extend beyond one year from the Tax Act enactment date for companies to complete the accounting under ASC Topic 740 - Income Taxes ("ASC 740"). In accordance with SAB 118, a company must reflect the income tax effects of those aspects of the Tax Act for which the accounting under ASC 740 is complete. To the extent that a company’s accounting for certain income tax effects of the Tax Act is incomplete but the Company is able to determine a reasonable estimate, it must record a provisional estimate in the financial statements. If a company cannot determine a provisional estimate to be included in the financial statements, it should continue to apply ASC 740 on the basis of the provisions of the tax laws that were in effect immediately before the enactment of the Tax Act.
Reduction of U.S. Federal Corporate Income Tax Rate
The Tax Act lowered the federal corporate tax rate from 35% to 21%, effective January 1, 2018. As a result, for the year ended December 31, 2017, the Company recorded a decrease in related net deferred tax assets, with a corresponding increase in deferred income tax expense, of $37.5 million.
Deemed Repatriation Transition Tax
The Deemed Repatriation Transition Tax ("Transition Tax") is a tax on previously untaxed accumulated and current earnings and profits of certain foreign subsidiaries. The Company has not yet completed its accounting for the effects of the Transition Tax. However, the Company has made a reasonable estimate, and in the three months and year ended December 31, 2017, recognized provisional income tax expense of $63.1 million. The Company computed this amount based on currently available information; however, there is still uncertainty as to the application of the Tax Act, in particular as it relates to state income taxes. Furthermore, the Company has not yet completed its analysis of the components of the computation, including the amount of the foreign earnings subject to the U.S. income tax, and the portion of foreign earnings held in cash or other specified assets. As a result of the accrual of the Transition Tax, the Company reversed deferred tax liabilities previously accrued on foreign earnings and recognized a net tax benefit of $58.7 million in the fourth quarter of 2017.
Global Intangible Low Taxed Income
The Tax Act created a new requirement related to global intangible low taxed income ("GILTI"). In particular, GILTI earned by controlled foreign corporations ("CFCs") must be included currently in the gross income of the CFC’s U.S. parent. GILTI is computed as the excess of the U.S. parent’s “net CFC tested income” over the net deemed intangible income return, which is currently defined as the excess of (i) 10% of the aggregate of the U.S. parent’s pro rata share of the qualified business asset investment of each CFC with respect to which it is a U.S. parent over, and (ii) the amount of certain interest expense taken into account in the determination of net CFC-tested income.
135
The Company's expectation for future U.S. taxable income inclusions of GILTI depends on (i) its current structure, (ii) estimated future results of its global operations, and (iii) its ability to modify its structure and/or business. The Company has not yet recorded any adjustments to its financial results relating to the potential impacts of the GILTI tax and has elected to record future GILTI impacts in the period in which the costs are incurred.
Actual income tax (expense) benefit differed from the amount computed by applying the U.S. federal tax rate of 35% to pre-tax income (loss) as a result of the following (in thousands):
Years Ended December 31, | |||||||||||
2017 | 2016 | 2015 | |||||||||
Expected income tax (expense) benefit at statutory rate | $ | 39,157 | $ | (46,941 | ) | $ | (45,844 | ) | |||
Increase (decrease) in income tax benefit (expense) resulting from: | |||||||||||
Foreign income inclusion | (780 | ) | (8,868 | ) | (7,056 | ) | |||||
Foreign earnings reinvestment assertion reversal (a) | 112,087 | — | — | ||||||||
Foreign earnings reinvestment assertion accrual (a) | (53,421 | ) | — | — | |||||||
Changes in income tax valuation allowance (a) | (52,563 | ) | 3,419 | 31,929 | |||||||
Change in fair value of contingent tax-sharing obligation | 4,344 | — | — | ||||||||
Share-based compensation | 8,901 | 12,940 | — | ||||||||
Research and general business tax credits | 5,718 | 4,063 | 1,879 | ||||||||
State and local taxes, net of federal benefit | 1,330 | (745 | ) | (4,184 | ) | ||||||
Capitalized transaction costs | (6,486 | ) | — | — | |||||||
Foreign rate differential | 16,778 | 12,200 | 11,490 | ||||||||
Changes in reserve for uncertain tax positions | 947 | 3,136 | 4,375 | ||||||||
Provision to tax return and other deferred tax adjustments | (536 | ) | (1,524 | ) | (5,322 | ) | |||||
Goodwill impairment | — | — | (1,023 | ) | |||||||
Federal rate change (a) | (37,468 | ) | — | — | |||||||
Transition tax (a) | (63,050 | ) | — | — | |||||||
Other, net | (1,550 | ) | 832 | (171 | ) | ||||||
Income tax benefit (expense) | $ | (26,592 | ) | $ | (21,488 | ) | $ | (13,927 | ) | ||
(a) As a result of enactment of the Tax Act, during the fourth quarter of 2017 the Company recorded direct and indirect charges to income tax expense of $94.4 million which is comprised of the following line items noted in the table above: (i) foreign earnings reinvestment assertion reversal; (ii) foreign earnings reinvestment assertion accrual; (iii) change in income tax valuation allowance; (iv) federal rate change; and (v) transition tax.
Acquired Deferred Income Tax Assets and Liabilities
As a result of the Merger, the Company assumed a net deferred tax liability of approximately $11.4 million which consisted primarily of (i) a deferred tax liability of approximately $455.3 million related to temporary differences associated with amortization of intangible assets, (ii) a deferred tax liability of approximately $53.7 million related to unremitted foreign earnings, (iii) a deferred tax asset of approximately $444.0 million related to net operating loss (“NOL”) carryforwards, and (iv) a deferred tax asset of $50.6 million for deferred financing costs. The NOL carryforwards acquired in the Merger consisted of (i) $1.1 billion of U.S. federal NOL carryforwards, (ii) $1.0 billion of domestic state and local NOL carryforwards, and (iii) $66.8 million of foreign NOL carryforwards.
A portion of the NOL carryforwards acquired from inVentiv was generated prior to their acquisition by the Company and therefore is subject to ownership change provisions under Section 382 of the Internal Revenue Code (“Section 382”). Section 382 requires a corporation to limit the amount of its future periods taxable income that can be offset by historic NOL carryforwards and tax credit carryforwards in the event of an “ownership change”, as defined in Section 382. As a result of the Tax Act, the Company recorded a valuation allowance in 2017 due to uncertainties related to the Company’s ability to utilize some of the U.S. deferred tax assets associated with the NOL carryforwards discussed above. The valuation allowance is based on the
136
Company’s estimate of taxable income in the U.S. and various state jurisdictions and the period over which the deferred income tax assets will be recoverable. Should the Company generate sufficient taxable income in future periods, the Company does not expect that the Section 382 limitations will significantly impact the Company’s ability to utilize its federal NOL carryforwards within the applicable expiration periods. Furthermore, the Company has assumed a contingent tax-sharing obligation related to certain pre-Merger transaction tax deductions. As the transaction tax deductions are realized through the utilization of certain acquired NOLs, the Company is obligated to make payments to the former stockholders of inVentiv. The amount of acquired NOLs subject to this contingent tax-sharing obligation is estimated to be approximately $187.8 million.
As a result of the Merger and associated debt financing, the Company re-evaluated and changed its assertion related to whether the Company would repatriate the majority of its undistributed foreign earnings. As a result of concluding that earnings of certain foreign subsidiaries would be repatriated, the Company recorded a corresponding deferred tax liability of $53.4 million. Furthermore, due to the accrual of the Transition Tax required by the Tax Act, the Company reversed the full balance of the deferred tax liability (including the deferred tax liability acquired as part of the Merger), resulting in a tax benefit of $112.1 million. As a result of the Transition Tax, the Company has approximately $649.4 million of previously taxed foreign earnings in the U.S., of which approximately $254.9 million will remain permanently reinvested in the foreign jurisdictions. These earnings are expected to be used to support the growth and working capital needs of the Company's foreign subsidiaries. The Company intends to repatriate its remaining foreign earnings of approximately $394.5 million and, as of December 31, 2017, has accrued anticipated withholding taxes.
The changes in the valuation allowance for deferred tax assets were as follows (in thousands):
Years Ended December 31, | |||||||||||
2017 | 2016 | 2015 | |||||||||
Balance at the beginning of the period | $ | 5,238 | $ | 16,731 | $ | 48,660 | |||||
Deferred tax assets assumed through business combinations | 101,527 | — | — | ||||||||
Charged (credited) to income tax expense (a) | 52,563 | (3,419 | ) | (31,929 | ) | ||||||
Foreign tax credit conversion | — | (6,707 | ) | — | |||||||
Foreign currency exchange | — | (890 | ) | — | |||||||
Other adjustments (b) | 318 | (477 | ) | — | |||||||
Balance at the end of the period | $ | 159,646 | $ | 5,238 | $ | 16,731 | |||||
(a) | For the year ended December 31, 2017, charge to income tax expense was calculated at 21% federal income tax rate as enacted by the Tax Act. |
(b) | Other adjustments denote the effects of write-offs and recoveries in various jurisdictions with no net tax impact. |
As of December 31, 2017, the valuation allowance increased by $154.4 million, which primarily consisted of (i) an increase of $52.6 million primarily as a result of recording a valuation allowance for U.S. federal and state deferred tax assets, and (ii) an increase of $101.5 million related to a valuation allowance acquired as a result of the Merger. Of this change to the valuation allowance, $52.6 million was charged to income tax expense during the fourth quarter of 2017.
As of December 31, 2017, the Company assessed both positive and negative evidence in evaluating whether it could support the recognition of its U.S. net deferred tax asset position or if a valuation allowance would be required. A significant piece of objective negative evidence that the Company considered was the cumulative loss over the three-year period ended December 31, 2017. This objective negative evidence was weighed against the subjective positive evidence available to the Company and it was determined that the positive evidence was not sufficient to overcome the substantial negative evidence. Therefore, the Company recorded a charge to income tax expense in the amount of $52.6 million for the net increase in the valuation allowance.
As of December 31, 2016, the Company released a portion of the valuation allowance primarily related to foreign deferred tax assets based on the Company's current and anticipated future earnings in certain foreign operations. The release of the valuation allowance resulted in an income tax benefit of $3.4 million during the year ended December 31, 2016.
137
As of December 31, 2015, the Company assessed both positive and negative evidence available to estimate whether future taxable income would be available to permit the use of the existing deferred tax assets. Accordingly, based on the Company achieving sustained profitability in 2015, the Company reevaluated its ability to consider other subjective evidence, such as the reliability of the Company's projections for future growth. The Company expected it would no longer need a significant portion of the valuation allowance related to these deferred tax assets. As a result of this change in assertion, the valuation allowance was released on the net deferred tax assets in the United States. The release of these valuation allowances resulted in an income tax benefit of $31.9 million during the year ended December 31, 2015.
The tax effects of temporary differences that give rise to significant portions of the deferred tax assets and liabilities are as follows (in thousands):
December 31, 2017 | December 31, 2016 | ||||||
Deferred tax assets: | |||||||
Net operating losses | $ | 308,606 | $ | 12,607 | |||
Tax credits | 55,920 | 4,690 | |||||
Deferred revenue | 15,719 | 4,630 | |||||
Foreign exchange | 978 | 10,430 | |||||
Employee compensation and other benefits | 31,956 | 18,382 | |||||
Allowance for doubtful accounts | 1,975 | 1,660 | |||||
Deferred rent | 2,258 | 729 | |||||
Accrued liabilities | 9,306 | 5,280 | |||||
Other | 2,698 | 68 | |||||
Total deferred tax assets | 429,416 | 58,476 | |||||
Less: valuation allowance | (159,646 | ) | (5,238 | ) | |||
Net deferred tax assets | 269,770 | 53,238 | |||||
Deferred tax liabilities: | |||||||
Undistributed foreign earnings | (7,346 | ) | — | ||||
Foreign branch operations | (1,652 | ) | (2,564 | ) | |||
Depreciation and amortization | (276,502 | ) | (42,272 | ) | |||
Other | (1,918 | ) | (1,971 | ) | |||
Total deferred tax liabilities | (287,418 | ) | (46,807 | ) | |||
Net deferred tax assets (liabilities) | $ | (17,648 | ) | $ | 6,431 | ||
As of December 31, 2017 and 2016, the Company had U.S. Federal NOL carryforwards, including those from inVentiv discussed above, of approximately $1.0 billion and $5.4 million, respectively. A valuation allowance has been established for jurisdictions where future benefit is uncertain. As of December 31, 2017, the Company established a full valuation allowance against the federal NOL carryforward balance.
As of December 31, 2017 and 2016, the Company had state NOL carryforwards, including those from inVentiv discussed above, of approximately $1.2 billion and $52.0 million, respectively, a portion of which will expire annually beginning in 2018. The Company also had foreign NOL carryforwards, including those from inVentiv discussed above, of $124.8 million and $54.3 million as of December 31, 2017 and 2016, respectively. A valuation allowance has been established for jurisdictions where the future benefit of the NOL carryforwards is uncertain.
The Company recognizes a tax benefit from any uncertain tax positions only if they are more likely than not to be sustained upon examination based on the technical merits of the position. The amount of the accrual for which an exposure exists is measured as the largest amount of benefit determined on a cumulative probability basis that the Company believes is more likely than not to be realized upon ultimate settlement of the position. Components of the reserve are classified as either a current or a long-term liability in the accompanying consolidated balance sheets based on when the Company expects each of the items to be settled.
138
The Company had gross unrecognized tax benefits, exclusive of associated interest and penalties, of approximately $43.7 million and $15.7 million as of December 31, 2017 and 2016, respectively. The Company recognizes accrued interest and penalties related to uncertain tax positions in income tax expense. As of December 31, 2017 and 2016, the Company had accrued interest and penalties related to uncertain tax positions of $5.0 million and $0.1 million, respectively. For the year ended December 31, 2017, the Company recorded in the accompanying consolidated statements of operations a tax expense of $0.9 million related to interest and penalties associated with uncertain tax positions. For the years ended December 31, 2016 and 2015, the Company recorded in the accompanying consolidated statements of operations a tax expense of $2.0 million, and $0.3 million, respectively, related to interest and penalties associated with uncertain tax positions. If recognized, the total amount of unrecognized tax benefits that would impact the effective tax rate is $21.2 million.
The Company anticipates that during the next 12 months, the unrecognized tax benefits will decrease by approximately $1.4 million. A reconciliation of the beginning and ending balances of unrecognized tax benefits, excluding accrued interest and penalties, is as follows (in thousands):
Unrecognized tax benefits balance at December 31, 2014 | $ | 21,566 | |
Lapse of statute of limitations | (2,106 | ) | |
Increases for tax positions of prior years | 2,001 | ||
Decreases for tax positions of prior years | (1,594 | ) | |
Impact of foreign currency translation | (837 | ) | |
Unrecognized tax benefits balance at December 31, 2015 | 19,030 | ||
Lapse of statute of limitations | (1,446 | ) | |
Increases for tax positions of prior years | 308 | ||
Decreases for tax positions of prior years | (2,275 | ) | |
Impact of foreign currency translation | 121 | ||
Unrecognized tax benefits balance at December 31, 2016 | 15,738 | ||
Increases for tax positions in the current year | 191 | ||
Increases for tax positions of prior years | 27,974 | ||
Decreases for tax positions in prior year | (226 | ) | |
Impact of foreign currency translation | 1 | ||
Unrecognized tax benefits at December 31, 2017 | $ | 43,678 | |
Due to the geographic breadth of the Company's operations, numerous tax audits may be ongoing throughout the world at any point in time. Income tax liabilities are recorded based on estimates of additional income taxes which will be due upon the conclusion of these audits. Estimates of these income tax liabilities are made based upon prior experience and are updated in light of changes in facts and circumstances. However, due to the uncertain and complex application of tax regulations, it is possible that the ultimate resolution of audits may result in liabilities which could be materially different from these estimates. In such an event, the Company will record additional income tax expense or benefit in the period in which such resolution occurs.
The Company remains subject to audit by the IRS and various state taxing jurisdictions back to 1998 due to NOL carryforwards. The Company's tax filings are open to investigation from 2014 forward in the United Kingdom, which is the jurisdiction of the Company's largest foreign operation.
inVentiv’s federal income tax return for tax year 2014 is currently under examination by the Internal Revenue Service. In addition, inVentiv’s income tax returns for various tax years are currently under examination by the respective tax authorities in Germany, India, and Japan. The Company believes that its reserve for uncertain tax positions is adequate to cover existing risks or exposures related to all open tax years.
Recently Adopted Accounting Standards
Effective January 1, 2017, the Company adopted new guidance under ASU No. 2016-16, Income Taxes - Intra-Entity Transfers of Assets Other Than Inventory. For additional discussion of the new guidance, see "Note 1 - Basis of Presentation and Summary of Significant Accounting Policies" to the accompanying consolidated financial statements.
139
13. Employee Benefit Plans
Defined Contribution Retirement Plans
The Company offers defined contribution retirement benefit plans that comply with Section 401(k) of the IRS Code under which it matches employee deferrals at varying percentages and specified limits of the employee’s salary.
The Company’s contributions related to its defined contribution retirement plans were as follows (in thousands):
Years Ended December 31, | |||||||||||
2017 | 2016 | 2015 | |||||||||
Total defined contribution retirement plan contributions | $ | 15,429 | $ | 9,604 | $ | 5,546 | |||||
The Company's contributions associated with these defined contribution benefit plans are recorded in the "Direct costs" and "Selling, general and administrative" expense line items in the accompanying consolidated statements of operations.
Deferred Compensation Plan
As a result of the Merger, the Company assumed inVentiv’s nonqualified Deferred Compensation Plan for certain executives pursuant to Section 409A of the IRC (“NQDC Plan”). Under this plan, participants can defer, on a pre-tax basis, from 1.0% up to a maximum of 100.0% of salary and performance and non-performance based bonus. The Company does not make matching contributions into the NQDC Plan. Distributions will be made to participants upon termination of employment or death in a lump sum, unless installments are selected.
As of December 31, 2017, the NQDC Plan deferred compensation liabilities were $15.9 million and are included in the “Other long-term liabilities” line item in the accompanying consolidated balance sheets. The assets associated with the NQDC Plan are subject to the claims of the creditors and primarily consist of investments in mutual funds maintained in a “rabbi trust”. These investments are classified as trading securities and included in the “Other long-term assets” line item in the accompanying consolidated balance sheets. During the year ended December 31, 2017, gains (losses) on these investments were immaterial and were included in “Selling, general and administrative” expense line item of the accompanying consolidated statement of operations.
14. Segment Information
During the third quarter of 2017, the Company realigned its operating segments as a result of the Merger to reflect the current structure under which performance is evaluated, strategic decisions are made and resources are allocated. As a result of this realignment, effective August 1, 2017, the Company began evaluating its financial performance based on two reportable segments: Clinical Solutions and Commercial Solutions. Historical segment reporting has been revised to reflect these changes to the Company’s segment structure.
Each reportable business segment is comprised of multiple service offerings that, when combined, create a fully integrated biopharmaceutical services organization. Clinical Solutions offers a variety of services spanning Phase I to Phase IV of clinical development, including full-service global studies, as well as individual service offerings such as clinical monitoring, investigator recruitment, patient recruitment, data management, and study startup to assist customers with their drug development process. Commercial Solutions provides commercialization services to the pharmaceutical, biotechnology, and healthcare industries, which include outsourced selling solutions, communication solutions (public relations and advertising), and consulting related services.
140
The Company’s CODM reviews segment performance and allocates resources based upon segment revenue and income from operations. Revenue and costs for reimbursed out-of-pocket expenses are not allocated to the Company’s segments. Inter-segment revenue is eliminated from the segment reporting provided to the CODM and is not included in the segment revenue presented in the table below. Certain costs are not allocated to the Company’s reportable segments and are reported as general corporate expenses. These costs primarily consist of share-based compensation and general operational expenses associated with the Company’s senior leadership, finance, human resources, information technology, facilities, and legal functions. The Company does not allocate depreciation, amortization, asset impairment charges, restructuring, or transaction and integration-related costs to its segments. Additionally, the CODM reviews the Company’s assets on a consolidated basis and does not allocate assets to its reportable segments for purposes of assessing segment performance or allocating resources.
Information about reportable segment operating results is as follows (in thousands):
Years Ended December 31, | |||||||||||
2017 (a) | 2016 | 2015 | |||||||||
Net service revenue: | |||||||||||
Clinical Solutions | $ | 1,459,968 | $ | 1,021,017 | $ | 906,528 | |||||
Commercial Solutions | 392,875 | 9,320 | 8,212 | ||||||||
Total segment net service revenue | 1,852,843 | 1,030,337 | 914,740 | ||||||||
Reimbursable out-of-pocket expenses not allocated to segments | 819,221 | 580,259 | 484,499 | ||||||||
Total consolidated net service revenue | $ | 2,672,064 | $ | 1,610,596 | $ | 1,399,239 | |||||
Segment direct costs: | |||||||||||
Clinical Solutions | $ | 930,176 | $ | 612,201 | $ | 533,277 | |||||
Commercial Solutions | 291,310 | 7,881 | 6,845 | ||||||||
Total segment direct costs | 1,221,486 | 620,082 | 540,122 | ||||||||
Segment selling, general, and administrative expenses: | |||||||||||
Clinical Solutions | 203,206 | 148,102 | 136,934 | ||||||||
Commercial Solutions | 40,236 | — | — | ||||||||
Total segment selling, general, and administrative expenses | 243,442 | 148,102 | 136,934 | ||||||||
Segment operating income: | |||||||||||
Clinical Solutions | $ | 326,586 | $ | 260,714 | $ | 236,317 | |||||
Commercial Solutions | 61,329 | 1,439 | 1,367 | ||||||||
Total segment operating income | 387,915 | 262,153 | 237,684 | ||||||||
Operating expenses not allocated to segments: | |||||||||||
Reimbursable out-of-pocket expenses not allocated to segments | 819,221 | 580,259 | 484,499 | ||||||||
Share-based compensation not allocated to direct costs | 10,537 | 6,551 | 2,282 | ||||||||
Share-based compensation not allocated to selling, general, and administrative expenses | 14,041 | 7,469 | 2,792 | ||||||||
Corporate selling, general, and administrative expenses not allocated to segments | 25,137 | 16,815 | 16,883 | ||||||||
Restructuring and other costs | 33,315 | 13,612 | 1,785 | ||||||||
Transaction and integration-related expenses | 123,815 | 3,143 | 1,637 | ||||||||
Asset impairment charges | 30,000 | — | 3,931 | ||||||||
Depreciation and amortization | 179,936 | 59,204 | 56,014 | ||||||||
Total consolidated (loss) income from operations | $ | (28,866 | ) | $ | 155,359 | $ | 152,360 | ||||
(a) Following the Company’s Merger with inVentiv, beginning August 1, 2017, the Company’s consolidated results of operations include results of operations of inVentiv.
141
15. Operations by Geographic Location
The Company conducts its global operations through wholly-owned subsidiaries and representative sales offices. Prior to the Merger, net service revenue was attributed to geographical locations based upon the location to which the Company invoiced the end customer. Following the Merger, the Company began to attribute net service revenues to geographical locations based upon the location of where the work is performed to reflect its expanded geographic presence and increases in scale of its operations. All prior periods have been recast to reflect the effect of this change. The following table summarizes total revenue by geographic area (in thousands and with all intercompany transactions eliminated):
Years Ended December 31, | |||||||||||
2017 | 2016 | 2015 | |||||||||
Net service revenues: | |||||||||||
North America (a) | $ | 1,174,462 | $ | 602,133 | $ | 536,526 | |||||
Europe, Middle East and Africa | 458,264 | 319,189 | 288,221 | ||||||||
Asia-Pacific | 174,345 | 74,268 | 57,871 | ||||||||
Latin America | 45,772 | 34,747 | 32,122 | ||||||||
Total net service revenue | 1,852,843 | 1,030,337 | 914,740 | ||||||||
Reimbursable-out-of-pocket expenses | 819,221 | 580,259 | 484,499 | ||||||||
Total revenue | $ | 2,672,064 | $ | 1,610,596 | $ | 1,399,239 | |||||
(a) Net service revenue for the North America region include revenue attributable to the U.S. of $1,128.1 million, $577.3 million and $513.8 million, or 60.9%, 56.0% and 56.2% of net service revenues, for the years ended December 31, 2017, 2016 and 2015, respectively. No other countries represented more than 10% of net service revenue for any period.
The following table summarizes long-lived assets by geographic area (in thousands and all intercompany transactions have been eliminated):
December 31, 2017 | December 31, 2016 | ||||||
Property and equipment, net: | |||||||
North America (a) | $ | 136,101 | $ | 41,057 | |||
Europe, Middle East and Africa | 25,517 | 11,235 | |||||
Asia-Pacific | 14,700 | 5,101 | |||||
Latin America | 4,094 | 913 | |||||
Total property and equipment, net | $ | 180,412 | $ | 58,306 | |||
(a) Long-lived assets for the North America region include property and equipment, net attributable to the U.S. of $128.5 million and $40.6 million as of December 31, 2017 and 2016, respectively.
16. Concentration of Credit Risk
Financial assets that subject the Company to credit risk primarily consist of cash and cash equivalents and billed and unbilled accounts receivable. The Company's cash and cash equivalents consist principally of cash and are maintained at several financial institutions with reputable credit ratings. The Company maintains cash depository accounts with several financial institutions worldwide and is exposed to credit risk related to the potential inability to access liquidity in financial institutions where its cash and cash equivalents are concentrated. The Company has not historically incurred any losses with respect to these balances and believes that they bear minimal credit risk.
As of December 31, 2017, the amount of cash and cash equivalents held outside the United States by the Company’s foreign subsidiaries was $192.0 million, or 59.8% of the total consolidated cash and cash equivalents balance. As of December 31, 2016, the amount of cash and cash equivalents held outside the United States by the Company’s foreign subsidiaries was $86.4 million, or 84.3% of the total consolidated cash and cash equivalents balance.
142
Substantially all of the Company's net service revenue is earned by performing services under contracts with pharmaceutical and biotechnology companies. The concentration of credit risk is equal to the outstanding billed and unbilled accounts receivable, less deferred revenue related thereto. The Company does not require collateral or other securities to support customer receivables. The Company maintains a credit approval process and makes significant judgments in connection with assessing customers' ability to pay throughout the contractual obligation. Despite this assessment, from time to time, customers are unable to meet their payment obligations. The Company continuously monitors customers' credit worthiness and applies judgment in establishing a provision for estimated credit losses based on historical experience and any specific customer collection issues that have been identified.
No single customer accounted for greater than 10% of the Company’s total consolidated net service revenue for the years ended December 31, 2017, 2016 or 2015.
As of December 31, 2017, one customer accounted for 13.4% of the Company’s billed and unbilled trade accounts receivable balances. As of December 31, 2016 and 2015, no single customer accounted for greater than 10% of the Company’s billed and unbilled trade accounts receivable balance.
17. Related-Party Transactions
For the year ended December 31, 2017, the Company incurred reimbursable out-of-pocket expenses of $0.4 million for professional services obtained from a provider whose significant shareholder was also a significant shareholder of the Company. There were no material related party expenses for the years ended December 31, 2016 and 2015.
The Company recorded net service revenue of $0.5 million and $0.1 million during the years ended December 31, 2016 and 2015, respectively, from a customer who has a significant shareholder who was also a significant shareholder of the Company through August 2016. No related-party revenue was recorded for the year ended December 31, 2017.
18. Commitments and Contingencies
Legal Proceedings
Through the Merger, the Company became a party to a lawsuit initiated and outstanding against inVentiv prior to the Merger. On October 31, 2013, Cel-Sci Corporation ("Claimant") made a demand for arbitration under a Master Services Agreement (the "MSA"), dated as of April 6, 2010 between Claimant and two of the Company’s subsidiaries, inVentiv Health Clinical, LLC (formerly known as PharmaNet, LLC) and PharmaNet GmbH (currently known as inVentiv Health Switzerland GmbH and formerly known as PharmaNet AG) (collectively, "PharmaNet"). Under the MSA and related project agreement, which were terminated by Claimant in April 2013, Claimant engaged PharmaNet in connection with a Phase III Clinical Trial of its investigational drug. The arbitration claim alleges (i) breach of contract, (ii) fraud in the inducement, and (iii) common law fraud on the part of PharmaNet, and seeks damages of at least $50.0 million. In December 2013, inVentiv Health Clinical, LLC filed a counterclaim against Claimant that alleges breach of contract and seeks at least $2.0 million in damages. The matter proceeded to the discovery phase. In January 2015, inVentiv Health Clinical, LLC filed additional counterclaims against Claimant that allege (i) breach of contract, (ii) opportunistic breach, restitution and unjust enrichment, and (iii) defamation, and seek at least $2.0 million in damages and $20.0 million in other equitable remedies. The arbitration is currently underway and it is expected that the arbitrator will issue a decision in 2018. The Company continues to maintain and intends to vigorously defend its position in this matter. In the Company’s opinion, the ultimate outcome of this matter, net of liabilities accrued in the Company’s balance sheet, is not expected to have a material adverse effect on the Company’s financial position or results of operations.
Self-Insurance Reserves
The Company is self-insured for certain losses relating to health insurance claims for the majority of its employees located within the United States. Additionally, in connection with the Merger, the Company
143
assumed liabilities associated with certain self-insurance retention limits of inVentiv related to employee medical, automobile, and workers’ compensation insurance. As of December 31, 2017 and 2016, the Company had accrued self-insurance reserves of $16.6 million and $3.6 million.
Assumed Contingent Tax-Sharing Obligation
As a result of the Merger, the Company assumed contingent tax-sharing obligations arising from inVentiv’s 2016 merger with Double Eagle Parent, Inc. As of December 31, 2017, the estimated fair value of the assumed contingent tax-sharing obligation was $50.5 million (see "Note 3 - Business Combinations" for further information).
19. Quarterly Results of Operations — Unaudited
The following is a summary of the Company's consolidated quarterly results of operations for each of the fiscal years ended December 31, 2017 and 2016 (in thousands, except per share data):
Three Months Ended | |||||||||||||||
March 31, 2017 | June 30, 2017 | September 30, 2017 | December 31, 2017 | ||||||||||||
Net service revenue (a) | $ | 252,078 | $ | 258,087 | $ | 592,207 | $ | 750,471 | |||||||
Income (loss) from operations (a)(b)(c)(d) | 34,752 | 10,250 | (88,888 | ) | 15,020 | ||||||||||
Net income (loss) (a)(e)(f)(g) | 21,187 | 3,389 | (147,998 | ) | (15,047 | ) | |||||||||
Basic earnings (loss) per share (a) | $ | 0.39 | $ | 0.06 | $ | (1.70 | ) | $ | (0.14 | ) | |||||
Diluted earnings (loss) per share (a) | $ | 0.38 | $ | 0.06 | $ | (1.70 | ) | $ | (0.14 | ) | |||||
Three Months Ended | |||||||||||||||
March 31, 2016 | June 30, 2016 | September 30, 2016 | December 31, 2016 | ||||||||||||
Net service revenue | $ | 248,997 | $ | 258,804 | $ | 259,557 | $ | 262,979 | |||||||
Income from operations (b)(c) | 32,508 | 39,655 | 39,396 | 43,800 | |||||||||||
Net income (e)(f)(g) | 17,405 | 30,403 | 27,331 | 37,491 | |||||||||||
Basic earnings per share | $ | 0.32 | $ | 0.56 | $ | 0.50 | $ | 0.70 | |||||||
Diluted earnings per share | $ | 0.31 | $ | 0.54 | $ | 0.49 | $ | 0.68 | |||||||
(a) | Following the Company’s Merger with inVentiv, beginning August 1, 2017, the Company’s consolidated results of operations include results of operations of inVentiv. |
(b) | Transaction and integration-related expenses for the three months ended June 30, 2017, September 30, 2017, and December 31, 2017 were $23.7 million, $84.3 million and $15.7 million, respectively. There were no material transaction and integration-related expenses for the three months ended March 31, 2017. Transaction expenses for the three months ended March 31, 2016, June 30, 2016, September 30, 2016 and December 31, 2016 were $0.6 million, $1.2 million, $1.1 million and $0.3 million, respectively. Transaction expenses include legal fees associated with (i) corporate transactions and integration-related activities which primarily related to the Merger in 2017 (ii) the 2017 and 2016 debt agreement amendments, (iii) fair value adjustments associated with the Company's assumed contingent tax-sharing obligations; (iv) secondary stock offerings and stock repurchase activities during 2016, and (v) other corporate projects. |
(c) | Restructuring and other costs for the three months ended March 31, 2017, June 30, 2017, September 30, 2017, and December 31, 2017 were $1.9 million, $4.0 million, $6.7 million and $20.7 million, respectively. Restructuring and other costs for the three months ended March 31, 2016, June 30, 2016, September 30, 2016 and December 31, 2016 were $6.0 million, $1.4 million, $2.9 million and $3.3 million, respectively. |
(d) | Asset impairment charges were $30.0 million for the three months ended September 30, 2017. Asset impairment charges related to the impairment of the INC Research tradename in connection with the Company's merger-related rebranding. |
(e) | During the three months ended September 30, 2017 and December 31, 2017, the Company recorded a loss on extinguishment of debt of $0.1 million and $0.5 million, respectively, associated with the 2017 Credit Agreement |
144
amendments and refinancing. During the three months ended September 30, 2016, the Company recorded a loss on extinguishment of debt of $0.4 million associated with the 2016 Credit Agreement and debt refinancing.
(f) | During the three months ended December 31, 2017, the Company's income tax expense included a charge of $94.4 million as a result of the Tax Act. During the three months ended December 2016, the Company determined that certain valuation allowances were no longer required and recorded an income tax benefit related to the release of valuation allowances totaling $3.4 million. See "Note 12 - Income Taxes" for additional information. |
(g) | During the three months ended December 31, 2017 and 2016, the Company determined that it qualified for additional research and development tax credits in certain international locations for expenses incurred during 2017 and 2016 and as a result recorded a $3.6 million and $2.5 million reduction of direct costs, respectively. |
Item 9. Changes in and Disagreements with Accountants on Accounting and Financial Disclosure.
None.
Item 9A. Controls and Procedures.
Evaluation of Disclosure Controls and Procedures
As required by Rule 13a-15(b) under the Exchange Act, we carried out an evaluation under the supervision and with the participation of our management, including our CEO and CFO, of the effectiveness of the design and operation of our disclosure controls and procedures (as defined in Rules 13a-15(e) and 15d-15(e) under the Exchange Act). There are inherent limitations to the effectiveness of any system of disclosure controls and procedures, including the possibility of human error and the circumvention or overriding of the controls and procedures. Accordingly, even effective disclosure controls and procedures can only provide reasonable assurance of achieving their control objectives. Based upon their evaluation, our CEO and CFO concluded that our disclosure controls and procedures were effective to provide reasonable assurance that information required to be disclosed by us in the reports that we file or submit under the Exchange Act is recorded, processed, summarized and reported within the time periods specified in the applicable rules and forms, and that it is accumulated and communicated to our management, including our CEO and CFO, as appropriate, to allow timely decisions regarding required disclosure.
Changes in Internal Control Over Financial Reporting
During the quarter ended December 31, 2017, we implemented a plan that called for modifications and additions to internal control over financial reporting related to the accounting for revenue as a result of the new revenue recognition standard. The modified and new controls have been designed to address risks associated with recognizing revenue under the new standard. We have therefore augmented our internal control over financial reporting as follows:
• | Enhanced the risk assessment process to take into account risks associated with the new revenue standard. |
• | Added controls that address risks associated with the five-step model for recording revenue, including the revision of our contract review controls. |
There have been no other changes in our internal control over financial reporting (as defined in Rules 13a-15(f) and 15d-15(f) under the Exchange Act) during the quarter ended December 31, 2017 that has materially affected, or is reasonably likely to materially affect, our internal control over financial reporting.
Management's Annual Report on Internal Control Over Financial Reporting
The management of Syneos Health, Inc. (the “Company”) is responsible for establishing and maintaining adequate internal control over financial reporting. Internal control over financial reporting is a process designed to provide reasonable assurance regarding the reliability of financial reporting and the preparation of financial statements for external purposes in accordance with generally accepted accounting principles. A company’s internal control over financial reporting includes those policies and procedures that pertain to the
145
maintenance of records that, in reasonable detail, accurately and fairly reflect the transactions and dispositions of the assets of the company; provide reasonable assurance that transactions are recorded as necessary to permit preparation of financial statements in accordance with generally accepted accounting principles in the United States of America, and that receipts and expenditures of the company are being made only in accordance with authorizations of management and directors of the company; and provide reasonable assurance regarding prevention or timely detection of unauthorized acquisition, use, or disposition of the company’s assets that could have a material effect on the financial statements.
Because of its inherent limitations, internal control over financial reporting might not prevent or detect misstatements. Also, projections of any evaluation of effectiveness to future periods are subject to the risk that controls may become inadequate because of changes in conditions, or that the degree of compliance with the policies or procedures may deteriorate.
Management assessed the effectiveness of the Company’s internal control over financial reporting as of December 31, 2017. In making this assessment, management used the framework established in the Internal Control-Integrated Framework issued in 2013 by the Committee of Sponsoring Organizations of the Treadway Commission (“COSO”). As a result of this assessment and based on the criteria in the COSO framework, management has concluded that, as of December 31, 2017, the Company’s internal control over financial reporting was effective.
As previously noted, we completed the Merger with inVentiv during the third quarter of 2017. Management considers this transaction to be material to our consolidated financial statements and believes that the internal controls and procedures of inVentiv have a material effect on our internal control over financial reporting. We are currently in the process of incorporating the internal controls and procedures of inVentiv into our internal controls over financial reporting and extending our Section 404 compliance program under the Sarbanes-Oxley Act of 2002 and the applicable rules and regulations under such Act to include inVentiv. We will report on our assessment of the consolidated operations within the time period provided by the Act and the applicable SEC rules and regulations concerning business combinations, which is the annual management report for the fiscal year ending December 31, 2018. inVentiv’s total assets (excluding goodwill which was included in management’s assessment of internal control over financial reporting as of December 31, 2017), and total revenues represented approximately 30% and 41%, respectively, of the related consolidated financial statement amounts as of and for the year ended December 31, 2017.
The effectiveness of the Company’s internal control over financial reporting as of December 31, 2017 has been audited by Deloitte & Touche LLP, an independent registered public accounting firm, as stated in their report which appears herein.
Item 9B. Other Information.
None.
146
PART III
Item 10. Directors, Executive Officers and Corporate Governance.
Pursuant to General Instruction G(3) on Form 10-K, information required by this Item concerning our directors and corporate governance is incorporated by reference from the sections captioned “Election of Directors” and “Corporate Governance Matters” contained in our 2018 Proxy Statement related to Our Annual Meeting of Stockholders which we intend to file with the SEC within 120 days of the end of our fiscal year.
We have adopted a code of business conduct and ethics relating to the conduct of our business by all of our employees, officers, and directors, as well as a code of ethics specifically for our principal executive officer and senior financial officers. Each of these policies is posted on our website: www.syneoshealth.com.
The information required by this Item concerning our executive officers is set forth at the end of Part I, Item 1, "Business" in this Annual Report on Form 10-K.
The information required by this Item concerning compliance with Section 16(a) of the United States Securities Exchange Act of 1934, as amended, is incorporated by reference from the section of the 2018 Proxy Statement captioned “Section 16(a) Beneficial Ownership Reporting Compliance.”
Item 11. Executive Compensation.
The information required by this Item is incorporated by reference to the information under the sections captioned “Executive Compensation and Other Matters” and “Director Compensation for Fiscal year 2017” in the 2018 Proxy Statement.
Item 12. Security Ownership of Certain Beneficial Owners and Management and Related Stockholder Matters.
The following table sets forth the indicated information as of December 31, 2017 with respect to our equity compensation plans approved by security holders:
Plan Description | Number of securities to be issued upon exercise of outstanding options, warrants and rights | Weighted-average exercise price of outstanding options, warrants and rights | Number of securities remaining available for future issuance under equity compensation plans | |||||||
2016 Employee Stock Purchase Plan | — | $ | — | 874,026 | ||||||
2014 Equity Incentive Plan | 586,217 | $ | 12.29 | 2,455,372 | ||||||
2010 Equity Incentive Plan | 601,880 | $ | 41.57 | — | ||||||
2016 Omnibus Equity Incentive Plan | 1,329,408 | $ | 29.98 | — | ||||||
Total | 2,517,505 | 3,329,398 | ||||||||
Our equity compensation plans consist of the 2016 Employee Stock Purchase Plan, the 2014 Equity Incentive Plan, the 2010 Equity Incentive Plan, and the 2016 Omnibus Equity Incentive Plan, which were approved by our shareholders. We do not have any equity compensation plans or arrangements that have not been approved by our shareholders.
Information regarding security ownership and securities authorized for issuance under equity compensation plans required by this Item is incorporated by reference to the information under the section captioned “Security Ownership of Certain Beneficial Owners and Management” in the 2018 Proxy Statement.
147
Item 13. Certain Relationships and Related Transactions and Director Independence.
The information required by this Item is incorporated by reference to the information under the section captioned “Transactions With Related Persons” and “Corporate Governance Matters” in the 2018 Proxy Statement.
Item 14. Principal Accounting Fees and Services.
The information required by this Item is incorporated by reference to the information under the section captioned “Audit Committee Report” in the 2018 Proxy Statement.
148
PART IV
Item 15. Exhibits and Financial Statement Schedules.
(a) The following documents are filed as part of this report:
(1) Financial Statements
The financial statements and report of the independent registered public accounting firm are filed as part of this Annual Report (see "Index to Consolidated Financial Statements" at Item 8).
(2) Financial Statement Schedules
The financial statements schedules are omitted because they are not applicable or the required information is shown in the consolidated financial statements or notes thereto.
149
(b) Exhibits
Incorporated by Reference (Unless Otherwise Indicated) | ||||||
Exhibit Number | Exhibit Description | Form | File No. | Exhibit | Filing Date | |
2.1 | 8-K | 001-36730 | 2.1 | May 10, 2017 | ||
3.1 | 8-K | 001-36730 | 3.1 | August 1, 2017 | ||
3.2 | 8-K | 001-36730 | 3.1 | January 8, 2018 | ||
3.3 | 8-K | 001-36730 | 3.2 | January 8, 2018 | ||
4.1 | S-1/A | 333-199178 | 4.1 | October 27, 2014 | ||
4.2 | 8-K | 001-36730 | 4.2 | November 13, 2014 | ||
4.3 | 8-K | 001-36730 | 10.1 | August 9, 2017 | ||
4.4 | 8-K | 001-36730 | 10.2 | August 9, 2017 | ||
10.3.1# | S-1 | 333-199178 | 10.3.1 | October 6, 2014 | ||
10.3.2# | S-1 | 333-199178 | 10.3.2 | October 6, 2014 | ||
10.3.3# | S-1 | 333-199178 | 10.3.3 | October 6, 2014 | ||
10.4# | S-1 | 333-199178 | 10.4 | October 6, 2014 | ||
10.6# | S-1/A | 333-199178 | 10.6 | October 17, 2014 | ||
10.7# | S-1 | 333-199178 | 10.7 | October 6, 2014 | ||
10.8# | S-1 | 333-199178 | 10.8 | October 6, 2014 | ||
10.9.1 | S-1 | 333-199178 | 10.9.1 | October 6, 2014 | ||
10.9.2 | S-1 | 333-199178 | 10.9.2 | October 6, 2014 | ||
10.9.3 | S-1 | 333-199178 | 10.9.3 | October 6, 2014 | ||
10.9.4 | S-1 | 333-199178 | 10.9.4 | October 6, 2014 | ||
10.10# | S-1 | 333-199178 | 10.10 | October 6, 2014 | ||
150
10.11.1# | S-1 | 333-199178 | 10.11 | October 6, 2014 | ||
10.11.2# | 8-K | 001-36730 | 10.1 | January 3, 2018 | ||
10.12.1# | S-1 | 333-199178 | 10.12 | October 6, 2014 | ||
10.12.2# | 10-Q | 001-36730 | 10.1 | April 27, 2015 | ||
10.13# | S-1 | 333-199178 | 10.13 | October 6, 2014 | ||
10.14# | S-1/A | 333-199178 | 10.14 | October 17, 2014 | ||
10.15# | S-1/A | 333-199178 | 10.15 | October 17, 2014 | ||
10.16# | S-1/A | 333-199178 | 10.16 | October 27, 2014 | ||
10.17# | S-1/A | 333-199178 | 10.17 | October 17, 2014 | ||
10.18# | 10-Q | 001-36730 | 10.1 | October 29, 2015 | ||
10.19# | 10-Q | 001-36730 | 10.2 | October 29, 2015 | ||
10.20# | 10-Q | 001-36730 | 10.3 | October 29, 2015 | ||
10.21# | 10-Q | 001-36730 | 10.4 | October 29, 2015 | ||
10.22# | 10-Q | 001-36730 | 10.5 | October 29, 2015 | ||
10.23# | 10-Q | 001-36730 | 10.6 | October 29, 2015 | ||
10.24# | 10-K | 001-36730 | 10.29 | February 25, 2016 | ||
10.25# | 10-Q | 001-36730 | 10.1 | May 2, 2016 | ||
10.26# | 10-Q | 001-36730 | 10.2 | May 2, 2016 | ||
10.27# | S-8 | 333-212154 | 4.3 | June 21, 2016 | ||
10.28# | S-8 | 333-212154 | 4.4 | June 21, 2016 | ||
10.29# | 8-K | 001-36730 | 10.1 | July 28, 2016 | ||
10.30# | 8-K | 001-36730 | 10.2 | July 28, 2016 | ||
151
10.31# | 8-K | 001-36730 | 10.3 | July 28, 2016 | ||
10.32# | 8-K | 001-36730 | 10.4 | July 28, 2016 | ||
10.33 | 8-K | 001-36730 | 10.1 | August 18, 2016 | ||
10.34 | 8-K | 001-36730 | 10.1 | August 31, 2016 | ||
10.35# | 8-K | 001-36730 | 10.1 | September 15, 2016 | ||
10.36# | 8-K | 001-36730 | 10.2 | September 15, 2016 | ||
10.37# | 10-Q | 001-36730 | 10.8 | October 31, 2016 | ||
10.38# | 8-K | 001-36730 | 10.1 | April 6, 2017 | ||
10.39# | 10-Q | 001-36730 | 10.1 | May 10, 2017 | ||
10.40# | 10-Q | 001-36730 | 10.2 | May 10, 2017 | ||
10.41# | 10-Q | 001-36730 | 10.3 | May 10, 2017 | ||
10.42 | 8-K | 001-36730 | 10.1 | May 10, 2017 | ||
10.43 | 8-K | 001-36730 | 10.2 | May 10, 2017 | ||
10.44 | 8-K | 001-36730 | 10.3 | May 10, 2017 | ||
10.45 | 8-K | 001-36730 | 10.4 | May 10, 2017 | ||
10.46# | S-4/A | 333-197719 | 10.18 | February 10, 2015 | ||
10.47# | 8-K | 001-36730 | 10.5 | May 10, 2017 | ||
10.48# | 8-K | 001-36730 | 10.1 | December 7, 2017 | ||
10.49 | 8-K | 001-36730 | 10.1 | August 1, 2017 | ||
152
10.50# | 8-K | 001-36730 | 10.1 | November 17, 2017 | ||
10.51# | S-8 | 333-219607 | 4.3 | August 1, 2017 | ||
21.1 | — | — | — | Filed herewith | ||
23.1 | — | — | — | Filed herewith | ||
23.2 | — | — | — | Filed herewith | ||
31.1 | — | — | — | Filed herewith | ||
31.2 | — | — | — | Filed herewith | ||
32.1 | — | — | — | Furnished herewith | ||
32.2 | — | — | — | Furnished herewith | ||
101.INS | XBRL Instance Document. | — | — | — | Furnished herewith | |
101.SCH | XBRL Taxonomy Extension Schema Document. | — | — | — | Furnished herewith | |
101.CAL | XBRL Taxonomy Extension Calculation Linkbase Document. | — | — | — | Furnished herewith | |
101.DEF | XBRL Taxonomy Extension Definition Linkbase Document. | — | — | — | Furnished herewith | |
101.LAB | XBRL Taxonomy Extension Label Linkbase Document. | — | — | — | Furnished herewith | |
101.PRE | Taxonomy Extension Presentation Linkbase Document. | — | — | — | Furnished herewith | |
# Denotes management contract or compensatory plan.
153
SIGNATURES
Pursuant to the requirements of Section 13 or 15(d) of the Securities Exchange Act of 1934, the registrant has duly caused this report to be signed on its behalf by the undersigned, thereunto duly authorized.
Syneos Health, Inc. | ||||||
By: | /s/ Alistair Macdonald | |||||
Name: | Alistair Macdonald | |||||
Title: | Chief Executive Officer (Principal Executive Officer) and Director | |||||
Date: | February 28, 2018 | |||||
Pursuant to the requirements of the Securities Exchange Act of 1934, this report has been signed below by the following persons on behalf of the registrant in the capacities and on the dates indicated.
Signature | Title | Date | ||||
/s/ Alistair Macdonald | Chief Executive Officer (Principal Executive Officer) and Director | February 28, 2018 | ||||
Alistair Macdonald | ||||||
/s/ Jason Meggs | Executive Vice President and Interim Chief Financial Officer (Principal Financial and Accounting Officer) | February 28, 2018 | ||||
Jason Meggs | ||||||
/s/ Michael Bell | Chairman and Director | February 28, 2018 | ||||
Michael Bell | ||||||
/s/ Todd Abbrecht | Director | February 28, 2018 | ||||
Todd Abbrecht | ||||||
/s/ Thomas Allen | Director | February 28, 2018 | ||||
Thomas Allen | ||||||
/s/ Linda Harty | Director | February 28, 2018 | ||||
Linda Harty | ||||||
/s/ William E. Klitgaard | Director | February 28, 2018 | ||||
William E. Klitgaard | ||||||
/s/ John Maldonado | Director | February 28, 2018 | ||||
John Maldonado | ||||||
/s/ Kenneth F. Meyers | Director | February 28, 2018 | ||||
Kenneth F. Meyers | ||||||
/s/ Matthew E. Monaghan | Director | February 28, 2018 | ||||
Matthew E. Monaghan | ||||||
/s/ Joshua M. Nelson | Director | February 28, 2018 | ||||
Joshua M. Nelson | ||||||
154
EXHIBIT INDEX
Incorporated by Reference (Unless Otherwise Indicated) | ||||||
Exhibit Number | Exhibit Description | Form | File No. | Exhibit | Filing Date | |
2.1 | Agreement and Plan of Merger, dated as of May 10, 2017, by and between Double Eagle Parent, Inc. and INC Research Holdings, Inc. | 8-K | 001-36730 | 2.1 | May 10, 2017 | |
3.1 | Certificate of Incorporation of INC Research Holdings, Inc. | 8-K | 001-36730 | 3.1 | August 1, 2017 | |
3.2 | Certificate of Amendment of Certificate of Incorporation of Syneos Health, Inc. | 8-K | 001-36730 | 3.1 | January 8, 2018 | |
3.3 | Amended and Restated Bylaws of Syneos Health, Inc. | 8-K | 001-36730 | 3.2 | January 8, 2018 | |
4.1 | Specimen Certificate for Class A Common Stock. | S-1/A | 333-199178 | 4.1 | October 27, 2014 | |
4.2 | Second Amended and Restated Stockholders Agreement, dated as of November 6, 2014, among INC Research Holdings, Inc. and certain stockholders named therein. | 8-K | 001-36730 | 4.2 | November 13, 2014 | |
4.3 | Second Supplemental Indenture, dated as of August 7, 2017, among INC Research Holdings, Inc., inVentiv Health, Inc., inVentiv Health Clinical, Inc., the guarantors party thereto and Wilmington Trust, National Association, as trustee. | 8-K | 001-36730 | 10.1 | August 9, 2017 | |
4.4 | Indenture, dated as of October 14, 2016, among Double Eagle Acquisition Sub, Inc., the guarantors party thereto and Wilmington Trust, National Association, as trustee. | 8-K | 001-36730 | 10.2 | August 9, 2017 | |
10.3.1# | Triangle Acquisition Holdings, Inc. 2010 Equity Incentive Plan. | S-1 | 333-199178 | 10.3.1 | October 6, 2014 | |
10.3.2# | Amendment No. 1 to INC Research Holdings, Inc. 2010 Equity Incentive Plan. | S-1 | 333-199178 | 10.3.2 | October 6, 2014 | |
10.3.3# | Amendment No. 2 to INC Research Holdings, Inc. 2010 Equity Incentive Plan. | S-1 | 333-199178 | 10.3.3 | October 6, 2014 | |
10.4# | Form of Nonqualified Stock Option Award Agreement under INC Research Holdings, Inc. 2010 Equity Incentive Plan. | S-1 | 333-199178 | 10.4 | October 6, 2014 | |
10.6# | Form of Stock Option Award Agreement for U.S. Participants under INC Research Holdings, Inc. 2014 Equity Incentive Plan. | S-1/A | 333-199178 | 10.6 | October 17, 2014 | |
10.7# | 2013 Management Incentive Plan. | S-1 | 333-199178 | 10.7 | October 6, 2014 | |
10.8# | Form of Management Incentive Plan. | S-1 | 333-199178 | 10.8 | October 6, 2014 | |
10.9.1 | Lease, dated May 6, 2010, by and between Highwoods Realty Limited Partnership and INC Research, Inc. | S-1 | 333-199178 | 10.9.1 | October 6, 2014 | |
10.9.2 | Lease Amendment Number One, dated August 26, 2010, by and between Highwoods Realty Limited Partnership and INC Research, Inc. | S-1 | 333-199178 | 10.9.2 | October 6, 2014 | |
10.9.3 | Lease Amendment Number Two, dated August 23, 2011, by and between Highwoods Realty Limited Partnership and INC Research, LLC. | S-1 | 333-199178 | 10.9.3 | October 6, 2014 | |
10.9.4 | Lease Amendment Number Three, dated January 4, 2013, by and between Highwoods Realty Limited Partnership and INC Research, LLC. | S-1 | 333-199178 | 10.9.4 | October 6, 2014 | |
10.10# | Executive Employment Agreement, effective as of July 31, 2014, by and between INC Research, LLC and Duncan Jamie Macdonald. | S-1 | 333-199178 | 10.10 | October 6, 2014 | |
10.11.1# | Executive Employment Agreement, effective as of August 5, 2013, by and between INC Research, LLC and Greg S. Rush. | S-1 | 333-199178 | 10.11 | October 6, 2014 | |
155
10.11.2# | Letter Agreement, dated January 3, 2018, between Syneos Health, Inc. and Gregory S. Rush | 8-K | 001-36730 | 10.1 | January 3, 2018 | |
10.12.1# | Executive Service Agreement, dated July 31, 2014, by and between INC Research Holdings Limited and Alistair Macdonald. | S-1 | 333-199178 | 10.12 | October 6, 2014 | |
10.12.2# | Amendment Two to the Executive Service Agreement, effective as of January 1, 2015, by and between INC Research Holdings Limited and Alistair Macdonald. | 10-Q | 001-36730 | 10.1 | April 27, 2015 | |
10.13# | Executive Employment Agreement, effective as of July 31, 2014, by and between INC Research, LLC and Christopher L. Gaenzle. | S-1 | 333-199178 | 10.13 | October 6, 2014 | |
10.14# | Form of Restricted Stock Award Agreement under INC Research Holdings, Inc. 2014 Equity Incentive Plan. | S-1/A | 333-199178 | 10.14 | October 17, 2014 | |
10.15# | Form of Stock Option Award Agreement for Non-U.S. Participant under INC Research Holdings, Inc. 2014 Equity Incentive Plan. | S-1/A | 333-199178 | 10.15 | October 17, 2014 | |
10.16# | Form of 2010 Equity Incentive Plan Stock Option Adjustment Letter. | S-1/A | 333-199178 | 10.16 | October 27, 2014 | |
10.17# | Form of 2010 Equity Incentive Plan Stock Option Amendment Letter. | S-1/A | 333-199178 | 10.17 | October 17, 2014 | |
10.18# | Form of Stock Option Award Agreement for U.S. Participants under INC Research Holdings, Inc. 2014 Equity Incentive Plan. | 10-Q | 001-36730 | 10.1 | October 29, 2015 | |
10.19# | Form of Stock Option Award Agreement for Non-U.S. Participants under INC Research Holdings, Inc. 2014 Equity Incentive Plan. | 10-Q | 001-36730 | 10.2 | October 29, 2015 | |
10.20# | Form of Stock Option Award Agreement for U.S. Participants under INC Research Holdings, Inc. 2014 Equity Incentive Plan. | 10-Q | 001-36730 | 10.3 | October 29, 2015 | |
10.21# | Form of Restricted Stock Unit Award Agreement for U.S. Participants under INC Research Holdings, Inc. 2014 Equity Incentive Plan. | 10-Q | 001-36730 | 10.4 | October 29, 2015 | |
10.22# | Form of Restricted Stock Unit Award Agreement for Non-U.S. Participants under INC Research Holdings, Inc. 2014 Equity Incentive Plan. | 10-Q | 001-36730 | 10.5 | October 29, 2015 | |
10.23# | Form of Restricted Stock Unit Award Agreement for U.S. Participants under INC Research Holdings, Inc. 2014 Equity Incentive Plan. | 10-Q | 001-36730 | 10.6 | October 29, 2015 | |
10.24# | Executive Employment Agreement, effective as of July 31, 2014, by and between INC Research, LLC and Michael Gibertini. | 10-K | 001-36730 | 10.29 | February 25, 2016 | |
10.25# | Form of Performance Restricted Stock Unit Award Agreement for U.S. Participants under INC Research Holdings, Inc. 2014 Equity Incentive Plan. | 10-Q | 001-36730 | 10.1 | May 2, 2016 | |
10.26# | Form of Performance Restricted Stock Unit Award Agreement for Non-U.S. Participants under INC Research Holdings, Inc. 2014 Equity Incentive Plan. | 10-Q | 001-36730 | 10.2 | May 2, 2016 | |
10.27# | INC Research Holdings, Inc. 2016 Employee Stock Purchase Plan. | S-8 | 333-212154 | 4.3 | June 21, 2016 | |
10.28# | INC Research Holdings, Inc. 2014 Equity Incentive Plan, as Amended and Restated. | S-8 | 333-212154 | 4.4 | June 21, 2016 | |
10.29# | Transition Agreement, by and among Duncan Jamie Macdonald, INC Research, LLC and INC Research Holdings, Inc. entered into as of July 27, 2016. | 8-K | 001-36730 | 10.1 | July 28, 2016 | |
10.30# | Executive Service Agreement, by and between INC Research Holding Limited and Alistair Macdonald, dated July 27, 2016. | 8-K | 001-36730 | 10.2 | July 28, 2016 | |
10.31# | Letter Agreement, by and between INC Research Holdings Limited and Alistair Macdonald, dated July 27, 2016. | 8-K | 001-36730 | 10.3 | July 28, 2016 | |
156
10.32# | Letter Agreement, by and between INC Research Holdings, Inc. and Alistair Macdonald, dated July 27, 2016. | 8-K | 001-36730 | 10.4 | July 28, 2016 | |
10.33 | Stock Repurchase Agreement, dated August 12, 2016, by and between INC Research Holdings, Inc. and certain stockholders named therein. | 8-K | 001-36730 | 10.1 | August 18, 2016 | |
10.34 | First Amendment to Credit Agreement and Increase Revolving Joinder, dated August 31, 2016, among INC Research, LLC, as the Borrower, INC Research Holdings, Inc., Subsidiary Guarantors, lenders party to the Credit Agreement, dated May 14, 2015, and Wells Fargo Bank, National Association, as Administrative Agent. | 8-K | 001-36730 | 10.1 | August 31, 2016 | |
10.35# | Form of Retention Agreement for Participants. | 8-K | 001-36730 | 10.1 | September 15, 2016 | |
10.36# | INC Research Holdings, Inc. Executive Severance Plan adopted September 15, 2016. | 8-K | 001-36730 | 10.2 | September 15, 2016 | |
10.37# | Form of Restricted Stock Unit Award Agreement under INC Research Holdings, Inc. 2014 Equity Incentive Plan. | 10-Q | 001-36730 | 10.8 | October 31, 2016 | |
10.38# | Amendment One to the Executive Service Agreement, made as of April 1, 2017, between INC Research Holdings Limited and Alistair Macdonald. | 8-K | 001-36730 | 10.1 | April 6, 2017 | |
10.39# | Form of Global Restricted Stock Unit Award Agreement under INC Research Holdings, Inc. 2014 Equity Incentive Plan, as Amended and Restated. | 10-Q | 001-36730 | 10.1 | May 10, 2017 | |
10.40# | Form of Global Performance Restricted Stock Unit Award Agreement under INC Research Holdings, Inc. 2014 Equity Incentive Plan, as Amended and Restated. | 10-Q | 001-36730 | 10.2 | May 10, 2017 | |
10.41# | Form of Restricted Stock Unit Award Agreement for Non-Employee Directors under INC Research Holdings, Inc. 2014 Equity Incentive Plan, as Amended and Restated. | 10-Q | 001-36730 | 10.3 | May 10, 2017 | |
10.42 | Voting Agreement, dated as of May 10, 2017, by and among Double Eagle Parent, Inc., INC Research Holdings, Inc. and Stockholders listed therein. | 8-K | 001-36730 | 10.1 | May 10, 2017 | |
10.43 | Voting Agreement, dated as of May 10, 2017, by and among Double Eagle Parent, Inc., INC Research Holdings, Inc. and Stockholders listed therein. | 8-K | 001-36730 | 10.2 | May 10, 2017 | |
10.44 | Stockholders’ Agreement, dated as of May 10, 2017, by and among INC Research Holdings, Inc. and the stockholders party thereto. | 8-K | 001-36730 | 10.3 | May 10, 2017 | |
10.45 | Stockholders’ Agreement, dated as of May 10, 2017, by and among INC Research Holdings, Inc. and the stockholders party thereto. | 8-K | 001-36730 | 10.4 | May 10, 2017 | |
10.46# | Employment, Severance and Non-Competition Agreement, effective as of September 24, 2014, between Michael Bell and inVentiv Health, Inc. | S-4/A | 333-197719 | 10.18 | February 10, 2015 | |
10.47# | Letter Agreement, dated May 10, 2017, by and among INC Research Holdings, Inc., inVentiv Health, Inc. and Michael A. Bell. | 8-K | 001-36730 | 10.5 | May 10, 2017 | |
10.48# | Letter Agreement, dated December 5, 2017, by and among INC Research Holdings, Inc. and Michael A. Bell. | 8-K | 001-36730 | 10.1 | December 7, 2017 | |
10.49 | Credit Agreement, dated as of August 1, 2017, among INC Research Holdings, Inc., the Administrative Borrower, other Borrowers party thereto, the financial institution party thereto as lenders party thereto, Credit Suisse AG, as Administrative Agent, and each of the other parties as Joint Lead Arrangers and Joint Bookrunners party thereto. | 8-K | 001-36730 | 10.1 | August 1, 2017 | |
10.50# | Letter Agreement, dated November 13, 2017, by and among INC Research Holdings, Inc. and Michael Gibertini, Ph.D. | 8-K | 001-36730 | 10.1 | November 17, 2017 | |
10.51# | Double Eagle Parent, Inc. 2016 Omnibus Equity Incentive Plan. | S-8 | 333-219607 | 4.3 | August 1, 2017 | |
157
21.1 | List of Significant Subsidiaries of the Registrant. | — | — | — | Filed herewith | |
23.1 | Consent of Ernst & Young LLP. | — | — | — | Filed herewith | |
23.2 | Consent of Deloitte & Touche LLP. | — | — | — | Filed herewith | |
31.1 | Certification of Chief Executive Officer pursuant to Section 302 of the Sarbanes-Oxley Act of 2002. | — | — | — | Filed herewith | |
31.2 | Certification of Executive Vice President and Interim Chief Financial Officer pursuant to Section 302 of the Sarbanes-Oxley Act of 2002. | — | — | — | Filed herewith | |
32.1 | Certification of Chief Executive Officer pursuant to Section 906 of the Sarbanes-Oxley Act of 2002. | — | — | — | Furnished herewith | |
32.2 | Certification of Executive Vice President and Interim Chief Financial Officer pursuant to Section 906 of the Sarbanes-Oxley Act of 2002. | — | — | — | Furnished herewith | |
101.INS | XBRL Instance Document. | — | — | — | Furnished herewith | |
101.SCH | XBRL Taxonomy Extension Schema Document. | — | — | — | Furnished herewith | |
101.CAL | XBRL Taxonomy Extension Calculation Linkbase Document. | — | — | — | Furnished herewith | |
101.DEF | XBRL Taxonomy Extension Definition Linkbase Document. | — | — | — | Furnished herewith | |
101.LAB | XBRL Taxonomy Extension Label Linkbase Document. | — | — | — | Furnished herewith | |
101.PRE | Taxonomy Extension Presentation Linkbase Document. | — | — | — | Furnished herewith | |
# Denotes management contract or compensatory plan.
158