Attached files
| file | filename |
|---|---|
| 8-K - FORM 8-K - Bluerock Residential Growth REIT, Inc. | tm212719d1_8k.htm |
Exhibit 99.1
January 2021
2 Forward - Looking Statements The information in this presentation has been prepared solely for informational purposes by Bluerock Residential Growth REIT, Inc . (“BRG”) and does not constitute an offer to sell or the solicitation of an offer to purchase any securities . This presentation is not, and should not be assumed to be, complete . This presentation has been prepared to assist interested parties in making their own evaluation of BRG and does not purport to contain all of the information that may be relevant . In all cases, interested parties should conduct their own investigation and analysis of BRG and the data set forth in this presentation and other information provided by or on behalf of BRG . In addition, certain of the information contained herein may be derived from information provided by industry sources . BRG believes that such information is accurate and that the sources from which it has been obtained are reliable . BRG cannot guarantee the accuracy of such information, however, and has not independently verified such information . The information presented herein remains subject to change . Statements in this presentation are made as of the date of this presentation unless stated otherwise . This presentation also contains statements that, to the extent they are not recitations of historical fact, constitute “forward - looking statements . ” Forward - looking statements are typically identified by the use of terms such as “may,” “should,” “expect,” “could,” “intend,” “plan,” “anticipate,” “estimate,” “believe,” “continue,” “predict,” “potential” or the negative of such terms and other comparable terminology . The forward - looking statements included herein are based upon BRG’s current expectations, plans, estimates, assumptions and beliefs that involve numerous risks and uncertainties . Assumptions relating to the foregoing involve judgments with respect to, among other things, future economic, competitive and market conditions and future business decisions, all of which are difficult or impossible to predict accurately and many of which are beyond BRG’s control . Although BRG believes that the expectations reflected in such forward - looking statements are based on reasonable assumptions, BRG’s actual results and performance and the value of its securities could differ materially from those set forth in the forward - looking statements due to the impact of many factors . Currently, one of the most significant factors, however, is the potential adverse effect of the current pandemic of the novel coronavirus (“COVID - 19 ”) on the financial condition, results of operations, cash flows and performance of the Company and its tenants of our properties, business partners within our network and service providers, as well as the real estate market and the global economy and financial markets . The extent to which COVID - 19 impacts the Company and its tenants will depend on future developments, which are highly uncertain and cannot be predicted with confidence, including the scope, severity and duration of the pandemic, the actions taken to contain the pandemic or mitigate its impact (including governmental actions that may vary by jurisdiction, such as mandated business closing ; “stay - at - home” orders ; limits on group activity ; and actions to protect residential tenants from eviction), and the direct and indirect economic effects of the pandemic and containment measures, among others . Other factors include, but are not limited to, the uncertainties of real estate development, acquisition and disposition activity, the ability of our joint venture partners to satisfy their obligations, the costs and availability of financing, the effects of local economic and market conditions, the effects of acquisitions and dispositions, the impact of newly adopted accounting principles on BRG’s accounting policies and on period - to - period comparisons of financial results, regulatory changes and other risks and uncertainties detailed in the “Risk Factors” in Item 1 . A . Risk Factors section of the Company’s Annual Report on Form 10 - K filed with the U . S . Securities and Exchange Commission on February 24 , 2020 , and other discussions of risk factors contained in BRG’s periodic filings . BRG claims the safe harbor protection for forward looking statements contained in the Private Securities Litigation Reform Act of 1995 . BRG undertakes no obligation to update or revise any such information for any reason after the date of this presentation, unless required by law .
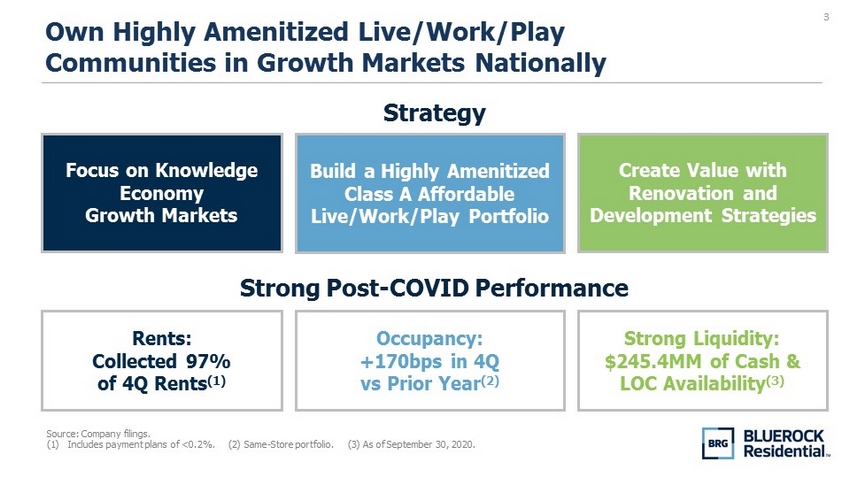
3 Own Highly Amenitized Live/Work/Play Communities in Growth Markets Nationally Create Value with Renovation and Development Strategies Focus on Knowledge Economy Growth Markets Build a Highly Amenitized Class A Affordable Live/Work/Play Portfolio Strategy Strong Liquidity: $245.4MM of Cash & LOC Availability (3) Rents: Collected 97% of 4Q Rents (1) Occupancy: +170bps in 4Q vs Prior Year (2) Strong Post - COVID Performance Source: Company filings. (1) Includes payment plans of <0.2%. (2) Same - Store portfolio. (3) As of September 30, 2020.
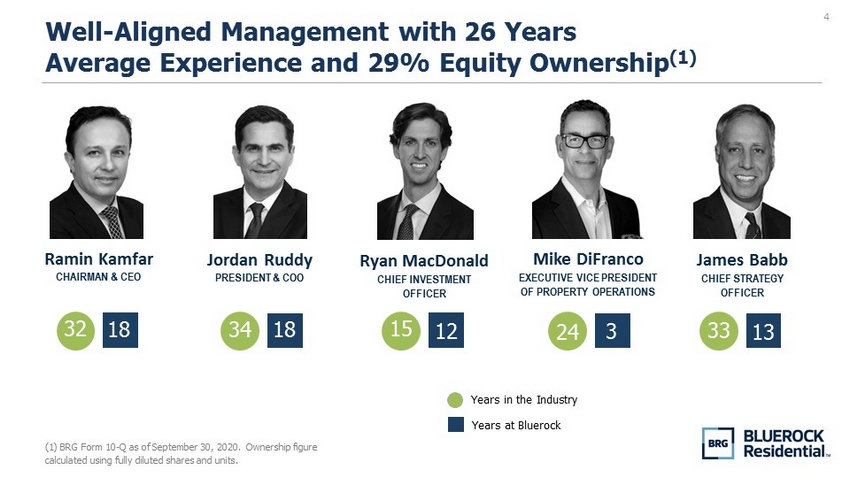
4 Well - Aligned Management with 26 Years Average Experience and 29% Equity Ownership (1) (1) BRG Form 10 - Q as of September 30, 2020. Ownership figure calculated using fully diluted shares and units. 32 18 Ramin Kamfar CHAIRMAN & CEO Jordan Ruddy PRESIDENT & COO 34 18 Ryan MacDonald CHIEF INVESTMENT OFFICER 15 12 Mike DiFranco EXECUTIVE VICE PRESIDENT OF PROPERTY OPERATIONS 24 3 James Babb CHIEF STRATEGY OFFICER 33 13 Years at Bluerock Years in the Industry
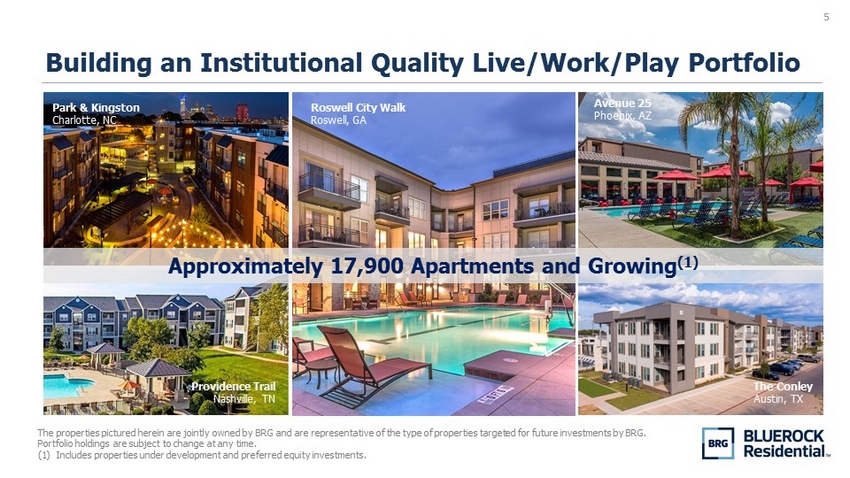
5 Building an Institutional Quality Live/Work/Play Portfolio The properties pictured herein are jointly owned by BRG and are representative of the type of properties targeted for future inv estments by BRG. Portfolio holdings are subject to change at any time. (1) Includes properties under development and preferred equity investments. Park & Kingston Charlotte, NC Providence Trail Nashville, TN Roswell City Walk Roswell, GA Avenue 25 Phoenix, AZ Approximately 17,900 Apartments and Growing (1) The Conley Austin, TX
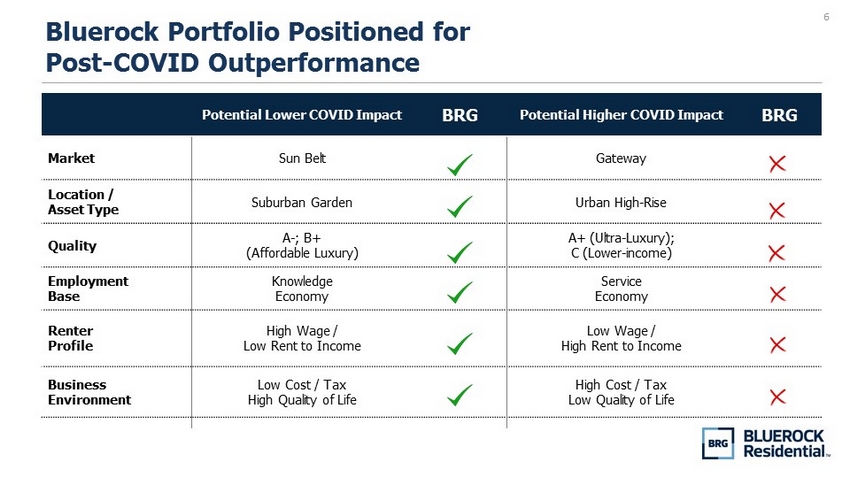
6 Bluerock Portfolio Positioned for Post - COVID Outperformance Potential Lower COVID Impact BRG Potential Higher COVID Impact BRG Market Sun Belt Gateway Location / Asset Type Suburban Garden Urban High - Rise Quality A - ; B+ (Affordable Luxury) A+ (Ultra - Luxury); C (Lower - income) Employment Base Knowledge Economy Service Economy Renter Profile High Wage / Low Rent to Income Low Wage / High Rent to Income Business Environment Low Cost / Tax High Quality of Life High Cost / Tax Low Quality of Life
7 Defensive Nature of the Multifamily Asset Class
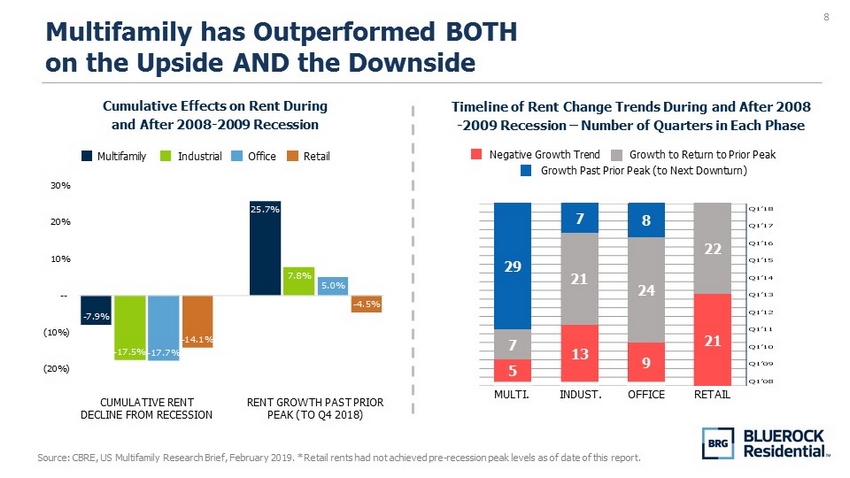
8 Multifamily has Outperformed BOTH on the Upside AND the Downside Source: CBRE, US Multifamily Research Brief, February 2019. * Retail rents had not achieved pre - recession peak levels as of date of this report. - 7.9% - 17.5% - 17.7% - 14.1% 25.7% 7.8% 5.0% - 4.5% (20%) (10%) -- 10% 20% 30% Cumulative Effects on Rent During and After 2008 - 2009 Recession Multifamily Industrial Retail Office CUMULATIVE RENT DECLINE FROM RECESSION RENT GROWTH PAST PRIOR PEAK (TO Q4 2018) MULTI. INDUST. OFFICE RETAIL 5 13 9 21 7 21 24 22 29 7 8 Timeline of Rent Change Trends During and After 2008 - 2009 Recession – Number of Quarters in Each Phase Negative Growth Trend Growth to Return to Prior Peak Growth Past Prior Peak (to Next Downturn)
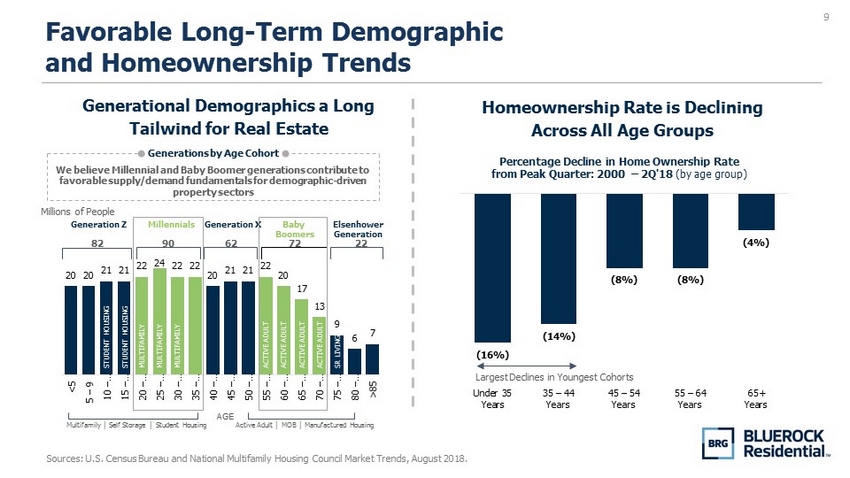
9 Favorable Long - Term Demographic and Homeownership Trends Sources: U.S. Census Bureau and National Multifamily Housing Council Market Trends, August 2018. Homeownership Rate is Declining Across All Age Groups Generational Demographics a Long Tailwind for Real Estate 20 20 21 21 22 24 22 22 20 21 21 22 20 17 13 9 6 7 <5 5 – 9 10 – … 15 – … 20 – … 25 – … 30 – … 35 – … 40 – … 45 – … 50 – … 55 – … 60 – … 65 – … 70 – … 75 – … 80 – … >85 Millennials Baby Boomers Generation X Generation Z AGE Active Adult │ MOB │ Manufactured Housing Multifamily │ Self Storage │ Student Housing Elsenhower Generation STUDENT HOUSING STUDENT HOUSING MULTIFAMILY MULTIFAMILY MULTIFAMILY ACTIVE ADULT ACTIVE ADULT ACTIVE ADULT ACTIVE ADULT SR LIVING Millions of People We believe Millennial and Baby Boomer generations contribute to favorable supply/demand fundamentals for demographic - driven property sectors Generations by Age Cohort 82 90 62 72 22 (16%) (14%) (8%) (8%) (4%) Under 35 Years 35 – 44 Years 45 – 54 Years 55 – 64 Years 65+ Years Percentage Decline in Home Ownership Rate from Peak Quarter: 2000 – 2Q'18 (by age group) Largest Declines in Youngest Cohorts
10 Bluerock’s Focus on Knowledge Economy Markets / Workers Provides Advantages
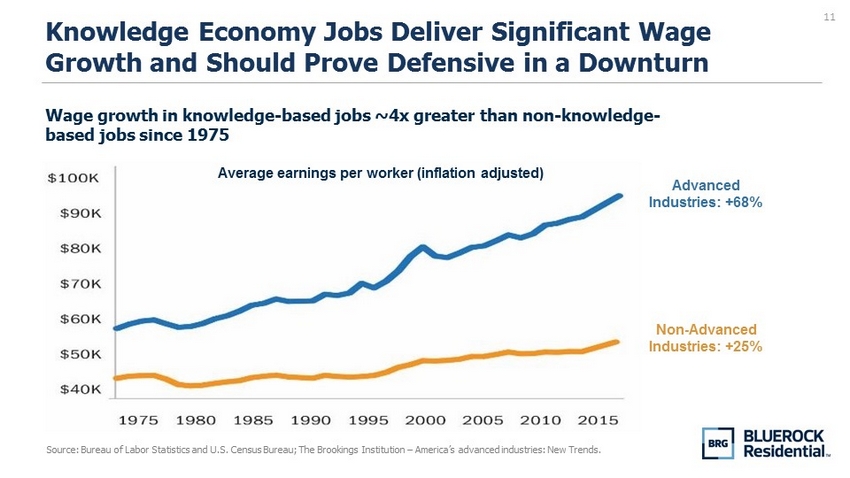
11 Knowledge Economy Jobs Deliver Significant Wage Growth and Should Prove Defensive in a Downturn Source: Bureau of Labor Statistics and U.S. Census Bureau; The Brookings Institution – America’s advanced industries: New Trends . Wage growth in knowledge - based jobs ~4x greater than non - knowledge - based jobs since 1975 Average earnings per worker (inflation adjusted) Advanced Industries: +68% Non - Advanced Industries: +25%
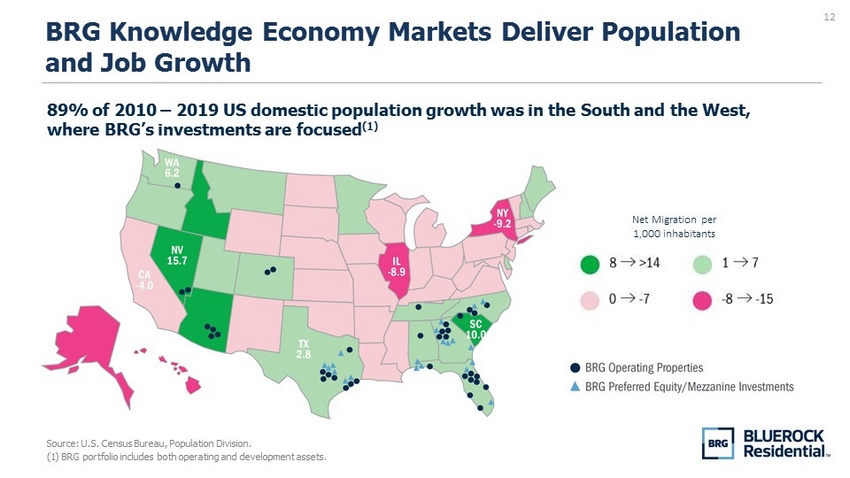
12 BRG Knowledge Economy Markets Deliver Population and Job Growth Source: U.S. Census Bureau, Population Division . (1) BRG portfolio includes both operating and development assets. Net Migration per 1,000 inhabitants 89% of 2010 – 2019 US domestic population growth was in the South and the West, where BRG’s investments are focused (1)
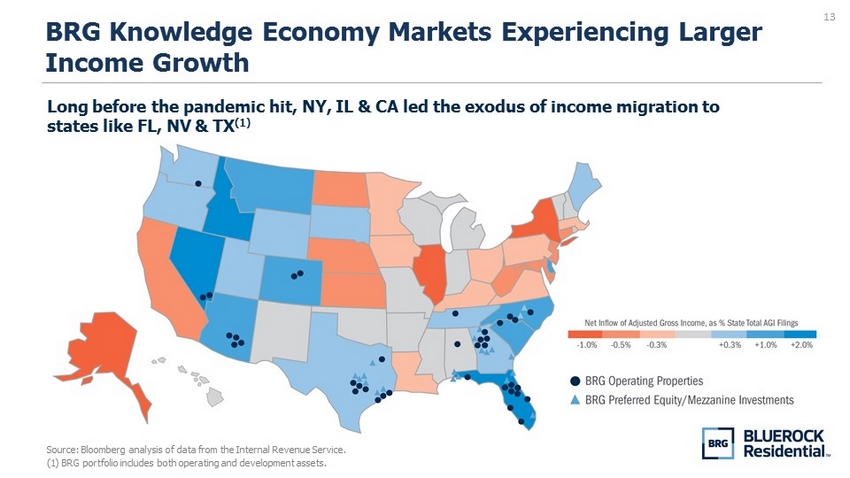
13 BRG Knowledge Economy Markets Experiencing Larger Income Growth Source: Bloomberg analysis of data from the Internal Revenue Service. (1) BRG portfolio includes both operating and development assets. Long before the pandemic hit, NY, IL & CA led the exodus of income migration to states like FL, NV & TX (1)
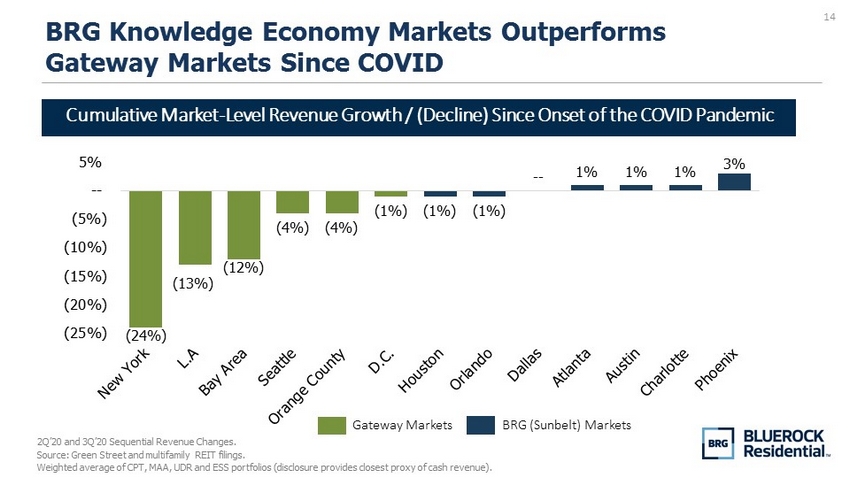
14 (24%) (13%) (12%) (4%) (4%) (1%) (1%) (1%) -- 1% 1% 1% 3% (25%) (20%) (15%) (10%) (5%) -- 5% BRG Knowledge Economy Markets Outperforms Gateway Markets Since COVID 2Q’20 and 3Q’20 Sequential Revenue Changes. Source: Green Street and multifamily REIT filings. Weighted average of CPT, MAA, UDR and ESS portfolios (disclosure provides closest proxy of cash revenue). Cumulative Market - Level Revenue Growth / (Decline) Since Onset of the COVID Pandemic Gateway Markets BRG (Sunbelt) Markets
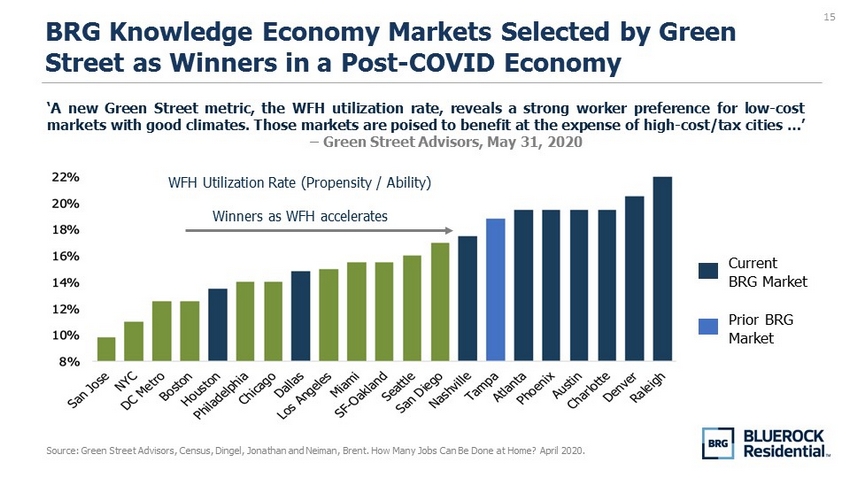
15 BRG Knowledge Economy Markets Selected by Green Street as Winners in a Post - COVID Economy Source: Green Street Advisors, Census, Dingel , Jonathan and Neiman, Brent. How Many Jobs Can Be Done at Home? April 2020. ‘A new Green Street metric, the WFH utilization rate, reveals a strong worker preference for low - cost markets with good climates . Those markets are poised to benefit at the expense of high - cost/tax cities … ’ – Green Street Advisors, May 31 , 2020 Prior BRG Market Current BRG Market WFH Utilization Rate (Propensity / Ability) Winners as WFH accelerates
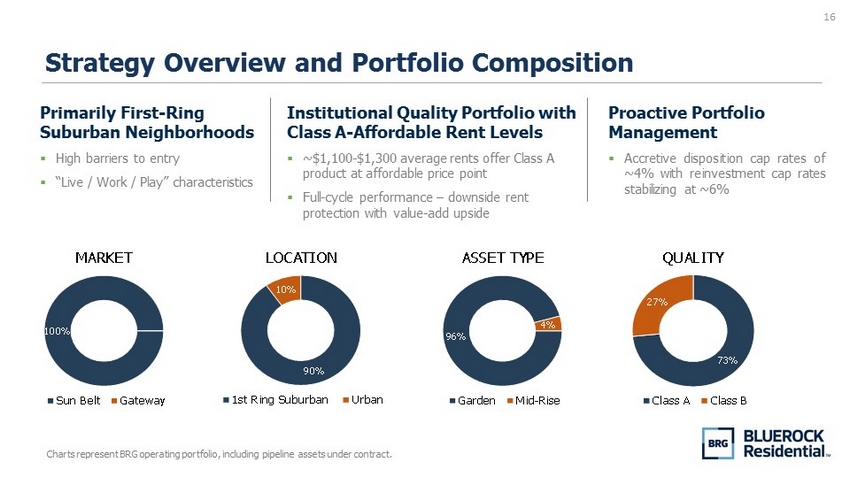
16 Strategy Overview and Portfolio Composition Charts represent BRG operating portfolio, including pipeline assets under contract. 96% 4% ASSET TYPE Garden Mid-Rise 100% 0% MARKET Sun Belt Gateway 90% 10% LOCATION 1st Ring Suburban Urban Primarily First - Ring Suburban Neighborhoods ▪ High barriers to entry ▪ “Live / Work / Play” characteristics Institutional Quality Portfolio with Class A - Affordable Rent Levels ▪ ~$1,100 - $1,300 average rents offer Class A product at affordable price point ▪ Full - cycle performance – downside rent protection with value - add upside Proactive Portfolio Management ▪ Accretive disposition cap rates of ~ 4 % with reinvestment cap rates stabilizing at ~ 6 %
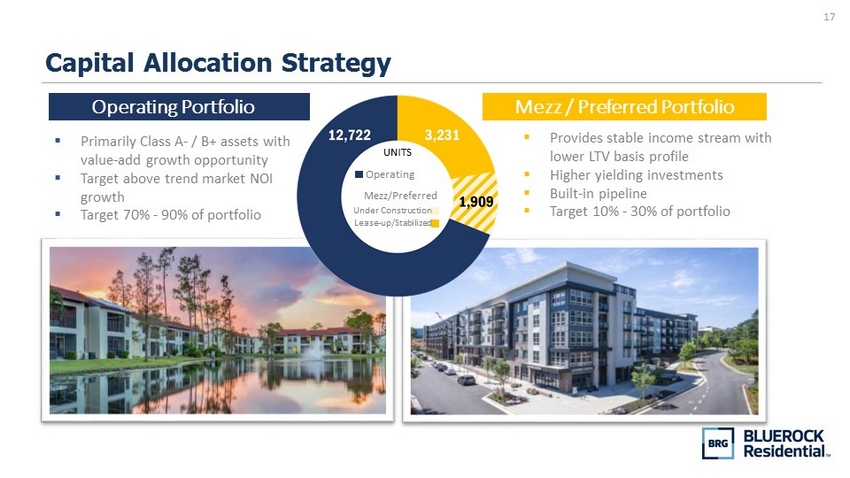
17 Capital Allocation Strategy ▪ Primarily Class A - / B+ assets with value - add growth opportunity ▪ Target above trend market NOI growth ▪ Target 70% - 90% of portfolio Operating Portfolio ▪ Provides stable income stream with lower LTV basis profile ▪ Higher yielding investments ▪ Built - in pipeline ▪ Target 10% - 30% of portfolio Mezz / Preferred Portfolio UNITS Operating Mezz/Preferred Under Construction Lease - up/Stabilized
18 Recent Performance
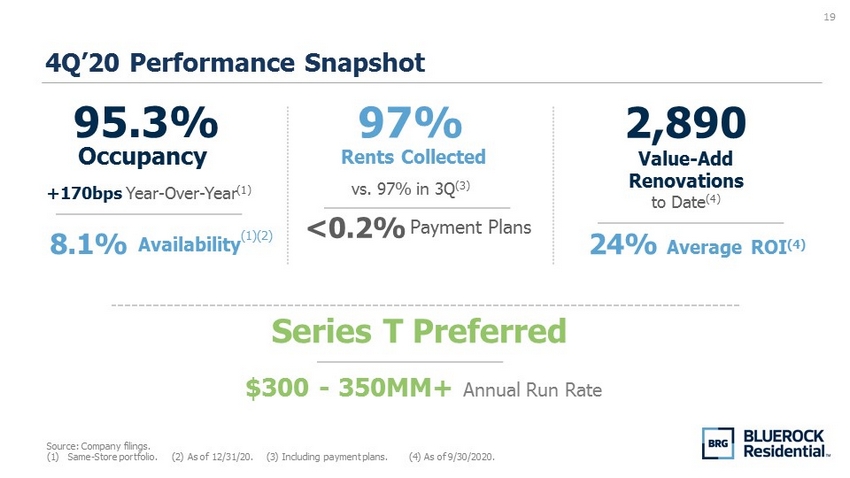
19 4Q’20 Performance Snapshot Source: Company filings. (1) Same - Store portfolio. (2) As of 12/31/20. (3) Including payment plans. (4) As of 9/30/2020. Rents Collected 97% 24% Average ROI (4) Payment Plans <0.2% Series T Preferred vs. 97% in 3Q (3) $300 - 350MM+ Annual Run Rate 8.1% Availability (1)(2) 95.3% Occupancy +170bps Year - Over - Year (1) 2,890 Value - Add Renovations to Date (4)
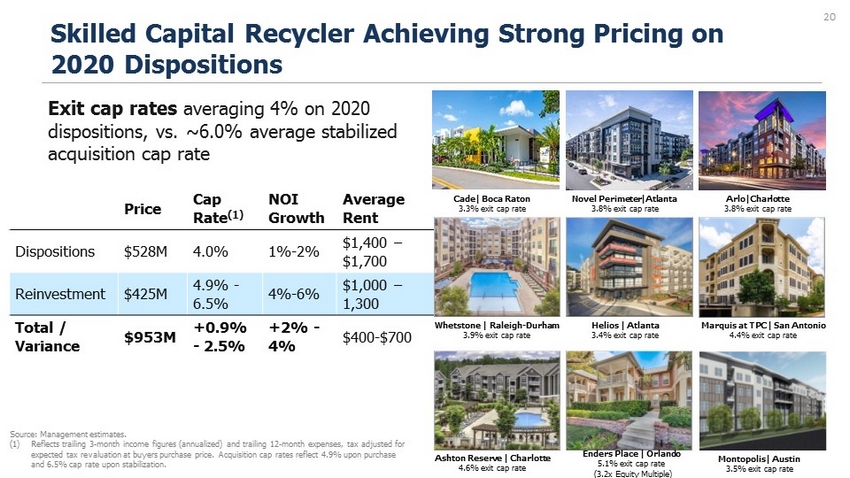
20 Skilled Capital Recycler Achieving Strong Pricing on 2020 Dispositions Source: Management estimates. (1) Reflects trailing 3 - month income figures (annualized) and trailing 12 - month expenses, tax adjusted for expected tax revaluation at buyers purchase price. Acquisition cap rates reflect 4.9% upon purchase and 6.5% cap rate upon stabilization. Price Cap Rate (1) NOI Growth Average Rent Dispositions $528M 4.0% 1% - 2% $1,400 – $1,700 Reinvestment $425M 4.9% - 6.5% 4% - 6% $1,000 – 1,300 Total / Variance $953M +0.9% - 2.5% +2% - 4% $400 - $700 Exit cap rates averaging 4% on 2020 dispositions, vs. ~6.0% average stabilized acquisition cap rate Helios | Atlanta 3.4% exit cap rate Whetstone | Raleigh - Durham 3.9% exit cap rate Marquis at TPC | San Antonio 4.4% exit cap rate Ashton Reserve | Charlotte 4.6% exit cap rate Enders Place | Orlando 5.1% exit cap rate (3.2x Equity Multiple) Arlo|Charlotte 3.8% exit cap rate Cade| Boca Raton 3.3% exit cap rate Montopolis| Austin 3.5% exit cap rate Novel Perimeter|Atlanta 3.8% exit cap rate
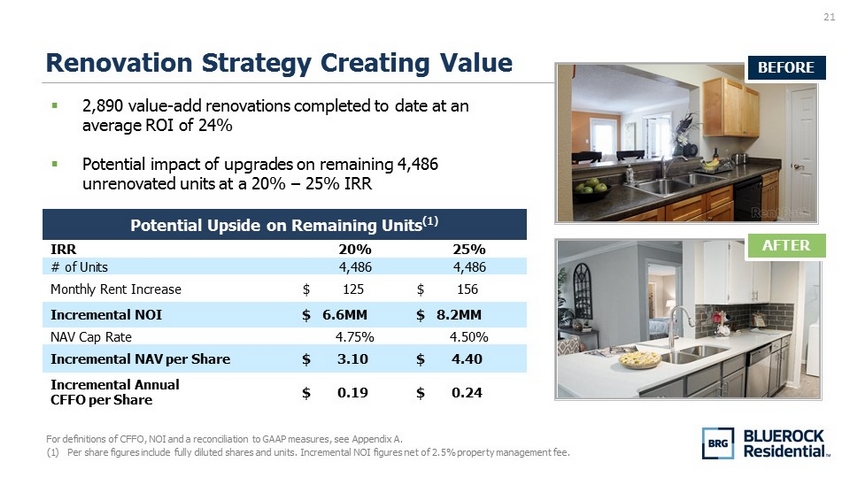
21 Renovation Strategy Creating Value For definitions of CFFO, NOI and a reconciliation to GAAP measures, see Appendix A. (1) Per share figures include fully diluted shares and units. Incremental NOI figures net of 2.5% property management fee. BEFORE AFTER Potential Upside on Remaining Units (1) IRR 20% 25% # of Units 4,486 4,486 Monthly Rent Increase $ 125 $ 156 Incremental NOI $ 6.6MM $ 8.2MM NAV Cap Rate 4.75% 4.50% Incremental NAV per Share $ 3.10 $ 4.40 Incremental Annual CFFO per Share $ 0.19 $ 0.24 ▪ 2,890 value - add renovations completed to date at an average ROI of 24% ▪ Potential impact of upgrades on remaining 4,486 unrenovated units at a 20% – 25% IRR
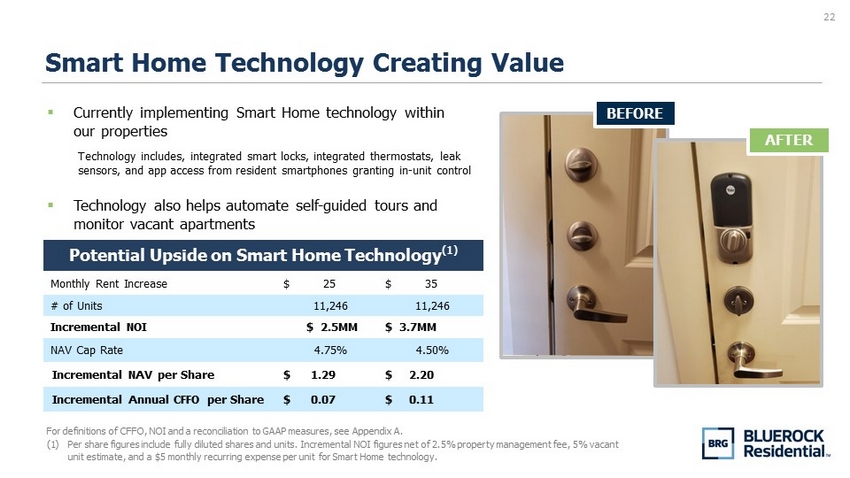
22 Smart Home Technology Creating Value For definitions of CFFO, NOI and a reconciliation to GAAP measures, see Appendix A. (1) Per share figures include fully diluted shares and units. Incremental NOI figures net of 2.5% property management fee, 5% vac ant unit estimate, and a $5 monthly recurring expense per unit for Smart Home technology. Technology includes, integrated smart locks, integrated thermostats, leak sensors, and app access from resident smartphones granting in - unit control Potential Upside on Smart Home Technology (1) Monthly Rent Increase $ 25 $ 35 # of Units 11,246 11,246 Incremental NOI $ 2.5MM $ 3.7MM NAV Cap Rate 4.75% 4.50% Incremental NAV per Share $ 1.29 $ 2.20 Incremental Annual CFFO per Share $ 0.07 $ 0.11 BEFORE AFTER ▪ Currently implementing Smart Home technology within our properties ▪ Technology also helps automate self - guided tours and monitor vacant apartments
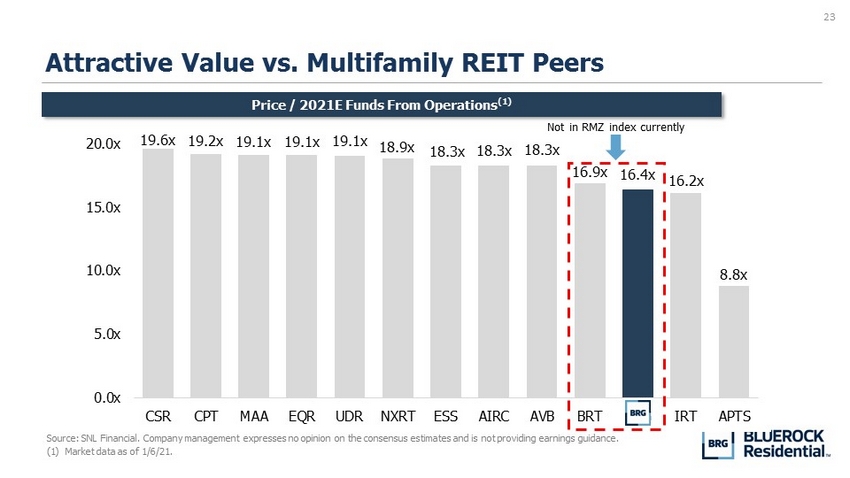
23 Attractive Value vs. Multifamily REIT Peers Source: SNL Financial. Company management expresses no opinion on the consensus estimates and is not providing earnings guida nce . (1) Market data as of 1/6/21. Price / 2021E Funds From Operations (1) 19.6x 19.2x 19.1x 19.1x 19.1x 18.9x 18.3x 18.3x 18.3x 16.9x 16.4x 16.2x 8.8x 0.0x 5.0x 10.0x 15.0x 20.0x CSR CPT MAA EQR UDR NXRT ESS AIRC AVB BRT BRG IRT APTS Not in RMZ index currently
24 APPENDIX A
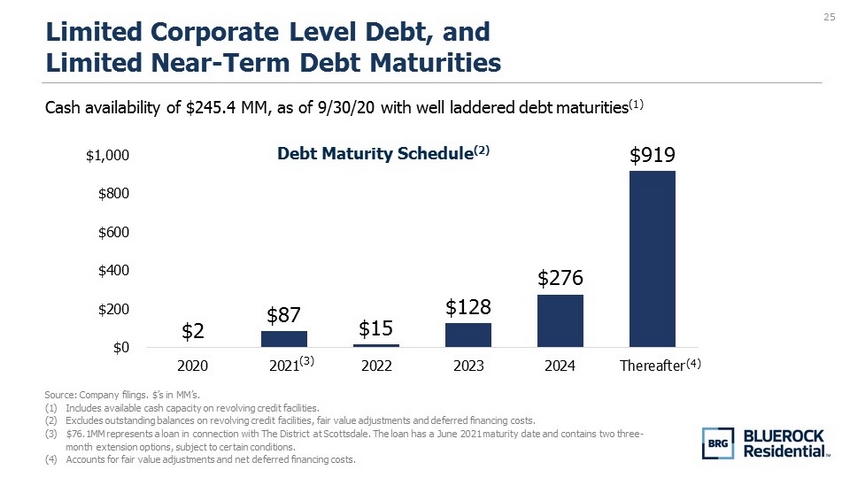
25 Source: Company filings. $’s in MM’s. (1) Includes available cash capacity on revolving credit facilities. (2) Excludes outstanding balances on revolving credit facilities, fair value adjustments and deferred financing costs. (3) $76.1MM represents a loan in connection with The District at Scottsdale. The loan has a June 2021 maturity date and contains two three - month extension options, subject to certain conditions. (4) Accounts for fair value adjustments and net deferred financing costs. Limited Corporate Level Debt, and Limited Near - Term Debt Maturities Cash availability of $245.4 MM, as of 9/30/20 with well laddered debt maturities (1) $2 $87 $15 $128 $276 $919 $0 $200 $400 $600 $800 $1,000 2020 2021 2022 2023 2024 Thereafter (3) (4) Debt Maturity Schedule (2)
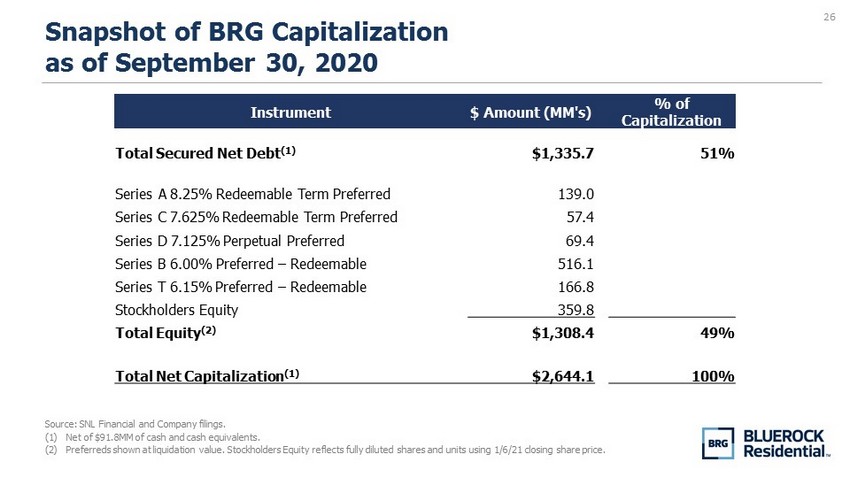
26 Snapshot of BRG Capitalization as of September 30, 2020 Source: SNL Financial and Company filings. (1) Net of $91.8MM of cash and cash equivalents. (2) Preferreds shown at liquidation value. Stockholders Equity reflects fully diluted shares and units using 1/6/21 closing share price. Instrument $ Amount (MM's) % of Capitalization Total Secured Net Debt (1) $1,335.7 51% Series A 8.25% Redeemable Term Preferred 139.0 Series C 7.625% Redeemable Term Preferred 57.4 Series D 7.125% Perpetual Preferred 69.4 Series B 6.00% Preferred – Redeemable 516.1 Series T 6.15% Preferred – Redeemable 166.8 Stockholders Equity 359.8 Total Equity (2) $1,308.4 49% Total Net Capitalization (1) $2,644.1 100%
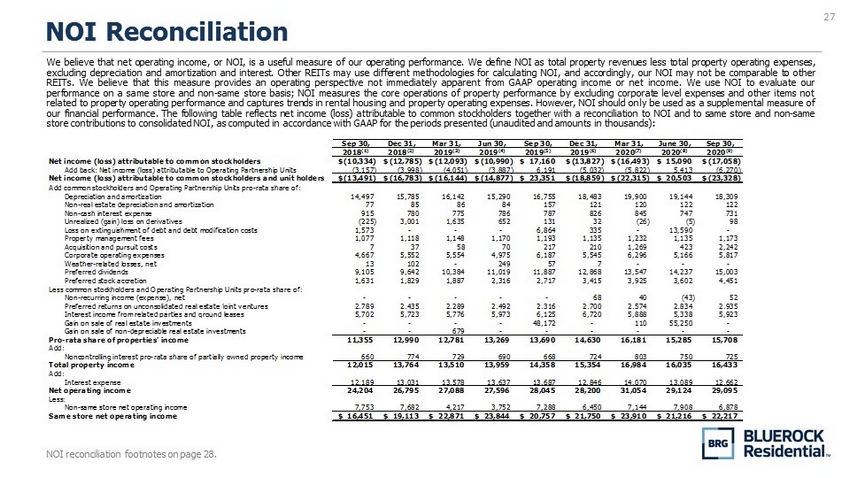
27 NOI Reconciliation NOI reconciliation footnotes on page 28. We believe that net operating income, or NOI, is a useful measure of our operating performance . We define NOI as total property revenues less total property operating expenses, excluding depreciation and amortization and interest . Other REITs may use different methodologies for calculating NOI, and accordingly, our NOI may not be comparable to other REITs . We believe that this measure provides an operating perspective not immediately apparent from GAAP operating income or net income . We use NOI to evaluate our performance on a same store and non - same store basis ; NOI measures the core operations of property performance by excluding corporate level expenses and other items not related to property operating performance and captures trends in rental housing and property operating expenses . However, NOI should only be used as a supplemental measure of our financial performance . The following table reflects net income (loss) attributable to common stockholders together with a reconciliation to NOI and to same store and non - same store contributions to consolidated NOI, as computed in accordance with GAAP for the periods presented (unaudited and amounts in thousands) : Sep 30, Dec 31, Mar 31, Jun 30, Sep 30, Dec 31, Mar 31, June 30, Sep 30, 2018 (1) 2018 (2) 2019 (3) 2019 (4) 2019 (5) 2019 (6) 2020 (7) 2020 (8) 2020 (9) Net income (loss) attributable to common stockholders (10,334)$ (12,785)$ (12,093)$ (10,990)$ 17,160$ (13,827)$ (16,493)$ 15,090$ (17,058)$ Add back: Net income (loss) attributable to Operating Partnership Units (3,157) (3,998) (4,051) (3,887) 6,191 (5,032) (5,822) 5,413 (6,270) Net income (loss) attributable to common stockholders and unit holders (13,491)$ (16,783)$ (16,144)$ (14,877)$ 23,351$ (18,859)$ (22,315)$ 20,503$ (23,328)$ Add common stockholders and Operating Partnership Units pro-rata share of: Depreciation and amortization 14,497 15,785 16,142 15,290 16,755 18,483 19,900 19,144 18,309 Non-real estate depreciation and amortization 77 85 86 84 157 121 120 122 122 Non-cash interest expense 915 780 775 786 787 826 845 747 731 Unrealized (gain) loss on derivatives (225) 3,001 1,635 652 131 32 (26) (5) 98 Loss on extinguishment of debt and debt modification costs 1,573 - - - 6,864 335 - 13,590 - Property management fees 1,077 1,118 1,148 1,170 1,193 1,135 1,232 1,135 1,173 Acquisition and pursuit costs 7 37 58 70 217 210 1,269 423 2,242 Corporate operating expenses 4,667 5,552 5,554 4,975 6,187 5,545 6,296 5,166 5,817 Weather-related losses, net 13 102 - 249 57 7 - - - Preferred dividends 9,105 9,642 10,384 11,019 11,887 12,868 13,547 14,237 15,003 Preferred stock accretion 1,631 1,829 1,887 2,316 2,717 3,415 3,925 3,602 4,451 Less common stockholders and Operating Partnership Units pro-rata share of: Non-recurring income (expense), net - - - - - 68 40 (43) 52 Preferred returns on unconsolidated real estate joint ventures 2,789 2,435 2,289 2,492 2,316 2,700 2,574 2,834 2,935 Interest income from related parties and ground leases 5,702 5,723 5,776 5,973 6,125 6,720 5,888 5,338 5,923 Gain on sale of real estate investments - - - - 48,172 - 110 55,250 - Gain on sale of non-depreciable real estate investments - - 679 - - - - - - Pro-rata share of properties' income 11,355 12,990 12,781 13,269 13,690 14,630 16,181 15,285 15,708 Add: Noncontrolling interest pro-rata share of partially owned property income 660 774 729 690 668 724 803 750 725 Total property income 12,015 13,764 13,510 13,959 14,358 15,354 16,984 16,035 16,433 Add: Interest expense 12,189 13,031 13,578 13,637 13,687 12,846 14,070 13,089 12,662 Net operating income 24,204 26,795 27,088 27,596 28,045 28,200 31,054 29,124 29,095 Less: Non-same store net operating income 7,753 7,682 4,217 3,752 7,288 6,450 7,144 7,908 6,878 Same store net operating income 16,451$ 19,113$ 22,871$ 23,844$ 20,757$ 21,750$ 23,910$ 21,216$ 22,217$
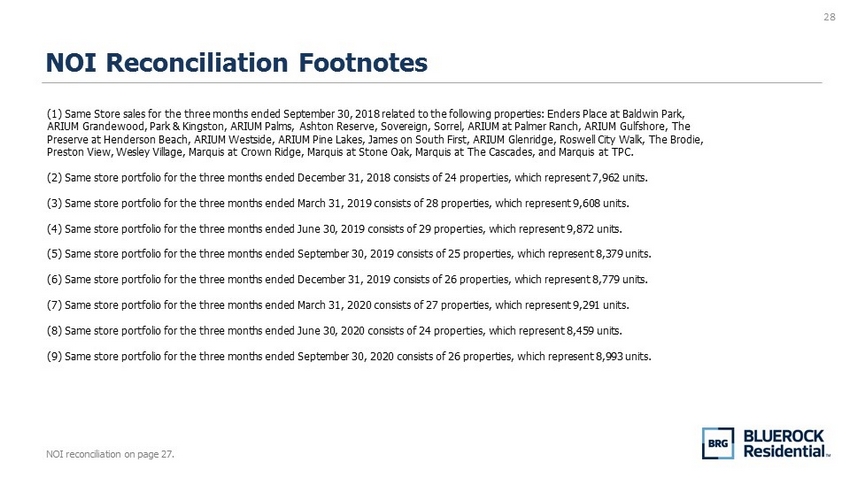
28 NOI Reconciliation Footnotes NOI reconciliation on page 27. (1) Same Store sales for the three months ended September 30, 2018 related to the following properties: Enders Place at Baldw in Park, ARIUM Grandewood, Park & Kingston, ARIUM Palms, Ashton Reserve, Sovereign, Sorrel, ARIUM at Palmer Ranch, ARIUM Gulfshore, Th e Preserve at Henderson Beach, ARIUM Westside, ARIUM Pine Lakes, James on South First, ARIUM Glenridge, Roswell City Walk, The Bro die, Preston View, Wesley Village, Marquis at Crown Ridge, Marquis at Stone Oak, Marquis at The Cascades, and Marquis at TPC. (2) Same store portfolio for the three months ended December 31, 2018 consists of 24 properties, which represent 7,962 units. (3) Same store portfolio for the three months ended March 31, 2019 consists of 28 properties, which represent 9,608 units. (4) Same store portfolio for the three months ended June 30, 2019 consists of 29 properties, which represent 9,872 units. (5) Same store portfolio for the three months ended September 30, 2019 consists of 25 properties, which represent 8,379 units . (6) Same store portfolio for the three months ended December 31, 2019 consists of 26 properties, which represent 8,779 units. (7) Same store portfolio for the three months ended March 31, 2020 consists of 27 properties, which represent 9,291 units. (8) Same store portfolio for the three months ended June 30, 2020 consists of 24 properties, which represent 8,459 units. (9) Same store portfolio for the three months ended September 30, 2020 consists of 26 properties, which represent 8,993 units .
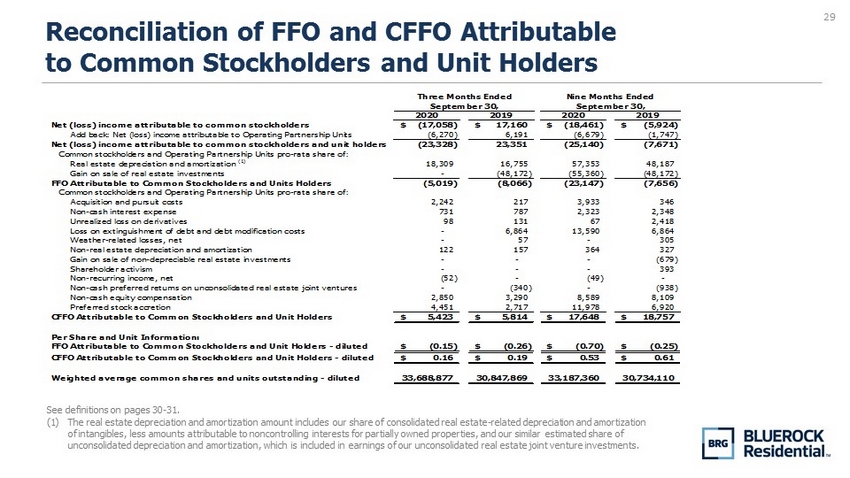
29 Reconciliation of FFO and CFFO Attributable to Common Stockholders and Unit Holders See definitions on pages 30 - 31. (1) The real estate depreciation and amortization amount includes our share of consolidated real estate - related depreciation and amo rtization of intangibles, less amounts attributable to noncontrolling interests for partially owned properties, and our similar estimat ed share of unconsolidated depreciation and amortization, which is included in earnings of our unconsolidated real estate joint venture i nve stments. 2020 2019 2020 2019 Net (loss) income attributable to common stockholders (17,058)$ 17,160$ (18,461)$ (5,924)$ Add back: Net (loss) income attributable to Operating Partnership Units (6,270) 6,191 (6,679) (1,747) Net (loss) income attributable to common stockholders and unit holders (23,328) 23,351 (25,140) (7,671) Common stockholders and Operating Partnership Units pro-rata share of: Real estate depreciation and amortization (1) 18,309 16,755 57,353 48,187 Gain on sale of real estate investments - (48,172) (55,360) (48,172) FFO Attributable to Common Stockholders and Units Holders (5,019) (8,066) (23,147) (7,656) Common stockholders and Operating Partnership Units pro-rata share of: Acquisition and pursuit costs 2,242 217 3,933 346 Non-cash interest expense 731 787 2,323 2,348 Unrealized loss on derivatives 98 131 67 2,418 Loss on extinguishment of debt and debt modification costs - 6,864 13,590 6,864 Weather-related losses, net - 57 - 305 Non-real estate depreciation and amortization 122 157 364 327 Gain on sale of non-depreciable real estate investments - - - (679) Shareholder activism - - - 393 Non-recurring income, net (52) - (49) - Non-cash preferred returns on unconsolidated real estate joint ventures - (340) - (938) Non-cash equity compensation 2,850 3,290 8,589 8,109 Preferred stock accretion 4,451 2,717 11,978 6,920 CFFO Attributable to Common Stockholders and Unit Holders 5,423$ 5,814$ 17,648$ 18,757$ Per Share and Unit Information: FFO Attributable to Common Stockholders and Unit Holders - diluted (0.15)$ (0.26)$ (0.70)$ (0.25)$ CFFO Attributable to Common Stockholders and Unit Holders - diluted 0.16$ 0.19$ 0.53$ 0.61$ Weighted average common shares and units outstanding - diluted 33,688,877 30,847,869 33,187,360 30,734,110 Three Months Ended September 30, Nine Months Ended September 30,
30 Definitions FFO and Core FFO reconciliation on page 29. Funds from Operations and Core Funds from Operations, Attributable to Common Stockholders and Unit Holders We believe that funds from operations (“FFO”), as defined by the National Association of Real Estate Investment Trusts (“NAREIT”), and core funds from operations (“CFFO”) are important non - GAAP supplemental measures of operating performance for a REIT . FFO attributable to common stockholders and unit holders is a non - GAAP financial measure that is widely recognized as a measure of REIT operating performance . We consider FFO to be an appropriate supplemental measure of our operating performance as it is based on a net income analysis of property portfolio performance that excludes non - cash items such as depreciation . The historical accounting convention used for real estate assets requires straight - line depreciation of buildings and improvements, which implies that the value of real estate assets diminishes predictably over time . Since real estate values historically rise and fall with market conditions, presentations of operating results for a REIT, using historical accounting for depreciation, could be less informative . We define FFO, consistent with the NAREIT definition, as net income, computed in accordance with GAAP, excluding gains or losses on sales of depreciable real estate property, plus depreciation and amortization of real estate assets, plus impairment write - downs of depreciable real estate, and after adjustments for unconsolidated partnerships and joint ventures . Adjustments for unconsolidated partnerships and joint ventures will be calculated to reflect FFO on the same basis . CFFO makes certain adjustments to FFO, removing the effect of items that do not reflect ongoing property operations such as acquisition expenses, non - cash interest expense, unrealized gains or losses on derivatives, losses on extinguishment of debt and debt modification costs (includes prepayment penalties incurred and the write - off of unamortized deferred financing costs and fair market value adjustments of assumed debt), one - time weather - related costs, gains or losses on sales of non - depreciable real estate property, shareholder activism, stock compensation expense and preferred stock accretion . Commencing January 1 , 2020 , we did not deduct the accrued portion of the preferred income on our preferred equity investments from FFO to determine CFFO as the income is deemed fully collectible . The accrued portion of the preferred income totaled $ 0 . 4 million and $ 1 . 2 million for the three and nine months ended September 30 , 2020 , respectively . We believe that CFFO is helpful to investors as a supplemental performance measure because it excludes the effects of certain items which can create significant earnings volatility, but which do not directly relate to our core recurring property operations . As a result, we believe that CFFO can help facilitate comparisons of operating performance between periods and provides a more meaningful predictor of future earnings potential . Our calculation of CFFO differs from the methodology used for calculating CFFO by certain other REITs and, accordingly, our CFFO may not be comparable to CFFO reported by other REITs . Our management utilizes FFO and CFFO as measures of our operating performance after adjustment for certain non - cash items, such as depreciation and amortization expenses, and acquisition and pursuit costs that are required by GAAP to be expensed but may not necessarily be indicative of current operating performance and that may not accurately compare our operating performance between periods . Furthermore, although FFO and CFFO and other supplemental performance measures are defined in various ways throughout the REIT industry, we also believe that FFO and CFFO may provide us and our stockholders with an additional useful measure to compare our financial performance to certain other REITs
31 Definitions continued… Neither FFO nor CFFO is equivalent to net income, including net income attributable to common stockholders, or cash generated from operating activities determined in accordance with GAAP . Furthermore, FFO and CFFO do not represent amounts available for management's discretionary use because of needed capital replacement or expansion, debt service obligations or other commitments or uncertainties . Neither FFO nor CFFO should be considered as an alternative to net income, including net income attributable to common stockholders, as an indicator of our operating performance or as an alternative to cash flow from operating activities as a measure of our liquidity . We have acquired six operating properties, made eight investments through mezzanine loans, preferred equity interests or ground lease investments, and sold five operating properties subsequent to September 30 , 2019 . The results presented are not directly comparable and should not be considered an indication of our future operating performance (unaudited and dollars in thousands, except share and per share data) .
32