Attached files
| file | filename |
|---|---|
| EX-99.1 - EXHIBIT 99.1 - RITE AID CORP | tm2038433d1_ex99-1.htm |
| 8-K - FORM 8-K - RITE AID CORP | tm2038433-1_8k.htm |
Exhibit 99.2


2 Cautionary Statement Regarding Forward Looking Statements Statements in this presentation that are not historical, are forward - looking statements made pursuant to the safe harbor provisions of the Private Securities Litigation Reform Act of 1995 . Such statements include, but are not limited to, statements regarding Rite Aid Corporation’s (the “Company”) outlook and guidance for fiscal 2021 ; the ability to generate positive free cash flows in fiscal 2021 ; the continued impact of the global coronavirus (COVID - 19 ) pandemic on Rite Aid’s business ; the ability to accelerate key initiatives and improve the operating performance of the Company’s stores ; expected business development pipeline during fiscal 2022 ; timing for launching all new member portal ; and any assumptions underlying any of the foregoing . Words such as “anticipate,” “believe,” “continue,” “could,” “estimate,” “expect,” “intend,” “may,” “plan,” “predict,” “project,” “should,” and “will” and variations of such words and similar expressions are intended to identify such forward - looking statements . These forward - looking statements are not guarantees of future performance and involve risks, assumptions and uncertainties, including, but not limited to : the continued impact of (COVID - 19 ) on the Company’s workforce, operations, stores, expenses and supply chain, and the operations of the Company’s customers, suppliers and business partners ; the Company’s ability to successfully implement its RxEvolution strategy ; Company’s high level of indebtedness and its ability to satisfy its obligations and the other covenants contained in the Company’s debt agreements ; general competitive, economic, industry, market, political (including healthcare reform) and regulatory conditions, civil unrest (including any resulting store closures, damage, or loss of inventory), as well as other factors specific to the markets in which we operate ; the impact of private and public third - party payers continued reduction in prescription drug reimbursements and efforts to encourage mail order ; the Company’s ability to manage expenses and its investments in working capital ; the Company’s ability to achieve the benefits of the Company’s efforts to reduce the costs of its generic and other drugs ; the Company’s ability to achieve cost savings and other benefits of its organizational restructuring within the Company’s anticipated timeframe, if at all ; and outcomes of legal and regulatory matters ; the Company’s ability to partner and have relationships with health plans and health systems . These and other risks, assumptions and uncertainties are more fully described in Item 1 A (Risk Factors) of the Company’s most recent Annual Report on Form 10 - K, in Item 1 A (Risk Factors) of the Company’s Quarterly Report on Form 10 - Q filed on July 2 , 2020 and in other documents that it files or furnishes with the Securities and Exchange Commission (the “SEC”), which you are encouraged to read . To the extent that COVID - 19 adversely affects the Company’s business and financial results, it may also have the effect of heightening many of such risk factors . Should one or more of these risks or uncertainties materialize, or should underlying assumptions prove incorrect, actual results may vary materially from those indicated or anticipated by such forward - looking statements . Accordingly, you are cautioned not to place undue reliance on these forward - looking statements, which speak only as of the date they are made . The degree to which COVID - 19 may adversely the Company’s results and operations, including its ability to achieve its outlook for fiscal 2021 guidance, will depend on numerous evolving factors and future developments, which are highly uncertain, including, but not limited to, the duration and spread of the outbreak, its severity, the actions to contain the virus or treat its impact (such as travel bans and restrictions, quarantines, shelter - in - place orders and shutdowns), including the reinstitution of more stringent regulations (including mandatory stay at home orders, the availability and rollout of vaccines to treat the virus), and how quickly and to what extent normal economic and operating conditions can resume . As a result, the impact on the Company’s financial and operating results cannot be reasonably estimated with specificity at this time, but the impact could be material . The Company expressly disclaims any current intention to update publicly any forward - looking statement after the distribution of this presentation, whether as a result of new information, future events, changes in assumptions or otherwise .

3 The following presentation includes the non - GAAP financial measures, Adjusted EBITDA, Adjusted Net Income (Loss), Adjusted Net Income (Loss) per Diluted Share, Adjusted EBITDA Gross Profit, Adjusted EBITDA SG&A and Free Cash Flow . The Company defines Adjusted EBITDA as net income (loss) excluding the impact of income taxes, interest expense, depreciation and amortization, LIFO adjustments, charges or credits for facility closing and impairment, goodwill and intangible asset impairment charges, inventory write - downs related to store closings, gains or losses on debt modifications and retirements, the WBA merger termination fee, and other items (including stock - based compensation expense, merger and acquisition - related costs, non - recurring litigation settlement, severance, restructuring - related costs and costs related to facility closures and gain or loss on sale of assets) . The presentation includes a reconciliation of Adjusted EBITDA to net income (loss), which is the most directly comparable GAAP financial measure . Adjusted Net Income (Loss) and Adjusted Net Income (Loss) per Diluted Share exclude amortization expense, merger and acquisition - related costs, non - recurring litigation settlement, gains or losses on debt modifications and retirements, LIFO adjustments, goodwill and intangible asset impairment charges, restructuring - related costs and the WBA merger termination fee . Additionally, the add back of LIFO (credit) charge when calculating Adjusted EBITDA, Adjusted Net Income (Loss) and Adjusted Net Income (Loss) per Diluted Share removes the entire impact of LIFO (credits) charges, and effectively reflects the Company’s results as if the Company was on a FIFO inventory basis . The presentation includes a reconciliation of Adjusted Net Income (Loss) to net income (loss), which is the most directly comparable GAAP financial measure . Adjusted EBITDA Gross Profit includes LIFO adjustments, depreciation and amortization (COGS portion only) and other items . The presentation includes a reconciliation of Adjusted EBITDA Gross Profit to Revenue, which is the most directly comparable GAAP financial measure . Adjusted EBITDA SG&A excludes depreciation and amortization (SG&A portion only), stock - based compensation expense, merger and acquisition - related costs, litigation settlement and other items . The presentation includes a reconciliation of Adjusted EBITDA SG&A to Revenue, which is the most directly comparable GAAP financial measure . Free Cash Flow is defined as Adjusted EBITDA less cash paid for interest, rent on closed stores, capital expenditures, restructuring - related costs and the change in working capital . Non - GAAP Financial Measures


$137.4 Adjusted EBITDA* 5 Q3 FY2021 at a Glance 3.1% Script count growth 0 .3% Increase in FE same store sales (excluding tobacco ) 29% Increase in revenues at Elixir 12% Increase in revenues 5.1% Growth in retail pharmacy revenues *Adjusted EBITDA reconciliation located in the Appendix

6 Key Third Quarter FY2021 Highlights Revenue increased 12% and narrowed guidance Retail Pharmacy: x Front end comparable sales increased 0.3% (excluding tobacco related products) x Pharmacy comparable sales increased 6.1 % x Flu immunizations increased by 28% x Same store 30 - day equivalent prescription count grew 3.1 % x Increased front - end and pharmacy market share Elixir: x Revenue increased 29% to $ 2.1 billion x Mail order revenue up 24% x Specialty revenue up 5% performance CMS receivable sale and Sale Leaseback of Perryman, MD distribution center : x Sold the CMS receivable generated from January 1 , 2020 to September 30 , 2020 and received proceeds of $ 412 . 8 million ▪ We expect to sell the portion of the CMS receivable that builds between October 1 and December 31 of 2020 prior to the end of Fiscal 2021 x Completed the sale leaseback of our Perryman, MD distribution center and a few additional retail stores - generated total proceeds of $ 80 . 6 million ▪ Continuing to explore additional monetization opportunities to generate cash and pay down debt

7 Immediate Signals of the New Brand Refreshed over 700 Store Exteriors Refreshed Store Interiors “Store of the Future” Digital Pylons Added in 700+ stores

8 Continued progress on our key strategic pillars Establishing Elixir as a clearly differentiated market leader Unlocking the value of our pharmacists Renewing our retail and digital experience

9 Establishing Elixir as a clearly differentiated market leader • Continued progress with operational integration and modernization • Consolidating formulary offerings for current employer clients to drive enhanced value • Reorganized and integrated clinical solutions team within Health Dialog for more focused drug spend management and enhanced member engagement • Set to launch all new member portal with distinct and improved improved user experience

10 • Delivered over 1M COVID - 19 tests, and partnering with CDC to administer COVID vaccines • Increased flu immunizations by 28 % • Increased pharmacy market share as measured by IQVIA • Through specialized training and support, our pharmacists delivered higher levels of engagement around the key holistic health topics of immunity, sleep and stress, continuing strong sales growth in these categories Unlocking the value of our pharmacists

11 • Officially launched our new brand and logo • R emerchandised 75 percent of our categories to our new standards • Opened first 3 Stores of the Future in Etters, PA, Littleton, NH and Moscow, PA with excellent initial customer response • Refreshed more than 700 stores with updated exteriors, signage and pylons featuring our new branding, with hundreds more slated for completion by the end of the fiscal year • Grew front - end market share as measured by IRI Renewing our retail and digital experience


13 Total Revenues $ 23.9B – $ 24.2B Same Store Sales 3.5% - 4.5% Adjusted EBITDA $ 490M - $ 520M Net Loss $89M - $114M Adjusted net income per share $0.45 - $ 0.85 Capital Expenditures ~$325M Free Cash Flow $50M - $100M FY 2021 Guidance

($ in thousands) FY 2021 Guidance 14 Guidance Range Low High Total Revenues $ 23,900,000 $ 24,200,000 PBM Revenues $ 7,850,000 $ 7,950,000 Same store sales 3.50 % 4.50 % Gross Capital Expenditures $ 325,000 $ 325,000 Reconciliation of net loss to adjusted EBITDA: Net loss $ ( 113,800 ) $ (88,800 ) Adjustments: Interest expense 202,000 202,000 Income tax benefit (12,000) (7,000) Depreciation and amortization 332,000 332,000 LIFO credit ( 39,000 ) ( 39,000 ) Lease termination and impairment charges 57,000 57,000 Intangible asset impairment charges 30,000 30,000 Gain on debt modifications and retirements, net (5,300) (5,300) Merger and Acquisition - related costs 1,200 1,200 Restructuring - related costs 80,000 80,000 Gain on sale of assets, net (60,100) (60,100) Other 18,000 18,000 Adjusted EBITDA $ 490,000 $ 520,000
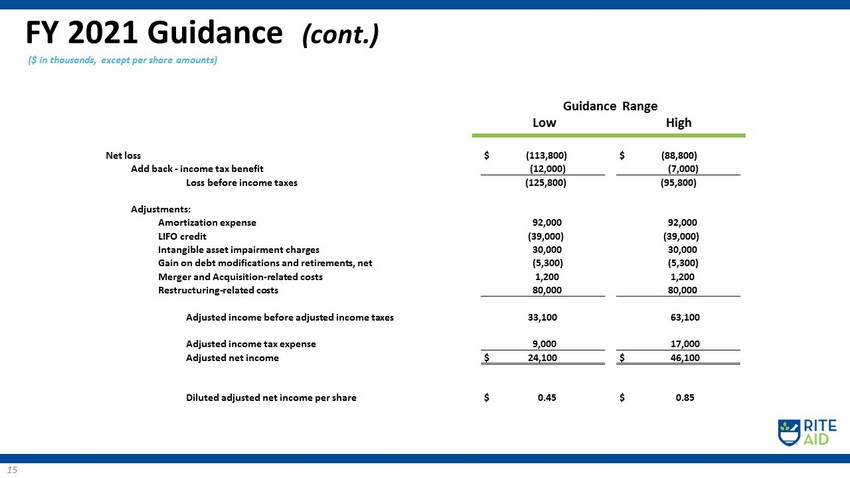
($ in thousands, except per share amounts) FY 2021 Guidance (cont.) 15 Guidance Range Low High Net loss $ ( 113,800 ) $ (88,800 ) Add back - income tax benefit (12,000 ) (7,000) Loss before income taxes (125,800 ) (95,800 ) Adjustments: Amortization expense 92,000 92,000 LIFO credit ( 39,000 ) ( 39,000 ) Intangible asset impairment charges 30,000 30,000 Gain on debt modifications and retirements, net (5,300) (5,300) Merger and Acquisition - related costs 1,200 1,200 Restructuring - related costs 80,000 80,000 Adjusted income before adjusted income taxes 33,100 63,100 Adjusted income tax expense 9,000 17,000 Adjusted net income $ 24,100 $ 46,100 Diluted adjusted net income per share $ 0.45 $ 0.85

($ in thousands) FY 2021 Guidance (cont.) 16 Guidance Range Low High Adjusted EBITDA $ 490,000 $ 520,000 Cash interest expense ( 190,000 ) ( 190,000 ) Restructuring - related costs (80,000 ) (80,000 ) Closed store rent ( 25,000 ) ( 25,000 ) Working capital benefit 180,000 200,000 Cash flow from operations 375,000 425,000 Gross capital expenditures (325,000 ) (325,000 ) Free cash flow $ 50,000 $ 100,000


($ in millions, except per share amounts) Q3 Fiscal 2021 Summary 18 Note: Data on this slide and throughout the presentation is on a continuing operations basis. 13 Weeks Ended November 28, 2020 13 Weeks Ended November 30, 2019 Revenues $ 6,117.0 $ 5,462.3 Net income $ 4.3 $ 52 .3 Net income per Diluted Share $ 0.08 $ 0.98 Adjusted Net Income per Diluted Share $ 0.40 $ 0.54 Adjusted EBITDA $ 137.4 2.25% $ 158.1 2.89%

($ in thousands) Q 3 - Fiscal 2021 Reconciliation of Net to Adjusted EBITDA 19 13 Weeks Ended November 28, 2020 13 Weeks Ended November 30, 2019 Net income $ 4,324 $ 52,286 Adjustments: • Interest expense 50,835 57,856 • Income tax expense 437 87 6 • Depreciation and amortization 83,336 82,007 • LIFO credit (9,487) (7,440) • Lease termination and impairment charges 7,453 166 • Gain on debt retirements, net - (55,692) • Merger and Acquisition - related costs 1,136 - • Stock - based compensation expense 2,867 3,506 • Restructuring - related costs 12,175 25,275 • Inventory write - downs related to store closings 704 93 • Gain on sale of assets, net ( 16,305) (1,371) • Other (70) 528 Adjusted EBITDA $ 137,405 $ 158,090 Percent of revenues 2.25% 2.89%

($ in thousands, except per share amounts) Q3 - Fiscal 2021 Reconciliation of Net to Adjusted Net Income 20 13 Weeks Ended November 28, 2020 13 Weeks Ended November 30, 2019 Net income $ 4,324 $ 52,286 Add back - Income tax expense 437 876 Income before income taxes $ 4,761 $ 53,162 Adjustments: Amortization expense 21,236 24,920 LIFO credit (9,487) (7,440) Gain on debt retirements, net - (55,692) Merger and Acquisition - related costs 1,136 - Restructuring - related costs 12,175 ____ 25,275 ______ Adjusted income before income taxes $ 29,821 $ 40,225 Adjusted income tax expense 8,243 11 ,090 Adjusted net income $ 21,578 $ 29 ,135 Net income per diluted share $ 0.08 $ 0.98 Adjusted net income per diluted share $ 0.40 $ 0.54

Q3 - Fiscal 2021 Summary – Retail Pharmacy Segment 21 (1) Refer to slides 22 and 23 for the reconciliations of these non - GAAP measures to their applicable GAAP measures. ($ in millions) 13 Weeks Ended November 28, 2020 13 Weeks Ended November 30, 2019 Revenues $ 4,109.6 $ 3,909.9 Adjusted EBITDA Gross Profit (1) $ 1,072.5 26.10% $ 1,065.5 27.25% Adjusted EBITDA SG&A (1) $ 984.0 23.94% $ 956.9 24.47% Adjusted EBITDA $ 88.6 2.15% $ 108.6 2.78%

($ in millions) Reconciliation of Adj. EBITDA Gross Profit – Retail Pharmacy Segment 22 13 Weeks Ended November 28, 2020 13 Weeks Ended November 30, 2019 Revenues $ 4,109.6 $ 3,909.9 Gross Profit 1,079.7 1,070.9 Addback: LIFO credit (9.5) (7.4) Depreciation and amortization (COGS portion only) 1.9 2.1 Other 0.4 (0.1) Adjusted EBITDA Gross Profit $ 1,072.5 $ 1,065.5 Adjusted EBITDA Gross Profit as a percent of revenues 26.10% 27.25%

($ in millions) Reconciliation of Adj. EBITDA SG&A - Retail Pharmacy Segment 23 13 Weeks Ended November 28, 2020 13 Weeks Ended November 30, 2019 Revenues $ 4,109.6 $ 3,909.9 Selling, general and administrative expenses 1,067.0 1,044.2 Less: Depreciation and amortization (SG&A portion only) 67.6 65.3 Stock - based compensation expense 2.4 3.0 Merger and Acquisition - related costs 1.1 - Restructuring - related costs 11 .6 18.4 Other 0.3 0.6 Adjusted EBITDA SG&A $ 984.0 $ 956.9 Adjusted EBITDA SG&A as a percent of revenues 23.94% 24.47%

($ in millions) Pharmacy Services Segment Results 24 13 Weeks Ended November 28, 2020 13 Weeks Ended November 30, 2019 Revenues $ 2,084.4 $ 1,613.1 Cost of Revenues 1,961.0 1,495.0 Gross Profit 123 .4 118.1 Selling, General and Administrative Expenses (89.3) (90.6) Loss on sale of assets, net (19.2) (0.5) Addback: Depreciation and Amortization 13.7 14.7 Loss on sale of assets, net 19.2 0.5 Restructuring - related costs 0.6 6.9 Other 0.4 0.4 Adjusted EBITDA - Pharmacy Services Segment $ 48.8 $ 49.5

Comparable Store Sales Growth 25 FRONT END SALES - 0.3% - 1.8% - 0.5% 0.1% 14.2% 4.6% - 0.7% 0.3% - 0.6% 1.0% 1.5% 16.0% 6.1% 0.3% Q2 Q2 Q1 Q3 Q4 Q3 2.3% 1.5% 0.1% 1.6% 2.2% 2.3% 6.1% 3.7% 2.7% 2.8% 5.0% 0.4% 2.6% 3.1% Excluding cigarette and tobacco products (1) Script count growth shown on a 30 - day equivalent basis. FY2020 FY2021 Q1

($ in thousands) Capitalization Table 26 November 28, 2020 February 29, 2020 Secured Debt: Senior secured revolving credit facility due December 2023 975,631$ 630,833$ FILO Term Loan due December 2023 447,566 446,954 1,423,197 1,077,787 Second Lien Secured Debt: 7.5% senior secured notes due July 2025 590,612 589,073 8.0% senior secured notes due November 2026 831,004 - 1,421,616 589,073 Guaranteed Unsecured Debt: 6.125% senior notes due April 2023 90,306 1,145,060 90,306 1,145,060 Unguaranteed Unsecured Debt: 7.7% notes due February 2027 236,577 236,478 6.875% fixed-rate senior notes due December 2028 28,881 28,870 265,458 265,348 Lease financing obligations 24,195 28,166 Total debt 3,224,772 3,105,434 Current maturities of long-term debt and lease financing obligations (7,097) (8,840) Long-term debt and lease financing obligations, less current maturities 3,217,675$ 3,096,594$ Total debt, gross 3,272,308$ 3,148,043$ Less: Unamortized debt issuance costs (47,536) (42,609) Total Debt per balance sheet: 3,224,772$ 3,105,434$

($ in thousands) Leverage Ratio 27 Total Debt: $ 3,224,772 Less: Cash and cash equivalents (50,813) Net Debt $ 3,173,959 LTM Adjusted EBITDA: Retail Pharmacy Segment 359,054 Pharmacy Services Segment 172,930 LTM Adjusted EBITDA $ 531,984 Leverage Ratio 5.97 November 28, 2020
