Attached files
| file | filename |
|---|---|
| 8-K - FORM 8-K - FIRST UNITED CORP/MD/ | tm2035890d1_8k.htm |
Exhibit 99.1
Investor Presentation Third Quarter 2020
2 2 Forward looking statements This presentation contains forward - looking statements as defined by the Private Securities Litigation Reform Act of 1995. Forward - looking statements do not represent historical facts, but are statements about management's beliefs, plans and objectives about the future, as well as its assumptions and judgments concerning such beliefs, plans and objectives. These statements are evidenced by terms such as "anticipate," "estimate," "should," "expect," "believe," "intend," and similar expressions. Although these statements reflect management's good faith beliefs and projections, they are not guarantees of future performance and they may not prove true. The beliefs, plans and objectives on which forward - looking statements are based involve risks and uncertainties that could cause actual results to differ materially from those addressed in the forward - looking statements. For a discussion of these risks and uncertainties, see the section of the periodic reports that First United Corporation files with the Securities and Exchange Commission entitled "Risk Factors", including the risk factor set forth in First United Corporation’s Annual Report on Form 10 - K, as amended, for the year ended December 31, 2019 entitled, “The outbreak of the recent coronavirus (“COVID - 19”), or an outbreak of another highly infectious or contagious disease, could adversely affect First United Corporation’s business, financial condition and results of operations.” and any updates thereto that might be contained in subsequent reports filed by First United Corporation. The risks and uncertainties associated with the COVID - 19 pandemic and its impact on First United Corporation will depend on, among other things, the length of time that the pandemic continues; the potential imposition of further restrictions on travel in the future; the effect of the pandemic on the global, national, and local economies and on the businesses of our borrowers and their ability to make payments on their obligations; the remedial actions and stimulus measures adopted by federal, state, and local governments; and the inability of employees to work due to illness, quarantine, or government mandates. Whether actual results will conform to expectations and predictions is subject to known and unknown risks and uncertainties. Actual results could be materially different from management’s expectations. This presentation should be read in conjunction with our Annual Report on Form 10 - K, as amended, for the year ended December 31, 2019 and our Quarterly Report on Form 10 - Q for the quarter ended September 30, 2020, including the sections of those reports entitled “Risk Factors”, as well as the reports and other documents that we subsequently file with the Securities and Exchange Commission (“SEC”), which are available on the SEC’s website at www.sec.gov or at our website at www.mybank.com . Except as required by law, we do not intend to publish updates or revisions of any forward - looking statements we make to reflect new information, future events or otherwise.
3 3 Table of Contents I. First United II. COVID - 19 Response III. Operating and Financial Performance IV. Our Commitment To Strong Governance V. Appendix

4 4 I. First United
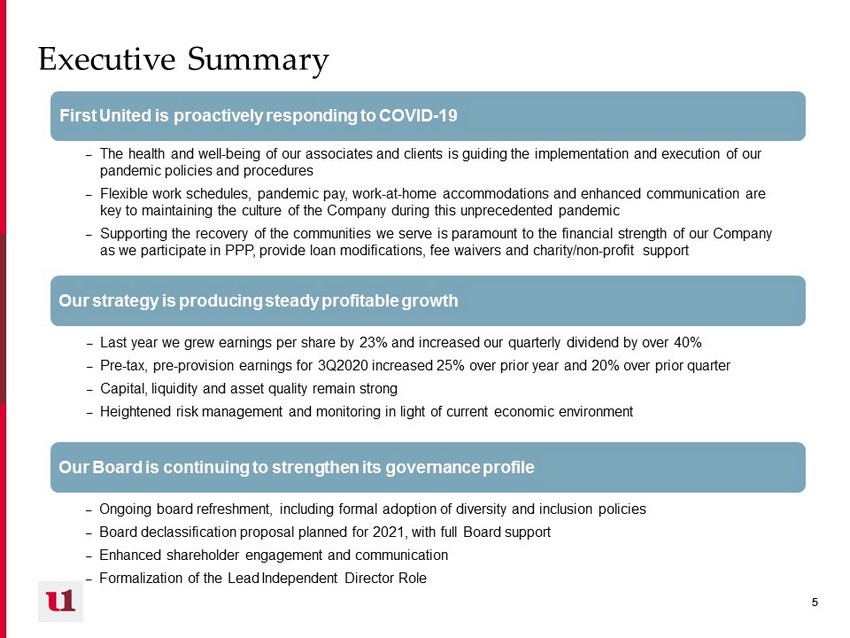
5 5 Executive Summary First United is proactively responding to COVID - 19 Our strategy is producing steady profitable growth Our Board is continuing to strengthen its governance profile – The health and well - being of our associates and clients is guiding the implementation and execution of our pandemic policies and procedures – Flexible work schedules, pandemic pay, work - at - home accommodations and enhanced communication are key to maintaining the culture of the Company during this unprecedented pandemic – Supporting the recovery of the communities we serve is paramount to the financial strength of our Company as we participate in PPP, provide loan modifications, fee waivers and charity/non - profit support – Ongoing board refreshment, including formal adoption of diversity and inclusion policies – Board declassification proposal planned for 2021, with full Board support – Enhanced shareholder engagement and communication – Formalization of the Lead Independent Director Role – Last year we grew earnings per share by 23% and increased our quarterly dividend by over 40% – Pre - tax, pre - provision earnings for 3Q2020 increased 25% over prior year and 20% over prior quarter – Capital, liquidity and asset quality remain strong – Heightened risk management and monitoring in light of current economic environment
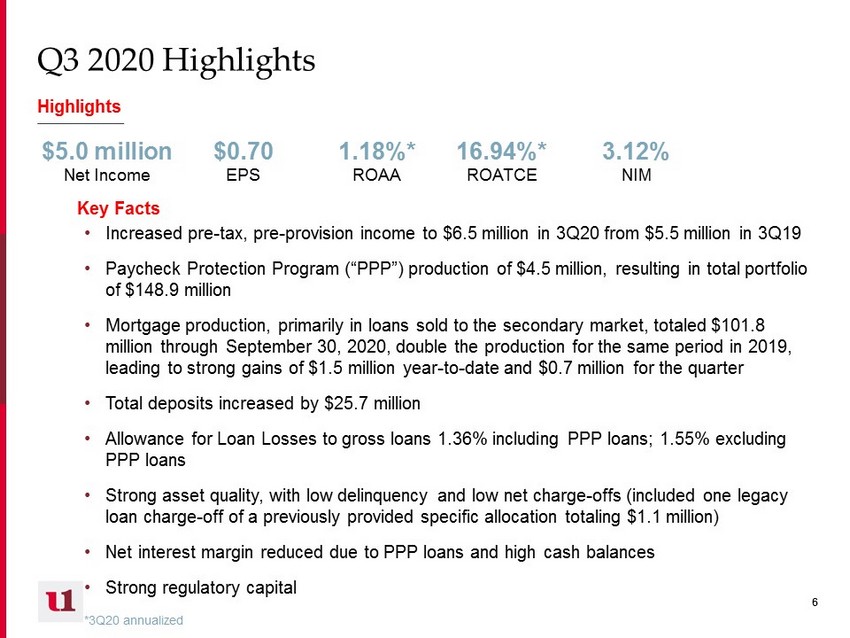
6 6 Q3 2020 Highlights Highlights • Increased pre - tax, pre - provision income to $6.5 million in 3Q20 from $5.5 million in 3Q19 • Paycheck Protection Program (“PPP”) production of $4.5 million, resulting in total portfolio of $148.9 million • Mortgage production, primarily in loans sold to the secondary market, totaled $101.8 million through September 30, 2020, double the production for the same period in 2019, leading to strong gains of $1.5 million year - to - date and $0.7 million for the quarter • Total deposits increased by $25.7 million • Allowance for Loan Losses to gross loans 1.36% including PPP loans; 1.55% excluding PPP loans • Strong asset quality, with low delinquency and low net charge - offs (included one legacy loan charge - off of a previously provided specific allocation totaling $1.1 million) • Net interest margin reduced due to PPP loans and high cash balances • Strong regulatory capital *3Q20 annualized $5.0 million Net Income $0.70 EPS 1.18%* ROAA 16.94%* ROATCE 3.12% NIM Key Facts
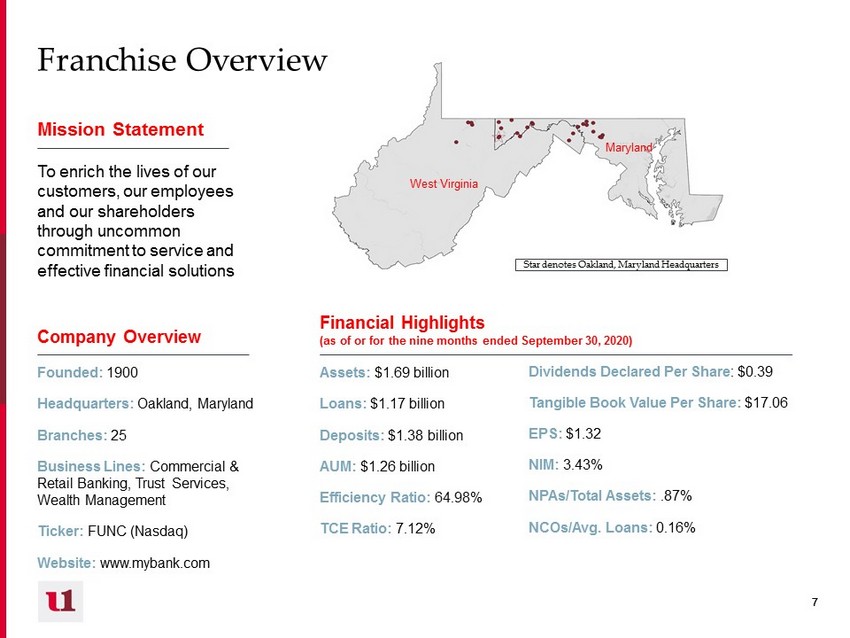
7 7 Mission Statement To enrich the lives of our customers, our employees and our shareholders through uncommon commitment to service and effective financial solutions Company Overview Founded: 1900 Headquarters: Oakland, Maryland Branches: 25 Business Lines: Commercial & Retail Banking, Trust Services, Wealth Management Ticker: FUNC (Nasdaq) Website: www.mybank.com Financial Highlights (as of or for the nine months ended September 30, 2020) Assets: $1.69 billion Loans: $1.17 billion Deposits: $1.38 billion AUM: $1.26 billion Efficiency Ratio: 64.98 % TCE Ratio: 7.12% Dividends Declared Per Share : $0.39 Tangible Book Value Per Share: $17.06 EPS: $1.32 NIM: 3.43% NPAs/Total Assets: .87% NCOs/Avg. Loans: 0.16% West Virginia Maryland Star denotes Oakland, Maryland Headquarters Franchise Overview
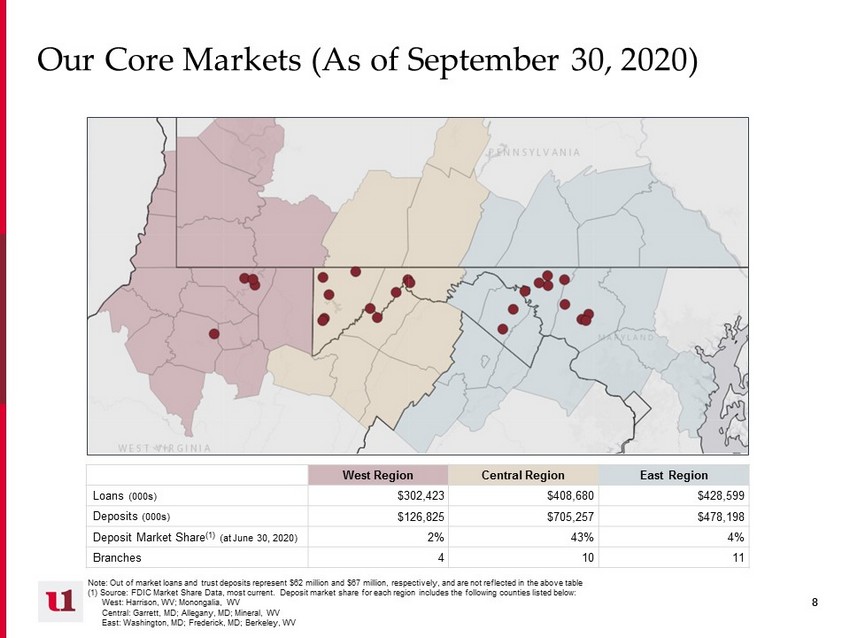
8 8 Our Core Markets (As of September 30, 2020) Note: Out of market loans and trust deposits represent $62 million and $67 million, respectively, and are not reflected in th e a bove table (1) Source: FDIC Market Share Data, most current. Deposit market share for each region includes the following counties liste d b elow: West: Harrison, WV; Monongalia, WV Central: Garrett, MD; Allegany, MD; Mineral, WV East: Washington, MD; Frederick, MD; Berkeley, WV West Region Central Region East Region Loans (000s) $302,423 $408,680 $428,599 Deposits (000s) $126,825 $705,257 $478,198 Deposit Market Share (1) (at June 30, 2020) 2% 43% 4% Branches 4 10 11
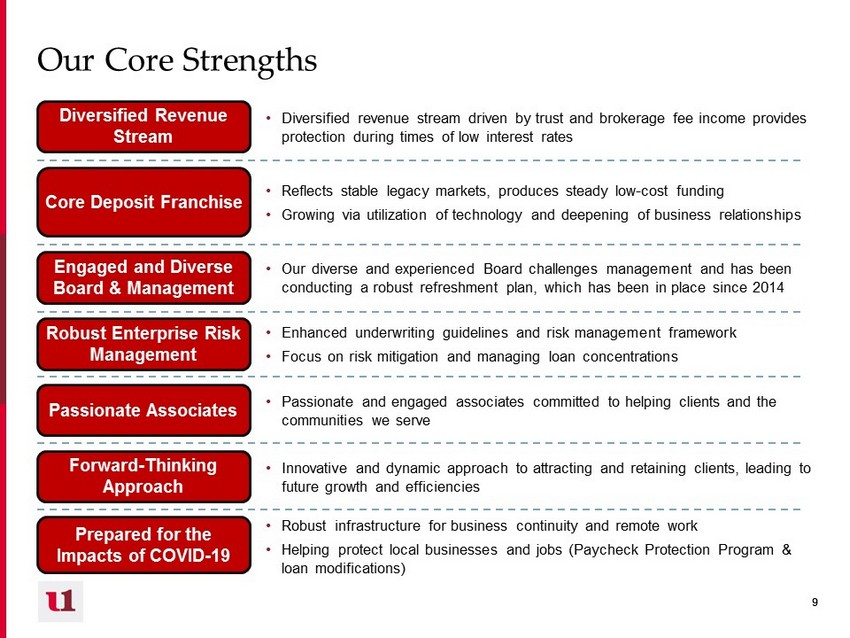
9 9 Our Core Strengths Engaged and Diverse Board & Management • Our diverse and experienced Board challenges management and has been conducting a robust refreshment plan, which has been in place since 2014 Core Deposit Franchise Diversified Revenue Stream Forward - Thinking Approach Robust Enterprise Risk Management Passionate Associates • Reflects stable legacy markets, produces steady low - cost funding • Growing via utilization of technology and deepening of business relationships • Diversified revenue stream driven by trust and brokerage fee income provides protection during times of low interest rates • Innovative and dynamic approach to attracting and retaining clients, leading to future growth and efficiencies • Enhanced underwriting guidelines and risk management framework • Focus on risk mitigation and managing loan concentrations • Passionate and engaged associates committed to helping clients and the communities we serve Prepared for the Impacts of COVID - 19 • Robust infrastructure for business continuity and remote work • Helping protect local businesses and jobs (Paycheck Protection Program & loan modifications)

10 10 II. COVID - 19 Response
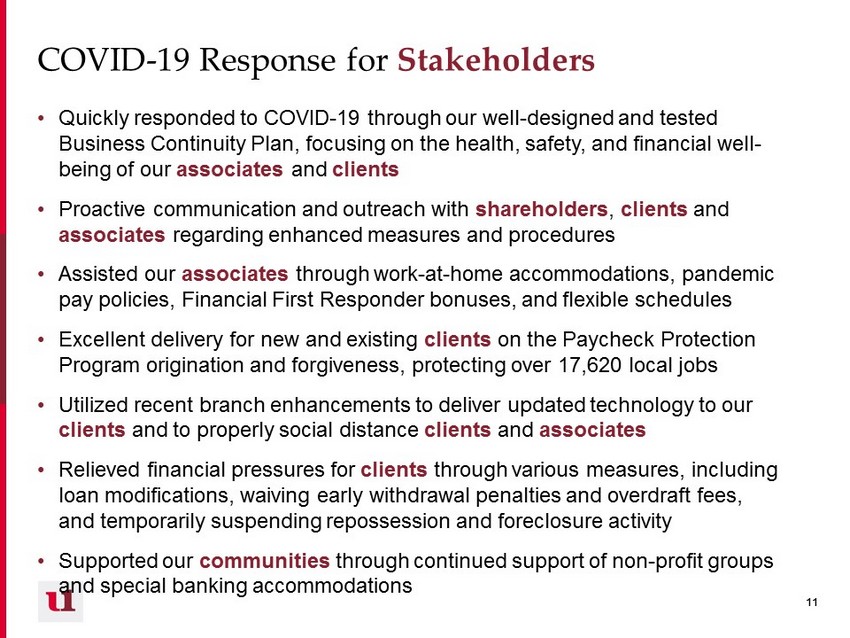
11 11 COVID - 19 Response for Stakeholders • Quickly responded to COVID - 19 through our well - designed and tested Business Continuity Plan, focusing on the health, safety, and financial well - being of our associates and clients • Proactive communication and outreach with shareholders , clients and associates regarding enhanced measures and procedures • Assisted our associates through work - at - home accommodations, pandemic pay policies, Financial First Responder bonuses, and flexible schedules • Excellent delivery for new and existing clients on the Paycheck Protection Program origination and forgiveness, protecting over 17,620 local jobs • Utilized recent branch enhancements to deliver updated technology to our clients and to properly social distance clients and associates • Relieved financial pressures for clients through various measures, including loan modifications, waiving early withdrawal penalties and overdraft fees, and temporarily suspending repossession and foreclosure activity • Supported our communities through continued support of non - profit groups and special banking accommodations

12 12 Clients • 90% of associates (excluding front line community office staff) are working remotely each week; no furloughs or layoffs • Pandemic Pay Policy and flexible scheduling for associates who are unable to work, such as those who need to care for family members during the crisis • Financial First Responder bonus paid to PPP team and essential associates reporting to work daily • Comprehensive protocols including suspension of travel, daily updates and enhanced branch cleaning • Enduring associate engagement will strengthen our culture and organization well beyond the crisis. First United understands the long - term impact of our stewardship of human capital. Associates • Funded 1,174 Paycheck Protection Program loans protecting 17,620 jobs, totaling $149 million (1) • Waived certificates of deposit early withdrawal penalties, overdraft fees for insufficient funds • Provided total COVID - 19 loan modifications for 643 loans totaling $260.4 million, of which modifications for 42 loans totaling $19.3 million are still in effect and 51 loans totaling $9.6 million paid off (2) • Our business ties to our clients and communities will withstand the crisis, support our market presence and enhance our competitive positioning long term. Our clients and communities are not just “stakeholders,” but also a key value driver for our shareholders. Our clients and associates are integral to our long - term strategy, and we are going the extra mile for these key stakeholders while we all navigate the crisis together (1) As of September 30, 2020 (2) As of October 30, 2020 Delivering for Stakeholders Amidst the COVID - 19 Crisis

13 13 Active COVID - 19 Modifications 97% of the active commercial loan modifications are for deferred P&I, and 3% are for extended interest only Industry Category # of Loans (**) Balance (000s) Balance as % of Total Portfolio # of Loans (**) Balance (000s) Balance as % of Category # of Loans (**) Balance (000s) Balance as % of Category RE/Rental/Leasing - NOO 90 124,370$ 11.9% - -$ 0.0% 26 57,687$ 46.4% RE/Rental/Leasing - OO, C&I 320 100,358 9.6% 2 141 0.1% 46 36,886 36.8% Construction - Developers 20 57,977 5.6% - - 0.0% 1 2,975 5.1% Accommodations 33 47,857 4.6% 6 13,519 28.2% 15 38,778 81.0% Services 207 45,926 4.4% - - 0.0% 26 15,357 33.4% RE/Rental/Leasing - Multifamily 60 34,048 3.3% - - 0.0% 14 7,087 20.8% Health Care/Social Assistance 107 32,204 3.1% - - 0.0% 23 11,334 35.2% RE/Rental/Leasing - Developers 39 25,840 2.5% - - 0.0% 1 194 0.7% Manufacturing 50 25,519 2.4% - - 0.0% 6 10,640 41.7% Construction - All Other 268 24,199 2.3% 5 396 1.6% 25 3,507 14.5% Prof/Scientific/Technical 108 19,820 1.9% - - 0.0% 24 7,491 37.8% Trade 109 16,890 1.6% - - 0.0% 4 166 1.0% Transportation/Warehousing 226 15,979 1.5% - - 0.0% 5 1,036 6.5% Public Administration 32 11,110 1.1% - - 0.0% - - 0.0% Food Service 46 10,536 1.0% - - 0.0% 12 3,155 29.9% Entertainment/Recreation 24 8,341 0.8% 1 284 3.4% 7 7,218 86.5% Agriculture 52 4,595 0.4% - - 0.0% 2 494 10.7% Energy 12 1,645 0.2% - - 0.0% - - 0.0% Total Commercial 1,803 607,214 58.2% 14 14,340 2.4% 237 204,002 33.6% Total Residential Mortgage 2,157 334,185 32.0% 16 4,508 1.3% 169 41,686 12.5% Total Consumer 6,508 102,091 9.8% 12 403 0.4% 186 5,145 5.0% Total Loans 10,468 1,043,491$ 100.0% 42 19,250$ 1.8% 592 250,833$ 24.0% (*) Excluding 1,174 PPP Loans totaling $148,855 million (**) Including active loans / lines with no outstanding balance Total Loans at 9/30/20 (*) COVID Modifications Still In Effect at 10/30/20 All COVID Modifications
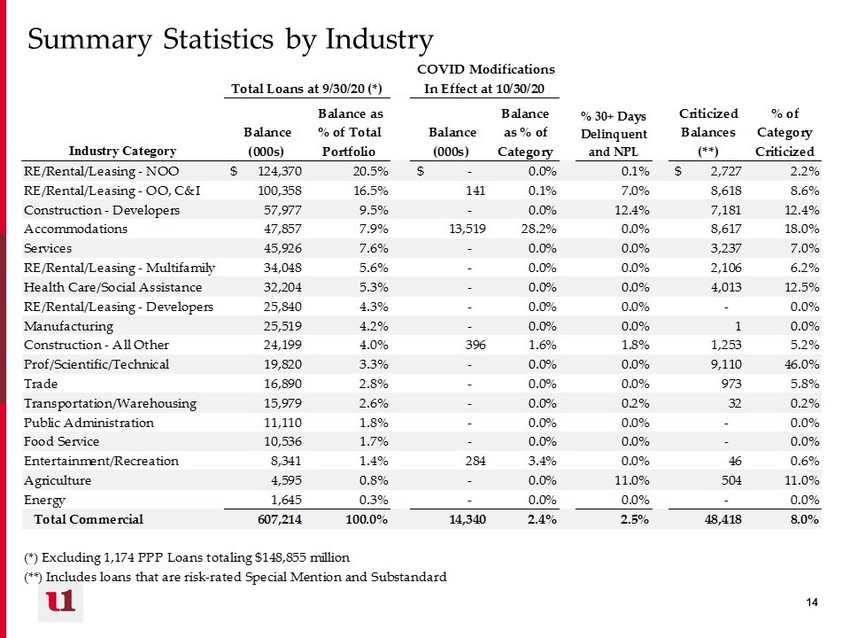
14 14 Summary Statistics by Industry Industry Category Balance (000s) Balance as % of Total Portfolio Balance (000s) Balance as % of Category % 30+ Days Delinquent and NPL Criticized Balances (**) % of Category Criticized RE/Rental/Leasing - NOO 124,370$ 20.5% -$ 0.0% 0.1% 2,727$ 2.2% RE/Rental/Leasing - OO, C&I 100,358 16.5% 141 0.1% 7.0% 8,618 8.6% Construction - Developers 57,977 9.5% - 0.0% 12.4% 7,181 12.4% Accommodations 47,857 7.9% 13,519 28.2% 0.0% 8,617 18.0% Services 45,926 7.6% - 0.0% 0.0% 3,237 7.0% RE/Rental/Leasing - Multifamily 34,048 5.6% - 0.0% 0.0% 2,106 6.2% Health Care/Social Assistance 32,204 5.3% - 0.0% 0.0% 4,013 12.5% RE/Rental/Leasing - Developers 25,840 4.3% - 0.0% 0.0% - 0.0% Manufacturing 25,519 4.2% - 0.0% 0.0% 1 0.0% Construction - All Other 24,199 4.0% 396 1.6% 1.8% 1,253 5.2% Prof/Scientific/Technical 19,820 3.3% - 0.0% 0.0% 9,110 46.0% Trade 16,890 2.8% - 0.0% 0.0% 973 5.8% Transportation/Warehousing 15,979 2.6% - 0.0% 0.2% 32 0.2% Public Administration 11,110 1.8% - 0.0% 0.0% - 0.0% Food Service 10,536 1.7% - 0.0% 0.0% - 0.0% Entertainment/Recreation 8,341 1.4% 284 3.4% 0.0% 46 0.6% Agriculture 4,595 0.8% - 0.0% 11.0% 504 11.0% Energy 1,645 0.3% - 0.0% 0.0% - 0.0% Total Commercial 607,214 100.0% 14,340 2.4% 2.5% 48,418 8.0% (*) Excluding 1,174 PPP Loans totaling $148,855 million (**) Includes loans that are risk-rated Special Mention and Substandard Total Loans at 9/30/20 (*) COVID Modifications In Effect at 10/30/20
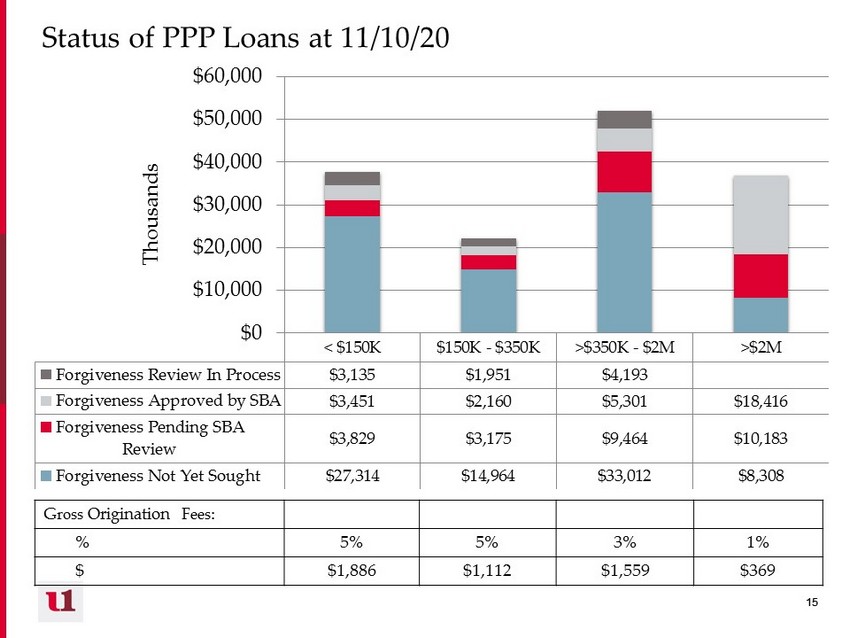
15 15 Status of PPP Loans at 11/10/20 < $150K $150K - $350K >$350K - $2M >$2M Forgiveness Review In Process $3,135 $1,951 $4,193 Forgiveness Approved by SBA $3,451 $2,160 $5,301 $18,416 Forgiveness Pending SBA Review $3,829 $3,175 $9,464 $10,183 Forgiveness Not Yet Sought $27,314 $14,964 $33,012 $8,308 $0 $10,000 $20,000 $30,000 $40,000 $50,000 $60,000 Thousands Gross Origination Fees: % 5% 5% 3% 1% $ $1,886 $1,112 $1,559 $369
16 16 III. Operating and Financial Performance
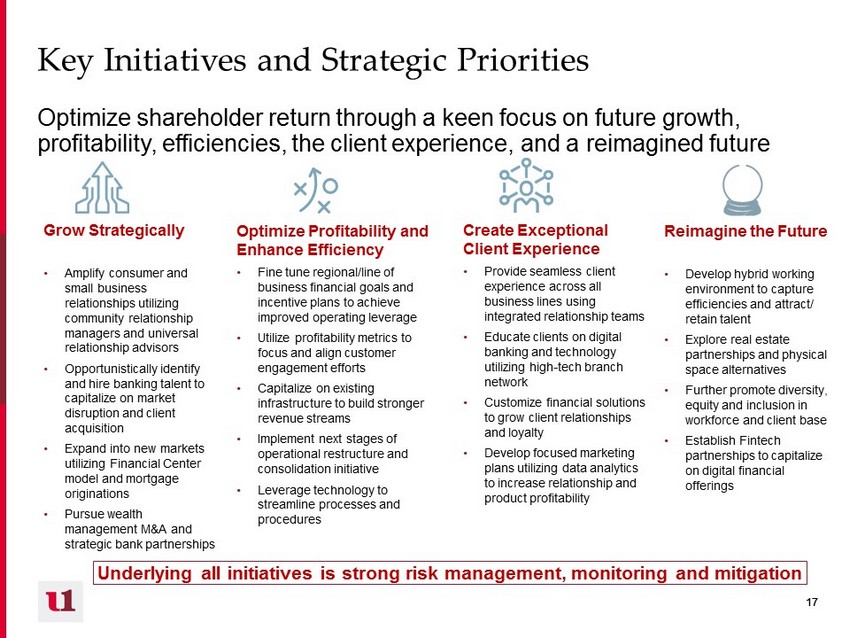
17 17 Key Initiatives and Strategic Priorities Optimize shareholder return through a keen focus on future growth, profitability, efficiencies, the client experience, and a reimagined future Create Exceptional Client Experience • Provide seamless client experience across all business lines using integrated relationship teams • Educate clients on digital banking and technology utilizing high - tech branch network • Customize financial solutions to grow client relationships and loyalty • Develop focused marketing plans utilizing data analytics to increase relationship and product profitability Grow Strategically • Amplify consumer and small business relationships utilizing community relationship managers and universal relationship advisors • Opportunistically identify and hire banking talent to capitalize on market disruption and client acquisition • Expand into new markets utilizing Financial Center model and mortgage originations • Pursue wealth management M&A and strategic bank partnerships Optimize Profitability and Enhance Efficiency • Fine tune regional/line of business financial goals and incentive plans to achieve improved operating leverage • Utilize profitability metrics to focus and align customer engagement efforts • Capitalize on existing infrastructure to build stronger revenue streams • Implement next stages of operational restructure and consolidation initiative • Leverage technology to streamline processes and procedures Underlying all initiatives is strong risk management, monitoring and mitigation Reimagine the Future • Develop hybrid working environment to capture efficiencies and attract/ retain talent • Explore real estate partnerships and physical space alternatives • Further promote diversity, equity and inclusion in workforce and client base • Establish Fintech partnerships to capitalize on digital financial offerings

18 18 Strong Risk Management, Monitoring and Mitigation Underlies all strategic priorities Asset Quality • Low net charge offs and strong asset quality as a result of conservative and proactive credit culture • Protective provision expense of $5.7 million YTD related to qualitative factor adjustments due to COVID - 19 uncertainties • Strong reserves - ALL level of 1.55%, excluding PPP loans • Diversified commercial loan portfolio and geographic footprint • Disciplined loan growth strategy, concentration management, stress testing and exception tracking and monitoring • Proactive, ongoing client engagement and experienced work - out teams • Weekly regional portfolio Quarterly Criticized Asset Reviews • Centralized risk rating, robust external loan review and monitoring of risk rating migration and delinquency trends • Established loan approval levels Liquidity Management • Loan to deposit ratio of 87% • Liquidity contingency plan in place • Liquidity stress testing performed quarterly with strong liquidity under various scenarios • Available borrowing capacity of $432.5 million through correspondent lines of credit, FHLB and PPPLF • Strong, stable low - cost core deposit franchise of 79% of total interest - earning assets Capital • Strong capital levels well above regulatory “well - capitalized” definition • Conservative dividend payout policy to improve TCE • Share repurchase plan authorized and available • Capital stress tests indicate Bank is well positioned to absorb potential losses
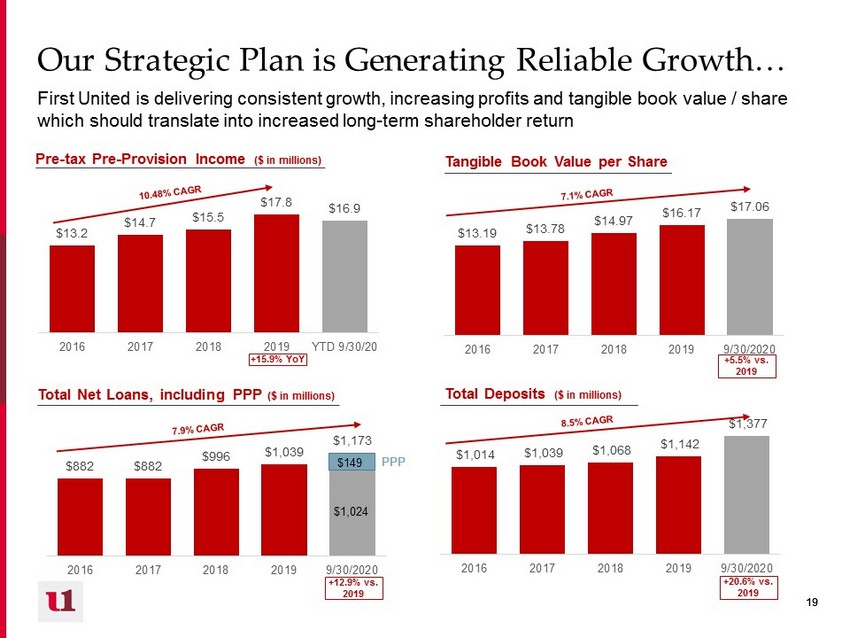
19 19 $13.2 $14.7 $15.5 $17.8 $16.9 2016 2017 2018 2019 YTD 9/30/20 $1,014 $1,039 $1,068 $1,142 $1,377 2016 2017 2018 2019 9/30/2020 $882 $882 $996 $1,039 $1,173 2016 2017 2018 2019 9/30/2020 $1,024 Our Strategic Plan is Generating Reliable Growth… Pre - tax Pre - Provision Income ($ in millions) Tangible Book Value per Share Total Deposits ($ in millions) Total Net Loans, including PPP ($ in millions) First United is delivering consistent growth, increasing profits and tangible book value / share which should translate into increased long - term shareholder return $13.19 $13.78 $14.97 $16.17 $17.06 2016 2017 2018 2019 9/30/2020 +15.9% YoY +5.5% vs. 2019 +12.9% vs. 2019 +20.6% vs. 2019 $149 PPP
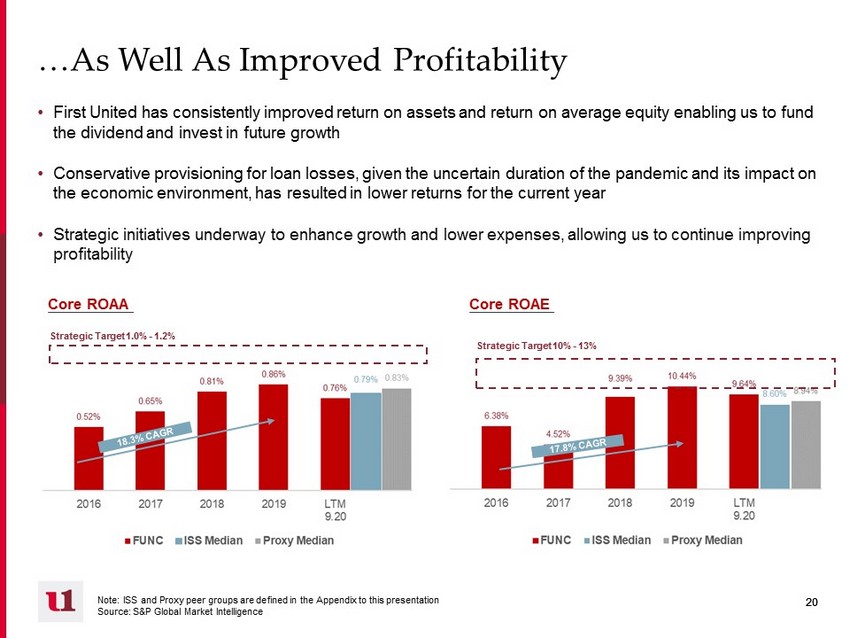
20 20 …As Well As Improved Profitability • First United has consistently improved return on assets and return on average equity enabling us to fund the dividend and invest in future growth • Conservative provisioning for loan losses, given the uncertain duration of the pandemic and its impact on the economic environment, has resulted in lower returns for the current year • Strategic initiatives underway to enhance growth and lower expenses, allowing us to continue improving profitability Core ROAE Core ROAA Note: ISS and Proxy peer groups are defined in the Appendix to this presentation Source: S&P Global Market Intelligence Strategic Target 1.0% - 1.2% Strategic Target 10% - 13%

21 21 Total 1 - 4 Family CRE - OO CRE - NOO Multi - family C&D C&I Consumer PPP Proactive Loan Portfolio Management • Diverse portfolio loan types and industries reduce Commercial portfolio risk • Focus on risk mitigation and managing of concentrations – CRE / Total Capital: 230% – ADC / Total Capital: 104% Loan Portfolio Mix (9/30/20) Commercial Loan Mix, excl PPP (9/30/20) Industry Balance (MMs) Average Balance (MMs) % RE/Rental/Leasing - NOO $124 $1.4 20% RE/Rental/Leasing – OO, C&I 100 .3 16% Construction - Developers 58 2.9 10% Accommodations 48 1.5 8% Services 46 .2 8% RE/Rental/Leasing - Multifamily 34 .6 6% Health Care / Social Assistance 32 .3 5% RE/Rental/Leasing - Developers 26 .7 4% Manufacturing 26 .5 4% Construction – All Other 24 .1 4% All Other 89 .1 15% Type Balance (MMs) Average Balance (MMs) % Total 1 - 4 Family $399 $.1 33% CRE – OO 142 .5 12% CRE – NOO 176 1.4 15% Multi - family 35 .6 3% C&D 127 .3 11% C&I 129 .1 11% Consumer 35 .01 3% PPP 149 .1 12%
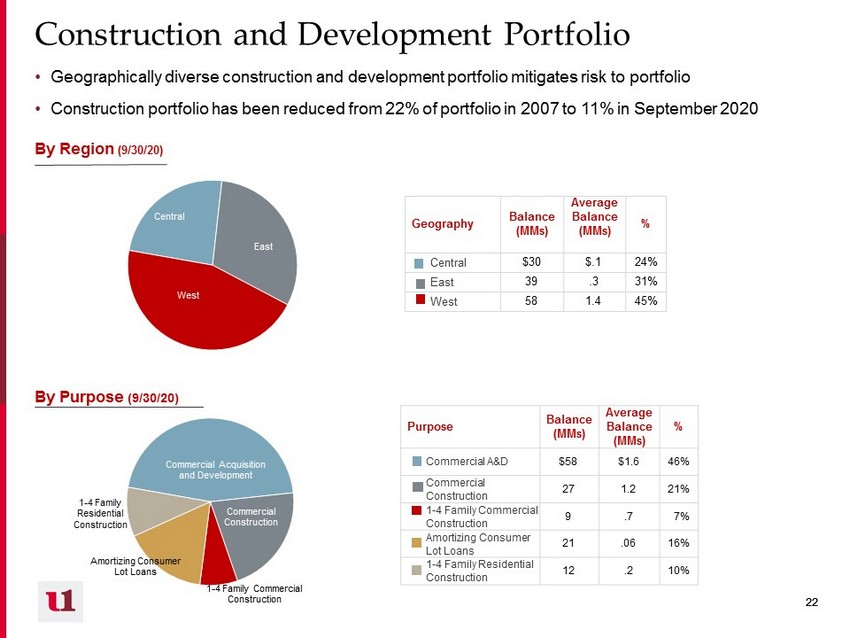
22 22 Commercial Acquisition and Development Commercial Construction 1 - 4 Family Commercial Construction Amortizing Consumer Lot Loans 1 - 4 Family Residential Construction Construction and Development Portfolio • Geographically diverse construction and development portfolio mitigates risk to portfolio • Construction portfolio has been reduced from 22% of portfolio in 2007 to 11% in September 2020 By Region (9/30/20) Central East West Geography Balance (MMs) Average Balance (MMs) % Central $30 $.1 24% East 39 .3 31% West 58 1.4 45% By Purpose (9/30/20) Purpose Balance (MMs) Average Balance (MMs) % Commercial A&D $58 $1.6 46% Commercial Construction 27 1.2 21% 1 - 4 Family Commercial Construction 9 .7 7% Amortizing Consumer Lot Loans 21 .06 16% 1 - 4 Family Residential Construction 12 .2 10%
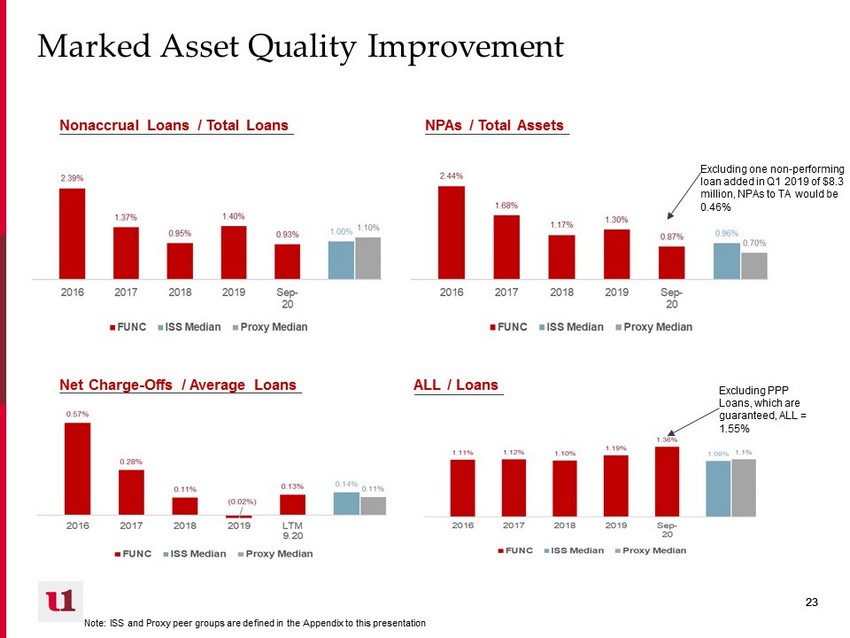
23 23 Marked Asset Quality Improvement NPAs / Total Assets ALL / Loans Excluding one non - performing loan added in Q1 2019 of $8.3 million, NPAs to TA would be 0.46% Note: ISS and Proxy peer groups are defined in the Appendix to this presentation Excluding PPP Loans, which are guaranteed, ALL = 1.55% Net Charge - Offs / Average Loans Nonaccrual Loans / Total Loans
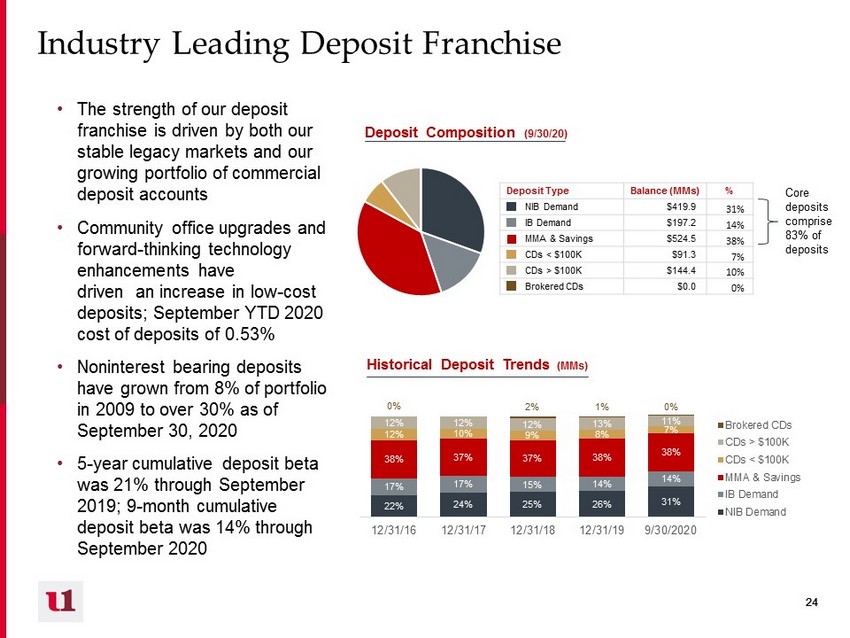
24 24 Industry Leading Deposit Franchise • The strength of our deposit franchise is driven by both our stable legacy markets and our growing portfolio of commercial deposit accounts • Community office upgrades and forward - thinking technology enhancements have driven an increase in low - cost deposits; September YTD 2020 cost of deposits of 0.53% • Noninterest bearing deposits have grown from 8% of portfolio in 2009 to over 30% as of September 30, 2020 • 5 - year cumulative deposit beta was 21% through September 2019; 9 - month cumulative deposit beta was 14% through September 2020 Deposit Composition (9/30/20) 22% 24% 25% 26% 31% 17% 17% 15% 14% 14% 38% 37% 37% 38% 38% 12% 10% 9% 8% 7% 12% 12% 12% 13% 11% 0% 2% 1% 0% 12/31/16 12/31/17 12/31/18 12/31/19 9/30/2020 Brokered CDs CDs > $100K CDs < $100K MMA & Savings IB Demand NIB Demand Historical Deposit Trends (MMs) Deposit Type Balance (MMs) % NIB Demand $419.9 31% IB Demand $197.2 14% MMA & Savings $524.5 38% CDs < $100K $91.3 7% CDs > $100K $144.4 10% Brokered CDs $0.0 0% Core deposits comprise 83% of deposits
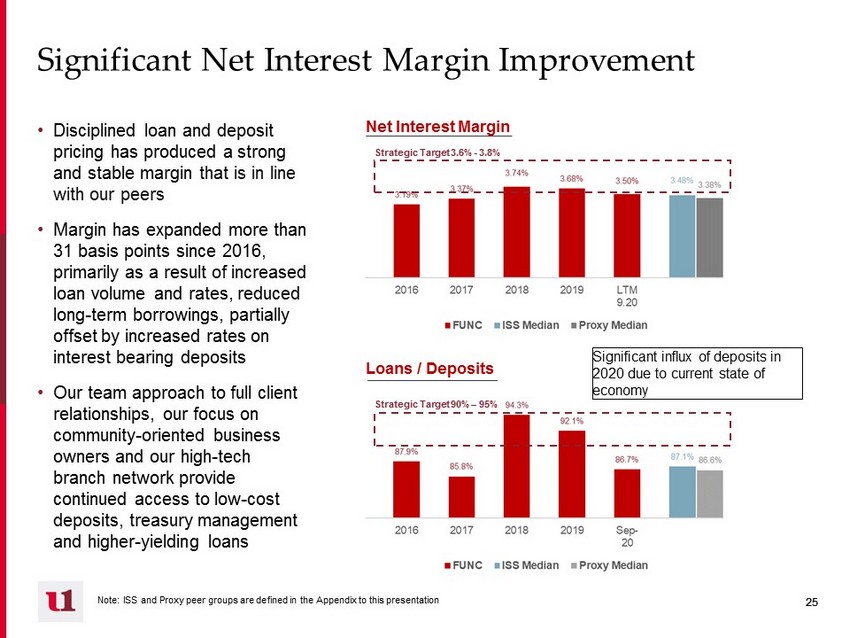
25 25 Significant Net Interest Margin Improvement • Disciplined loan and deposit pricing has produced a strong and stable margin that is in line with our peers • Margin has expanded more than 31 basis points since 2016, primarily as a result of increased loan volume and rates, reduced long - term borrowings, partially offset by increased rates on interest bearing deposits • Our team approach to full client relationships, our focus on community - oriented business owners and our high - tech branch network provide continued access to low - cost deposits, treasury management and higher - yielding loans Net Interest Margin Loans / Deposits Strategic Target 3.6% - 3.8% Note: ISS and Proxy peer groups are defined in the Appendix to this presentation Strategic Target 90% – 95% Significant influx of deposits in 2020 due to current state of economy CR18
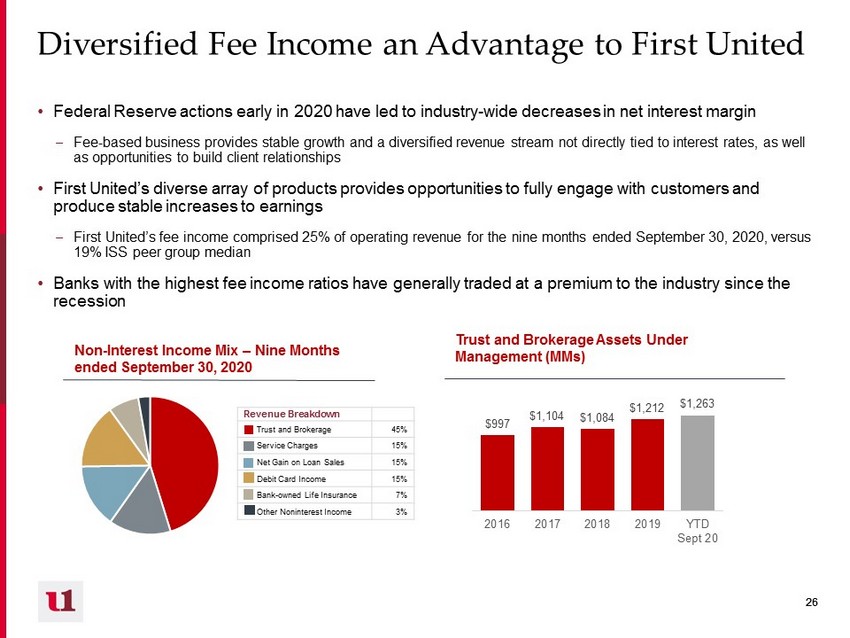
26 26 Diversified Fee Income an Advantage to First United • Federal Reserve actions early in 2020 have led to industry - wide decreases in net interest margin – Fee - based business provides stable growth and a diversified revenue stream not directly tied to interest rates, as well as opportunities to build client relationships • First United’s diverse array of products provides opportunities to fully engage with customers and produce stable increases to earnings – First United’s fee income comprised 25% of operating revenue for the nine months ended September 30, 2020, versus 19% ISS peer group median • Banks with the highest fee income ratios have generally traded at a premium to the industry since the recession Trust and Brokerage Assets Under Management (MMs) Non - Interest Income Mix – Nine Months ended September 30, 2020 75% $997 $1,104 $1,084 $1,212 $1,263 2016 2017 2018 2019 YTD Sept 20 Revenue Breakdown Trust and Brokerage 45% Service Charges 15% Net Gain on Loan Sales 15% Debit Card Income 15% Bank - owned Life Insurance 7% Other Noninterest Income 3%
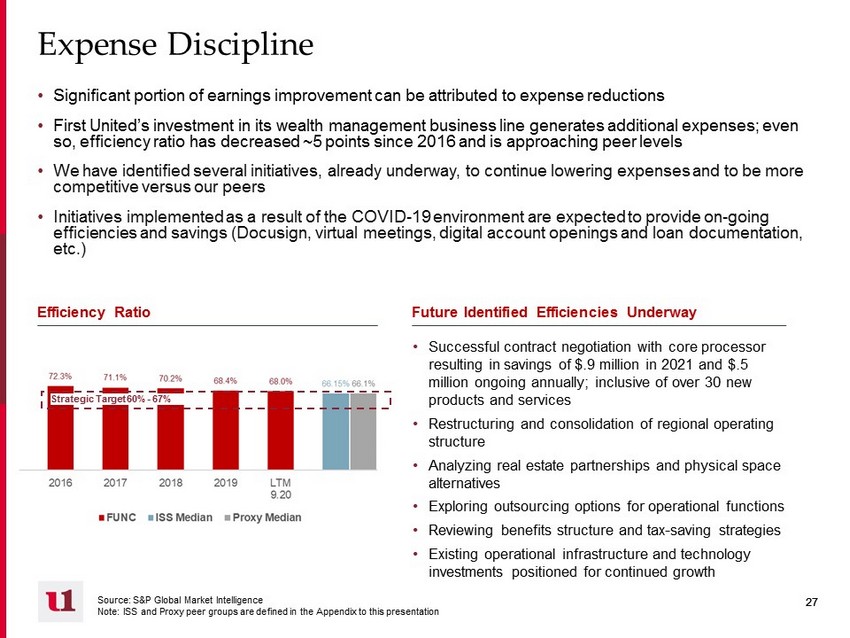
27 27 Expense Discipline • Significant portion of earnings improvement can be attributed to expense reductions • First United’s investment in its wealth management business line generates additional expenses; even so, efficiency ratio has decreased ~5 points since 2016 and is approaching peer levels • We have identified several initiatives, already underway, to continue lowering expenses and to be more competitive versus our peers • Initiatives implemented as a result of the COVID - 19 environment are expected to provide on - going efficiencies and savings ( Docusign , virtual meetings, digital account openings and loan documentation, etc.) Efficiency Ratio Source: S&P Global Market Intelligence Note: ISS and Proxy peer groups are defined in the Appendix to this presentation • Successful contract negotiation with core processor resulting in savings of $.9 million in 2021 and $.5 million ongoing annually; inclusive of over 30 new products and services • Restructuring and consolidation of regional operating structure • Analyzing real estate partnerships and physical space alternatives • Exploring outsourcing options for operational functions • Reviewing benefits structure and tax - saving strategies • Existing operational infrastructure and technology investments positioned for continued growth Future Identified Efficiencies Underway Strategic Target 60% - 67%

28 28 Prudential Capital Management $13.19 $13.78 $14.97 $16.17 $17.06 2016 2017 2018 2019 9/30/2020 Growing Tangible Book – TBV/Share 6.33% 7.35% 7.72% 8.03% 7.12% 2016 2017 2018 2019 9/30/2020 Historical Capital Trends – TCE/TA 16.71% 15.98% 15.91% 16.29% 16.14% 2016 2017 2018 2019 9/30/2020 Historical Capital Trends – Total RBC Ratio* Regulatory Capital Composition (9/30/20) Loan Type Balance (MMs) % Tier 1 Common (CET1) $148 78% Additional Tier 1 Capital 27 14% Tier 2 Capital 15 8% *2016 and 2017 capital ratios impacted by repayment of preferred stock (2016 and 2017) and Trust Preferred debentures (2017) Excluding PPP Loans, TCE/TA = 7.79%

29 29 Total Shareholder Return Source: S&P Global Market Intelligence; includes price change and reinvested cash dividends (1) SNL U.S. $1B - $5B Bank Index (2) Peer groups are defined in the Appendix to this presentation. Peer group refers to median unless stated otherwise • Our long - term performance reflects the fundamental operations and earnings growth of our company • The banking industry has been significantly impacted by the current pandemic and its effect on the economy. Our short - term stock price reflects the uncertainties of how this crisis will influence our clients, our local economic environment and our balance sheet Total Return as of December 31, 2019 Total Return YTD as of September 30, 2020
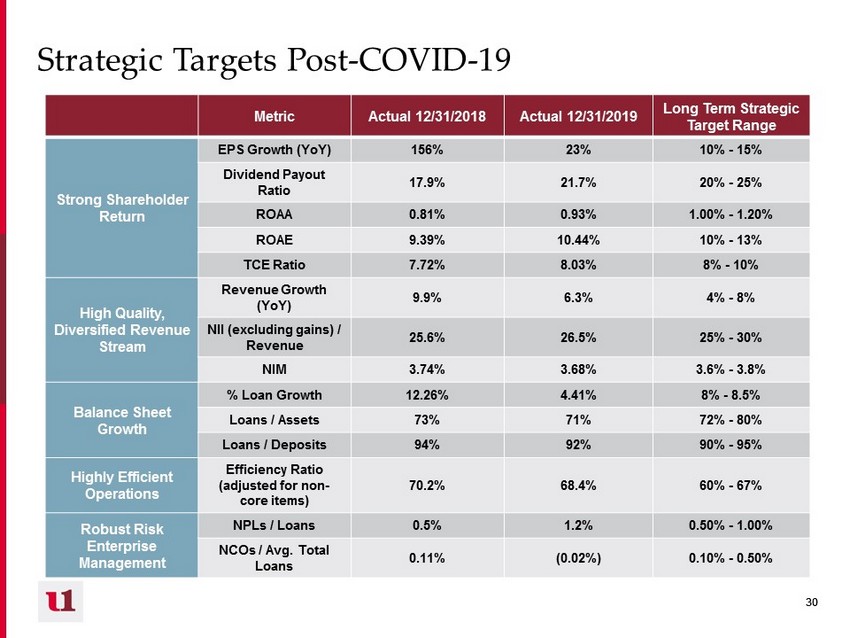
30 30 Strategic Targets Post - COVID - 19 Metric Actual 12/31/2018 Actual 12/31/2019 Long Term Strategic Target Range Strong Shareholder Return EPS Growth (YoY) 156% 23% 10% - 15% Dividend Payout Ratio 17.9% 21.7% 20% - 25% ROAA 0.81% 0.93% 1.00% - 1.20% ROAE 9.39% 10.44% 10% - 13% TCE Ratio 7.72% 8.03% 8% - 10% High Quality, Diversified Revenue Stream Revenue Growth (YoY) 9.9% 6.3% 4% - 8% NII (excluding gains) / Revenue 25.6% 26.5% 25% - 30% N IM 3.74% 3.68% 3.6% - 3.8% Balance Sheet Growth % Loan Growth 12.26% 4.41% 8% - 8.5% Loans / Assets 73% 71% 72% - 80% Loans / Deposits 94% 92% 90% - 95% Highly Efficient Operations Efficiency Ratio (adjusted for non - core items) 70.2% 68.4% 60% - 67% Robust Risk Enterprise Management NPLs / Loans 0.5% 1.2% 0.50% - 1.00% NCOs / Avg. Total Loans 0.11% (0.02%) 0.10% - 0.50%

31 31 IV. Our Commitment to Strong Corporate Governance

32 32 Ongoing Board Refreshment Program Our ongoing Board evolution will result in the strategic refreshment of a majority of our independent directors, maintain our commitment to diversity, and continuously update the skill set of our Board • In July 2020 , Elaine McDonald retired, and a search is underway for independent board candidates that will enhance our Board's diversity and provide expertise in key areas such as technology and innovation, finance, M&A and banking • One additional director will retire by our 2021 annual meeting • Two additional directors will retire in 2023 Future Plans : Four more directors within three years • In 2014 - 15 , our current Board refreshment efforts began with the addition of three new directors: John Barr, Brian Boal and Marisa Shockley • In 2019 , we reduced our Board size upon the retirement of Robert Stuck • In 2020 , Robert Kurtz, our longest - tenured director retired, and Patricia Milon was named to the Board (1) Refreshment to Date : Four directors within five years (1) Originally planned for 2021 but accelerated based on shareholder feedback
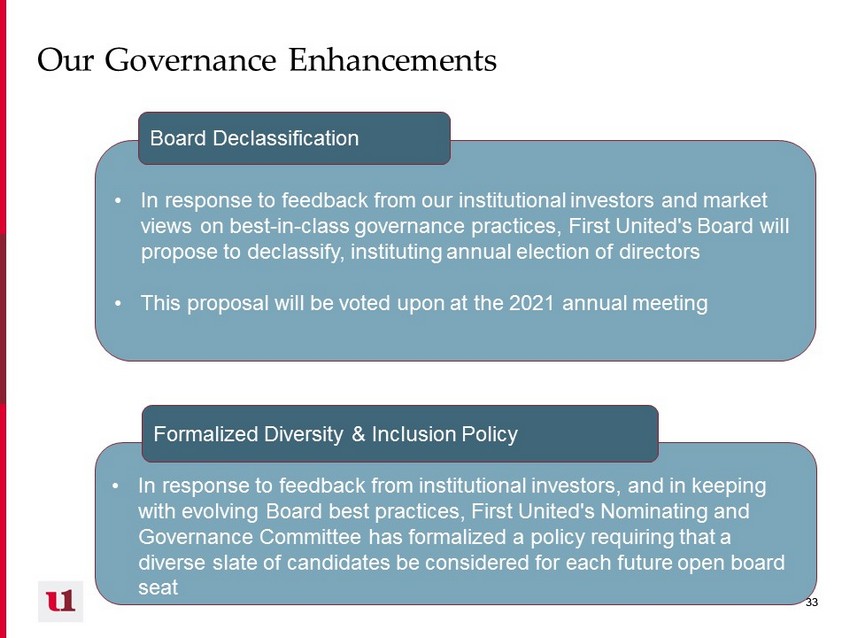
33 33 Our Governance Enhancements Board Declassification • In response to feedback from our institutional investors and market views on best - in - class governance practices, First United's Board will propose to declassify, instituting annual election of directors • This proposal will be voted upon at the 2021 annual meeting Board Declassification • In response to feedback from institutional investors, and in keeping with evolving Board best practices, First United's Nominating and Governance Committee has formalized a policy requiring that a diverse slate of candidates be considered for each future open board seat Formalized Diversity & Inclusion Policy
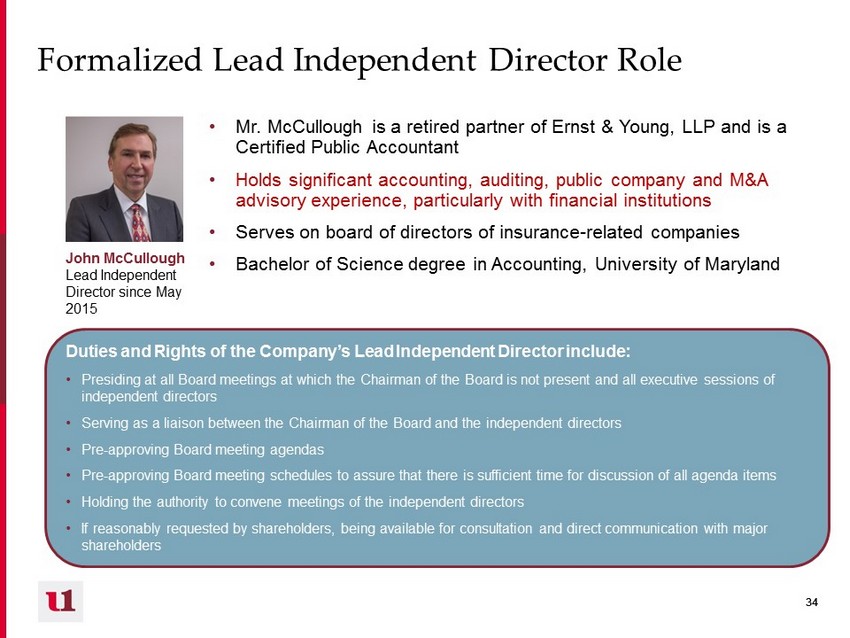
34 34 Formalized Lead Independent Director Role • Mr. McCullough is a retired partner of Ernst & Young, LLP and is a Certified Public Accountant • Holds significant accounting, auditing, public company and M&A advisory experience, particularly with financial institutions • Serves on board of directors of insurance - related companies • Bachelor of Science degree in Accounting, University of Maryland Duties and Rights of the Company’s Lead Independent Director include: • Presiding at all Board meetings at which the Chairman of the Board is not present and all executive sessions of independent directors • Serving as a liaison between the Chairman of the Board and the independent directors • Pre - approving Board meeting agendas • Pre - approving Board meeting schedules to assure that there is sufficient time for discussion of all agenda items • Holding the authority to convene meetings of the independent directors • If reasonably requested by shareholders, being available for consultation and direct communication with major shareholders John McCullough Lead Independent Director since May 2015

35 35 Strong Investor Relations and Shareholder Communications and Engagement Clear long - term strategic plan with performance targets x Dedicated Investor Relations contact x Investor non - deal roadshows x Members of the Board and senior management routinely engage with shareholders and other stakeholders, and management regularly updates the Board on the context of ongoing investor discussions. These engagements help the Board and management gain feedback on a variety of topics, including strategic and financial performance, executive compensation, Board composition, and leadership structure. Quarterly investor presentation and outreach to institutional and retail shareholders x How to contact your Board: Shareholders and interested parties wishing to contact our Board may send a letter to First United Co rporation Board of Directors, c/o Tonya K. Sturm, Secretary, First United Corporation, 19 South Second Street, Oakland, Maryland, 21550 - 0009 or by e - mail at tsturm@mybank.com. The Secretary will deliver all shareholder communications directly to the Board for consideration

36 36 V. Appendix
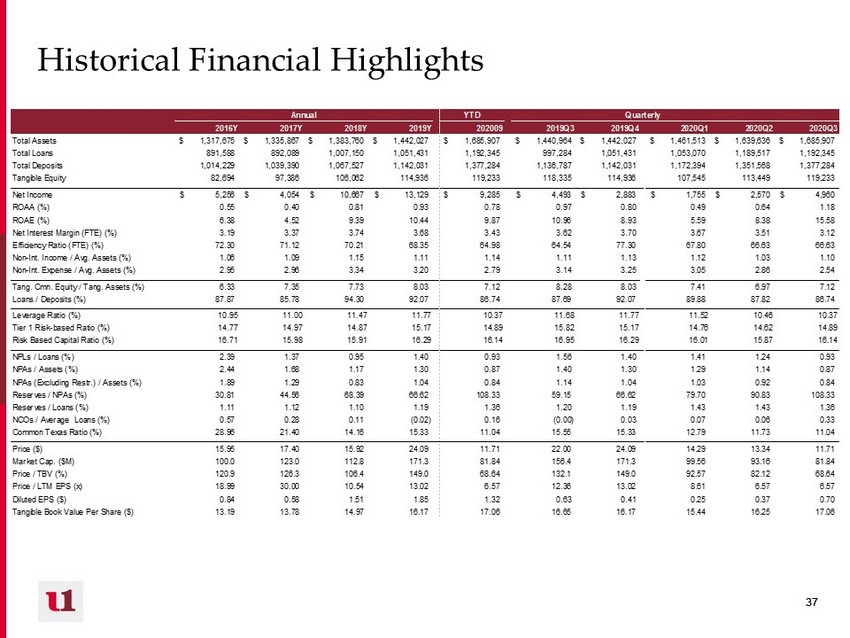
37 37 Historical Financial Highlights YTD 2016Y 2017Y 2018Y 2019Y 202009 2019Q3 2019Q4 2020Q1 2020Q2 2020Q3 Total Assets 1,317,675$ 1,335,867$ 1,383,760$ 1,442,027$ 1,685,907$ 1,440,964$ 1,442,027$ 1,461,513$ 1,639,636$ 1,685,907$ Total Loans 891,588 892,089 1,007,150 1,051,431 1,192,345 997,284 1,051,431 1,053,070 1,189,517 1,192,345 Total Deposits 1,014,229 1,039,390 1,067,527 1,142,031 1,377,284 1,136,787 1,142,031 1,172,394 1,351,568 1,377,284 Tangible Equity 82,694 97,386 106,062 114,936 119,233 118,335 114,936 107,545 113,449 119,233 Net Income 5,256$ 4,054$ 10,667$ 13,129$ 9,285$ 4,493$ 2,883$ 1,755$ 2,570$ 4,960$ ROAA (%) 0.55 0.40 0.81 0.93 0.78 0.97 0.80 0.49 0.64 1.18 ROAE (%) 6.38 4.52 9.39 10.44 9.87 10.96 8.93 5.59 8.38 15.58 Net Interest Margin (FTE) (%) 3.19 3.37 3.74 3.68 3.43 3.62 3.70 3.67 3.51 3.12 Efficiency Ratio (FTE) (%) 72.30 71.12 70.21 68.35 64.98 64.54 77.30 67.80 66.63 66.63 Non-Int. Income / Avg. Assets (%) 1.06 1.09 1.15 1.11 1.14 1.11 1.13 1.12 1.03 1.10 Non-Int. Expense / Avg. Assets (%) 2.95 2.96 3.34 3.20 2.79 3.14 3.25 3.05 2.86 2.54 Tang. Cmn. Equity / Tang. Assets (%) 6.33 7.35 7.73 8.03 7.12 8.28 8.03 7.41 6.97 7.12 Loans / Deposits (%) 87.87 85.78 94.30 92.07 86.74 87.69 92.07 89.88 87.82 86.74 Leverage Ratio (%) 10.95 11.00 11.47 11.77 10.37 11.68 11.77 11.52 10.46 10.37 Tier 1 Risk-based Ratio (%) 14.77 14.97 14.87 15.17 14.89 15.82 15.17 14.76 14.62 14.89 Risk Based Capital Ratio (%) 16.71 15.98 15.91 16.29 16.14 16.95 16.29 16.01 15.87 16.14 NPLs / Loans (%) 2.39 1.37 0.95 1.40 0.93 1.56 1.40 1.41 1.24 0.93 NPAs / Assets (%) 2.44 1.68 1.17 1.30 0.87 1.40 1.30 1.29 1.14 0.87 NPAs (Excluding Restr.) / Assets (%) 1.89 1.29 0.83 1.04 0.84 1.14 1.04 1.03 0.92 0.84 Reserves / NPAs (%) 30.81 44.56 68.39 66.62 108.33 59.15 66.62 79.70 90.83 108.33 Reserves / Loans (%) 1.11 1.12 1.10 1.19 1.36 1.20 1.19 1.43 1.43 1.36 NCOs / Average Loans (%) 0.57 0.28 0.11 (0.02) 0.16 (0.00) 0.03 0.07 0.06 0.33 Common Texas Ratio (%) 28.96 21.40 14.16 15.33 11.04 15.55 15.33 12.79 11.73 11.04 Price ($) 15.95 17.40 15.92 24.09 11.71 22.00 24.09 14.29 13.34 11.71 Market Cap. ($M) 100.0 123.0 112.8 171.3 81.84 156.4 171.3 99.56 93.16 81.84 Price / TBV (%) 120.9 126.3 106.4 149.0 68.64 132.1 149.0 92.57 82.12 68.64 Price / LTM EPS (x) 18.99 30.00 10.54 13.02 6.57 12.36 13.02 8.61 6.57 6.57 Diluted EPS ($) 0.84 0.58 1.51 1.85 1.32 0.63 0.41 0.25 0.37 0.70 Tangible Book Value Per Share ($) 13.19 13.78 14.97 16.17 17.06 16.65 16.17 15.44 16.25 17.06 QuarterlyAnnual
38 38 Selected Peer Groups • Proxy peers can be found in First United’s definitive proxy statement found here: https://www.sec.gov/Archives/edgar/data/763907/000110465920048280/tm2016149d1_defc14a.htm – Proxy peers include: ACNB, ASRV, CFFI, CHMG, CVLY, CZFS, CZNC, EVBN, FDBC, FRAF, MVBF, NKSH, OPOF, ORRF, PWOD, RIVE, SAL, SMMF and UNB • ISS peers can be found in the 2020 ISS Annual Benchmark Report – Includes ACNB, ASRV, CFFI, CHMG, CVLY, CZFS, CZNC, ESXB, EVBN, FBIZ, FBLV, FBSS, FRAF, MBCN, MVBF, NKSH, NWFL, OPOF, PEBK, PFBI, PWOD, SHBI, SLCT and TCFC
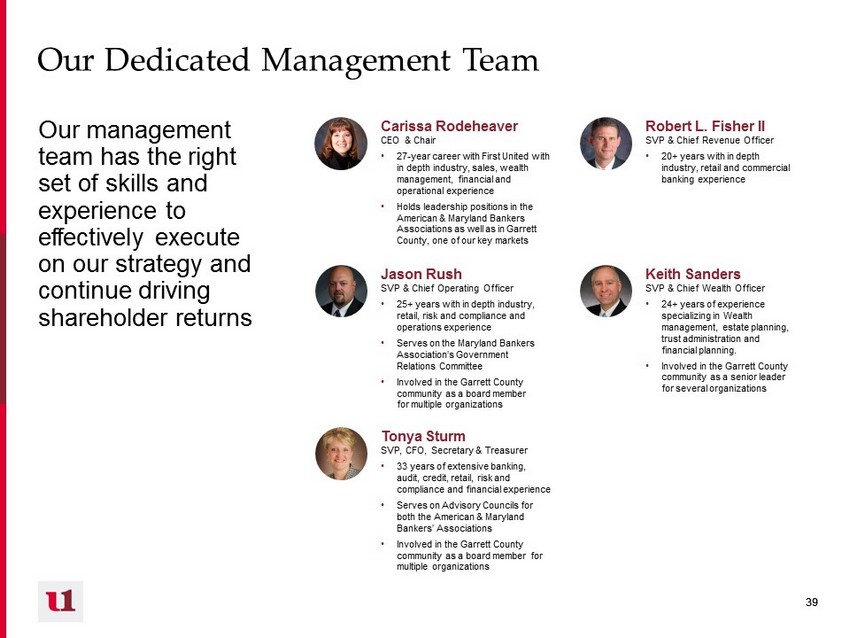
39 39 Our Dedicated Management Team Our management team has the right set of skills and experience to effectively execute on our strategy and continue driving shareholder returns Carissa Rodeheaver CEO & Chair • 27 - year career with First United with in depth industry, sales, wealth management, financial and operational experience • Holds leadership positions in the American & Maryland Bankers Associations as well as in Garrett County, one of our key markets Robert L. Fisher II SVP & Chief Revenue Officer • 20+ years with in depth industry, retail and commercial banking experience Jason Rush SVP & Chief Operating Officer • 25+ years with in depth industry, retail, risk and compliance and operations experience • Serves on the Maryland Bankers Association’s Government Relations Committee • Involved in the Garrett County community as a board member for multiple organizations Keith Sanders SVP & Chief Wealth Officer • 24+ years of experience specializing in Wealth management, estate planning, trust administration and financial planning. • Involved in the Garrett County community as a senior leader for several organizations Tonya Sturm SVP, CFO, Secretary & Treasurer • 33 years of extensive banking, audit, credit, retail, risk and compliance and financial experience • Serves on Advisory Councils for both the American & Maryland Bankers’ Associations • Involved in the Garrett County community as a board member for multiple organizations
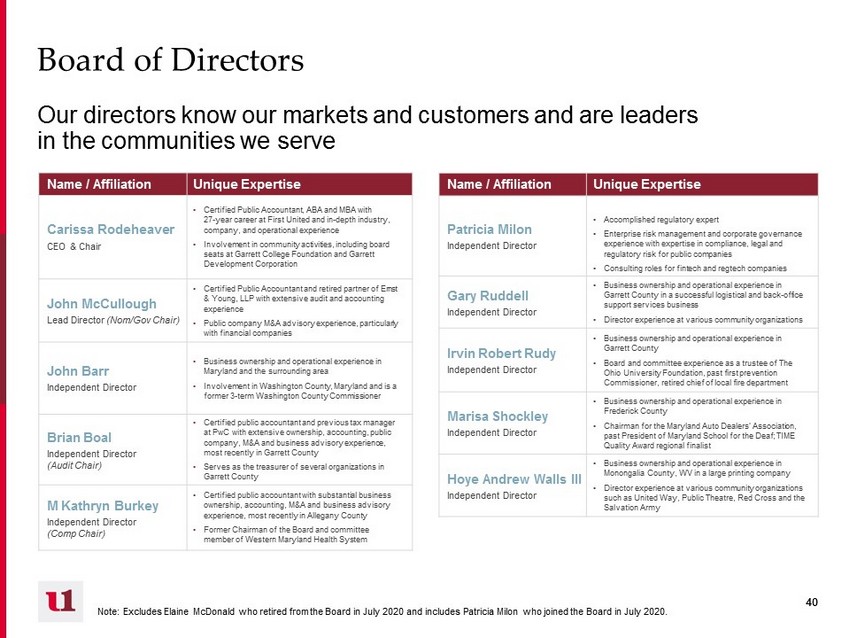
40 40 Board of Directors Our directors know our markets and customers and are leaders in the communities we serve Name / Affiliation Unique Expertise Carissa Rodeheaver CEO & Chair • Certified Public Accountant, ABA and MBA with 27 - year career at First United and in - depth industry, company, and operational experience • Involvement in community activities, including board seats at Garrett College Foundation and Garrett Development Corporation John McCullough Lead Director (Nom/Gov Chair) • Certified Public Accountant and retired partner of Ernst & Young, LLP with extensive audit and accounting experience • Public company M&A advisory experience, particularly with financial companies John Barr Independent Director • Business ownership and operational experience in Maryland and the surrounding area • Involvement in Washington County, Maryland and is a former 3 - term Washington County Commissioner Brian Boal Independent Director (Audit Chair) • Certified public accountant and previous tax manager at PwC with extensive ownership, accounting, public company, M&A and business advisory experience, most recently in Garrett County • Serves as the treasurer of several organizations in Garrett County M Kathryn Burkey Independent Director (Comp Chair) • Certified public accountant with substantial business ownership, accounting, M&A and business advisory experience, most recently in Allegany County • Former Chairman of the Board and committee member of Western Maryland Health System Name / Affiliation Unique Expertise Patricia Milon Independent Director • Accomplished regulatory expert • Enterprise risk management and corporate governance experience with expertise in compliance, legal and regulatory risk for public companies • Consulting roles for fintech and regtech companies Gary Ruddell Independent Director • Business ownership and operational experience in Garrett County in a successful logistical and back - office support services business • Director experience at various community organizations Irvin Robert Rudy Independent Director • Business ownership and operational experience in Garrett County • Board and committee experience as a trustee of The Ohio University Foundation, past first prevention Commissioner, retired chief of local fire department Marisa Shockley Independent Director • Business ownership and operational experience in Frederick County • Chairman for the Maryland Auto Dealers’ Association, past President of Maryland School for the Deaf; TIME Quality Award regional finalist Hoye Andrew Walls III Independent Director • Business ownership and operational experience in Monongalia County, WV in a large printing company • Director experience at various community organizations such as United Way, Public Theatre, Red Cross and the Salvation Army Note: Excludes Elaine McDonald who retired from the Board in July 2020 and includes Patricia Milon who joined the Board in Ju ly 2020.
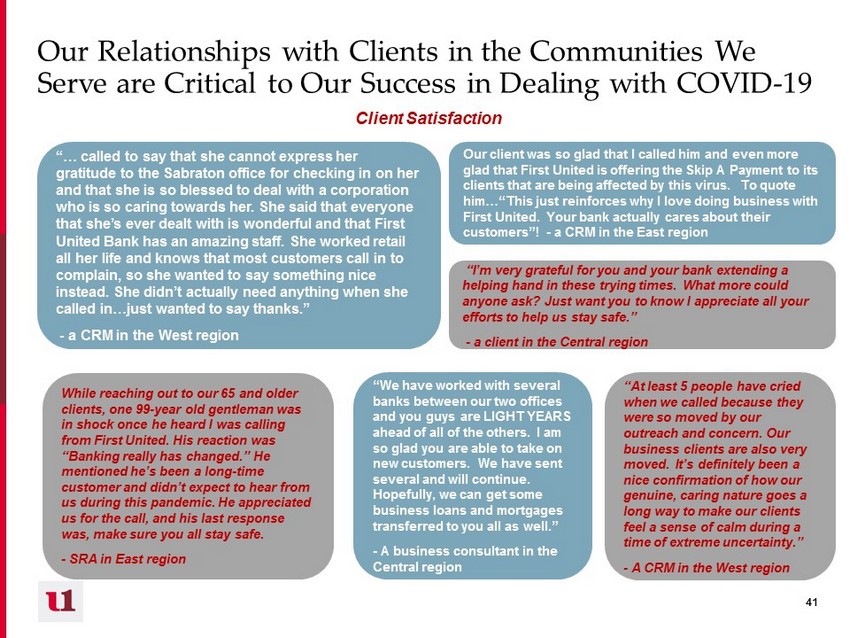
41 41 Our Relationships with Clients in the Communities We Serve are Critical to Our Success in Dealing with COVID - 19 Client Satisfaction “We have worked with several banks between our two offices and you guys are LIGHT YEARS ahead of all of the others. I am so glad you are able to take on new customers. We have sent several and will continue. Hopefully, we can get some business loans and mortgages transferred to you all as well.” - A business consultant in the Central region While reaching out to our 65 and older clients, one 99 - year old gentleman was in shock once he heard I was calling from First United. His reaction was “Banking really has changed.” He mentioned he’s been a long - time customer and didn’t expect to hear from us during this pandemic. He appreciated us for the call, and his last response was, make sure you all stay safe. - SRA in East region Our client was so glad that I called him and even more glad that First United is offering the Skip A Payment to its clients that are being affected by this virus. To quote him…“This just reinforces why I love doing business with First United. Your bank actually cares about their customers”! - a CRM in the East region “I’m very grateful for you and your bank extending a helping hand in these trying times. What more could anyone ask? Just want you to know I appreciate all your efforts to help us stay safe.” - a client in the Central region “… called to say that she cannot express her gratitude to the Sabraton office for checking in on her and that she is so blessed to deal with a corporation who is so caring towards her. She said that everyone that she’s ever dealt with is wonderful and that First United Bank has an amazing staff. She worked retail all her life and knows that most customers call in to complain, so she wanted to say something nice instead. She didn’t actually need anything when she called in…just wanted to say thanks.” - a CRM in the West region “At least 5 people have cried when we called because they were so moved by our outreach and concern. Our business clients are also very moved. It’s definitely been a nice confirmation of how our genuine, caring nature goes a long way to make our clients feel a sense of calm during a time of extreme uncertainty.” - A CRM in the West region
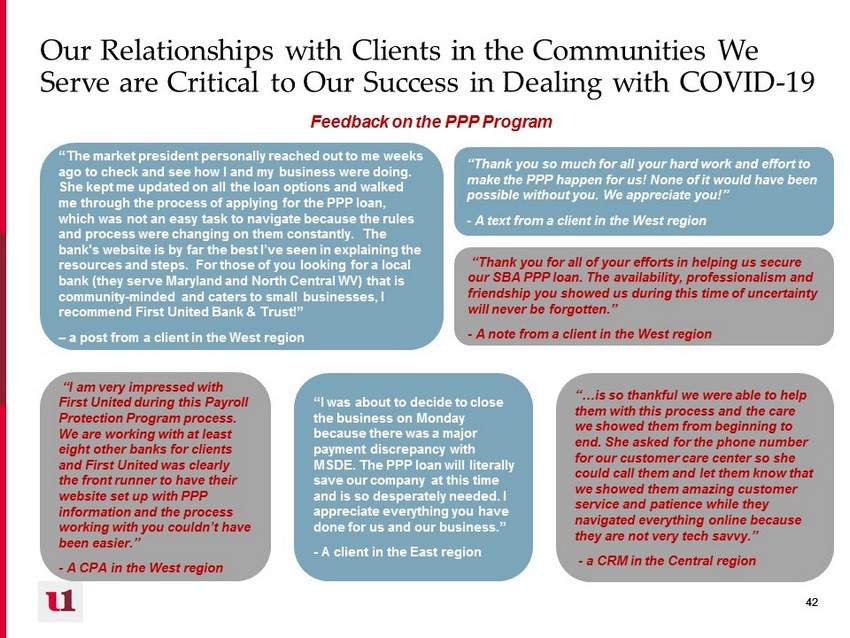
42 42 Our Relationships with Clients in the Communities We Serve are Critical to Our Success in Dealing with COVID - 19 Feedback on the PPP Program “I was about to decide to close the business on Monday because there was a major payment discrepancy with MSDE. The PPP loan will literally save our company at this time and is so desperately needed. I appreciate everything you have done for us and our business.” - A client in the East region “I am very impressed with First United during this Payroll Protection Program process. We are working with at least eight other banks for clients and First United was clearly the front runner to have their website set up with PPP information and the process working with you couldn’t have been easier.” - A CPA in the West region “Thank you so much for all your hard work and effort to make the PPP happen for us! None of it would have been possible without you. We appreciate you!” - A text from a client in the West region “Thank you for all of your efforts in helping us secure our SBA PPP loan. The availability, professionalism and friendship you showed us during this time of uncertainty will never be forgotten.” - A note from a client in the West region “The market president personally reached out to me weeks ago to check and see how I and my business were doing. She kept me updated on all the loan options and walked me through the process of applying for the PPP loan, which was not an easy task to navigate because the rules and process were changing on them constantly. The bank's website is by far the best I’ve seen in explaining the resources and steps. For those of you looking for a local bank (they serve Maryland and North Central WV) that is community - minded and caters to small businesses, I recommend First United Bank & Trust!” – a post from a client in the West region “…is so thankful we were able to help them with this process and the care we showed them from beginning to end. She asked for the phone number for our customer care center so she could call them and let them know that we showed them amazing customer service and patience while they navigated everything online because they are not very tech savvy.” - a CRM in the Central region
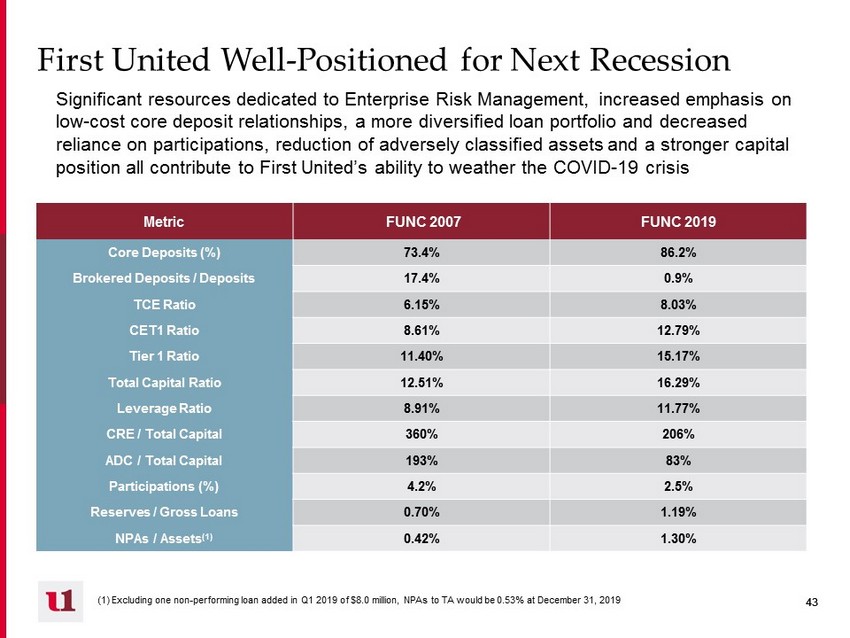
43 43 First United Well - Positioned for Next Recession Significant resources dedicated to Enterprise Risk Management, increased emphasis on low - cost core deposit relationships, a more diversified loan portfolio and decreased reliance on participations, reduction of adversely classified assets and a stronger capital position all contribute to First United’s ability to weather the COVID - 19 crisis Metric FUNC 2007 FUNC 2019 Core Deposits (%) 73.4% 86.2% Brokered Deposits / Deposits 17.4% 0.9% TCE Ratio 6.15% 8.03% CET1 Ratio 8.61% 12.79% Tier 1 Ratio 11.40% 15.17% Total Capital Ratio 12.51% 16.29% Leverage Ratio 8.91% 11.77% CRE / Total Capital 360% 206% ADC / Total Capital 193% 83% Participations (%) 4.2% 2.5% Reserves / Gross Loans 0.70% 1.19% NPAs / Assets (1) 0.42% 1.30% (1) Excluding one non - performing loan added in Q1 2019 of $8.0 million, NPAs to TA would be 0.53% at December 31, 2019
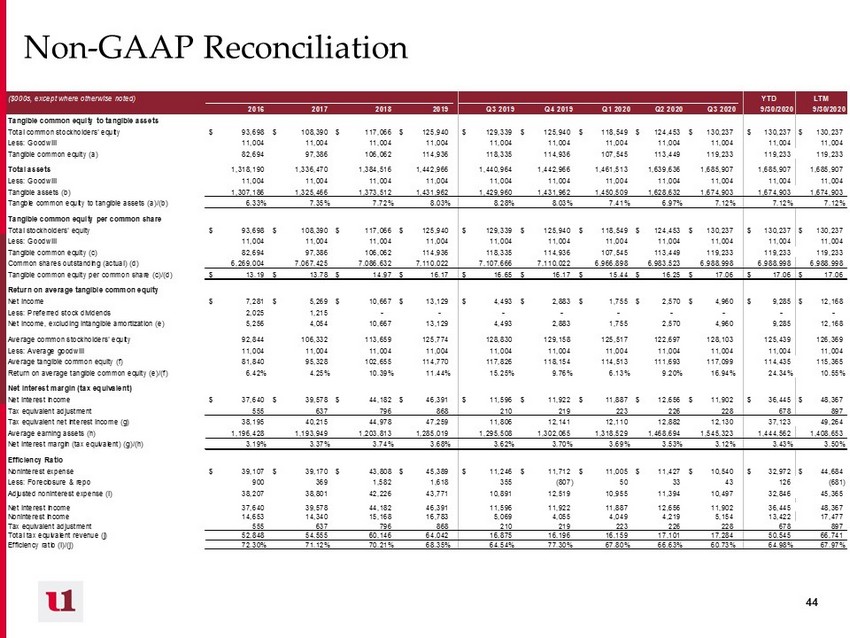
44 44 Non - GAAP Reconciliation ($000s, except where otherwise noted) YTD LTM 2016 2017 2018 2019 Q3 2019 Q4 2019 Q1 2020 Q2 2020 Q3 2020 9/30/2020 9/30/2020 Tangible common equity to tangible assets Total common stockholders' equity 93,698$ 108,390$ 117,066$ 125,940$ 129,339$ 125,940$ 118,549$ 124,453$ 130,237$ 130,237$ 130,237$ Less: Goodwill 11,004 11,004 11,004 11,004 11,004 11,004 11,004 11,004 11,004 11,004 11,004 Tangible common equity (a) 82,694 97,386 106,062 114,936 118,335 114,936 107,545 113,449 119,233 119,233 119,233 Total assets 1,318,190 1,336,470 1,384,516 1,442,966 1,440,964 1,442,966 1,461,513 1,639,636 1,685,907 1,685,907 1,685,907 Less: Goodwill 11,004 11,004 11,004 11,004 11,004 11,004 11,004 11,004 11,004 11,004 11,004 Tangible assets (b) 1,307,186 1,325,466 1,373,512 1,431,962 1,429,960 1,431,962 1,450,509 1,628,632 1,674,903 1,674,903 1,674,903 Tangble common equity to tangible assets (a)/(b) 6.33% 7.35% 7.72% 8.03% 8.28% 8.03% 7.41% 6.97% 7.12% 7.12% 7.12% Tangible common equity per common share Total stockholders' equity 93,698$ 108,390$ 117,066$ 125,940$ 129,339$ 125,940$ 118,549$ 124,453$ 130,237$ 130,237$ 130,237$ Less: Goodwill 11,004 11,004 11,004 11,004 11,004 11,004 11,004 11,004 11,004 11,004 11,004 Tangible common equity (c) 82,694 97,386 106,062 114,936 118,335 114,936 107,545 113,449 119,233 119,233 119,233 Common shares outstanding (actual) (d) 6,269,004 7,067,425 7,086,632 7,110,022 7,107,666 7,110,022 6,966,898 6,983,523 6,988,998 6,988,998 6,988,998 Tangible common equity per common share (c)/(d) 13.19$ 13.78$ 14.97$ 16.17$ 16.65$ 16.17$ 15.44$ 16.25$ 17.06$ 17.06$ 17.06$ Return on average tangible common equity Net income 7,281$ 5,269$ 10,667$ 13,129$ 4,493$ 2,883$ 1,755$ 2,570$ 4,960$ 9,285$ 12,168$ Less: Preferred stock dividends 2,025 1,215 - - - - - - - - - Net income, excluding intangible amortization (e) 5,256 4,054 10,667 13,129 4,493 2,883 1,755 2,570 4,960 9,285 12,168 Average common stockholders' equity 92,844 106,332 113,659 125,774 128,830 129,158 125,517 122,697 128,103 125,439 126,369 Less: Average goodwill 11,004 11,004 11,004 11,004 11,004 11,004 11,004 11,004 11,004 11,004 11,004 Average tangible common equity (f) 81,840 95,328 102,655 114,770 117,826 118,154 114,513 111,693 117,099 114,435 115,365 Return on average tangible common equity (e)/(f) 6.42% 4.25% 10.39% 11.44% 15.25% 9.76% 6.13% 9.20% 16.94% 24.34% 10.55% Net interest margin (tax equivalent) Net interest income 37,640$ 39,578$ 44,182$ 46,391$ 11,596$ 11,922$ 11,887$ 12,656$ 11,902$ 36,445$ 48,367$ Tax equivalent adjustment 555 637 796 868 210 219 223 226 228 678 897 Tax equivalent net interest income (g) 38,195 40,215 44,978 47,259 11,806 12,141 12,110 12,882 12,130 37,123 49,264 Average earning assets (h) 1,196,428 1,193,949 1,203,813 1,285,019 1,295,508 1,302,065 1,318,529 1,468,694 1,545,323 1,444,562 1,408,653 Net interest margin (tax equivalent) (g)/(h) 3.19% 3.37% 3.74% 3.68% 3.62% 3.70% 3.69% 3.53% 3.12% 3.43% 3.50% Efficiency Ratio Noninterest expense 39,107$ 39,170$ 43,808$ 45,389$ 11,246$ 11,712$ 11,005$ 11,427$ 10,540$ 32,972$ 44,684$ Less: Foreclosure & repo 900 369 1,582 1,618 355 (807) 50 33 43 126 (681) Adjusted noninterest expense (i) 38,207 38,801 42,226 43,771 10,891 12,519 10,955 11,394 10,497 32,846 45,365 Net interest income 37,640 39,578 44,182 46,391 11,596 11,922 11,887 12,656 11,902 36,445 48,367 Noninterest income 14,653 14,340 15,168 16,783 5,069 4,055 4,049 4,219 5,154 13,422 17,477 Tax equivalent adjustment 555 637 796 868 210 219 223 226 228 678 897 Total tax equivalent revenue (j) 52,848 54,555 60,146 64,042 16,875 16,196 16,159 17,101 17,284 50,545 66,741 Efficiency ratio (i)/(j) 72.30% 71.12% 70.21% 68.35% 64.54% 77.30% 67.80% 66.63% 60.73% 64.98% 67.97%