Attached files
| file | filename |
|---|---|
| EX-32.1 - FIRST UNITED CORP/MD/ | v177206_ex32-1.htm |
| EX-23.1 - FIRST UNITED CORP/MD/ | v177206_ex23-1.htm |
| EX-99.1 - FIRST UNITED CORP/MD/ | v177206_ex99-1.htm |
| EX-31.1 - FIRST UNITED CORP/MD/ | v177206_ex31-1.htm |
| EX-99.2 - FIRST UNITED CORP/MD/ | v177206_ex99-2.htm |
| EX-31.2 - FIRST UNITED CORP/MD/ | v177206_ex31-2.htm |
UNITED
STATES
SECURITIES
AND EXCHANGE COMMISSION
WASHINGTON,
DC 20549
FORM
10-K
ANNUAL
REPORT PURSUANT TO SECTION 13 OR 15(d) OF THE SECURITIES EXCHANGE ACT OF
1934
For the fiscal year ended
December 31,
2009
Commission
file number 0-14237
FIRST UNITED
CORPORATION
(Exact
name of registrant as specified in its charter)
|
Maryland
|
52-1380770
|
|
|
(State or other jurisdiction of incorporation or organization)
|
(I.R.S.
Employer Identification Number)
|
|
|
19 South Second Street, Oakland,
Maryland
|
21550-0009
|
|
|
(Address
of principal executive offices)
|
(Zip
Code)
|
Registrant’s
telephone number, including area code: (800) 470-4356
Securities
registered pursuant to Section 12(b) of the Act:
|
Title of Each Class:
|
Name of Each Exchange on Which
Registered:
|
|
|
Common
Stock, par value $.01 per share
|
NASDAQ
Global Select Market
|
Indicate
by check mark if the registrant is a well-known seasoned issuer, as defined in
Rule 405 of the Securities Act. Yes ¨ No R
Indicate
by check mark if the registrant is not required to file reports pursuant to
Section 13 or 15(d) of the Act. Yes ¨ No R
Indicate
by check mark whether the registrant (1) has filed all reports required to be
filed by Section 13 or 15(d) of the Securities Exchange Act of 1934 during the
preceding 12 months (or such shorter period that the registrant was required to
file such reports), and (2) has been subject to such filing requirements for the
past 90 days. Yes R No ¨
Indicate
by check mark whether the registrant has submitted electronically and posted on
its corporate Web site, if any, every Interactive Data File required to be
submitted and posted pursuant to Rule 405 of Regulation S-T (§232.405 of this
chapter) during the preceding 12 months (or for such shorter period that the
registrant was required to submit and post such files). Yes ¨ No ¨ (Not
Applicable)
Indicate
by check mark if disclosures of delinquent filers pursuant to Item 405 of
Regulation S-K (Section 229.405 of this chapter) is not contained herein, and
will not be contained, to the best of the registrant’s knowledge, in definitive
proxy or information statements incorporated by reference in Part III of this
Form 10-K or any amendment to this Form 10-K.¨
Indicate
by check mark whether the registrant is a large accelerated filer, an
accelerated filer, a non-accelerated filer, or a smaller reporting company. (See
definition of “accelerated filer”, “large accelerated filer”, and “smaller
reporting company” in Rule 12b-2 of the Exchange Act). (check
one): Large accelerated filer ¨ Accelerated
filer R
Non-accelerated filer ¨ Smaller
reporting company ¨
Indicate
by check mark whether the registrant is a shell company (as defined in Rule
12b-2 of the Act).Yes ¨ No R
The
aggregate market value of the registrant’s outstanding voting and non-voting
common equity held by non-affiliates as of June 30, 2009: $ 61,683,165.
The
number of shares of the registrant’s common stock outstanding as of February 28,
2010: 6,143,947
Documents
Incorporated by Reference
Portions
of the registrant’s definitive proxy statement for the 2010 Annual Meeting of
Shareholders to be filed with the SEC pursuant to Regulation 14A are
incorporated by reference into Part III of this Annual Report on Form
10-K.
First
United Corporation
Table
of Contents
|
PART
I
|
||
|
ITEM
1.
|
Business
|
3
|
|
ITEM
1A.
|
Risk
Factors
|
11
|
|
ITEM
1B.
|
Unresolved
Staff Comments
|
18
|
|
ITEM
2.
|
Properties
|
18
|
|
ITEM
3.
|
Legal
Proceedings
|
18
|
|
ITEM
4.
|
[Reserved]
|
18
|
|
PART
II
|
||
|
ITEM
5.
|
Market
for the Registrant’s Common Equity, Related Stockholder Matters and Issuer
Purchases of Equity Securities
|
18
|
|
ITEM
6.
|
Selected
Financial Data
|
21
|
|
ITEM
7.
|
Management's Discussion &
Analysis of Financial Condition & Results of
Operations
|
22
|
|
ITEM
7A.
|
Quantitative and Qualitative
Disclosures About Market Risk
|
48
|
|
ITEM
8.
|
Financial
Statements and Supplementary Data
|
48
|
|
ITEM
9.
|
Changes in and Disagreements with
Accountants on Accounting and Financial Disclosure
|
87
|
|
ITEM
9A.
|
Controls and
Procedures
|
87
|
|
ITEM
9B.
|
Other
Information
|
90
|
|
PART
III
|
||
|
ITEM
10.
|
Directors,
Executive Officers and Corporate Governance
|
90
|
|
ITEM
11.
|
Executive
Compensation
|
90
|
|
ITEM
12.
|
Security
Ownership of Certain Beneficial Owners and Management and Related
Stockholder Matters
|
90
|
|
ITEM
13.
|
Certain
Relationships and Related Transactions, and Director
Independence
|
90
|
|
ITEM
14.
|
Principal
Accountant Fees and Services
|
90
|
|
PART
IV
|
||
|
ITEM
15.
|
Exhibits
and Financial Statement Schedules
|
90
|
|
SIGNATURES
|
91
|
|
|
EXHIBITS
|
92
|
|
[2]
Forward-Looking
Statements
This
Annual Report of First United Corporation (the “Corporation” on a parent only
basis and “we”, “our” or “us”, on a consolidated basis) filed on Form 10-K may
contain forward-looking statements within the meaning of The Private Securities
Litigation Reform Act of 1995. Readers of this report should be aware of the
speculative nature of “forward-looking statements”. Statements that
are not historical in nature, including those that include the words
“anticipate”, “estimate”, “should”, “expect”, “believe”, “intend”, and similar
expressions, are based on current expectations, estimates and projections about,
among other things, the industry and the markets in which we operate, and they
are not guarantees of future performance. Whether actual results will
conform to expectations and predictions is subject to known and unknown risks
and uncertainties, including risks and uncertainties discussed in this report;
general economic, market, or business conditions; changes in interest rates,
deposit flow, the cost of funds, and demand for loan products and financial
services; changes in our competitive position or competitive actions by other
companies; changes in the quality or composition of loan and investment
portfolios; the ability to manage growth; changes in laws or regulations or
policies of federal and state regulators and agencies; and other circumstances
beyond our control. Consequently, all of the forward-looking
statements made in this document are qualified by these cautionary statements,
and there can be no assurance that the actual results anticipated will be
realized, or if substantially realized, will have the expected consequences on
our business or operations. For a more complete discussion of these
and other risk factors, see Item 1A of Part I of this report. Except
as required by applicable laws, the Corporation does not intend to publish
updates or revisions of forward-looking statements it makes to reflect new
information, future events or otherwise.
|
BUSINESS
|
General
The
Corporation is a Maryland corporation chartered in 1985 and a financial holding
company registered under the federal Bank Holding Company Act of 1956, as
amended. The Corporation’s primary business is serving as the parent
company of First United Bank & Trust, a Maryland trust company (the “Bank”),
First United Insurance Group, LLC, a full service insurance provider organized
under Maryland law (the “Insurance Group”), First United Statutory Trust I
(“Trust I”) and First United Statutory Trust II (“Trust II”), both Connecticut
statutory business trusts and First United Statutory Trust III (“Trust III” and
together with Trust I and Trust II, the “Trusts”), a Delaware statutory business
trust. The Trusts were formed for the purpose of selling trust
preferred securities. The Bank has two wholly-owned subsidiaries:
OakFirst Loan Center, Inc., a West Virginia finance company; and OakFirst Loan
Center, LLC, a Maryland finance company (collectively, the “OakFirst Loan
Centers”); and owns 99.9% of the limited partnership interests in Liberty Mews
Limited Partnership, a Maryland limited partnership formed for the purpose of
acquiring, developing and operating low-income housing units in Garrett County,
Maryland. First United Insurance Agency, Inc. a subsidiary of
OakFirst Loan Center, Inc., was merged into the Insurance Group effective June
30, 2009.
At December 31, 2009, the Corporation
had assets of approximately $1.74 billion, net loans of approximately $1.10
billion, and deposits of approximately $1.30 billion. Shareholders’
equity at December 31, 2009 was approximately $101 million.
The
Corporation maintains an Internet site at www.mybank4.com on which it makes
available, free of charge, its Annual Report on Form 10-K, Quarterly Reports on
Form 10-Q, Current Reports on Form 8-K, and all amendments to the foregoing as
soon as reasonably practicable after these reports are electronically filed
with, or furnished to, the Securities and Exchange Commission (the
“SEC”).
Banking
Products and Services
The Bank
operates 28 banking offices, one call center and 33 Automated Teller Machines
(“ATM’s”) in Allegany County, Frederick County, Garrett County, and Washington
County in Maryland, and in Berkeley County, Mineral County, Hardy, and
Monongalia County in West Virginia. The Bank is an independent
community bank providing a complete range of retail and commercial banking
services to businesses and individuals in its market areas. Services
offered are essentially the same as those offered by the regional institutions
that compete with the Bank and include checking, savings, and money market
deposit accounts, business loans, personal loans, mortgage loans, lines of
credit, and consumer-oriented retirement accounts including individual
retirement accounts (“IRA”) and employee benefit accounts. In addition, the Bank
provides full brokerage services through a networking arrangement with PrimeVest
Financial Services, Inc., a full service broker-dealer. The Bank also
provides safe deposit and night depository facilities, and a complete line of
insurance products and trust services. The Bank’s deposits are
insured by the Federal Deposit Insurance Corporation (the “FDIC”).
[3]
Lending
Activities— Our
lending activities are conducted through the Bank and OakFirst Loan
Centers.
The
Bank’s commercial loans are primarily secured by real estate, commercial
equipment, vehicles or other assets of the borrower. Repayment is
often dependent on the successful business operations of the borrower and may be
affected by adverse conditions in the local economy or real estate
market. The financial condition and cash flow of commercial borrowers
is therefore carefully analyzed during the loan approval process, and continues
to be monitored throughout the duration of the loan by obtaining business
financial statements, personal financial statements and income tax
returns. The frequency of this ongoing analysis depends upon the size
and complexity of the credit and collateral that secures the loan. It is also
the Bank’s general policy to obtain personal guarantees from the principals of
the commercial loan borrowers.
Commercial
real estate loans are primarily those secured by land for residential and
commercial development, agricultural purpose properties, service industry
buildings such as restaurants and motels, retail buildings and general purpose
business space. The Bank attempts to mitigate the risks associated
with these loans through low loan to value ratio standards, thorough financial
analyses, and management’s knowledge of the local economy in which the Bank
lends.
The risk
of loss associated with commercial real estate construction lending is
controlled through conservative underwriting procedures such as loan to value
ratios of 80% or less, obtaining additional collateral when prudent, and closely
monitoring construction projects to control disbursement of funds on
loans.
The
Bank’s residential mortgage portfolio is distributed between variable and fixed
rate loans. Many loans are booked at fixed rates in order to meet the
Bank’s requirements under the Community Reinvestment Act. Other fixed rate
residential mortgage loans are originated in a brokering capacity on behalf of
other financial institutions, for which the Bank receives a fee. As with any
consumer loan, repayment is dependent on the borrower’s continuing financial
stability, which can be adversely impacted by job loss, divorce, illness, or
personal bankruptcy. Residential mortgage loans exceeding an internal
loan-to-value ratio require private mortgage insurance. Title
insurance protecting the Bank’s lien priority, as well as fire and casualty
insurance, are also required.
Home
equity lines of credit, included within the residential mortgage portfolio, are
secured by the borrower’s home and can be drawn on at the discretion of the
borrower. These lines of credit are at variable interest
rates.
The Bank
also provides residential real estate construction loans to builders and
individuals for single family dwellings. Residential construction
loans are usually granted based upon “as completed” appraisals and are secured
by the property under construction. Site inspections are performed to
determine pre-specified stages of completion before loan proceeds are
disbursed. These loans typically have maturities of six to 12 months
and may have a fixed or variable rate. Permanent financing for
individuals offered by the Bank includes fixed and variable rate loans with
three, five or seven year adjustable rate mortgages.
A variety
of other consumer loans are also offered to customers, including indirect and
direct auto loans, and other secured and unsecured lines of credit and term
loans. Careful analysis of an applicant’s creditworthiness is performed before
granting credit, and on-going monitoring of loans outstanding is performed in an
effort to minimize risk of loss by identifying problem loans early.
An
allowance for loan losses is maintained to provide for anticipated losses from
our lending activities. A complete discussion of the factors
considered in determination of the allowance for loan losses is included in Item
7 of Part II of this report.
Additionally,
we meet the lending needs of under-served customer groups within our market
areas in part through OakFirst Loan Center, Inc., located in Martinsburg, West
Virginia, and OakFirst Loan Center, LLC, located in Hagerstown,
Maryland.
Deposit
Activities—The Bank offers a full array of deposit products including
checking, savings and money market accounts, regular and IRA certificates of
deposit, Christmas Savings accounts, College Savings accounts, and Health
Savings accounts. The Bank also offers the CDARS program to
municipalities, businesses, and consumers, providing them $50 million or more of
FDIC insurance. In addition, we offer our commercial customers
packages which include Treasury Management, Cash Sweep and various checking
opportunities.
[4]
Information
about our income from and assets related to our banking business may be found in
the Consolidated Statements of Financial Condition and the Consolidated
Statements of Income and the related notes thereto included in Item 8 of Part II
of this annual report.
Trust
Services—The
Bank’s Trust Department offers a full range of trust services, including
personal trust, investment agency accounts, charitable trusts, retirement
accounts including IRA roll-overs, 401(k) accounts and defined benefit plans,
estate administration and estate planning.
At
December 31, 2009, 2008 and 2007, the total market value of assets under the
supervision of the Bank’s Trust Department was approximately $544 million, $472
million and $547 million, respectively. Trust Department revenues for
these years may be found in the Consolidated Statements of Income under the
heading “Other operating income”, which is contained in Item 8 of Part II of
this annual report.
Insurance
Activities— We offer a full range of insurance products and services to
customers in our market areas through the Insurance
Group. Information about income from insurance activities for each of
the years ended December 31, 2009, 2008 and 2007 may be found under “Other
Operating Income” in the Consolidated Statements of Income included in Item 8 of
Part II of this annual report.
COMPETITION
The
banking business, in all of its phases, is highly competitive. Within
our market areas, we compete with commercial banks, (including local banks and
branches or affiliates of other larger banks), savings and loan associations and
credit unions for loans and deposits, with consumer finance companies for loans,
with insurance companies and their agents for insurance products, and with other
financial institutions for various types of products and
services. There is also competition for commercial and retail banking
business from banks and financial institutions located outside our market
areas.
The
primary factors in competing for deposits are interest rates, personalized
services, the quality and range of financial services, convenience of office
locations and office hours. The primary factors in competing for loans are
interest rates, loan origination fees, the quality and range of lending services
and personalized services.
To
compete with other financial services providers, we rely principally upon local
promotional activities, personal relationships established by officers,
directors and employees with its customers, and specialized services tailored to
meet its customers’ needs. In those instances in which we are unable to
accommodate a customer’s needs, we attempt to arrange for those services to be
provided by other financial services providers with which we have a
relationship.
The following table sets forth deposit
data for the Maryland and West Virginia Counties in which the Bank maintains
offices as of June 30, 2009, the most recent date for which comparative
information is available.
|
Offices
(in Market)
|
Deposits (in thousands)
|
Market Share
|
||||||||||
|
Allegany
County, Maryland:
|
||||||||||||
|
Susquehanna
Bank
|
5 | $ | 271,328 | 40.79 | % | |||||||
|
Manufacturers
& Traders Trust Company
|
7 | 173,850 | 26.14 | % | ||||||||
|
First
United Bank & Trust
|
4 | 127,538 | 19.17 | % | ||||||||
|
PNC
Bank NA
|
3 | 54,102 | 8.13 | % | ||||||||
|
Standard
Bank
|
2 | 38,333 | 5.77 | % | ||||||||
Source: FDIC
Deposit Market Share Report
[5]
|
Frederick
County, Maryland:
|
||||||||||||
|
PNC
Bank NA
|
21 | 1,043,943 | 30.96 | % | ||||||||
|
Branch
Banking & Trust Co.
|
12 | 636,036 | 18.86 | % | ||||||||
|
Bank
Of America NA
|
5 | 259,180 | 7.69 | % | ||||||||
|
Manufacturers
& Traders Trust Company
|
8 | 232,450 | 6.89 | % | ||||||||
|
Frederick
County Bank
|
4 | 220,518 | 6.54 | % | ||||||||
|
Chevy
Chase Bank FSB
|
6 | 171,423 | 5.08 | % | ||||||||
|
Woodsboro
Bank
|
7 | 169,682 | 5.03 | % | ||||||||
|
First
United Bank & Trust
|
4 | 128,285 | 3.81 | % | ||||||||
|
SunTrust
Bank
|
3 | 127,001 | 3.77 | % | ||||||||
|
Middletown
Valley Bank
|
4 | 115,185 | 3.42 | % | ||||||||
|
Sandy
Spring Bank
|
4 | 84,654 | 2.51 | % | ||||||||
|
BlueRidge
Bank
|
1 | 47,261 | 1.40 | % | ||||||||
|
Columbia
Bank
|
2 | 36,367 | 1.08 | % | ||||||||
|
Damascus
Community Bank
|
2 | 31,131 | 0.92 | % | ||||||||
|
Sovereign
Bank
|
2 | 27,376 | 0.81 | % | ||||||||
|
Wachovia
Bank NA
|
1 | 24,452 | 0.73 | % | ||||||||
|
Harvest
Bank of Maryland
|
1 | 16,952 | 0.50 | % | ||||||||
Source: FDIC
Deposit Market Share Report
|
Garrett
County, Maryland:
|
||||||||||||
|
First
United Bank & Trust
|
5 | 599,431 | 72.18 | % | ||||||||
|
Manufacturers
& Traders Trust Co.
|
5 | 102,244 | 12.31 | % | ||||||||
|
Susquehanna
Bank
|
2 | 97,280 | 11.72 | % | ||||||||
|
Clear
Mountain Bank
|
1 | 26,718 | 3.22 | % | ||||||||
|
Miners
& Merchants Bank
|
1 | 4,750 | 0.57 | % | ||||||||
Source: FDIC
Deposit Market Share Report
|
Washington
County, Maryland:
|
||||||||||||
|
Susquehanna
Bank
|
10 | 501,480 | 25.83 | % | ||||||||
|
Hagerstown
Trust Co.
|
11 | 453,446 | 23.35 | % | ||||||||
|
Manufacturers
& Traders Trust Company
|
12 | 379,130 | 19.52 | % | ||||||||
|
PNC
Bank NA
|
6 | 155,728 | 8.02 | % | ||||||||
|
Sovereign
Bank
|
4 | 150,082 | 7.73 | % | ||||||||
|
First
United Bank & Trust
|
3 | 83,889 | 4.32 | % | ||||||||
|
Centra
Bank, Inc.
|
2 | 64,358 | 3.31 | % | ||||||||
|
Graystone
Tower Bank
|
3 | 43,723 | 2.25 | % | ||||||||
|
Chevy
Chase Bank FSB
|
3 | 39,659 | 2.04 | % | ||||||||
|
Citizens
National Bank of Berkeley Springs
|
1 | 36,787 | 1.90 | % | ||||||||
|
Orrstown
Bank
|
2 | 23,588 | 1.22 | % | ||||||||
|
Jefferson
Security Bank
|
1 | 6,063 | 0.31 | % | ||||||||
|
Middletown
Valley Bank
|
1 | 3,837 | 0.20 | % | ||||||||
Source: FDIC
Deposit Market Share Report
[6]
|
Berkeley
County, West Virginia:
|
||||||||||||
|
Branch
Banking & Trust Co.
|
5 | 317,296 | 30.41 | % | ||||||||
|
Centra
Bank Inc.
|
4 | 214,385 | 20.55 | % | ||||||||
|
First
United Bank & Trust
|
5 | 127,653 | 12.24 | % | ||||||||
|
City
National Bank of West Virginia
|
4 | 113,984 | 10.93 | % | ||||||||
|
Susquehanna
Bank
|
3 | 103,640 | 9.93 | % | ||||||||
|
Jefferson
Security Bank
|
2 | 58,700 | 5.63 | % | ||||||||
|
Bank
of Charles Town
|
2 | 44,600 | 4.27 | % | ||||||||
|
Citizens
National Bank of Berkeley Springs
|
3 | 35,229 | 3.38 | % | ||||||||
|
Summit
Community Bank
|
1 | 15,338 | 1.47 | % | ||||||||
|
MVB
Bank Inc.
|
1 | 12,067 | 1.16 | % | ||||||||
|
Woodforest
National Bank
|
1 | 312 | 0.03 | % | ||||||||
Source: FDIC
Deposit Market Share Report
|
Hardy
County, West Virginia:
|
||||||||||||
|
Summit
Community Bank, Inc.
|
3 | 350,315 | 67.67 | % | ||||||||
|
Capon
Valley Bank
|
3 | 116,254 | 22.46 | % | ||||||||
|
Pendleton
Community Bank, Inc.
|
1 | 24,312 | 4.70 | % | ||||||||
|
First
United Bank & Trust
|
1 | 14,727 | 2.85 | % | ||||||||
|
Grant
County Bank
|
1 | 12,025 | 2.32 | % | ||||||||
Source: FDIC
Deposit Market Share Report
|
Mineral
County, West Virginia:
|
||||||||||||
|
Branch
Banking & Trust Co.
|
2 | 79,892 | 32.42 | % | ||||||||
|
First
United Bank & Trust
|
2 | 78,369 | 31.80 | % | ||||||||
|
Manufacturers
& Traders Trust Co.
|
2 | 50,113 | 20.34 | % | ||||||||
|
Grant
County Bank
|
1 | 38,050 | 15.44 | % | ||||||||
Source: FDIC
Deposit Market Share Report
|
Monongalia
County, West Virginia:
|
||||||||||||
|
Branch
Banking & Trust Co.
|
5 | 496,816 | 27.26 | % | ||||||||
|
Centra
Bank, Inc.
|
5 | 485,663 | 26.65 | % | ||||||||
|
Huntington
National Bank
|
5 | 380,607 | 20.89 | % | ||||||||
|
United
Bank
|
4 | 169,039 | 9.28 | % | ||||||||
|
Clear
Mountain Bank
|
5 | 107,660 | 5.91 | % | ||||||||
|
Wesbanco
Bank, Inc.
|
5 | 85,691 | 4.70 | % | ||||||||
|
First
United Bank & Trust
|
3 | 46,390 | 2.55 | % | ||||||||
|
First
Exchange Bank
|
5 | 29,748 | 1.63 | % | ||||||||
|
Citizens
Bank of Morgantown, Inc.
|
1 | 20,484 | 1.12 | % | ||||||||
|
PNC
Bank NA
|
1 | 89 | 0.01 | % | ||||||||
Source: FDIC
Deposit Market Share Report
For
further information about competition in our market areas, see the Risk Factor
entitled “We operate in a
competitive environment” in Item 1A of Part I of this annual
report.
[7]
SUPERVISION
AND REGULATION
The
following is a summary of the material regulations and policies applicable to
the Corporation and its subsidiaries and is not intended to be a comprehensive
discussion. Changes in applicable laws and regulations may have a
material effect on our business.
General
The Corporation is a financial holding
company registered with the Board of Governors of the Federal Reserve System
(the “FRB”) under the BHC Act and, as such, is subject to the supervision,
examination and reporting requirements of the BHC Act and the regulations of the
FRB.
The Bank
is a Maryland trust company subject to the banking laws of Maryland and to
regulation by the Commissioner of Financial Regulation of Maryland, who is
required by statute to make at least one examination in each calendar year (or
at 18-month intervals if the Commissioner determines that an examination is
unnecessary in a particular calendar year). The Bank also has offices
in West Virginia, and the operations of these offices are subject to West
Virginia laws and to supervision and examination by the West Virginia Division
of Banking. As a member of the FDIC, the Bank is also subject to
certain provisions of federal law and regulations regarding deposit insurance
and activities of insured state-chartered banks, including those that require
examination by the FDIC. In addition to the foregoing, there are a
myriad of other federal and state laws and regulations that affect, impact or
govern the business of banking, including consumer lending, deposit-taking, and
trust operations.
All
non-bank subsidiaries of the Corporation are subject to examination by the FRB,
and, as affiliates of the Bank, are subject to examination by the FDIC and the
Commissioner of Financial Regulation of Maryland. In addition, OakFirst Loan
Center, Inc. is subject to licensing and regulation by the West Virginia
Division of Banking, OakFirst Loan Center, LLC is subject to licensing and
regulation by the Commissioner of Financial Regulation of Maryland, and the
Insurance Group is subject to licensing and regulation by various state
insurance authorities. Retail sales of insurance products by these insurance
affiliates are also subject to the requirements of the Interagency Statement on
Retail Sales of Nondeposit Investment Products promulgated in 1994 by the FDIC,
the FRB, the Office of the Comptroller of the Currency, and the Office of Thrift
Supervision.
Regulation
of Financial Holding Companies
In
November 1999, the federal Gramm-Leach-Bliley Act (the “GLB Act”) was signed
into law. The GLB Act revised the BHC Act and repealed the
affiliation provisions of the Glass-Steagall Act of 1933, which, taken together,
limited the securities, insurance and other non-banking activities of any
company that controls an FDIC insured financial institution. Under
the GLB Act, a bank holding company can elect, subject to certain
qualifications, to become a “financial holding company.” The GLB Act
provides that a financial holding company may engage in a full range of
financial activities, including insurance and securities sales and underwriting
activities, and real estate development, with new expedited notice procedures.
Maryland law generally permits state-chartered banks, including the Bank, to
engage in the same activities, directly or through an affiliate, as national
banking associations. The GLB Act permits certain qualified national
banking associations to form financial subsidiaries, which have broad authority
to engage in all financial activities except insurance underwriting, insurance
investments, real estate investment or development, or merchant banking. Thus,
the GLB Act has the effect of broadening the permitted activities of the
Corporation and the Bank.
The
Corporation and its affiliates are subject to the provisions of Section 23A and
Section 23B of the Federal Reserve Act. Section 23A limits the amount
of loans or extensions of credit to, and investments in, the Corporation and its
non-bank affiliates by the Bank. Section 23B requires that
transactions between the Bank and the Corporation and its non-bank affiliates be
on terms and under circumstances that are substantially the same as with
non-affiliates.
Under FRB
policy, the Corporation is expected to act as a source of strength to the Bank,
and the FRB may charge the Corporation with engaging in unsafe and unsound
practices for failure to commit resources to a subsidiary bank when
required. In addition, under the Financial Institutions Reform,
Recovery and Enforcement Act of 1989 (“FIRREA”), depository institutions insured
by the FDIC can be held liable for any losses incurred by, or reasonably
anticipated to be incurred by, the FDIC in connection with (i) the default of a
commonly controlled FDIC-insured depository institution or (ii) any assistance
provided by the FDIC to a commonly controlled FDIC-insured depository
institution in danger of default. Accordingly, in the event that any
insured subsidiary of the Corporation causes a loss to the FDIC, other insured
subsidiaries of the Corporation could be required to compensate the FDIC by
reimbursing it for the estimated amount of such loss. Such cross
guaranty liabilities generally are superior in priority to obligations of a
financial institution to its shareholders and obligations to other
affiliates.
[8]
Federal
Banking Regulation
Federal
banking regulators, such as the FRB and the FDIC, may prohibit the institutions
over which they have supervisory authority from engaging in activities or
investments that the agencies believe are unsafe or unsound banking
practices. Federal banking regulators have extensive enforcement
authority over the institutions they regulate to prohibit or correct activities
that violate law, regulation or a regulatory agreement or which are deemed to be
unsafe or unsound practices. Enforcement actions may include the
appointment of a conservator or receiver, the issuance of a cease and desist
order, the termination of deposit insurance, the imposition of civil money
penalties on the institution, its directors, officers, employees and
institution-affiliated parties, the issuance of directives to increase capital,
the issuance of formal and informal agreements, the removal of or restrictions
on directors, officers, employees and institution-affiliated parties, and the
enforcement of any such mechanisms through restraining orders or other court
actions.
The Bank
is subject to certain restrictions on extensions of credit to executive
officers, directors, and principal shareholders or any related interest of such
persons, which generally require that such credit extensions be made on
substantially the same terms as are available to third parties dealing with the
Bank and not involve more than the normal risk of repayment. Other
laws tie the maximum amount that may be loaned to any one customer and its
related interests to capital levels.
As part
of the Federal Deposit Insurance Corporation Improvement Act of 1991 (“FDICIA”),
each federal banking regulator adopted non-capital safety and soundness
standards for institutions under its authority. These standards
include internal controls, information systems and internal audit systems, loan
documentation, credit underwriting, interest rate exposure, asset growth, and
compensation, fees and benefits. An institution that fails to meet
those standards may be required by the agency to develop a plan acceptable to
meet the standards. Failure to submit or implement such a plan may
subject the institution to regulatory sanctions. We believe that the
Bank meets substantially all standards that have been adopted. FDICIA
also imposes capital standards on insured depository institutions.
The
Community Reinvestment Act (“CRA”) requires the FDIC, in connection with its
examination of financial institutions within its jurisdiction, to evaluate the
record of those financial institutions in meeting the credit needs of their
communities, including low and moderate income neighborhoods, consistent with
principles of safe and sound banking practices. These factors are
also considered by all regulatory agencies in evaluating mergers, acquisitions
and applications to open a branch or facility. As of the date of its
most recent examination report, the Bank has a CRA rating of
“Satisfactory”.
On October 14, 2008, the FDIC announced
the creation of the Temporary Liquidity Guarantee Program (the “TLGP”) to
decrease the cost of bank funding and, hopefully, normalize
lending. This program is comprised of two components. The first
component guarantees senior unsecured debt issued between October 14, 2008 and
June 30, 2009. The guarantee will remain in effect until June 30,
2012 for such debts that mature beyond June 30, 2009. The second
component, called the Transaction Accounts Guarantee Program (“TAG”), provided
full coverage for non-interest bearing transaction deposit accounts, IOLTAs, and
NOW accounts with interest rates of 0.50% or less, regardless of account
balance, initially until December 31, 2009. The TAG program has been
extended until June 30, 2010. We elected to participate in both
programs and paid additional FDIC premiums in 2009 as a result. See
the section below entitled “Deposit Insurance”.
Capital
Requirements
FDICIA
established a system of prompt corrective action to resolve the problems of
undercapitalized institutions. Under this system, the federal banking regulators
are required to rate supervised institutions on the basis of five capital
categories: “well capitalized,” “adequately capitalized,” “undercapitalized,”
“significantly undercapitalized,” and “critically undercapitalized;” and to take
certain mandatory actions (and are authorized to take other discretionary
actions) with respect to institutions in the three undercapitalized
categories. The severity of the actions will depend upon the category
in which the institution is placed. A depository institution is “well
capitalized” if it has a total risk based capital ratio of 10% or greater, a
Tier 1 risk based capital ratio of 6% or greater, and a leverage ratio of 5% or
greater and is not subject to any order, regulatory agreement, or written
directive to meet and maintain a specific capital level for any capital
measure. An “adequately capitalized” institution is defined as one
that has a total risk based capital ratio of 8% or greater, a Tier 1 risk based
capital ratio of 4% or greater and a leverage ratio of 4% or greater (or 3% or
greater in the case of a bank with a composite CAMEL rating of 1).
[9]
FDICIA
generally prohibits a depository institution from making any capital
distribution, including the payment of cash dividends, or paying a management
fee to its holding company if the depository institution would thereafter be
undercapitalized. Undercapitalized depository institutions are
subject to growth limitations and are required to submit capital restoration
plans. For a capital restoration plan to be acceptable, the
depository institution’s parent holding company must guarantee (subject to
certain limitations) that the institution will comply with such capital
restoration plan.
Significantly
undercapitalized depository institutions may be subject to a number of other
requirements and restrictions, including orders to sell sufficient voting stock
to become adequately capitalized and requirements to reduce total assets and
stop accepting deposits from correspondent banks. Critically
undercapitalized depository institutions are subject to the appointment of a
receiver or conservator; generally within 90 days of the date such institution
is determined to be critically undercapitalized.
Further
information about our capital resources is provided in the “Capital Resources”
section of Item 7 of Part II of this annual report. Information about
the capital ratios of the Corporation and of the Bank as of December 31, 2009
may be found in Note 2 to the Consolidated Financial Statements, which is
included in Item 8 of Part II of this annual report.
Deposit
Insurance
The deposits of the Bank are insured to
a maximum of $100,000 per depositor through the Deposit Insurance Fund, which is
administered by the FDIC, and the Bank is required to pay quarterly deposit
insurance premium assessments to the FDIC. The Deposit Insurance Fund
was created pursuant to the Federal Deposit Insurance Reform Act of 2005 (the
“Reform Act”), which was signed into law on February 8, 2006. Under
this law, (i) the current $100,000 deposit insurance coverage will be indexed
for inflation (with adjustments every five years, commencing January 1, 2011),
and (ii) deposit insurance coverage for retirement accounts was increased to
$250,000 per participant subject to adjustment for
inflation. Effective October 3, 2008, however, the Emergency Economic
Stabilization Act of 2008 (the “EESA”) was enacted and, among other things,
temporarily raised the basic limit on federal deposit insurance coverage from
$100,000 to $250,000 per depositor. EESA initially contemplated that
the coverage limit would return to $100,000 after December 31, 2009, but the
expiration date was recently extended to December 31, 2013. The
coverage for retirement accounts did not change and remains at
$250,000.
The Reform Act also gave the FDIC
greater latitude in setting the assessment rates for insured depository
institutions which could be used to impose minimum assessments. On
May 22, 2009, the FDIC imposed an emergency insurance assessment of
five basis points in an effort to restore the Deposit Insurance Fund to an
acceptable level. On November 12, 2009, the FDIC adopted a final rule
requiring insured depository institutions to prepay their estimated quarterly
risk-based deposit assessments for the fourth quarter of 2009, and for all of
2010, 2011, and 2012, on December 30, 2009, along with each institution’s risk
based deposit insurance assessment for the third quarter of 2009. It
was also announced that the assessment rate will increase by 3 basis points
effective January 1, 2011. The prepayment will be accounted for as a
prepaid expense to be amortized quarterly. The prepaid assessment
will qualify for a zero risk weight under the risk-based capital
requirements. The Bank paid $4 million in FDIC premiums for
2009. In December 2009, the Bank prepaid approximately $11 million in
FDIC premiums.
USA
PATRIOT ACT
Congress
adopted the USA PATRIOT Act (the “Patriot Act”) on October 26, 2001 in response
to the terrorist attacks that occurred on September 11, 2001. Under
the Patriot Act, certain financial institutions, including banks, are required
to maintain and prepare additional records and reports that are designed to
assist the government’s efforts to combat terrorism. The Patriot Act
includes sweeping anti-money laundering and financial transparency laws that
require additional regulations, including, among other things, standards for
verifying client identification when opening an account and rules to promote
cooperation among financial institutions, regulators and law enforcement
entities in identifying parties that may be involved in terrorism or money
laundering.
Federal
Securities Law
The
shares of the Corporation’s common stock are registered with the SEC under
Section 12(b) of the Securities Exchange Act of 1934, as amended (the “Exchange
Act”), and listed on the NASDAQ Global Select Market. The Corporation
is subject to information reporting requirements, proxy solicitation
requirements, insider trading restrictions and other requirements of the
Exchange Act, including the requirements imposed under the federal
Sarbanes-Oxley Act of 2002. Among other things, loans to and other
transactions with insiders are subject to restrictions and heightened
disclosure, directors and certain committees of the Board must satisfy certain
independence requirements, and the Corporation is generally required to comply
with certain corporate governance requirements.
[10]
Governmental
Monetary and Credit Policies and Economic Controls
The
earnings and growth of the banking industry and ultimately of the Bank are
affected by the monetary and credit policies of governmental authorities,
including the FRB. An important function of the FRB is to regulate
the national supply of bank credit in order to control recessionary and
inflationary pressures. Among the instruments of monetary policy used by the FRB
to implement these objectives are open market operations in U.S. Government
securities, changes in the federal funds rate, changes in the discount rate of
member bank borrowings, and changes in reserve requirements against member bank
deposits. These means are used in varying combinations to influence
overall growth of bank loans, investments and deposits and may also affect
interest rates charged on loans or paid on deposits. The monetary
policies of the FRB authorities have had a significant effect on the operating
results of commercial banks in the past and are expected to continue to have
such an effect in the future. In view of changing conditions in the
national economy and in the money markets, as well as the effect of actions by
monetary and fiscal authorities, including the FRB, no prediction can be made as
to possible future changes in interest rates, deposit levels, loan demand or
their effect on the business and earnings of the Corporation and its
subsidiaries.
SEASONALITY
Management does not believe that our
business activities are seasonal in nature. Deposit, loan, and
insurance demand may vary depending on local and national economic conditions,
but management believes that any variation will not have a material impact on
our planning or policy-making strategies.
EMPLOYEES
At
December 31, 2009, we employed 487 individuals, of whom 377 were full-time
employees.
|
ITEM
1A.
|
RISK
FACTORS
|
Our financial condition and results of
operations are subject to numerous risks and uncertainties and could be
materially and adversely affected by any of these risks and
uncertainties. The risks and uncertainties that we believe are the
most significant are discussed below. You should carefully consider
these risks before making an investment decision with respect to any of the
Corporation’s securities. This annual report also contains
forward-looking statements that involve risks and uncertainties. Our
actual results could differ materially from those anticipated in these
forward-looking statements as a result of certain factors, including the risks
faced by us described below and elsewhere in this report.
Risks
Relating to the Corporation and its Affiliates
The
Corporation’s future success depends on the successful growth of its
subsidiaries.
The
Corporation’s primary business activity for the foreseeable future will be to
act as the holding company of the Bank and its other direct and indirect
subsidiaries. Therefore, the Corporation’s future profitability will
depend on the success and growth of these subsidiaries. In the
future, part of the Corporation’s growth may come from buying other banks and
buying or establishing other companies. Such entities may not be
profitable after they are purchased or established, and they may lose money,
particularly at first. A new bank or company may bring with it
unexpected liabilities, bad loans, or bad employee relations, or the new bank or
company may lose customers.
[11]
Interest
rates and other economic conditions will impact our results of
operations.
Our results of operations may be
materially and adversely affected by changes in prevailing economic conditions,
including declines in real estate values, rapid changes in interest rates and
the monetary and fiscal policies of the federal government. Our
profitability is in part a function of the spread between the interest rates
earned on assets and the interest rates paid on deposits and other
interest-bearing liabilities (i.e., net interest income),
including advances from the Federal Home Loan Bank (the “FHLB”) of Atlanta.
Interest rate risk arises from mismatches (i.e., the interest
sensitivity gap) between the dollar amount of repricing or maturing assets and
liabilities and is measured in terms of the ratio of the interest rate
sensitivity gap to total assets. More assets repricing or maturing
than liabilities over a given time period is considered asset-sensitive and is
reflected as a positive gap, and more liabilities repricing or maturing than
assets over a given time period is considered liability-sensitive and is
reflected as negative gap. An asset-sensitive position (i.e., a positive gap) could
enhance earnings in a rising interest rate environment and could negatively
impact earnings in a falling interest rate environment, while a
liability-sensitive position (i.e., a negative gap) could
enhance earnings in a falling interest rate environment and negatively impact
earnings in a rising interest rate environment. Fluctuations in
interest rates are not predictable or controllable. There can be no
assurance that our attempts to structure our asset and liability management
strategies to mitigate the impact on net interest income of changes in market
interest rates will be successful in the event of such changes.
The
majority of our business is concentrated in Maryland and West Virginia, much of
which involves real estate lending, so a decline in the real estate and credit
markets could materially and adversely impact our financial condition and
results of operations.
Most of our loans are made to Western
Maryland and Northeastern West Virginia borrowers, and many of these loans are
secured by real estate, including construction and land development
loans. Approximately 20%, or $226 million, of our total loans are
loans secured by real estate construction and development
projects. Commercial real estate development loans comprise $152
million of this amount. No industry or borrower comprises greater than 10% of
total loans as of December 31, 2009. Accordingly, a decline in local economic
conditions may have a greater effect on our earnings and capital than on the
earnings and capital of larger financial institutions whose loan portfolios are
geographically diverse. Moreover, the national and local economies
have significantly weakened during the past several years because of the ongoing
economic recession. As a result, real estate values across the
country, including in our market areas, have decreased and the general
availability of credit, especially credit to be secured by real estate, has also
decreased. These conditions have made it more difficult for real
estate owners and owners of loans secured by real estate to sell their assets at
the times and at the prices they desire. In addition, these
conditions have increased the risk that the market values of the real estate
securing our loans may deteriorate, which could cause us to lose money in the
event a borrower fails to repay a loan and we are forced to foreclose on the
property. There can be no guarantee as to when or whether economic
conditions will improve.
Additionally, the FRB and the FDIC,
along with the other federal banking regulators, issued guidance in December
2006 entitled “Concentrations in Commercial Real Estate Lending, Sound Risk
Management Practices” directed at institutions that have particularly high
concentrations of commercial real estate loans within their lending
portfolios. This guidance suggests that institutions whose commercial
real estate loans exceed certain percentages of capital should implement
heightened risk management practices appropriate to their concentration risk and
may be required to maintain higher capital ratios than institutions with lower
concentrations in commercial real estate lending. Based on our
commercial real estate concentration as of December 31, 2009, we may be subject
to further supervisory analysis during future examinations. We cannot
guarantee that any risk management practices we implement will be effective to
prevent losses relating to our commercial real estate
portfolio. Management cannot predict the extent to which this
guidance will impact our operations or capital requirements.
The
Bank may experience loan losses in excess of its allowance, which would reduce
our earnings.
The risk of credit losses on loans
varies with, among other things, general economic conditions, the type of loan
being made, the creditworthiness of the borrower over the term of the loan and,
in the case of a collateralized loan, the value and marketability of the
collateral for the loan. Management of the Bank maintains an
allowance for loan losses based upon, among other things, historical experience,
an evaluation of economic conditions and regular reviews of delinquencies and
loan portfolio quality. Based upon such factors, management makes various
assumptions and judgments about the ultimate collectability of the loan
portfolio and provides an allowance for loan losses based upon a percentage of
the outstanding balances and for specific loans when their ultimate
collectability is considered questionable. If management’s
assumptions and judgments prove to be incorrect and the allowance for loan
losses is inadequate to absorb future losses, or if the bank regulatory
authorities require us to increase the allowance for loan losses as a part of
its examination process, our earnings and capital could be significantly and
adversely affected. Although management continually monitors our loan
portfolio and makes determinations with respect to the allowance for loan
losses, future adjustments may be necessary if economic conditions differ
substantially from the assumptions used or adverse developments arise with
respect to our non-performing or performing loans. Material additions
to the allowance for loan losses could result in a material decrease in our net
income and capital, and could have a material adverse effect on our financial
condition.
[12]
The
market value of our investments could decline.
As of December 31, 2009, we had
classified all but four of our investment securities as available-for-sale
pursuant to Financial Accounting Standards Board (“FASB”) Accounting Standards
Codification (“ASC”) Topic 320, Investments – Debt and Equity
Securities, relating to accounting
for investments. Topic 320 requires that unrealized gains and losses
in the estimated value of the available-for-sale portfolio be “marked to market”
and reflected as a separate item in shareholders’ equity (net of tax) as
accumulated other comprehensive income. There can be no assurance
that future market performance of our investment portfolio will enable us to
realize income from sales of securities. Shareholders’ equity will
continue to reflect the unrealized gains and losses (net of tax) of these
investments. Moreover, there can be no assurance that the market
value of our investment portfolio will not decline, causing a corresponding
decline in shareholders’ equity.
Our investments include stock issued by
the FHLB of Atlanta. As a member of the FHLB of Atlanta, we are
required to purchase stock of that bank based on how much we borrow from it and
the quality of the collateral that we pledge to secure that
borrowing. In recent months, the banking industry has become
concerned about the financial strength of the banks in the FHLB system, and some
FHLB banks have stopped paying dividends on and redeeming FLHB
stock.
On March 25, 2009, the FHLB of Atlanta
announced that it would not pay a dividend for the fourth quarter of
2008. On June 3, 2009, the FHLB of Atlanta announced that it would
not pay a dividend for first quarter of 2009. During the first
quarter of 2009, the Corporation reversed approximately $28,000 in dividends
that were accrued for the fourth quarter of 2008. On August 12, 2009,
FHLB of Atlanta announced that a dividend for the second quarter of 2009 would
be paid. A dividend of $29,000 was posted during the third quarter of
2009. The Corporation did not accrue any dividends for the third or
fourth quarters of 2009.
Management
believes that several factors will affect the market values of our investment
portfolio. These include, but are not limited to, changes in interest
rates or expectations of changes, the degree of volatility in the securities
markets, inflation rates or expectations of inflation and the slope of the
interest rate yield curve (the yield curve refers to the differences between
shorter-term and longer-term interest rates; a positively sloped yield curve
means shorter-term rates are lower than longer-term rates). Also, the
passage of time will affect the market values of our investment securities, in
that the closer they are to maturing, the closer the market price should be to
par value. These and other factors may impact specific categories of
the portfolio differently, and management cannot predict the effect these
factors may have on any specific category.
We
operate in a competitive environment, and our inability to effectively compete
could adversely and materially impact our financial condition and results of
operations.
We operate in a competitive
environment, competing for loans, deposits, and customers with commercial banks,
savings associations and other financial entities. Competition for
deposits comes primarily from other commercial banks, savings associations,
credit unions, money market and mutual funds and other investment
alternatives. Competition for loans comes primarily from other
commercial banks, savings associations, mortgage banking firms, credit unions
and other financial intermediaries. Competition for other products,
such as insurance and securities products, comes from other banks, securities
and brokerage companies, insurance companies, insurance agents and brokers, and
other non-bank financial service providers in our market area. Many
of these competitors are much larger in terms of total assets and
capitalization, have greater access to capital markets, and/or offer a broader
range of financial services than those that we offer. In addition,
banks with a larger capitalization and financial intermediaries not subject to
bank regulatory restrictions have larger lending limits and are thereby able to
serve the needs of larger customers.
In
addition, current banking laws facilitate interstate branching, merger activity
among banks, and expanded activities. Since September 1995, certain
bank holding companies have been authorized to acquire banks throughout the
United States. Since June 1, 1997, certain banks have been permitted
to merge with banks organized under the laws of different states. As
a result, interstate banking is now an accepted element of competition in the
banking industry and the Corporation may be brought into competition with
institutions with which it does not presently compete. Moreover, the
GLB Act revised the BHC Act in 2000 and repealed the affiliation provisions of
the Glass-Steagall Act of 1933, which, taken together, limited the securities,
insurance and other non-banking activities of any company that controls an FDIC
insured financial institution. These laws may increase the
competition we face in our market areas in the future, although management
cannot predict the degree to which such competition will impact our financial
conditions or results of operations.
[13]
The
banking industry is heavily regulated; significant regulatory changes could
adversely affect our operations.
Our operations will be impacted by
current and future legislation and by the policies established from time to time
by various federal and state regulatory authorities. The Corporation
is subject to supervision by the FRB. The Bank is subject to
supervision and periodic examination by the Maryland Commissioner of Financial
Regulation, the West Virginia Division of Banking, and the
FDIC. Banking regulations, designed primarily for the safety of
depositors, may limit a financial institution’s growth and the return to its
investors by restricting such activities as the payment of dividends, mergers
with or acquisitions by other institutions, investments, loans and interest
rates, interest rates paid on deposits, expansion of branch offices, and the
offering of securities or trust services. The Corporation and the
Bank are also subject to capitalization guidelines established by federal law
and could be subject to enforcement actions to the extent that either is found
by regulatory examiners to be undercapitalized. It is not possible to predict
what changes, if any, will be made to existing federal and state legislation and
regulations or the effect that such changes may have on our future business and
earnings prospects. Management also cannot predict the nature or the
extent of the effect on our business and earnings of future fiscal or monetary
policies, economic controls, or new federal or state
legislation. Further, the cost of compliance with regulatory
requirements may adversely affect our ability to operate
profitably.
Our
regulatory expenses will likely increase due to federal laws, rules and programs
that have been enacted or adopted in response to the recent banking crisis and
the current national recession.
In response to the banking crisis that
began in 2008 and the resulting national recession, the federal government took
drastic steps to help stabilize the credit market and the financial
industry. These steps included the enactment of EESA, which, among
other things, raised the basic limit on federal deposit insurance coverage to
$250,000, and the FDIC’s adoption of the TLGP, which, under the TAG portion,
provides full deposit insurance coverage through June 30, 2010 for non-interest
bearing transaction deposit accounts, IOLTAs, and NOW accounts with interest
rates of 0.50% or less, regardless of account balance. The TLGP
requires participating institutions, like us, to pay 10 basis points per annum
for the additional insured deposits. These actions will cause our
regulatory expenses to increase. Additionally, due in part to the
failure of several depository institutions around the country since the banking
crisis began, the FDIC imposed an emergency insurance assessment to help restore
the Deposit Insurance Fund and further required insured depository institutions
to prepay their estimated quarterly risk-based deposit assessments through 2012
on December 30, 2009. Given the current state of the national
economy, there can be no assurance that the FDIC will not impose future
emergency assessments or further revise its rate structure.
Customer
concern about deposit insurance may cause a decrease in deposits held at the
Bank.
With increased concerns about bank
failures, customers increasingly are concerned about the extent to which their
deposits are insured by the FDIC. Customers may withdraw deposits
from the Bank in an effort to ensure that the amount they have on deposit with
us is fully insured. Decreases in deposits may adversely affect our
funding costs and net income.
Our
funding sources may prove insufficient to replace deposits and support our
future growth.
We rely on customer deposits, advances
from the FHLB, lines of credit at other financial institutions and brokered
funds to fund our operations. Although we have historically been able
to replace maturing deposits and advances if desired, no assurance can be given
that we would be able to replace such funds in the future if our financial
condition or the financial condition of the FHLB or market conditions were to
change. Our financial flexibility will be severely constrained and/or
our cost of funds will increase if we are unable to maintain our access to
funding or if financing necessary to accommodate future growth is not available
at favorable interest rates. Finally, if we are required to rely more heavily on
more expensive funding sources to support future growth, our revenues may not
increase proportionately to cover our costs. In this case, our profitability
would be adversely affected.
The
loss of key personnel could disrupt our operations and result in reduced
earnings.
Our growth and profitability will
depend upon our ability to attract and retain skilled managerial, marketing and
technical personnel. Competition for qualified personnel in the
financial services industry is intense, and there can be no assurance that we
will be successful in attracting and retaining such personnel. Our
current executive officers provide valuable services based on their many years
of experience and in-depth knowledge of the banking industry. Due to
the intense competition for financial professionals, these key personnel would
be difficult to replace and an unexpected loss of their services could result in
a disruption to the continuity of operations and a possible reduction in
earnings.
[14]
We
may lose key personnel because of our participation in the Troubled Asset Relief
Program Capital Purchase Program.
On January 30, 2009, we participated in
the Troubled Asset Relief Program (“TARP”) Capital Purchase Program (the “CPP”)
adopted by the U.S. Department of Treasury (“Treasury”) by selling $30 million
in shares of our Fixed Rate Cumulative Perpetual Preferred Stock, Series A (the
“Series A Preferred Stock”) to Treasury and issuing a 10-year common stock
purchase warrant (the “Warrant”) to Treasury. As part of these
transactions, we adopted Treasury’s standards for executive compensation and
corporate governance for the period during which Treasury holds any shares of
the Series A Preferred Stock and/or any shares of common stock that may be
acquired upon exercise of the Warrant. On February 17, 2009, the
American Recovery and Reinvestment Act of 2009 (the “Recovery Act”) was signed
into law, which, among other things, imposed additional executive compensation
restrictions on institutions that participate in TARP for so long as any TARP
assistance remains outstanding. Among these restrictions is a
prohibition against making most severance payments to our “senior executive
officers”, which term includes our Chairman and Chief Executive Officer, our
Chief Financial Officer and, generally, the three next most highly compensated
executive officers, and to the next five most highly compensated
employees. The restrictions also limit the type, timing and amount of
bonuses, retention awards and incentive compensation that may be paid to certain
employees. These restrictions, coupled with the competition we face
from other institutions, including institutions that do not participate in TARP,
may make it more difficult for us to attract and/or retain exceptional key
employees.
Our
lending activities subject us to the risk of environmental
liabilities.
A
significant portion of our loan portfolio is secured by real
property. During the ordinary course of business, we may foreclose on
and take title to properties securing certain loans. In doing so,
there is a risk that hazardous or toxic substances could be found on these
properties. If hazardous or toxic substances are found, we may be
liable for remediation costs, as well as for personal injury and property
damage. Environmental laws may require us to incur substantial
expenses and may materially reduce the affected property’s value or limit our
ability to use or sell the affected property. In addition, future
laws or more stringent interpretations or enforcement policies with respect to
existing laws may increase our exposure to environmental
liability. Although we have policies and procedures to perform an
environmental review before initiating any foreclosure action on real property,
these reviews may not be sufficient to detect all potential environmental
hazards. The remediation costs and any other financial liabilities
associated with an environmental hazard could have a material adverse effect on
our financial condition and results of operations.
We
may be adversely affected by other recent legislation.
As discussed above, the GLB Act
repealed restrictions on banks affiliating with securities firms and it also
permitted bank holding companies that become financial holding companies to
engage in additional financial activities, including insurance and securities
underwriting and agency activities, merchant banking, and insurance company
portfolio investment activities that are currently not permitted for bank
holding companies. Although the Corporation is a financial holding
company, this law may increase the competition we face from larger banks and
other companies. It is not possible to predict the full effect that
this law will have on us.
The
federal Sarbanes-Oxley Act of 2002 requires management of publicly traded
companies to perform an annual assessment of their internal controls over
financial reporting and to report on whether the system is effective as of the
end of the Company’s fiscal year. Disclosure of significant
deficiencies or material weaknesses in internal controls could cause an
unfavorable impact to shareholder value by affecting the market value of our
stock.
The federal USA PATRIOT Act requires
certain financial institutions, such as the Bank, to maintain and prepare
additional records and reports that are designed to assist the government’s
efforts to combat terrorism. This law includes sweeping anti-money laundering
and financial transparency laws and required additional regulations, including,
among other things, standards for verifying client identification when opening
an account and rules to promote cooperation among financial institutions,
regulators and law enforcement entities in identifying parties that may be
involved in terrorism or money laundering. If we fail to comply with
this law, we could be exposed to adverse publicity as well as fines and
penalties assessed by regulatory agencies.
[15]
We
may be subject to claims and the costs of defensive actions.
Our customers may sue us for losses due
to alleged breaches of fiduciary duties, errors and omissions of employees,
officers and agents, incomplete documentation, our failure to comply with
applicable laws and regulations, or many other reasons. Also, our
employees may knowingly or unknowingly violate laws and
regulations. Management may not be aware of any violations until
after their occurrence. This lack of knowledge may not insulate us
from liability. Claims and legal actions may result in legal expenses
and liabilities that may reduce our profitability and hurt our financial
condition.
We
may not be able to keep pace with developments in technology.
We use various technologies in
conducting our businesses, including telecommunication, data processing,
computers, automation, internet-based banking, and debit
cards. Technology changes rapidly. Our ability to compete
successfully with other financial institutions may depend on whether we can
exploit technological changes. We may not be able to exploit
technological changes, and any investment we do make may not make us more
profitable.
Risks
Relating to the Corporation’s Securities
The
Corporation’s shares of common stock, Series A Preferred Stock, and the Warrant
are not insured.
The shares of the Series A Preferred
Stock, the warrant, and the shares of common stock for which the warrant may be
exercised are not deposits and are not insured against loss by the FDIC or any
other governmental or private agency.
The
Corporation’s ability to pay dividends is limited by applicable banking and
corporate law.
The Corporation’s ability to pay
dividends to shareholders is largely dependent upon the receipt of dividends
from the Bank. Both federal and state laws impose restrictions on the
ability of the Bank to pay dividends. Federal law generally prohibits
the payment of a dividend by a troubled institution. Under Maryland
law, a state-chartered commercial bank may pay dividends only out of undivided
profits or, with the prior approval of the Commissioner, from surplus in excess
of 100% of required capital stock. If however, the surplus of a
Maryland bank is less than 100% of its required capital stock, cash dividends
may not be paid in excess of 90% of net earnings. In addition to these specific
restrictions, bank regulatory agencies also have the ability to prohibit
proposed dividends by a financial institution which would otherwise be permitted
under applicable regulations if the regulatory body determines that such
distribution would constitute an unsafe or unsound
practice. Moreover, the payment of dividends to shareholders, and the
amounts thereof, is at the discretion of the Corporation’s Board of
Directors. Accordingly, there can be no guarantee that we will
declare dividends in any fiscal quarter or, if declared, that the amount of a
dividend will remain unchanged from quarter to quarter.
Because
of the Corporation’s participation in TARP, it is subject to several
restrictions relating to shares of its securities, including restrictions on its
ability to declare or pay dividends on and repurchase its shares.
As stated above, the Corporation issued
30,000 shares of the Series A Preferred Stock and the Warrant to purchase
326,323 shares of common stock. Under the terms of the transaction
documents, the Corporation’s ability to declare or pay dividends on shares of
its capital stock is limited. Specifically, the Corporation is unable
to declare dividends on common stock, other stock ranking junior to the Series A
Preferred Stock (“Junior Stock”), or preferred stock ranking on a parity with
the Series A Preferred Stock (“Parity Stock”) if the Corporation is in arrears
on the dividends on the Series A Preferred Stock. Further, the
Corporation is not permitted to increase dividends on its common stock above the
amount of the last quarterly cash dividend per share declared prior to October
14, 2008 without Treasury’s approval until January 30, 2012 unless all of the
Series A Preferred Stock has been redeemed or transferred. In
addition, the Corporation’s ability to repurchase its capital stock is
restricted. Until the earlier of January 30, 2012 or the date on
which the Treasury no longer holds any Series A Preferred Stock, Treasury’s
consent generally is required for any repurchase by the Corporation of its
outstanding capital stock or any redemption by the Trusts of their outstanding
trust preferred securities. Further, shares of common stock, Junior
Stock or Parity Stock may not be repurchased if the Corporation is in arrears on
the Series A Preferred Stock dividends.
[16]
The
Corporation’s ability to pay dividends on its securities is also subject to the
terms of its outstanding debentures.
In March 2004, the Corporation issued
approximately $30.9 million of junior subordinated debentures to Trust I and
Trust II in connection with the sales by those trusts of $30.0 in mandatorily
redeemable preferred capital securities to third party investors. In
December 2004, the Corporation issued $5.0 million of additional junior
subordinated debentures. Between December 2009 and January 2010, the
Corporation issued approximately $10.8 million of junior subordinated debentures
to Trust III and Trust III issued approximately $10.5 million in mandatorily
redeemable preferred capital securities to third party investors. The
terms of these debentures require the Corporation to make quarterly payments of
interest to the holders of the debentures, although the Corporation has the
ability to defer payments of interest for up to 20 consecutive quarterly
periods. Should the Corporation make such a deferral election,
however, it would be prohibited from paying dividends or distributions on, or
from repurchasing, redeeming or otherwise acquiring any shares of its capital
stock, including the common stock and the Series A Preferred
Stock. Although the Corporation has no present intention of deferring
payments of interest on its debentures, there can be no assurance that the
Corporation will not elect to do so in the future.
There
is no market for the Series A Preferred Stock or the Warrant, and the common
stock is not heavily traded.
There is no established trading market
for the shares of the Series A Preferred Stock or the Warrant. The Corporation
does not intend to apply for listing of the Series A Preferred Stock on any
securities exchange or for inclusion of the Series A Preferred Stock in any
automated quotation system unless requested by Treasury. The Corporation’s
common stock is listed on the NASDAQ Global Select Market, but shares of the
common stock are not heavily traded. Securities that are not heavily traded can
be more volatile than stock trading in an active public market. Factors such as
our financial results, the introduction of new products and services by us or
our competitors, and various factors affecting the banking industry generally
may have a significant impact on the market price of the shares the common
stock. Management cannot predict the extent to which an active public market for
any of the Corporation’s securities will develop or be sustained in the future.
Accordingly, holders of the Corporation’s securities may not be able to sell
such securities at the volumes, prices, or times that they desire.
The
Corporation’s Articles of Incorporation and Bylaws and Maryland law may
discourage a corporate takeover.
The Corporation’s Amended and Restated
Articles of Incorporation and Amended and Restated Bylaws, as amended, contain
certain provisions designed to enhance the ability of the Corporation’s Board of
Directors to deal with attempts to acquire control of the
Corporation. First, the Board of Directors is classified into three
classes. Directors of each class serve for staggered three-year
periods, and no director may be removed except for cause, and then only by the
affirmative vote of either a majority of the entire Board of Directors or a
majority of the outstanding voting stock. Second, the Board has the
authority to classify and reclassify unissued shares of stock of any class or
series of stock by setting, fixing, eliminating, or altering in any one or more
respects the preferences, rights, voting powers, restrictions and qualifications
of, dividends on, and redemption, conversion, exchange, and other rights of,
such securities. The Board could use this authority, along with its
authority to authorize the issuance of securities of any class or series, to
issue shares having terms favorable to management to a person or persons
affiliated with or otherwise friendly to management. In addition, the
Bylaws require any shareholder who desires to nominate a director to abide by
strict notice requirements.
Maryland law also contains
anti-takeover provisions that apply to the Corporation. Maryland’s
Business Combination Act generally prohibits, subject to certain limited
exceptions, corporations from being involved in any “business combination”
(defined as a variety of transactions, including a merger, consolidation, share
exchange, asset transfer or issuance or reclassification of equity securities)
with any “interested shareholder” for a period of five years following the most
recent date on which the interested shareholder became an interested
shareholder. An interested shareholder is defined generally as a
person who is the beneficial owner of 10% or more of the voting power of the
outstanding voting stock of the corporation after the date on which the
corporation had 100 or more beneficial owners of its stock or who is an
affiliate or associate of the corporation and was the beneficial owner, directly
or indirectly, of 10% percent or more of the voting power of the then
outstanding stock of the corporation at any time within the two-year period
immediately prior to the date in question and after the date on which the
corporation had 100 or more beneficial owners of its
stock. Maryland’s Control Share Acquisition Act applies to
acquisitions of “control shares”, which, subject to certain exceptions, are
shares the acquisition of which entitle the holder, directly or indirectly, to
exercise or direct the exercise of the voting power of shares of stock of the
corporation in the election of directors within any of the following ranges of
voting power: one-tenth or more, but less than one-third of all
voting power; one-third or more, but less than a majority of all voting power or
a majority or more of all voting power. Control shares have limited
voting rights.
Although these provisions do not
preclude a takeover, they may have the effect of discouraging, delaying or
deferring a tender offer or takeover attempt that a shareholder might consider
in his or her best interest, including those attempts that might result in a
premium over the market price for the common stock. Such provisions
will also render the removal of the Board of Directors and of management more
difficult and, therefore, may serve to perpetuate current
management. These provisions could potentially adversely affect the
market price of our common stock.
[17]
|
ITEM 1B.
|
UNRESOLVED
STAFF COMMENTS
|
None.
|
ITEM 2.
|
PROPERTIES
|
The headquarters of the Corporation and
the Bank occupies approximately 29,000 square feet at 19 South Second Street,
Oakland, Maryland, a 30,000 square feet operations center located at 12892
Garrett Highway, Oakland Maryland and 8,500 square feet at 102 South Second
Street, Oakland, Maryland. These premises are owned by the Corporation. The Bank
owns 20 of its banking offices and leases eight. The Corporation also
leases eight offices of non-bank subsidiaries. Total rent expense on
the leased offices and properties was $.64 million in 2009.
|
ITEM 3.
|
LEGAL
PROCEEDINGS
|
We are at times, in the ordinary course
of business, subject to legal actions. Management, upon the advice of
counsel, believes that losses, if any, resulting from current legal actions will
not have a material adverse effect on our financial condition or results of
operations.
|
ITEM 4.
|
[RESERVED]
|
PART
II
|
MARKET
FOR REGISTRANT’S COMMON EQUITY, RELATED STOCKHOLDER MATTERS AND ISSUER
PURCHASES OF EQUITY SECURITIES
|
Shares of the Corporation’s common
stock are listed on the NASDAQ Global Select Market under the symbol
“FUNC”. As of February 26, 2010, the Corporation had 1,949
shareholders of record. The high and low sales prices for, and the cash
dividends declared on, the shares of the Corporation’s common stock for each
quarterly period of 2009 and 2008 are set forth below. On March 10,
2010, the closing sales price of the common stock was $5.65 per
share.
|
2009
|
High
|
Low
|
Dividends Declared
|
|||||||||
|
1st
Quarter
|
$ | 14.96 | $ | 7.02 | $ | .200 | ||||||
|
2nd
Quarter
|
12.50 | 8.06 | .200 | |||||||||
|
3rd
Quarter
|
12.00 | 10.15 | .200 | |||||||||
|
4th
Quarter
|
11.80 | 5.88 | .100 | |||||||||
|
2008
|
High
|
Low
|
Dividends Declared
|
|||||||||
|
1st
Quarter
|
$ | 20.85 | $ | 17.01 | $ | .200 | ||||||
|
2nd
Quarter
|
19.98 | 18.04 | .200 | |||||||||
|
3rd
Quarter
|
20.73 | 16.01 | .200 | |||||||||
|
4th
Quarter
|
20.00 | 13.00 | .200 | |||||||||
Cash dividends are typically declared
on a quarterly basis and are at the discretion of the Corporation’s Board of
Directors. Dividends to shareholders are generally dependent on the
ability of the Corporation’s subsidiaries, especially the Bank, to declare
dividends to the Corporation. The ability of these entities to
declare dividends is limited by federal and state banking laws, state corporate
laws, and the terms of our other securities. Further information
about these limitations may be found in Note 16 of the Notes to Consolidated
Financial Statements and in the risk factors contained in Item 1A of Part I
under the heading “Risks Relating to the Corporation’s Securities”, which are
incorporated herein by reference. There can be no guarantee that
dividends will be declared in any fiscal quarter.
[18]
Market makers for the Corporation’s
common stock are:
SCOTT AND STRINGFELLOW,
INC.
909 East
Main Street
Richmond,
VA 23219
(804)643-1811
(800)552-7757
First
United Corporation Stock Performance Graph
The following graph compares the yearly
percentage change in the cumulative total return for the Corporation’s common
stock for the five years ended December 31, 2009. This data is
compared to the NASDAQ Composite market index and the SNL $1 billion to $5
billion Bank Index during the same time period. Total return numbers
are calculated as change in stock price for the period indicated with dividends
being reinvested.
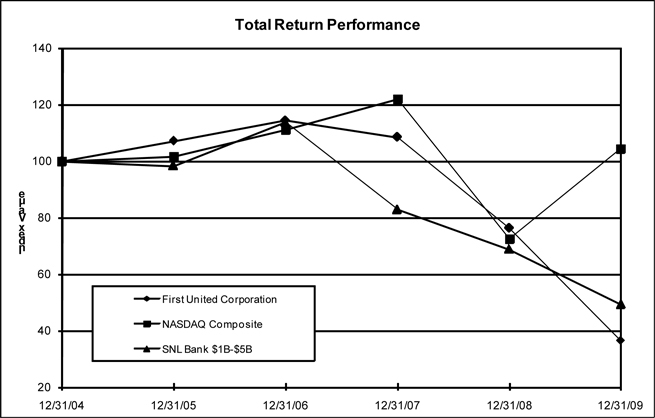
|
Period Ending
|
||||||||||||||||||||||||
|
Index
|
12/31/04
|
12/31/05
|
12/31/06
|
12/31/07
|
12/31/08
|
12/31/09
|
||||||||||||||||||
|
First
United Corporation
|
100.00 | 106.98 | 114.29 | 108.34 | 76.15 | 36.44 | ||||||||||||||||||
|
NASDAQ
Composite
|
100.00 | 101.37 | 111.03 | 121.92 | 72.49 | 104.31 | ||||||||||||||||||
|
SNL
Bank $1B-$5B Index
|
100.00 | 98.29 | 113.74 | 82.85 | 68.72 | 49.26 | ||||||||||||||||||
[19]
Issuer
Repurchases
On August 14, 2007, the Corporation’s
Board of Directors authorized a common stock repurchase plan, which was publicly
announced on August 21, 2007. The plan authorized the repurchase of up to
307,500 shares of common stock in open market and/or private transactions at
such times and in such amounts per transaction as the Chairman and Chief
Executive Officer of the Corporation determines to be appropriate. The
repurchase plan was suspended in January 2009 in connection with the
Corporation’s participation in the CPP, and no shares were repurchased by or on
behalf of the Company and its affiliates (as defined by Exchange Act Rule
10b-18) during the fourth quarter of 2009.
Equity
Compensation Plan Information
At the 2007 Annual Meeting of
Shareholders, the Corporation’s shareholders approved the First United
Corporation Omnibus Equity Compensation Plan (the “Omnibus Plan”), which
authorizes the grant of stock options, stock appreciation rights, stock awards,
stock units, performance units, dividend equivalents, and other stock-based
awards. The following table contains information about the Omnibus
Plan as of December 31, 2009:
|
Plan Category
|
Number of securities to
be issued upon exercise
of outstanding options,
warrants, and rights
(a)
|
Weighted-average
exercise price of
outstanding options,
warrants, and rights
(b)
|
Number of securities
remaining available for
future issuance under
equity compensation
plans (excluding
securities reflected in
column (a))
(c)
|
|||||||||
|
Equity
compensation plans approved by security holders
|
0 | N/A | 185,000 | (1) | ||||||||
|
Equity
compensation plans not approved by security holders
|
0 | N/A | N/A | |||||||||
|
Total
|
0 | N/A | 185,000 | |||||||||
Note:
|
(1)
|
In
addition to stock options and stock appreciation rights, the Omnibus Plan
permits the grant of stock awards, stock units, performance units,
dividend equivalents, and other stock-based awards. Subject to
the anti-dilution provisions of the Omnibus Plan, the maximum number of
shares for which awards may be granted to any one participant in any
calendar year is 20,000, without regard to whether an award is paid in
cash or shares.
|
[20]
|
ITEM
6.
|
SELECTED
FINANCIAL DATA
|
The following table sets forth certain
selected financial data for the five years ended December 31, 2009 and is
qualified in its entirety by the detailed information and financial statements,
including notes thereto, included elsewhere or incorporated by reference in this
annual report.
|
2009
|
2008
|
2007
|
2006
|
2005
|
||||||||||||||||
|
Balance
Sheet Data
|
||||||||||||||||||||
|
Total
Assets
|
$ | 1,743,736 | $ | 1,639,104 | $ | 1,478,909 | $ | 1,349,317 | $ | 1,310,991 | ||||||||||
|
Net
Loans
|
1,101,794 | 1,120,199 | 1,035,962 | 957,126 | 954,545 | |||||||||||||||
|
Investment
Securities
|
273,784 | 354,595 | 304,908 | 263,272 | 230,095 | |||||||||||||||
|
Deposits
|
1,304,166 | 1,222,889 | 1,126,552 | 971,381 | 955,854 | |||||||||||||||
|
Long-term
Borrowings
|
270,544 | 277,403 | 178,451 | 166,330 | 128,373 | |||||||||||||||
|
Shareholders’
Equity
|
100,566 | 72,690 | 104,665 | 96,856 | 92,039 | |||||||||||||||
|
Operating
Data
|
||||||||||||||||||||
|
Interest
Income
|
$ | 85,342 | $ | 95,216 | $ | 93,565 | $ | 80,269 | $ | 69,756 | ||||||||||
|
Interest
Expense
|
32,104 | 43,043 | 49,331 | 39,335 | 29,413 | |||||||||||||||
|
Net
Interest Income
|
53,238 | 52,173 | 44,234 | 40,934 | 40,343 | |||||||||||||||
|
Provision
for Loan Losses
|
15,588 | 12,925 | 2,312 | 1,165 | 1,078 | |||||||||||||||
|
Other
Operating Income
|
(10,677 | ) | 13,769 | 15,092 | 14,041 | 14,088 | ||||||||||||||
|
Other
Operating Expense
|
46,793 | 40,573 | 38,475 | 35,490 | 34,654 | |||||||||||||||
|
Income
Before Taxes
|
(19,820 | ) | 12,444 | 18,539 | 18,320 | 18,699 | ||||||||||||||
|
Income
Tax (benefit)/expense
|
(8,496 | ) | 3,573 | 5,746 | 5,743 | 6,548 | ||||||||||||||
|
Net
(Loss) Income
|
$ | (11,324 | ) | $ | 8,871 | $ | 12,793 | $ | 12,577 | $ | 12,151 | |||||||||
|
Accumulated
preferred stock dividend and discount accretion
|
(1,430 | ) | — | — | — | — | ||||||||||||||
|
Net
(loss) attributable to/income available to common
shareholders
|
$ | (12,754 | ) | $ | 8,871 | $ | 12,793 | $ | 12,577 | $ | 12,151 | |||||||||
|
Per
Share Data
|
||||||||||||||||||||
|
Basic
net (Loss)/ Income per common share
|
$ | (2.08 | ) | $ | 1.45 | $ | 2.08 | $ | 2.05 | $ | 1.99 | |||||||||
|
Diluted
net (Loss)/Income per common share
|
$ | (2.08 | ) | $ | 1.45 | $ | 2.08 | $ | 2.05 | $ | 1.99 | |||||||||
|
Dividends
Paid
|
.80 | .80 | .78 | .76 | .74 | |||||||||||||||
|
Book
Value
|
11.49 | 11.89 | 17.05 | 15.77 | 15.04 | |||||||||||||||
|
Significant
Ratios
|
||||||||||||||||||||
|
Return
on Average Assets
|
(.67 | )% | .55 | % | .90 | % | .96 | % | .95 | % | ||||||||||
|
Return
on Average Equity
|
(11.02 | )% | 9.31 | % | 12.70 | % | 13.07 | % | 13.61 | % | ||||||||||
|
Dividend
Payout Ratio
|
(43.21 | )% | 55.17 | % | 37.50 | % | 37.07 | % | 37.44 | % | ||||||||||
|
Average
Equity to Average Assets
|
6.06 | % | 5.95 | % | 7.10 | % | 7.35 | % | 7.00 | % | ||||||||||
|
Total
Risk-based Capital Ratio
|
11.20 | % | 12.18 | % | 12.51 | % | 12.95 | % | 12.66 | % | ||||||||||
|
Tier
I Capital to Risk Weighted Assets
|
9.60 | % | 10.59 | % | 11.40 | % | 11.81 | % | 11.45 | % | ||||||||||
|
Tier
I Capital to Average Assets
|
8.53 | % | 8.10 | % | 8.91 | % | 9.08 | % | 8.64 | % | ||||||||||
[21]
ITEM
7. MANAGEMENT’S DISCUSSION AND ANALYSIS OF FINANCIAL CONDITION AND RESULTS
OF OPERATIONS
This discussion and analysis should be
read in conjunction with the audited consolidated financial statements and notes
thereto for the year ended December 31, 2009, which appear in Item 8 of Part II
of this annual report.
Subsequent
Events
In January 2010, Trust III issued $3.5
million in trust preferred securities to third party investors, and the
Corporation issued $3.6 million in underlying junior subordinated
debentures.
Overview
The Corporation is a financial holding
company which, through the Bank and its non-bank subsidiaries, provides an array
of financial products and services primarily to customers in four Western
Maryland counties and four Northeastern West Virginia counties. Its
principal operating subsidiary is the Bank, which consists of a community
banking network of 28 branch offices located throughout its market
areas. Our primary sources of revenue are interest income earned from
our loan and investment securities portfolios and fees earned from financial
services provided to customers.
The net loss attributable to common
shareholders for the year ended December 31, 2009 was $12.8 million, compared to
net income available to common shareholders of $8.9 million for
2008. Basic and diluted losses per common share for the year ended
December 31, 2009 were ($2.08), compared to basic and diluted income per common
share of $1.45 for 2008. The decrease in net income resulted
primarily from an increase of $24.0 million of other-than-temporary impairment
charges related to available-for-sale securities, $2.7 million in increased loan
loss provision expense and $3.5 million of increased FDIC deposit insurance
premiums. The increase in FDIC premiums resulted from the special
assessment charge of $.8 million recognized in June 2009, the revised FDIC rate
structure and the credit which offset 2008 premiums charged. Core
operations remained strong as our net interest income for the year ended
December 31, 2009 increased $1.1 million when compared to the same period of
2008. Our net interest margin decreased from 3.68% at December 31,
2008 to 3.56% at December 31, 2009 as a result of an increase in non-accruing
loans and management’s desire to increase our liquidity position. The
provision for loan losses was $15.6 million for the year ended December 31,
2009, compared to $12.9 million for the same period of 2008. Interest
expense on our interest-bearing liabilities decreased $10.9 million due to the
low interest rate environment, our decision to only increase special pricing for
full relationship customers and certificates of deposit renewing at lower
interest rates due to the short duration of our portfolio. The
increased provision was necessary to provide specific allocations for impaired
loans where management has determined that the collateral supporting the loans
is not adequate to cover the loan balance and due to increases in the
qualitative factors affecting the allowance for loan losses as a result of the
current recession and distressed economic environment.
Other
operating income decreased $24.4 million during 2009 when compared to 2008. This
decrease is primarily attributable to the recognition of $26.7 million in
other-than-temporary impairment charges and $.3 million realized losses on the
investment portfolio. Trust department income and income earned on bank
owned life insurance have also declined as compared to 2008 due to decreases in
the market values of assets under management and reduced interest rates,
respectively. Management has also noted a decrease in consumer spending as
service charge income has shown a decline of $2.0 million during the 12 months
of 2009. These declines were offset slightly by $0.7 million of increased
insurance commissions as a result of the Insurance Group’s acquisition of books
of business late in 2008. Operating expenses increased $6.2 million in
2009 when compared to 2008. This increase is due primarily to a $3.5
million increase of FDIC premiums, which is inclusive of the $0.8 million
special assessment charge, and increases in personnel costs, other real estate
owned expenses, and amortization of intangibles.
Operations
in 2009 were impacted by the following factors and strategic
initiatives:
Loan and Deposit
Growth/Impact on Net Interest Margin – We experienced a decrease of $12.7
million in loans in 2009 when compared to 2008. The residential
mortgage and construction portfolio decreased $11.8 million and a decrease in
the installment portfolio of $29.3 million. These decreases were
offset by growth of $28.4 million in the commercial portfolio as a result of
in-house production and commercial participations with other financial
institutions. We experienced growth in both fixed rate and adjustable
rate products. Interest income on loans in 2009 decreased from the
amount generated in 2008 by $6.1 million (on a fully taxable equivalent basis)
due to the decrease in interest rates, flat rate environment throughout 2009,
and the increase in non-accrual loans. Interest income on investment
securities decreased slightly by $3.0 million (on a fully taxable equivalent
basis) due to a $44.6 million decrease in the portfolio. (Additional
information on the composition of interest income is available in Table 1 that
appears on page 26).
[22]
Funding
costs in 2009 decreased as a result of the flat interest rate environment
throughout 2009 and the enhanced efforts of the internal treasury
committee. Deposits at December 31, 2009 increased $81.3 million when
compared to deposits at December 31, 2008, primarily from a $75.7 million
increase in our IRA and regular certificates of deposit as a result of 13-month
and 24-month specials offset by declines in interest bearing demand and savings
products.
Although
deposits increased during 2009, the decline in the interest rate environment
decreased deposit interest expense by $10.6 million when compared to
2008. The reduction in interest expense resulted in a slight
increase in net interest income on a tax equivalent basis of $1.4 million (3%)
in 2009 when compared to 2008.
The
overall net interest margin decreased during 2009 to 3.56% from 3.68% in 2008 on
a fully taxable equivalent basis.
Other Operating
Income/Other Operating Expense - Other operating
income decreased $24.4 million during the 12 months of 2009 when compared to the
same period of 2008. The decrease is primarily attributable to the recognition
of $26.7 million in other-than-temporary impairment charges, a $.3 million
realized loss on the investment portfolio, as a result of moving four securities
to trading, and a decrease of $2.0 million in service charge income due to
decreased consumer spending. Trust department revenue and income on our bank
owned life insurance policies also decreased due to declines in the market
values of assets under management and reduced interest rates,
respectively. These declines were offset slightly by a $.7 million
increase in insurance commissions as a result of the Insurance Group’s
acquisition of books of business in December 2008.
Trust
department income is directly affected by the performance of the equity and bond
markets and by the amount of assets under management. Although we
experienced favorable sales production in our trust department, unfavorable
market conditions have reduced the fees and commissions on our existing accounts
under management resulting in slightly lower income when compared to
2008. In 2008, declining market values negatively impacted the value
of assets under management and the resultant fees. This decline
in market values began to reverse in 2009. Assets under management
were $544 million, $472 million and $547 million at December 31, 2009, 2008 and
2007, respectively.
Securities
losses are the most variable component of other operating
income. During 2009, we recorded non-cash charges of approximately
$26.7 million as a result of an other-than-temporary impairment analysis
performed on our investment portfolio. This process is described more
fully in the Investment Securities section of the Consolidated Balance Sheet
Review.
Other
operating expenses increased $6.2 million for 2009 when compared to
2008. The increase was due to increases in personnel expenses,
occupancy and equipment expenses as we continued our expansion in Morgantown,
West Virginia, Frederick, Maryland and in the markets served by the Insurance
Group. In addition, expense for the Corporation’s defined benefit
pension plan increased $1.0 million in 2009 when compared to
2008. This increase is a result of the decline in market value of the
plan assets and the lower discount rate. We also recognized increases
in other expenses directly attributable to the FDIC assessments of $3.5 million
when compared to the same time period in 2008.
Dividends —
The Corporation continued its tradition of paying dividends to
shareholders during 2009, which totaled $0.80 per share. The
Corporation has paid quarterly cash dividends consistently since 1985, the year
in which it was formed. In December 2009, the Corporation reduced its
quarterly dividend to $.10 per common share effective for the dividend payable
on February 1, 2010.
As noted
above, the Corporation is generally prohibited from increasing this dividend
above $.20 per share without the prior consent of the Treasury until the earlier
of (i) January 30, 2012 or (ii) the date on which the Treasury no longer holds
any shares of the Series A Preferred Stock.
Looking Forward
— We will continue to
face risks and challenges in the future, including: changes in local economic
conditions in our core geographic markets; potential yield compression on loan
and deposit products from existing competitors and potential new entrants in our
markets; fluctuations in interest rates and changes to existing federal and
state legislation and regulations over banks and financial holding
companies. For a more complete discussion of these and other risk
factors, see Item 1A of Part I of this annual report.
[23]
Critical
Accounting Policies and Estimates
This
discussion and analysis of our financial condition and results of operations is
based upon our consolidated financial statements, which have been prepared in
accordance with accounting principles generally accepted in the United States of
America. The preparation of these financial statements requires
management to make estimates and judgments that affect the reported amounts of
assets, liabilities, revenues and expenses, and related disclosure of contingent
liabilities. (See Note 1 of the Notes to Consolidated Financial
Statements included in Item 8 of Part II of this annual report.) On an on-going
basis, management evaluates estimates, including those related to loan losses
and intangible assets. Management bases its estimates on historical
experience and on various other assumptions that are believed to be reasonable
under the circumstances, the results of which form the basis for making
judgments about the carrying values of assets and liabilities that are not
readily apparent from other sources. Actual results may differ from these
estimates under different assumptions or conditions. Management
believes the following critical accounting policies affect our more significant
judgments and estimates used in the preparation of the consolidated financial
statements.
Allowance
for Loan Losses
One of
our most important accounting policies is that related to the monitoring of the
loan portfolio. A variety of estimates impact the carrying value of
the loan portfolio, including the calculation of the allowance for loan losses,
the valuation of underlying collateral, the timing of loan charge-offs and the
placement of loans on non-accrual status. The allowance is established and
maintained at a level that management believes is adequate to cover losses
resulting from the inability of borrowers to make required payment on loans.
Estimates for loan losses are arrived at by analyzing risks associated with
specific loans and the loan portfolio, current and historical trends in
delinquencies and charge-offs, and changes in the size and composition of the
loan portfolio. The analysis also requires consideration of the economic climate
and direction, changes in lending rates, political conditions, legislation
impacting the banking industry and economic conditions specific to Western
Maryland and Northeastern West Virginia. Because the calculation of
the allowance for loan losses relies on management’s estimates and judgments
relating to inherently uncertain events, actual results may differ from
management’s estimates.
The
allowance for loan losses is also discussed below in Item 7 under the caption
“Allowance for Loan Losses” and in Note 5 to Consolidated Financial Statements
contained in Item 8 of Part II of this annual report.
Goodwill
and Other Intangible Assets
ASC Topic
350, Intangibles - Goodwill
and Other, establishes standards for the amortization of acquired
intangible assets and the non-amortization and impairment assessment of
goodwill. We have $.5 million of core deposit intangible assets and
$2.9 million related to acquisitions of insurance “books of business” which are
subject to amortization. The $11.9 million in recorded goodwill is primarily
related to the acquisition of Huntington National Bank branches that occurred in
2003, which is not subject to periodic amortization.
Goodwill
arising from business combinations represents the value attributable to
unidentifiable intangible elements in the business acquired. Our goodwill
relates to value inherent in the banking business and the value is dependent
upon our ability to provide quality, cost effective services in a highly
competitive local market. This ability relies upon continuing
investments in processing systems, the development of value-added service
features and the ease of use of our services. As such, goodwill value
is supported ultimately by revenue that is driven by the volume of business
transacted. A decline in earnings as a result of a lack of growth or
the inability to deliver cost effective services over sustained periods can lead
to impairment of goodwill, which could adversely impact earnings in future
periods. ASC Topic 350 requires an annual evaluation of goodwill for
impairment. The determination of whether or not these assets are
impaired involves significant judgments. Management has completed its
annual evaluation for impairment and concluded that the recorded value of
goodwill was not impaired. However, future changes in strategy and/or
market conditions could significantly impact these judgments and require
adjustments to recorded asset balances.
Other-Than-Temporary
Impairment of Investment Securities
Securities
available-for-sale: Securities available-for-sale are stated
at fair value, with the unrealized gains and losses, net of tax, reported in the
accumulated other comprehensive income/(loss) component in shareholders’
equity.
The amortized cost of debt securities
classified as available-for-sale is adjusted for amortization of premiums to the
first call date, if applicable, or to maturity, and for accretion of discounts
to maturity, or in the case of mortgage-backed securities, over the estimated
life of the security. Such amortization and accretion, plus interest
and dividends, are included in interest income from
investments. Gains and losses on the sale of securities are recorded
using the specific identification method.
[24]
Management systematically evaluates
securities for impairment on a quarterly basis. Based upon
application of new accounting guidance for subsequent measurement in Topic 320
(ASC Section 320-10-35), which the Corporation early adopted effective March 31,
2009 according to the effective date provisions of ASC Paragraph 320-10-65-1,
management assesses whether (a) it has the intent to sell a security being
evaluated and (b) it is more likely than not that the Corporation will be
required to sell the security prior to its anticipated recovery. If
neither applies, then declines in the fair values of securities below their cost
that are considered other-than-temporary declines are split into two
components. The first is the loss attributable to declining credit
quality. Credit losses are recognized in earnings as realized losses
in the period in which the impairment determination is made. The
second component consists of all other losses, which are recognized in other
comprehensive loss. In estimating other-than-temporary impairment
losses, management considers (1) the length of time and the extent to which the
fair value has been less than cost, (2) adverse conditions specifically related
to the security, an industry, or a geographic area, (3) the historic and implied
volatility of the fair value of the security, (4) changes in the rating of the
security by a rating agency, (5) recoveries or additional declines in fair value
subsequent to the balance sheet date, (6) failure of the issuer of the security
to make scheduled interest or principal payments, and (7) the payment structure
of the debt security and the likelihood of the issuer being able to make
payments that increase in the future. Management also monitors cash
flow projections for securities that are considered beneficial interests under
the guidance of ASC Subtopic 325-40, Investments – Other – Beneficial
Interests in Securitized Financial Assets, (ASC Section 325-40-35). This process
is described more fully in the Investment Securities section of the Consolidated
Balance Sheet Review.
Fair
Value of Investments
Our entire investment portfolio is
classified as available-for-sale and is therefore carried at fair
value. We have determined the fair value of our investment securities
in accordance with the requirements of ASC Topic 820, Fair Value Measurements and
Disclosures, which defines fair value, establishes a framework for
measuring fair value and expands disclosures about fair value measurements
required under other accounting pronouncements. The Corporation
measures the fair market values of its investments based on the fair value
hierarchy established in Topic 820. The determination of fair value
of investments and other assets is discussed further in Note 18 to the
Consolidated Financial Statements contained in Item 8 of Part II of this annual
report.
Pension
Plan Assumptions
Our pension plan costs are calculated
using actuarial concepts, as discussed within the requirements of ASC Topic 715,
Compensation – Retirement
Benefits. Pension expense and the determination of our
projected pension liability are based upon two critical assumptions: the
discount rate and the expected return on plan assets. We evaluate
each of these critical assumptions annually. Other assumptions impact
the determination of pension expense and the projected liability including the
primary employee demographics, such as retirement patterns, employee turnover,
mortality rates, and estimated employer compensation increases. These
factors, along with the critical assumptions, are carefully reviewed by
management each year in consultation with our pension plan consultants and
actuaries. Further information about our pension plan assumptions,
the plan’s funded status, and other plan information is included in Note 13 to
the Consolidated Financial Statements, which is included in Item 8 of Part II of
this annual report.
Recent
Accounting Pronouncements and Developments
Note 1 to the Consolidated Financial
Statements included in Item 8, Part II of this annual report discusses new
accounting pronouncements that when adopted, may have an effect on our
consolidated financial statements.
CONSOLIDATED
STATEMENT OF INCOME REVIEW
Net
Interest Income
Net
interest income is our largest source of operating revenue. Net
interest income is the difference between the interest earned on
interest-earning assets and the interest expense incurred on interest-bearing
liabilities. For analytical and discussion purposes, net interest
income is adjusted to a fully taxable equivalent (FTE) basis to facilitate
performance comparisons between taxable and tax-exempt assets by increasing
tax-exempt income by an amount equal to the federal income taxes that would have
been paid if this income were taxable at the statutorily applicable
rate. The table below summarizes net interest income (on a fully
taxable equivalent basis) for the years 2007-2009 (dollars in
thousands).
[25]
|
2009
|
2008
|
2007
|
||||||||||
|
Interest
income
|
$ | 87,478 | $ | 97,062 | $ | 95,286 | ||||||
|
Interest
expense
|
32,104 | 43,043 | 49,331 | |||||||||
|
Net
interest income
|
$ | 55,374 | $ | 54,019 | $ | 45,955 | ||||||
|
Net
interest margin %
|
3.56 | % | 3.68 | % | 3.51 | % | ||||||
Net
interest income on an FTE basis increased $1.4 million during 2009 over the same
period in 2008 due to a $10.9 million decrease in interest expense, offset by a
$9.6 million decrease in interest income. The decrease in interest
income resulted primarily from a decrease in interest rates on loans, an
increase in non-accrual assets and our desire to maintain higher cash levels
when compared to 2008. A reversal of approximately $28,000 is
reflected in the “Other interest earning assets” line item for December 31, 2009
due to the accrual of stock dividends issued by the Federal Home Loan Bank
(“FHLB”) of Atlanta at a rate of 0.80% for the fourth quarter of
2008. The Corporation was notified during the first quarter of 2009
that the FHLB of Atlanta would not pay a dividend for the fourth quarter
2008. The decreases in interest rates throughout 2008 and the
increase in non-accrual assets during 2009 contributed to the decrease in the
average rate on our average earning assets of 99 basis points, from 6.62% at
December 31, 2008 to 5.63% for December 31, 2009 (on a fully tax equivalent
basis).
Interest
expense decreased during 2009 when compared to the same period of 2008 due
primarily to the significantly low level of interest rates on our interest
bearing liabilities. Average interest-bearing liabilities increased during 2009
by $82.4 million when compared to 2008, with interest-bearing deposits
increasing by approximately $73.1 million. The effect of the
decreasing rate environment throughout 2008 and continuing into 2009, our
decision to only increase special rates for full relationship customers and the
short duration of our portfolio resulted in a 92 basis point decrease in the
average rate paid on our average interest-bearing liabilities from 3.11% for the
12 months ended December 31, 2008 to 2.19% for the same period of
2009.
The net
result of the aforementioned factors was a 12 basis point decrease in the net
interest margin during the 12 months of 2009 to 3.56% from 3.68% for the same
time period of 2008.
Comparing
2008 to 2007, net interest income increased $8.1 million (18%) in 2008 over the
same period in 2007, due to a $1.8 million (1.9%) increase in interest income
coupled with a $6.3 million (12.7%) decrease in interest expense. The
increase in interest income resulted from an increase in average
interest-earning assets of $158.9 million (12%) during 2008 when compared to
2007. The increased level of interest earning assets is attributable
to the growth that we experienced in our loan and investment portfolios during
2008. The declines in the interest rates throughout 2008 contributed
to the decrease in the average yield on our average earning assets of 67 basis
points, from 7.29% in 2007 to 6.62% in 2008 (on a fully tax equivalent
basis). The average yield on loans decreased by 81 basis points and
the yield on investment securities as a percentage of interest earning assets
was stable in 2008. Although we experienced an increase in average
interest-bearing liabilities of $212.9 million in 2008, interest expense
decreased $6.3 million due to the decline in interest rates and the enhanced
efforts of the internal treasury committee. Average deposits
increased in 2008 by approximately $146.7 million. Effective
management of both retail and wholesale interest rates resulted in a 110 basis
point decrease in the average rate paid on our average interest-bearing
liabilities from 4.21% for 2007 to 3.11% for 2008. The net
result of the aforementioned factors was a 17 basis point increase in the net
interest margin at December 31, 2008 to 3.68% from 3.51% at December 31,
2007.
As shown
below, the composition of total interest income between 2008 and 2009 shifted
towards interest and fees on loans. This was the result of
accumulating cash from calls on securities in the investment portfolio in order
to enhance our liquidity position. The composition of total interest
income between 2007 and 2008 shows a slight increase in interest on investments
and a corresponding decline in interest and fees on loans. This shift
is attributable to the leverage strategies implemented throughout 2007 and
2008. Leverage strategies are the purchase of investment securities
funded by borrowings of matched terms and durations. The difference
between the rate earned and the rate paid has resulted in additional
earnings. Management has more control over the rates, duration and
structure of the investment portfolio as compared to the loan portfolio which is
customized to the individual needs of each borrower. As such, the
investment portfolio is used as a supplement to our asset liability management
process.
[26]
|
%
of Total Interest Income
|
||||||||||||
|
2009
|
2008
|
2007
|
||||||||||
|
Interest
and fees on loans
|
80 | % | 78 | % | 82 | % | ||||||
|
Interest
on investment securities
|
20 | % | 22 | % | 18 | % | ||||||
Table 1
sets forth the average balances, net interest income and expense and average
yields and rates for our interest-earning assets and interest-bearing
liabilities for 2009, 2008 and 2007. Table 2 sets forth an analysis
of volume and rate changes in interest income and interest expense of our
average interest-earning assets and average interest-bearing liabilities for
2009, 2008 and 2007. Table 2 distinguishes between the changes
related to average outstanding balances (changes in volume created by holding
the interest rate constant) and the changes related to average interest rates
(changes in interest income or expense attributed to average rates created by
holding the outstanding balance constant).
Distribution
of Assets, Liabilities and Shareholders’ Equity
Interest
Rates and Interest Differential – Tax Equivalent Basis
(Dollars
in thousands)
Table
1
|
For
the Years Ended December 31
|
||||||||||||||||||||||||||||||||||||
|
2009
|
2008
|
2007
|
||||||||||||||||||||||||||||||||||
|
AVERAGE
BALANCE
|
INTEREST
|
AVERAGE
YIELD/RATE
|
AVERAGE
BALANCE
|
INTEREST
|
AVERAGE
YIELD/RATE
|
AVERAGE
BALANCE
|
INTEREST
|
AVERAGE
YIELD/RATE
|
||||||||||||||||||||||||||||
|
Assets
|
||||||||||||||||||||||||||||||||||||
|
Loans
|
$ | 1,132,569 | $ | 68,271 | 6.03 | % | $ | 1,081,191 | $ | 74,415 | 6.88 | % | $ | 1,003,854 | $ | 77,158 | 7.69 | % | ||||||||||||||||||
|
Investment
Securities:
|
||||||||||||||||||||||||||||||||||||
|
Taxable
|
224,647 | 13,106 | 5.83 | 285,382 | 16,848 | 5.90 | 215,756 | 12,474 | 5.78 | |||||||||||||||||||||||||||
|
Non
taxable
|
98,960 | 5,962 | 6.02 | 82,844 | 5,229 | 6.31 | 73,467 | 4,847 | 6.60 | |||||||||||||||||||||||||||
|
Total
|
323,607 | 19,068 | 5.89 | 368,226 | 22,077 | 6.00 | 289,223 | 17,321 | 5.99 | |||||||||||||||||||||||||||
|
Federal
funds sold
|
48,979 | 96 | .20 | 368 | 4 | 1.09 | 285 | 11 | 3.86 | |||||||||||||||||||||||||||
|
Interest-bearing
deposits with
other banks
|
34,389 | 28 | .08 | 3,691 | 77 | 2.09 | 5,135 | 241 | 4.69 | |||||||||||||||||||||||||||
|
Other
interest earning assets
|
13,819 | 15 | .11 | 13,235 | 489 | 3.69 | 9,363 | 555 | 5.93 | |||||||||||||||||||||||||||
|
Total
earning assets
|
1,553,363 | 87,478 | 5.63 | % | 1,466,711 | 97,062 | 6.62 | % | 1,307,860 | 95,286 | 7.29 | % | ||||||||||||||||||||||||
|
Allowance
for loan losses
|
(14,960 | ) | (9,002 | ) | (6,584 | ) | ||||||||||||||||||||||||||||||
|
Non-earning
assets
|
157,741 | 142,076 | 118,780 | |||||||||||||||||||||||||||||||||
|
Total
Assets
|
$ | 1,696,144 | $ | 1,599,785 | $ | 1,420,056 | ||||||||||||||||||||||||||||||
|
Liabilities
and Shareholders’
Equity
|
||||||||||||||||||||||||||||||||||||
|
Interest-bearing
demand
deposits
|
$ | 391,299 | $ | 2,997 | .77 | % | $ | 414,750 | $ | 6,906 | 1.67 | % | $ | 333,443 | $ | 9,752 | 2.92 | % | ||||||||||||||||||
|
Savings
deposits
|
76,703 | 498 | .65 | 80,812 | 1,035 | 1.28 | 42,123 | 1,445 | 3.43 | |||||||||||||||||||||||||||
|
Time
deposits:
|
||||||||||||||||||||||||||||||||||||
|
Less
than $100
|
323,409 | 9,241 | 2.86 | 239,211 | 10,220 | 4.27 | 234,439 | 10,429 | 4.45 | |||||||||||||||||||||||||||
|
$100
or more
|
355,589 | 7,480 | 2.10 | 339,110 | 12,621 | 3.72 | 317,219 | 16,132 | 5.09 | |||||||||||||||||||||||||||
|
Short-term
borrowings
|
44,473 | 318 | .72 | 55,243 | 1,022 | 1.85 | 70,474 | 2,903 | 4.12 | |||||||||||||||||||||||||||
|
Long-term
borrowings
|
274,718 | 11,570 | 4.21 | 254,680 | 11,239 | 4.41 | 173,208 | 8,670 | 5.01 | |||||||||||||||||||||||||||
|
Total
interest-bearing liabilities
|
1,466,191 | 32,104 | 2.19 | % | 1,383,806 | 43,043 | 3.11 | % | 1,170,906 | 49,331 | 4.21 | % | ||||||||||||||||||||||||
|
Non-interest-bearing
Deposits
|
110,883 | 106,124 | 133,509 | |||||||||||||||||||||||||||||||||
|
Other
liabilities
|
16,240 | 14,595 | 14,885 | |||||||||||||||||||||||||||||||||
|
Shareholders’
Equity
|
102,830 | 95,260 | 100,756 | |||||||||||||||||||||||||||||||||
|
Total
Liabilities and Shareholders’
Equity
|
$ | 1,696,144 | $ | 1,599,785 | $ | 1,420,056 | ||||||||||||||||||||||||||||||
|
Net
interest income and Spread
|
$ | 55,374 | 3.44 | % | $ | 54,019 | 3.51 | % | $ | 45,955 | 3.08 | % | ||||||||||||||||||||||||
|
Net
interest margin
|
3.56 | % | 3.68 | % | 3.51 | % | ||||||||||||||||||||||||||||||
—The
above table reflects the average rates earned or paid stated on a tax equivalent
basis assuming a tax rate of 35% for 2009, 2008 and 2007. The fully
taxable equivalent adjustments for the years ended December 31, 2009, 2008, and
2007 were $1,613, $1,846, and $1,721, respectively.
—The
average balances of non-accrual loans for the years ended December 31, 2009,
2008 and 2007, which were reported in the average loan balances for these years,
were $39,851, $23,517, and $4,167, respectively.
[27]
—Net
interest margin is calculated as net interest income divided by average earning
assets.
—The
average yields on investments are based on amortized cost.
Interest
Variance Analysis (1)
(In
thousands and tax equivalent basis)
Table
2
|
2009 Compared to 2008
|
2008 Compared to 2007
|
|||||||||||||||||||||||
|
Volume
|
Rate
|
Net
|
Volume
|
Rate
|
Net
|
|||||||||||||||||||
|
INTEREST
INCOME:
|
||||||||||||||||||||||||
|
Loans
|
$ | 3,097 | $ | (9,241 | ) | $ | (6,144 | ) | $ | 5,323 | $ | (8,066 | ) | $ | (2,743 | ) | ||||||||
|
Taxable
Investments
|
(3,543 | ) | (199 | ) | (3,742 | ) | 4,111 | 264 | 4,375 | |||||||||||||||
|
Non-taxable
Investments
|
971 | (238 | ) | 733 | 592 | (210 | ) | 382 | ||||||||||||||||
|
Federal
funds sold
|
95 | (3 | ) | 92 | 1 | (8 | ) | (7 | ) | |||||||||||||||
|
Other
interest earning assets
|
59 | (582 | ) | (523 | ) | 140 | (370 | ) | (230 | ) | ||||||||||||||
|
Total
interest income
|
679 | (10,263 | ) | (9,584 | ) | 10,167 | (8,390 | ) | 1,777 | |||||||||||||||
|
INTEREST
EXPENSE:
|
||||||||||||||||||||||||
|
Interest-bearing
demand deposits
|
(180 | ) | (3,729 | ) | (3,909 | ) | 1,354 | (4,200 | ) | (2,846 | ) | |||||||||||||
|
Savings
deposits
|
(27 | ) | (510 | ) | (537 | ) | 495 | (905 | ) | (410 | ) | |||||||||||||
|
Time
deposits less than $100
|
2,406 | (3,385 | ) | (979 | ) | 204 | (413 | ) | (209 | ) | ||||||||||||||
|
Time
deposits $100 or more
|
347 | (5,488 | ) | (5,141 | ) | 815 | (4,326 | ) | (3,511 | ) | ||||||||||||||
|
Short-term
borrowings
|
(77 | ) | (627 | ) | (704 | ) | (282 | ) | (1,598 | ) | (1,880 | ) | ||||||||||||
|
Long-term
borrowings
|
844 | (513 | ) | 331 | 3,595 | (1,026 | ) | 2,569 | ||||||||||||||||
|
Total
interest expense
|
3,313 | (14,252 | ) | (10,939 | ) | 6,181 | (12,468 | ) | (6,287 | ) | ||||||||||||||
|
Net
interest income
|
$ | (2,634 | ) | $ | 3,989 | $ | 1,355 | $ | 3,986 | $ | 4,078 | $ | 8,064 | |||||||||||
Note:
|
(1)
|
The
change in interest income/expense due to both volume and rate has been
allocated to volume and rate changes in proportion to the relationship of
the absolute dollar amounts of the change in
each.
|
Provision
for Loan Losses
The
provision for loan losses was $15.6 million for the year ended December 31,
2009, compared to $12.9 million for the same period of 2008. The
increase in the provision for loan losses for 2009 when compared to 2008 was in
response to the increase in net charge-offs and non-performing loans, the
results of our quarterly reviews of the adequacy of the qualitative factors
affecting the allowance, and specific allocations for impaired
loans. As part of our loan review process, management noted an
increase in foreclosures and bankruptcies in the geographic areas where we
operate. Additionally, the current economic environment has caused a
decline in real estate sales. Consequently, we have closely reviewed
and applied sensitivity analysis to collateral values to more adequately measure
potential future losses. Where necessary, we have obtained new
appraisals on collateral. Specific allocations of the allowance have
been provided in these instances where losses may occur.
The provision for loan losses was $12.9
million for 2008, compared to $2.3 million for 2007. The increase in
the provision in 2008 was due to increased net charge offs, an increase in the
level of non-accrual loans, loan growth during 2008, specific allocations for
impaired loans and changes in the qualitative factors used in the overall
assessment of the adequacy of the allowance for loan losses. We have
closely reviewed and applied sensitivity analysis to the collateral values
related to our loan portfolio to adequately measure potential future
losses. Specific allocations have been provided in instances where
loans have been considered impaired and collateral analysis indicates that
losses may occur.
Other
Operating Income
The
following table shows the major components of other operating income for the
past three years, exclusive of securities losses (dollars in thousands) and the
percentage changes during these years:
[28]
|
2009 VS. 2008
|
2008 VS. 2007
|
|||||||||||||||||||
|
2009
|
2008
|
2007
|
% CHANGE
|
% CHANGE
|
||||||||||||||||
|
Service
charges on deposit accounts
|
$ | 4,992 | $ | 5,835 | $ | 4,955 | -14.4 | % | 17.8 | % | ||||||||||
|
Other
service charge income
|
466 | 424 | 883 | 9.9 | % | -52.0 | % | |||||||||||||
|
Debit
Card income
|
1,404 | 1,215 | 1,111 | 15.6 | % | 9.4 | % | |||||||||||||
|
Trust
department income
|
3,665 | 3,912 | 4,076 | -6.3 | % | -4.0 | % | |||||||||||||
|
Insurance
commissions
|
2,888 | 2,143 | 2,529 | 34.8 | % | -15.3 | % | |||||||||||||
|
Bank
owned life insurance (BOLI)
|
559 | 704 | 1,114 | -20.6 | % | -36.8 | % | |||||||||||||
|
Brokerage
commissions
|
593 | 745 | 734 | -20.4 | % | 1.5 | % | |||||||||||||
|
Other
income
|
1,761 | 788 | 1,295 | 123.5 | % | -39.2 | % | |||||||||||||
|
Total
other operating income
|
$ | 16,328 | $ | 15,766 | $ | 16,697 | 3.6 | % | -5.6 | % | ||||||||||
|
Securities
losses
|
$ | (27,005 | ) | $ | (1,997 | ) | $ | (1,605 | ) | 1,252.3 | % | -24.4 | % | |||||||
As the table above illustrates, other
operating income increased by $.6 million in 2009 when compared to 2008,
exclusive of the securities losses. This compares to a $.9 million
(5.6%) decrease in 2008 over 2007.
Service charges on deposit accounts
decreased in 2009 when compared to 2008 and increased in 2008 when compared to
2007. The decrease in 2009 was primarily attributable to a decline in
overdraft fee income which was a result of decreased consumer
spending. Service charge related income constituted 33%, 40%, and 35%
of other operating income in 2009, 2008, and 2007, respectively.
Trust department income is directly
affected by the performance of the equity and bond markets and by the amount of
assets under management. Although we have experienced favorable sales
production in our trust division, unfavorable market conditions have reduced the
fees and commissions on our existing accounts under management resulting in
slightly lower income when compared to 2008. Declining market values
negatively impacted the value of assets under management for
2008. Assets under management were $544 million, $472 million and
$547 million for years 2009, 2008 and 2007, respectively.
Insurance commissions increased in 2009
when compared to 2008 due to the acquisition of a book of business in December
2008. Insurance commissions decreased from 2007 to 2008 due to a soft
insurance market resulting in lower premium income and a reduction in the amount
of contingency income received in 2008. Contingency income is
received from the insurance carriers based upon claims histories and varies from
year to year.
Securities (losses)/gains are the most
variable component of other operating income. During 2009 and 2008,
we recorded non-cash charges of approximately $26.7 million and $2.7 million,
respectively, as a result of an other-than-temporary impairment analysis
performed on our investment portfolio throughout each year. This
process is described more fully in the Investment Securities section of the
Consolidated Balance Sheet Review. This charge was offset by gains
realized from sales of investment securities and calls on fixed-income
bonds.
During 2007, we recorded a
non-recurring pre-tax charge of approximately $1.6 million ($1.0 million or $.18
per share, net of tax) associated with the transfer of certain investment
securities from the available-for-sale category to the trading category during
the first quarter of 2007 and the subsequent sale of those securities during the
second quarter. This sale of securities was part of our overall
restructuring of the investment portfolio designed to improve overall earnings
from the portfolio.
We experienced an increase in other
income during 2009 primarily due to a $0.9 million gain realized as a result of
the exercise of eminent domain rights by a governmental entity relating to one
of our retail branch sites. This increase was offset by reduced bank owned life
insurance earnings. This decline is attributable to the overall
decrease in the interest rate environment throughout 2009 and the movement of
our separate account policy to a money market fund in order to protect
principal. In December 2009, management surrendered this
policy. A new BOLI purchase was made in November 2009 which is
projected to increase the overall return on this portfolio in
2010. We also recognized a decline in secondary market
fees.
[29]
Other
Operating Expense
Other operating expense for 2009
increased $6.2 million (15.3%) when compared to 2008, compared to an increase in
2008 of $2.1 million (5.5%) over 2007. The following table shows the
major components of other operating expense for the past three years (in
thousands) and the percentage changes during these years:
|
2009 VS. 2008
|
2008 VS. 2007
|
|||||||||||||||||||
|
2009
|
2008
|
2007
|
% CHANGE
|
% CHANGE
|
||||||||||||||||
|
Salaries
and employee benefits
|
$ | 22,917 | $ | 21,531 | $ | 20,628 | 6.4 | % | 4.4 | % | ||||||||||
|
Other
expenses
|
11,168 | 10,785 | 10,340 | 3.6 | % | 4.3 | % | |||||||||||||
|
FDIC
Premiums
|
3,966 | 479 | 223 | 728.0 | % | 114.8 | % | |||||||||||||
|
Equipment
|
3,409 | 3,364 | 3,224 | 1.3 | % | 4.3 | % | |||||||||||||
|
Occupancy
|
2,822 | 2,693 | 2,388 | 4.8 | % | 12.8 | % | |||||||||||||
|
Data
processing
|
2,511 | 1,721 | 1,672 | 4.6 | % | 2.9 | % | |||||||||||||
|
Total
other operating expense
|
$ | 46,793 | $ | 40,573 | $ | 38,475 | 15.3 | % | 5.5 | % | ||||||||||
Other operating expenses
increased $6.2 million (15%) for the 12 months of 2009 when compared to the 12
months of 2008. The increase was due to an increase in salaries and
wages by $1.4 million in 2009 over 2008 due primarily to our continued expansion
in Morgantown, West Virginia, Frederick, Maryland and in the markets served by
the Insurance Group. An increase of $.9 million from 2007 to 2008
was primarily attributable to normal merit increases and new hires to
support on-going operations and production. Salaries and
employee benefits represent approximately 49% of total other operating expenses
in 2009, compared to 53% in 2008 and 54% in 2007. In addition, expense for the
Corporation’s defined benefit pension plan increased $1.0 million in the 12
months of 2009 when compared to the same period of 2008. This
increase is a result of the decline in market value of the plan assets and the
lower discount rate.
In
response to the current banking environment, the FDIC substantially increased
deposit premiums for all insured banks in 2009. This resulted in a
$3.5 million increase in our premium expense when compared to
2008. These premiums increased slightly from 2007 to 2008 as the
credits related to the assessment were applied during 2007 and
2008.
Occupancy and equipment expenses
increased by $.2 million from 2008 to 2009 and $.4 million from 2007 to
2008. These increases relate to the growth and expansion of the
Bank’s retail network and the opening of our operations center during
2007.
Other
expenses increased slightly by $.4 million in 2008 when compared to 2007 due to
increases in marketing, membership fees and licenses and miscellaneous
conversion costs as a result of our core processor conversion completed in
April.
Applicable
Income Taxes
Due to the net loss incurred in 2009,
we recognized a net tax benefit of $8.5 million, compared to $3.6 million and
$5.7 million of income tax expense in 2008 and 2007 (29% and 31% effective tax
rates), respectively. The net tax benefit generated in 2009 resulted
primarily from the non cash other-than-temporary impairment charges on our
investment portfolio of $26.7 million and the increased loan loss
provision. The effective tax rates in 2008 and 2007 are slightly less
than the statutory rate due to the level of tax exempt income. See
Note 12 to the Consolidated Financial Statements, “Income Taxes” for detailed
analysis of the Corporation’s deferred tax assets and liabilities. A
valuation allowance has been provided for the state tax loss carry forwards
included in deferred tax assets which will expire commencing in
2019.
We have
concluded that no valuation allowance is deemed necessary for our remaining
federal and state net deferred tax assets at December 31, 2009 as it is more
likely than not that they will be realized based on the following:
|
|
·
|
the
expected reversal of all but $1.1 million of the total $5.1 million of
deferred tax liabilities at December 31, 2009 in such a manner to
substantially utilize the dollar for dollar impact against the deferred
tax assets at December 31, 2009;
|
|
|
·
|
the
available carry-back available to our 2008 tax return to obtain a tax
refund of tax paid in that year, if needed, based on 2010 deferred tax
reversals; and
|
|
|
·
|
for
the remaining excess deferred tax assets that will not be utilized by the
reversal of deferred tax liabilities, our expected future income will be
sufficient to utilize the deferred tax assets as they reverse or before
any net operating loss, if created, would
expire.
|
[30]
We will
need to generate taxable income in future years of approximately $40 million to
fully utilize the net deferred tax assets in the years in which they are
expected to reverse. Management estimates that we can fully utilized
the deferred tax assets in approximately four to five years based on the
historical pre-tax income and forecasts of estimated future pre-tax income as
adjusted for permanent book to tax differences.
CONSOLIDATED
BALANCE SHEET REVIEW
Overview
Our total assets reached $1.74 billion
at December 31, 2009, representing an increase of $104.6 million (6.4%) from
year-end 2008.
The total interest-earning asset mix at
December 31, 2009 shows a slight decline in the percentage of loans and
investments as a percentage of total assets from 2008 to 2009 as we increased
our cash and cash equivalents for liquidity purposes. The mix was comparable
from 2007 to 2008. The mix for each year is illustrated
below:
|
Year End Percentage of Total Assets
|
||||||||||||
|
2009
|
2008
|
2007
|
||||||||||
|
Net
loans
|
63 | % | 68 | % | 70 | % | ||||||
|
Investments
|
16 | % | 22 | % | 21 | % | ||||||
|
Cash
and cash equivalents
|
11 | % | 1 | % | 2 | % | ||||||
The year-end total liability mix has
remained consistent during the three-year period as illustrated
below.
|
Year End Percentage of Total Liabilities
|
||||||||||||
|
2009
|
2008
|
2007
|
||||||||||
|
Total
deposits
|
79 | % | 78 | % | 82 | % | ||||||
|
Total
borrowings
|
19 | % | 21 | % | 17 | % | ||||||
Loan
Portfolio
Through the Bank and the OakFirst Loan
Centers, we are actively engaged in originating loans to customers primarily in
Allegany County, Frederick County, Garrett County, and Washington County in
Maryland, and in Berkeley County, Hardy County, Mineral County, and Monongalia
County in West Virginia; and the surrounding regions of West Virginia and
Pennsylvania. We have policies and procedures designed to mitigate
credit risk and to maintain the quality of our loan portfolio. These
policies include underwriting standards for new credits as well as continuous
monitoring and reporting policies for asset quality and the adequacy of the
allowance for loan losses. These policies, coupled with ongoing
training efforts, have provided effective checks and balances for the risk
associated with the lending process. Lending authority is based on
the type of the loan, and the experience of the lending officer.
Commercial loans are collateralized
primarily by real estate and, to a lesser extent, equipment and vehicles.
Unsecured commercial loans represent an insignificant portion of total
commercial loans. Residential mortgage loans are collateralized by
the related property. Any residential mortgage loan exceeding a
specified internal loan-to-value ratio requires private mortgage
insurance. Installment loans are typically collateralized, with
loan-to-value ratios which are established based on the financial condition of
the borrower. We will also make unsecured consumer loans to qualified
borrowers meeting our underwriting standards. Additional information
about our loans and underwriting policies can be found in Item 1 of Part I of
this annual report under the caption “Banking Products and
Services”.
Table 3 sets forth the composition of
our loan portfolio. Historically, our policy has been to make the
majority of our loan commitments in our market areas. We had no
foreign loans in our portfolio as of December 31 for any of the periods
presented.
[31]
Summary
of Loan Portfolio
(Dollars
in thousands)
Table 3
|
Loans Outstanding as of December 31
|
||||||||||||||||||||
|
2009
|
2008
|
2007
|
2006
|
2005
|
||||||||||||||||
|
Commercial
|
$ | 604,410 | $ | 575,962 | $ | 492,302 | $ | 408,361 | $ | 404,681 | ||||||||||
|
Real
Estate – Mortgage
|
398,413 | 403,768 | 384,420 | 359,601 | 337,559 | |||||||||||||||
|
Consumer
Installment
|
110,937 | 140,234 | 153,593 | 181,574 | 193,275 | |||||||||||||||
|
Real
Estate – Construction
|
8,124 | 14,582 | 12,951 | 14,120 | 25,446 | |||||||||||||||
|
Total
Loans
|
$ | 1,121,884 | $ | 1,134,546 | $ | 1,043,266 | $ | 963,656 | $ | 960,961 | ||||||||||
Comparing
loans at December 31, 2009 to loans at December 31, 2008, our loan portfolio has
decreased by $12.7 million (1%). Continued growth in commercial loans
($28.4 million) was offset by a decline in our residential mortgage and
construction portfolio ($11.8 million) and a decline in our installment
portfolio ($29.3 million). The decrease in installment loans is primarily
attributable to a decline in the indirect loan portfolio resulting from a
slowdown in economic activity and management’s de-emphasis of this form of
lending product. Indirect auto loans comprise the largest percentage of
installment loans, 75% at December 31, 2009, 74% at December 31, 2008 and 85% at
December 31, 2007.
The
decrease in the residential mortgage portfolio is attributable to the increased
amount of loan refinancings that have occurred in the current low interest rate
environment during the past 12 months as consumers seek long-term fixed rate
loans. We used secondary market outlets to satisfy these loan
requests. The decrease in construction loans is due to the current
recession which has had a material and adverse effect on economic growth and the
housing market.
The
growth in the commercial portfolio is a result of continuous growth in our new
market areas and funding of previous loan commitments. At December
31, 2009, approximately 72% of the commercial loan portfolio was collateralized
by real estate, compared to 74% at December 31, 2008 and 81% at December 31,
2007. At
December 31, 2009, adjustable interest rate loans maturing within one to five
years were 62% of total loans, compared to 60% at December 31,
2008.
Fixed–interest rate loans made up 38%
of the total loan portfolio at December 31, 2009 and 2008, compared to 42% of
total loans at December 31, 2007.
During
2008, gross loans increased by $91 million, or 8.8%, over 2007. This
growth was focused in our commercial ($84 million) and residential mortgage
($21 million) loan portfolios, offset by a decline in installment ($13 million)
and remains consistent with management’s objectives over the past several
years. Continued efforts were made to increase the percentage of
loans in the portfolio with adjustable interest rates. At December
31, 2008, adjustable interest rate loans maturing within one to five years were
60% of total loans, compared to 55% at December 31, 2007.
Commercial loans increased 17% in 2008,
following a 20.6% increase in 2007. The growth in the commercial
portfolio is a result of both in-house production and participations with other
institutions. Residential mortgage loans increased by $21
million, or 5%, in 2008 when compared to 2007. The growth in
the residential portfolio consists of both adjustable and fixed rate
products.
Consumer installment loans decreased by
$13 million in 2008, or 8.7%, when compared to 2007. This decrease
reflects management’s continued shift toward more commercial loans with less
emphasis on the highly competitive consumer loan market and indirect car dealer
loans.
[32]
The
following table sets forth the remaining maturities, based upon contractual
dates, for selected loan categories as of December 31, 2009 (in
thousands):
Maturities
of Loan Portfolio at December 31, 2009
Table 4
|
Maturing
Within
One Year
|
After One
But Within
Five Years
|
Maturing
After Five
Years
|
Total
|
|||||||||||||
|
Commercial
|
$ | 244,382 | $ | 233,923 | $ | 126,105 | $ | 604,410 | ||||||||
|
Real
Estate – Mortgage
|
133,611 | 114,267 | 150,535 | 398,413 | ||||||||||||
|
Installment
|
35,673 | 72,890 | 2,374 | 110,937 | ||||||||||||
|
Real
Estate – Construction
|
— | 8,124 | — | 8,124 | ||||||||||||
|
Total
Loans
|
$ | 413,666 | $ | 429,204 | $ | 279,014 | $ | 1,121,884 | ||||||||
|
Classified
by Sensitivity to Change in Interest Rates
|
||||||||||||||||
|
Fixed-Interest
Rate Loans
|
$ | 125,653 | $ | 184,328 | $ | 270,087 | $ | 580,068 | ||||||||
|
Adjustable-Interest
Rate Loans
|
288,013 | 244,876 | 8,927 | 541,816 | ||||||||||||
|
Total
Loans
|
$ | 413,666 | $ | 429,204 | $ | 279,014 | $ | 1,121,884 | ||||||||
Our policy is to place loans on
non-accrual status, except for consumer loans, whenever there is substantial
doubt about the ability of a borrower to pay principal or interest on the
outstanding credit. Management considers such factors as payment
history, the nature of the collateral securing the loan, and the overall
economic situation of the borrower when making a non-accrual
decision. Management closely monitors the status of all non-accrual
loans. A non-accruing loan is restored to accrual status when
principal and interest payments have been brought current, it becomes well
secured, or is in the process of collection and the prospects of future
contractual payments are no longer in doubt. Generally, consumer
installment loans are not placed on non-accrual status, but are charged off
after they are 120 days contractually past due.
Table 5 sets forth the amounts of
non-accrual, past-due and restructured loans (dollars in thousands) for the past
five years:
Risk
Elements of Loan Portfolio
Table 5
|
At December 31
|
||||||||||||||||||||
|
2009
|
2008
|
2007
|
2006
|
2005
|
||||||||||||||||
|
Non-Accrual
Loans
|
$ | 46,584 | $ | 24,553 | $ | 5,443 | $ | 3,190 | $ | 2,393 | ||||||||||
|
Accruing
Loans Past Due 90 Days or More
|
1,770 | 3,476 | 3,260 | 619 | 989 | |||||||||||||||
|
Total
|
$ | 48,354 | $ | 28,029 | $ | 8,703 | $ | 3,809 | $ | 3,382 | ||||||||||
|
Total
as percentage of total loans
|
4.32 | % | 2.47 | % | .83 | % | .40 | % | .35 | % | ||||||||||
|
Restructured
Loans:
|
||||||||||||||||||||
|
Performing
|
$ | 22,160 | $ | 349 | $ | — | $ | 522 | $ | 532 | ||||||||||
|
Non-accrual
(included above)
|
13,321 | 119 | — | |||||||||||||||||
|
Total
Restructured
|
$ | 35,481 | $ | 468 | $ | — | $ | 522 | $ | 532 | ||||||||||
|
Other
Real Estate Owned
|
$ | 7,591 | $ | 2,424 | $ | 825 | $ | 23 | $ | 133 | ||||||||||
|
At December 31
|
||||||||||||||||||||
|
Non-Accrual Type
|
2009
|
2008
|
2007
|
2006
|
2005
|
|||||||||||||||
|
Commercial
|
$ | 40,370 | $ | 20,226 | $ | 382 | $ | 3,100 | $ | 2,256 | ||||||||||
|
Residential
– Mortgage
|
5,200 | 3,434 | 60 | 66 | 121 | |||||||||||||||
|
Installment
|
93 | 86 | 24 | 24 | 16 | |||||||||||||||
|
Residential
- Construction
|
921 | 807 | 4,977 | — | — | |||||||||||||||
|
Total
|
$ | 46,584 | $ | 24,553 | $ | 5,443 | $ | 3,190 | $ | 2,393 | ||||||||||
[33]
|
Non-Accrual Loans as a % of Applicable Portfolio
|
||||||||||||||||||||
|
2009
|
2008
|
2007
|
2006
|
2005
|
||||||||||||||||
|
Commercial
|
6.7 | % | 3.5 | % | .08 | % | .76 | % | .56 | % | ||||||||||
|
Residential-
Mortgage
|
1.3 | % | .85 | % | .02 | % | .02 | % | .04 | % | ||||||||||
|
Installment
|
.08 | % | .06 | % | .02 | % | .01 | % | .01 | % | ||||||||||
|
Residential
- Construction
|
11.3 | % | 5.5 | % | 38.4 | % | — | — | ||||||||||||
Interest
income not recognized as a result of placing loans on non-accrual status was
$1.3 million during 2009, $0.4 million during 2008 and $0.2 million during
2007. Interest income not recognized as a result of rate
modifications on restructured loans was $0.1 million in 2009 and none in 2008
and 2007.
We have seen an increase in non-accrual
loans in 2009 and 2008 primarily due to the effects of the recession on our
acquisition and development portfolio, which is in the commercial
portfolio.
The amount of restructured loans
increased significantly in 2009 as we have made every effort to work with our
borrowers during this distressed economic environment. At December 31, 2009,
performing restructured loans were comprised of approximately $7.4 million of
commercial real estate land development loans, $5.7 million of other commercial
real estate loans, $4.5 million of commercial and industrial loans, and $4.6
million of single family mortgage loans. The objective of the
restructurings was to increase loan repayments by customers and thereby reduce
net charge-offs. Restructured terms can include temporary relief of
contractual principal payments, temporary or permanent reductions of the
interest rate, and maturity extensions. For loans that were
originally interest only credit lines, if the maturity date is extended, the
restructured loan is placed on a principal amortization
schedule. Restructured loans are considered performing if they have
made at least six consecutive payments of their original and modified terms.
Restructured loans are evaluated for impairment as required by applicable
accounting guidance.
Allowance
for Loan Losses
An allowance for loan losses is
maintained to absorb losses from the loan portfolio. The allowance
for loan losses is based on management’s continuing evaluation of the quality of
the loan portfolio, assessment of current economic conditions, diversification
and size of the portfolio, adequacy of collateral, past and anticipated loss
experience, and the amount of non-performing loans.
We use the methodology outlined in FDIC
Statement of Policy on Allowance for Loan Losses. The starting point
for this methodology is to segregate the loan portfolio into two pools,
non-homogeneous (i.e., commercial) and homogeneous (i.e., consumer and
residential mortgage) loans. The two pools are further segmented by loan type
and by loan classification, including uncriticized (pass), other assets
especially mentioned and substandard. The uncriticized (pass) pools
for commercial real estate and residential real estate are further segmented
based upon the geographic locations of the underlying collateral. Each loan pool
is analyzed with general allowances and specific allocations being made as
appropriate. For general allowances, the previous eight quarters of
loss activity are used in the estimation of losses in the current
portfolio. These historical loss amounts are modified by the
following qualitative factors: levels of and trends in delinquency rates and
non-accrual loans; trends in volumes and terms of loans; effects of changes in
lending policies; experience, ability, and depth of management; national and
local economic trends and conditions; and concentrations of credit in the
determination of the general allowance. The qualitative factors are
updated each quarter by information obtained from internal, regulatory, and
governmental sources. Specific allocations of the allowance for loan
losses are made for those loans on the “Watchlist” that are considered impaired
and in which the collateral value is less than the outstanding loan balance with
the allocation being the dollar difference between the two. The
Watchlist represents loans, identified and closely monitored by management,
which possess certain qualities or characteristics that may lead to collection
and loss issues. Allocations are not made for loans that are cash
secured, for the Small Business Administration and Farm Service Agency
guaranteed portion of loans, or for loans that are sufficiently
collateralized.
The allowance for loan losses is based
on estimates, and actual losses will vary from current
estimates. These estimates are reviewed quarterly, and as
adjustments, either positive or negative, become necessary, a corresponding
increase or decrease is made in the allowance for loan losses. The
methodology used to determine the adequacy of the allowance for loan losses is
consistent with prior years. An estimate for probable losses related
to unfunded lending commitments, such as letters of credit and binding but
unfunded loan commitments is also prepared. This estimate is computed
in a manner similar to the methodology described above, adjusted for the
probability of actually funding the commitment.
[34]
The balance of the allowance for loan
losses increased to $20.1 million at December 31, 2009, from $14.3 million at
December 31, 2008. Several factors contributed to the $5.8 million
increase in the balance of the allowance in 2009, including: a
significant increase in the balance of non-accrual loans, from $24.6 million in
2008 to $46.6 million in 2009; changes to the qualitative factors which are
reviewed quarterly and reflect the current economic environment; an increase in
impaired loans from $83.3 million in 2008 to $131.2 million in 2009; and an
increase in the percentage of net charge-offs to average outstanding loans from
.54% in 2008 to .87% in 2009. Non-accrual loans and impaired loans
consist primarily of real estate development loans and commercial real estate
that have experienced a slowdown in the level of sales activity during the
current year. All of these types of credit facilities were thoroughly
reviewed by management during 2009 as to the adequacy of the collateral, the
valuation of collateral, secondary sources of repayment, and other credit
quality attributes. Collateral valuations were also subject to a
sensitivity and shock analysis in order to identify loans that may not have
sufficient collateral in the event of a significant decline in the market value
of the collateral. As a result of these extensive reviews, some
specific allocations of the allowance were made to several loans. At
December 31, 2009, the balance of the allowance was equal to 1.79% of total
loans, which was 2.0 times the amount of net charge-offs for the
year.
Performing loans considered impaired
loans, as defined and identified by management, amounted to $84.6 million at
December 31, 2009. Loans are identified as impaired when the loan is
classified as substandard and management determines that it is probable that the
borrower will not be able to pay principal and interest according to the
contractual terms of the loan. These loans consist primarily of
acquisition and development loans. The fair values are generally
determined based upon independent third party appraisals of the collateral or
discounted cash flows based upon the expected proceeds. Specific
allocations have been made where management believes there is insufficient
collateral and no secondary source of repayment is available.
During 2008, there was significant
coverage in the media regarding the topic of “sub-prime” loans and the resulting
increase in loan delinquencies and foreclosures. A sub-prime loan is
defined generally as a loan to a borrower with a weak credit record or a reduced
repayment capacity. These borrowers typically pose a higher risk of
default and foreclosure. We generally do not make sub-prime
loans. If credit is extended to a sub-prime borrower, the decision to
lend is based on the presence of facts and circumstances that management
believes mitigate the risks inherent in this type of loan. As of
December 31, 2009, management believes that our loss exposure arising from the
sub-prime loan market is minimal.
The
balance of the allowance for loan losses increased to $14.3 million at December
31, 2008, from $7.3 million at December 31, 2007. Several factors
contributed to the $7 million increase in the balance of the allowance in 2008,
including: a significant increase in the balance of non-accrual
loans, from $5.4 million in 2007 to $24.6 million in 2008; changes to the
qualitative factors which are reviewed quarterly; an increase in impaired loans
from $6.9 million in 2007 to $83.3 million in 2008; and an increase in the
percentage of net charge-offs to average outstanding loans from .15% in 2007 to
.54% in 2008. Non-accrual loans and impaired loans consist primarily
of real estate development loans and commercial real estate that have
experienced a slowdown in the level of sales activity during the current
year. All of these types of credit facilities were thoroughly
reviewed by management during the fourth quarter of 2008 as to the adequacy of
the collateral, the valuation of collateral, secondary sources of repayment, and
other credit quality attributes. Collateral valuations were also
subject to a sensitivity and shock analysis in order to identify loans that may
not have sufficient collateral in the event of a significant decline in the
market value of the collateral. As a result of this extensive review,
some specific allocations of the allowance were made to several of these
loans. At December 31, 2008, the balance of the allowance was equal
to 1.26% of total loans, which was 2.4 times the amount of net charge-offs for
the year.
As a result of management’s evaluation
of the loan portfolio using the factors and methodology described above,
management believes the allowance for loan losses is appropriate as of
December 31, 2009.
[35]
Table 6 presents the activity in the
allowance for loan losses by major loan category for the past five
years.
Analysis
of Activity in the Allowance for Loan Losses
(Dollars
in thousands)
Table 6
|
For the Years Ended December 31,
|
||||||||||||||||||||
|
2009
|
2008
|
2007
|
2006
|
2005
|
||||||||||||||||
|
Balance
at Beginning of Period
|
$ | 14,347 | $ | 7,304 | $ | 6,530 | $ | 6,416 | $ | 6,814 | ||||||||||
|
Loans
Charged Off:
|
||||||||||||||||||||
|
Commercial
|
6,375 | 3,936 | 540 | 359 | 557 | |||||||||||||||
|
Real
Estate – Mortgage
|
2,206 | 743 | 103 | 89 | 162 | |||||||||||||||
|
Installment
|
1,851 | 1,408 | 1,171 | 1,127 | 1,171 | |||||||||||||||
|
Deposit
Overdrafts
|
353 | 508 | 408 | — | — | |||||||||||||||
|
Total
Charged Off
|
10,785 | 6,595 | 2,222 | 1,575 | 1,890 | |||||||||||||||
|
Recoveries
of Loans:
|
||||||||||||||||||||
|
Commercial
|
309 | 147 | 45 | 110 | 8 | |||||||||||||||
|
Real
Estate – Mortgage
|
128 | 39 | 17 | 11 | 59 | |||||||||||||||
|
Installment
|
461 | 375 | 380 | 403 | 347 | |||||||||||||||
|
Deposit
Overdrafts
|
42 | 152 | 242 | — | — | |||||||||||||||
|
Total
Recoveries
|
940 | 713 | 684 | 524 | 414 | |||||||||||||||
|
Net
Loans Charged Off
|
9,845 | 5,882 | 1,538 | 1,051 | 1,476 | |||||||||||||||
|
Provision
for Loan Losses
|
15,588 | 12,925 | 2,312 | 1,165 | 1,078 | |||||||||||||||
|
Balance
at the End of Period
|
$ | 20,090 | $ | 14,347 | $ | 7,304 | $ | 6,530 | $ | 6,416 | ||||||||||
|
Loans
at End of Period
|
$ | 1,121,884 | $ | 1,134,546 | $ | 1,043,266 | $ | 963,656 | $ | 960,961 | ||||||||||
|
Daily
Average Balance of Loans
|
$ | 1,132,569 | $ | 1,081,191 | $ | 1,003,854 | $ | 957,709 | $ | 954,784 | ||||||||||
|
Allowance
for Loan Losses to Loans Outstanding
|
1.79 | % | 1.26 | % | .70 | % | .68 | % | .67 | % | ||||||||||
|
Net
Charge Offs to Average Loans Outstanding
|
.87 | % | .54 | % | .15 | % | .11 | % | .15 | % | ||||||||||
Table 7
presents management’s allocation of the allowance for loan losses by major loan
category in comparison to that loan category’s percentage of total loans.
Changes in the allocation over time reflect changes in the composition of the
loan portfolio risk profile and refinements to the methodology of determining
the allowance. Specific allocations in any particular category may be
reallocated in the future as needed to reflect current
conditions. Accordingly, the entire allowance is considered available
to absorb losses in any category.
Allocation
of the Allowance for Loan Losses
(In
thousands at December 31)
Table
7
|
2009
|
% of
Total
Loans
|
2008
|
% of
Total
Loans
|
2007
|
% of
Total
Loans
|
2006
|
% of
Total
Loans
|
2005
|
% of
Total
Loans
|
|||||||||||||||||||||||||||||||
|
Commercial
|
$ | 15,004 | 54 | % | $ | 9,002 | 51 | % | $ | 3,825 | 47 | % | $ | 2,983 | 42 | % | $ | 2,777 | 42 | % | ||||||||||||||||||||
|
Real
Estate-Mortgage
|
3,172 | 36 | % | 3,326 | 37 | % | 1,716 | 38 | % | 1,512 | 39 | % | 1,504 | 38 | % | |||||||||||||||||||||||||
|
Consumer
Installment
|
1,657 | 10 | % | 2,015 | 12 | % | 1,763 | 15 | % | 1,934 | 19 | % | 2,060 | 20 | % | |||||||||||||||||||||||||
|
Other
|
257 | — | 4 | — | 0 | — | 101 | — | 75 | — | ||||||||||||||||||||||||||||||
|
Total
|
$ | 20,090 | 100 | % | $ | 14,347 | 100 | % | $ | 7,304 | 100 | % | $ | 6,530 | 100 | % | $ | 6,416 | 100 | % | ||||||||||||||||||||
[36]
Investment
Securities
Investment securities classified as
available-for-sale are held for an indefinite period of time and may be sold in
response to changing market and interest rate conditions or for liquidity
purposes as part of our overall asset/liability management
strategy. Available-for-sale securities are reported at market value,
with unrealized gains and losses excluded from earnings and reported as a
separate component of other comprehensive income included in shareholders’
equity, net of applicable income taxes. For additional information,
see Notes 1 and 4 of the Notes to Consolidated Financial Statements, which are
included in Item 8 of Part II of this annual report.
The following sets forth the
composition of our securities portfolio available-for-sale, reported at fair
value, by major category as of the indicated dates (in thousands):
|
December
31,
|
||||||||||||||||||||||||||||||||||||
|
2009
|
2008
|
2007
|
||||||||||||||||||||||||||||||||||
|
Amortized
Cost
|
Fair
Value
(FV)
|
FV
As %
of
Total
|
Amortized
Cost
|
Fair
Value
(FV)
|
FV
As %
of
Total
|
Amortized
Cost
|
Fair
Value
(FV)
|
FV
As %
of
Total
|
||||||||||||||||||||||||||||
|
Securities
Available-for-Sale:
|
||||||||||||||||||||||||||||||||||||
|
U.S.
government and agencies
|
$ | 68,487 | $ | 68,263 | 25 | % | $ | 111,938 | $ | 113,645 | 32 | % | $ | 89,211 | $ | 90,768 | 30 | % | ||||||||||||||||||
|
Residential
mortgage-backed agencies
|
59,640 | 62,573 | 23 | % | 80,354 | 82,561 | 23 | % | 39,931 | 40,258 | 13 | % | ||||||||||||||||||||||||
|
Collateralized mortgage obligations
|
40,809 | 33,197 | 12 | % | 51,753 | 40,638 | 12 | % | 20,574 | 20,681 | 7 | % | ||||||||||||||||||||||||
|
Obligation
of states and political subdivisions
|
95,190 | 97,303 | 35 | % | 95,876 | 93,485 | 26 | % | 85,896 | 85,893 | 28 | % | ||||||||||||||||||||||||
|
Collateralized
debt obligations
|
44,478 | 12,448 | 5 | % | 70,324 | 24,266 | 7 | % | 73,537 | 67,308 | 22 | % | ||||||||||||||||||||||||
|
Total
|
$ | 308,604 | $ | 273,784 | 100 | % | $ | 410,245 | $ | 354,595 | 100 | % | $ | 309,149 | $ | 304,908 | 100 | % | ||||||||||||||||||
Investment
securities have decreased $80.8 million since December 31, 2008. U.S.
government agencies decreased by $45.4 million during 2009 primarily due to
calls in the portfolio. Residential mortgage-backed agencies decreased by $20.0
million and collateralized mortgage obligations decreased slightly by $7.4
million as a result of increased paydowns on the underlying
loans. The collateralized debt obligations portfolio consists
primarily of trust preferred securities issued by trust subsidiaries of
financial institutions and insurance companies that are collateralized by junior
subordinated debentures issued by those parent institutions. The
$11.8 million decrease in this sector is due to a decline in the fair value of
these securities directly attributable to the current economic environment and
its impact on the financial services industry as well as realized losses
recognized in 2009 as a result of other-than-temporary impairment
charges. The decreases in these sectors were offset by a slight
increase in state and political subdivisions of $3.8 million.
At December 31, 2009, the securities
classified as available-for-sale included a net unrealized loss of $34.8
million, which represents the difference between the fair value and amortized
cost of securities in the portfolio. The comparable amount at
December 31, 2008 was an unrealized loss of $55.6 million. Typically,
the fair values of securities available-for-sale will generally decrease
whenever interest rates increase, and the fair values will typically increase in
a declining rate environment. However, fair values have also been
affected by factors such as marketability, liquidity and the current economic
environment.
As
discussed in Note 18 of the Notes to Consolidated Financial Statements included
in Item 8 of Part II of this annual report, the Corporation measures fair market
values based on the fair value hierarchy established in ASC Topic 820, Fair Value Measurements and
Disclosures. In April 2009, FASB issued additional guidance in ASC
Subparagraphs 820-10-35-51A and 820-10-35-51B on determining when the volume and
level of activity for the asset or liability has significantly decreased and
provides a list of factors that a reporting entity should evaluate to determine
whether there has been a significant decrease in the volume and level of
activity for the asset or liability in relation to normal market activity for
the asset or liability. When the reporting entity concludes there has been a
significant decrease in the volume and level of activity for the asset or
liability, further analysis of the information from that market is needed and
significant adjustments to the related prices may be necessary to estimate fair
value. The new guidance also clarifies in ASC Subparagraphs
820-10-35-51E and 820-10-35-51F that when there has been a significant decrease
in the volume and level of activity for the asset or liability, some
transactions may not be orderly. In those situations, the entity must evaluate
the weight of the evidence to determine whether the transaction is orderly. The
guidance provides a list of circumstances that may indicate that a transaction
is not orderly. The hierarchy gives the highest priority to unadjusted quoted
prices in active markets for identical assets or liabilities (Level 1
measurements) and the lowest priority to unobservable inputs (Level 3
measurements). Level 3 prices or valuation techniques require inputs that are
both significant to the valuation assumptions and are not readily observable in
the market (i.e. supported with little or no market activity). These
Level 3 instruments are valued based on both observable and unobservable inputs
derived from the best available data, some of which is internally developed, and
considers risk premiums that a market participant would
require.
[37]
Approximately $12.4 million (5%) of our
securities available-for-sale were valued using significant unobservable inputs
(Level 3 assets). These securities are pooled trust preferred
securities and are classified as collateralized debt obligations and contributed
approximately $32.0 million to the unrealized loss reported in our accumulated
other comprehensive loss on the Statement of Financial Condition. The
terms of the debentures underlying trust preferred securities allow the issuer
of the debentures to defer interest payments for up to 20 quarters, and, in such
case, the terms of the related trust preferred securities allow their issuers to
defer dividend payments for up to 20 quarters. Some of the issuers of
the trust preferred securities in our investment portfolio have defaulted and/or
deferred payments ranging from 4.2% to 31.7% of the total collateral balances
underlying the securities. The securities were designed to include
structural features that provide investors with credit enhancement or support to
provide default protection by subordinated tranches. These features
include over-collateralization of the notes or subordination, excess interest or
spread which will redirect funds in situations where collateral is insufficient,
and a specified order of principal payments. There are securities in
our portfolio that are under-collateralized which does represent additional
stress on our tranche. However, in these cases, the terms of the
securities require excess interest to be redirected from subordinate tranches as
credit support, which provides additional support to our
investment.
As part of its other-than-temporary
impairment analysis, management reviewed all of the underlying issuers for each
trust preferred security in the portfolio. Various credit factors
were analyzed and as a result, management identified issuers we considered to
represent collateral at risk. The total collateral at risk for each
security was then compared to the amount of collateral that would need to move
to deferral or default in order to cause a break in yield for a given class of
bonds. A break in yield means that deferrals or defaults have reached
such a level that the tranche would not receive all of the contractual cash
flows (principal and interest) by the maturity date. This is indicative of a
permanent credit loss. This information was reviewed along with the
results of the cash flow tests described below to assess whether a security is
other-than-temporarily impaired.
The
following table provides a summary of these securities and the credit status of
the securities as of December 31, 2009.
Level
3 Investment Securities Available for Sale
(Dollars in
Thousands)
|
Investment
Description
|
First
United Level 3 Investments
|
Security
Credit Status
|
|||||||||||||||||||||||||||||||||||||||||||
|
Deal
|
Class
|
Book
Value
|
Fair
Market
Value
|
Unrealized
Gain/(Loss)
|
Lowest
Credit
Rating
|
Original
Collateral
|
Deferrals/
Defaults
as
% of Original
Collateral
|
Performing
Collateral
|
Collateral
Support
|
Collateral
Support
as
%
of
Performing
Collateral
|
Collateral
at
Risk
(Internal
Assessment)
|
Number
of
Performing
Issuers/Total
Issuers
|
|||||||||||||||||||||||||||||||||
|
Preferred
Term Security I*
|
Mezz
|
861 | 632 | (229 | ) |
CC
|
277,500 | 24.86 | % | 208,500 | (11,492 | ) | -5.61 | % | - |
28 /
32
|
|||||||||||||||||||||||||||||
|
Preferred
Term Security XI
|
B-1
|
1,500 | 579 | (921 | ) |
CC
|
601,775 | 21.23 | % | 479,410 | (69,316 | ) | -14.46 | % | 24,000 |
53 /
65
|
|||||||||||||||||||||||||||||
|
Preferred
Term Security XV*
|
B-1
|
93 | 93 | (0 | ) |
CC
|
598,300 | 23.58 | % | 461,191 | (98,153 | ) | -21.28 | % | 5,000 |
58 /
72
|
|||||||||||||||||||||||||||||
|
Preferred
Term Security XVI*
|
C
|
1,372 | 92 | (1,280 | ) |
CC
|
606,040 | 30.08 | % | 396,451 | (111,110 | ) | -28.03 | % | 17,000 |
42 /
56
|
|||||||||||||||||||||||||||||
|
Preferred
Term Security XVII*
|
C
|
27 | 27 | 0 |
CC
|
481,470 | 19.91 | % | 387,945 | (50,508 | ) | -13.02 | % | 10,000 |
45 /
57
|
||||||||||||||||||||||||||||||
|
Preferred
Term Security XVII*
|
C
|
81 | 81 | 0 |
CC
|
481,470 | 19.91 | % | 387,945 | (50,508 | ) | -13.02 | % | 10,000 |
45 /
57
|
||||||||||||||||||||||||||||||
|
Preferred
Term Security XVIII
|
C
|
2,010 | 247 | (1,763 | ) |
CCC
|
676,565 | 19.90 | % | 544,686 | (67,524 | ) | -12.40 | % | 6,200 |
62 /
80
|
|||||||||||||||||||||||||||||
|
Preferred
Term Security XVIII
|
C
|
3,015 | 371 | (2,644 | ) |
CCC
|
676,565 | 19.90 | % | 544,686 | (67,524 | ) | -12.40 | % | 6,200 |
62 /
80
|
|||||||||||||||||||||||||||||
|
Preferred
Term Security XIX
|
C
|
1,517 | 286 | (1,231 | ) |
CC
|
700,535 | 16.42 | % | 588,253 | (48,994 | ) | -8.33 | % | 23,245 |
60 /
74
|
|||||||||||||||||||||||||||||
|
Preferred
Term Security XIX
|
C
|
2,529 | 477 | (2,052 | ) |
CC
|
700,535 | 16.42 | % | 588,253 | (48,994 | ) | -8.33 | % | 23,245 |
60 /
74
|
|||||||||||||||||||||||||||||
|
Preferred
Term Security XIX
|
C
|
3,538 | 668 | (2,870 | ) |
CC
|
700,535 | 16.42 | % | 588,253 | (48,994 | ) | -8.33 | % | 23,245 |
60 /
74
|
|||||||||||||||||||||||||||||
|
Preferred
Term Security XIX
|
C
|
1,517 | 286 | (1,231 | ) |
CC
|
700,535 | 16.42 | % | 588,253 | (48,994 | ) | -8.33 | % | 23,245 |
60 /
74
|
|||||||||||||||||||||||||||||
|
Preferred
Term Security XXII*
|
C-1
|
4,545 | 699 | (3,846 | ) |
C
|
1,386,600 | 25.57 | % | 1,036,723 | (167,593 | ) | -16.17 | % | 3,000 |
74 /
98
|
|||||||||||||||||||||||||||||
|
Preferred
Term Security XXII*
|
C-1
|
1,841 | 279 | (1,562 | ) |
C
|
1,386,600
|
25.57 | % | 1,036,723 | (167,593 | ) | -16.17 | % | 3,000 |
74 /
98
|
|||||||||||||||||||||||||||||
|
Preferred Term
Security XXIII*
|
C-1
|
1,988 | 484 | (1,504 | ) |
CCC
|
1,388,000 | 21.87 | % | 1,087,340 | (91,615 | ) | -8.43 | % | 70,000 |
105
/ 126
|
|||||||||||||||||||||||||||||
|
Preferred
Term Security XXIII*
|
D-1
|
1,677 | 167 | (1,510 | ) |
CC
|
1,388,000 | 21.87 | % | 1,087,340 | (196,419 | ) | -18.06 | % | 70,000 |
105
/ 126
|
|||||||||||||||||||||||||||||
|
Preferred
Term Security XXIII*
|
D-1
|
5,011 | 502 | (4,509 | ) |
CC
|
1,388,000 | 21.87 | % | 1,087,340 | (196,419 | ) | -18.06 | % | 70,000 |
105
/ 126
|
|||||||||||||||||||||||||||||
|
Preferred
Term Security XXIV*
|
C-1
|
1,356 | 166 | (1,190 | ) |
CC
|
1,050,600 | 29.44 | % | 744,170 | (193,565 | ) | -26.01 | % | 28,000 |
69 /
93
|
|||||||||||||||||||||||||||||
|
Preferred
Term Security I-P-I
|
B-2
|
2,000 | 1,258 | (742 | ) |
B+
|
192,100 | 9.11 | % | 176,000 | 12,982 | 7.38 | % | 15,000 |
16 /
17
|
||||||||||||||||||||||||||||||
|
Preferred
Term Security I-P-IV
|
B-1
|
3,000 | 1,895 | (1,105 | ) |
B
|
312,700 | 4.16 | % | 299,700 | 24,889 | 8.30 | % | 23,000 |
31 /
32
|
||||||||||||||||||||||||||||||
|
Preferred
Term Security I-P-IV
|
B-1
|
5,000 | 3,158 | (1,842 | ) |
B
|
312,700 | 4.16 | % | 299,700 | 24,889 | 8.30 | % | 23,000 |
31 /
32
|
||||||||||||||||||||||||||||||
|
Total
Level 3 Securities Available for Sale
|
44,478 | 12,448 | (32.030 | ) | |||||||||||||||||||||||||||||||||||||||||
* Security has been deemed other-than-temporarily impaired and loss has
been recognized in accordance with ASC Section 320-10-35.
[38]
Management
systematically evaluates securities for impairment on a quarterly
basis. Based upon application of new accounting guidance for
subsequent measurement in Topic 320 (ASC Section 320-10-35) management must
assess whether (a) it has the intent to sell the security and (b) it is
more likely than not that the Corporation will be required to sell the security
prior to its anticipated recovery. If neither applies,
then declines in the fair value of securities below their cost that are
considered other-than-temporary declines are split into two
components. The first is the loss attributable to declining credit
quality. Credit losses are recognized in earnings as realized losses
in the period in which the impairment determination is made. The
second component consists of all other losses. The other losses are
recognized in other comprehensive income. In estimating
other-than-temporary impairment losses, management considers (1) the length of
time and the extent to which the fair value has been less than cost, (2) adverse
conditions specifically related to the security, an industry, or a geographic
area, (3) the historic and implied volatility of the security, (4) changes in
the rating of a security by a rating agency, (5) recoveries or additional
declines in fair value subsequent to the balance sheet date, (6) failure of the
issuer of the security to make scheduled interest payments, and (7) the payment
structure of the debt security and the likelihood of the issuer being able to
make payments that increase in the future. Due to the duration and
the significant market value decline in the pooled trust preferred securities
held in our portfolio, we performed more extensive testing on these securities
for purposes of evaluating whether or not an other-than-temporary impairment has
occurred.
Twenty-two
of the pooled trust preferred securities in our portfolio have been in an
unrealized loss position for over 12 months. Although some of the
securities have been in a loss position for over one year, this is not an
automatic indication of an other-than-temporary impairment. Rather,
individual facts and circumstances may indicate that a decline in fair value
longer than 12 months may be temporary. Given the extraordinary
market conditions prevalent over the past year and the economic recession,
additional consideration has been given to the length of time the securities
have been in a loss position and the likelihood that a market recovery will be
longer than an otherwise orderly market would dictate.
The
factors to be considered in reaching a conclusion about the existence of
impairment may be both subjective and objective and include knowledge and
experience about past and current events as well as assumptions about future
events. In the case of the trust preferred securities, the decline in
fair value is attributable to adverse conditions in the market, adverse
conditions in the financial industry, as well as adverse conditions related to
the underlying issuers of the securities (all of whom operate in the financial
services industry).
The
significant deterioration of the sub-prime mortgage market during the past two
years has resulted in the occurrence of unprecedented events in the financial
services industry. Large banking houses and investment firms have
gone out of business and/or consolidated, many banks have been closed by
regulators and the capital structures of many organizations have significantly
weakened. These events, in turn, have significantly and adversely
affected all sectors of the local, national and global economies and have
contributed to a national and worldwide liquidity and credit
crisis. The FRB and other agencies of the U.S. government have taken
steps to lower interest rates, inject capital into banks and financial
companies, establish outlets to sell troubled assets and have developed programs
to modify troubled mortgage loans. The new accounting guidance in ASC
Topic 820 was provided to relieve the uncertainties of fair market accounting
applications in markets where there has been a significant decrease in the
volume and level of activity resulting in non-orderly transactions and in ASC
Topic 320 to provide relief from other-than-temporary impairment not related to
credit problems. The fair market values of the pooled trust preferred
securities have shown the effects of all of these factors because the underlying
issuers all operate in some aspect of the financial services industry, most of
them community banks.
The
economic environment and its impact on the financial services industry have
virtually eliminated the market for the pooled trust preferred securities in our
portfolio. Management has determined that there has been a significant decrease
in the volume and level of activity in these securities. There are
few recent transactions in the market for these securities relative to
historical levels. There were no new pooled trust preferred issuances
during 2008 or 2009. Trading activity for pooled trust preferred
securities indicates only three total trades during the first quarter of 2009,
zero trades during the second quarter of 2009 and only distressed trades during
the third and fourth quarters of 2009, compared to a high of 116 trades in the
first quarter of 2008. The volume is sporadic with $0 in trades
during the first and second quarters of 2009, $14 million during the third
quarter and $400 million during the fourth quarter of 2009, representing
primarily distressed sales. The trading and issuance data presented, along with
information from traders, indicates that there is currently an inactive and
inefficient market in pooled trust preferred securities which is contributing to
the depressed pricing on these securities. Price quotations are
clearly indicative of distressed trades and vary significantly from prices
achieved during an active market. Comparing each issuer’s estimate of
cash flows and, taking into consideration all available market data and
nonperformance risk, there is a significant increase in the implied liquidity
risk premiums and yields on the securities. This has led to a wide
bid-ask spread as buyers for the securities are seeking “fire-sale” prices and
owners of the securities are not willing to accept such
pricing.
[39]
All of
the above mentioned issues, coupled with the general interest rate environment,
have had an adverse impact on the underlying banks and insurance company issuers
of the pooled trust preferred securities. The generally accepted
accounting principles that we use to prepare our financial statements require
management to consider all available evidence in its evaluation of the
realizable value of an investment. Judgment is required to determine
whether factors exist that indicate an impairment loss has been incurred at the
end of a reporting period. The judgment may be based on both
subjective and objective factors. At the time of purchase, nineteen
of the Trust Preferred securities were rated A and seven were rated
BBB. In its analysis, management considered the current credit
ratings as part of its overall evaluation of the underlying
collateral. Management also recognizes that there have been instances
over the past several months where highly rated securities have
failed. Two of the preferred term securities in our portfolio were
downgraded by Moody’s in the fourth quarter of 2008 and an additional eight were
downgraded in March 2009. During the quarter ended June 30, 2009, the
remaining preferred term securities in our portfolio were downgraded below
investment grade by Fitch Ratings. Due to the credit
downgrades, management performed an in-depth analysis of the underlying issuers
in every trust preferred security owned by the Corporation and shock tests of
collateral values were performed in order to determine how much stress the
securities could withstand before a loss in principal would be
experienced.
For
securities that are considered beneficial interests under the guidance of ASC
Subtopic 325-40, Investments –
Other – Beneficial Interests in Securitized Financial Assets, (ASC
Section 325-40-35), management also monitors cash flow projections for
significant adverse changes. The guidance removes the requirement to estimate
cash flows from the views of a market participant but rather to base the
estimate of cash flows on current information and events. Further, in
making the other-than-temporary assessment, the holder should consider all
relevant information about past events, current conditions, and reasonable and
supportable forecasts when estimating future cash flows. This
information should include remaining payment terms of the security, prepayment
speeds, the financial condition of the issuer(s), expected defaults, and the
value of any underlying collateral.
The
guidance in ASC Subtopic 325-40 requires that the present value of the current
estimated cash flows be compared to the present value of cash flows at the last
reporting date. If the present value of the original cash flows
estimated at the initial transaction date (or at the last date previously
revised) is greater than the present value of the current estimated cash flows,
the change is considered adverse (that is, an other-than-temporary impairment
should be considered to have occurred). The following assumptions
were used in our cash flow tests:
|
|
1.
|
Default Rate –
0.75% applied annually to bank and insurance collateral; 15% recovery
after two years
|
|
|
·
|
Based
upon FDIC data, the default data since the late 70’s demonstrates that BIF
(Bank Insurance Fund) insured institutions defaulted at a rate of
approximately 36 basis points (bps) per
year.
|
|
|
·
|
Based
upon A.M. Best number of impairments experienced in the insurance industry
of 72 bps per year.
|
|
|
·
|
On
November 21, 2008, Standard & Poor’s published “Global Methodology for
Rating Trust Preferred/Hybrid Securities Revised”. This study
lists a recovery assumption of 15%.
|
|
|
2.
|
Prepayment Speed
– 1% annually; 100% at
maturity;
|
|
|
·
|
Based
upon a preferred term security historical collateral redemption summary;
updated since September 30, 2008 to reflect the slow-down in pre-payment
speeds and the reluctance on the part of banks to release capital in the
current market environment. Anticipated life to maturity is
used because auction take-out is currently considered
unlikely.
|
|
|
3.
|
LIBOR Rate is
assumed to remain constant for all
periods.
|
|
|
4.
|
Additional Defaults
and Deferrals – actual defaults that have been experienced in the
pools and actual and announced deferrals have been incorporated into
expected cash flows for each individual
security.
|
|
|
5.
|
Discount Rate –
the rate equal to the current yield used to accrete the beneficial
interest as required in FASB ASC paragraph
325-40-35-6.
|
Management regularly performs an
internal assessment of the specific banks and insurance company issuers
underlying the securities to assess the likelihood of additional collateral
being at risk beyond those issuers that have defaulted, deferred interest, or
indicated a future deferral of interest. Publically available key
performance ratios are reviewed with emphasis placed on the combination of third
party ratings of financial strength and ratios such as the Texas ratio and the
modified Texas ratio that relate concentrations and levels of non-performing
assets to capital. Favorable consideration is given to those banks
who participated in the U.S. government’s CPP program on the strength of the
review to enter that program. The results of the internal
assessment are factored into an analysis stressing the standard cash flow
tests.
[40]
In accordance with FASB ASC section
325-40-35, the present value of cash flow for the Preferred Term Securities at
December 31, 2009 was compared to the present value of the cash flows previously
projected at September 30, 2009. The results showed that the
present value of the current estimated cash flows were less than the present
value of cash flows at the last reporting date for the following: PRETSL I
mezzanine class, PRETSL XVI class C, PRETSL XVII class C, PRETSL XXII class C-1,
PRETSL XXIII class D-1, PRETSL XXIV class C-1, and the Alesco 11A
D. As a result, management determined that we do not expect to
recover the securities’ entire amortized cost basis and as such, they were
deemed other-than-temporarily impaired at December 31, 2009. Based on
this calculation, a non-cash credit loss in the amount of approximately $5.5
million was recognized in earnings for this period. Management
does not believe that this will have a material effect on our
liquidity.
As the
Board and management focus on increasing capital levels, we have determined to
change our intent with regard to two of our trust preferred
positions. Both PRETSL XV and PRETSL XVII are pools in which the
Corporation issued underlying debentures, so we have disallowed capital for
purposes of regulatory capital calculations to the extent we have outstanding
debt in those pools. As of December 31, 2009 the associated
disallowance of capital was approximately $7.25
million. Because of this disallowance of capital and the
uncertainties that remain in our loan and investment portfolio, we have
determined that we will more likely than not be required to sell the securities
before recovering their cost basis. The timing of that sale or
disposal is uncertain at this time and is dependent upon our capital
modeling. According to Topic 320 (FASB ASC section 320-10-35), the
impairment related to these securities is other than temporary and should be
recognized currently in earnings in an amount equal to the entire difference
between fair value and amortized cost. The non-cash loss recorded on
these two securities in the fourth quarter of 2009 amounted to approximately
$10.3 million. Management does not believe that this will have a
material effect on our liquidity.
As of
December 31, 2009, non-cash other-than-temporary impairment charges were $26.5
million.
During 2009, management deemed five of
the Preferred Term Securities to be worthless. These included PRETSL
XV Class C, PRETSL XXII Class D, PRETSL XXV Class D, ALESCO 11A D, and SLOSO SE
1A B1L. The full value of these securities has been recognized in
earnings through December 31, 2009.
On
October 13, 2008, as part of the U.S. government’s economic stabilization plan,
the Treasury announced two plans, the CPP and the TLGP. The
regulators highly encouraged participation in the programs in order to build
capital levels, supply additional liquidity to the banking industry, and improve
financial ratios for the large regional and national banks and the community
banks. A third program, the Capital Assistance Program, was adopted
during the first quarter of 2009. Many of the banks who issued the
trust preferred securities in our portfolio have announced participation in one
or more of these programs. Management believes that these programs
should help to bolster confidence in the industry and, eventually, provide
capital and liquidity to the banking industry, but a long recovery is
anticipated.
With the exception of PRETSL XV and
PRETSL XVII as discussed above, management does not intend to sell the remaining
Preferred Term Securities nor is it more likely than not that we will be
required to sell the securities prior to recovery. The risk-based
capital ratios require that banks set aside additional capital for securities
that are rated below investment grade. Securities rated one level
below investment grade require a 200% risk weighting. Additional
methods are applicable to securities rated more than one level below investment
grade. As of December 31, 2009, management believes that we maintain
sufficient capital and liquidity to cover the additional capital requirements of
these securities and future operating expenses. Additionally, we do
not anticipate any material commitments or expected outlays of capital in the
near term.
The mortgage backed securities
portfolio consists of agency backed bonds and private label collateralized
mortgage obligations. Nine of the private label bonds with a fair value of $33.2
million have been in an unrealized loss position for greater than 12 months. The
unrealized loss on these securities is $7.6 million. All of the private label
securities are monitored on a monthly basis to allow management to assess the
overall exposure to various factors that could have an effect on the credit
quality of the bonds. Factors such as loan to value ratio, credit
support levels, credit scores, geographic concentration, prepayment speeds,
delinquencies and coverage ratios are incorporated into this
assessment.
All
private label collateralized mortgage obligation bonds held in the portfolio
were of the highest investment grade at the time of
purchase. However, seven of the nine private labels were downgraded
below investment grade during 2009. For purposes of determining
impairment status, management has determined that a coverage ratio of less than
one could indicate potential shortfall of principal cash flow for the security.
Accordingly, management performed cash flow analysis on all of the bonds with a
coverage ratio of less than one.
[41]
A whole loan collateralized mortgage
obligation credit stress analysis was run on each of the private label bonds
with a coverage ratio less than one. The stress analysis modeled the
performance of our holdings based on varying constant default rates, constant
prepayment rates and loss severities. The first factor used to
determine the appropriate assumptions for cash flow analysis was the resulting
life cumulative default percentage needed to be at least equal to the current 60
day plus delinquency percentage in the specific collateral. Either an
INTEX cash flow model or a Bloomberg Super Yield Table was run using the
constant prepayment rate, loss severity percentage, and constant default rate
attributable to the projected cumulative default percentage of our bond based on
its current level of performance. The current book yield on each bond
was used to determine the present value of the cash flows for each bond as of
December 31, 2009. The current book value of each bond was compared
to the present value per the cash flow model to determine any
other-than-temporary impairment losses. One private label
collateralized mortgage obligation bond had a book value less than the current
present value. An other-than-temporary impairment charge of approximately $.2
million was recorded on this bond for the year ended December 31,
2009. We do not consider the remaining bonds to be
other-than-temporarily impaired.
We manage
our investment portfolio utilizing policies which seek to achieve desired levels
of liquidity, manage interest rate sensitivity, meet earnings objectives, and
provide required collateral support for deposit activities and treasury
management overnight investment products. Other than as indicated
above, we do not intend to sell the impaired bonds in our portfolio nor do we
believe we will be required to sell them prior to recovery of the
impairment. Management believes that it has properly identified and
recorded other-than-temporary losses in the portfolio at December 31,
2009.
Table 8
sets forth the contractual or estimated maturities of the components of our
securities portfolio as of December 31, 2009 and the weighted average yields on
a tax-equivalent basis.
Investment
Security Maturities, Yields, and Fair Values at December 31, 2009
(Dollars
in thousands)
Table 8
|
Within
1 Year
|
1 Year
To 5
Years
|
5 Years
To 10
Years
|
Over
10
Years
|
Total
Fair
Value
|
||||||||||||||||
|
Securities
Available-for-Sale:
|
||||||||||||||||||||
|
|
||||||||||||||||||||
|
U.S.
government agencies
|
$ | — | $ | 10,309 | $ | 10,445 | $ | 47,509 | $ | 68,263 | ||||||||||
|
Residential
mortgage-backed agencies
|
589 | 61,984 | — | — | 62,573 | |||||||||||||||
|
Collateralized
mortgage obligations
|
6,591 | 23,588 | 3,018 | — | 33,197 | |||||||||||||||
|
Obligations
of states and political subdivisions
|
— | 3,985 | 16,922 | 76,396 | 97,303 | |||||||||||||||
|
Collateralized
debt obligations
|
— | — | — | 12,448 | 12,448 | |||||||||||||||
|
|
||||||||||||||||||||
|
Total
|
$ | 7,180 | $ | 99,866 | $ | 30,385 | $ | 136,353 | $ | 273,784 | ||||||||||
|
|
||||||||||||||||||||
|
Percentage
of total
|
2.62 | % | 36.48 | % | 11.10 | % | 49.80 | % | 100.00 | % | ||||||||||
|
Weighted
average yield
|
5.91 | % | 5.49 | % | 5.33 | % | 4.75 | % | 5.08 | % | ||||||||||
We held
three securities in the name of one issuer exceeding 10% of shareholders’
equity, excluding securities issued by U.S. government
agencies. These securities are Wells Fargo mortgage-backed securities
with an aggregate book value of $23.3 million and fair value of $19.1 million at
December 31, 2009.
[42]
Deposits
Table 9 sets forth the average deposit
balances by major category for 2009, 2008 and 2007:
Average
Deposit Balances
(Dollars
in thousands)
Table 9
|
2009
|
2008
|
2007
|
||||||||||||||||||||||
|
Average
Balance
|
Average
Yield
|
Average
Balance
|
Average
Yield
|
Average
Balance
|
Average
Yield
|
|||||||||||||||||||
|
Non-interest-bearing
demand deposits
|
$ | 110,882 | — | $ | 106,124 | — | $ | 133,509 | — | |||||||||||||||
|
Interest-bearing
demand deposits
|
391,299 | .77 | % | 414,750 | 1.67 | % | 333,443 | 2.92 | % | |||||||||||||||
|
Savings
deposits
|
76,703 | .65 | % | 80,812 | 1.28 | % | 42,123 | 3.43 | % | |||||||||||||||
|
Time
deposits less than $100K
|
323,409 | 2.86 | % | 239,211 | 4.27 | % | 234,439 | 4.45 | % | |||||||||||||||
|
Time
deposits $100K or more
|
355,589 | 2.10 | % | 339,110 | 3.72 | % | 317,219 | 5.09 | % | |||||||||||||||
|
Total
|
$ | 1,257,882 | $ | 1,180,007 | $ | 1,060,733 | ||||||||||||||||||
Total
deposits increased $81.3 million in 2009, or 6.6%, when compared to
2008. This compares to a $96.3 million (8.6%) increase during 2008
over 2007. On an average balance basis, total deposits increased
$77.9 million (6.6%) in 2009 versus 2008, following a $119.3 million (11.2%)
increase in 2008 versus 2007.
The
increase in deposits resulted primarily from growth of in-house and retirement
account certificates of deposits as well as brokered money market
products. At December 31, 2009 and 2008, brokered certificates of
deposit amounted to $182.5 million and $168.6 million, respectively, or 14% of
total deposits at December 31, 2009 and 2008.
The
following table sets forth the maturities of time deposits of $100,000 or more
(in thousands):
Maturity
of Time Deposits of $100,000 or More
(Dollars
in thousands)
Table 10
|
December 31, 2009
|
||||
|
Maturities
|
||||
|
3
Months or Less
|
$ | 58,334 | ||
|
3-6
Months
|
45,836 | |||
|
6-12
Months
|
102,715 | |||
|
Over
1 Year
|
165,823 | |||
|
Total
|
$ | 372,708 | ||
During 2009, the Bank shifted its focus
on certificates of deposit of $100,000 or more, particularly brokered deposits,
to longer-term maturities as we anticipate a flat to rising interest rate
environment in the future.
[43]
Borrowed
Funds
The following shows the composition of
our borrowings at December 31 (in thousands):
|
2009
|
2008
|
2007
|
||||||||||
|
Securities
sold under agreements to repurchase
|
$ | 47,563 | $ | 41,995 | $ | 34,112 | ||||||
|
Short-term
FHLB advances
|
0 | 8,500 | 21,000 | |||||||||
|
Total
short-term borrowings
|
47,563 | 50,495 | 55,112 | |||||||||
|
Long-term
FHLB advances
|
227,423 | 241,474 | 142,522 | |||||||||
|
Junior
subordinated debentures
|
43,121 | 35,929 | 35,929 | |||||||||
|
Total
long-term borrowings
|
270,544 | 277,403 | 178,451 | |||||||||
|
Total
borrowings
|
$ | 318,107 | $ | 327,898 | $ | 233,563 | ||||||
|
Average
balance (from Table 1)
|
$ | 319,191 | $ | 309,923 | $ | 243,682 | ||||||
Total
borrowings decreased by $9.8 million or 3% in 2009 when compared to 2008, while
the average balance of borrowings increased by $9.3 million during the same
period. This decrease in 2009 is due to having no overnight
borrowings at December 31, 2009 and the repayment of a $13 million long-term
FHLB advance during the year. These decreases were offset by an
increase of $7.2 million in junior subordinated debentures that were issued to
Trust III in December 2009. In January 2010, the Corporation issued
an additional $3.6 million in junior subordinated debentures to Trust
III. Total borrowings increased by $94.3 million or 40% in 2008 when
compared to 2007, while the average balance of borrowings increased by $66.2
million during the same period. During 2008, the Corporation took
advantage of opportunities to borrow long-term FHLB advances and match these
borrowings with specific interest earning assets where possible.
Management
will continue to closely monitor interest rates within the context of its
overall asset-liability management process. See the “Interest Rate
Sensitivity” section of this Item 7 for further discussion on this
topic.
At
December 31, 2009, we had additional borrowing capacity with the FHLB totaling
$4.7 million, an additional $20 million of unused lines of credit with
various financial institutions, $23 million of an unused secured line of credit
with the FRB and approximately $97 million through wholesale money market
funds. See Note 9 of the Notes to Consolidated Financial Statements,
included in Item 8 of Part II of this annual report, for further details about
our borrowings and additional borrowing capacity, which is incorporated herein
by reference.
Capital
Resources
The Bank and the Corporation are
subject to risk-based capital regulations, which were adopted and monitored by
federal banking regulators. These guidelines are used to evaluate
capital adequacy and are based on an institution’s asset risk profile and
off-balance sheet exposures, such as unused loan commitments and stand-by
letters of credit. The regulatory guidelines require that a portion
of total capital be Tier 1 capital, consisting of common shareholders’ equity,
qualifying portion of trust issued preferred securities, and perpetual preferred
stock, less goodwill and certain other deductions. The remaining
capital, or Tier 2 capital, consists of elements such as subordinated debt,
mandatory convertible debt, remaining portion of trust issued preferred
securities, and grandfathered senior debt, plus the allowance for loan losses,
subject to certain limitations.
Under the risk-based capital
regulations, banking organizations are required to maintain a minimum 8% (10%
for well capitalized banks) total risk-based capital ratio (total qualifying
capital divided by risk-weighted assets), including a Tier 1 ratio of 4% (6% for
well capitalized banks). The risk-based capital rules have
been further supplemented by a leverage ratio, defined as Tier I capital divided
by average assets, after certain adjustments. The minimum leverage
ratio is 4% (5% for well capitalized banks) for banking organizations that do
not anticipate significant growth and have well-diversified risk (including no
undue interest rate risk exposure), excellent asset quality, high liquidity and
good earnings. Other banking organizations not in this category are
expected to have ratios of at least 4-5%, depending on their particular
condition and growth plans. Higher capital ratios could be required
if warranted by the particular circumstances or risk profile of a given banking
organization. In the current regulatory environment, banking
organizations must stay well capitalized in order to receive favorable
regulatory treatment on acquisition and other expansion activities and favorable
risk-based deposit insurance assessments. The Corporation’s capital
policy establishes guidelines meeting these regulatory requirements, and takes
into consideration current or anticipated risks as well as potential future
growth opportunities.
[44]
At December 31, 2009, the Corporation’s
total risk-based capital ratio was 11.20%, which was well above the regulatory
minimum of 8%. The Corporation’s total risk-based capital ratio for
year-end 2008 was 12.18%. As of December 31, 2009, the most recent
notification from the regulators categorizes the Corporation as “well
capitalized” under the regulatory framework for prompt corrective
action. See Note 3 of the Notes to Consolidated Financial Statements,
included in Item 8 of Part II of this annual report, for additional information
regarding regulatory capital ratios.
Total shareholders’ equity
increased $27.8 million to $100.6 million at December 31, 2009, from $72.7
million at December 31, 2008, primarily due to the receipt of $30 million in CPP
funds from the Treasury in January 2009 offset by declines in retained earnings
and accumulated other comprehensive loss. The return on average
equity (ROE) for 2009 decreased to (11.02%) from 9.31% for 2008.
As noted
above, pursuant to the Treasury’s CPP, in January, 2009, the Corporation sold
30,000 shares of Series A Preferred Stock and a related warrant to purchase
326,323 shares of common stock for an exercise price of $13.79 per share to the
Treasury for an aggregate purchase price of $30 million. The proceeds
from this transaction count as Tier 1 capital and the warrant qualifies as
tangible common equity. Information about the terms of these
securities is provided in Note 10 of the Notes to Consolidated Financial
Statements, included in Item 8 of Part II of this annual report.
Cash dividends in the amount of $1.2
million were paid on the Series A Preferred Stock during 2009.
Cash dividends of $.80 per common share
were paid during 2009 and 2008, compared with $.78 paid in 2007. This
represents a dividend payout ratio (cash dividends per common share divided by
net income per common share) of (38.46%), 55.17%, and 37.50% for 2009,
2008, and 2007, respectively. In December 2009, the Corporation
reduced its quarterly dividend by 50% to $.10 per share effective with the
dividend payable on February 1, 2010.
Liquidity
The Asset and Liability Management
Committee of the Corporation seeks to assess and manage the risks associated
with fluctuating interest rates while maintaining adequate
liquidity. This is accomplished by formulating and implementing
policies that take into account the sources and uses of funds, maturity and
repricing distributions of assets and liabilities, pricing strategies, and
marketability of assets.
The objective of liquidity management
is to maintain sufficient funds to satisfy the needs of depositors and
borrowers. The principal sources of asset liquidity are cash and due
from banks, interest-bearing deposits in banks, federal funds and investment
securities available-for-sale that are not pledged. At December 31,
2009, such liquid assets totaled $122 million. While much more
difficult to quantify, liability liquidity is enhanced by a stable core deposit
base, access to credit lines at other financial institutions, and the
Corporation’s ability to renew maturing deposits. The Corporation’s
ability to attract deposits and borrow funds depends primarily on continued rate
competitiveness, profitability, capitalization and overall financial
condition.
When appropriate, we take advantage of
external sources of funds, such as advances from the FHLB, lines of credit at
other financial institutions and brokered funds. These external
sources often provide attractive interest rates and flexible maturity dates that
better enable us to match funding dates and pricing characteristics with
contractual maturity dates and pricing parameters of earning
assets. At December 31, 2009, our available borrowing capacity
through the FHLB and other financial institutions was approximately $48
million. In addition, we had approximately $97 million available
funding through brokered money market funds.
We actively manage our liquidity
position under the direction of the Asset and Liability Management Committee of
the Corporation’s Board of Directors. Monthly reviews by management
and quarterly reviews by this Committee under prescribed policies and procedures
are intended to ensure that we will maintain adequate levels of available funds.
Management believes that we have adequate liquidity available to respond to
current and anticipated liquidity demands, which could include future branch
expansion. In addition to on-going liquidity management, we
also maintain a liquidity contingency plan which stresses our liquidity position
under potential adverse conditions. This plan is updated monthly and
enables management to foresee potential liquidity needs and to plan
accordingly.
[45]
The Corporation uses cash to pay
dividends to shareholders and to service its junior subordinated
debentures. The main sources of funding for the Corporation include
dividends from the Bank and access to the capital markets. As
discussed in Note 16 of the Notes to Consolidated Financial Statements, included
in Item 8 of Part II of this annual report, the Bank is subject to significant
regulation and, among other things, may be limited in its ability to pay
dividends or transfer funds to the holding company. Accordingly,
consolidated cash flows as presented in the Consolidated Statements of Cash
Flows may not represent cash immediately available to the
Corporation. During 2009, the Bank declared and paid $5.6 million in
cash dividends on its common stock. As of December 31, 2009, the
amount of additional dividends that the Bank could have paid to the Corporation
without regulatory approval was $15.0 million.
Interest
Rate Sensitivity
Our primary market risk is interest
rate fluctuation. Interest rate risk results primarily from the
traditional banking activities that we engage in, such as gathering deposits and
extending loans. Many factors, including economic and financial
conditions, movements in interest rates and consumer preferences affect the
difference between the interest earned on our assets and the interest paid on
our liabilities. Interest rate sensitivity refers to the degree that
earnings will be impacted by changes in the prevailing level of interest
rates. Interest rate risk arises from mismatches in the repricing or
maturity characteristics between interest-bearing assets and
liabilities. Management seeks to minimize fluctuating net interest
margins, and to enhance consistent growth of net interest income through periods
of changing interest rates. Management uses interest sensitivity gap
analysis and simulation models to measure and manage these risks. The
interest rate sensitivity gap analysis assigns each interest-earning asset and
interest-bearing liability to a time frame reflecting its next repricing or
maturity date. The differences between total interest-sensitive
assets and liabilities at each time interval represent the “interest sensitivity
gap” for that interval. A positive gap generally indicates that
rising interest rates during a given interval will increase net interest income,
as more assets than liabilities will reprice. A negative gap position would
benefit us during a period of declining interest rates. During 2009,
we remained negatively gapped although our focus was shifted to begin moving to
a more neutral position in anticipation of rising interest rates.
In order to manage interest sensitivity
risk, management formulates guidelines regarding asset generation and pricing,
funding sources and pricing, and off-balance sheet commitments. These
guidelines are based on management’s outlook regarding future interest rate
movements, the state of the regional and national economy, and other financial
and business risk factors. Management uses computer simulations to
measure the effect on net interest income of various interest rate
scenarios. Key assumptions used in the computer simulations include
cash flows and maturities of interest rate sensitive assets and liabilities,
changes in asset volumes and pricing, and management’s capital
plans. This modeling reflects interest rate changes and the related
impact on net interest income over specified periods.
As a part
of managing interest rate risk, the Corporation entered into interest rate swap
agreements to modify the re-pricing characteristics of certain interest-bearing
liabilities. The Corporation has designated its interest rate swap agreements as
cash flow hedges, which have the effective portion of changes in the fair value
of the derivative, net of taxes, recorded in net accumulated other comprehensive
income. In July 2009, the Corporation entered into three interest
rate swap contracts totaling $20.0 million notional amount, hedging future cash
flows associated with floating rate trust preferred debt. At December
31, 2009, the fair value of the interest rate swap contracts was ($60) thousand.
The Corporation had no open derivative positions at December 31,
2008. There was no hedge ineffectiveness recorded for the year ended
December 31, 2009. Interest rate swap agreements are entered into
with counterparties that meet established credit standards and the Corporation
believes that the credit risk inherent in these contracts is not significant as
of December 31, 2009.
At
December 31, 2009, the static gap analysis prepared by management indicated that
we become slightly asset sensitive over the next year. In computing
the effect on net interest income of changes in interest rates, management has
assumed that any changes would immediately affect earnings. When an
organization is asset sensitive an increase in interest rates normally creates a
positive impact to net interest income. Based on the simulation
analysis performed at December 31, 2009 and 2008, management estimated the
following changes in net interest income, assuming the indicated rate
changes:
|
(Dollars in thousands)
|
||||||||
|
2009
|
2008
|
|||||||
|
+200
basis point increase
|
$ | 847 | $ | (1,272 | ) | |||
|
+100
basis point increase
|
$ | 229 | $ | (257 | ) | |||
|
-100
basis point decrease
|
$ | (1,449 | ) | $ | 551 | |||
[46]
This estimate is based on assumptions
that may be affected by unforeseeable changes in the general interest rate
environment and any number of unforeseeable factors. Rates on
different assets and liabilities within a single maturity category adjust to
changes in interest rates to varying degrees and over varying periods of
time. The relationships between lending rates and rates paid on
purchased funds are not constant over time. Management can respond to
current or anticipated market conditions by lengthening or shortening the
Corporation’s sensitivity through loan repricings or changing its funding
mix. The rate of growth in interest-free sources of funds will
influence the level of interest-sensitive funding sources. In
addition, the absolute level of interest rates will affect the volume of earning
assets and funding sources. As a result of these limitations, the
interest-sensitive gap is only one factor to be considered in estimating the net
interest margin.
Impact of Inflation – Our
assets and liabilities are primarily monetary in nature, and as such, future
changes in prices do not affect the obligations to pay or receive fixed and
determinable amounts of money. During inflationary periods, monetary
assets lose value in terms of purchasing power and monetary liabilities have
corresponding purchasing power gains. The concept of purchasing power
is not an adequate indicator of the impact of inflation on financial
institutions because it does not incorporate changes in interest rates, which
are an important determination of the Corporation’s earnings.
Contractual
Obligations, Commitments and Off-Balance Sheet Arrangements
The following table presents, as of
December 31, 2009, significant fixed and determinable contractual obligations to
third parties by payment date and amounts and expected maturities of significant
commitments. Commitments to extend credit and letters of credit are
legally binding, conditional agreements generally having fixed expiration or
termination dates. These commitments generally require customers to
maintain certain credit standards and are established based on management’s
credit assessment of the customer. The commitments may expire without
being drawn upon. Therefore, the total commitment does not
necessarily represent future funding requirements. Further discussion
of the nature of certain obligations and commitments is included in the Notes to
the Consolidated Financial Statements referenced in the table below, which are
included in Item 8 of Part II of this annual report.
|
Payments Due by Period
|
||||||||||||||||||||||||
|
Contractual Obligations
(in millions)
|
Note
Reference
|
Total
|
Less than
1 Year
|
1-3
Years
|
3-5
Years
|
More
than
5 Years
|
||||||||||||||||||
|
Long
term debt
|
9 | |||||||||||||||||||||||
|
FHLB
Advances
|
$ | 227.4 | $ | 31.0 | $ | 95.3 | $ | — | $ | 101.1 | ||||||||||||||
|
Junior
subordinated debt
|
43.1 | — | — | — | 43.1 | |||||||||||||||||||
|
Operating
leases
|
6 | 9.2 | .6 | 1.1 | .9 | 6.6 | ||||||||||||||||||
|
Data
processing and telecommunications services
|
6 | 19.2 | 2.9 | 5.9 | 4.4 | 6.0 | ||||||||||||||||||
|
Time
Deposits
|
8 | 717.6 | 419.1 | 285.3 | 13.2 | — | ||||||||||||||||||
|
Pension/SERP
|
13 | 13.8 | .9 | 1.5 | 2.4 | 9.0 | ||||||||||||||||||
|
Commitment Expiration by Period
|
||||||||||||||||||||||||
|
Commitments
(in millions)
|
Note
Reference
|
Total
|
Less than
1 Year
|
1-3
Years
|
3-5
Years
|
More
than 5 Years
|
||||||||||||||||||
|
Loan
commitments
|
5 | $ | 87.3 | $ | 5.0 | $ | 6.0 | $ | 5.2 | $ | 71.1 | |||||||||||||
|
Letters
of credit
|
5 | 2.9 | 2.9 | — | — | — | ||||||||||||||||||
At December 31, 2009, our off-balance
sheet arrangements were limited to the loan commitments and letters of credit
discussed above.
[47]
|
ITEM
7A.
|
QUANTITATIVE
AND QUALITATIVE DISCLOSURES ABOUT MARKET
RISK
|
The information called for by this item
is incorporated herein by reference to Item 7 of Part II of this annual report
under the caption “Interest Rate Sensitivity”.
|
ITEM
8.
|
FINANCIAL
STATEMENTS AND SUPPLEMENTARY DATA
|
|
Page
|
||||
|
Report
of Independent Registered Public Accounting Firm
|
49 | |||
|
Consolidated
Statements of Financial Condition as of December 31, 2009 and
2008
|
50 | |||
|
Consolidated
Statements of Operations for the years ended December 31, 2009, 2008 and
2007
|
51 | |||
|
Consolidated
Statements of Changes in Shareholders’ Equity for the years ended December
31, 2009, 2008 and 2007
|
52 | |||
|
Consolidated
Statements of Cash Flows for the years ended December 31, 2009, 2008 and
2007
|
53 | |||
|
Notes
to Consolidated Financial Statements for the years ended December 31,
2009, 2008 and 2007
|
54 | |||
[48]
REPORT
OF INDEPENDENT REGISTERED PUBLIC ACCOUNTING FIRM
To the
Board of Directors and Shareholders
First
United Corporation
Oakland,
Maryland
We have audited the accompanying
consolidated statements of financial condition of First United Corporation and
subsidiaries (“Corporation”) as of December 31, 2009 and 2008, and the related
consolidated statements of operations, changes in shareholders’ equity, and cash
flows for each of the years in the three-year period ended December 31,
2009. The Corporation's management is responsible for these financial
statements. Our responsibility is to express an opinion on these
financial statements based on our audits.
We conducted our audits in accordance
with the standards of the Public Company Accounting Oversight Board (United
States). Those standards require that we plan and perform the audit
to obtain reasonable assurance about whether the financial statements are free
of material misstatement. An audit includes examining, on a test
basis, evidence supporting the amounts and disclosures in the financial
statements. An audit also includes assessing the accounting
principles used and significant estimates made by management, as well as
evaluating the overall financial statement presentation. We believe
that our audits provide a reasonable basis for our opinion.
In our opinion, the financial
statements referred to above present fairly, in all material respects, the
consolidated financial position of First United Corporation and subsidiaries as
of December 31, 2009 and 2008, and the consolidated results of their operations
and their cash flows for each of the years in the three-year period ended
December 31, 2009, in conformity with accounting principles generally accepted
in the United States of America.
We also have audited, in accordance
with the standards of the Public Company Accounting Oversight Board (United
States), First United Corporation’s internal control over financial reporting as
of December 31, 2009, based on criteria established in Internal Control—Integrated
Framework issued by the Committee of Sponsoring Organizations of the
Treadway Commission (COSO), and our report dated March 11, 2010 expressed an
unqualified opinion.
|
/s/
ParenteBeard LLC
|
|
Pittsburgh,
Pennsylvania
|
|
March
11, 2010
|
[49]
First United Corporation and
Subsidiaries
Consolidated
Statements of Financial Condition
(In
thousands, except per share amounts)
|
December 31
|
||||||||
|
2009
|
2008
|
|||||||
|
Assets
|
||||||||
|
Cash
and due from banks
|
$ | 139,169 | $ | 18,423 | ||||
|
Interest
bearing deposits in banks
|
50,502 | 882 | ||||||
|
Cash
and cash equivalents
|
189,671 | 19,305 | ||||||
|
Investment
securities available-for-sale (at fair value)
|
273,784 | 354,595 | ||||||
|
Federal
Home Loan Bank stock, at cost
|
13,861 | 13,933 | ||||||
|
Loans
|
1,121,884 | 1,134,546 | ||||||
|
Allowance
for loan losses
|
(20,090 | ) | (14,347 | ) | ||||
|
Net
loans
|
1,101,794 | 1,120,199 | ||||||
|
Premises
and equipment, net
|
31,719 | 31,124 | ||||||
|
Goodwill
and other intangible assets, net
|
15,241 | 16,322 | ||||||
|
Bank
owned life insurance
|
29,386 | 29,743 | ||||||
|
Deferred
tax assets
|
29,189 | 29,566 | ||||||
|
Accrued
interest receivable and other assets
|
59,091 | 24,317 | ||||||
|
Total
Assets
|
$ | 1,743,736 | $ | 1,639,104 | ||||
|
Liabilities
and Shareholders’ Equity
|
||||||||
|
Liabilities:
|
||||||||
|
Non-interest
bearing deposits
|
$ | 106,976 | $ | 107,749 | ||||
|
Interest
bearing deposits
|
1,197,190 | 1,115,140 | ||||||
|
Total
deposits
|
1,304,166 | 1,222,889 | ||||||
|
Short-term
borrowings
|
47,563 | 50,495 | ||||||
|
Long-term
borrowings
|
270,544 | 277,403 | ||||||
|
Accrued
interest payable and other liabilities
|
20,282 | 14,529 | ||||||
|
Dividends
payable
|
615 | 1,098 | ||||||
|
Total
Liabilities
|
1,643,170 | 1,566,414 | ||||||
|
Shareholders’
Equity:
|
||||||||
|
Preferred
stock-no par value; Authorized 2,000 shares, 30 shares of Series A, $1,000
per share liquidation preference, 5% cumulative, increasing to 9%
cumulative on February 15, 2014, issued and outstanding on December 31,
2009 (discount of $261)
|
29,739 | - | ||||||
|
Common
stock-par value $.01 per share; Authorized 25,000 shares, issued and
outstanding 6,144 in 2009 and 6,113 in 2008
|
61 | 61 | ||||||
|
Surplus
|
21,305 | 20,520 | ||||||
|
Retained
earnings
|
76,120 | 93,092 | ||||||
|
Accumulated
other comprehensive loss
|
(26,659 | ) | (40,983 | ) | ||||
|
Total
Shareholders’ Equity
|
100,566 | 72,690 | ||||||
|
Total
Liabilities and Shareholders’ Equity
|
$ | 1,743,736 | $ | 1,639,104 | ||||
See notes to consolidated financial
statements.
[50]
First
United Corporation and Subsidiaries
Consolidated
Statements of Operations
(In
thousands, except share and per share amounts)
|
Year ended December 31
|
||||||||||||
|
2009
|
2008
|
2007
|
||||||||||
|
Interest
income
|
||||||||||||
|
Interest
and fees on loans
|
$ | 68,221 | $ | 74,398 | $ | 77,132 | ||||||
|
Interest
on investment securities:
|
||||||||||||
|
Taxable
|
13,106 | 16,848 | 12,474 | |||||||||
|
Exempt
from federal income taxes
|
3,876 | 3,400 | 3,152 | |||||||||
|
Total
investment income
|
16,982 | 20,248 | 15,626 | |||||||||
|
Other
|
139 | 570 | 807 | |||||||||
|
Total
interest income
|
85,342 | 95,216 | 93,565 | |||||||||
|
Interest
expense
|
||||||||||||
|
Interest
on deposits
|
20,216 | 30,782 | 37,759 | |||||||||
|
Interest
on short-term borrowings
|
318 | 1,022 | 2,902 | |||||||||
|
Interest
on long-term borrowings
|
11,570 | 11,239 | 8,670 | |||||||||
|
Total
interest expense
|
32,104 | 43,043 | 49,331 | |||||||||
|
Net
interest income
|
53,238 | 52,173 | 44,234 | |||||||||
|
Provision
for loan losses
|
15,588 | 12,925 | 2,312 | |||||||||
|
Net
interest income after provision for loan losses
|
37,650 | 39,248 | 41,922 | |||||||||
|
Other
operating income
|
||||||||||||
|
Service
charges
|
5,458 | 6,259 | 5,838 | |||||||||
|
Trust
department
|
3,665 | 3,912 | 4,076 | |||||||||
|
Total
other-than-temporary security impairment losses
|
(42,394 | ) | (2,724 | ) | — | |||||||
|
Less: Portion
of loss recognized in other comprehensive income (before
taxes)
|
15,701 | — | — | |||||||||
|
Net
securities impairment losses recognized in earnings
|
(26,693 | ) | (2,724 | ) | — | |||||||
|
Securities
losses - trading
|
(443 | ) | — | — | ||||||||
|
Securities
gains/(losses) – available-for-sale
|
131 | 727 | (1,605 | ) | ||||||||
|
Insurance
commissions
|
2,888 | 2,143 | 2,529 | |||||||||
|
Debit
card income
|
1,404 | 1,215 | 1,111 | |||||||||
|
Bank
owned life insurance
|
559 | 704 | 1,114 | |||||||||
|
Other
|
2,354 | 1,533 | 2,029 | |||||||||
|
Total
other operating income
|
(10,677 | ) | 13,769 | 15,092 | ||||||||
|
Other
operating expense
|
||||||||||||
|
Salaries
and employee benefits
|
22,917 | 21,531 | 20,628 | |||||||||
|
FDIC
premiums
|
3,966 | 479 | 223 | |||||||||
|
Equipment
|
3,409 | 3,364 | 3,224 | |||||||||
|
Occupancy
|
2,822 | 2,693 | 2,388 | |||||||||
|
Data
processing
|
2,511 | 1,721 | 1,672 | |||||||||
|
Other
|
11,168 | 10,785 | 10,340 | |||||||||
|
Total
other operating expenses
|
46,793 | 40,573 | 38,475 | |||||||||
|
(Loss)/Income
before income taxes
|
(19,820 | ) | 12,444 | 18,539 | ||||||||
|
Applicable
income tax (benefit) expense
|
(8,496 | ) | 3,573 | 5,746 | ||||||||
|
Net
(Loss)/Income
|
$ | (11,324 | ) | $ | 8,871 | $ | 12,793 | |||||
|
Preferred
stock dividends and discount accretion
|
(1,430 | ) | — | — | ||||||||
|
Net
(Loss) Attributable to/Income Available to Common
Shareholders
|
$ | (12,754 | ) | $ | 8,871 | $ | 12,793 | |||||
|
Basic
net (loss)/income per common share
|
$ | (2.08 | ) | $ | 1.45 | $ | 2.08 | |||||
|
Diluted
net (loss)/income per common share
|
$ | (2.08 | ) | $ | 1.45 | $ | 2.08 | |||||
|
Dividends
declared per common share
|
$ | .70 | $ | .80 | $ | .78 | ||||||
|
Weighted
average number of common shares outstanding
|
6,122,187 | 6,112,808 | 6,149,125 | |||||||||
|
Weighted
average number of diluted common shares outstanding
|
6,122,187 | 6,131,461 | 6,149,125 | |||||||||
See notes to consolidated financial
statements.
[51]
First
United Corporation and Subsidiaries
Consolidated
Statements of Changes in Shareholders’ Equity
(In
thousands, except per share amounts)
|
Preferred
Stock
|
Capital
Stock
|
Surplus
|
Retained
Earnings
|
Accumulated
Other
Comprehensive
Loss
|
Total
Shareholders’
Equity
|
|||||||||||||||||||
|
Balance
at January 1, 2007
|
$ | — | $ | 61 | $ | 21,448 | $ | 80,927 | $ | (5,580 | ) | $ | 96,856 | |||||||||||
|
Comprehensive
income:
|
||||||||||||||||||||||||
|
Net
income for the year
|
12,793 | 12,793 | ||||||||||||||||||||||
|
Unrealized
loss on securities available-for sale,
net of reclassifications and income taxes
of $1,228
|
(1,815 | ) | (1,815 |
)
|
||||||||||||||||||||
|
Change
in accumulated unrealized losses for
pension and SERP obligations, net of income
taxes of $1,178
|
1,740 | 1,740 | ||||||||||||||||||||||
|
Comprehensive
income
|
12,718 | |||||||||||||||||||||||
|
Issuance
of 22,824 shares of common stock
under dividend reinvestment plan
|
476 | 476 | ||||||||||||||||||||||
|
Repurchase
of common stock
|
(524 | ) | (524 |
)
|
||||||||||||||||||||
|
Common
Stock dividends-$.78 per share
|
(4,861 | ) | (4,861 |
)
|
||||||||||||||||||||
|
Balance
at December 31, 2007
|
— | 61 | 21,400 | 88,859 | (5,655 | ) | 104,665 | |||||||||||||||||
|
Comprehensive
income (loss):
|
||||||||||||||||||||||||
|
Net
income for the year
|
8,871 | 8,871 | ||||||||||||||||||||||
|
Unrealized
loss on securities available-for sale,
net of reclassifications and income taxes
of $20,748
|
(30,660 | ) | (30,660 |
)
|
||||||||||||||||||||
|
Change
in accumulated unrealized losses for
pension and SERP obligations, net of income
taxes of $2,784
|
(4,668 | ) | (4,668 |
)
|
||||||||||||||||||||
|
Comprehensive
loss
|
(26,457 |
)
|
||||||||||||||||||||||
|
Issuance
of 25,814 shares of common stock
under dividend reinvestment plan
|
362 | 362 | ||||||||||||||||||||||
|
Repurchase
of common stock
|
(1,391 | ) | (1,391 |
)
|
||||||||||||||||||||
|
Stock
based compensation
|
149 | 149 | ||||||||||||||||||||||
|
Common
Stock dividends-$.80 per share
|
(4,638 | ) | (4,638 |
)
|
||||||||||||||||||||
|
Balance
at December 31, 2008
|
— | 61 | 20,520 | 93,092 | (40,983 | ) | 72,690 | |||||||||||||||||
|
Comprehensive
income:
|
||||||||||||||||||||||||
|
Net
loss for the year
|
(11,324 | ) | (11,324 |
)
|
||||||||||||||||||||
|
Unrealized
gain on securities available-for sale,
net of reclassifications and income
taxes of $8,407
|
12,422 | 12,422 | ||||||||||||||||||||||
|
Change
in accumulated unrealized losses for
pension and SERP obligations, net of income
taxes of $1,311
|
1,938 | 1,938 | ||||||||||||||||||||||
|
Unrealized
loss on derivatives, net
of income taxes of $24
|
(36 | ) | (36 |
)
|
||||||||||||||||||||
|
Comprehensive
income
|
3,000 | |||||||||||||||||||||||
|
Issuance
of 43,680 shares of common stock
under dividend reinvestment plan
|
488 | 488 | ||||||||||||||||||||||
|
Stock
based compensation
|
(16 | ) | (16 |
)
|
||||||||||||||||||||
|
Preferred
stock issued pursuant to TARP – 30,000
shares
|
29,687 | 29,687 | ||||||||||||||||||||||
|
Preferred
stock discount accretion
|
52 | (52 | ) | — | ||||||||||||||||||||
|
Warrant
issued pursuant to TARP
|
313 | 313 | ||||||||||||||||||||||
|
Preferred
stock dividends
|
(1,186 | ) | (1,186 |
)
|
||||||||||||||||||||
|
Common
Stock dividends declared-$.70 per share
|
(4,410 | ) | (4,410 |
)
|
||||||||||||||||||||
|
Balance
at December 31, 2009
|
$ | 29,739 | $ | 61 | $ | 21,305 | $ | 76,120 | $ | (26,659 | ) | $ | 100,566 | |||||||||||
See notes to consolidated financial
statements.
[52]
First
United Corporation and Subsidiaries
Consolidated
Statements of Cash Flows
(In
thousands)
|
Year
ended December 31
|
||||||||||||
|
2009
|
2008
|
2007
|
||||||||||
|
Operating
activities
|
||||||||||||
|
Net
(Loss)/Income
|
$ | (11,324 | ) | $ | 8,871 | $ | 12,793 | |||||
|
Adjustments
to reconcile net (loss)/ income to net cash provided
by operating activities:
|
||||||||||||
|
Provision
for loan losses
|
15,588 | 12,925 | 2,312 | |||||||||
|
Depreciation
|
2,719 | 2,834 | 2,581 | |||||||||
|
Stock
compensation
|
(16 | ) | 149 | — | ||||||||
|
Amortization
of intangible assets
|
1,081 | 684 | 656 | |||||||||
|
Loss
on sales of foreclosed real estate
|
125 | 9 | 13 | |||||||||
|
Net
(accretion)/amortization of investment security
discounts and premiums
|
157 | (514 | ) | 145 | ||||||||
|
Other-than-temporary-impairment
loss on securities
|
26,693 | 2,724 | — | |||||||||
|
Loss
on investment securities - trading
|
443 | — | — | |||||||||
|
Loss/(Gain)
on investment securities – available for sale
|
(131 | ) | (727 | ) | 1,605 | |||||||
|
Increase
in accrued interest receivable and other
assets
|
(26,695 | ) | (7,296 | ) | (3,757 | ) | ||||||
|
Deferred
income taxes
|
(9,040 | ) | (3,147 | ) | 557 | |||||||
|
Increase
(decrease) in accrued interest payable and
other liabilities
|
5,753 | 1,634 | (1,307 | ) | ||||||||
|
Earnings
on bank owned life insurance
|
(559 | ) | (704 | ) | (1,114 | ) | ||||||
|
Net
cash provided by operating activities
|
4,794 | 17,442 | 14,484 | |||||||||
|
Investing
activities
|
||||||||||||
|
Proceeds
from maturities of investment securities available-for-sale
|
112,298 | 78,223 | 45,190 | |||||||||
|
Proceeds
from maturities of investment securities held-to-maturity
|
— | 9,000 | — | |||||||||
|
Proceeds
from sales/calls of investment securities available-for-sale
|
44,050 | 43,008 | — | |||||||||
|
Proceeds
from surrender of bank owned life insurance
|
10,916 | — | — | |||||||||
|
Purchases
of bank owned life insurance
|
(10,000 | ) | — | — | ||||||||
|
Purchases
of investment securities available-for-sale
|
(81,870 | ) | (224,110 | ) | (163,246 | ) | ||||||
|
Purchases
of investment securities held-to-maturity
|
— | (8,700 | ) | — | ||||||||
|
Proceeds
from sales of investment securities - trading
|
— | — | 71,611 | |||||||||
|
Proceeds
from sales of foreclosed real estate
|
1,307 | 427 | 21 | |||||||||
|
Net
increase in loans
|
(3,782 | ) | (97,589 | ) | (56,214 | ) | ||||||
|
Purchase
of mortgage loans
|
— | — | (24,955 | ) | ||||||||
|
Net
decrease/(increase) in FHLB stock
|
72 | (4,070 | ) | (243 | ) | |||||||
|
Acquisition
of insurance business
|
— | (2,446 | ) | (680 | ) | |||||||
|
Purchase
of premises and equipment
|
(3,314 | ) | (2,551 | ) | (4,135 | ) | ||||||
|
Net
cash provided by (used in) investing activities
|
69,677 | (208,808 | ) | (132,651 | ) | |||||||
|
Financing
activities
|
||||||||||||
|
Net
increase in deposits
|
81,277 | 96,337 | 155,171 | |||||||||
|
Net
decrease in short-term borrowings
|
(2,932 | ) | (4,617 | ) | (44,267 | ) | ||||||
|
Proceeds
from long-term borrowings
|
7,192 | 115,000 | 73,500 | |||||||||
|
Payments
on long-term borrowings
|
(14,051 | ) | (16,048 | ) | (61,379 | ) | ||||||
|
Proceeds
from issuance of preferred stock and warrants
|
30,000 | — | — | |||||||||
|
Cash
dividends paid on common stock
|
(4,893 | ) | (4,774 | ) | (4,796 | ) | ||||||
|
Proceeds
from issuance of common stock
|
488 | 362 | 476 | |||||||||
|
Preferred
stock dividends paid
|
(1,186 | ) | — | — | ||||||||
|
Repurchase
of common stock
|
— | (1,391 | ) | (524 | ) | |||||||
|
Net
cash provided by financing activities
|
95,895 | 184,869 | 118,181 | |||||||||
|
(Decrease)
increase in cash and cash equivalents
|
170,366 | (6,497 | ) | 14 | ||||||||
|
Cash
and cash equivalents at beginning of year
|
19,305 | 25,802 | 25,788 | |||||||||
|
Cash
and cash equivalents at end of year
|
$ | 189,671 | $ | 19,305 | $ | 25,802 | ||||||
|
Supplemental
information
|
||||||||||||
|
Interest
paid
|
$ | 33,538 | $ | 44,399 | $ | 48,790 | ||||||
|
Income
taxes paid
|
1,880 | 7,280 | 5,620 | |||||||||
|
Non-cash
investing activities:
|
||||||||||||
|
Transfers
from loans to foreclosed real estate
|
6,599 | 2,023 | 825 | |||||||||
|
Transfers
from available-for-sale securities to trading
|
443 | — | — | |||||||||
|
Restructured
loans
|
37,595 | 468 | — | |||||||||
See
notes to consolidated financial statements
[53]
First
United Corporation and Subsidiaries
Notes
to Consolidated Financial Statements
1. Summary
of Significant Accounting Policies
Business
First
United Corporation is a registered financial holding company that was
incorporated under the laws of the state of Maryland. It is the
parent company of First United Bank & Trust, a Maryland trust company
(“Bank”), First United Insurance Group, LLC, a full-service insurance agency
(“Insurance Group”), and First United Statutory Trust I (“Trust I”) and First
United Statutory Trust II (“Trust II”), both Connecticut statutory business
trusts and First United Statutory Trust III (“Trust III” and together with Trust
I and Trust II, the “Trusts”), a Delaware statutory business
trust. The Trusts were formed for the purpose of selling trust
preferred securities. The Bank has two wholly owned
subsidiaries: OakFirst Loan Center, Inc., a West Virginia consumer
finance company; and OakFirst Loan Center, LLC, a Maryland consumer finance
company, and holds 99.9% of the ownership interests (designated as limited
partnership interests) in Liberty Mews Limited Partnership, a Maryland limited
partnership formed for the purpose of acquiring, developing and operating
low-income housing units in Garrett County, Maryland (the
“Partnership”). First United Insurance Agency, Inc. a
subsidiary of OakFirst Loan Center, Inc., was merged into the Insurance Group
effective June 30, 2009. The Bank provides a complete range of retail
and commercial banking services to a customer base serviced by a network of 28
offices and 33 automated teller machines. This customer base includes
individuals, businesses and various governmental units. The Insurance
Group is a full-service insurance agency. First United Corporation
and its subsidiaries operate principally in four Western Maryland counties and
four West Virginia counties.
As used
in these Notes, unless the context requires otherwise, the terms “the
Corporation”, “we”, “us”, “our” and words of similar import refer collectively
to First United Corporation and its direct and indirect
subsidiaries.
Basis
of Presentation
The
accompanying consolidated financial statements have been prepared in accordance
with United States generally accepted accounting principles (“GAAP”) that
require management to make estimates and assumptions that affect the reported
amounts of certain assets and liabilities at the date of the financial
statements as well as the reported amount of revenues and expenses during the
reporting period. Actual results could differ from these
estimates. Material estimates that are particularly susceptible to
significant change in the near term relate to the determination of the allowance
for loan losses, the assessment of other-than-temporary impairment
pertaining to investment securities, potential impairment of goodwill, and the
valuation of deferred tax assets. For purposes of comparability, certain prior
period amounts have been reclassified to conform to the 2009
presentation. Such reclassifications had no impact on net
income.
The Corporation has evaluated events
and transactions occurring subsequent to the balance sheet date of December 31,
2009 for items that should potentially be recognized or disclosed in these
financial statements as prescribed by Accounting Standards Codification (“ASC”)
Topic 855, Subsequent
Events. The evaluation was conducted through the date these financial
statements were issued.
Principles
of Consolidation
The
consolidated financial statements of the Corporation include the accounts of the
Bank, the Insurance Group, OakFirst Loan Center, Inc. and OakFirst Loan Center,
LLC. All significant inter-company accounts and transactions have
been eliminated.
The
Corporation determines whether it has a controlling financial interest in an
entity by first evaluating whether the entity is a voting interest entity or a
variable interest entity (“VIE”) in accordance with GAAP. Voting
interest entities are entities in which the total equity investment at risk is
sufficient to enable the entity to finance itself independently and provides the
equity holders with the obligation to absorb losses, the right to receive
residual returns and the right to make financial and operating
decisions. The Corporation consolidates voting interest entities in
which it has 100%, or at least a majority, of the voting interest. As
defined in applicable accounting standards, a VIE is an entity that either (a)
does not have equity investors with voting rights or (b) has equity investors
that do not provide sufficient financial resources for the entity to support its
activities. A controlling financial interest in an entity exists when
an enterprise has a variable interest, or a combination of variable interests
that will absorb a majority of an entity’s expected losses, receive a majority
of an entity’s expected residual returns, or both. The enterprise
with a controlling financial interest, known as the primary beneficiary,
consolidates the VIE.
[54]
The Corporation accounts for its
investment in Liberty Mews Limited Partnership utilizing the effective yield
method under guidance that applies specifically to investments in limited
partnerships that operate qualified affordable housing
projects. Under the effective yield method, the investor recognizes
tax credits as they are allocated and amortizes the initial cost of the
investment to provide a constant effective yield over the period that tax
credits are allocated to the investor. The effective yield is the internal rate
of return on the investment, based on the cost of the investment and the
guaranteed tax credits allocated to the investor. The tax credit
allocated, net of the amortization of the investment in the limited partnership,
is recognized in the income statement as a component of income taxes
attributable to continuing operations.
Significant
Concentrations of Credit Risk
Most of the Corporation’s relationships
are with customers located in Western Maryland and Northeastern West
Virginia. At December 31, 2009, approximately 19%, or $210 million,
of total loans was loans secured by real estate construction and development
projects, with commercial real estate development loans comprising $152 million
of the total. Of the total, $139 million were performing according to their
contractual terms, $7 million were performing according to their modified terms,
$27 million have been identified as impaired based on management’s concerns
about the borrowers’ ability to comply with present repayment terms, and $37
million were non-performing at December 31, 2009. No industry or
borrower comprises greater than 10% of total loans as of December 31,
2009. Note 4 discusses the types of securities in which the
Corporation invests and Note 5 discusses the Corporation’s lending
activities. The Corporation does not have any significant
concentrations in any one industry or customer.
Investments
The
investment portfolio is classified and accounted for based on the guidance of
ASC Topic 320, Investments –
Debt and Equity Securities.
Securities held for trading:
Securities that are held principally for resale in the near future are reported
at their fair values as investment securities – trading, with changes in fair
value reported in earnings. Interest and dividends on trading
securities are included in interest income from investments. Net
trading losses shown in the Consolidated Statements of Income represent losses
from the transfer from securities available for sale to securities held for
trading.
Securities
available-for-sale: Securities classified as available-for-sale are
stated at their fair values with the unrealized gains and losses, net of tax,
reported as a separate component of accumulated other comprehensive income
(loss) (“AOCI”) in shareholders’ equity. The fair values of
investments are based upon information that is currently available and may not
necessarily represent amounts that will ultimately be realized, which depend on
future events and circumstances that are beyond the control of the
Corporation.
The
amortized cost of debt securities classified as available-for-sale is adjusted
for the amortization of premiums to the first call date, if applicable, or to
maturity, and for the accretion of discounts to maturity, or, in the case of
mortgage-backed securities, over the estimated life of the
security. Such amortization and accretion is included in interest
income from investments. Interest and dividends are included in
interest income from investments. Gains and losses on the sale of
securities are recorded using the specific identification method.
Management systematically evaluates
securities for impairment on a quarterly basis. Based upon
application of new accounting guidance for subsequent measurement in ASC Topic
320 (ASC Section 320-10-35), which the Corporation early adopted effective March
31, 2009 according to the effective date provisions of ASC Paragraph
320-10-65-1, management assesses whether (a) it has the intent to sell a
security being evaluated and (b) it is more likely than not that the Corporation
will be required to sell the security prior to its anticipated
recovery. If neither applies, then declines in the fair values of
securities below their cost that are considered other-than-temporary declines
are split into two components. The first is the loss attributable to
declining credit quality. Credit losses are recognized in earnings as
realized losses in the period in which the impairment determination is
made. The second component consists of all other losses, which are
recognized in other comprehensive loss. In estimating
other-than-temporary impairment losses, management considers (1) the length of
time and the extent to which the fair value has been less than cost, (2) adverse
conditions specifically related to the security, an industry, or a geographic
area, (3) the historic and implied volatility of the fair value of the security,
(4) changes in the rating of the security by a rating agency, (5) recoveries or
additional declines in fair value subsequent to the balance sheet date, (6)
failure of the issuer of the security to make scheduled interest or principal
payments, and (7) the payment structure of the debt security and the likelihood
of the issuer being able to make payments that increase in the
future. Management also monitors cash flow projections for securities
that are considered beneficial interests under the guidance of ASC Subtopic
325-40, Investments – Other –
Beneficial Interests in Securitized Financial Assets, (ASC Section
325-40-35). Further discussion about the evaluation of securities for impairment
can be found in Note 4.
[55]
Fair
Value
The Corporation determines fair value
of its investment securities and certain other assets in accordance with the
requirements of ASC Topic 820, Fair Value Measurements and
Disclosures, which defines fair value, establishes a framework for
measuring fair value and expands disclosures about fair value measurements
required under other accounting pronouncements. The Corporation
measures the fair market values of its investments based on the fair value
hierarchy established in Topic 820. Note 18 to the consolidated
financial statements includes the Corporation’s fair value
disclosures.
Restricted
Investment in Bank Stock
Restricted
stock, which represents required investments in the common stock of the Federal
Home Loan Bank (the “FHLB”) of Atlanta and Atlantic Central Bankers Bank, is
carried at cost and
is considered a long-term investment.
Management evaluates the
restricted stock for impairment in accordance with ASC Industry Topic 942,
Financial
Services – Depository and Lending, (ASC Section
942-325-35). Management’s evaluation of potential impairment is based
on management’s assessment of the ultimate
recoverability of the cost of the restricted stock rather than by recognizing
temporary declines in value. The determination of whether a
decline affects the ultimate recoverability is influenced by criteria such as
(1) the significance of the decline in net assets of the issuing bank as
compared to the capital stock amount for that bank and the length of time this
situation has persisted, (2) commitments by the issuing bank to make payments
required by law or regulation and the level of such payments in relation to the
operating performance of that bank, and (3) the impact of legislative and
regulatory changes on institutions and, accordingly, on the customer base of the
issuing bank.
On March 25, 2009, the FHLB of Atlanta
announced that it would not pay a dividend for the fourth quarter of
2008. During the first quarter of 2009, the Corporation reversed
approximately $28,000 in dividends that were accrued for the fourth quarter of
2008. On June 3, 2009, the FHLB of Atlanta announced that it would
not pay a dividend for first quarter of 2009. On August 12, 2009, the
FHLB of Atlanta announced that a dividend for the second quarter of 2009 would
be paid. A dividend of $29,000 was posted during the third quarter of
2009. The Corporation did not accrue any dividends for the third or
fourth quarters of 2009.
Management
believes that no impairment charge in respect of the restricted stock is
necessary as of December 31, 2009.
Loans
Loans and
leases that management has the intent and ability to hold for the foreseeable
future or until maturity or full repayment by the borrower are reported at their
outstanding unpaid principal balance, adjusted for any deferred fees or costs
pertaining to origination.
Interest
and Fees on Loans
Interest
on loans and leases (other than those on non-accrual status) is recognized based
upon the principal amount outstanding. Loan fees in excess of
the costs incurred to originate the loan are recognized as income over the life
of the loan utilizing either the interest method or the straight-line method,
depending on the type of loan. Generally, fees on loans with a
specified maturity date, such as residential mortgages, are recognized using the
interest method. Loan fees for lines of credit are recognized on the
straight-line method.
A loan is
considered to be past due when a payment has not been received for 30 days after
its contractual due date. It is the Corporation’s general policy to
discontinue the accrual of interest on loans (including impaired loans), except
for consumer loans, when circumstances indicate that collection of principal or
interest is doubtful. After a loan is placed on non-accrual status, interest is
not recognized and cash payments received are applied to the principal balances.
A non-accruing loan is restored to accrual status when principal and interest
payments have been brought current, it becomes well secured or is in the process
of collection and the prospects of future contractual payments are no longer in
doubt.
Generally,
consumer installment loans are not placed on non-accrual status, but are charged
off after they are 120 days contractually past due. Loans other than
consumer loans are charged-off based on an evaluation of the facts and
circumstances of each individual loan.
Allowance
for Loan Losses
The
allowance for loan losses is maintained at a level believed by management to be
sufficient to absorb estimated losses inherent in the loan portfolio. Loans
deemed uncollectible are charged off against the allowance, while recoveries of
amounts previously charged off are credited to it. Management’s determination of
the adequacy of the loan loss allowance is based upon several factors including
the impact of economic conditions on borrowers’ ability to repay their loans,
past collection experience, the risk characteristics of the loan portfolio,
estimated fair value of underlying collateral for collateral dependent loans,
and such other factors which in management’s judgment, deserve current
recognition.
[56]
The
Corporation utilizes the methodology outlined in the FDIC Statement of Policy on
Allowance for Loan and Lease Losses. The starting point for this methodology is
to segregate the loan portfolio into two pools, non-homogeneous (i.e.
commercial) and homogeneous (i.e. mortgage, consumer) loans. The two pools are
further segmented by loan type and by loan classification, including
uncriticized (pass), other assets especially mentioned and
substandard. The uncriticized (pass) pools for commercial real estate
and residential real estate are further segmented based upon the geographic
locations of the underlying collateral. Each loan pool is analyzed with general
allowances and specific allocations being made as appropriate. For general
allowances, the previous eight quarters of loss activity are used in the
estimation of losses in the current portfolio. These historical loss amounts are
modified by the following qualitative factors: levels of and trends in
delinquency and non-accruals; trends in volumes and terms of loans; effects of
changes in lending policies, experience, ability, and depth of management,
national and local economic trends and conditions; and concentrations of credit
in the determination of the general allowance. The qualitative factors are
updated each quarter by the gathering of information from internal, regulatory,
and governmental sources. Specific allocations are made for impaired loans in
which the collateral value, or the present value of expected future cash flows,
is less than the outstanding loan balance with the allocation being the dollar
difference between the two. The Corporation maintains a watchlist which
represents loans, identified and closely monitored by management, which possess
certain qualities or characteristics that may lead to collection and loss
issues. Allocations are not made for loans that are cash secured, for the Small
Business Administration or Farm Service Agency guaranteed portion of loans, or
for loans that are sufficiently collateralized.
Management
has made, and will continue to make every effort to work with our borrowers
during this distressed economic environment by formally restructuring loan terms
in a way that maximizes the ability of the Corporation to collect principal and
interest. Restructured terms can include temporary relief of contractual
principal payments, temporary or permanent reductions of the interest rate, and
maturity extensions. For loans that were originally interest only credit lines,
the restructured loan is placed on a principal amortization schedule if the
maturity date is extended. Restructured loans are evaluated for impairment as
required by applicable accounting guidance.
A loan is
considered impaired when, based on current information and events, it is
probable that the Corporation will be unable to collect the scheduled payments
of principal or interest when due according to the contractual terms of the loan
agreement. Factors considered by management in determining impairment
include payment status, collateral value, and the probability of collecting
scheduled principal and interest payments when due. Loans that
experience insignificant payment delays and payment shortfalls generally are not
classified as impaired. Management determines the significance of
payment delays and payment shortfalls on a case-by-case basis, taking into
consideration all of the circumstances surrounding the loan and the borrower,
including the length of the delay, the reasons for the delay, the borrower’s
prior payment record, and the amount of the shortfall in relation to the
principal and interest owed. Impairment is measured on a loan by loan
basis for commercial and construction loans. Large groups of smaller
balance homogeneous loans are collectively evaluated for
impairment. Accordingly, the Corporation does not separately identify
individual consumer and residential loans for impairment disclosures, unless
such loans are the subject of a restructuring agreement.
The
Corporation maintains an allowance for losses on unfunded commercial lending
commitments and letters of credit to provide for the risk of loss inherent in
these arrangements. The allowance is determined utilizing a
methodology that is similar to that used to determine the allowance for loan
losses, modified to take into account the probability of a draw down on the
commitment. This allowance is reported as a liability on the balance
sheet within accrued interest payable and other liabilities. The
balance in the liability account was $45,000 at December 31, 2009.
Premises
and Equipment
Land is
carried at cost. Premises and equipment are carried at cost, less
accumulated depreciation. The provision for depreciation for financial reporting
has been made by using the straight-line method based on the estimated useful
lives of the assets, which range from 18 to 32 years for buildings and three to
20 years for furniture and equipment. Accelerated depreciation methods are used
for income tax purposes.
Goodwill
and Other Intangible Assets
Goodwill
represents the excess of the cost of an acquisition over the fair value of the
net assets acquired in business combinations. In accordance with ASC
Topic 350, Intangibles -
Goodwill and Other, goodwill is not amortized but is subject to an annual
impairment test.
Other
intangible assets with finite lives include core deposit intangible assets,
which represent the present value of future net income to be earned from
acquired deposits. Core deposit intangibles are being amortized using
the straight-line method over their estimated life of 7.2
years. Insurance agency book of business intangibles are being
amortized using the straight-line method over their estimated
lives.
[57]
Bank-Owned
Life Insurance (BOLI)
BOLI
policies are recorded at their cash surrender values. Changes in the cash
surrender values are recorded as other operating income.
Foreclosed
Assets
Assets acquired through, or in lieu of,
loan foreclosure are held for sale and are initially recorded at fair value less
cost to sell at the date of foreclosure, establishing a new cost
basis. Subsequent to foreclosure, valuations are periodically
performed by management and the assets are carried at the lower of carrying
amount or fair value less cost to sell. Revenue and expenses from
operations and changes in the valuation allowance are included in net expenses
from foreclosed assets. Foreclosed assets are included in accrued
interest receivable and other assets and were $7,591,000 and $2,424,000,
respectively, at December 31, 2009 and 2008.
Income
Taxes
The
Corporation and its subsidiaries file a consolidated federal income tax
return. The Corporation accounts for income taxes using the liability
method. Under the liability method, the deferred tax liability or asset is
determined based on the difference between the financial statement and tax bases
of assets and liabilities (temporary differences) and is measured at the enacted
tax rates that will be in effect when these differences reverse. Deferred tax
expense is determined by the change in the net liability or asset for deferred
taxes adjusted for changes in any deferred tax asset valuation
allowance.
ASC Topic
740, Taxes, provides
clarification on accounting for uncertainty in income taxes recognized in an
enterprise’s financial statements and prescribes a recognition threshold and
measurement attribute for the financial statement recognition and measurement of
a tax position taken or expected to be taken in a tax return. The
Corporation has not identified any income tax uncertainties.
The
Corporation files federal and state corporate income tax returns
annually. These returns may be selected for examination by the
Internal Revenue Service and the states where we file, subject to a statute of
limitations. At any given point in time, the Corporation may have
several years of filed tax returns that may be selected for examination or
review by taxing authorities. With few exceptions, the Corporation is
no longer subject to U.S. Federal, State, and local income tax examinations by
tax authorities for years prior to 2006.
The
Corporation recognizes interest and penalties on income taxes as a component of
income tax expense.
Defined
Benefit Plans
The Corporation accounts for its defined benefits pension
plan and supplemental executive retirement plan in accordance with ASC Topic
715, Compensation – Retirement
Benefits. Under the provisions of Topic 715, the funded status of its
defined benefits pension plan is recognized as an asset, and its supplemental
executive retirement plan is recognized as a liability on the Consolidated
Statements of Financial Condition, and unrecognized net actuarial losses, prior
service costs and a net transition asset are recognized as a separate component
of accumulated other comprehensive loss, net of tax. Refer to Note 13
for a further discussion of the Corporation’s pension plan and supplemental
executive retirement plan obligations.
Statement
of Cash Flows
Cash and
cash equivalents are defined as cash and due from banks and interest bearing
deposits in banks in the Consolidated Statements of Cash Flows.
Trust
Assets and Income
Assets
held in an agency or fiduciary capacity are not assets of the Corporation and,
accordingly, are not included in the accompanying consolidated statements of
financial condition. Income from the Bank’s trust department represents fees
charged to customers and is recorded on an accrual basis.
[58]
Business
Segments
As
defined by ASC Topic 280, Segment Reporting, the
Corporation has two operating segments, community banking and insurance. Because
the operating activities of the insurance segment are immaterial to the
consolidated financial statements, no separate segment disclosures for insurance
operations have been made.
Equity
Compensation Plan
At the 2007 Annual Meeting of
Shareholders, the Corporation’s shareholders approved the First United
Corporation Omnibus Equity Compensation Plan (the “Omnibus Plan”), which
authorizes the grant of stock options, stock appreciation rights, stock awards,
stock units, performance units, dividend equivalents, and other stock-based
awards to employees or directors totaling up to 185,000 shares.
On June 18, 2008, the Board of
Directors of the Corporation adopted a Long-Term Incentive Program (the
“LTIP”). This program was adopted as a sub-plan of the Corporation’s
Omnibus Equity Compensation Plan to reward participants for increasing
shareholder value, align executive interests with those of shareholders, and
serve as a retention tool for key executives. Under the LTIP,
participants are granted shares of restricted common stock of the
Corporation. The amount of an award is based on a specified
percentage of the participant’s salary as of the date of grant. These
shares will vest if the Corporation meets or exceeds certain performance
thresholds.
The
Corporation complies with the provisions of ASC Topic 718, Compensation-Stock Compensation, in
measuring and disclosing stock compensation cost. The
measurement objective in ASC Paragraph 718-10-30-6 requires public companies to
measure the cost of employee services received in exchange for an award of
equity instruments based on the grant date fair value of the
award. The cost is recognized in expense over the period in which an
employee is required to provide service in exchange for the award (the vesting
period). The performance-related shares granted in connection with
the LTIP are expensed ratably from the date that the likelihood of meeting the
performance measures is probable through the end of a three year vesting
period.
During
the second quarter 2009, management determined that the likelihood of meeting
the performance measures set forth with the 2008 LTIP stock grant would not be
probable. Therefore, under the guidance of ASC Paragraph
718-10-25-20, the shares are considered unissued and the share-based
compensation expense of approximately $80,000 recognized in 2008 was reversed
effective June 30, 2009.
The
American Recovery and Reinvestment Act of 2009 (the “Recovery Act”) imposes
restrictions on the type and timing of bonuses and incentive compensation that
may be accrued for or paid to certain employees of institutions that
participated in Treasury’s Capital Purchase Program. The Recovery Act
generally limits bonuses and incentive compensation to grants of long-term
restricted stock that, among other requirements, cannot fully vest until the
Capital Purchase Program assistance is repaid, but certain types of
compensation, including the Corporation’s 2008 restricted stock grants, are
grandfathered.
Stock-based
awards were made to directors in May 2009. This award totaled 5,655
shares at a fair market price of $11.48 per share and is part of their annual
compensation package. The directors’ shares were vested
immediately. Director stock compensation expense was $65,000, $70,000
and $0 for years ended December 31, 2009, 2008 and 2007,
respectively.
Stock
Repurchases
Under the Maryland General Corporation
Law, shares of capital stock that are repurchased are cancelled and treated as
authorized but unissued shares. When a share of capital stock is
repurchased, the payment of the repurchase price reduces stated capital by the
par value of that share (currently, $0.01 for common stock and $0.00 for
preferred stock), and any excess over par value reduces capital
surplus.
Variable
Interest Entities
In March
2004, First United Corporation issued approximately $30.9 million of junior
subordinated debentures to Trust I and Trust II which are Connecticut statutory
business trusts formed for the purpose of selling mandatorily redeemable
preferred capital securities to third party investors. All of the
outstanding common equity interests in Trust I and Trust II are held by First
United Corporation. Trust I and Trust II used the proceeds from these
offerings to purchase junior subordinated debentures from First United
Corporation.
In
December 2004, First United Corporation issued $5.0 million of junior
subordinated debentures to a third party investor.
[59]
In
December 2009, First United Corporation issued approximately $7.2 million of
junior subordinated debentures to Trust III, which is a Delaware statutory
business trust formed for the purpose of selling mandatorily redeemable
preferred capital securities to third party investors. All of the
outstanding common equity interests in Trust III are held by First United
Corporation. Trust III used the proceeds from its offering to
purchase junior subordinated debentures from First United
Corporation.
The
Trusts are considered variable interest entities (VIEs), but are not
consolidated because the Corporation is not the primary
beneficiary. The Corporation reported the $43.1 million of junior
subordinated debentures as long-term borrowings and its $1.1 million equity
interest in the Trusts as “Other Assets” at December 31, 2009. These
debentures and preferred securities are discussed in detail in Note
9.
In November 2009, the Bank became a
99.99% limited partner in Liberty Mews Limited Partnership, a Maryland limited
partnership formed for the purpose of acquiring, developing and operating
low-income housing units in Garrett County, Maryland. The Bank’s capital
contribution to the Partnership totals $6.1 million and will be paid in to the
partnership over approximately 13 months. Once the project is
complete, estimated to be December 2010, and certain qualifying hurdles are met
and maintained, the Bank will be entitled to $8.4 million in federal investment
tax credits over a 10 year period. The Bank has no voting rights and
is not in any way involved in the daily management of the limited
partnership. At December 31, 2009 the Bank had made one contribution,
totaling $0.55 million. The Liberty Mews Limited Partnership is
considered a VIE but is not consolidated because the Bank is not the primary
beneficiary.
Recent
Accounting Pronouncements
In
January 2010, the FASB amended fair value measurement and disclosure guidance in
Accounting Standards Updates (“ASU”) No. 2010-6 to require disclosure of
significant transfers in and out of Level 1 and Level 2 fair value measurements
and the reasons for the transfers and to require separate presentation of
information about purchases, sales, issuances, and settlements in the roll
forward of activity in Level 3 fair value measurements. The amended guidance
also clarifies existing requirements that (i) fair value measurement disclosures
should be disaggregated for each class of asset and liability and (ii)
disclosures about valuation techniques and inputs for both recurring and
nonrecurring Level 2 and Level 3 fair value measurements should be provided. The
guidance is effective for interim and annual periods beginning after December
15, 2009, except for the disclosures about purchases, sales, issuances, and
settlements in the roll forward of activity in Level 3 fair value measurements,
which are effective for fiscal years beginning after December 15, 2010 and for
interim periods within those years. The adoption of this guidance will not
impact the Corporation’s financial position or results of
operations.
In June
2009, the Financial Accounting Standards Board (“FASB”) issued Statement of
Financial Accounting Standards (“SFAS”) No. 168, The FASB Accounting Standards Codification
and the Hierarchy of
Generally Accepted Accounting Principles – a replacement of FASB Statement No.
162, (“SFAS 168”). SFAS 168 established the ASC as the source of
authoritative GAAP for nongovernmental entities. The Codification
does not change GAAP. Instead, it takes the thousands of individual
pronouncements the currently comprise GAAP and reorganizes them into
approximately 90 accounting Topics, and displays all Topics using a consistent
structure. Contents in each Topic are further organized first by
Subtopic, then Section and finally Paragraph. The Paragraph level is
the only level that contains substantive content. Citing particular
content in the Codification involves specifying the unique numeric path to the
content through the Topic, Subtopic, Section and Paragraph
structure. Changes to the ASC subsequent to June 30, 2009 are
referred to as Accounting Standards Updates.
In
conjunction with the issuance of SFAS 168, the FASB also issued its first ASU
No. 2009-1, “Topic 105 – Generally Accepted Accounting Principles” (“ASU
2009-1”) which included SFAS 168 in its entirety as a transition to the
ASC. ASU 2009-1 was effective for interim and annual periods ending
after September 15, 2009 and did not have an impact on the Corporation’s
financial position or results of operations but did change the referencing
system for accounting standards.
In June
2009, the FASB issued ASC Topic 855, Subsequent Events, to
establish general standards of accounting and disclosure for subsequent
events. The guidance, which only applies to the accounting and
disclosure of subsequent events that are not addressed in other applicable GAAP,
establishes the period through which an entity should evaluate events for
possible recognition or disclosure in the financial statements; requires
disclosure of the date through which the subsequent events evaluation ended, and
whether it is the issued date or available to be issued date; and provides
examples of subsequent events that a company is required to recognize, as well
as those that a company is required to disclose, but not
recognize. For calendar year entities, the guidance became effective
for the quarter ending on June 30, 2009 (See Note 1).
[60]
In June
2009, the FASB issued SFAS No. 166, Accounting for Transfers of
Financial Assets, an amendment of FASB Statement No. 140, which was codified in
December 2009 as ASU No. 2009-16, Accounting for Transfers of
Financial Assets (“ASU
2009-16”). This statement
prescribes the information that a reporting entity must provide in its financial
reports about a transfer of financial assets; the effects of a transfer on its
financial position, financial performance and cash flows; and a transferor’s
continuing involvement in transferred financial assets. Specifically,
among other aspects, ASU 2009-16 amends the guidance found in ASC Topic 860,
Transfers and
Servicing, by removing the concept of a qualifying special-purpose entity
and by modifying the financial-components approach used in Topic 860. The
amended guidance is effective for fiscal years beginning after November 15,
2009. The Corporation is currently evaluating the effect that the
adoption of ASU 2009-16 may have on its financial position and results of
operations.
In June
2009, the FASB issued SFAS No. 167, Amendments to FASB Interpretation
No. 46(R) which was codified in December 2009 as ASU No.
2009-17, Improvements to
Financial Reporting by Enterprises Involved with Variable Interest Entities
(“ASU 2009-17”). This statement
amends guidance found in ASC Topic 810, Consolidation, that required
an enterprise to determine whether it’s variable interest or interests give it a
controlling financial interest in a VIE. Under ASU 2009-17, the
primary beneficiary of a VIE is the enterprise that has both (1) the power
to direct the activities of a VIE that most significantly impact the entity’s
economic performance and (2) the obligation to absorb losses of the entity
that could potentially be significant to the VIE or the right to receive
benefits from the entity that could potentially be significant to the
VIE. ASU 2009-17 also amends Topic 810 to require ongoing
reassessments of whether an enterprise is the primary beneficiary of a
VIE. The amended guidance is effective for fiscal years beginning
after November 15, 2009 and is not anticipated to have any material effect on
the Corporation’s consolidated financial statements.
2. Earnings
Per Share
Basic earnings/(loss) per common share
is derived by dividing net income/(loss) available to common shareholders by the
weighted-average number of common shares outstanding during the period and does
not include the effect of any potentially dilutive common stock
equivalents. Diluted earnings/(loss) per share is derived by dividing
net income/(loss) available to common shareholders by the weighted-average
number of shares outstanding, adjusted for the dilutive effect of outstanding
common stock equivalents. There is no dilutive effect on the
earnings/(loss) per share during loss periods.
The following table sets forth the
calculation of basic and diluted earnings/(loss) per common share for the years
ended December 31, 2009 and 2008 (in thousands, except for per share
amounts):
|
For
the year ended
|
|||||||||||||||||||||||||||||||||||
|
December
31,
2009
|
December
31,
2008
|
December
31,
2007
|
|||||||||||||||||||||||||||||||||
|
Loss
|
Average
Shares
|
Per
Share
Amount
|
Income
|
Average
Shares
|
Per
Share
Amount
|
Income
|
Average
Shares
|
Per
Share
Amount
|
|||||||||||||||||||||||||||
|
Basic
Earnings Per
Share:
|
|||||||||||||||||||||||||||||||||||
|
Net
(loss)/income
|
$ | (11,324 | ) | $ | 8,871 | $ | 12,793 | ||||||||||||||||||||||||||||
|
Accumulated
preferred stock dividends
|
(1,378 | ) | — | — | |||||||||||||||||||||||||||||||
|
Discount
accretion on preferred stock
|
(52 | ) | — | — | |||||||||||||||||||||||||||||||
|
Net
(loss) attributable to/income available to common
shareholders
|
$ | (12,754 | ) | 6,122 | $ | (2.08 | ) | $ | 8,871 | 6,113 | $ | 1.45 | $ | 12.793 | 6,149 | $ | 2.08 | ||||||||||||||||||
|
Diluted
Earnings Per Share:
|
|||||||||||||||||||||||||||||||||||
|
Net
(loss)/income available to common shareholders
|
$ | (12,754 | ) | 6,122 | $ | (2.08 | ) | $ | 8,871 | 6,113 | $ | 1.45 | $ | 12,793 | 6,149 | $ | 2.08 | ||||||||||||||||||
|
Non-vested
employee stock award
|
18 | ||||||||||||||||||||||||||||||||||
|
Diluted
net (loss) attributable to/income available to common
shareholders
|
$ | (12,754 | ) | 6,122 | $ | (2.08 | ) | $ | 8,871 | 6,131 | $ | 1.45 | $ | 12,793 | 6,149 | $ | 2.08 | ||||||||||||||||||
[61]
3. Regulatory
Capital Requirements
The
Corporation and the Bank are subject to various regulatory capital requirements
administered by the federal banking agencies. Failure to meet minimum
capital requirements can initiate certain mandatory and possibly additional
discretionary actions by regulators that, if undertaken, could have a direct
material effect on the financial statements. Under capital adequacy
guidelines and the regulatory framework for prompt corrective action, the
Corporation and the Bank must meet specific capital guidelines that involve
quantitative measures of its assets, liabilities, and certain off-balance sheet
items as calculated under regulatory accounting practices. The
capital amounts and classification are also subject to qualitative judgments by
the regulators about components, risk weightings, and other
factors.
Quantitative
measures established by regulation to ensure capital adequacy require the
Corporation and the Bank to maintain certain minimum amounts of capital and
ratios of total and Tier I capital to risk-weighted assets, and of Tier I
capital to average assets (leverage). Management believes, as of
December 31, 2009, that the Corporation and the Bank meet all capital adequacy
requirements to which they are subject.
As of
December 31, 2009, the most recent notification from regulatory agencies
categorized the Bank as “well capitalized” under the regulatory framework for
prompt corrective action. For a financial institution to be
categorized as well capitalized, total risk-based, Tier I risk-based, and Tier I
leverage ratios must not fall below the percentages shown in the following
table. Management is not aware of any condition or event which has
caused the well capitalized position to change.
|
Actual
|
For Capital
Adequacy Purposes
|
To Be Well
Capitalized Under
Prompt Corrective
Action Provisions
|
||||||||||||||||||||||
|
(Dollars in thousands)
|
Amount
|
Ratio
|
Amount
|
Ratio
|
Amount
|
Ratio
|
||||||||||||||||||
|
December
31, 2009
|
||||||||||||||||||||||||
|
Total
Capital (to Risk Weighted Assets)
|
||||||||||||||||||||||||
|
Consolidated
|
$ | 167,762 | 11.20 | % | $ | 119,843 | 8.00 | % | N/A | N/A | ||||||||||||||
|
First
United Bank
|
165,256 | 11.05 | % | 119,679 | 8.00 | % | 149,599 | 10.00 | % | |||||||||||||||
|
Tier
1 Capital (to Risk Weighted Assets)
|
||||||||||||||||||||||||
|
Consolidated
|
143,843 | 9.60 | % | 59,922 | 4.00 | % | N/A | N/A | ||||||||||||||||
|
First
United Bank
|
146,377 | 9.78 | % | 59,839 | 4.00 | % | 89,759 | 6.00 | % | |||||||||||||||
|
Tier
1 Capital (to Average Assets)
|
||||||||||||||||||||||||
|
Consolidated
|
143,843 | 8.53 | % | 67,423 | 4.00 | % | N/A | N/A | ||||||||||||||||
|
First
United Bank
|
146,377 | 8.73 | % | 67,086 | 4.00 | % | 83,858 | 5.00 | % | |||||||||||||||
|
Actual
|
For Capital
Adequacy Purposes
|
To Be Well
Capitalized Under
Prompt Corrective
Action Provisions
|
||||||||||||||||||||||
|
(Dollars in thousands)
|
Amount
|
Ratio
|
Amount
|
Ratio
|
Amount
|
Ratio
|
||||||||||||||||||
|
December
31, 2008
|
||||||||||||||||||||||||
|
Total
Capital (to Risk Weighted Assets)
|
||||||||||||||||||||||||
|
Consolidated
|
$ | 148,464 | 12.18 | % | $ | 97,541 | 8.00 | % | N/A | N/A | ||||||||||||||
|
First
United Bank
|
131,572 | 10.91 | % | 96,521 | 8.00 | % | 120,652 | 10.00 | % | |||||||||||||||
|
Tier
1 Capital (to Risk Weighted Assets)
|
||||||||||||||||||||||||
|
Consolidated
|
129,117 | 10.59 | % | 48,771 | 4.00 | % | N/A | N/A | ||||||||||||||||
|
First
United Bank
|
117,398 | 9.73 | % | 48,260 | 4.00 | % | 72,391 | 6.00 | % | |||||||||||||||
|
Tier
1 Capital (to Average Assets)
|
||||||||||||||||||||||||
|
Consolidated
|
129,117 | 8.10 | % | 63,751 | 4.00 | % | N/A | N/A | ||||||||||||||||
|
First
United Bank
|
117,398 | 7.43 | % | 63,205 | 4.00 | % | 79,007 | 5.00 | % | |||||||||||||||
[62]
4. Investment
Securities
The following table shows a comparison
of amortized cost and fair values of investment securities available-for-sale
(in thousands):
|
Amortized
Cost
|
Gross
Unrealized
Gains
|
Gross
Unrealized
Losses
|
Fair
Value
|
OTTI in
AOCI
|
||||||||||||||||
|
December
31, 2009
|
||||||||||||||||||||
|
U.S.
government agencies
|
$ | 68,487 | $ | 274 | $ | 498 | $ | 68,263 | $ | — | ||||||||||
|
Residential
mortgage-backed agencies
|
59,640 | 2,946 | 13 | 62,573 | — | |||||||||||||||
|
Collateralized
mortgage obligations
|
40,809 | 7,612 | 33,197 | 1,574 | ||||||||||||||||
|
Obligations
of states and political subdivisions
|
95,190 | 2,501 | 388 | 97,303 | — | |||||||||||||||
|
Collateralized
debt obligations
|
44,478 | — | 32,030 | 12,448 | 14,127 | |||||||||||||||
|
Totals
|
$ | 308,604 | $ | 5,721 | $ | 40,541 | $ | 273,784 | $ | 15,701 | ||||||||||
|
December
31, 2008
|
||||||||||||||||||||
|
U.S.
government agencies
|
$ | 111,938 | $ | 1,885 | $ | 178 | $ | 113,645 | $ | — | ||||||||||
|
Residential
mortgage-backed agencies
|
80,354 | 2,222 | 15 | 82,561 | — | |||||||||||||||
|
Collateralized
mortgage obligations
|
51,753 | — | 11,115 | 40,638 | — | |||||||||||||||
|
Obligations
of states and political subdivisions
|
95,876 | 705 | 3,096 | 93,485 | — | |||||||||||||||
|
Collateralized
debt obligations
|
70,324 | — | 46,058 | 24,266 | — | |||||||||||||||
|
Totals
|
$ | 410,245 | $ | 4,812 | $ | 60,462 | $ | 354,595 | $ | — | ||||||||||
Proceeds
from sales of securities and the realized gains and losses are as follows (in
thousands):
|
2009
|
2008
|
2007
|
||||||||||
|
Proceeds
|
$ | 12,471 | $ | 43,008 | $ | 71,611 | ||||||
|
Realized
gains
|
30 | 727 | 10 | |||||||||
|
Realized
losses
|
— | — | (1,615 | ) | ||||||||
The
following table shows the Corporation’s securities available-for-sale with gross
unrealized losses and fair value, aggregated by investment category and length
of time that individual securities have been in a continuous unrealized
position, at December 31, 2009 and 2008 (in thousands):
|
December 31, 2009
|
||||||||||||||||
|
Less than 12 months
|
12 months or more
|
|||||||||||||||
|
Fair
Value
|
Unrealized
Losses
|
Fair
Value
|
Unrealized
Losses
|
|||||||||||||
|
U.S.
government agencies
|
$ | 36,090 | $ | 371 | $ | 14,873 | $ | 127 | ||||||||
|
Residential
mortgage-backed agencies
|
589 | 13 | — | — | ||||||||||||
|
Collateralized
mortgage obligations
|
— | — | 33,197 | 7,612 | ||||||||||||
|
Obligations
of states and political subdivisions
|
12,154 | 123 | 8,075 | 265 | ||||||||||||
|
Collateralized
debt obligations
|
— | — | 12,448 | 32,030 | ||||||||||||
| $ | 48,833 | $ | 507 | $ | 68,593 | $ | 40,034 | |||||||||
[63]
|
December 31, 2008
|
||||||||||||||||
|
Less than 12 months
|
12 months or more
|
|||||||||||||||
|
Fair
Value
|
Unrealized
Losses
|
Fair
Value
|
Unrealized
Losses
|
|||||||||||||
|
U.S.
government agencies
|
$ | 19,822 | $ | 178 | $ | — | $ | — | ||||||||
|
Residential
mortgage-backed agencies
|
806 | 15 | — | — | ||||||||||||
|
Collateralized
mortgage obligations
|
37,423 | 9,927 | 3,216 | 1,188 | ||||||||||||
|
Obligations
of states and political subdivisions
|
66,735 | 2,781 | 3,632 | 315 | ||||||||||||
|
Collateralized
debt obligations
|
2,159 | 5,393 | 21,724 | 40,665 | ||||||||||||
| $ | 126,945 | $ | 18,294 | $ | 28,572 | $ | 42,168 | |||||||||
U.S. Government Agencies
– The unrealized losses on the Corporation’s investments in U.S.
government agencies of $498,000 are attributable to the lower interest rate
environment and call features associated with the securities with premiums paid
at the time of purchase. All of these securities are of the highest
investment grade. The fair value of one security has been impaired
for over 12 months and the fair value of six securities has been impaired for
less than 12 months. Contractually, the issuers are not permitted to
settle the securities at a price less than the amortized cost basis of the
individual investments. The Corporation does not intend to sell these
investments and it is not more likely than not that the Corporation will be
required to sell the investments before recovery of their amortized cost bases,
which may be at maturity. Accordingly, management does not consider
these investments to be other-than-temporarily impaired at December 31,
2009.
Residential Mortgage-Backed
Agencies - The residential mortgage-backed agencies were in an unrealized
gain position of $2.9 million at December 31, 2009. All of these
securities are of the highest investment grade. The fair value of 13
of these securities has been in an unrealized loss position for less than 12
months. The Corporation does not intend to sell these
investments and it is not more likely than not that the Corporation will be
required to sell the investments before recovery of their amortized cost bases,
which may be at maturity. Management does not believe that other-than-temporary
impairment exists at December 31, 2009.
Collateralized Mortgage
Obligations – The collateralized mortgage obligations were in an
unrealized loss position of $7.6 million at December 31, 2009. All
nine of these securities are private label residential mortgage-backed
securities and have been in an unrealized loss position for 12 months or
more. These securities are reviewed for factors such as loan to value
ratio, credit support levels, borrower FICO scores, geographic concentration,
prepayment speeds, delinquencies, coverage ratios and credit
ratings. The Corporation purchased all of these securities at a
discount relative to their face amounts. All of these securities were
of the highest investment grade at the time of purchase. As of
December 31, 2009, two have been downgraded to one level below investment grade
and five have been downgraded more than one level below investment
grade. All of these securities continue to perform as expected at the
time of purchase. This class of securities has been reduced by $10.9
million since December 31, 2008 due to principal paydown. Based upon
a review of credit quality and the cash flow tests performed, management
determined that one of the private label residential mortgage-backed securities
in the Corporation’s portfolio was other-than-temporarily
impaired. As a result of this assessment, the Corporation recorded a
$171,000 million other-than-temporary impairment credit loss and $1.6 million of
non-credit related losses in other comprehensive income on this security as of
December 31, 2009. The Corporation does not intend to sell these
investments and it is not more likely than not that the Corporation will be
required to sell the investments before recovery of their amortized cost bases,
which may be at maturity. Accordingly, management does not consider
the remainder of this portfolio to be other-than-temporarily impaired at
December 31, 2009.
Obligations of State and
Political Subdivisions – The Corporation’s investments in state and
political subdivisions were in an unrealized loss position of
$388,000 at December 31, 2009. Ten securities carried a fair value
less than amortized cost basis for over 12 months, and 19 securities have been
in an unrealized loss position for less than 12 months. $2.3 million
of the bonds are not rated by rating agencies. Two of those bonds were highly
rated investment grade bonds at the time of purchase are no longer being rated
by the rating agencies. The remaining investments
in states and other political subdivisions are all of investment grade as
determined by the major rating agencies. Management reviewed the
investment ratings of the underlying issuers and found them to be of high
quality. In addition, the portfolio is supported by various forms of underlying
insurance. Management believes that this portfolio is well-diversified
throughout the United States, and all bonds continue to perform according to
their contractual terms. The Corporation does not intend to sell
these investments and it is not more likely than not that the Corporation will
be required to sell the investments before recovery of their amortized cost
bases, which may be at maturity. Accordingly, management does not
consider these investments to be other-than-temporarily impaired at December 31,
2009.
[64]
Collateralized Debt
Obligations - The $32.0 million in unrealized losses reported for
collateralized debt obligations at December 31, 2009 relates to 22 pooled trust
preferred securities. See Note 1 for a discussion of the methodology
used by management to determine the fair values of these
securities. Based upon a review of credit quality for the fourth
quarter of 2009, the cash flow tests performed, and the Corporation’s intent
with regard to hold the securities, management determined that nine of the
collateralized debt obligations in the Corporation’s portfolio were
other-than-temporarily impaired. As a result of this assessment, the
Corporation recorded a $15.8 million other-than-temporary impairment loss on
these securities as of December 31, 2009. For the year, $26.5 million
of non-cash other-than-temporary credit losses have been recognized in earnings
on 15 trust preferred securities and $443,000 of losses have been recognized as
a result of moving four securities to trading. The unrealized losses
on the remaining investment securities are primarily attributable to factors
such as changes in market interest rates, marketability, liquidity and the
current economic environment. Non-credit related losses of $14.1
million are in other comprehensive income. Non-cash
other-than-temporary impairment losses for the year ended December 31, 2008 were
$2.7 million.
The
following table presents a cumulative roll-forward of the amount of
other-than-temporary impairment (“OTTI”) related to credit losses which have
been recognized in earnings for debt securities held and not intended to be sold
(in thousands):
|
December 31, 2009
|
December 31, 2008
|
|||||||
|
Balance
of credit-related OTTI at beginning of period
|
$ | 2,724 | $ | — | ||||
|
Additions
for credit-related OTTI not previously recognized
|
16,345 | 2,724 | ||||||
|
Additional
increases for credit-related OTTI previously recognized when there is no
intent to sell and no requirements to sell before recovery of amortized
cost basis
|
— | — | ||||||
|
Decreases
for previously recognized credit-related OTTI because there is current
intent to sell
|
(8,304 | ) | — | |||||
|
Balance
of credit-related OTTI at end of period
|
$ | 10,765 | $ | 2,724 | ||||
The
amortized cost and estimated fair value of securities available-for-sale by
contractual maturity at December 31, 2009 are shown in the following table (in
thousands). Actual maturities will differ from contractual maturities
because the issuers of the securities may have the right to call or prepay
obligations with or without call or prepayment penalties.
|
Contractual
Maturity
|
Amortized
Cost
|
Fair
Value
|
||||||
|
Due
in one year or less
|
$ | — | $ | — | ||||
|
Due
after one year through five years
|
14,095 | 14,294 | ||||||
|
Due
after five years through ten years
|
26,687 | 27,367 | ||||||
|
Due
after ten years
|
167,373 | 136,353 | ||||||
| 208,155 | 178,014 | |||||||
|
Residential
mortgage-backed agencies
|
59,640 | 62,573 | ||||||
|
Collateralized
mortgage obligations
|
40,809 | 33,197 | ||||||
| $ | 308,604 | $ | 273,784 | |||||
At
December 31, 2009 and 2008, investment securities with a fair value of $153
million and $235 million, respectively, were pledged as permitted or required to
secure public and trust deposits, for securities sold under agreements to
repurchase as required or permitted by law and as collateral for borrowing
capacity.
[65]
5. Loans
The
Corporation, through the Bank, is active in originating loans to customers
primarily in Western Maryland and Northeastern West Virginia. The
following table is a summary of the loan portfolio and loan commitments by
principal categories (in thousands):
|
December
31, 2009
|
December
31, 2008
|
|||||||||||||||
|
Loans
|
Loan
Commitments
|
Loans
|
Loan
Commitments
|
|||||||||||||
|
Commercial
|
$ | 604,410 | $ | 33,966 | $ | 575,962 | $ | 88,640 | ||||||||
|
Real
Estate – Mortgage
|
398,413 | 46,461 | 403,768 | 44,304 | ||||||||||||
|
Consumer
Installment
|
110,937 | 3,911 | 140,234 | 3,897 | ||||||||||||
|
Real
Estate – Construction
|
8,124 | 2,918 | 14,582 | 5,441 | ||||||||||||
|
Commercial
letters of credit
|
— | 2,941 | — | 5,943 | ||||||||||||
|
Total
|
$ | 1,121,884 | $ | 90,197 | $ | 1,134,546 | $ | 148,225 | ||||||||
Loan
commitments are made to accommodate the financial needs of the Corporation’s
customers. Letters of credit commit the Corporation to make payments on behalf
of customers when certain specified future events occur. Letters of
credit are issued to customers to support contractual obligations and to insure
job performance. Commitments to extend credit generally have fixed expiration
dates, may require payment of a fee, and contain cancellation clauses in the
event of an adverse change in the customer’s credit
quality. Historically, most letters of credit expire unfunded, and
therefore, cash requirements are substantially less than the total
commitment. Loan commitments and letters of credit have credit risk
essentially the same as that involved in extending loans to customers and are
subject to normal credit policies. Collateral is obtained based on
management’s credit assessment of the customer. The Corporation
considers letters of credit to be guarantees and the amount of liability related
to such guarantees was not significant at December 31, 2009 and
2008.
In the
ordinary course of business, executive officers and directors of the
Corporation, including their families and companies in which certain directors
are principal owners, were loan customers of the Bank. Pursuant to
the Bank’s lending policies, such loans were made on the same terms, including
collateral, as those prevailing at the time for comparable transactions with
unrelated persons and do not involve more than the normal risk of
collectability. Changes in the dollar amount of loans outstanding to
officers, directors and their associates were as follows for the year ended
December 31 (in thousands):
|
2009
|
||||
|
Balance
at January 1
|
$ | 14,226 | ||
|
Loans
or advances
|
1,177 | |||
|
Repayments
|
(2,133 | ) | ||
|
Balance
at December 31
|
$ | 13,270 | ||
Activity
in the allowance for loan losses is summarized as follows (in
thousands):
|
2009
|
2008
|
2007
|
||||||||||
|
Balance
at January 1
|
$ | 14,347 | $ | 7,304 | $ | 6,530 | ||||||
|
Gross
credit losses
|
(10,785 | ) | (6,595 | ) | (2,222 | ) | ||||||
|
Recoveries
|
940 | 713 | 684 | |||||||||
|
Net
credit losses
|
(9,845 | ) | (5,882 | ) | (1,538 | ) | ||||||
|
Provision
for loan losses
|
15,588 | 12,925 | 2,312 | |||||||||
|
Balance
at December 31
|
$ | 20,090 | $ | 14,347 | $ | 7,304 | ||||||
A loan is
considered impaired when, based on current information and events, it is
probable that the Corporation will be unable to collect the scheduled payments
of principal or interest when due according to the contractual terms of the loan
agreement. Impairment is measured on a loan by loan basis for
commercial and construction loans. Large groups of smaller balance
homogeneous loans are collectively evaluated for impairment. Based
upon the current economic environment and its effect on the overall real estate
markets, the amount of impaired loans has increased significantly from December
31, 2008.
[66]
The
following is a summary of information pertaining to impaired and non-accrual
loans (in thousands):
|
Years
Ended December 31,
|
||||||||||||
|
2009
|
2008
|
2007
|
||||||||||
|
Impaired
loans without a valuation allowance
|
$ | 102,553 | $ | 66,816 | $ | 6,814 | ||||||
|
Impaired
loans with a valuation allowance
|
28,677 | 16,519 | 176 | |||||||||
|
Total
impaired loans
|
$ | 131,230 | $ | 83,335 | $ | 6,990 | ||||||
|
Valuation
allowance related to impaired loans
|
$ | 7,624 | $ | 4,759 | $ | 176 | ||||||
|
Average
investment in impaired loans
|
$ | 91,743 | $ | 28,180 | $ | 1,472 | ||||||
|
Interest
income recognized on an accrual basis on impaired loans
|
$ | 5,097 | $ | 4,658 | $ | 225 | ||||||
|
Interest
income recognized on a cash basis on impaired loans
|
$ | 1,042 | $ | 410 | $ | 162 | ||||||
Non-accruing
loans were $46.6 million, $24.6 million, and $5.4 million at December 31, 2009,
2008 and 2007, respectively. Interest income not recognized as a result of
placing loans on a non-accrual status was $1.3 million during 2009, $0.4 million
during 2008 and $0.2 million during 2007. Accruing loans past due 90
days or more were $1.8 million, $3.5 million and $3.3 million at the end of
2009, 2008 and 2007, respectively.
The
amount of restructured loans increased significantly in 2009 as we have made
every effort to work with our borrowers during this distressed economic
environment. At December 31, 2009, performing restructured loans are comprised
of approximately $7.4 million of commercial real estate land development loans,
$5.7 million other commercial real estate loans, $4.5 million of commercial and
industrial loans, and $4.6 million single family mortgage loans. The objective
of the restructurings was to increase loan repayments by customers and thereby
reduce net charge-offs. Restructured terms can include temporary relief of
contractual principal payments, temporary or permanent reductions of the
interest rate, and maturity extensions. For loans that were originally interest
only credit lines, if the maturity date is extended, the restructured loan is
placed on a principal amortization schedule. Restructured loans are considered
performing if they have made at least six consecutive payments of their original
and modified terms. Restructured loans are evaluated for impairment as required
by applicable accounting guidance.
Additional
funds of up to $0.2 million are committed to be advanced in connection with
restructured loans. Interest income not recognized due to rate
modifications of restructured loans was $0.1 million in 2009 and none in 2008
and 2007.
6. Premises
and Equipment
The
composition of premises and equipment at December 31 is as follows (in
thousands):
|
2009
|
2008
|
|||||||
|
Land
|
$ | 8,794 | $ | 8,910 | ||||
|
Land
Improvements
|
815 | 322 | ||||||
|
Premises
|
23,950 | 23,058 | ||||||
|
Furniture
and Equipment
|
21,828 | 21,071 | ||||||
|
Capital
Lease
|
535 | — | ||||||
| 55,922 | 53,361 | |||||||
|
Less
accumulated depreciation
|
(24,203 | ) | (22,237 | ) | ||||
|
Total
|
$ | 31,719 | $ | 31,124 | ||||
The
Corporation recorded depreciation expense of $2.7 million, $2.8 million and $2.6
million in 2009, 2008 and 2007, respectively.
Pursuant
to the terms of noncancelable operating lease agreements for banking and
subsidiaries’ offices and for data processing and telecommunications equipment
in effect at December 31, 2009, future minimum rent commitments under these
leases for each of the next five years are as follows: $3.5 million, $3.5
million, $3.5 million, $2.7 million, $2.6 million and $12.6 million thereafter.
The leases contain options to extend for periods from one to five years, which
are not included in the aforementioned amounts.
Total
rent expense for offices amounted to $0.9 million in 2009 and $0.7 million in
2008 and 2007.
7. Goodwill
and Other Intangible Assets
Goodwill
resulted from the acquisition of four branch offices and a banking center from
The Huntington National Bank in July 2003, one insurance agency in April 1999
and three insurance agencies in December 2008. The Corporation
performed its annual impairment test as of December 31, 2009 and determined that
goodwill was not impaired. There can be no assurance that goodwill
impairment will not occur in the future. The Corporation will continue to
evaluate goodwill for impairment on an annual basis and as events occur or
circumstances change.
[67]
The
estimated goodwill and intangible assets are based upon a preliminary valuation
and are subject to change during the allocation period as defined by ASC Topic
350, Intangibles - Goodwill
and Other.
The
significant components of goodwill and acquired intangible assets at December 31
are as follows (in thousands):
|
2009
|
2008
|
|||||||||||||||||||||||||||||||
|
Gross
Carrying
Amount
|
Accumulated
Amortization
|
Net
Carrying
Amount
|
Weighted
Average
Remaining
Life
|
Gross
Carrying
Amount
|
Accumulated
Amortization
|
Net
Carrying
Amount
|
Weighted
Average
Remaining
Life
|
|||||||||||||||||||||||||
|
Goodwill
|
$ | 11,900 | $ | — | $ | 11,900 | $ | 11,900 | $ | — | $ | 11,900 | ||||||||||||||||||||
|
Core
deposit intangible
assets
|
4,040 | (3,581 | ) | 459 | .8 | 4,040 | (3,023 | ) | 1,017 | 1.8 | ||||||||||||||||||||||
|
Insurance
agency book of businesses
|
3,651 | (769 | ) | 2,882 | 8.1 | 3,651 | (246 | ) | 3,405 | 9.1 | ||||||||||||||||||||||
|
Total
|
$ | 19,591 | $ | (4,350 | ) | $ | 15,241 | $ | 19,591 | $ | (3,269 | ) | $ | 16,322 | ||||||||||||||||||
Amortization
expense relating to amortizable intangible assets was $1.1 million in 2009 and
$0.7 million in 2008 and 2007. Future estimated annual amortization
expense is presented below (in thousands):
|
Year
|
Annual
Amortization
|
|||
|
2010
|
$ | 722 | ||
|
2011
|
263 | |||
|
2012
|
263 | |||
|
2013
|
257 | |||
|
2014
|
213 | |||
8. Deposits
The
aggregate amount of time deposits with a minimum denomination of $100,000 was
$372.7 million and $334.4 million at December 31, 2009 and December 31, 2008,
respectively.
The
following is a summary of the scheduled maturities of all time deposits as of
December 31, 2009 (in thousands):
|
2010
|
$ | 419,114 | ||
|
2011
|
255,319 | |||
|
2012
|
29,934 | |||
|
2013
|
5,906 | |||
|
2014
|
7,284 | |||
|
Thereafter
|
0 |
[68]
9. Borrowed
Funds
The
following is a summary of short-term borrowings at December 31 with original
maturities of less than one year
(dollars
in thousands):
|
2009
|
2008
|
2007
|
||||||||||
|
Short-term
FHLB advance, Daily
borrowings, interest rate of 0.36% (at December 31, 2009)
|
$ | 0 | $ | 8,500 | $ | 21,000 | ||||||
|
Securities
sold under agreements to repurchase:
|
||||||||||||
|
Outstanding
at end of year
|
$ | 47,563 | $ | 41,995 | $ | 34,112 | ||||||
|
Weighted
average interest rate at year end
|
0.66 | % | 1.33 | % | 5.99 | % | ||||||
|
Maximum
amount outstanding as of any
month end
|
$ | 50,052 | $ | 47,811 | $ | 70,746 | ||||||
|
Average
amount outstanding
|
43,887 | 38,128 | 55,140 | |||||||||
|
Approximate
weighted average rate during
the year
|
0.71 | % | 1.46 | % | 3.71 | % | ||||||
The
following is a summary of long-term borrowings at December 31 with original
maturities exceeding one year
(dollars
in thousands):
|
2009
|
2008
|
|||||||
|
FHLB
advances, bearing interest at rates ranging from
2.46% to 4.98% at December 31, 2009
|
$ | 227,423 | $ | 241,474 | ||||
|
Junior
subordinated debt, bearing interest at rates ranging
from 3.00% to 9.875% at December 31, 2009
|
43,121 | 35,929 | ||||||
| $ | 270,544 | $ | 277,403 | |||||
The contractual maturities of long-term
borrowings are as follows:
|
December
31,
|
||||||||||||||||
|
2009
|
2008
|
|||||||||||||||
|
Fixed
Rate
|
Floating
Rate
|
Total
|
Total
|
|||||||||||||
|
(in
thousands)
|
||||||||||||||||
|
Due
in 2010
|
$ | 31,000 | $ | — | $ | 31,000 | $ | 14,000 | ||||||||
|
Due
in 2011
|
51,000 | — | 51,000 | 31,000 | ||||||||||||
|
Due
in 2012
|
44,250 | — | 44,250 | 51,000 | ||||||||||||
|
Due
in 2013
|
— | — | — | 44,250 | ||||||||||||
|
Due
in 2014
|
— | — | — | — | ||||||||||||
|
Thereafter
|
113,365 | 30,929 | 144,294 | 137,153 | ||||||||||||
|
Total
long-term debt
|
$ | 239,615 | $ | 30,929 | $ | 270,544 | $ | 277,403 | ||||||||
We have a
borrowing capacity agreement with the FHLB in an amount equal to 29% of the
Bank’s assets. At December 31, 2009, the available line of credit
equaled $506 million. This line of credit, which can be used for both
short and long-term funding, can only be utilized to the extent of available
collateral. The line is secured by certain qualified mortgage and
commercial loans and investment securities, as follows (in
thousands):
|
1-4
family mortgage loans
|
$ | 119,692 | ||
|
Commercial
loans
|
12,888 | |||
|
Multi-family
loans
|
2,130 | |||
|
Home
equity loans
|
10,847 | |||
|
Cash
|
47,000 | |||
|
Investment
securities
|
39,538 | |||
| $ | 232,095 |
[69]
The
collateralized line of credit totaled $232 million at December 31, 2009, of
which $5 million was available for additional borrowings.
We also
have various unsecured lines of credit totaling $20.0 million with various
financial institutions and a $23 million secured line with the Federal Reserve
to meet daily liquidity requirements. As of December 31, 2009, we had
no borrowings under these credit facilities. In addition, we had
approximately $97 million of available funding through brokered money market
funds.
Repurchase
Agreements—We have retail repurchase agreements with customers within its
local market areas. Repurchase agreements generally have maturities
of one to four days from the transaction date. These borrowings are
collateralized with securities that we own and are held in safekeeping at
independent correspondent banks.
FHLB
Advances—The FHLB advances consist of various borrowings with maturities
generally ranging from five to 10 years with initial fixed rate periods of one,
two or three years. After the initial fixed rate period the FHLB has one or more
options to convert each advance to a LIBOR based, variable rate advance, but we
may repay the advance in whole or in part, without a penalty, if the FHLB
exercises its option. At all other times, our early repayment of any advance
could be subject to a prepayment penalty.
Subordinated
Debt— In March 2004, Trust I and Trust II issued preferred securities
with an aggregate liquidation amount of $30.9 million to third-party investors
and issued common equity with an aggregate liquidation amount of $.9 million to
First United Corporation. These Trusts used the proceeds of these
offerings to purchase an equal amount of junior subordinated debentures of First
United Corporation, as follows:
$20.6
million—floating rate payable quarterly based on floating rate based on
three-month LIBOR plus 275 basis points (3.00% at December 31, 2009), maturing
in 2034, redeemable five years after issuance at First United Corporation’s
option.
$10.3
million—floating rate payable quarterly based on three-month LIBOR plus
275 basis points (3.00% at December 31, 2009) maturing in 2034, redeemable five
years after issuance at First United Corporation’s option.
In
December 2004, First United Corporation issued $5.0 million of junior
subordinated debentures. The debentures have a fixed rate of 5.88%
for the first five years, payable quarterly, and convert to a floating rate in
March 2010 based on the three month LIBOR plus 185 basis points. The
debentures mature in 2014, but are redeemable five years after issuance at First
United Corporation’s option.
In
December 2009, Trust III issued 9.875% fixed-rate preferred securities with an
aggregate liquidation amount of approximately $7.0 million to private investors
and issued common securities to First United Corporation with an aggregate
liquidation amount of approximately $.2 million. Trust III used the
proceeds of the offering to purchase approximately $7.2 million of 9.875%
fixed-rate junior subordinated debentures of First United
Corporation. Interest on the debentures is payable quarterly, and the
debentures mature in 2040 but are redeemable five years after issuance at First
United Corporation’s option.
In
January 2010, Trust III issued an additional $3.5 million of 9.875% fixed-rate
preferred securities to private investors and issued common securities to First
United Corporation with an aggregate liquidation amount of $.1
million. Trust III used the proceeds of the offering to purchase $3.6
million of 9.875% fixed-rate junior subordinated debentures of First United
Corporation. Interest on the debentures is payable quarterly, and the
debentures mature in 2040 but are redeemable five years after issuance at First
United Corporation’s option.
The
debentures issued to each of the Trusts represent the sole assets of that Trust,
and payments of the debentures by First United Corporation are the only sources
of cash flow for the Trust. First United Corporation has the right to
defer interest on all of the foregoing debentures for up to 20 quarterly
periods, in which case distributions on the preferred securities will also be
deferred. Should this occur, the Corporation may not pay dividends or
distributions on, or repurchase, redeem or acquire any shares of its capital
stock. As of December 31, 2009, First United Corporation has not
deferred any payments.
10. Preferred
Stock
On
January 30, 2009, pursuant to the Troubled Asset Relief Program Capital Purchase
Program adopted by the United States Department of the Treasury (the
“Treasury”), First United Corporation issued the following securities to the
Treasury for an aggregate consideration of $30.0 million: (i) 30,000
shares of Fixed Rate Cumulative Perpetual Preferred Stock, Series A, having no
par per share (the “Series A Preferred Stock”); and (ii) a warrant to purchase
326,323 shares of common stock, par value $.01 per share, at an exercise price
of $13.79 per share (the “Warrant”). The proceeds from this
transaction qualify as Tier 1 capital and the warrant qualifies as tangible
common equity. The operative documents relating to this transaction
are on file with the SEC and available to the public free of
charge.
[70]
Holders of the Series A Preferred Stock
are entitled to receive, if and when declared by the Board of Directors, out of
assets legally available for payment, cumulative cash dividends at a rate per
annum of 5% per share on a liquidation amount of $1,000 per share of Series A
Preferred Stock with respect to each dividend period from January 30, 2009 to,
but excluding, February 15, 2014. From and after February 15, 2014,
holders of Series A Preferred Stock are entitled to receive cumulative cash
dividends at a rate per annum of 9% per share on a liquidation amount of $1,000
per share with respect to each dividend period thereafter. Under the terms of
the Series A Preferred Stock, on and after February 15, 2012, First United
Corporation may, at its option, redeem shares of Series A Preferred Stock, in
whole or in part, at any time and from time to time, for cash at a per share
amount equal to the sum of the liquidation preference per share plus any accrued
and unpaid dividends to but excluding the redemption date. The terms
of the Series A Preferred Stock further provide that, prior to February 15,
2012, First United Corporation may redeem shares of Series A Preferred Stock
only if it has received aggregate gross proceeds of not less than $7.5 million
from one or more qualified equity offerings, and the aggregate redemption price
may not exceed the net proceeds received by the Corporation from such
offerings. Notwithstanding the foregoing restriction on redemption,
the recently-enacted Recovery Act permits First United Corporation to redeem
shares of Series A Preferred Stock held by Treasury at any time (subject to a
minimum 25% redemption requirement). If First United Corporation
redeems shares of Series A Preferred Stock pursuant to the Recovery Act, it may
also repurchase a pro rata portion of the Warrant; otherwise, Treasury must
liquidate any portion of the Warrant that is not repurchased, at the current
market price. Any redemption of the Series A Preferred Stock requires
prior regulatory approval.
Until the earlier of (i) January 30,
2012 or (ii) the date on which the Treasury disposes of the Series A Preferred
Stock, without the consent of the Treasury, First United Corporation is
prohibited from increasing its quarterly cash dividend paid on common stock
above $0.20 per share and from repurchasing or redeeming any shares of its
capital stock, and the Trusts are prohibited from redeeming their trust
preferred securities.
11. Other
Comprehensive Income/(Loss)
Other comprehensive income/(loss)
(“OCI”) consists of the changes in unrealized gains (losses) on investment
securities available-for-sale, cash flow hedges and pension obligations. Total
comprehensive income/(loss), which consists of net income/(loss) plus the
changes in other comprehensive income/(loss), was $3.0 million, ($26.5) million
and $12.7 million for the years ended December 31, 2009, 2008 and 2007,
respectively.
The
following tables present the accumulated other comprehensive loss for the years
ended December 31, 2009, 2008 and 2007 and the components included
therein:
|
Investment
securities
with
OTTI
|
Investment
securities
–
all
other
|
Cash
Flow
Hedges
|
Pension
Plan
|
SERP
|
Total
|
|||||||||||||||||||
|
Accumulated
OCI, net:
|
||||||||||||||||||||||||
|
Balance
– January 1, 2007
|
$ | — | $ | (715 | ) | $ | — | $ | (2,901 | ) | $ | (1,964 | ) | $ | (5,580 | ) | ||||||||
|
Net
gain/(loss) during period
|
— | (1,815 | ) | — | 151 | 1,589 | (75 | ) | ||||||||||||||||
|
Balance
– December 31, 2007
|
$ | — | $ | (2,530 | ) | $ | — | $ | (2,750 | ) | $ | (375 | ) | $ | (5,655 | ) | ||||||||
|
Accumulated
OCI, net:
|
||||||||||||||||||||||||
|
Net
gain/(loss) during period
|
— | (30,660 | ) | — | (4,636 | ) | (32 | ) | (35,328 | ) | ||||||||||||||
|
Balance
– December 31, 2008
|
$ | — | $ | (33,190 | ) | $ | — | $ | (7,386 | ) | $ | (407 | ) | $ | (40,983 | ) | ||||||||
|
Accumulated
OCI, net:
|
||||||||||||||||||||||||
|
Net
gain/(loss) during period
|
(9,364 | ) | 21,786 | (36 | ) | 2,335 | (397 | ) | 14,324 | |||||||||||||||
|
Balance
– December 31, 2009
|
$ | (9,364 | ) | $ | (11,404 | ) | $ | (36 | ) | $ | (5,051 | ) | $ | (804 | ) | $ | (26,659 | ) | ||||||
[71]
|
Pre-Tax
|
Taxes
|
Net
|
||||||||||
|
December
31, 2007:
|
||||||||||||
|
Available
for sale securities:
|
||||||||||||
|
Unrealized
holding losses during the period
|
$ | (4,648 | ) | $ | 1,877 | $ | (2,771 | ) | ||||
|
Less:
reclassification adjustment for gains recognized in income
|
(1,605 | ) | 649 | (956 | ) | |||||||
|
Net
unrealized losses on AFS investment securities
|
(3,043 | ) | 1,228 | (1,815 | ) | |||||||
|
Defined
benefit plans liability adjustment
|
2,918 | (1,178 | ) | 1,740 | ||||||||
| $ | (125 | ) | $ | 50 | $ | (75 | ) | |||||
|
December
31, 2008:
|
||||||||||||
|
Available
for sale securities with OTTI:
|
||||||||||||
|
Securities
with OTTI charges during the period
|
$ | (2,724 | ) | $ | 1,099 | $ | (1,625 | ) | ||||
|
Less:
OTTI charges recognized in income
|
(2,724 | ) | 1,099 | (1,625 | ) | |||||||
|
Net
unrealized losses on investments with OTTI
|
0 | 0 | 0 | |||||||||
|
Available
for sale securities – all other:
|
||||||||||||
|
Unrealized
holding losses during the period
|
(53,405 | ) | 21,553 | (31,852 | ) | |||||||
|
Less:
reclassification adjustment for gains recognized in income
|
727 | (294 | ) | 433 | ||||||||
|
Less:
securities with OTTI charges during the period
|
(2,724 | ) | 1,099 | (1,625 | ) | |||||||
|
Net
unrealized losses on all other AFS securities
|
(51,408 | ) | 20,748 | (30,660 | ) | |||||||
|
Net
unrealized losses on AFS investment securities
|
(51,408 | ) | 20,748 | (30,660 | ) | |||||||
|
Defined
benefit plans liability adjustment
|
(7,452 | ) | 2,784 | (4,668 | ) | |||||||
| $ | (58,860 | ) | $ | 23,532 | $ | (35,328 | ) | |||||
|
December
31, 2009:
|
||||||||||||
|
Available
for sale (AFS) securities with OTTI:
|
||||||||||||
|
Securities
with OTTI charges during the period
|
$ | (42,394 | ) | $ | 17,110 | $ | (25,284 | ) | ||||
|
Less:
OTTI charges recognized in income
|
(26,693 | ) | 10,773 | (15,920 | ) | |||||||
|
Net
unrealized losses on investments with OTTI
|
(15,701 | ) | 6,337 | (9,364 | ) | |||||||
|
Available
for sale securities – all other:
|
||||||||||||
|
Unrealized
holding losses during the period
|
(5,733 | ) | 2,313 | (3,420 | ) | |||||||
|
Less:
reclassification adjustment for gains recognized in income
|
131 | (53 | ) | 78 | ||||||||
|
Less:
securities with OTTI charges during the period
|
(42,394 | ) | 17,110 | (25,284 | ) | |||||||
|
Net
unrealized gains on all other AFS securities
|
36,530 | (14,744 | ) | 21,786 | ||||||||
|
Net
unrealized gains on AFS investment securities
|
20,829 | (8,407 | ) | 12,422 | ||||||||
|
Unrealized
losses on cash flow hedges
|
(60 | ) | 24 | (36 | ) | |||||||
|
Defined
benefit plans liability adjustment
|
3,249 | (1,311 | ) | 1,938 | ||||||||
| $ | 24,018 | $ | (9,694 | ) | $ | 14,324 | ||||||
12. Income
Taxes
The
provision for income taxes consists of the following for the years ended
December 31 (in thousands):
|
2009
|
2008
|
2007
|
||||||||||
|
Current
Tax Provision:
|
||||||||||||
|
Federal
|
$ | 187 | $ | 5,337 | $ | 4,275 | ||||||
|
State
|
357 | 1,383 | 914 | |||||||||
| $ | 544 | $ | 6,720 | $ | 5,189 | |||||||
|
Deferred
taxes (benefit) :
|
||||||||||||
|
Federal
|
$ | (7,830 | ) | $ | (2,699 | ) | $ | 455 | ||||
|
State
|
(1,210 | ) | (448 | ) | 102 | |||||||
| $ | (9,040 | ) | $ | (3,147 | ) | $ | 557 | |||||
|
Income
tax expense (benefit) for the year
|
$ | (8,496 | ) | $ | 3,573 | $ | 5,746 | |||||
[72]
The
reconciliation between the statutory federal income tax rate and effective
income tax rate is as follows:
|
2009
|
2008
|
2007
|
||||||||||
|
Federal
statutory rate
|
(35.0 | )% | 35.0 | % | 35.0 | % | ||||||
|
Tax-exempt
income on securities and loans
|
(6.6 | ) | (9.0 | ) | (5.9 | ) | ||||||
|
Tax-exempt
BOLI income
|
2.5 | (2.0 | ) | (2.1 | ) | |||||||
|
State
income tax, net of federal tax benefit
|
(4.9 | ) | 3.6 | 3.8 | ||||||||
|
Other
|
1.1 | 1.1 | .2 | |||||||||
| (42.9 | )% | 28.7 | % | 31.0 | % | |||||||
Deferred
income taxes reflect the net tax effects of temporary differences between the
carrying amounts of assets and liabilities for financial reporting purposes and
the amounts used for income tax purposes. Significant components of the
Corporation’s temporary differences as of December 31 are as follows (in
thousands):
|
2009
|
2008
|
|||||||
|
Deferred
tax assets:
|
||||||||
|
Allowance
for loan losses
|
$ | 8,108 | $ | 5,790 | ||||
|
Deferred
loan fees
|
211 | 271 | ||||||
|
Deferred
compensation
|
562 | 613 | ||||||
|
State
tax loss carry forwards
|
1,079 | 1,001 | ||||||
|
Unrealized
loss on investment securities available-for-sale
|
14,053 | 22,460 | ||||||
|
Pension/SERP
|
— | 428 | ||||||
|
Other
than temporary impairment on investment securities
|
7,004 | 1,100 | ||||||
|
Other
real estate owned
|
1,446 | 518 | ||||||
|
Other
|
706 | 113 | ||||||
|
Total
deferred tax assets
|
33,169 | 32,294 | ||||||
|
Valuation
allowance
|
(1,079 | ) | (1,001 | ) | ||||
|
Total
deferred tax assets less valuation allowance
|
32,090 | 31,293 | ||||||
|
Deferred
tax liabilities:
|
||||||||
|
Amortization
of goodwill and core deposit intangible
|
(988 | ) | (837 | ) | ||||
|
Pension/SERP
|
(53 | ) | — | |||||
|
Depreciation
|
(1,707 | ) | (820 | ) | ||||
|
Other
|
(153 | ) | (70 | ) | ||||
|
Total
deferred tax liabilities
|
(2,901 | ) | (1,727 | ) | ||||
|
Net
deferred tax assets
|
$ | 29,189 | $ | 29,566 | ||||
State
income tax expense (benefit) amounted to ($0.9) million during 2009, $0.9
million during 2008 and $1.0 million during 2007. A valuation
allowance has been provided for the state tax loss carry forwards included in
deferred tax assets which will expire commencing in 2019.
13. Employee
Benefit Plans
The
Corporation sponsors a noncontributory defined benefit pension plan (the
“Pension Plan”) covering substantially all full-time employees who qualify as to
age and length of service. The benefits are based on years of service and the
employees’ compensation during the last five years of employment. The
Corporation’s funding policy is to make annual contributions in amounts
sufficient to meet the current year’s minimum funding requirements.
During
2001, the Corporation established an unfunded supplemental executive retirement
plan (the “SERP”) to provide senior management personnel with supplemental
retirement benefits in excess of limits imposed on qualified plans by federal
tax law. Concurrent with the establishment of the SERP, the
Corporation acquired bank owned life insurance (“BOLI”) policies on the senior
management personnel and officers of the Corporation. The benefits
resulting from the favorable tax treatment accorded the earnings on the BOLI
policies are intended to provide a source of funds for the future payment of the
SERP benefits as well as other employee benefit costs.
The
benefit obligation activity for both the Pension Plan and SERP was calculated
using an actuarial measurement date of January 1. Plan assets and the benefit
obligations were calculated using an actuarial measurement date of December 31.
The following table summarizes benefit obligation and funded status, plan asset
activity, components of net pension cost, and weighted average assumptions for
the Pension Plan and the SERP plans (dollars in thousands):
[73]
|
Pension
|
SERP
|
|||||||||||||||
|
2009
|
2008
|
2009
|
2008
|
|||||||||||||
|
Change
in Benefit Obligation
|
||||||||||||||||
|
Obligation
at the beginning of the year
|
$ | 20,543 | $ | 20,922 | $ | 3,446 | $ | 3,036 | ||||||||
|
Service
cost
|
808 | 923 | 134 | 106 | ||||||||||||
|
Interest
cost
|
1,217 | 1,263 | 229 | 181 | ||||||||||||
|
Change
in assumptions
|
— | (2,336 | ) | 102 | — | |||||||||||
|
Actuarial
losses
|
16 | 400 | 705 | 149 | ||||||||||||
|
Benefits
paid
|
(722 | ) | (629 | ) | (26 | ) | (26 | ) | ||||||||
|
Obligation
at the end of the year
|
21,862 | 20,543 | 4,590 | 3,446 | ||||||||||||
|
Change
in Plan Assets
|
||||||||||||||||
|
Fair
value at the beginning of the year
|
22,245 | 27,856 | — | — | ||||||||||||
|
Actual
return on plan assets
|
5,060 | (7,482 | ) | — | — | |||||||||||
|
Employer
contribution
|
— | 2,500 | 26 | 26 | ||||||||||||
|
Benefits
paid
|
(722 | ) | (629 | ) | (26 | ) | (26 | ) | ||||||||
|
Fair
value at the end of the year
|
26,583 | 22,245 | — | — | ||||||||||||
|
Funded
Status
|
$ | 4,721 | $ | 1,702 | $ | (4,590 | ) | $ | (3,446 | ) | ||||||
|
Pension
|
SERP
|
|||||||||||||||||||||||
|
2009
|
2008
|
2007
|
2009
|
2008
|
2007
|
|||||||||||||||||||
|
Components
of Net Pension Cost
|
||||||||||||||||||||||||
|
Service
cost
|
$ | 808 | $ | 923 | $ | 809 | $ | 134 | $ | 106 | $ | 179 | ||||||||||||
|
Interest
cost
|
1,217 | 1,263 | 1,155 | 229 | 181 | 256 | ||||||||||||||||||
|
Expected
return on assets
|
(1,703 | ) | (2,340 | ) | (1,891 | ) | — | — | — | |||||||||||||||
|
Amortization
of transition asset
|
(39 | ) | (39 | ) | (39 | ) | — | — | — | |||||||||||||||
|
Amortization
of recognized loss
|
625 | 142 | 169 | 0 | 0 | 203 | ||||||||||||||||||
|
Amortization
of prior service cost
|
10 | 10 | 10 | 126 | 113 | 113 | ||||||||||||||||||
|
Net
pension (income)/expense in employee benefits
|
$ | 918 | $ | (41 | ) | $ | 213 | $ | 489 | $ | 400 | $ | 751 | |||||||||||
|
Weighted
Average Assumptions used to determine
benefit obligations:
|
||||||||||||||||||||||||
|
Discount
rate for benefit obligations
|
6.00 | % | 6.00 | % | 6.00 | % | 6.00 | % | 6.00 | % | 6.00 | % | ||||||||||||
|
Discount
rate for net pension cost
|
6.00 | % | 6.00 | % | 6.00 | % | — | — | — | |||||||||||||||
|
Expected
long-term return on assets
|
7.75 | % | 7.75 | % | 8.00 | % | — | — | — | |||||||||||||||
|
Rate
of compensation increase
|
4.00 | % | 4.00 | % | 3.00 | % | 4.00 | % | 4.00 | % | 4.00 | % | ||||||||||||
The
accumulated benefit obligation for the Pension Plan was $18.8 million and
$16.7 million at December 31, 2009 and 2008, respectively. The
accumulated benefit obligation for the SERP was $4.6 million and $3.4 million at
December 31, 2009 and 2008, respectively.
The investment assets of the defined
benefit plan are managed with the goal of providing for retiree distributions
while also supporting long-term plan obligations with a moderate level of
portfolio risk. In order to address the variability over time of both risk and
return, the plan investment strategy entails a dynamic approach to asset
allocation, providing for normalized targets for major asset classes, with the
ability to tactically adjust within the following specified ranges around those
targets.
|
Asset
Class
|
Normalized
Target
|
Range
|
||||
|
Cash
|
5%
|
0%
- 20%
|
||||
|
Fixed
Income
|
40%
|
30%
- 50%
|
||||
|
Equities
|
55%
|
45%
- 65%
|
Decisions regarding tactical
adjustments within the above noted ranges for asset classes are based on a top
down review of factors expected to have material impact on the risk and reward
dynamics of the portfolio as a whole. Such factors include, but are not limited
to, the following:
|
|
a)
|
Anticipated
domestic and international economic growth as a
whole.
|
|
|
b)
|
The
position of the economy within its longer term economic
cycle.
|
[74]
|
|
c)
|
The
expected impact of economic vitality, cycle positioning, financial market
risks, industry/demographic trends and political forces on the various
market sectors and investment
styles.
|
With
respect to individual company securities, additional company specific matters
are considered, which could include management track record and guidance, future
earnings expectations, current relative price expectations and the impact of
identified risks on expected performance, among others. A core equity position
of large cap stocks will be maintained, with more aggressive or volatile sectors
meaningfully represented in the asset mix in pursuit of higher
returns.
Strategic
and specific investment decisions are guided by an in-house investment committee
as well as a number of outside institutional resources that provide economic,
industry and company data and analytics. It is management’s intent to
give the Plan’s investment managers flexibility with respect to investment
decisions and their timing within the overall guidelines. However,
certain investments require specific review and approval by
management. Management is also informed of anticipated changes in
nonproprietary investment managers, significant modifications of any previously
approved investment, or the anticipated use of derivatives to execute investment
strategies.
Portfolio risk is managed in large part
by a focus on diversification across multiple levels as well as an emphasis on
financial strength. For example, current investment policies restrict initial
investments in debt securities to be rated investment grade at the time of
purchase. Also, with the exception of the highest rated securities (e.g., U.S.
Treasury or government-backed agency securities), no more than 10% of the
portfolio may be invested in a single entity’s securities. As a
result of the previously noted approaches to controlling portfolio risk, any
concentrations of risk would be associated with general systemic risks faced by
industry sectors or the portfolio as a whole.
Assets in the Pension Plan are valued
by the Corporation’s accounting system provider who utilizes a third party
pricing service. Valuation data is based on actual market data for stocks and
mutual funds (Level 1) and matrix pricing for bonds (Level 2). Cash
and cash equivalents are also considered Level 1 within the fair value
hierarchy.
As of December 31, 2009, the value of
Pension Plan investments was as follows (dollars in thousands):
|
Fair Value Hierarchy
|
||||||||||||||||
|
Assets at
Fair Value
|
% of Portfolio
|
Level 1
|
Level 2
|
|||||||||||||
|
Cash
and cash equivalents
|
$ | 869 | 3.3 | % | $ | 869 | $ | — | ||||||||
|
Fixed
income securities:
|
||||||||||||||||
|
U.S.
Government and Agencies
|
1,693 | 6.4 | % | — | 1,693 | |||||||||||
|
Taxable
municipal bonds and notes
|
168 | 0.6 | % | — | 168 | |||||||||||
|
Corporate
bonds and notes
|
5,932 | 22.3 | % | — | 5,932 | |||||||||||
|
Preferred
stock
|
757 | 2.9 | % | — | 757 | |||||||||||
|
Fixed
income mutual funds
|
1,889 | 7.1 | % | 1,889 | — | |||||||||||
|
Total
fixed income
|
10,439 | 39.3 | % | 1,889 | 8,550 | |||||||||||
|
Equities:
|
||||||||||||||||
|
Large
Cap
|
10,075 | 37.9 | % | $ | 10,075 | $ | — | |||||||||
|
Mid
Cap
|
2,057 | 7.7 | % | 2,057 | — | |||||||||||
|
Small
Cap
|
906 | 3.4 | % | 906 | — | |||||||||||
|
International
|
2,237 | 8.4 | % | 2,237 | — | |||||||||||
|
Total
equities:
|
15,275 | 57.4 | % | 15,275 | — | |||||||||||
|
Total
market value
|
$ | 26,583 | 100.0 | % | $ | 18,033 | $ | 8,550 | ||||||||
The expected rate of return on pension
assets is based on a combination of the following:
|
|
a)
|
Historical
returns of the pension portfolio.
|
|
|
b)
|
Monte
Carlo simulations of expected returns for a portfolio with strategic asset
targets similar to the normalized
targets.
|
|
|
c)
|
Market
impact adjustments to reflect expected future investment environment
considerations.
|
As of December 31, 2009, the 20-year
average return on pension portfolio assets was 7.36%. Monte Carlo simulations
modeled against the normalized asset class targets for the pension portfolio
suggest an expected long-term return average of 7.11% with a 95% confidence
level. Actual and simulated returns have been impacted materially by two
significant bear markets that covered four of the last 10 years. Some long-term
data suggests that U.S. equities may be near an inflection point to improving
multi-year performance. For example, Ibbotson data from 1826 through 2009
indicates that rolling 10-year returns exhibit some cyclicality. These returns
recently touched historical lows and may be turning upward. In addition, it is
anticipated that the December 2007 recession ended sometime in mid-2009,
suggesting further progress toward economic recovery and positive investment
performance. The expected long-term return used for 2009 was 7.75%.
Based on the above considerations, it is considered appropriate to maintain the
forward expected long-term rates of return at 7.75%.
[75]
The
following summarizes the number of shares of the Corporation’s common stock and
the fair value of such shares that are included in Pension Plan assets at
December 31, 2009 and 2008, as well as dividends paid to the Pension Plan for
such years (dollars in thousands):
|
2009
|
2008
|
|||||||
|
Number
of shares held
|
3,000 | 3,000 | ||||||
|
Number
of shares purchased
|
0 | 0 | ||||||
|
Number
of shares sold
|
0 | 0 | ||||||
|
Fair
value
|
$ | 18 | $ | 40 | ||||
|
Dividends
paid
|
$ | 2 | $ | 2 | ||||
|
Percentage
of total plan assets
|
0.07 | % | 0.18 | % | ||||
Estimated
cash flows related to the Pension Plan are as follows (in
thousands):
Estimated
future benefit payments:
|
Pension Plan
|
SERP
|
|||||||
|
2010
|
$ | 666 | $ | 206 | ||||
|
2011
|
681 | 26 | ||||||
|
2012
|
771 | 67 | ||||||
|
2013
|
964 | 123 | ||||||
|
2014
|
1,077 | 219 | ||||||
|
2015-2019
|
7,531 | 1,445 | ||||||
| $ | 11,690 | $ | 2,086 | |||||
The Corporation’s contribution to the
Pension Plan in 2010 is dependent upon market conditions and a full evaluation
of the plan. The Corporation expects to fund the annual projected
benefit payments for the SERP from operations.
Amounts
included in accumulated other comprehensive loss as of December 31, 2009 and
2008, net of tax, are as follows (in thousands):
|
2009
|
2008
|
|||||||||||||||
|
Pension
|
SERP
|
Pension
|
SERP
|
|||||||||||||
|
Unrecognized
net actuarial loss
|
$ | 5,119 | $ | 524 | $ | 7,470 | $ | 104 | ||||||||
|
Unrecognized
prior service costs
|
60 | 280 | 67 | 303 | ||||||||||||
|
Net
transition asset
|
(128 | ) | — | (151 | ) | — | ||||||||||
| $ | 5,051 | $ | 804 | $ | 7,386 | $ | 407 | |||||||||
[76]
Other
changes in plan assets and benefit obligations recognized in other comprehensive
loss during the year ended December 31, 2009 were as follows:
|
Defined
Benefit Pension Plan
|
||||
|
Net
actuarial gain during the period
|
$ | 3,335 | ||
|
Amortization
of prior service costs
|
10 | |||
|
Amortization
of transition asset
|
(39 | ) | ||
|
Amortization
of unrecognized loss
|
625 | |||
| 3,931 | ||||
|
Supplemental
Executive Retirement Plan
|
||||
|
Net
actuarial loss during the period
|
(705 | ) | ||
|
New
prior service cost
|
(103 | ) | ||
|
Amortization
of prior service costs
|
126 | |||
| (682 | ) | |||
|
Change
in Plan Assets and Benefit Costs
|
3,249 | |||
|
Tax
effect
|
(1,311 | ) | ||
|
Amount
included in other comprehensive loss, net of tax
|
$ | 1,938 | ||
The
estimated costs that will be amortized from accumulated other comprehensive loss
into net periodic pension cost during the next fiscal year are as follows (in
thousands):
|
Pension
|
SERP
|
|||||||
|
Prior
service costs
|
$ | 10 | $ | 126 | ||||
|
Net
transition asset
|
(39 | ) | — | |||||
|
Net
actuarial loss
|
394 | 60 | ||||||
| $ | 365 | $ | 186 | |||||
|
14.
|
401(K)
Profit Sharing Plan
|
The First
United Bank & Trust 401(k) Profit Sharing Plan (the “401(k) Plan”) is a
defined contribution plan that is intended to qualify under section 401(k) of
the Internal Revenue Code. The 401(k) Plan covers substantially all
employees of the Bank and its affiliates. Eligible employees can
elect to contribute to the plan through payroll deductions. The first
1% of contributions of an employee’s base salary are matched at 100% and the
next 5% are matched on a 50% basis by the Corporation. Expense
charged to operations for the 401(k) Plan was $0.5 million, $0.5 million, and
$0.3 million in 2009, 2008 and 2007, respectively.
|
15.
|
Federal
Reserve Requirements
|
The Bank
is required to maintain cash reserves with the Federal Reserve Bank of Richmond
based principally on the type and amount of its deposits. During
2009, the daily average amount of these required reserves was approximately $0.9
million.
|
16.
|
Restrictions
on Subsidiary Dividends, Loans or
Advances
|
Federal
and state banking regulations place certain restrictions on the amount of
dividends paid and loans or advances made by the Bank to the
Corporation. The total amount of dividends that may be paid at any
date is generally limited to the retained earnings of the Bank, and loans or
advances are limited to 10 percent of the Bank’s capital stock and surplus on a
secured basis. In addition, dividends paid by the Bank to the
Corporation would be prohibited if the effect thereof would cause the Bank’s
capital to be reduced below applicable minimum capital
requirements. At December 31, 2009, the Bank could have paid
additional dividends of $15.0 million to the Corporation without regulatory
approval.
|
17.
|
Commitments
and Contingent Liabilities
|
The
Corporation and its subsidiaries are at times, and in the ordinary course of
business, subject to legal actions. However, to the knowledge of
management, the Corporation is not currently subject to any such legal
actions.
Loan and
letter of credit commitments are discussed in Note 5.
[77]
|
18.
|
Fair
Value of Financial Instruments
|
The
Corporation complies with the guidance of ASC Topic 820, Fair Value Measurements and
Disclosures, which defines fair value, establishes a framework for
measuring fair value and expands disclosures about fair value measurements
required under other accounting pronouncements. This guidance applies only to
fair value measurements required or permitted under current accounting
guidelines, but does not require any new fair value measurements. The
Corporation also follows the guidance on matters relating to all financial
instruments found in ASC Subtopic 825-10, Financial Instruments –
Overall.
Fair
value is defined as the price to sell an asset or to transfer a liability in an
orderly transaction between willing market participants as of the measurement
date. Fair value is best determined by values quoted through active
trading markets. Active trading markets are characterized by numerous
transactions of similar financial instruments between willing buyers and willing
sellers. Because no active trading market exists for various types of financial
instruments, many of the fair values disclosed were derived using present value
discounted cash flows or other valuation techniques described
below. As a result, the Corporation’s ability to actually realize
these derived values cannot be assumed.
The
Corporation measures fair values based on the fair value hierarchy established
in ASC Paragraph 820-10-35-37. The hierarchy gives the highest
priority to unadjusted quoted prices in active markets for identical assets or
liabilities (Level 1 measurements) and the lowest priority to unobservable
inputs (Level 3 measurements). The three levels of inputs that may be
used to measure fair value under the hierarchy are as follows:
Level 1: Unadjusted quoted
prices in active markets that are accessible at the measurement date for
identical, unrestricted assets and liabilities. This level is the
most reliable source of valuation.
Level 2: Quoted prices that
are not active, or inputs that are observable either directly or indirectly, for
substantially the full term of the asset or liability. Level 2 inputs
include inputs other than quoted prices that are observable for the asset or
liability (for example, interest rates and yield curves at commonly quoted
intervals, volatilities, prepayment speeds, loss severities, credit risks, and
default rates). It also includes inputs that are derived principally
from or corroborated by observable market data by correlation or other means
(market-corroborated inputs). Several sources are utilized for
valuing these assets, including a contracted valuation service, Standard &
Poor’s (S&P) evaluations and pricing services, and other valuation
matrices.
Level 3: Prices or valuation
techniques that require inputs that are both significant to the valuation
assumptions and not readily observable in the market (i.e. supported with little
or no market activity). Level 3 instruments are valued based on the
best available data, some of which is internally developed, and consider risk
premiums that a market participant would require.
The level
established within the fair value hierarchy is based on the lowest level of
input that is significant to the fair value measurement.
In April
2009, FASB issued additional guidance in ASC Subparagraphs 820-10-35-51A
and 820-10-35-51B on determining when the volume and level of activity for the
asset or liability has significantly decreased and provides a list of factors
that a reporting entity should evaluate to determine whether there has been a
significant decrease in the volume and level of activity for the asset or
liability in relation to normal market activity for the asset or liability. When
the reporting entity concludes there has been a significant decrease in the
volume and level of activity for the asset or liability, further analysis of the
information from that market is needed and significant adjustments to the
related prices may be necessary to estimate fair value. The new
guidance also clarifies in ASC Subparagraphs 820-10-35-51E and 820-10-35-51F
that when there has been a significant decrease in the volume and level of
activity for the asset or liability, some transactions may not be orderly. In
those situations, the entity must evaluate the weight of the evidence to
determine whether the transaction is orderly. The guidance provides a list of
circumstances that may indicate that a transaction is not orderly. A transaction
price that is not associated with an orderly transaction is given little, if
any, weight when estimating fair value. The Corporation elected to early adopt
this guidance for its March 31, 2009 financial statements as provided in the
effective date provisions of ASC Paragraph 820-10-65-4.
The
Corporation believes that its valuation techniques are appropriate and
consistent with other market participants. However, the use of
different methodologies and assumptions could result in a different estimate of
fair values at the reporting date. The following valuation techniques
were used to measure the fair value of assets in the table below which are
measured on a recurring and non-recurring basis as of December 31,
2009.
[78]
Investments held
for trading – The fair value of investments held for trading is
determined using a market approach. The Level 3 investments consist
of four pooled trust preferred securities, which are preferred term securities
issued by trust subsidiaries of financial institutions and insurance companies
and collateralized by junior subordinated debentures issued to those trusts by
the parent institution. Two securities were deemed to be other-than-temporarily
impaired at December 31, 2008 and were moved to trading during the first quarter
of 2009. The remaining two securities were moved to trading during
the third quarter of 2009. During 2009, the Corporation obtained fair
values for these securities from an experienced independent third-party pricing
provider. Information such as performance of the underlying
collateral, deferral/default rates, cash flow projections, related relevant
trades, models and other analytical tools are utilized by the third-party in
determining individual security valuations in accordance with proper accounting
guidance. A full explanation of the pricing methodology is presented
in the next section, under Investments available for sale. At
December 31, 2009, all securities held for trading were deemed to be worthless
based upon the cash flow models and the underlying collateral for the each class
owned. Accordingly, these securities showed no value at year end and
none have been sold.
Investments
available for sale – The fair value of investments available-for-sale is
determined using a market approach. As of December 31, 2009, Level 2
investment securities available-for-sale include U.S. Government Agencies and
residential mortgage-backed securities, private label residential
mortgage-backed securities and municipal bonds which are not as actively
traded. Their fair values were determined based upon
market-corroborated inputs and valuation matrices which were obtained through
third party data service providers or securities brokers through which the
Corporation has historically transacted both purchases and sales of investment
securities. The Level 3 investments consist of pooled trust preferred
securities. The Corporation obtained fair values for these securities
from Moody’s Analytics and from S&P. Information such as
performance of the underlying collateral, deferral/default rates, cash flow
projections, related relevant trades, models, inquiries of trading firms
who are prominent in the Trust Preferred market, actual market activity,
clearing levels where bonds are likely to trade, current market sentiment and
other analytical tools were utilized by the third-parties in determining
individual security valuations in accordance with proper accounting
guidance.
At
December 31, 2009, the Bank owned 22 pooled trust preferred securities with a
par value of $44.5 million and a fair value of $12.4 million. Based upon
application of the guidance in ASC Subparagraph 820-10-35-51A, management has
determined that there has been a significant decrease in the volume and level of
activity in these securities. The market for pooled trust preferred
securities continues to be non-existent. There are few recent
transactions in the market for these securities relative to historical
levels. There were no new pooled trust preferred issuances during
2008 or 2009. Trading activity for pooled trust preferred securities
indicates only three total trades during the first quarter of 2009, zero trades
during the second quarter of 2009 and only distressed trades during the third
and fourth quarters of 2009, compared to a high of 116 trades in the first
quarter of 2008. The volume is sporadic with $0 in trades during the
first and second quarters of 2009, $14 million during the third quarter and $400
million during the fourth quarter of 2009, representing primarily distressed
sales. The trading and issuance data presented, along with information from
traders, indicates that there is currently an inactive and inefficient market in
pooled trust preferred securities which is contributing to the depressed pricing
on these securities. Price quotations are clearly indicative of
distressed trades and vary significantly from prices achieved during an active
market. Comparing each issuer’s estimate of cash flows and, taking
into consideration all available market data and nonperformance risk, there is a
significant increase in the implied liquidity risk premiums and yields on the
securities. This has led to a wide bid-ask spread as buyers for the
securities are seeking “fire-sale” prices and owners of the securities are not
willing to accept such pricing.
Observable
prices for these securities are available based upon broker models and these
inputs have been considered in the pricing models used by Moody’s Analytics and
S&P. However, the few observable transactions and market
quotations that are available are not reliable for purposes of determining fair
value at December 31, 2009. Accordingly, the pooled trust preferred
securities portion of the Corporation’s investment portfolio will be classified
within Level 3 of the fair value hierarchy because management determined that
significant adjustments are required to determine fair value at the measurement
date.
In
determining the fair values of the securities, Moody’s Analytics utilized an
income valuation approach (present value technique) which maximizes the use of
observable inputs and minimizes the use of unobservable inputs. This
approach is more indicative of fair value than the market approach that has been
used historically, and involves several steps. The credit quality of
the collateral was estimated using the average probability of default values for
each underlying issuer, adjusted for credit ratings. The default
probabilities also considered the potential for correlation among issuers within
the same industry, such as banks with other banks. The loss given
default was assumed to be 95%, allowing for a 5% recovery of
collateral. Management elected to utilize the option assuming that
there were no defaults or deferrals for a two-year time period for those banks
who have publicly announced participation in the Treasury’s Capital Purchase
Program. The cash flows for the securities were forecast for the underlying
collateral and applied to each tranche in the structure to determine the
resulting distribution among the securities. These expected cash
flows were then discounted to calculate the present value of the
security. The effective discount rate utilized by Moody’s Analytics
for the various securities in the present value calculation was the three-month
LIBOR plus 200 basis points (a risk free rate plus a premium for
illiquidity). The resulting prices are highly dependent upon the
credit quality of the collateral, the relative position of the tranche in the
capital structure of the security and the prepayment
assumptions. Moody’s Analytics modeled the calculations in
several thousand scenarios using a Monte Carlo engine and the average price was
used for valuation purposes.
[79]
S&P
is another independent third party whose pricing methodology is based upon
inquiries of trading firms who are prominent in the Trust Preferred
market. Information such as actual market activity, clearing levels
where bonds are likely to trade and current market sentiment are considered in
valuations. S&P structures their approach to pricing on the
premise that the market now trades on dollar price versus yield or discount
margin. This pricing methodology is more market driven, considering
distressed sales, and is more indicative of the pricing likely to be achieved
should the securities be sold in the short term. Due to the current market
conditions as well as the limited trading activity of these securities, the
market value of the securities is highly sensitive to assumption changes and
market volatility.
Derivative
Financial Instruments: The
Corporation’s open derivative positions are interest rate swaps that are
classified as Level 3 within the valuation hierarchy. Open derivative positions
are valued using externally developed pricing models based on observable market
inputs provided by a third party and validated by
management. The Corporation has considered counterparty credit
risk in the valuation of its interest rate swap assets.
Impaired
loans – Loans included in the table below are those that are considered
impaired under the guidance of the loan impairment subsection of the Receivables Topic, ASC
Section 310-10-35, under which the Corporation has measured impairment generally
based on the fair value of the loan’s collateral. Fair value consists
of the loan balance less its valuation allowance and is generally determined
based on independent third-party appraisals of the collateral or discounted cash
flows based upon the expected proceeds. These assets are included as
Level 3 fair values based upon the lowest level of input that is significant to
the fair value measurements.
Foreclosed real
estate – Fair value of foreclosed assets was based on independent
third-party appraisals of the properties. These values were
determined based on the sales prices of similar properties in the approximate
geographic area. These assets are included as Level 3 fair values
based upon the lowest level of input that is significant to the fair value
measurements.
For
assets measured at fair value on a recurring and non-recurring basis, the fair
value measurements by level within the fair value hierarchy used at December 31,
2009 and 2008 are as follows;
|
Fair Value Measurements at
December 31, 2009 Using
(Dollars in Thousands)
|
|||||||||||||
|
Description
|
Assets
Measured
at Fair
Value
12/31/09
|
Quoted
Prices in
Active
Markets for
Identical
Assets
(Level 1)
|
Significant
Other
Observable
Inputs
(Level 2)
|
Significant
Unobservable
Inputs
(Level 3)
|
|||||||||
|
Recurring:
|
|||||||||||||
|
Investment
securities – trading
|
$ | — | $ | — | |||||||||
|
Investment
securities available-for-sale:
|
|||||||||||||
|
U.S.
government agencies
|
$ | 68,263 | $ | 68,263 | |||||||||
|
Residential
mortgage-backed agencies
|
$ | 62,573 | $ | 62,573 | |||||||||
|
Collateralized
mortgage obligations
|
$ | 33,197 | $ | 33,197 | |||||||||
|
Obligations
of states and political Subdivisions
|
$ | 97,303 | $ | 97,303 | |||||||||
|
Collateralized
debt obligations
|
$ | 12,448 | $ | 12,448 | |||||||||
|
Financial
Derivative
|
$ | (60 | ) | $ | (60 | ) | |||||||
| Non-recurring: | |||||||||||||
|
Impaired
loans¹
|
$ | 21,053 | $ | 21,053 | |||||||||
|
Foreclosed
real estate
|
$ | 40 | $ | 40 | |||||||||
¹ The impaired loans fair value consists
of impaired loans net of the $7,624 valuation allowance.
[80]
|
Fair Value Measurements at
December 31, 2008 Using
(Dollars in Thousands)
|
|||||||||||||
|
Description
|
Assets
Measured
at Fair
Value
12/31/08
|
Quoted
Prices in
Active
Markets for
Identical
Assets
(Level 1)
|
Significant
Other
Observable
Inputs
(Level 2)
|
Significant
Unobservable
Inputs
(Level 3)
|
|||||||||
| Recurring: | |||||||||||||
|
Investment
securities available-for-sale:
|
|||||||||||||
|
U.S.
government agencies
|
$ | 113,645 | $ | 113,645 | |||||||||
|
Residential
mortgage-backed agencies
|
$ | 82,561 | $ | 82,561 | |||||||||
|
Collateralized
mortgage obligations
|
$ | 40,638 | $ | 40,638 | |||||||||
|
Obligations
of states and political Subdivisions
|
$ | 93,485 | $ | 93,485 | |||||||||
|
Collateralized
debt obligations
|
$ | 24,266 | $ | 24,266 | |||||||||
|
Non-recurring:
|
|||||||||||||
|
Impaired
loans¹
|
$ | 11,760 | $ | 11,760 | |||||||||
¹ The
impaired loans fair value consists of impaired loans net of the $4,759 valuation
allowance.
The
following tables show a reconciliation of the beginning and ending balances for
fair valued assets measured using Level 3 significant unobservable inputs for
the year ended December 31, 2009 and 2008:
|
Fair Value Measurements Using Significant
Unobservable Inputs
(Level 3)
(Dollars in Thousands)
|
||||||||||||
|
Investment
Securities
Available for Sale
|
Investment
Securities -
Trading
|
Cash Flow
Hedge
|
||||||||||
|
Beginning
balance January 1, 2009
|
$ | 24,266 | $ | — | $ | — | ||||||
|
Total
gains/(losses) realized/unrealized:
|
||||||||||||
|
Included
in earnings (or changes in net assets)
|
(26,522 | ) | (443 | ) | — | |||||||
|
Included
in other comprehensive loss
|
15,147 | — | — | |||||||||
|
Purchases,
issuances, and settlements
|
— | — | (60 | ) | ||||||||
|
Transfers
from Available for Sale to Trading
|
(443 | ) | 443 | — | ||||||||
|
Transfers
in and/or out of Level 3
|
— | — | — | |||||||||
|
Sales
|
— | — | — | |||||||||
|
Payments/credits/charge-offs
|
— | — | — | |||||||||
|
Properties/loans
added
|
— | — | — | |||||||||
|
Ending
balance December 31, 2009
|
$ | 12,448 | $ | — | $ | (60 | ) | |||||
|
The
amount of total gains or losses for the period included in earnings
attributable to the change in realized/ unrealized gains or losses
related to assets still held at the reporting date
|
$ | (26,522 | ) | $ | (443 | ) | $ | — | ||||
[81]
|
Fair Value Measurements Using Significant
Unobservable Inputs
(Level 3)
(Dollars in Thousands)
|
||||
|
Investments
Securities
Available for Sale
|
||||
|
Beginning
balance January 1, 2008
|
$ | 67,308 | ||
|
Total
gains/(losses) realized/unrealized:
|
||||
|
Included
in earnings (or changes in net assets)
|
(2,724 | ) | ||
|
Included
in other comprehensive loss
|
(40,318 | ) | ||
|
Sales
|
— | |||
|
Payments/maturities/credits
|
— | |||
|
Properties/loans
added
|
— | |||
|
Ending
balance December 31, 2008
|
$ | 24,266 | ||
Gains and
losses (realized and unrealized) included in earnings for the periods above are
reported in the Consolidated Statements of Operations in other operating
income.
The fair
values disclosed under ASC Subtopic 825-10 may vary significantly between
institutions based on the estimates and assumptions used in the various
valuation methodologies. The derived fair values are subjective in
nature and involve uncertainties and significant judgment. Therefore, they
cannot be determined with precision. Changes in the assumptions could
significantly impact the derived estimates of fair value. Disclosure
of non financial assets such as buildings as well as certain financial
instruments such as leases is not required. Accordingly, the
aggregate fair values presented do not represent the underlying value of the
Corporation.
The
following methods and assumptions were used by the Corporation in estimating its
fair value disclosures for financial instruments:
Cash and due from
banks: The
carrying amounts for cash and due from banks and federal funds sold approximate
their fair values.
Interest bearing deposits
in banks: The carrying amount of interest bearing deposits
approximates their fair values.
Federal Home Loan Bank
stock: The
carrying value of stock issued by the FHLB of Atlanta approximates fair value
based on the redemption provisions of that stock.
Loans(excluding
impaired loans with specific loss allowances): For
variable rate loans and leases that reprice frequently or “in one year or less,”
and with no significant change in credit risk, fair values are based on carrying
values. Fair values for fixed rate loans and leases and loans and
leases that do not reprice frequently are estimated using a discounted cash flow
calculation that applies current market interest rates being offered on the
various loan products.
Deposits: The
fair values disclosed for demand deposits (e.g., interest and non-interest
checking, savings, and certain types of money market accounts, etc.) are, by
definition, equal to the amount payable on demand at the reporting date (i.e.,
their carrying amounts). Fair values for fixed rate certificates of
deposit are estimated using a discounted cash flow calculation that applies
interest rates currently being offered on the various certificates of deposit to
the cash flow stream.
Borrowed
funds: The fair value of the Corporation’s FHLB borrowings and junior
subordinated debt is calculated based on the discounted value of contractual
cash flows, using rates currently existing for borrowings with similar remaining
maturities. The carrying amounts of federal funds purchased and
securities sold under agreements to repurchase approximate their fair
values.
Accrued
Interest: The carrying amount of accrued interest receivable
and payable approximates their fair values.
Off-Balance-Sheet
Financial Instruments: In the normal course of business, the
Bank makes commitments to extend credit and issues standby letters of
credit. The Bank expects most of these commitments to expire without
being drawn upon; therefore, the commitment amounts do not necessarily represent
future cash requirements. Due to the uncertainty of cash flows and
difficulty in the predicting the timing of such cash flows, fair values were not
estimated for these instruments.
[82]
The
following table presents fair value information about financial instruments,
whether or not recognized in the statement of financial condition, for which it
is practicable to estimate that value. The actual carrying amounts and
estimated fair values of the Corporation’s financial instruments that are
included in the statement of financial condition are as follows (in
thousands):
|
2009
|
2008
|
|||||||||||||||
|
Carrying
Amount
|
Fair
Value
|
Carrying
Amount
|
Fair
Value
|
|||||||||||||
|
Financial
Assets:
|
||||||||||||||||
|
Cash
and cash equivalents
|
$ | 139,169 | $ | 139,169 | $ | 18,423 | $ | 18,423 | ||||||||
|
Interest
bearing deposits in banks
|
50,502 | 50,502 | 882 | 882 | ||||||||||||
|
Investment
securities (AFS and trading)
|
273,784 | 273,784 | 354,595 | 354,595 | ||||||||||||
|
Federal
Home Loan Bank stock
|
13,861 | 13,861 | 13,933 | 13,933 | ||||||||||||
|
Loans,
net
|
1,101,794 | 1,093,241 | 1,120,199 | 1,125,029 | ||||||||||||
|
Accrued
interest receivable
|
6,103 | 6,103 | 7,713 | 7,713 | ||||||||||||
|
Financial
derivative
|
(60 | ) | (60 | ) | — | — | ||||||||||
|
Financial
Liabilities:
|
||||||||||||||||
|
Deposits
|
1,304,166 | 1,251,465 | 1,222,889 | 1,229,834 | ||||||||||||
|
Borrowed
funds
|
318,107 | 325,090 | 327,898 | 346,110 | ||||||||||||
|
Accrued
interest payable
|
2,861 | 2,861 | 4,295 | 4,295 | ||||||||||||
|
Off
balance sheet financial instruments
|
— | — | — | — | ||||||||||||
|
19.
|
Derivative
Financial Instruments
|
As a part
of managing interest rate risk, the Corporation entered into interest rate swap
agreements to modify the re-pricing characteristics of certain interest-bearing
liabilities. The Corporation has designated its interest rate swap agreements as
cash flow hedges under the guidance of ASC Subtopic 815-30, Derivatives and Hedging – Cash Flow
Hedges. Cash flow hedges have the effective portion of changes in the
fair value of the derivative, net of taxes, recorded in net accumulated other
comprehensive income.
In July
2009, the Corporation entered into three interest rate swap contracts totaling
$20.0 million notional amount, hedging future cash flows associated with
floating rate trust preferred debt. At December 31, 2009, the fair
value of the interest rate swap contracts was ($60) thousand and was reported on
the Consolidated Statements of Financial Condition. Cash in the
amount of $700,000 is posted as collateral as of December 31,
2009. The Corporation had no open derivative positions at December
31, 2008.
For the
year ended December 31, 2009, the Corporation recorded a decrease in the value
of the derivatives of $36 thousand in net accumulated other comprehensive loss
to reflect the effective portion of cash flow hedges. ASC Subtopic
815-30 requires this amount to be reclassified to earnings if the hedge becomes
ineffective or is terminated. There was no hedge ineffectiveness
recorded for the year ended December 31, 2009. The Corporation does not expect
any losses relating to these hedges to be reclassified into earnings within the
next twelve months.
Interest
rate swap agreements are entered into with counterparties that meet established
credit standards and the Corporation believes that the credit risk inherent in
these contracts is not significant as of December 31, 2009.
The table
below discloses the impact of derivative financial instruments on the
Corporation’s Consolidated Financial Statements for the year ended December 31,
2009.
|
Derivatives in Cash
Flow Hedging
Relationships
(In thousands)
|
Amount of gain or (loss)
recognized in OCI on
derivative
(effective portion)
|
Amount of gain or (loss)
reclassified from accumulated
OCI into income
(effective portion) (a)
|
Amount of gain or (loss)
recognized in income on
derivative (ineffective
portion and amount
excluded from
effectiveness testing) (b)
|
|||||||||
|
Interest
rate contracts
|
$ | (36 | ) | $ | — | $ | — | |||||
|
|
(a)
|
Reported
as interest expense
|
|
|
(b)
|
Reported
as other income
|
[83]
|
20.
|
Parent
Company Only Financial Information
|
Condensed
Statements of Financial Condition (in thousands)
|
December
31,
|
||||||||
|
2009
|
2008
|
|||||||
|
Assets
|
||||||||
|
Cash
|
$ | 8,474 | $ | 482 | ||||
|
Investment
securities
|
— | 1,236 | ||||||
|
Investment
in bank subsidiary
|
131,018 | 88,346 | ||||||
|
Investment
in non-bank subsidiaries
|
2,991 | 13,247 | ||||||
|
Other
assets
|
3,256 | 7,586 | ||||||
|
Total
Assets
|
$ | 145,739 | $ | 110,897 | ||||
|
Liabilities
and Shareholder’s Equity
|
||||||||
|
Accrued
interest and other liabilities
|
$ | 1,437 | $ | 1,180 | ||||
|
Dividends
payable
|
615 | 1,098 | ||||||
|
Junior
subordinated debt
|
43,121 | 35,929 | ||||||
|
Shareholders’
equity
|
100,566 | 72,690 | ||||||
|
Total
Liabilities and Shareholder’s Equity
|
$ | 145,739 | $ | 110,897 | ||||
Condensed
Statements of (Loss)/Income (in thousands)
|
Year Ended December 31,
|
||||||||||||
|
2009
|
2008
|
2007
|
||||||||||
|
Income:
|
||||||||||||
|
Dividend
income from bank subsidiary
|
$ | 7,247 | $ | 8,192 | $ | 7,912 | ||||||
|
Other
income
|
481 | (34 | ) | 299 | ||||||||
|
Total
Income
|
7,728 | 8,158 | 8,211 | |||||||||
|
Expenses:
|
||||||||||||
|
Interest
expense
|
1,823 | 2,175 | 2,384 | |||||||||
|
Other
expenses
|
279 | (10 | ) | 169 | ||||||||
|
Total
Expenses
|
2,102 | 2,165 | 2,553 | |||||||||
|
Income
before income taxes and equity in undistributed net income of
subsidiaries
|
5,626 | 5,993 | 5,658 | |||||||||
|
Applicable
income taxes
|
(590 | ) | — | — | ||||||||
|
Net
Income before equity in undistributed net income/(loss) of
subsidiaries
|
6,216 | 5,993 | 5,658 | |||||||||
|
Equity
in undistributed net (loss)/income of subsidiaries:
|
||||||||||||
|
Bank
|
$ | (17,776 | ) | 2,054 | 5,790 | |||||||
|
Non-bank
|
236 | 824 | 1,345 | |||||||||
|
Net
(Loss)/Income
|
$ | (11,324 | ) | $ | 8,871 | $ | 12,793 | |||||
[84]
Condensed
Statements of Cash Flows (in thousands)
|
Year Ended December 31,
|
||||||||||||
|
2009
|
2008
|
2007
|
||||||||||
|
Operating Activities
|
||||||||||||
|
Net
(Loss)/Income
|
$ | (11,324 | ) | $ | 8,871 | $ | 12,793 | |||||
|
Adjustments
to reconcile net (loss)/income to net cash provided by operating
activities:
|
||||||||||||
|
Equity
in undistributed net income of subsidiaries
|
17,540 | (2,878 | ) | (7,135 | ) | |||||||
|
Decrease
(increase) in other assets
|
4,330 | (667 | ) | 124 | ||||||||
|
Increase
(decrease) in accrued interest payable and other
liabilities
|
257 | (168 | ) | (122 | ) | |||||||
|
Stock
Compensation
|
(16 | ) | 149 | — | ||||||||
|
Net
cash provided by operating activities
|
10,787 | 5,307 | 5,660 | |||||||||
|
Investing
Activities
|
||||||||||||
|
Proceeds
from investment maturities
|
1,236 | (20 | ) | — | ||||||||
|
Net
investment in subsidiaries
|
(35,632 | ) | (488 | ) | (923 | ) | ||||||
|
Net
cash used in investing activities
|
(34,396 | ) | (508 | ) | (923 | ) | ||||||
|
Financing
Activities
|
||||||||||||
|
Dividends
– common stock
|
(4,893 | ) | (4,774 | ) | (4,796 | ) | ||||||
|
Dividends
– preferred stock
|
(1,186 | ) | — | — | ||||||||
|
Proceeds
from issuance of common stock
|
488 | 362 | 476 | |||||||||
|
Proceeds
from long-term borrowings
|
7,192 | — | — | |||||||||
|
Proceeds
from stock and warrants
|
30,000 | — | — | |||||||||
|
Repurchase
of Common Stock
|
— | (1,391 | ) | (524 | ) | |||||||
|
Net
cash provided by (used in) financing activities
|
31,601 | (5,803 | ) | (4,844 | ) | |||||||
|
Increase
(decrease) in cash and cash equivalents
|
7,992 | (1,004 | ) | (107 | ) | |||||||
|
Cash
and cash equivalents at beginning of year
|
482 | 1,486 | 1,593 | |||||||||
|
Cash
and cash equivalents at end of year
|
$ | 8,474 | $ | 482 | $ | 1,486 | ||||||
|
21.
|
Quarterly
Results of Operations (Unaudited)
|
The following is a summary of the
quarterly results of operations for the years ended December 31, 2009 and 2008
(in thousands, except per share amounts):
|
First
Quarter
|
Second
Quarter
|
Third
Quarter
|
Fourth
Quarter
|
|||||||||||||
|
2009
|
||||||||||||||||
|
Interest
income
|
$ | 22,373 | $ | 21,373 | $ | 21,138 | $ | 20,458 | ||||||||
|
Interest
expense
|
8,547 | 8,010 | 7,833 | 7,714 | ||||||||||||
|
Net
interest income
|
13,826 | 13,363 | 13,305 | 12,744 | ||||||||||||
|
Provision
for loan losses
|
2,049 | 1,871 | 6,917 | 4,751 | ||||||||||||
|
Other
income
|
3,665 | 3,948 | 3,949 | 4,766 | ||||||||||||
|
Gains
(losses) on securities
|
(1,075 | ) | (1,383 | ) | (8,479 | ) | (16,068 | ) | ||||||||
|
Other
expenses
|
10,986 | 12,550 | 11,500 | 11,757 | ||||||||||||
|
Income
(loss) before income taxes
|
3,381 | 1,507 | (9,642 | ) | (15,066 | ) | ||||||||||
|
Applicable
income tax expense (benefit)
|
1,002 | 358 | (4,056 | ) | (5,800 | ) | ||||||||||
|
Net
income/(loss)
|
$ | 2,379 | $ | 1,149 | $ | (5,586 | ) | $ | (9,266 | ) | ||||||
|
Accumulated
preferred stock dividends and discount accretion
|
259 | 393 | 389 | 389 | ||||||||||||
|
Net
(Loss) Attributable to/Income Available to Common
Shareholders
|
$ | 2,120 | $ | 756 | $ | (5,975 | ) | $ | (9,655 | ) | ||||||
|
Basic
and diluted net income/(loss) per common share
|
$ | .35 | $ | .12 | $ | (.97 | ) | $ | (1.58 | ) | ||||||
[85]
|
First
Quarter
|
Second
Quarter
|
Third
Quarter
|
Fourth
Quarter
|
|||||||||||||
|
2008
|
||||||||||||||||
|
Interest
income
|
$ | 23,858 | $ | 23,851 | $ | 23,777 | $ | 23,730 | ||||||||
|
Interest
expense
|
11,829 | 10,627 | 10,576 | 10,011 | ||||||||||||
|
Net
interest income
|
12,029 | 13,224 | 13,201 | 13,719 | ||||||||||||
|
Provision
for loan losses
|
1,387 | 966 | 4,217 | 6,355 | ||||||||||||
|
Other
income
|
3,941 | 4,493 | 3,778 | 3,554 | ||||||||||||
|
Gains
(losses) on securities
|
399 | 77 | - | (2,473 | ) | |||||||||||
|
Other
expenses
|
10,354 | 10,651 | 9,976 | 9,592 | ||||||||||||
|
Income/(Loss)
before income taxes
|
4,628 | 6,177 | 2,786 | (1,147 | ) | |||||||||||
|
Applicable
income tax expense(benefit)
|
1,493 | 2,063 | 921 | (904 | ) | |||||||||||
|
Net
income/(loss)
|
$ | 3,135 | $ | 4,114 | $ | 1,865 | $ | (243 | ) | |||||||
|
Accumulated
preferred stock dividends and discount accretion
|
- | — | — | — | ||||||||||||
|
Net
(Loss) Attributable to/Income Available to Common
Shareholders
|
$ | 3,135 | $ | 4,114 | $ | 1,865 | $ | (243 | ) | |||||||
|
Basic
and diluted net income/(loss) per common share
|
$ | .51 | $ | .68 | $ | .30 | $ | (.04 | ) | |||||||
[86]
|
ITEM
9.
|
CHANGES
IN AND DISAGREEMENTS WITH ACCOUNTANTS ON ACCOUNTING AND FINANCIAL
DISCLOSURE
|
None.
|
CONTROLS
AND PROCEDURES
|
The
Corporation maintains disclosure controls and procedures that are designed to
ensure that information required to be disclosed in the Corporation’s reports
filed under the Securities Exchange Act of 1934 with the SEC, such as this
annual report, is recorded, processed, summarized and reported within the time
periods specified in those rules and forms, and that such information is
accumulated and communicated to the Corporation’s management, including the
Chief Executive Officer (“CEO”) and the Chief Financial Officer (“CFO”), as
appropriate, to allow for timely decisions regarding required
disclosure. A control system, no matter how well conceived and
operated, can provide only reasonable, not absolute, assurance that the
objectives of the control system are met. Further, the design of a
control system must reflect the fact that there are resource constraints, and
the benefits of controls must be considered relative to their
costs. These inherent limitations include the realities that
judgments in decision-making can be faulty, and that breakdowns can occur
because of simple error or mistake. Additionally, controls can be
circumvented by the individual acts of some persons, by collusion of two or more
people, or by management override of the control. The design of any
system of controls also is based in part upon certain assumptions about the
likelihood of future events, and there can be no assurance that any design will
succeed in achieving its stated goals under all potential future conditions;
over time, a control may become inadequate because of changes in conditions, or
the degree of compliance with the policies or procedures may
deteriorate.
An
evaluation of the effectiveness of these disclosure controls as of December 31,
2009 was carried out under the supervision and with the participation of the
Corporation’s management, including the CEO and the CFO. Based on
that evaluation, the Corporation’s management, including the CEO and the CFO,
has concluded that the Corporation’s disclosure controls and procedures are, in
fact, effective at the reasonable assurance level.
During
the fourth quarter of 2009, there was no change in the Corporation’s internal
control over financial reporting that has materially affected, or is reasonably
likely to materially affect, the Corporation’s internal control over financial
reporting.
As
required by Section 404 of the Sarbanes-Oxley Act of 2002, management has
performed an evaluation and testing of the Corporation’s internal control over
financial reporting as of December 31, 2009. Management’s report on
the Corporation’s internal control over financial reporting and the related
attestation report of the Corporation’s independent registered public accounting
firm are included on the following pages.
[87]
Management’s
Report on Internal Control Over Financial Reporting
The Board
of Directors and Shareholders
First
United Corporation
The
Corporation’s management is responsible for establishing and maintaining
adequate internal control over financial reporting. This internal
control system was designed to provide reasonable assurance to management and
the Board of Directors as to the reliability of the Corporation’s financial
reporting and the preparation and presentation of financial statements for
external purposes in accordance with accounting principles generally accepted in
the United States, as well as to safeguard assets from unauthorized use or
disposition.
An
internal control system, no matter how well designed, has inherent
limitations. Therefore, even those systems determined to be effective
can provide only reasonable assurance with respect to financial statement
preparation and presentation and may not prevent or detect misstatements in the
financial statements or the unauthorized use or disposition of the Corporation’s
assets. Also, projections of any evaluation of effectiveness of
internal controls to future periods are subject to the risk that controls may
become inadequate because of changes in conditions, or that the degree of
compliance with policies and procedures may deteriorate.
Management
assessed the effectiveness of the Corporation’s internal control over financial
reporting as of December 31, 2009, based on the criteria set forth by the
Committee of Sponsoring Organizations of the Treadway Commission (COSO) in
Internal Control—Integrated Framework. Based on this assessment and
on the foregoing criteria, management has concluded that, as of December 31,
2009, the Corporation’s internal control over financial reporting is
effective.
ParenteBeard
LLC, an independent registered public accounting firm, has audited the
Consolidated Financial Statements of the Corporation for the year ended December
31, 2009, appearing elsewhere in this annual report, and has issued an
attestation report on the effectiveness of the Corporation’s internal control
over financial reporting as of December 31, 2009, as stated in their report,
which is included herein.
|
/s/ William B. Grant
|
/s/ Carissa L.
Rodeheaver
|
|
|
William
B. Grant, Esq., CFP
|
Carissa
L. Rodeheaver, CPA, CFP
|
|
|
Chairman
of the Board and
|
Executive
Vice President and
|
|
|
Chief
Executive Officer
|
Chief
Financial Officer
|
[88]
REPORT
OF INDEPENDENT REGISTERED PUBLIC ACCOUNTING FIRM
To the
Board of Directors and Shareholders
First
United Corporation
Oakland,
Maryland
We have
audited First United Corporation’s internal control over financial reporting as
of December 31, 2009, based on criteria established in Internal Control—Integrated
Framework issued by the Committee of Sponsoring Organizations of the
Treadway Commission (COSO). First United Corporation’s management is
responsible for maintaining effective internal control over financial reporting
and for its assessment of the effectiveness of internal control over financial
reporting included in the accompanying Management's Report on Internal Control
Over Financial Reporting. Our responsibility is to express an opinion
on the Corporation’s internal control over financial reporting based on our
audit.
We
conducted our audit in accordance with the standards of the Public Company
Accounting Oversight Board (United States). Those standards require
that we plan and perform the audit to obtain reasonable assurance about whether
effective internal control over financial reporting was maintained in all
material respects. Our audit of internal control over financial
reporting included obtaining an understanding of internal control over financial
reporting, assessing the risk that a material weakness exists, and testing and
evaluating the design and operating effectiveness of internal control, based on
the assessed risk. Our audit also included performing such other
procedures as we considered necessary in the circumstances. We
believe that our audit provides a reasonable basis for our opinion.
A
company’s internal control over financial reporting is a process designed to
provide reasonable assurance regarding the reliability of financial reporting
and the preparation of financial statements for external purposes in accordance
with generally accepted accounting principles. A company’s internal
control over financial reporting includes those policies and procedures that (1)
pertain to the maintenance of records that, in reasonable detail, accurately and
fairly reflect the transactions and dispositions of the assets of the company;
(2) provide reasonable assurance that transactions are recorded as necessary to
permit preparation of financial statements in accordance with generally accepted
accounting principles, and that receipts and expenditures of the company are
being made only in accordance with authorizations of management and directors of
the company; and (3) provide reasonable assurance regarding prevention or timely
detection of unauthorized acquisition, use, or disposition of the company’s
assets that could have a material effect on the financial
statements.
Because
of its inherent limitations, internal control over financial reporting may not
prevent or detect misstatements. Also, projections of any evaluation
of effectiveness to future periods are subject to the risk that controls may
become inadequate because of changes in conditions, or that the degree of
compliance with the policies or procedures may deteriorate.
In our
opinion, First United Corporation maintained, in all material respects,
effective internal control over financial reporting as of December 31, 2009,
based on criteria established in Internal Control—Integrated
Framework issued by the Committee of Sponsoring Organizations of the
Treadway Commission (COSO).
We have
also audited, in accordance with the standards of the Public Company Accounting
Oversight Board (United States), the consolidated statements of financial
condition and the related consolidated statements of operations, changes in
shareholders’ equity, and cash flows of First United Corporation, and our report
dated March 11, 2010, expressed an unqualified opinion.
/s/
ParenteBeard LLC
|
Pittsburgh,
Pennsylvania
|
|
|
March
11, 2010
|
[89]
|
ITEM
9B.
|
OTHER
INFORMATION
|
None.
|
DIRECTORS,
EXECUTIVE OFFICERS AND CORPORATE
GOVERNANCE
|
The
Corporation has adopted a Code of Ethics applicable to its principal executive
officer, principal financial officer, principal accounting officer, or
controller, or persons performing similar functions, a Code of Ethics applicable
to all employees, and a Code of Ethics applicable to members of the Board of
Directors. Copies of the Corporation’s Codes of Ethics are available
free of charge upon request to Mr. Jason B. Rush, Chief Risk and Operations
Officer , First United Corporation, c/o First United Bank & Trust, P.O. Box
9, Oakland, MD 21550-0009 or on the Corporation’s website at
www.mybank4.com.
All other
information required by this item is incorporated herein by reference to the
Corporation’s definitive Proxy Statement for the 2010 Annual Meeting of
Shareholders to be filed with the SEC pursuant to Regulation 14A.
|
ITEM
11.
|
EXECUTIVE
COMPENSATION
|
The
information required by this item is incorporated herein by reference to the
Corporation’s definitive Proxy Statement for the 2010 Annual Meeting of
Shareholders to be filed with the SEC pursuant to Regulation 14A.
|
ITEM
12.
|
SECURITY
OWNERSHIP OF CERTAIN BENEFICIAL OWNERS AND MANAGEMENT AND RELATED
STOCKHOLDER MATTERS
|
The
information regarding the Corporation’s equity compensation plans required by
this item is incorporated herein by reference to Item 5 of Part II of this
annual report. All other information required by this item is
incorporated herein by reference to the Corporation’s definitive Proxy Statement
for the 2010 Annual Meeting of Shareholders to be filed with the SEC pursuant to
Regulation 14A.
|
ITEM
13.
|
CERTAIN
RELATIONSHIPS AND RELATED TRANSACTIONS, AND DIRECTOR
INDEPENDENCE
|
The
information required by this item is incorporated herein by reference to the
Corporation’s definitive Proxy Statement for the 2010 Annual Meeting of
Shareholders to be filed with the SEC pursuant to Regulation 14A.
|
ITEM
14.
|
PRINCIPAL
ACCOUNTANT FEES AND SERVICES
|
The
information required by this item is incorporated herein by reference to the
Corporation’s definitive Proxy Statement for the 2010 Annual Meeting of
Shareholders to be filed with the SEC pursuant to Regulation 14A.
|
EXHIBITS
AND FINANCIAL STATEMENT SCHEDULES
|
(a)(1), (2) and
(c) Financial Statements.
Report of
Independent Registered Public Accounting Firm
Consolidated
Statements of Financial Condition as of December 31, 2009 and 2008
Consolidated
Statements of Operations for the years ended December 31, 2009, 2008 and
2007
Consolidated
Statements of Changes in Shareholders’ Equity for the years ended December 31,
2009, 2008and 2007
Consolidated
Statements of Cash Flows for the years ended December 31, 2009, 2008 and
2007
Notes to
Consolidated Financial Statements for the years ended December 31, 2009, 2008
and 2007
(a)(3) and
(b) Exhibits.
[90]
The
exhibits filed or furnished with this annual report are shown on the Exhibit
Index that follows the signatures to this annual report, which is incorporated
herein by reference.
SIGNATURES
Pursuant
to the requirements of Section 13 or 15(d) of the Securities Exchange Act of
1934, the registrant has duly caused this report to be signed on its behalf by
the undersigned, thereunto duly authorized.
| FIRST UNITED CORPORATION | ||
|
Dated: March
11, 2010
|
By:
|
/s/ William B. Grant
|
|
William
B. Grant, Esq., CFP
|
||
|
Chairman
of the Board and Chief Executive
Officer
|
||
Pursuant
to the requirements of the Securities Exchange Act of 1934, this report has been
signed below by the following persons on behalf of the registrant and in the
capacities indicated.
|
/s/ William B. Grant
|
/s/ David J. Beachy
|
|
|
(William
B. Grant) Director, Chief Executive Officer
|
(David
J. Beachy) Director—March 11, 2010
|
|
|
March
11, 2010
|
||
|
/s/ M. Kathryn Burkey
|
/s/ Faye E. Cannon
|
|
|
(M.
Kathryn Burkey) Director—March 11, 2010
|
(Faye
E. Cannon) Director—March 11, 2010
|
|
|
/s/ Paul Cox, Jr.
|
/s/ Raymond F. Hinkle
|
|
|
(Paul
Cox, Jr.) Director—March 11, 2010
|
(Raymond
F. Hinkle) Director—March 11, 2010
|
|
|
/s/ Robert W. Kurtz
|
/s/ John W. McCullough
|
|
|
(Robert
W. Kurtz) Director—March 11, 2010
|
(John
W. McCullough) Director—March 11, 2010
|
|
|
/s/ Elaine L. McDonald
|
/s/ Donald E. Moran
|
|
|
(Elaine
L. McDonald) Director—March 11, 2010
|
(Donald
E. Moran) Director—March 11, 2010
|
|
|
/s/ Carissa L. Rodeheaver
|
/s/ Gary R. Ruddell
|
|
|
(Carissa L. Rodeheaver) EVP & Chief Financial Officer-
|
(Gary
R. Ruddell) Director—March 11, 2010
|
|
|
March
11, 2010
|
||
|
/s/ I. Robert Rudy
|
/s/ Richard G. Stanton
|
|
|
(I.
Robert Rudy) Director—March 11, 2010
|
(Richard
G. Stanton) Director – March 11, 2010
|
|
|
/s/ Robert G. Stuck
|
/s/ H. Andrew Walls III
|
|
|
(Robert
G. Stuck) Director—March 11, 2010
|
(H.
Andrew Walls III) Director—March 11,
2010
|
[91]
EXHIBIT
INDEX
|
Exhibit
|
Description
|
|
|
3.1
|
Amended
and Restated Articles of Incorporation (incorporated by reference to
Exhibit 3.1 of the Corporation's Quarterly Report on Form 10-Q for the
period ended June 30, 1998)
|
|
|
3.2(i)
|
Amended
and Restated By-Laws (incorporated by reference to Exhibit 3.2(i) of the
Corporation’s Annual Report on Form 10-K for the year ended December 31,
2008)
|
|
|
3.2(ii)
|
First
Amendment to Amended and Restated Bylaws (incorporated by reference to
Exhibit 3.2(ii) of the Corporation’s Annual Report on Form 10-K for the
year ended December 31, 2008)
|
|
|
3.2(iii)
|
Second
Amendment to Amended and Restated Bylaws (incorporated by reference to
Exhibit 3.2(iii) of the Corporation’s Annual Report on Form 10-K for the
year ended December 31, 2008)
|
|
|
4.1
|
Letter
Agreement, including the related Securities Purchase Agreement – Standard
Terms, dated January 30, 2009 by and between the Corporation and the U.S.
Department of Treasury (incorporated by reference to Exhibit 10.1 of the
Corporation’s Form 8-K filed on February 2, 2009)
|
|
|
4.2
|
Certificate
of Notice, including the Certificate of Designations incorporated therein,
relating to the Fixed Rate Cumulative Perpetual Preferred Stock, Series A
(incorporated by reference Exhibit 4.1 of the Corporation’s Form 8-K filed
on February 2, 2009)
|
|
|
4.3
|
Sample
Stock Certificate for Series A Preferred Stock for the Series A Preferred
Stock (incorporated by reference Exhibit 4.3 of the Corporation’s Form 8-K
filed on February 2, 2009)
|
|
|
4.4
|
Common
Stock Purchase Warrant dated January 30, 2009 issued to the U.S.
Department of Treasury (incorporated by reference to Exhibit 4.2 of the
Corporation’s Form 8-K filed on February 2, 2009)
|
|
|
4.5
|
Amended
and Restated Declaration of Trust, dated as of December 30, 2009
(incorporated by reference to Exhibit 4.1 of the Corporation's Current
Report on Form 8-K filed on December 30, 2009)
|
|
|
4.6
|
Indenture,
dated as of December 30, 2009 (incorporated by reference to Exhibit 4.2 of
the Corporation's Current Report on Form 8-K filed on December 30,
2009)
|
|
|
4.7
|
Preferred
Securities Guarantee Agreement, dated as of December 30, 2009
(incorporated by reference to Exhibit 4.3 of the Corporation's Current
Report on Form 8-K filed on December 30, 2009)
|
|
|
4.8
|
Form
of Preferred Security Certificate of First United Statutory Trust III
(included as Exhibit C of Exhibit 4.5)
|
|
|
4.9
|
Form
of Common Security Certificate of First United Statutory Trust III
(included as Exhibit B of Exhibit 4.5)
|
|
|
4.10
|
Form
of Junior Subordinated Debenture of First United Corporation (included as
Exhibit A of Exhibit 4.6)
|
|
|
10.1
|
First
United Bank & Trust Amended and Restated Supplemental Executive
Retirement Plan (“SERP”) (incorporated by reference to Exhibit 10.4 of the
Corporation’s Current Report on Form 8-K filed on February 21,
2007)
|
|
|
10.2
|
Amended
and Restated SERP Agreement with William B. Grant (incorporated by
reference to Exhibit 10.5 of the Corporation’s Current Report on Form 8-K
filed on February 21, 2007)
|
|
|
10.3
|
Form
of Amended and Restated SERP Agreement with executive officers other than
William B. Grant (incorporated by reference to Exhibit 10.6 of the
Corporation’s Current Report on Form 8-K filed on February 21,
2007)
|
|
|
10.4
|
Form
of Endorsement Split Dollar Agreement between the Bank and each of William
B. Grant, Robert W. Kurtz, Jeannette R. Fitzwater, Phillip D. Frantz,
Eugene D. Helbig, Jr., Steven M. Lantz, Robin M. Murray, Carissa L.
Rodeheaver, and Frederick A. Thayer, IV (incorporated by reference to
Exhibit 10.3 of the Corporation’s Quarterly Report on Form 10-Q for the
period ended September 30, 2003)
|
|
|
10.5
|
Amended
and Restated First United Corporation Executive and Director Deferred
Compensation Plan (incorporated by reference to Exhibit 10.1 of the
Corporation’s Current Report on Form 8-K filed on November 24,
2008)
|
|
|
10.6
|
Amended
and Restated First United Corporation Change in Control Severance Plan
(incorporated by reference to Exhibit 10.5 of the Corporation’s Current
Report on Form 8-K filed on June 23, 2008)
|
|
|
10.7
|
Form
of Change in Control Severance Plan Agreement with executive officers
other than William B. Grant (incorporated by reference to Exhibit 10.3 of
the Corporation’s Current Report on Form 8-K filed on February 21,
2007)
|
[92]
|
10.8
|
First
United Corporation Omnibus Equity Compensation Plan (incorporated by
reference to Appendix B to the Corporation’s 2007 definitive proxy
statement filed on March 23, 2007)
|
|
|
10.9
|
First
United Corporation Long-Term Incentive Plan (incorporated by reference to
Exhibit 10.1 of the Corporation’s Current Report on Form 8-K filed on June
23, 2008)
|
|
|
10.10
|
Restricted
Stock Agreement for William B. Grant (incorporated by reference to Exhibit
10.2 of the Corporation’s Current Report on Form 8-K filed on June 23,
2008)
|
|
|
10.11
|
Form
of Restricted Stock Agreement for Executive Officers other than the Chief
Executive Officer (incorporated by reference to Exhibit 10.3 of the
Corporation’s Current Report on Form 8-K filed on June 23,
2008)
|
|
|
10.12
|
First
United Corporation Executive Pay for Performance Plan (incorporated by
reference to Exhibit 10.4 of the Corporation’s Current Report on Form 8-K
filed on June 23, 2008)
|
|
|
10.13
|
Consulting
Agreement, dated as of December 7, 2009, among First United Corporation,
First United Bank & Trust and Robert W. Kurtz (incorporated by
reference to Exhibit 10.1 of the Corporation’s Current Report on Form 8-K
filed on December 7, 2009)
|
|
|
21
|
Subsidiaries
of the Corporation, incorporated by reference to the list of subsidiaries
in the discussion entitled “General” in Item 1 of Part I of this Annual
Report on Form 10-K.
|
|
|
23.1
|
Consent
of ParenteBeard LLC (filed herewith)
|
|
|
31.1
|
Certifications
of the CEO pursuant to Section 302 of the Sarbanes-Oxley Act (filed
herewith)
|
|
|
31.2
|
Certifications
of the CFO pursuant to Section 302 of the Sarbanes-Oxley Act (filed
herewith)
|
|
|
32.1
|
Certifications
pursuant to Section 906 of the Sarbanes-Oxley Act (furnished
herewith)
|
|
|
99.1
|
Certifications
of Principal Executive Officer pursuant to 31 C.F.R. § 30.15 (filed
herewith)
|
|
|
99.2
|
Certifications
of Principal Accounting Officer pursuant to 31 C.F.R. § 30.15 (filed
herewith)
|
[93]