Attached files
| file | filename |
|---|---|
| 8-K - WEX INC. 8-K - WEX Inc. | a52315945.htm |
Exhibit 99.1

WEX Third Quarter 2020 Earnings October 29, 2020
This earnings information contains forward-looking statements, including statements regarding:
financial guidance and potential for providing the same; assumptions underlying the Company's future financial performance; future growth opportunities and expectations; and, expectations for the macro environment. Any statements that are not
statements of historical facts may be deemed to be forward-looking statements. When used in this earnings information, the words “anticipate,” “believe,” “continue,” “could,” “estimate,” “expect,” “intend,” “may,” “plan,” “project” and
similar expressions are intended to identify forward-looking statements, although not all forward-looking statements contain such words. These forward-looking statements are subject to a number of risks and uncertainties that could cause
actual results to differ materially, including: the extent to which the coronavirus (COVID-19) pandemic and measures taken in response thereto adversely impact our business, results of operations and financial condition in excess of current
expectations; the effects of general economic conditions on fueling patterns as well as payment and transaction processing activity; the impact of foreign currency exchange rates on the Company’s operations, revenue and income; changes in
interest rates; the impact of fluctuations in fuel prices including the impact of any continued reductions in fuel price and the resulting impact on our revenues and net income; the effects of the Company’s business expansion and acquisition
efforts; potential adverse changes to business or employee relationships, including those resulting from the completion of an acquisition; competitive responses to any acquisitions; uncertainty of the expected financial performance of the
combined operations following completion of an acquisition; the failure to complete or successfully integrate the Company's acquisitions; the ability to realize anticipated synergies and cost savings; unexpected costs, charges or expenses
resulting from an acquisition; the Company's ability to successfully acquire, integrate, operate and expand commercial fuel card programs; the failure of corporate investments to result in anticipated strategic value; the impact and size of
credit losses; the impact of changes to the Company's credit standards; breaches of the Company’s technology systems or those of the Company's third-party service providers and any resulting negative impact on the Company's reputation,
liabilities or relationships with customers or merchants; the Company’s failure to maintain or renew key commercial agreements; failure to expand the Company’s technological capabilities and service offerings as rapidly as the Company’s
competitors; failure to successfully implement the Company's information technology strategies and capabilities in connection with its technology outsourcing and insourcing arrangements and any resulting cost associated with that failure; the
actions of regulatory bodies, including banking and securities regulators, or possible changes in banking or financial regulations impacting the Company’s industrial bank, the Company as the corporate parent or other subsidiaries or
affiliates; legal, political and economic uncertainty surrounding the United Kingdom's departure from the European Union; the impact of the transition from LIBOR as a global benchmark to a replacement rate; the impact of the Company’s
outstanding notes on its operations; the impact of increased leverage on the Company's operations, results or borrowing capacity generally, and as a result of acquisitions specifically; the impact of sales or dispositions of significant
amounts of the Company’s outstanding common stock into the public market, or the perception that such sales or dispositions could occur; the possible dilution to the Company’s stockholders caused by the issuance of additional shares of common
stock or equity linked securities, the incurrence of impairment charges if our assessment of the fair value of certain of the Company's reporting units changes; the uncertainties of litigation, including the legal proceedings with respect to
the purchase agreement relating to the proposed eNett and Optal acquisition; as well as other risks and uncertainties identified in Item 1A of our annual report on Form 10-K for the year ended December 31, 2019 and our quarterly reports on
Forms 10-Q for the quarters ended March 31, 2020 and June 30, 2020, filed respectively with the Securities and Exchange Commission on February 28, 2020, May 11, 2020 and August 5, 2020. The Company's forward-looking statements do not reflect
the potential future impact of any alliance, merger, acquisition, disposition or stock repurchases. The forward-looking statements speak only as of the date of this earnings release and undue reliance should not be placed on these statements.
The Company disclaims any obligation to update any forward-looking statements as a result of new information, future events or otherwise. WEX Forward-Looking Statements Non-GAAP Information:For additional important information and
disclosure regarding our use of non-GAAP metrics, specifically adjusted net income attributable to shareholders and adjusted operating income, please see our most recent earnings release, issued on October 29, 2020. See the Appendix to this
presentation for an explanation and reconciliation of (i) non-GAAP adjusted net income attributable to shareholders (or "adjusted net income" or “ANI”) to GAAP net (loss) income attributable to shareholders, and (ii) ANI per diluted share to
GAAP net (loss) income per diluted share.
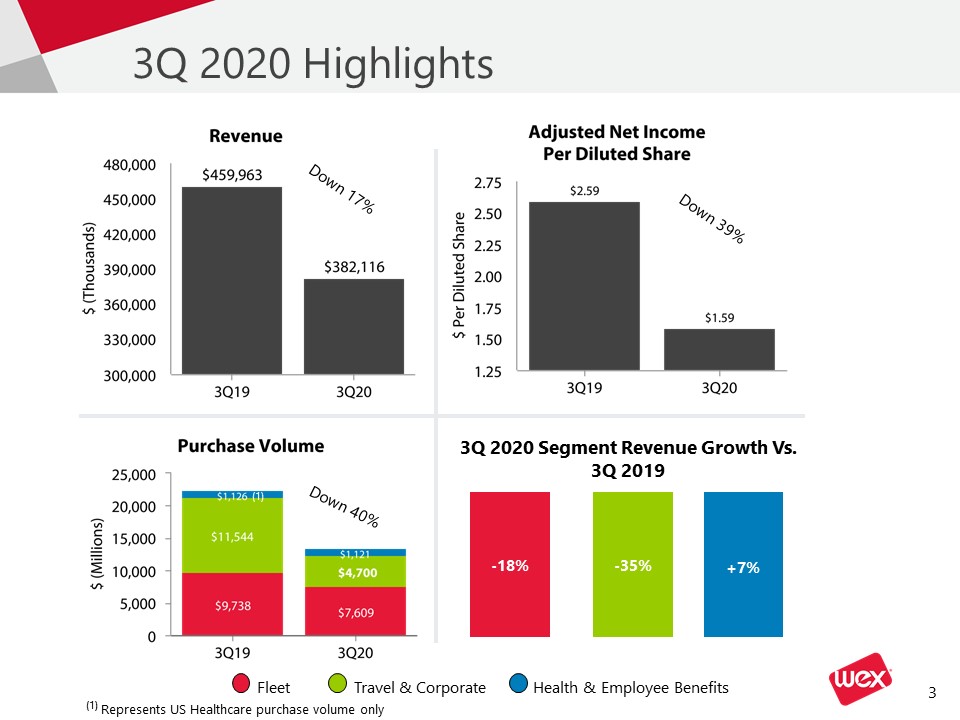
3Q 2020 Highlights Fleet Travel & Corporate Health & Employee Benefits Down 17%
Down 39% Down 40% 3Q 2020 Segment Revenue Growth
Vs. 3Q 2019 +7% -35% -18% (1) (1) Represents US Healthcare purchase volume only
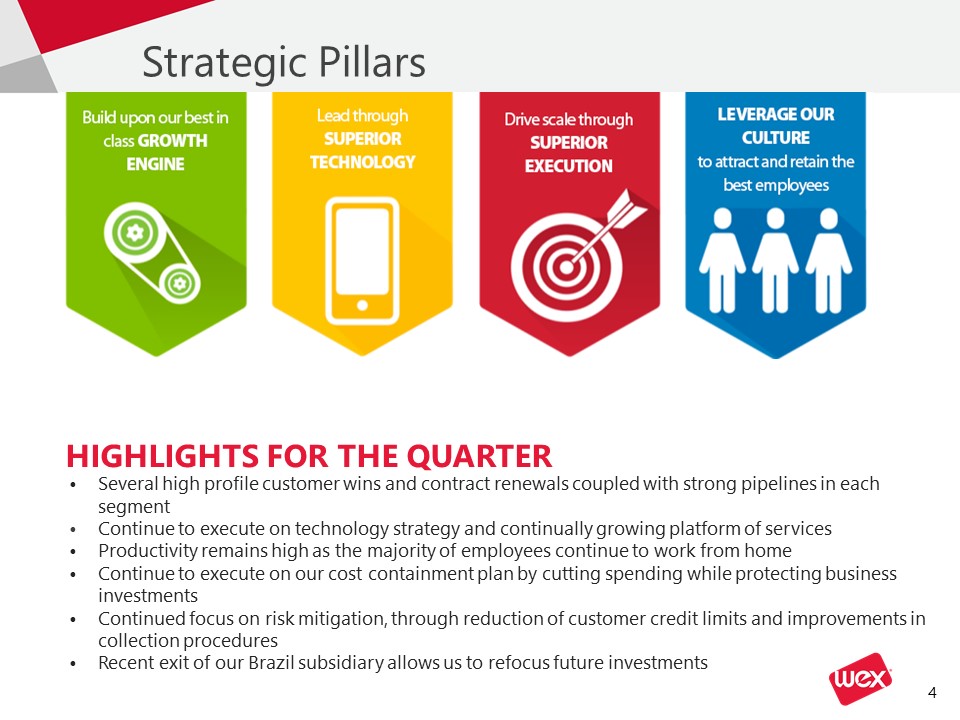
Strategic Pillars HIGHLIGHTS FOR THE QUARTER Several high profile customer wins and contract
renewals coupled with strong pipelines in each segmentContinue to execute on technology strategy and continually growing platform of services Productivity remains high as the majority of employees continue to work from homeContinue to execute
on our cost containment plan by cutting spending while protecting business investments Continued focus on risk mitigation, through reduction of customer credit limits and improvements in collection proceduresRecent exit of our Brazil
subsidiary allows us to refocus future investments
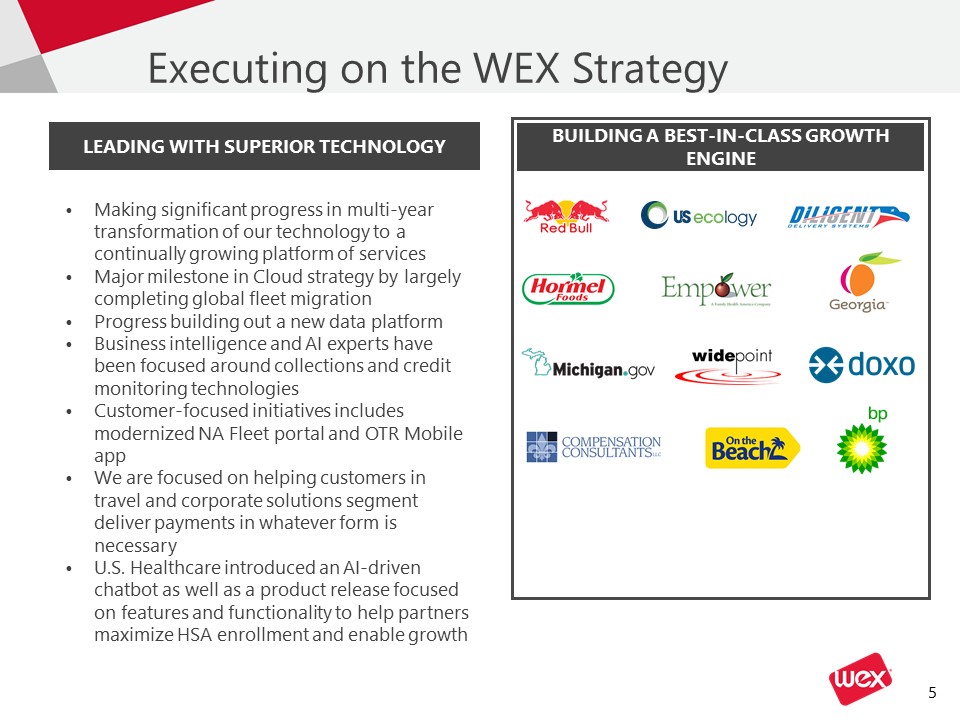
Executing on the WEX Strategy Making significant progress in multi-year transformation of our
technology to a continually growing platform of servicesMajor milestone in Cloud strategy by largely completing global fleet migrationProgress building out a new data platformBusiness intelligence and AI experts have been focused around
collections and credit monitoring technologiesCustomer-focused initiatives includes modernized NA Fleet portal and OTR Mobile app We are focused on helping customers in travel and corporate solutions segment deliver payments in whatever form
is necessary U.S. Healthcare introduced an AI-driven chatbot as well as a product release focused on features and functionality to help partners maximize HSA enrollment and enable growth BUILDING A BEST-IN-CLASS GROWTH
ENGINE LEADING WITH SUPERIOR TECHNOLOGY
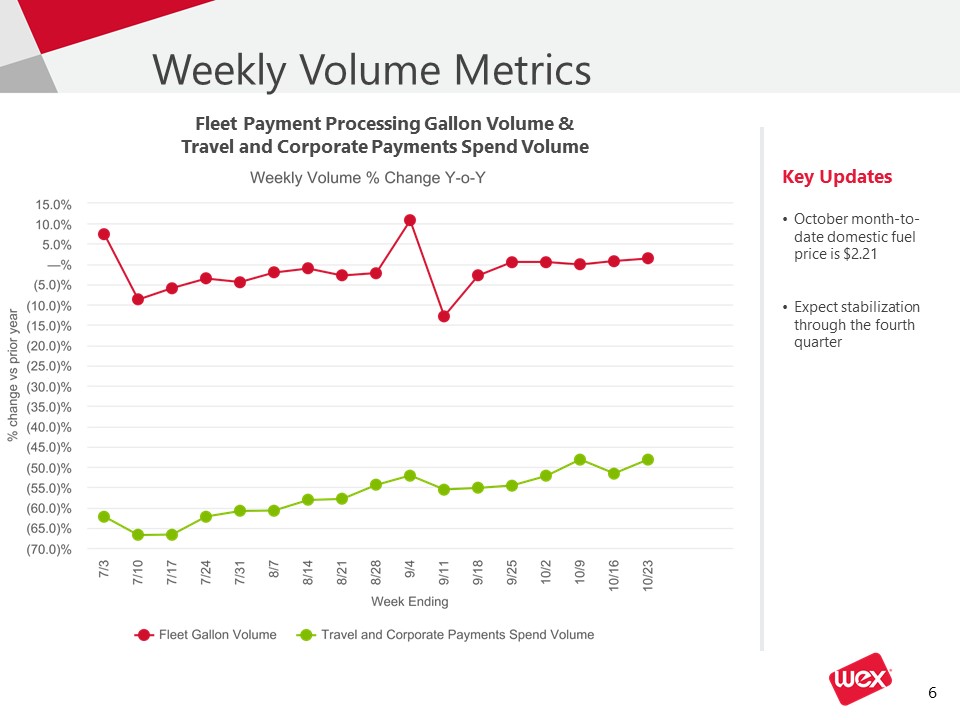
Weekly Volume Metrics Key UpdatesOctober month-to-date domestic fuel price is $2.21Expect
stabilization through the fourth quarter Fleet Payment Processing Gallon Volume & Travel and Corporate Payments Spend Volume
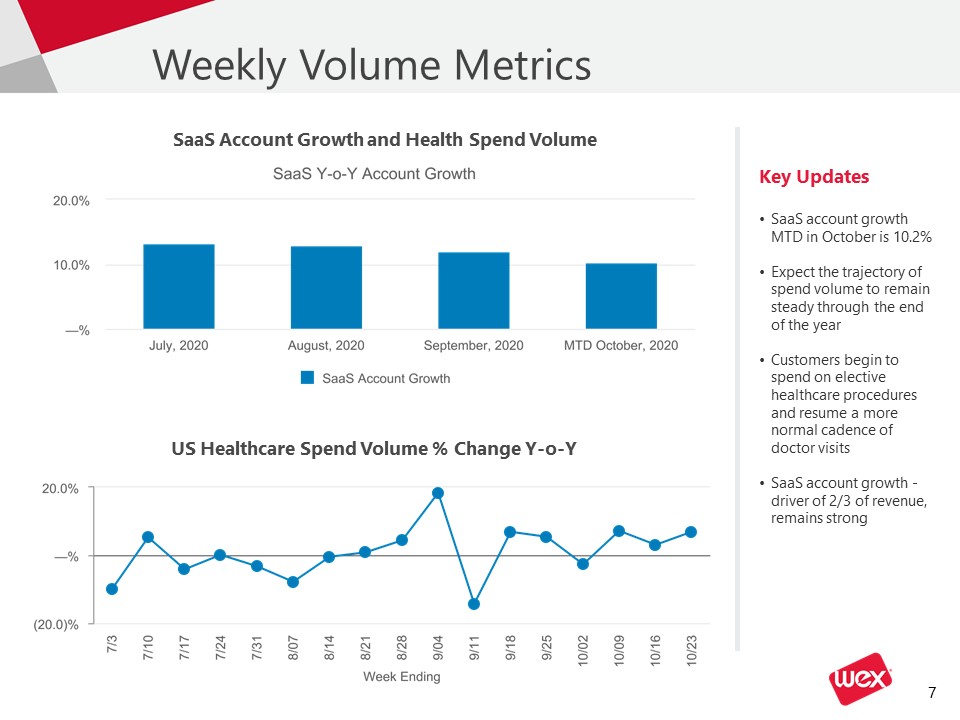
Weekly Volume Metrics Key UpdatesSaaS account growth MTD in October is 10.2%Expect the trajectory of
spend volume to remain steady through the end of the year
Customers begin to spend on elective healthcare procedures and resume a more normal cadence of doctor visits
SaaS account growth - driver of 2/3 of revenue, remains strong SaaS
Account Growth and Health Spend Volume US Healthcare Spend Volume % Change Y-o-Y

WEX Third Quarter 2020 Financial Results
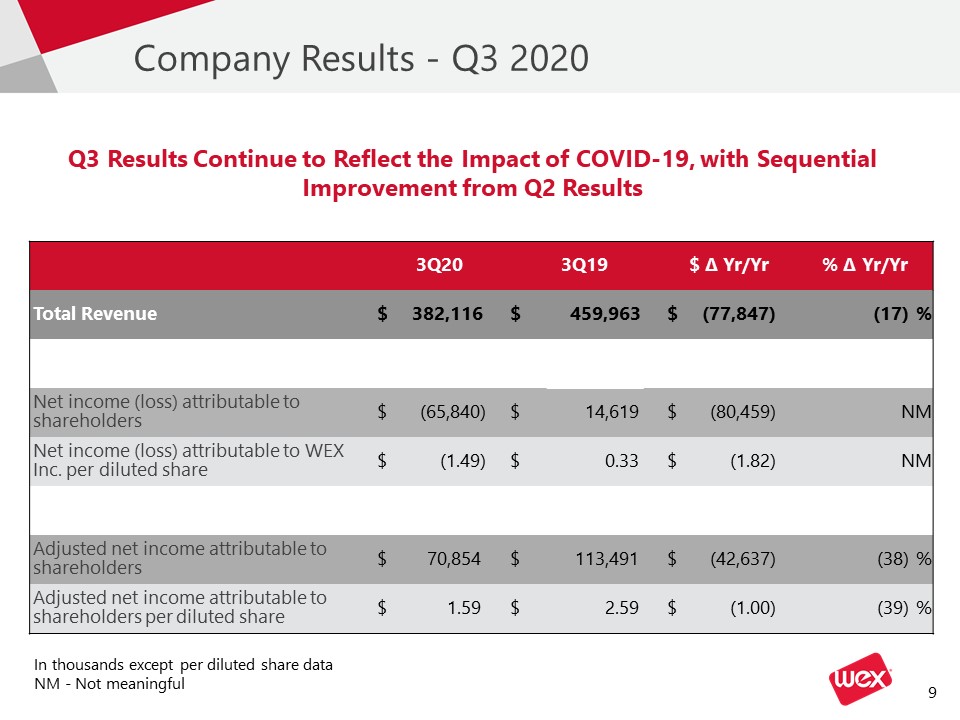
Company Results - Q3 2020 3Q20 3Q19 $ ∆ Yr/Yr % ∆ Yr/Yr Total
Revenue $ 382,116 $ 459,963 459,963 $ (77,847) (77,847) (17) % Net income (loss) attributable to shareholders $ (65,840) $ 14,619 14,619 $ (80,459) NM Net income
(loss) attributable to WEX Inc. per diluted share $ (1.49) $ 0.33 0.33 $ (1.82) NM Adjusted net income attributable to
shareholders $ 70,854 $ 113,491 $ (42,637) (38) % Adjusted net income attributable to shareholders per diluted share $ 1.59 $ 2.59 $ (1.00) (39) % In thousands except per diluted share dataNM -
Not meaningful Q3 Results Continue to Reflect the Impact of COVID-19,
with Sequential Improvement from Q2 Results
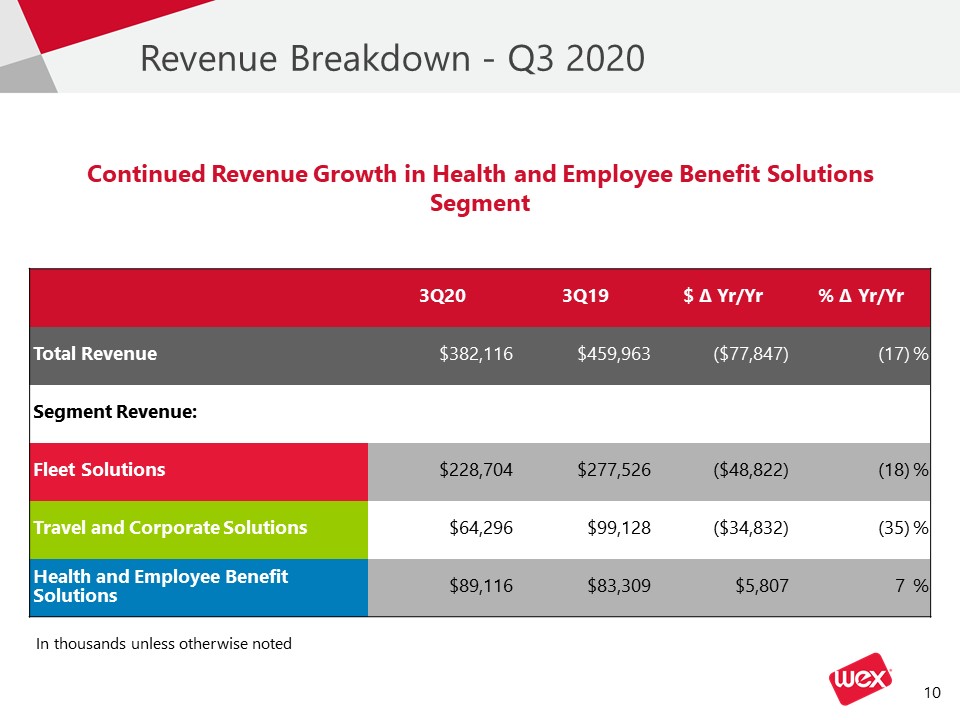
Revenue Breakdown - Q3 2020 3Q20 3Q19 $ ∆ Yr/Yr % ∆ Yr/Yr Total
Revenue $382,116 $459,963 ($77,847) (17) % Segment Revenue: Fleet Solutions $228,704 $277,526 ($48,822) (18) % Travel and Corporate Solutions $64,296 $99,128 ($34,832) (35) % Health and Employee Benefit
Solutions $89,116 $83,309 $5,807 7 % Continued Revenue Growth in Health and
Employee Benefit Solutions Segment In thousands unless otherwise noted
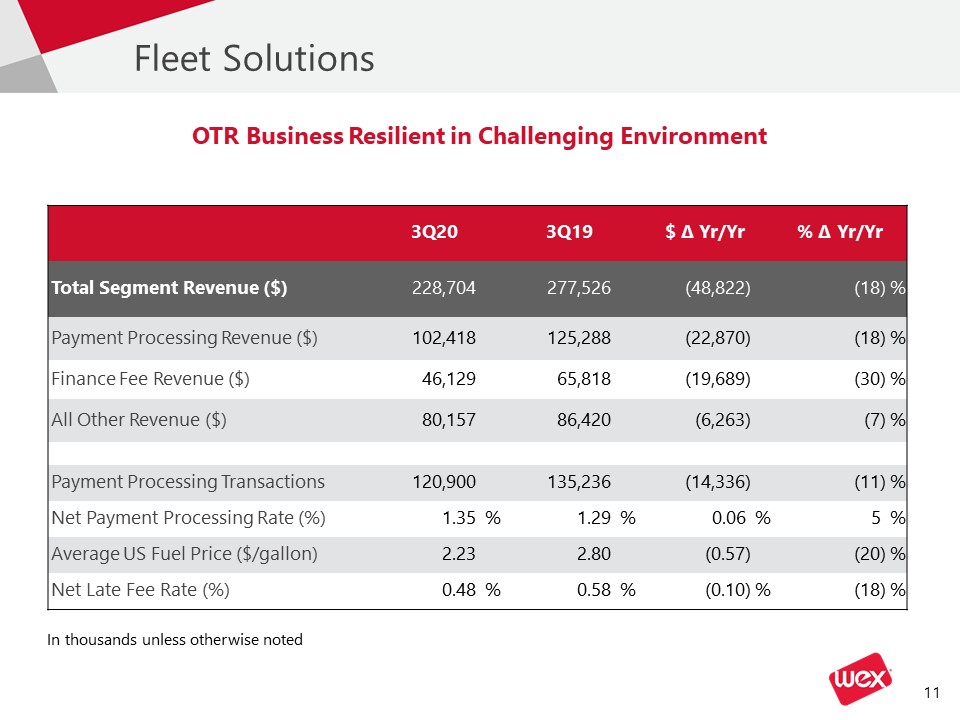
Fleet Solutions 3Q20 3Q19 $ ∆ Yr/Yr % ∆ Yr/Yr Total Segment Revenue
($) 228,704 277,526 (48,822) (18) % Payment Processing Revenue ($) 102,418 125,288 (22,870) (18) % Finance Fee Revenue ($) 46,129 65,818 (19,689) (30) % All Other Revenue
($) 80,157 86,420 (6,263) (7) % Payment Processing Transactions 120,900 135,236 (14,336) (11) % Net Payment Processing Rate (%) 1.35 % 1.29 % 0.06 % 5 % Average US Fuel Price
($/gallon) 2.23 2.80 (0.57) (20) % Net Late Fee Rate (%) 0.48 % 0.58 % (0.10) % (18) % OTR Business Resilient in Challenging Environment In thousands unless otherwise noted
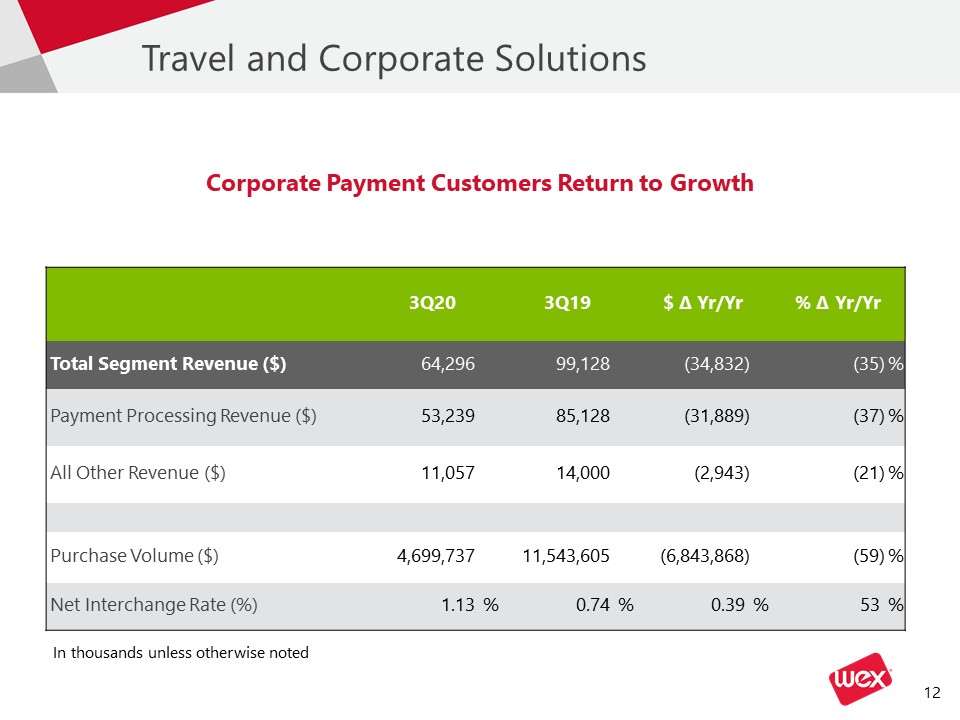
Travel and Corporate Solutions 3Q20 3Q19 $ ∆ Yr/Yr % ∆ Yr/Yr Total Segment Revenue
($) 64,296 99,128 (34,832) (35) % Payment Processing Revenue ($) 53,239 85,128 (31,889) (37) % All Other Revenue ($) 11,057 14,000 (2,943) (21) % Purchase Volume
($) 4,699,737 11,543,605 (6,843,868) (59) % Net Interchange Rate (%) 1.13 % 0.74 % 0.39 % 53 % Corporate Payment Customers Return to Growth In thousands unless otherwise noted
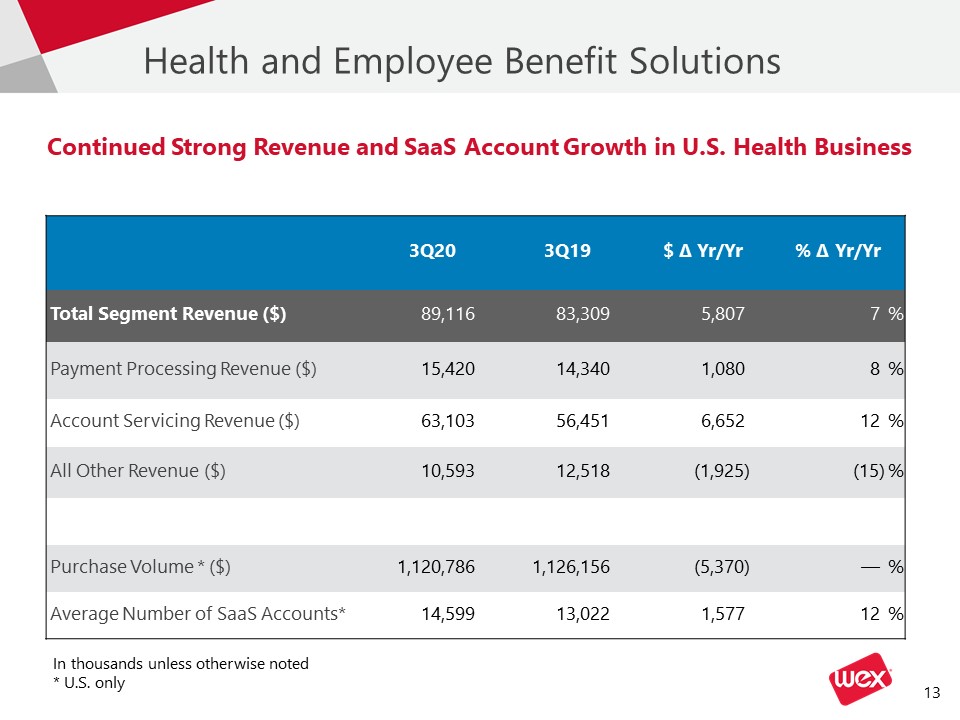
Health and Employee Benefit Solutions 3Q20 3Q19 $ ∆ Yr/Yr % ∆ Yr/Yr Total Segment
Revenue ($) 89,116 83,309 5,807 7 % Payment Processing Revenue ($) 15,420 14,340 1,080 8 % Account Servicing Revenue ($) 63,103 56,451 6,652 12 % All Other Revenue
($) 10,593 12,518 (1,925) (15) % Purchase Volume * ($) 1,120,786 1,126,156 (5,370) — % Average Number of SaaS Accounts* 14,599 13,022 1,577 12 % Continued Strong Revenue and SaaS
Account Growth in U.S. Health Business In thousands unless otherwise noted* U.S. only
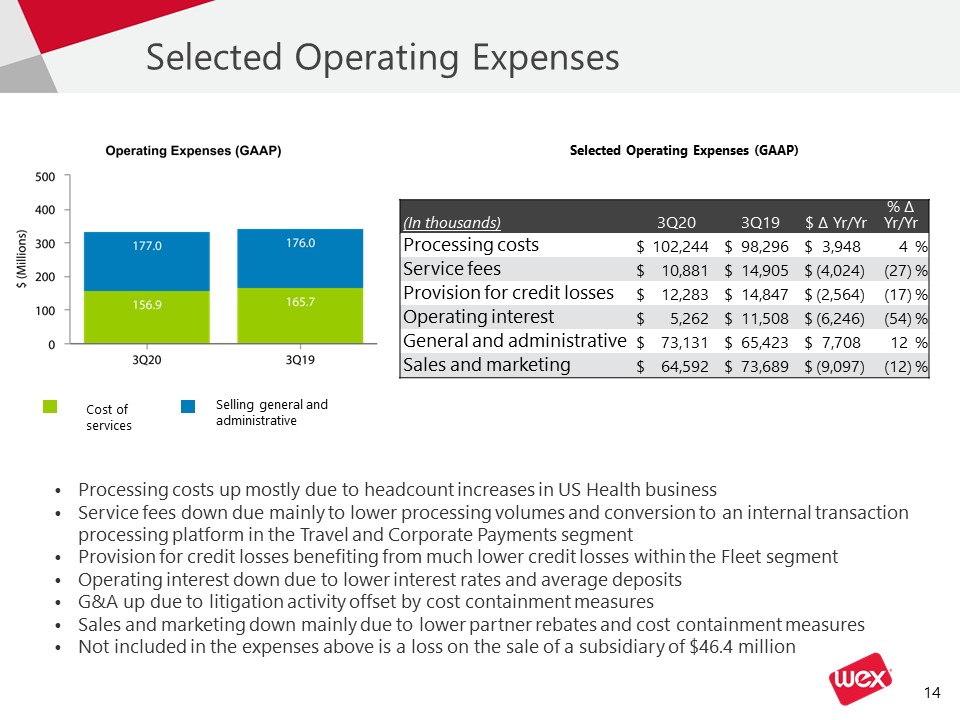
Selected Operating Expenses Processing costs up mostly due to headcount increases in US Health
businessService fees down due mainly to lower processing volumes and conversion to an internal transaction processing platform in the Travel and Corporate Payments segmentProvision for credit losses benefiting from much lower credit losses
within the Fleet segment Operating interest down due to lower interest rates and average depositsG&A up due to litigation activity offset by cost containment measuresSales and marketing down mainly due to lower partner rebates and cost
containment measuresNot included in the expenses above is a loss on the sale of a subsidiary of $46.4 million (In thousands) 3Q20 3Q19 $ ∆ Yr/Yr % ∆ Yr/Yr Processing
costs $ 102,244 $ 98,296 $ 3,948 4 % Service fees $ 10,881 $ 14,905 $ (4,024) (27) % Provision for credit losses $ 12,283 $ 14,847 $ (2,564) (17) % Operating
interest $ 5,262 $ 11,508 $ (6,246) (54) % General and administrative $ 73,131 $ 65,423 $ 7,708 12 % Sales and marketing $ 64,592 $ 73,689 $ (9,097) (12) % Cost of services Selling
general and administrative Selected Operating Expenses (GAAP)
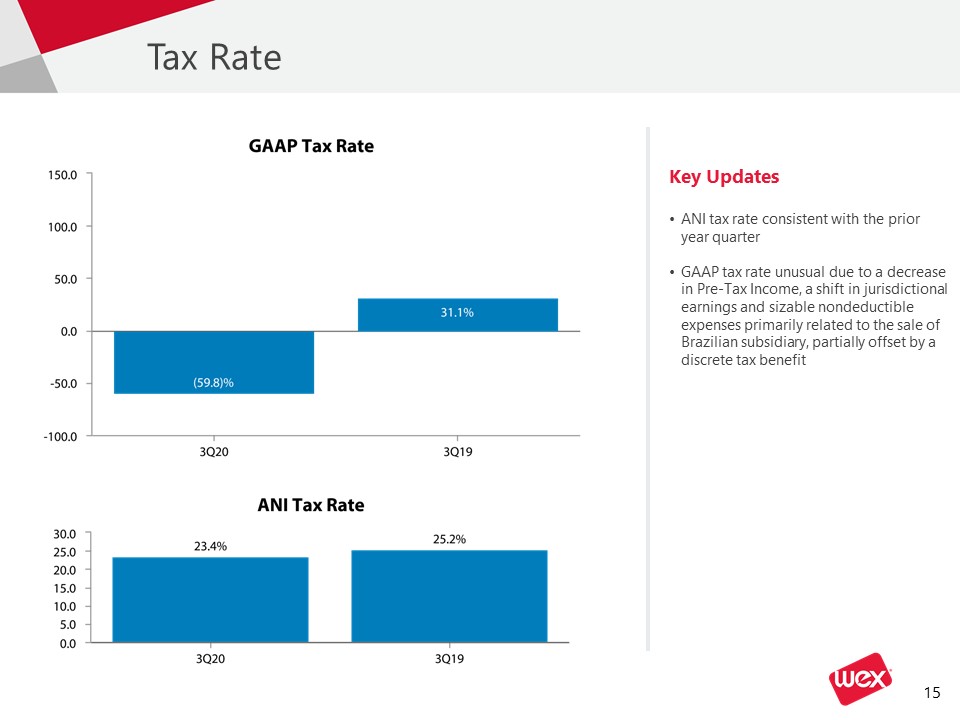
Tax Rate Key UpdatesANI tax rate consistent with the prior year quarterGAAP tax rate unusual due to a
decrease in Pre-Tax Income, a shift in jurisdictional earnings and sizable nondeductible expenses primarily related to the sale of Brazilian subsidiary, partially offset by a discrete tax benefit
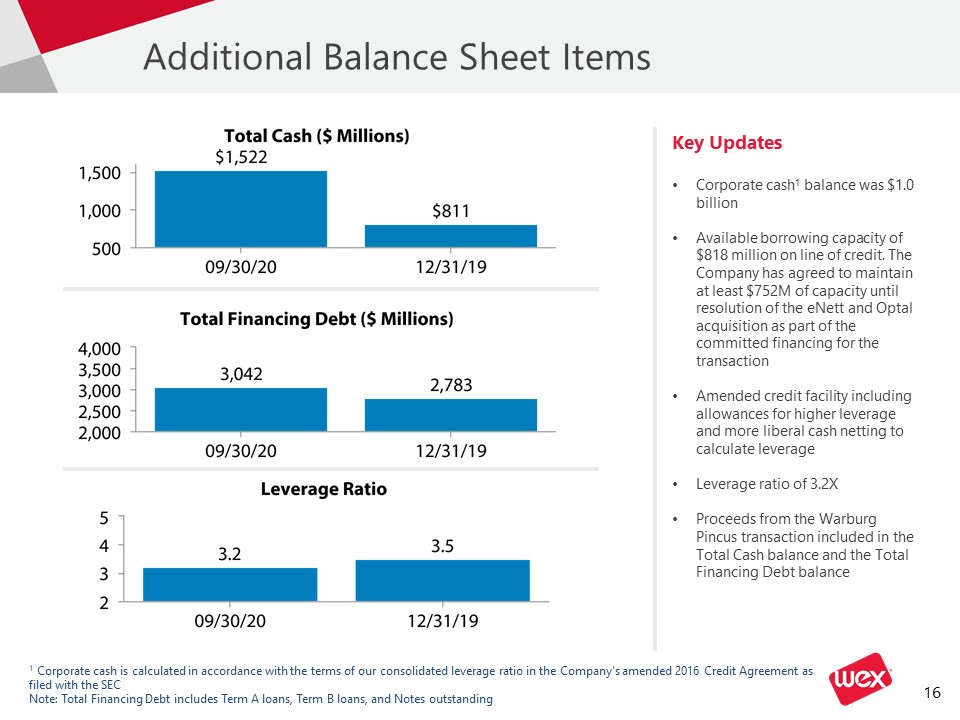
Additional Balance Sheet Items Key UpdatesCorporate cash1 balance was $1.0 billion Available
borrowing capacity of $818 million on line of credit. The Company has agreed to maintain at least $752M of capacity until resolution of the eNett and Optal acquisition as part of the committed financing for the transactionAmended credit
facility including allowances for higher leverage and more liberal cash netting to calculate leverageLeverage ratio of 3.2XProceeds from the Warburg Pincus transaction included in the Total Cash balance and the Total Financing Debt
balance 1 Corporate cash is calculated in accordance with the terms of our consolidated leverage ratio in the Company’s amended 2016 Credit Agreement as filed with the SECNote: Total Financing Debt includes Term A loans, Term B
loans, and Notes outstanding

Appendix
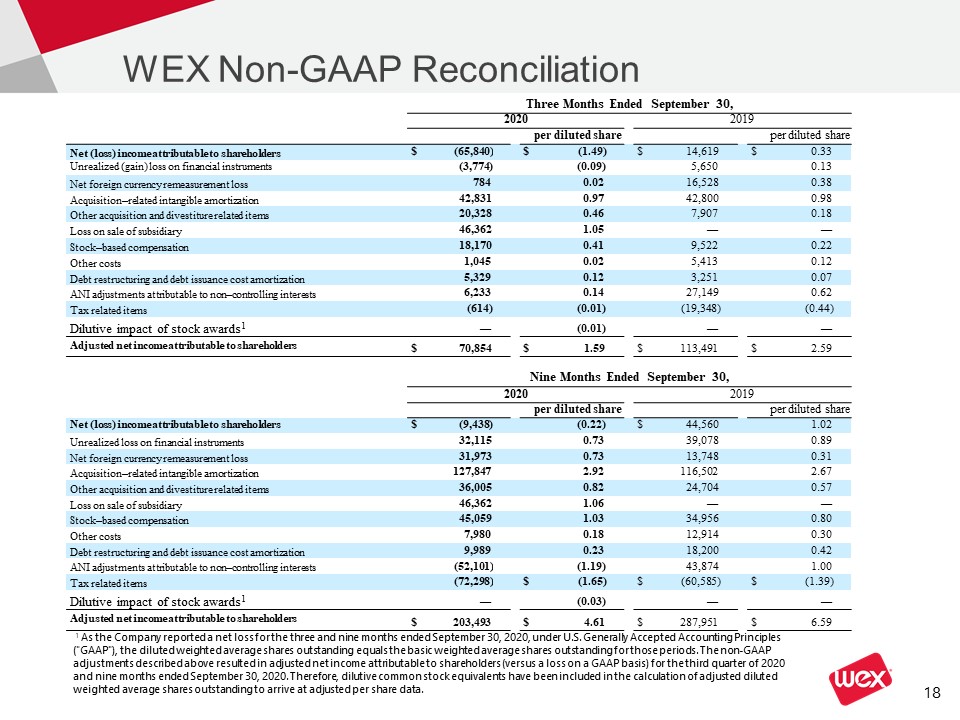
WEX Non-GAAP Reconciliation Three Months Ended September
30, 2020 2019 per diluted share per diluted share Net (loss) income attributable to
shareholders $ (65,840) $ (1.49) $ 14,619 $ 0.33 Unrealized (gain) loss on financial instruments (3,774) (0.09) 5,650 0.13 Net foreign currency remeasurement
loss 784 0.02 16,528 0.38 Acquisition–related intangible amortization 42,831 0.97 42,800 0.98 Other acquisition and divestiture related
items 20,328 0.46 7,907 0.18 Loss on sale of subsidiary 46,362 1.05 — — Stock–based compensation 18,170 0.41 9,522 0.22 Other
costs 1,045 0.02 5,413 0.12 Debt restructuring and debt issuance cost amortization 5,329 0.12 3,251 0.07 ANI adjustments attributable to non–controlling
interests 6,233 0.14 27,149 0.62 Tax related items (614) (0.01) (19,348) (0.44) Dilutive impact of stock awards1 — (0.01) — — Adjusted net income
attributable to shareholders $ 70,854 $ 1.59 $ 113,491 $ 2.59 Nine Months Ended September 30, 2020 2019 per
diluted share per diluted share Net (loss) income attributable to shareholders $ (9,438) (0.22) $ 44,560 1.02 Unrealized loss on financial
instruments 32,115 0.73 39,078 0.89 Net foreign currency remeasurement loss 31,973 0.73 13,748 0.31 Acquisition–related intangible
amortization 127,847 2.92 116,502 2.67 Other acquisition and divestiture related items 36,005 0.82 24,704 0.57 Loss on sale of
subsidiary 46,362 1.06 — — Stock–based compensation 45,059 1.03 34,956 0.80 Other costs 7,980 0.18 12,914 0.30 Debt restructuring and debt issuance
cost amortization 9,989 0.23 18,200 0.42 ANI adjustments attributable to non–controlling interests (52,101) (1.19) 43,874 1.00 Tax related
items (72,298) $ (1.65) $ (60,585) $ (1.39) Dilutive impact of stock awards1 — (0.03) — — Adjusted net income attributable to
shareholders $ 203,493 $ 4.61 $ 287,951 $ 6.59 1 As the Company reported a net loss for the three and nine months ended September 30, 2020, under U.S. Generally Accepted Accounting Principles ("GAAP"), the diluted
weighted average shares outstanding equals the basic weighted average shares outstanding for those periods. The non-GAAP adjustments described above resulted in adjusted net income attributable to shareholders (versus a loss on a GAAP basis)
for the third quarter of 2020 and nine months ended September 30, 2020. Therefore, dilutive common stock equivalents have been included in the calculation of adjusted diluted weighted average shares outstanding to arrive at adjusted per share
data.
WEX Non-GAAP Reconciliation The Company's non-GAAP adjusted net income excludes unrealized gains and
losses on financial instruments, net foreign currency remeasurement gains and losses, acquisition-related intangible amortization, other acquisition and divestiture related items, loss on sale of a subsidiary, stock-based compensation, other
costs, debt restructuring and debt issuance cost amortization, similar adjustments attributable to our non-controlling interests and certain tax related items. The Company's non-GAAP adjusted operating income excludes acquisition-related
intangible amortization, other acquisition and divestiture related items, stock-based compensation, other costs, and debt restructuring costs. Total segment adjusted operating income incorporates the same adjustments and further excludes
unallocated corporate expenses.Although adjusted net income, adjusted operating income and total segment adjusted operating income are not calculated in accordance with U.S. GAAP, these non-GAAP measures are integral to the Company's
reporting and planning processes and the chief operating decision maker of the Company uses segment adjusted operating income to allocate resources among our operating segments. The Company considers these measures integral because they
exclude the above-specified items that the Company's management excludes in evaluating the Company's performance. Specifically, in addition to evaluating the Company's performance on a GAAP basis, management evaluates the Company's
performance on a basis that excludes the above items because:Exclusion of the non-cash, mark-to-market adjustments on financial instruments, including interest rate swap agreements and investment securities, helps management identify and
assess trends in the Company's underlying business that might otherwise be obscured due to quarterly non-cash earnings fluctuations associated with these financial instruments. Additionally, the non-cash mark-to-market adjustments on
financial instruments are difficult to forecast accurately, making comparisons across historical and future quarters difficult to evaluate.Net foreign currency gains and losses primarily result from the remeasurement to functional currency of
cash, accounts receivable and accounts payable balances, certain intercompany notes denominated in foreign currencies and any gain or loss on foreign currency hedges relating to these items. The exclusion of these items helps management
compare changes in operating results between periods that might otherwise be obscured due to currency fluctuations.The Company considers certain acquisition-related costs, including certain financing costs, investment banking fees, warranty
and indemnity insurance, certain integration related expenses and amortization of acquired intangibles, as well as gains and losses from divestitures to be unpredictable, dependent on factors that may be outside of our control and unrelated
to the continuing operations of the acquired or divested business or the Company. In addition, the size and complexity of an acquisition, which often drives the magnitude of acquisition-related costs, may not be indicative of such future
costs. The Company believes that excluding acquisition-related costs and gains or losses of divestitures facilitates the comparison of our financial results to the Company's historical operating results and to other companies in our
industry.The loss on sale of subsidiary relates to the divestiture of the Company's former Brazilian subsidiary as of the date of sale, September 30, 2020, and the associated write-off of its assets and liabilities. As previously discussed,
gains and losses from divestitures are considered by the Company to be unpredictable and dependent on factors that may be outside of our control. The exclusion of these gains and losses are consistent with the Company's practice of excluding
other non-recurring items associated with strategic transactions. Stock-based compensation is different from other forms of compensation as it is a non-cash expense. For example, a cash salary generally has a fixed and unvarying cash cost. In
contrast, the expense associated with an equity-based award is generally unrelated to the amount of cash ultimately received by the employee, and the cost to the Company is based on a stock-based compensation valuation methodology and
underlying assumptions that may vary over time.We exclude other costs when evaluating our continuing business performance as such items are not consistently occurring and do not reflect expected future operating expense, nor do they provide
insight into the fundamentals of current or past operations of our business. This includes costs related to further streamline the business, improve the Company’s efficiency, create synergies and globalize the Company’s operations. For the
three and nine months ended September 30, 2020, other costs include certain costs incurred in association with COVID-19, including the cost of providing additional health, welfare and technological support to our employees as they work
remotely.Debt restructuring and debt issuance cost amortization are unrelated to the continuing operations of the Company. Debt restructuring costs are not consistently occurring and do not reflect expected future operating expense, nor do
they provide insight into the fundamentals of current or past operations of our business. In addition, since debt issuance cost amortization is dependent upon the financing method, which can vary widely company to company, we believe that
excluding these costs helps to facilitate comparison to historical results as well as to other companies within our industry.The adjustments attributable to non-controlling interests, including adjustments to the redemption value of a
non-controlling interest, have no significant impact on the ongoing operations of the business.The tax related items are the difference between the Company’s GAAP tax provision and a pro forma tax provision based upon the Company’s adjusted
net income before taxes as well as the impact from certain discrete tax items. The methodology utilized for calculating the Company’s adjusted net income tax provision is the same methodology utilized in calculating the Company’s GAAP tax
provision.The Company does not allocate certain corporate expenses to our operating segments, as these items are centrally controlled and are not directly attributable to any reportable segment.For the same reasons, WEX believes that adjusted
net income, adjusted operating income and total segment adjusted operating income may also be useful to investors when evaluating the Company's performance. However, because adjusted net income, adjusted operating income and total segment
adjusted operating income are non-GAAP measures, they should not be considered as a substitute for, or superior to, net income (loss), operating income or cash flows from operating activities as determined in accordance with GAAP. In
addition, adjusted net income, adjusted operating income and total segment adjusted operating income as used by WEX may not be comparable to similarly titled measures employed by other companies.