Attached files
Table of Contents
UNITED STATES
SECURITIES AND EXCHANGE COMMISSION
SECURITIES AND EXCHANGE COMMISSION
Washington, D.C. 20549
FORM 10-K
(Mark One)
þ ANNUAL REPORT PURSUANT TO SECTION 13 OR 15(d) OF THE SECURITIES EXCHANGE ACT OF 1934
For the fiscal year ended December 31, 2009
OR
o TRANSITION REPORT PURSUANT TO SECTION 13 OR 15(d) OF THE SECURITIES EXCHANGE ACT OF 1934
For
the transition period from _____________________________________ to _____________________________________
Commission file number 001-32426

WRIGHT EXPRESS CORPORATION
(Exact name of registrant as specified in its charter)
| Delaware | 01-0526993 | |
| (State or other jurisdiction of | (I.R.S. Employer | |
| incorporation or organization) | Identification No.) | |
| 97 Darling Avenue | ||
| South Portland, Maine | 04106 | |
| (Address of principal executive offices) | (Zip Code) |
(207) 773-8171
(Registrant’s telephone number, including area code)
(Registrant’s telephone number, including area code)
Securities registered pursuant to Section 12(b) of the Act:
| Title of each class | Name of each exchange on which registered | |
| Common Stock, $0.01 par value | New York Stock Exchange |
Securities registered pursuant to Section 12(g) of the Act:
None
(Title of class)
Indicate by check mark if the registrant is a well-known seasoned issuer, as defined in
Rule 405 of the Securities Act.
o Yes þ No
Indicate by check mark if the registrant is not required to file reports pursuant to Section 13 or
Section 15(d) of the Act.
o Yes þ No
Indicate by check mark whether the registrant (1) has filed all reports required to be filed by
Section 13 or 15(d) of the Securities
Exchange Act of 1934 during the preceding 12 months (or for such shorter period that the registrant
was required to file such reports),
and (2) has been subject to such filing requirements for the past 90 days.
þ
Yes o No
Indicate by check mark whether the registrant has submitted electronically and posted on its
corporate Web site, if any, every
Interactive Data File required to be submitted and posted pursuant to Rule 405 of Regulation S-T (§
232.405 of this chapter) during the preceding 12 months (or for such shorter period that the
registrant was required to submit and post such files).
o Yes o No
Indicate by check mark if disclosure of delinquent filers pursuant to Item 405 of Regulation S-K
(§229.405 of this chapter) is not
contained herein, and will not be contained, to the best of registrant’s knowledge, in definitive
proxy or information statements
incorporated by reference in Part III of this Form 10-K or any amendment to this Form 10-K.
þ
Indicate by check mark whether the registrant is a large accelerated filer, an accelerated filer, a
non-accelerated filer, or a smaller
reporting company. See definitions of “large accelerated filer,” “accelerated filer,” and “smaller
reporting company” in Rule 12b-2 of
the Exchange Act. (Check one):
| Large accelerated filer þ | Accelerated filer o | |||
| Non-accelerated filer o | Smaller reporting company o | |||
| (Do not check if a smaller reporting company) | ||||
Indicate by check mark whether the registrant is a shell company (as defined in Rule 12b-2 of the Act).
o Yes þ No
The aggregate market value of the voting and non-voting common equity held by non-affiliates of the
registrant (assuming for the
purpose of this calculation, but without conceding, that all directors, officers and any 10 percent
or greater stockholders are affiliates
of the registrant) as of June 30, 2009, the last business day of the registrant’s most recently
completed second fiscal quarter,
was $962,352,387 (based on the closing price of the registrant’s common stock on that date as
reported on the New York
Stock Exchange).
There were 38,213,657 shares of the registrant’s common stock outstanding as of February 23, 2010.
DOCUMENTS INCORPORATED BY REFERENCE
Portions of the Company’s Proxy Statement for the 2010 Annual Meeting of Stockholders are
incorporated by reference
in Part III.
TABLE OF CONTENTS
Table of Contents
All references to “we,” “us,” “our,” “Wright Express,” or the “Company,” in the Annual Report
on Form 10-K mean Wright Express Corporation and all entities owned or controlled by Wright Express
Corporation, except where it is clear that the term means only Wright Express Corporation.
FORWARD-LOOKING STATEMENTS
The Private Securities Litigation Reform Act of 1995 provides a “safe harbor” for statements
that are forward-looking and are not statements of historical facts. The “Outlook for the Future”
section of this Annual Report in Item 7, among other sections, contains forward-looking statements.
Any statements that are not statements of historical facts may be deemed to be forward-looking
statements. When used in this Annual Report, the words “may,” “will,” “could,” “anticipate,”
“plan,” “continue,” “project,” “intend,” “estimate,” “believe,” “expect” and similar expressions
are intended to identify forward-looking statements, although not all forward-looking statements
contain such words. Forward-looking statements relate to our future plans, objectives, expectations
and intentions and are not historical facts and accordingly involve known and unknown risks and
uncertainties and other factors that may cause the actual results or performance to be materially
different from future results or performance expressed or implied by these forward-looking
statements. The following factors, among others, could cause actual results to differ materially
from those contained in forward-looking statements made in this Annual Report, in press releases
and in oral statements made by our authorized officers: fuel price volatility; the Company's failure to maintain or renew key agreements; failure to expand the Company's technological capabilities and service offerings as rapidly as the Company's competitors; the actions of regulatory bodies, including bank regulators, or possible changes in banking regulations impacting the Company's industrial loan bank and the Company as the corporate parent; the uncertainties of litigation; the effects of general economic conditions on fueling patterns and the commercial activity of fleets; the effects of the Company's international business expansion efforts; the impact and range of first quarter and full year credit losses; the amount of full year interest rates, financial loss if we determine it necessary to unwind our derivative instrument position prior to the expiration of the contract, as well as other risks and
uncertainties identified in Item 1A of this Annual Report. Our forward-looking statements and these
factors do not reflect the potential future impact of any merger, acquisition or disposition. The
forward-looking statements speak only as of the date of the initial filing of this Annual Report
and undue reliance should not be placed on these statements. We disclaim any obligation to update
any forward-looking statements as a result of new information, future events or otherwise.
PART I
ITEM 1. BUSINESS
Our Company
Wright Express Corporation, founded in 1983, is a leading provider of payment processing and
information management products and services to the United States commercial and government vehicle
fleet industry. We provide our products and services in the United States, Canada, New Zealand,
Australia and Europe. Together with our affiliates, we market our products and services directly,
as well as through more than 150 strategic relationships which include major oil companies, fuel
retailers and vehicle maintenance providers. We also offer a MasterCard-branded corporate card.
On February 16, 2005, Wright Express LLC converted into Wright Express Corporation, a Delaware
corporation, and 100 percent of the ownership interests in Wright Express LLC were converted into
40 million shares of common stock and 100 shares of non-voting convertible, redeemable preferred
stock. On the same day, our former corporate parent sold all 40 million shares of common stock in
an initial public offering (“IPO”) and all 100 shares of non-voting convertible, redeemable
preferred stock in a private placement.
Our wholly owned banking subsidiary, Wright Express Financial Services Corporation (“FSC”), a
Utah industrial bank, was established in 1998. FSC approves the customer applications, issues the
card and owns the customer relationships for most of our fuel and maintenance programs and offers
our MasterCard-branded corporate payment solution. Wright Express Canada Ltd. (“WEXCanada”) was
incorporated in January 2007 as a wholly owned subsidiary of FSC to assist us in funding
transactions with Canadian companies.
In addition to the companies described above, we have expanded our business through the
acquisition of the following entities:
| • | We acquired TelaPoint, Inc. (“TelaPoint”) on August 6, 2007. TelaPoint is a provider of browser-based supply chain software solutions for bulk petroleum distributors, retailers and fleets. | ||
| • | We acquired the net assets of Pacific Pride Services, Inc. and converted it into Pacific Pride Services, LLC (“Pacific Pride”) on February 29, 2008. Pacific Pride is an independent fuel distributor franchisee network, encompassing more than 325 independent fuel franchisees. | ||
| • | We acquired the net assets of Financial Automation Limited, a provider of fuel card processing software solutions located in New Zealand, on August 29, 2008. Concurrent with the acquisition of Financial Automation Limited, we established a structure for international operations (“Wright Express International”). |
1
Table of Contents
Our Company is organized under two segments, Fleet and MasterCard. The Fleet segment
represents 88 percent of our total revenue. The Fleet segment of our business provides customers
with payment processing services specifically designed for the needs of vehicle fleet industries.
Revenue is earned primarily from payment processing, account servicing revenue and transaction
processing, with the majority generated by payment processing. The MasterCard segment of our
business provides customers with a payment processing solution for their corporate purchasing and
transaction monitoring needs.
We believe the following strengths distinguish us in our industry:
| • | We are a leading provider of payment processing and information management services. Our charge cards are used by commercial and government fleets to purchase fuel and maintenance services for approximately 4.6 million vehicles. We have long-standing strategic relationships with each of the six largest fleet management companies and automotive manufacturers, over 790 fuel retailers and fuel distributors, convenience store chains and bulk and mobile fuel providers. We believe that our sales strategy of utilizing both our own sales force of approximately 110 salespersons in collaboration with the salespersons of the companies with which we maintain strategic relationships provides us with the ability to attract new customers nationwide. | ||
| • | During the last 25 years, we have built a network of over 180,000 fuel and vehicle maintenance locations, with site acceptance at over 90% of the nation’s retail fuel locations and over 45,000 vehicle maintenance locations. We believe our network is one of the largest closed fuel and vehicle maintenance networks of its kind, which allows us to offer customers broad site acceptance. Our proprietary closed network (see illustration on page 3) also affords us access to a higher level of fleet-specific information and control than is widely available on the networks of MasterCard, Visa, American Express or Discover, which allows us to improve and refine the information reporting we provide to our fleet customers and strategic relationships. | ||
| • | With our ownership of FSC, we have excellent access to low cost sources of capital. | ||
| • | We offer a differentiated set of products and services to allow our customers and the customers of our strategic relationships to better manage their vehicle fleets. | ||
| • | We provide customized analysis and reporting on the efficiency of fleet vehicles and the purchasing behavior of fleet vehicle drivers. We make this data available to fleet customers through both traditional reporting services and sophisticated Internet-based data analysis tools. | ||
| • | Our proprietary software facilitates the collection of information and affords us a high level of control and flexibility in allowing fleets to restrict purchases and delivering automated alerts. | ||
| • | Through our WEXOnline® Internet website, customers have access to account and purchase control management, data, reporting and analysis tools in order to better monitor and maintain fleets. |
Strategy
Our strategy is to leverage our core competitive strengths – sales and marketing, portfolio
management, customer service and product differentiation – to acquire and retain customers and to
create products that add value by satisfying new and existing customers’ needs.
Our strategic initiatives include:
| • | Increase market share. We intend to leverage our proprietary network and our knowledge of our industry to increase our share in the marketplace. We expect to utilize existing and new marketing channels, along with additional outsourced strategic relationships and added product features including, but not limited to, web-based account management and distributor-specific product offerings. | ||
| • | Leverage our existing customer base and cross-sell our products. We have approximately 280,000 customers. We will continue to leverage this existing customer base by cross-selling our products to them. These cross-selling opportunities include, but are not limited to, the supply chain software offered by our TelaPoint subsidiary and our vehicle-based telematics offering, which we refer to as WEXSmartTM. We continue to develop additional products and services to expand our customer offerings. | ||
| • | Penetrate international markets. We have over 25 years of experience as a provider of payment and transaction processing services in the United States fleet industry. We expect to draw on this experience, along with our existing |
2
Table of Contents
| industry relationships and brand recognition, to grow our international presence initially through our investment in Wright Express International. | |||
| • | Increase market share for corporate charge card. We intend to further penetrate commercial and government prospects in the mid range of the corporate card marketplace. Additionally we intend to leverage our fleet relationships and cross-sell our Corporate MasterCard charge card to offer a total corporate payment solution to companies. |
FLEET SEGMENT
We have created one of the largest proprietary payment processing networks in the United
States. We collect a broad array of information at the point of sale including the amount of the
expenditure, the identity of the driver and vehicle, the odometer reading, the identity of the fuel
or vehicle maintenance provider and the items purchased. We use this information to provide
customers with purchase controls and analytical tools to help them effectively manage their vehicle
fleets and control costs. We deliver value to our customers by providing customized offerings with
accepting merchants, processing payments and providing information management products and services
to our fleets.
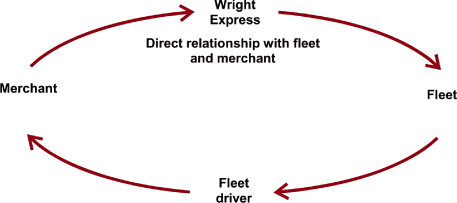
Our payment processing network, which is deployed at fuel and maintenance locations that use
our proprietary software, is referred to as closed network because we have a direct contractual
relationship with the merchant and the fleet; only Wright Express transactions can be processed in
this network.
The
following illustrates our proprietary closed network:
Products and Services
Payment processing
In a payment processing transaction we pay the purchase price for the fleet customer’s
transaction, less the payment processing fees we retain, to the fuel or vehicle maintenance
provider, and we collect the total purchase price from the fleet customer, most often within one
month from the billing date. Payment processing fees are typically based on a combination of both a
percentage of the aggregate dollar amount of the customer’s purchase and a fixed amount charged per
transactions or on a percentage of the aggregate dollar amount of the customer’s purchase alone. In
2009, we had approximately 204 million payment processing transactions.
Transaction processing
In a transaction processing transaction we earn a fixed fee per transaction. We processed
nearly 56 million transaction processing transactions in 2009.
3
Table of Contents
The following illustration depicts our business process for a typical payment processing
transaction:
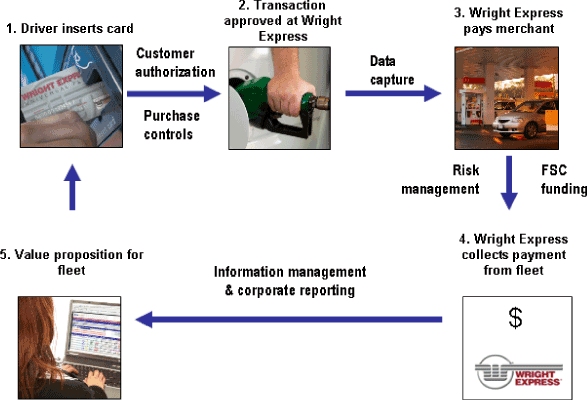
In most transaction processing transactions, steps 3 and 4 typically do not apply.
However, data capture and information management remain an important part of the value
proposition for fleets for whom we perform transaction processing.
Account management
We also provide the following account management services:
| • | Customer service, account activation and account retention. We offer customer service, account activation and account retention services to fleets, fleet management companies and automotive manufacturers (collectively, “strategic relationships”) and the fuel and vehicle maintenance providers on our network. Our services include promoting the adoption and use of our products and programs and account retention programs on behalf of our private label partners. | ||
| • | Authorization and billing inquiries and account maintenance. We handle authorization and billing questions, account changes and other issues for fleets through our dedicated customer contact center, which is available 24 hours a day, seven days a week. Fleet customers also have self service options available to them through WEXOnline®. | ||
| • | Premium fleet services. We assign designated account managers to businesses and government agencies with large fleets. These representatives have in-depth knowledge of both our programs and the operations and objectives of the fleets they service. | ||
| • | Credit and collections services. We have developed proprietary account approval, credit management and fraud detection programs. Our underwriting model produces a proprietary score, which we use to predict the likelihood of an account becoming delinquent within 12 months of activation. We also use a credit line maintenance model to manage ongoing accounts, which allows us to predict the likelihood of account delinquency over an on-going 18 month time horizon. We have developed a collections scoring model that we use to rank and prioritize past due accounts for collection activities. We also employ fraud specialists who monitor, alert and provide case management expertise to minimize losses and reduce program abuse. |
4
Table of Contents
| • | Merchant services. Our representatives work with fuel and vehicle maintenance providers to enroll them in our network, certify all network and terminal software and hardware, and train them on our sale, transaction authorization and settlement processes. |
Information management
We provide standard and customized information to customers through monthly vehicle analysis
reports, custom reports and our website, WEXOnline®. We also alert the customer to any unusual
transactions or transactions that fall outside of pre-established parameters. Customers can access
their account information, including account history and recent transactions, and download the
details. In addition, through WEXOnline®, fleet managers can elect to be notified by email when
limits are exceeded in specified purchase categories, including limits on transactions within a
time range and gallons per day. Utilizing our WEXSmartTM product which leverages
telematics, a vehicle system that combines global positioning satellite tracking and other wireless
technology, fleet managers can track the movements and the locations of their vehicles. We
generally recognize revenue from these services under account servicing revenue.
Marketing Channels
United States
We market our payment processing and information management products and services to fleets
directly and indirectly. Our experienced inside and outside sales forces and our marketing team,
which has expertise in direct marketing, database analysis and marketing strategy and execution,
facilitate our sales and marketing efforts. We also utilize industry tradeshows, advertising and
other awareness campaigns to market our services. By collecting and analyzing customer data
acquired for more than 25 years, we have created a detailed profile of representative fleet
customers and have also developed a proprietary database that allows us to better market to the
fleet industry. We provide market opportunity analyses, customer acquisition models and detailed
marketing plans to our sales force and the sales forces of companies with which we have co-branded,
affinity, distributor or private label relationships.
Direct
We market our products and services, branded with the Wright Express name, directly to
commercial and government vehicle fleets, which allows us to have a direct relationship with our
fleet customers. These direct customers include fleets of all sizes and vehicle categories. We use
our inside sales force to attract small fleets, such as contracting, landscaping and plumbing
businesses. Our mid-size fleet customers are typically regional businesses, such as dairies,
beverage companies and grocery chains. We use our outside sales force to market to these customers.
Our large fleet customers consist of national and large regional fleets. In marketing our products
and services to these customers, we emphasize our ability to offer national site acceptance, a high
level of customer service, and on-line tools to monitor, control and customize their fleet
management capabilities. To attract and retain large fleet customers, we use both our outside sales
force, focused on the acquisition of new customers, and internal account managers, who focus on
servicing and growing revenue from existing customers.
Indirect
We market our products and services indirectly through co-branded, affinity, distributor and
private label relationships.
| • | Co-branded. Through our co-branded relationships, we market our products and services for, and in collaboration with, fleet management companies, automotive manufacturers, fuel providers and convenience store chains using their brand names and our Wright Express logo. These companies seek to offer our payment processing and information management services to their fleet customers. | ||
| We use our co-branded relationships to reach all sizes of fleet customers. We are able to expand the base of customers to whom we provide our products and services by combining the marketing and sales efforts of our own sales force with the efforts of the sales forces of our co-branded partners. | |||
| • | Affinity. Similar to the co-branded relationships, our affinity relationships are marketed in collaboration with fuel providers and convenience store chains. The products and services we deliver are designed to foster loyalty to the fuel provider or convenience store chain as the program is marketed as their own. However, these products allow for the same level of payment processing and information management products and services as are received by the companies using our co-branded programs. | ||
| • | Distributor. Through our distributor relationships, we market our products and services via a network of independent Pacific Pride fuel franchisees. Franchisees issue their own Pacific Pride commercial fueling cards to fleet customers. Vehicles in this program have access to fuel at Pacific Pride and strategic partner locations in the United States and |
5
Table of Contents
| Canada. We increase penetration to these customers by leveraging Pacific Pride’s local market presence and brand recognition, as well as its platform and products for commercial and government fleets. We also service distributors through the Wright Express Distributor program, which provides fuel merchants with payment processing and information management products and services for their own fleets. | |||
| • | Private Label. We market our product and services for, and in collaboration with, fuel retailers, using only their brand names. The fuel retailers with which we have formed strategic relationships offer our payment processing and information management product and services to their fleet customers in order to establish and enhance customer loyalty. These fleets use these product and services to purchase fuel at locations of the fuel retailer with whom we have the private label relationship. Private label customers are typically small fleets. The fleet drivers often do not travel beyond a defined geographic area and are not unduly burdened by limiting their fuel purchases to the fuel locations of a particular fuel retailer within that area. We primarily rely on the marketing efforts of our private label relationships to attract customers; however, many of these fuel retailers also rely on our sales and marketing expertise to further their efforts. |
International
Our international operations include an office in New Zealand and various locations in Europe.
We have fuel card processing software solutions that give us a presence that we can leverage in
geographic markets around the world. We are developing long term relationships with oil companies
to manage their fleet specific payment processing and information management service offerings.
Our international strategy is to offer a hosting solution where we process fueling
transactions for a fee for each transaction. Our international marketing team is actively seeking
out major oil companies and responding to requests for information. As we add clients and
transaction volume, we plan to offer services similar to our product offering in North America. We
believe our services maximize the value of our clients’ portfolios. The value proposition that
Wright Express International offers is based on the benefits and value it delivers in satisfying
the oil companies’ strategic objectives, including improved market effectiveness and cost
efficiency.
Fuel Price Derivatives
A significant portion of our total revenues result from fees paid to us by fuel and vehicle
maintenance providers based on a negotiated percentage of the purchase price paid by customers.
Because our customers primarily purchase fuel, our revenues are largely dependent on retail fuel
prices, which are prone to significant volatility.
We own fuel price sensitive derivative instruments to manage the impact of volatility in fuel
prices on our cash flows and enhance the visibility and predictability of future cash flows. We
have entered into put and call option contracts (“Options”) indexed to the wholesale price of
unleaded gasoline and retail price of diesel fuel and which contain monthly settlement provisions.
When entering into the Options, our intent is to effectively lock in a range of prices during any
given quarter on a portion of our forecasted earnings that are subject to fuel price variations. We
have estimated the effect on our forecasted earnings exposure associated with changes in fuel
prices and entered into derivative agreements designed to cover 80 percent of this estimated
impact. In prior years, we entered into derivative agreements designed to cover 90 percent of our
forecasted earnings exposure. This change was made for all instruments which will start to settle
in 2010. For the portion of 2011 that we have entered into Options, as of December 31, 2009, we
have achieved approximately 25 percent of the full year’s target. Differences between the indices
underlying the Options and the actual retail prices may create a disparity between the actual
revenues we earn and the gains or losses realized on the Options.
Our derivative instruments do not qualify for hedge accounting under accounting guidance.
Accordingly, gains and losses on our fuel price sensitive derivative instruments; whether they are
realized or unrealized, affect our current period earnings.
The Options are intended to limit the impact fuel price fluctuations have on our cash flows.
The Options that we have entered into:
| • | Create a floor price. When the current month put option contract settles, the Company receives cash payments from the counterparties of the Options when the average price for the current month (as defined by the option contract) is below the strike price of the put option contract. | ||
| • | Create a ceiling price. When the current month call option contract settles, the Company makes cash payments to the counterparties of the Options when the average price for the current month (as defined by the option contract) is above the strike price of the call option contract. |
6
Table of Contents
| • | Have no cash impact. When the current month put and call option contracts settle and the average price for the current month (as defined by the option contract) is between the strike price of the put option contract and the strike price of the call option contract, no cash is exchanged between the Company and the counterparties of the Options. |
The following table presents information about the Options as of December 31, 2009:
| Weighted-Average Price(b) | ||||||||||||
| Percentage | (a) | Floor | Ceiling | |||||||||
For the period January 1, 2010 through March 31, 2010 |
80 | % | $ | 3.25 | $ | 3.31 | ||||||
For the period April 1, 2010 through June 30, 2010 |
80 | % | $ | 3.17 | $ | 3.23 | ||||||
For the period July 1, 2010 through September 30, 2010 |
80 | % | $ | 3.03 | $ | 3.09 | ||||||
For the period October 1, 2010 through December 31, 2010 |
80 | % | $ | 2.69 | $ | 2.75 | ||||||
For the period January 1, 2011 through March 31, 2011 |
53 | % | $ | 2.72 | $ | 2.78 | ||||||
For the period April 1, 2011 through June 30, 2011 |
27 | % | $ | 2.74 | $ | 2.80 | ||||||
| (a) | Represents the estimated percentage of the Company’s forecasted earnings subject to fuel price variations at the time of purchase. | |
| (b) | Weighted-average price is the Company’s estimate of the retail price equivalent of the underlying strike price of the fuel price derivatives. |
MASTERCARD SEGMENT
In
addition to our proprietary closed retail fuel and vehicle maintenance network, we also issue
corporate MasterCard products. Our corporate MasterCard charge card product provides commercial
travel and entertainment and purchase capabilities to businesses in industries that can utilize our
information management functionality. The MasterCard product can be sold jointly with the fleet
card product to offer a total payment solution to companies. Additionally, our single use account
MasterCard product allows businesses to centralize purchasing, simplify complex supply chain
processes and eliminate the paper check writing associated with traditional purchase order systems.
Products and Services
Corporate charge card
Our corporate MasterCard charge card provides commercial travel and entertainment and purchase
capabilities to businesses that benefit from our information management functionality. The
MasterCard product can be sold jointly with the fleet card product to offer a total corporate
payment solution to companies.
Single use account
Our single use account MasterCard service allows businesses to centralize purchasing, simplify
complex supply chain processes and eliminate the paper check writing associated with traditional
purchase order programs. Our single use account service is used for transactions where no card is
presented, including, for example, transactions conducted over the telephone, by mail, fax or on
the Internet. They also can be used for transactions that require pre-authorization, such as hotel
reservations. Under this program, each transaction is assigned a unique MasterCard account number
and expiration date. These controls are in place to limit fraud and unauthorized spending. The
unique account number limits purchase amounts, tracks, settles and reconciles purchases more
easily, while eliminating the risks associated with using multiple cards.
Marketing Channels
We market our MasterCard-branded corporate payment solutions directly to our customers in
conjunction with our fleet offerings, as well as potential new clients with whom we have no
existing relationship. We leverage the marketing and advertising efforts of MasterCard, Inc. Our
corporate MasterCard products are marketed to commercial and government organizations.
OTHER ITEMS
Employees
As
of December 31, 2009, Wright Express Corporation and its subsidiaries had 725 employees, of
which, 687 were located in the United States. None of our employees are subject to a collective
bargaining agreement.
7
Table of Contents
Competition
We have a strong competitive position in our Fleet and MasterCard segments. Our product
features and extensive account management services are key factors behind our position in the fleet
industry. We face considerable competition in both of our operating segments. Our competitors vie
with us for prospective direct fleet customers as well as for companies with which we form
strategic relationships. We compete with companies that perform payment and transaction processing
or similar services. Financial institutions that issue Visa, MasterCard and American Express credit
and charge cards currently compete against us primarily in the small fleet category of our Fleet
segment and in the corporate charge card category of our MasterCard segment.
The most significant competitive factors are breadth of features, functionality, servicing
capability and price. For more information regarding risks related to competition, see the
information in Item 1A, under the heading “Our industry continues to become increasingly
competitive, which makes it more difficult for us to maintain profit margins at historical levels.”
Technology
We
believe investment in technology is a crucial step in
enhancing our competitive position in
the market place. Our proprietary software captures comprehensive information from the more than
180,000 fuel and maintenance locations within our network. Operating a proprietary network not only
enhances our value proposition, it enables us to avoid dependence on third-party processors in the
Fleet segment and to respond rapidly to changing customer needs with system upgrades and new
specifications, while maintaining our security in a SAS 70 certified environment. Our
infrastructure has been designed around industry-standard architectures to reduce downtime in the
event of outages or catastrophic occurrences.
We are continually improving our technology to enhance the customer relationship and to
increase efficiency and security. We also review technologies and services provided by others in
order to maintain the high level of service expected by our customers. For information regarding
technology related risks, see the information in Item 1A under the headings “Our failure to
effectively implement new technology could jeopardize our position as a leader in our industry,”
and “We are dependent on technology systems and electronic communications networks managed by third
parties, which could result in our inability to prevent service disruptions.”
Intellectual Property
We rely on a combination of copyright, trade secret and trademark laws, confidentiality
procedures, contractual provisions and other similar measures to protect proprietary information
and technology used in our business. We generally enter into confidentiality or license agreements
with our consultants and corporate partners, and generally control access to and distribution of
our technology, documentation and other proprietary information. Despite the efforts to protect our
proprietary rights, unauthorized parties may attempt to copy or otherwise obtain the use of our
products or technology that we consider proprietary and third parties may attempt to develop
similar technology independently. We pursue registration and protection of our trademarks primarily
in the United States.
Regulation
The Company and FSC are subject to certain state and federal laws and regulations governing
insured depository institutions and their affiliates. FSC is subject to supervision and examination
by both the Utah Department of Financial Institutions and the Federal Deposit Insurance
Corporation. The Company and FSC are also subject to certain restrictions on transactions with
affiliates set forth in the Federal Reserve Act (“FRA”). The Company is subject to anti-tying
provisions in the Bank Holding Company Act. State and Federal laws and regulations limit the loans
FSC may make to one borrower and the types of investments FSC may make.
Set forth below is a description of the material elements of the laws, regulations, policies
and other regulatory matters affecting Wright Express.
Restrictions on intercompany borrowings and transactions
The FRA restricts the extent to which the Company may borrow or otherwise obtain credit from,
sell assets to or engage in certain other transactions with FSC. In general, these restrictions
require that any such extensions of credit by FSC to the parent company must be fully secured.
There is no limit on such transactions to the extent they are secured by a cash deposit or pledged
United States government securities. It is also possible to pledge designated amounts of other
specified kinds of collateral if the aggregate of such transactions are limited to 10 percent of
FSC’s capital stock and surplus with respect to any single affiliate and to 20 percent of FSC’s
capital stock and surplus with respect to all affiliates.
Restrictions on dividends
The FRA also limits the dividends FSC may pay to the Company. In addition, FSC is subject to
various regulatory policies and requirements relating to the payment of dividends, including
requirements to maintain capital above regulatory minimums. A state or federal regulatory authority
can determine, under certain circumstances relating to the financial condition of a bank, that the
payment
8
Table of Contents
of dividends would be an unsafe or unsound practice and can prohibit payment. FSC may not pay
a dividend to the Company if it is undercapitalized or would become undercapitalized as a result of
paying the dividend. Utah law permits an industrial bank to pay dividends only from undivided
earnings.
Company obligations to FSC
Any non-deposit obligation of FSC to the Company is subordinate, in right of payment, to
deposits and other indebtedness of FSC. In the event of the Company’s bankruptcy, any commitment by
the Company to a federal bank regulatory agency to maintain the capital of FSC will be assumed by
the bankruptcy trustee and entitled to priority of payment.
Restrictions on ownership of Wright Express common stock
FSC, and therefore the Company, is subject to bank regulations that impose requirements on
entities that control 10 percent or more of Wright Express common stock. These requirements are
discussed in detail in Item 1A under the heading “If any entity controls 10 percent or more of our
common stock and such entity has caused a violation of applicable banking laws by its failure to
obtain any required approvals prior to acquiring such common stock, we will have the power to
restrict such entity’s ability to vote such shares.”
Segments and Geographic Information
For an analysis of financial information about our segments as well as our geographic
areas, see Item 8 – Note 21 of our consolidated financial statements included elsewhere in this
Annual Report on Form 10-K.
Available Information
The Company’s principal executive offices are located at 97 Darling Avenue, South Portland, ME
04106. Our telephone number is (207) 773-8171, and our Internet address is
http://www.wrightexpress.com. The Company’s annual, quarterly and current reports, proxy
statements and certain other information filed with the SEC, as well as amendments thereto, may be
obtained free of charge from our web site. These documents are posted to our web site as soon as
reasonably practicable after we have filed or furnished these documents with the SEC. These
documents are also available at the SEC’s Public Reference Room at 100 F Street, NE, Washington, DC
20549. The public may obtain information on the operation of the Public Reference Room by calling
the SEC at 1-800-SEC-0330. The SEC maintains an Internet site that contains reports, proxy and
information statements and other information regarding issuers that file electronically with the
SEC at http://www.sec.gov. The Company’s Audit Committee
Charter, Compensation Committee
Charter, Corporate Governance Committee Charter, Corporate Governance Guidelines and codes of conduct are
available without charge through the “Corporate Governance” portion of the Investor Relations page
of the Company’s web site, as well.
Copies will also be provided, free of charge, to any stockholder upon written request to
Investor Relations at the address above or by telephone at (866) 230-1633.
The Company’s Internet site and the information contained on it are not incorporated into this
Form 10-K.
9
Table of Contents
ITEM 1A. RISK FACTORS
The risks and uncertainties described below are not the only ones facing us. Other events that
we do not currently anticipate or that we currently deem immaterial also may affect our results of
operations and financial condition.
Risks Relating to Our Company
The majority of our revenues are related to the dollar amount of fuel purchased by our
customers, and, as a result, volatility in fuel prices could have an adverse effect on our
payment processing revenues.
In 2009, approximately 57 percent of our total revenues were attributable to fees paid to us
by fuel and vehicle maintenance providers based on a negotiated percentage of the purchase price
paid by our customers. Our customers primarily purchase fuel. Accordingly, our revenues are largely
dependent on fuel prices, which are prone to significant volatility. For example, we estimate that
during 2009, a 10 cent decline in average fuel prices below average actual prices would have
resulted in approximately a $7.5 million decline in 2009 revenue. Declines in the price of fuel
could have a material adverse effect on our total revenues.
Fuel prices are dependent on several factors, all of which are beyond our control. These
factors include, among others:
| • | supply and demand for oil and gas, and expectations regarding supply and demand; | ||
| • | speculative trading; | ||
| • | actions by major oil exporting nations; | ||
| • | political conditions in other oil-producing and gas-producing countries, including insurgency, terrorism or war; | ||
| • | refinery capacity; | ||
| • | weather; | ||
| • | the prices of foreign exports and the availability of alternate fuel sources; | ||
| • | value of the U.S. dollar vs. other major currencies; | ||
| • | general worldwide economic conditions; and | ||
| • | governmental regulations and tariffs. |
Derivative transactions may not adequately stabilize our cash flows and may cause volatility in
our earnings.
Because the majority of our revenues are subject to fuel price volatility, we utilize fuel
price sensitive derivative instruments to manage our exposure to this volatility by seeking to
limit fluctuations in our cash flows. For a more detailed discussion of these derivative
instruments see our “Fuel Price Derivatives” discussion in Item 1. These instruments may expose us
to the risk of financial loss if, for example, the counterparties fail to perform under the
contracts governing those arrangements, we unwind our position before the expiration of the
contract or there is a significant change in fuel prices. The success of our fuel price derivatives
program depends upon, among other things, our ability to forecast the amount of fuel purchased by
fleets using our services and the percent fee we will earn from merchants. To the extent our
forecasts are inaccurate these derivative contracts may be inadequate to protect us against
significant changes in fuel prices or over-expose us to fuel price volatility. Realized and
unrealized gains and losses on these contracts will be recorded each quarter to reflect changes in
the market value of the underlying contracts. As a result, our quarterly net income may be prone to
significant volatility.
In an increasing interest rate environment, interest expense on the variable rate portion of our
borrowings on our credit facility would increase and we may not be able to replace our maturing
certificates of deposit with new certificates of deposit that carry the same interest rates.
We had $128 million of indebtedness outstanding at December 31, 2009, under our credit
agreement, of which $70 million bears interest at rates that vary with changes in overall market
interest rates. Rising interest rates would result in reduced net income.
The certificates of deposit that our industrial bank subsidiary uses to finance payments to
major oil companies carry fixed rates from issuance to maturity. Upon maturity, the certificates of
deposit will be replaced by issuing new certificates of deposit to the extent that they are needed
to finance payments primarily to oil companies. In a rising interest rate environment, FSC would
not be able to replace maturing certificates of deposit with new certificates of deposit that carry
the same interest rates. Rising interest rates would result in reduced net income to the extent
that certificates of deposit mature and need to be replaced. At December 31, 2009, FSC had
outstanding $308.3 million in certificates of deposit maturing within one year and $106.7 million
in certificates of deposit maturing within one to two years.
10
Table of Contents
Our exposure to counterparty credit risk could create an adverse affect on our financial
condition.
We engage in a number of transactions where counterparty credit risk becomes a relevant
factor. Specifically, we have fuel price derivatives and interest rate swaps whose values at any
point in time are dependent upon not only the market but also the viability of the counterparty.
The failure or perceived weakness of any of our counterparties has the potential to expose us to
risk of loss in these situations. Financial institutions, primarily banks, have historically been
our most significant counterparties.
Our industry continues to become increasingly competitive, which makes it more difficult for us
to maintain profit margins at historical levels.
We face and may continue to face increased levels of competition in each category of the
overall industry from several companies that seek to offer competing capabilities and services.
Historically, we have been able to provide customers with a wide spectrum of services and
capabilities and, therefore, we have not considered price to be the exclusive or even the primary
basis on which we compete. As our competitors have continued to develop their service offerings, it
has become increasingly more difficult for us to compete solely on the basis of superior
capabilities or service. In some areas of our business we have been forced to respond to
competitive pressures by reducing our fees. We have seen erosion of our historical profit margins
as we use alternative pricing to encourage existing strategic relationships to sign long-term
contracts. If these trends continue and if competition intensifies, our profitability may be
adversely impacted.
While we have traditionally offered our services to all categories of the fleet industry, some
of our competitors have successfully garnered significant share in particular categories of the
overall industry. To the extent that our competitors are regarded as leaders in specific
categories, they may have an advantage over us as we attempt to further penetrate these categories.
We also face increased competition in our efforts to enter into new strategic relationships
and renew existing strategic relationships on the same terms.
Our business and operating results are dependent on several key strategic relationships, the
loss of which could adversely affect our results of operations.
Revenue we received from services we provided to our top five strategic relationships
accounted for approximately 19 percent of our total revenues in 2009. Accordingly, we are dependent
on maintaining our strategic relationships and our results of operations would be lower in the
event that these relationships were terminated.
Likewise, we have agreements with the major oil companies and fuel retailers whose locations
accept our payment processing services. The termination of any of these agreements would reduce the
number of locations where our payment processing services are accepted; therefore, we could lose
our competitive advantage and our operating results could be adversely affected.
We are exposed to risks associated with operations outside of the United States, which
could harm both our domestic and international operations.
We conduct operations in Canada, Europe, New Zealand and Australia. As part of our business
strategy and growth plan, we plan to expand our international sales as we obtain relationships with
organizations outside of the United States. Expansion of our international operations could impose
substantial burdens on our resources, divert management’s attention from domestic operations and
otherwise harm our business. In addition, there are many barriers to competing successfully in the
international market, including:
| • | changes in the relations between the United States and foreign countries; | ||
| • | actions of foreign or United States governmental authority affecting trade and foreign investment; | ||
| • | regulations on repatriation of funds; | ||
| • | increased infrastructure costs including complex legal, tax, accounting and information technology laws and treaties; | ||
| • | interpretation and application of local laws and regulations; | ||
| • | enforceability of intellectual property and contract rights; | ||
| • | potentially adverse tax consequences; and | ||
| • | local labor conditions and regulations. |
We cannot assure you that our investments outside the United States will produce desired
levels of revenue or that one or more of the factors listed above will not harm our business.
11
Table of Contents
A decline in general economic conditions affects our revenue and adversely impacts our business.
Unfavorable changes in economic conditions, including declining consumer confidence,
inflation, recession or other changes, may lead our customers, which are largely comprised of
commercial fleets and corporate charge card and single use account users, to require less of our
services as a result of declines in their businesses. These declines could result from, among other
things, reduced fleet traffic, corporate purchasing, travel and other economic activities from
which we derive revenue. These challenging economic conditions also may impair the ability of our
customers or partners to pay for services they have purchased and, as a result, our reserve for
credit losses and write-offs of accounts receivable could increase.
Decreased demand for fuel and other vehicle products and services could harm our business and
results of operations.
Our results of operations are dependent on the number of transactions we process and the
dollar value of those transactions. We believe that our transaction volume is correlated with
general economic conditions in the United States. A downturn in the United States economy is
generally characterized by reduced commercial activity and, consequently, reduced purchasing of
fuel and other vehicle products and services.
In addition, demand for fuel and other vehicle products and services may be reduced by other
factors that are beyond our control, such as the implementation of fuel efficiency standards and
the development by vehicle manufacturers and adoption by our fleet customers of vehicles with
greater fuel efficiency or alternative fuel sources.
Our failure to effectively implement new technology could jeopardize our position as a leader in
our industry.
As a provider of information management and payment processing services, we must constantly
adapt and respond to the technological advances offered by our competitors and the informational
requirements of our customers, including those related to the Internet, in order to maintain and
improve upon our competitive position. We may not be able to expand our technological capabilities
and service offerings as rapidly as our competitors, which could jeopardize our position as a
leader in our industry.
We are dependent on technology systems and electronic communications networks managed by third
parties, which could result in our inability to prevent service disruptions.
Our ability to process and authorize transactions electronically depends on our ability to
electronically communicate with our fuel and vehicle maintenance providers through point-of-sale
devices and electronic networks that are owned and operated by third parties. The electronic
communications networks upon which we depend are often subject to disruptions of various magnitudes
and durations. Any severe disruption of one or all of these networks could impair our ability to
authorize transactions or collect information about such transactions, which, in turn, could harm
our reputation for dependable service and adversely affect our results of operations. In addition,
our ability to collect enhanced data relating to our customers’ purchases may be limited by the use
of older point-of-sale devices by fuel and vehicle maintenance providers. To the extent that fuel
and vehicle maintenance providers within our network are slow to adopt advanced point-of-sale
devices, we may not be able to offer the services and capabilities our customers demand.
If we fail to adequately assess and monitor credit risks of our customers, we could experience
an increase in credit loss.
We are subject to the credit risk of our customers, many of which are small to mid-sized
businesses. We use various formulae and models to screen potential customers and establish
appropriate credit limits, but these formulae and models cannot eliminate all potential bad credit
risks and may not prevent us from approving applications that are fraudulently completed. Increases
in average fuel prices can require us to periodically increase credit limits for a significant
number of our customers. Moreover, businesses that are good credit risks at the time of application
may become bad credit risks over time and we may fail to detect such change. In times of economic
recession, the number of our customers who default on payments owed to us tends to increase. If we
fail to adequately manage our credit risks, our bad debt expense could be significantly higher than
it has been in the past.
Volatility in the financial markets may negatively impact our ability to access credit.
Adverse conditions in the credit market may limit our ability to access credit at a time when
we would like to or need to do so. Our revolving credit facility expires in May 2012, when the
outstanding balance will be due. Any limitation of availability of funds or credit facilities
could have an impact on our ability to refinance the maturing debt or react to changing economic
and business conditions which could adversely impact us.
12
Table of Contents
The loss or suspension of the charter for our Utah industrial bank or changes in regulatory
requirements could be disruptive to operations and increase costs.
FSC’s bank regulatory status enables FSC to issue certificates of deposit, accept money market
deposits and borrow on a federal funds rate basis. These funds are used to support our payment
processing operations, which require the Company to make payments to fuel and maintenance providers
on behalf of fleets. FSC operates under a uniform set of state lending laws, and its operations are
subject to extensive state and federal regulation. FSC is regulated and examined by the Utah
Department of Financial Institutions on the state level, and the Federal Deposit Insurance
Corporation on the federal level. Continued licensing and federal deposit insurance are subject to
ongoing satisfaction of compliance and safety and soundness requirements. FSC must be well
capitalized and satisfy a range of additional capital requirements. If FSC were to lose its bank
charter, Wright Express would either outsource its credit support activities or perform these
activities itself, which would subject the Company to the credit laws of each individual state in
which Wright Express conducts business. Furthermore, Wright Express could not be a MasterCard
issuer and would have to work with another financial institution to issue the product or sell the
portfolio. Any such change would be disruptive to Wright Express’ operations and could result in
significant incremental costs. In addition, changes in the bank regulatory environment, including
the implementation of new or varying measures or interpretations by the state of Utah or the
federal government, may significantly affect or restrict the manner in which the Company conducts
business in the future.
We may not be able to adequately protect the data we collect about our customers, which could
subject us to liability and damage our reputation.
We collect and store data about our customers and their fleets, including bank account
information and spending data. Our customers expect us to keep this information in our confidence.
Attempts by experienced programmers or “hackers” to penetrate our network security could
misappropriate our proprietary information or cause interruptions in our WEXOnline® web site. We
may be required to expend significant capital and other resources to protect against the threat of
such security breaches or to alleviate problems caused by such breaches. Moreover, any security
breach or inadvertent transmission of information about our customers could expose us to liability
and/or litigation and cause damage to our reputation.
We may incur substantial losses due to fraudulent use of our charge cards.
Under certain circumstances, when we fund customer transactions, we bear the risk of
substantial losses due to fraudulent use of our charge cards. We do not maintain any insurance to
protect us against any such losses.
If we fail to maintain effective systems of internal control over financial reporting and
disclosure controls and procedures, we may not be able to accurately report our financial
results or prevent fraud, which could cause current and potential shareholders to lose
confidence in our financial reporting, adversely affect the trading price of our securities or
harm our operating results.
Effective internal control over financial reporting and disclosure controls and procedures are
necessary for us to provide reliable financial reports and effectively prevent fraud and operate
successfully as a public company. Our financial reporting and disclosure controls and procedures
are reliant, in part, on information we receive from third parties that supply information to us
regarding transactions that we process. Any failure to develop or maintain effective internal
control over financial reporting and disclosure controls and procedures could harm our reputation
or operating results, or cause us to fail to meet our reporting obligations. If we are unable to
adequately maintain our internal control over financial reporting, our external auditors will not
be able to issue an unqualified opinion on the effectiveness of our internal control over financial
reporting.
Ineffective internal control over financial reporting and disclosure controls and procedures
could cause investors to lose confidence in our reported financial information, which could have a
negative effect on the trading price of our securities or affect our ability to access the capital
markets and could result in regulatory proceedings against us by, among others, the SEC. In
addition, a material weakness in internal control over financial reporting, which may lead to
deficiencies in the preparation of financial statements, could lead to litigation claims against
us. The defense of any such claims may cause the diversion of management’s attention and resources,
and we may be required to pay damages if any such claims or proceedings are not resolved in our
favor. Any litigation, even if resolved in our favor, could cause us to incur significant legal and
other expenses. Such events could harm our business, affect our ability to raise capital and
adversely affect the trading price of our securities.
13
Table of Contents
Historical transactions with our former parent company may adversely affect our financial
statements.
Historical
transactions involving Avis Budget Group, Inc. (“Avis”) (formerly Cendant Corporation), our
former corporate parent, and our other former affiliates such as Realogy Corporation and Wyndham
Worldwide Corporation, may be reviewed from time to time by external parties that may include, but
are not limited to, former subsidiaries or operating companies of Avis Budget Group, Inc., as well
as government regulatory organizations. The decision by one or more of these organizations to
undertake a review is beyond our control. While management does not believe, nor has any knowledge
of, any transaction that would be in error or otherwise adjusted, corrections to the financial
statements of Avis Budget Group, Inc., or its successor or its current or former affiliates, could
adversely affect our financial statements.
Our ability to attract and retain qualified employees is critical to the success of our business
and the failure to do so may materially adversely affect our performance.
We believe our employees, including our executive management team, are our most important
resource and, in our industry and geographic area, competition for qualified personnel is intense.
If we were unable to retain and attract qualified employees, our performance could be materially
adversely affected.
If we engage in acquisitions, we will incur costs and may never realize the anticipated benefits
of the acquisitions.
We have acquired and may attempt to acquire businesses, technologies, services, products or
license in technologies that we believe are a strategic fit with our business. The process of
integrating any acquired business, technology, service or product may result in unforeseen
operating difficulties and expenditures and may divert significant management attention from our
ongoing business operations. As a result, we will incur a variety of costs in connection with
acquisitions and may never realize their anticipated benefits.
Risks Relating to Our Common Stock
If any entity controls 10 percent or more of our common stock and such entity has caused a
violation of applicable banking laws by its failure to obtain any required approvals prior to
acquiring that common stock, we have the power to restrict such entity’s ability to vote shares
held by it.
As owners of a Utah industrial bank, we are subject to banking regulations that require any
entity that controls 10 percent or more of our common stock to obtain the prior approval of Utah
banking authorities and the federal banking regulators. A failure to comply with these requirements
could result in sanctions, including the loss of our Utah industrial bank charter. Our certificate
of incorporation requires that if any stockholder fails to provide us with satisfactory evidence
that any required approvals have been obtained, we may, or will if required by state or federal
regulators, restrict such stockholder’s ability to vote such shares with respect to any matter
subject to a vote of our stockholders.
Provisions in our charter documents, Delaware law and applicable banking law may delay or
prevent our acquisition by a third party.
Our certificate of incorporation, by-laws and our rights plan contain several provisions that
may make it more difficult for a third party to acquire control of us without the approval of our
board of directors. These provisions include, among other things, a classified board of directors,
the elimination of stockholder action by written consent, advance notice for raising business or
making nominations at meetings of stockholders and “blank check” preferred stock. Blank check
preferred stock enables our board of directors, without stockholder approval, to designate and
issue additional series of preferred stock with such special dividend, liquidation, conversion,
voting or other rights, including the right to issue convertible securities with no limitations on
conversion, and rights to dividends and proceeds in a liquidation that are senior to the common
stock, as our board of directors may determine. These provisions may make it more difficult or
expensive for a third party to acquire a majority of our outstanding voting common stock. We also
are subject to certain provisions of Delaware law, which could delay, deter or prevent us from
entering into an acquisition, including Section 203 of the Delaware General Corporation Law, which
prohibits a Delaware corporation from engaging in a business combination with an interested
stockholder unless specific conditions are met. These provisions also may delay, prevent or deter a
merger, acquisition, tender offer, proxy contest or other transaction that might otherwise result
in our stockholders receiving a premium over the market price for their common stock.
In addition, because we own a Utah industrial bank, any purchaser of our common stock who
would own 10 percent or more of our common stock after such purchase would be required to obtain
the prior consent of Utah banking authorities and the federal banking authorities prior to
consummating any such acquisition. These regulatory requirements may preclude or delay the purchase
of a relatively large ownership stake by certain potential investors.
14
Table of Contents
Our stockholder rights plan could prevent you from receiving a premium over the market price for
your shares of common stock from a potential acquirer.
Our board of directors approved a stockholder rights plan, which entitles our stockholders to
acquire shares of our common stock at a price equal to 50 percent of the then current market value
in limited circumstances when a third party acquires 15 percent or more of our outstanding common
stock or announces its intent to commence a tender offer for at least 15 percent of our common
stock, in each case, in a transaction that our board of directors does not approve. The existence
of these rights would significantly increase the cost of acquiring control of our Company without
the support of our board of directors because, under these limited circumstances, all of our
stockholders, other than the person or group who caused the rights to become exercisable, would
become entitled to purchase shares of our common stock at a discount. The existence of the rights
plan could therefore deter potential acquirers and thereby reduce the likelihood that our
stockholders will receive a premium for their common stock in an acquisition.
ITEM 1B. UNRESOLVED STAFF COMMENTS
None.
ITEM 2. PROPERTIES
All of our facilities are leased, including our 67,000 square foot corporate headquarters in
South Portland, Maine. We lease five smaller buildings in the South Portland area. Four of these
buildings, totaling 86,000 square feet, are used for technical and customer service employees. The
fifth building is 7,500 square feet and is our warehouse. We lease 11,500 square feet of office
space in Salt Lake City, Utah to support our bank operations and a second call center location. We
lease 4,000 square feet in Louisville, Kentucky to support TelaPoint. We lease 10,000 square feet
of space in Salem, Oregon to support Pacific Pride, a wholly owned subsidiary of Wright Express. We
lease 5,800 square feet of space in Auckland, New Zealand to support Wright Express International.
These facilities are adequate for our current use. Additional financial information about our
leased facilities appears in Item 8 – Note 18 of our consolidated financial statements.
ITEM 3. LEGAL PROCEEDINGS
As of the date of this filing, we are not involved in any material legal proceedings. We also
were not involved in any material legal proceedings that were terminated during the fourth quarter
of 2009. From time to time, we are subject to legal proceedings and claims in the ordinary course
of business, none of which we believe are likely to have a material adverse effect on our financial
position, results of operations or cash flows.
ITEM 4. SUBMISSION OF MATTERS TO A VOTE OF SECURITY HOLDERS
No matters were submitted to a vote of security holders during the three months ended December
31, 2009.
15
Table of Contents
PART II
| ITEM 5. | MARKET FOR REGISTRANT’S COMMON EQUITY, RELATED STOCKHOLDER MATTERS AND ISSUER PURCHASES OF
EQUITY SECURITIES |
|
Market Information
The principal market for the Company’s common stock is the New York Stock Exchange (“NYSE”)
and our ticker symbol is WXS. The following table sets forth, for the indicated calendar periods,
the reported intraday high and low sales prices of the common stock on the NYSE Composite Tape:
| High | Low | |||||||
2008 |
||||||||
First quarter |
$ | 35.38 | $ | 24.98 | ||||
Second quarter |
$ | 34.75 | $ | 24.78 | ||||
Third quarter |
$ | 32.46 | $ | 22.14 | ||||
Fourth quarter |
$ | 30.96 | $ | 8.21 | ||||
2009 |
||||||||
First quarter |
$ | 18.77 | $ | 10.72 | ||||
Second quarter |
$ | 28.12 | $ | 17.51 | ||||
Third quarter |
$ | 32.14 | $ | 22.58 | ||||
Fourth quarter |
$ | 32.72 | $ | 27.39 | ||||
As of February 23, 2010, the closing price of our common stock was $29.99 per share,
there were 38,213,657 shares of our common stock outstanding and there were 6 holders of record of
our common stock.
Dividends
The Company has not declared any dividends on its common stock since it commenced trading on
the NYSE on February 16, 2005. The timing and amount of future dividends will be (i) dependent upon
the Company’s results of operations, financial condition, cash requirements and other relevant
factors, (ii) subject to the discretion of the Board of Directors of the Company and (iii) payable
only out of the Company’s surplus or current net profits in accordance with the General Corporation
Law of the State of Delaware.
The Company has certain restrictions on the dividends it may pay. If the Company’s leverage
ratio is higher than 1.75, the Company may pay no more than $10 million per annum for restricted
payments, including dividends.
Share Repurchases
The following table provides information about the Company’s purchases of shares of the
Company’s common stock during the quarter ended December 31, 2009:
| Approximate Dollar | ||||||||||||||||
| Total Number of | Value of Shares | |||||||||||||||
| Shares Purchased | that May Yet Be | |||||||||||||||
| as Part of Publicly | Purchased Under | |||||||||||||||
| Total Number of | Average Price | Announced Plans or | the Plans or | |||||||||||||
| Shares Purchased | Paid per Share | Programs (a) | Programs (a) | |||||||||||||
October 1 – October 31, 2009 |
— | $ | — | — | $ | 66,990,242 | ||||||||||
November 1 – November 30, 2009 |
— | $ | — | — | $ | 66,990,242 | ||||||||||
December 1 – December 31, 2009 |
— | $ | — | — | $ | 66,990,242 | ||||||||||
Total |
— | $ | — | — | ||||||||||||
| (a) | On February 7, 2007, the Company announced a share repurchase program authorizing the purchase of up to $75 million of its common stock over the next 24 months. In July 2008, our board of directors approved an increase of $75 million to the share repurchase authorization. In addition, our board of directors extended the share repurchase program to July 25, 2010. We have been authorized to purchase, in total, up to $150 million of our common stock. Share repurchases will be made on the open market and may be commenced or suspended at any time. The Company’s management, based on its evaluation of market and economic conditions and other factors, will determine the timing and number of shares repurchased. |
16
Table of Contents
ITEM 6. SELECTED FINANCIAL DATA
The following table sets forth our summary historical financial information for the periods
ended and as of the dates indicated. You should read the following historical financial information
along with Item 7 contained in this Form 10-K and the consolidated financial statements and related
notes thereto. The financial information included in the table below is derived from audited
financial statements:
| Year ended December 31, | ||||||||||||||||||||
| (in thousands, except per share data) | 2009 | 2008 | 2007 | 2006 | 2005(a) | |||||||||||||||
Income statement information |
||||||||||||||||||||
Total revenues |
$ | 318,224 | $ | 393,582 | $ | 336,128 | $ | 291,247 | $ | 241,333 | ||||||||||
Total operating expenses |
$ | 200,074 | $ | 232,150 | $ | 184,036 | $ | 156,144 | $ | 134,716 | ||||||||||
Financing interest expense |
$ | 6,210 | $ | 11,859 | $ | 12,677 | $ | 14,447 | $ | 12,966 | ||||||||||
Net realized and unrealized (losses) gains on fuel price derivatives |
$ | (22,542 | ) | $ | 55,206 | $ | (53,610 | ) | $ | (4,180 | ) | $ | (65,778 | ) | ||||||
Net income |
$ | 139,659 | $ | 127,640 | $ | 51,577 | $ | 74,609 | $ | 18,653 | ||||||||||
Basic earnings per share |
$ | 3.65 | $ | 3.28 | $ | 1.29 | $ | 1.85 | $ | 0.46 | ||||||||||
Weighted average basic shares
of common stock outstanding |
38,303 | 38,885 | 40,042 | 40,373 | 40,194 | |||||||||||||||
Balance sheet information, at end of period |
||||||||||||||||||||
Total assets |
$ | 1,499,662 | $ | 1,611,855 | $ | 1,785,076 | $ | 1,551,015 | $ | 1,448,295 | ||||||||||
Liabilities
and stockholders’ equity |
||||||||||||||||||||
All liabilities except preferred stock |
$ | 1,048,346 | $ | 1,307,193 | $ | 1,570,817 | $ | 1,357,888 | $ | 1,335,682 | ||||||||||
Preferred stock |
10,000 | 10,000 | 10,000 | 10,000 | 10,000 | |||||||||||||||
Total
stockholders’ equity |
441,316 | 294,662 | 204,259 | 183,127 | 102,613 | |||||||||||||||
Total liabilities and stockholders’ equity |
$ | 1,499,662 | $ | 1,611,855 | $ | 1,785,076 | $ | 1,551,015 | $ | 1,448,295 | ||||||||||
| (a) | 2005 includes several costs related to the IPO and the first year of being a publicly traded, stand-alone entity, which may impact the comparability to subsequent year’s results. |
17
Table of Contents
ITEM 7. MANAGEMENT’S DISCUSSION AND ANALYSIS OF FINANCIAL CONDITION AND RESULTS OF OPERATIONS
2009 Highlights and Year in Review
During 2009, we focused on growing our customer base, customer retention and cost containment.
As a result of our efforts, we increased the size of our fleet portfolio and grew our MasterCard
segment to a purchase volume of over $3 billion for the year. Our credit losses were significantly
reduced as we refined our credit and collection procedures. Our results for the year were impacted
by the following significant events and accomplishments:
| • | The United States economy was in a recession during most of 2009 and faced many challenges that directly impacted our business. During 2009 we experienced a reduction in our fleet segment volume as compared to previous years. | ||
| • | Our MasterCard segment grew to $3.1 billion in purchase volume for the year. This increase is primarily due to our single use account product used for online travel. | ||
| • | We entered into the Tax Receivable Prepayment Agreement with Realogy Corporation (“Realogy”) in June 2009. We paid Realogy $51 million, less our bank fees and legal expenses, as a prepayment in full to settle the remaining obligations to Realogy under the 2005 Tax Receivable Agreement. These obligations were recorded on our balance sheet at approximately $187 million and this transaction resulted in a gain of approximately $136 million. We remain obligated to pay the portion of the obligation under our tax receivable agreement that was assigned to Wyndham Worldwide Corporation (“Wyndham”). | ||
| • | During the fourth quarter of 2008, we began processing transactions for fleets in the Federal Government’s General Services Administration (“GSA”). As a result we added 278,000 federal fleet vehicles using our fuel purchase, vehicle maintenance and accident management services. During 2009 we processed 7.8 million transactions in connection with the GSA contract. | ||
| • | Credit losses, when we combine both the Fleet and MasterCard segments, were approximately $27 million lower than 2008, for a total of $17.7 million. Credit losses for 2009 were within our historical range. | ||
| • | Fuel prices averaged $2.39 per gallon during 2009. Fuel prices averaged $3.47 per gallon during 2008. As of December 31, 2009, the price of fuel increased, resulting in an unrealized loss of $43 million for the year. |
18
Table of Contents
Outlook for the Future
Looking forward, we anticipate the following:
| • | We expect a stable economic environment during 2010; therefore we expect transaction volume within our installed customer base will be slightly negative to slightly positive compared to 2009. | ||
| • | Our provision for credit losses is one of the most volatile expenses in our business. While we have over $800 million in accounts receivable at December 31, 2009, the credit we extend is not revolving which limits our exposure to credit losses as compared to businesses which have consumer exposure or revolving credit arrangements. Nearly all of our receivables are due in full within 30 days or less. We tightly manage credit lines and monitor customer payments. We are estimating credit losses in our fleet segment to be in the range of 18 to 23 basis points of payment processing transaction expenditures for 2010. | ||
| • | We will continue to invest in our fuel card processing software solutions that will give us a presence in select geographic markets around the world. We seek to develop long term relationships with large oil companies currently operating in the international arena, in order to increase the overall portfolio value through an outsourced processing and information management solution. |
19
Table of Contents
Results of Operations
YEAR ENDED DECEMBER 31, 2009, AS COMPARED TO THE YEAR ENDED DECEMBER 31, 2008
FLEET SEGMENT
The following table reflects comparative operating results and key operating statistics within
our Fleet segment:
| Increase | ||||||||||||
| (in thousands) | 2009 | 2008 | (decrease) | |||||||||
Service Revenues |
||||||||||||
Payment processing revenue |
$ | 182,530 | $ | 272,501 | (33 | )% | ||||||
Transaction processing revenue |
17,532 | 19,339 | (9 | )% | ||||||||
Account servicing revenue |
36,943 | 30,573 | 21 | % | ||||||||
Finance fees |
32,321 | 30,716 | 5 | % | ||||||||
Other |
8,447 | 9,902 | (15 | )% | ||||||||
Total service revenues |
277,773 | 363,031 | (23 | )% | ||||||||
Product Revenues |
||||||||||||
Hardware and equipment sales |
3,244 | 3,579 | (9 | )% | ||||||||
Total revenues |
281,017 | 366,610 | (23 | )% | ||||||||
Total operating expenses |
176,438 | 211,550 | (17 | )% | ||||||||
Operating income |
104,579 | 155,060 | (33 | )% | ||||||||
Financing interest expense |
(6,210 | ) | (11,859 | ) | (48 | )% | ||||||
Loss on foreign currency transactions |
(40 | ) | — | — | ||||||||
Gain on settlement portion of amounts due under tax receivable
derivatives agreement |
136,485 | — | — | |||||||||
Net realized and unrealized gains (losses) on fuel price
derivative instruments |
(22,542 | ) | 55,206 | (141 | )% | |||||||
(Increase) decrease in amount due under tax receivable agreement |
(599 | ) | (9,014 | ) | (93 | )% | ||||||
Income before taxes |
211,673 | 189,393 | 12 | % | ||||||||
Income taxes |
80,436 | 65,908 | 22 | % | ||||||||
Net income |
$ | 131,237 | $ | 123,485 | 6 | % | ||||||
| Increase | ||||||||||||
| (in thousands, except per transaction and per gallon data) | 2009 | 2008 | (decrease) | |||||||||
Key operating statistics |
||||||||||||
Payment processing revenue: |
||||||||||||
Payment processing transactions |
204,147 | 216,193 | (6 | )% | ||||||||
Average expenditure per payment processing transaction |
$ | 48.71 | $ | 69.80 | (30 | )% | ||||||
Average price per gallon of fuel |
$ | 2.39 | $ | 3.47 | (31 | )% | ||||||
Transaction processing revenue: |
||||||||||||
Transaction processing transactions |
55,921 | 60,831 | (8 | )% | ||||||||
Account servicing revenue: |
||||||||||||
Average number of vehicles serviced |
4,648 | 4,492 | 3 | % | ||||||||
Payment processing revenue decreased $90.0 million for 2009, as compared to 2008. This
decrease is primarily due to a 31 percent decrease in the average price per gallon of fuel as well
as a 6 percent decrease in the number of payment processing transactions. A majority of our
contracts contain both a fixed fee and a percentage fee component. The remainder of our contracts
have just a percentage fee component. This combined fixed fee and percentage fee structure reduces
the impact of fuel price volatility on our payment processing revenues. Payment processing
transactions were down as a result in the economic recession during the year.
Transaction processing revenue decreased $1.8 million for 2009, as compared to 2008. This
decrease in revenue is due primarily to one customer changing from transaction processing to
payment processing,
20
Table of Contents
Account servicing revenue increased $6.4 million for 2009, as compared to 2008. This increase
is due both to our expansion into international markets following our August 2008 acquisition of
Financial Automation Limited and our WEXSmartTM telematics program.
Our finance fees have increased $1.6 million for 2009, as compared to 2008. During December of
2008, we adjusted our late fee charged to delinquent customers to encourage timely payments. While
delinquencies declined, our adjustment to late fees still caused finance fees to increase,
contributing approximately $12 million during 2009. This increase in revenue was largely offset by
a decline in delinquent balances due to an improvement in aging and lower receivable balances, as
compared to the same period in the prior year.
The following table compares selected expense line items within our Fleet segment:
| Increase | ||||||||||||
| (in thousands) | 2009 | 2008 | (decrease) | |||||||||
Expense |
||||||||||||
Salary and other personnel |
$ | 72,256 | $ | 63,899 | 13 | % | ||||||
Service fees |
$ | 12,895 | $ | 10,669 | 21 | % | ||||||
Provision for credit loss |
$ | 15,854 | $ | 42,971 | (63 | )% | ||||||
Depreciation and amortization |
$ | 21,721 | $ | 19,483 | 11 | % | ||||||
Operating interest expense |
$ | 11,723 | $ | 32,148 | (64 | )% | ||||||
| • | Salary and other personnel expenses increased $8.4 million over last year. This increase is primarily due to higher stock-based compensation and short-term incentive program bonuses for 2009 over 2008, as we did not pay bonuses under our short-term incentive program in the prior year, as program targets were not achieved. |
| • | Service fees increased $2.2 million for 2009. This increase is primarily due to professional service fees for legal and accounting work related to costs associated with our international activities and our WEXSmartTM telematics program. |
| • | We generally measure our credit loss performance by calculating credit losses as a percentage of total fuel expenditures on payment processing transactions (“Fuel Expenditures”). This metric for credit losses was 15.9 basis points of Fuel Expenditures for 2009, compared to 28.5 basis points of Fuel Expenditures for 2008. We use a roll rate methodology to calculate the amount necessary for our ending receivable reserve balance. This methodology takes into account total receivable balances, recent charge off experience, recoveries on previously charged off accounts and the dollars that are delinquent to calculate the total reserve. In addition, management undertakes a detailed evaluation of the receivable balances to help ensure further overall reserve adequacy. The expense we recognized in the period is the amount necessary to bring the reserve to its required level after charge offs. Provision for credit loss decreased $27.1 million for the year ended December 31, 2009, as compared to the same period in 2008. Approximately $11 million of this decrease is associated with lower fuel expenditures, primarily as a result of decreases in the price of fuel. Improvements in receivables aging and ultimate charge offs as well as strong recoveries on previously charged off accounts accounted for the remainder of the change. | ||
| • | Depreciation and amortization expenses increased $2.2 million. This increase is primarily due to higher depreciation expense as a result of additional expenditures for internally-developed software. We continue to carefully monitor the recoverability of software asset values. | ||
| • | Operating interest expense relates to our deposits and borrowed federal funds. This interest expense decreased $20.4 million during 2009, compared to 2008. We finance the receivables arising from our payment processing transactions with our operating debt (deposits and borrowed federal funds). Our average debt balance for 2009 totaled $434.5 million as compared to our average debt balance of $664.6 million for 2008. This resulted in approximately a $10 million decrease in operating interest. Our operating interest expense is also lower due to a decrease in weighted average interest rates to 2.2 percent in 2009 from 4.3 percent in 2008. The decrease in interest rates reduced operating interest expense year over year by approximately $9 million. |
21
Table of Contents
During 2009, we incurred $0.8 million in impairment charges related to partially completed
internal-use software. During 2008, we incurred a $1.5 million impairment charge related to
partially completed internal-use software. These non-cash charges for both years have been included
in occupancy and equipment expense.
Financing interest expense is related primarily to our revolving credit facility and
secondarily, to our preferred stock that we issued as part of our initial public offering. Interest
expense for 2009 decreased $5.6 million from 2008, due to lower interest rates and a reduction in
the outstanding balance on our revolving credit facility.
We own fuel price sensitive derivative instruments that we purchase on a periodic basis to
manage the impact of volatility in fuel prices on our cash flows. Our derivative instruments do not
qualify for hedge accounting. Accordingly, realized and unrealized gains and losses on our fuel
price sensitive derivative instruments affect our net income. We recognized an unrealized loss of
$43.1 million in 2009 compared to unrealized gain of $90.9 million in 2008. We recognized a
realized gain of $20.6 million in 2009 and a realized loss of $35.7 million in 2008.
Our effective tax rate was 38.0 percent for 2009 and 34.8 percent for 2008. Our effective tax
rate may fluctuate due to changes in the mix of earnings among legal entities. Our tax rate also
fluctuates due to the impacts that rate mix changes have on our net deferred tax assets.
Adjustments to net deferred tax assets for rate changes can cause volatility in our effective tax
rates. The 2009 provision for income taxes reflects losses incurred in foreign jurisdictions
where no benefits are recognized. The 2008 provision for income
taxes reflects a net benefit of approximately $8.9 million as a result of rate change impacts on
the deferred tax asset balance. These rate changes also increased the associated liability to Avis,
resulting in a $9.0 million charge to non-operating expense in 2008. Changes in the price of fuel
which impacts our fuel price derivatives and changes in the mix of earnings between our legal
entities, especially between U.S. and international subsidiaries, may cause fluctuations in our
effective tax rates.
22
Table of Contents
MASTERCARD SEGMENT
The following table reflects comparative operating results and key operating statistics within
our MasterCard segment:
| Increase | |||||||||||||
| (in thousands) | 2009 | 2008 | (decrease) | ||||||||||
Service Revenues |
|||||||||||||
Payment processing revenue |
$ | 33,090 | $ | 24,940 | 33 | % | |||||||
Account servicing revenue |
58 | 58 | — | ||||||||||
Finance fees |
495 | 327 | 51 | % | |||||||||
Other |
3,564 | 1,647 | 116 | % | |||||||||
Total revenues |
37,207 | 26,972 | 38 | % | |||||||||
Total operating expenses |
23,636 | 20,600 | 15 | % | |||||||||
Operating income |
13,571 | 6,372 | 113 | % | |||||||||
Income taxes |
5,149 | 2,217 | 132 | % | |||||||||
Net income |
$ | 8,422 | $ | 4,155 | 103 | % | |||||||
| Increase | |||||||||||||
| (in thousands) | 2009 | 2008 | (decrease) | ||||||||||
Key operating statistics |
|||||||||||||
Payment processing revenue: |
|||||||||||||
MasterCard purchase volume |
$ | 3,082,779 | $ | 2,404,646 | 28 | % | |||||||
Payment processing revenue increased approximately $8.2 million over 2008, primarily due
to additional business derived from our single use account product. Our MasterCard purchase volume
grew by over $678 million in 2009 compared to 2008.
Other revenue increased during 2009 as the volume of cross-border fees increased over the
prior year. These fees are primarily associated with our single use account product being used for
online travel. This increase is offset by an increase in associated service fees expense.
Operating expenses increased by $3.0 million during 2009 primarily due to the following:
| • | Service fees increased by $5.1 million as compared to 2008 due to higher purchase volumes. | ||
| • | Operating interest decreased $1.3 million primarily due to lower interest rates. | ||
| • | Credit loss reserve expense decreased $0.2 million. We measure our credit loss performance by calculating credit losses as a percentage of total card purchases. This metric for credit losses was 6.0 basis points of total MasterCard purchase volume for 2009 compared to 8.5 basis points for 2008. |
23
Table of Contents
YEAR ENDED DECEMBER 31, 2008, AS COMPARED TO THE YEAR ENDED DECEMBER 31, 2007
FLEET SEGMENT
The following table reflects comparative operating results and key operating statistics within
our Fleet segment:
| Increase | ||||||||||||
| (in thousands) | 2008 | 2007 | (decrease) | |||||||||
Service Revenues |
||||||||||||
Payment processing revenue |
$ | 272,501 | $ | 236,629 | 15 | % | ||||||
Transaction processing revenue |
19,339 | 14,452 | 34 | % | ||||||||
Account servicing revenue |
30,573 | 26,697 | 15 | % | ||||||||
Finance fees |
30,716 | 26,509 | 16 | % | ||||||||
Other |
9,902 | 9,053 | 9 | % | ||||||||
Total service revenues |
363,031 | 313,340 | 16 | % | ||||||||
Product Revenues |
||||||||||||
Hardware and equipment sales |
3,579 | 278 | 1187 | % | ||||||||
Total revenues |
366,610 | 313,618 | 17 | % | ||||||||
Total operating expenses |
211,550 | 167,229 | 27 | % | ||||||||
Operating income |
155,060 | 146,389 | 6 | % | ||||||||
Financing interest expense |
(11,859 | ) | (12,677 | ) | (6 | )% | ||||||
Loss on extinguishment of debt |
— | (1,572 | ) | (100 | )% | |||||||
Net realized and unrealized gains (losses) on fuel price derivatives |
55,206 | (53,610 | ) | (203 | )% | |||||||
(Increase) decrease in amount due under tax receivable agreement |
(9,014 | ) | 78,904 | (111 | )% | |||||||
Income before taxes |
189,393 | 157,434 | 20 | % | ||||||||
Income taxes |
65,908 | 109,510 | (40 | )% | ||||||||
Net income |
$ | 123,485 | $ | 47,924 | 158 | % | ||||||
| Increase | ||||||||||||
| (in thousands, except per transaction and per gallon data) | 2008 | 2007 | (decrease) | |||||||||
Key operating statistics |
||||||||||||
Payment processing revenue: |
||||||||||||
Payment processing transactions |
216,193 | 210,714 | 3 | % | ||||||||
Average expenditure per payment processing transaction |
$ | 69.80 | $ | 57.94 | 20 | % | ||||||
Average price per gallon of fuel |
$ | 3.47 | $ | 2.84 | 22 | % | ||||||
Transaction processing revenue: |
||||||||||||
Transaction processing transactions |
60,831 | 38,804 | 57 | % | ||||||||
Account servicing revenue: |
||||||||||||
Average number of vehicles serviced |
4,492 | 4,390 | 2 | % | ||||||||
Payment processing revenue increased $35.9 million for 2008, as compared to 2007. This
increase is primarily due to a 22 percent increase in the average price per gallon of fuel as well
as a 3 percent increase in the number of payment processing transactions. Unprecedented changes in
the price of fuel during the course of the year, specifically during the second and third quarters
when average fuel prices were as high as more than four dollars per gallon, drove most of the
increased payment processing revenue. These historically high fuel prices influenced the behavior
of both our customers and our merchants. In some instances as 2008 progressed, we renegotiated
agreements which offered higher rebates to certain customers. In other instances we renegotiated
agreements with our merchants to change our pricing with them to include both a fixed fee component
and a percentage fee component. The new pricing reduces the impact fuel price volatility has on our
payment processing revenues.
During 2008, our transaction processing transactions increased by $22.0 million over the prior
year. The increase in revenue, as well as the increase in transaction processing transactions, is
due primarily to the acquisition of Pacific Pride during the first quarter of 2008.
The increase in account servicing revenue was primarily due to a full year of revenue from our
TelaPoint subsidiary compared to five months in 2007 and a full year from our WEXSmartTM
telematics program compared to seven months in 2007.
Finance fees increased $4.2 million for 2008. The increase in finance fees was primarily due
to higher average daily account receivable balances subject to late fees. These higher balances can
primarily be attributed to elevated fuel prices. Offsetting the impact of higher average account
receivable balances subject to late fees were changes in our portfolio. We found that customers who
were
24
Table of Contents
consistently late with their payments, and made up a core of our finance fee base, stopped
paying altogether. We terminated our relationship with these customers and charged them off as a
credit loss. As this customer base declined, our provision for credit loss increased and our
finance fees decreased.
As a result of our Pacific Pride acquisition in the first quarter of 2008 and the growth of
our WEXSmartTM telematics program, we have revenues from the sale of hardware and
equipment. These sales have been reflected separately in the operating results.
The following table compares selected expense line items within our Fleet segment:
| Increase | ||||||||||||
| (in thousands) | 2008 | 2007 | (decrease) | |||||||||
Expense |
||||||||||||
Salary and other personnel |
$ | 63,899 | $ | 62,145 | 3 | % | ||||||
Service fees |
$ | 10,669 | $ | 6,807 | 57 | % | ||||||
Provision for credit loss |
$ | 42,971 | $ | 19,770 | 117 | % | ||||||
Depreciation and amortization |
$ | 19,483 | $ | 14,299 | 36 | % | ||||||
Operating interest expense |
$ | 32,148 | $ | 31,490 | 2 | % | ||||||
| • | Salary and other personnel expenses increased $1.8 million over last year. These expenses were approximately $3.6 million higher due to a full year of expense from our TelaPoint subsidiary compared to five months in 2007 and the addition of Pacific Pride and Wright Express International during 2008. Offsetting this increase was a reduction in our cash bonus of $2.5 million. |
| • | Service fees increased $3.9 million for 2008. Professional service fees for legal and accounting work were approximately $3.0 million higher year over year as we incurred costs associated with a potential acquisition that did not materialize, investigated additional market opportunities and filed franchise disclosure documents on behalf of our Pacific Pride subsidiary. |
| • | Provision for credit losses increased $23.2 million over last year. We measure our credit loss performance by calculating credit losses as a percentage of total expenditures on payment processing transactions (“Total Expenditures”). This metric for credit losses was 28.5 basis points of Total Expenditures for 2008 compared to 16.3 basis points of Total Expenditures for 2007. This increase was predominantly due to higher charge-offs as a result of the weakening United States economy. This translated to additional credit loss expense of approximately $16 million. The remaining change in our credit loss expense year over year is primarily related to higher accounts receivable balances associated with higher fuel prices. | ||
| • | Depreciation and amortization expenses increased $5.2 million. The amortization associated with the intangible assets acquired with the August 2007 purchase of TelaPoint, the February 2008 purchase of Pacific Pride and the August 2008 purchase of Financial Automation Limited resulted in an increase of $3.8 million. The remaining increase is primarily due to higher depreciation expense as a result of additional expenditures for internally-developed software. | ||
| • | Operating interest increased $0.7 million compared to 2007. The average balance of our receivables, and therefore, our operating debt, was higher than prior year due to the exceptionally high fuel prices during 2008. Our average debt balance for 2008 totaled $664.6 million as compared to our average debt balance of $544.7 million for 2007. This resulted in approximately $6.4 million of additional operating interest. This increase in our operating interest expense due to higher average debt balances was more than offset by a decrease in weighted average interest rates to 4.3 percent in 2008 from 5.3 percent in 2007. The decrease in interest rates reduced operating interest expense year over year by approximately $6.7 million. |
In the fourth quarter of 2008, we incurred a $1.5 million impairment charge related to
partially completed internal-use software. This non-cash charge was related to product development
for the construction vertical. The impairment charge has been included in occupancy and equipment
expense.
Financing interest expense decreased $0.6 million from 2007, primarily due to lower interest
rates.
On our fuel price derivative instruments, we recognized unrealized gains of $90.9 million in 2008 compared to unrealized losses of
$37.1 million in 2007. We recognized realized losses of $35.7 million in 2008 and $16.5 million in
2007.
Our effective tax rate was 34.8 percent for 2008 and 69.6 percent for 2007. The 2008 provision
for income taxes reflects a net benefit of approximately $8.9 million as a result of rate change
impacts on the deferred tax asset balance. These rate changes also increased the associated
liability to Avis, resulting in a $9.0 million charge to non-operating expense in the current year.
25
Table of Contents
The unusual 2007 rate was attributable to the State of Maine’s enactment of a law which
changed the State’s rules for apportioning income related to the performance of services. The new
law effectively reduced taxable income or loss allocable to the State of Maine which lowered our
blended state income tax rate which then decreased our deferred tax assets. This resulted in a
charge to the provision for income taxes in the second quarter of 2007 of approximately
$80.9 million. The lower projected overall tax rate in 2007, in turn, decreased the expected
benefit we will realize from the increased tax basis generated by our separation from Avis.
Accordingly, the related contractual liability to Avis recorded in connection with the tax
receivable agreement decreased by approximately $78.9 million during the second quarter of 2007.
26
Table of Contents
MASTERCARD SEGMENT
The following table reflects comparative operating results and key operating statistics within
our MasterCard segment:
| Increase | ||||||||||||
| (in thousands) | 2008 | 2007 | (decrease) | |||||||||
Revenues |
||||||||||||
Payment processing revenue |
$ | 24,940 | $ | 20,864 | 20 | % | ||||||
Account servicing revenue |
58 | 70 | (17 | )% | ||||||||
Finance fees |
327 | 376 | (13 | )% | ||||||||
Other |
1,647 | 1,200 | 37 | % | ||||||||
Total revenues |
26,972 | 22,510 | 20 | % | ||||||||
Total operating expenses |
20,600 | 16,807 | 23 | % | ||||||||
Operating income |
6,372 | 5,703 | 12 | % | ||||||||
Income taxes |
2,217 | 2,050 | 8 | % | ||||||||
Net income |
$ | 4,155 | $ | 3,653 | 14 | % | ||||||
| Increase | ||||||||||||
| (in thousands) | 2008 | 2007 | (decrease) | |||||||||
Key operating statistics |
||||||||||||
Payment processing revenue: |
||||||||||||
MasterCard purchase volume |
$ | 2,404,646 | $ | 1,844,506 | 30 | % | ||||||
Payment processing revenue increased approximately $4.1 million over 2007, primarily due
to additional business driven by new customers on our single use account service. Our MasterCard
purchase volume grew by over $560 million in 2008 compared to 2007.
Operating expenses increased by $3.8 million during 2008 primarily due to the following:
| • | Service fees increased by $1.5 million as compared to 2007 due to higher purchase volumes. | ||
| • | An increase in the credit loss reserve of $1.3 million. We measure our credit loss performance by calculating credit losses as a percentage of total card purchases. This metric for credit losses was 8.5 basis points of total MasterCard purchase volume for 2008 compared to 4.0 basis points for 2007. |
27
Table of Contents
Liquidity, Capital Resources and Cash Flows
We focus on management operating cash as a key element in achieving maximum stockholder value,
and it is the primary measure we use internally to monitor cash flow performance from our core
operations. Since deposits and borrowed federal funds are used to finance our accounts receivable,
we believe that they are a recurring and necessary use and source of cash. As such, we consider
deposits and borrowed federal funds when evaluating our operating activities. For the same reason,
we believe that management operating cash may also be useful to investors as one means of
evaluating our performance. However, management operating cash is a non-GAAP measure and should not
be considered a substitute for, or superior to, net cash provided by (used for) operating
activities as presented on the consolidated statement of cash flows in accordance with GAAP.
|
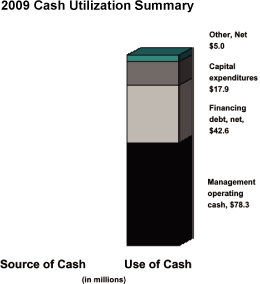 |
|
During 2009, we used approximately $78.3 million in management operating cash as compared to
generating approximately $272.1 million in 2008 and $53.2 million in 2007. The significant change
in 2009 is attributable to activity at our bank
|
||
| subsidiary, FSC, which utilizes certificates of deposit to finance our accounts receivable. At the end of 2008, FSC was overfunded by approximately $140 million. This overfunding was the result of lower receivable balances brought about by the rapid decline in fuel prices during the second half of 2008. During the first quarter of 2009 this overfunding was eliminated. Hence, there was a significant decrease in outstanding certificates of deposit as 2008 amounts matured. Additionally, during the second quarter of 2009, we prepaid a portion of our liabilities under our tax receivable agreement for $51 million, which resulted in a pre-tax gain of approximately $136 million. We anticipate, as we enter 2010, that we will return to reporting favorable management operating cash movements. | ||
The significant increase in management operating cash in 2008, as compared to 2007, is largely due
to an approximately $670 million drop in our accounts receivable balances in the fourth quarter of
2008 (see above). Our excess cash position at the end of 2008 diminished in the first half of 2009
as certificates of deposit matured during the first quarter of 2009.
2009 Highlights
| • | During 2009, we reduced the outstanding balance on our revolving credit facility by $43 million. | ||
| • | We used $6.3 million during 2009 to acquire our own common stock. | ||
| • | We paid Realogy $51 million, less our bank fees and legal expenses, as a prepayment in full to settle the remaining obligations to Realogy under the 2005 Tax Receivable Agreement. These obligations were recorded on our balance sheet at approximately $187 million and this transaction resulted in a gain of approximately $136 million. We remain obligated to pay Wyndham the remainder of the obligation under our tax receivable agreement. | ||
| • | During 2009, we had approximately $18 million of capital expenditures. A significant portion of our capital expenditures are for the development of internal-use computer software, primarily to enhance product features and functionality. We expect total capital expenditures for 2010 to be approximately $20 to $25 million. Our capital spending is financed primarily through internally generated funds. |
28
Table of Contents
2008 Highlights
| • | We used approximately $41 million from our credit facility for the acquisition of Pacific Pride and Financial Automation Limited. During the fourth quarter of 2008, we used excess cash to pay down approximately $30 million on our credit facility to a balance of $170.6 million at the end of the year. | ||
| • | We used $39 million during 2008 to acquire our own common stock. | ||
| • | We had approximately $16 million of capital expenditures. A significant portion of our capital expenditures are for the development of internal-use computer software, primarily to enhance product features and functionality. |
2007 Highlights
| • | We entered into a new credit agreement and repaid the term loan that we entered into at the time of our IPO. The net cash provided from our financing debt was $47 million. We borrowed approximately $40 million for the acquisition of TelaPoint during the third quarter of 2007. | ||
| • | We used approximately $38 million as part of the new share repurchase program during 2007. | ||
| • | We had approximately $20 million of capital expenditures, $17 million of which was cash. The 2007 capital expenditures included a financing agreement for approximately $3 million for a software license which we capitalized. |
Management Operating Cash
The table below reconciles net cash provided by (used for) operating activities to management
operating cash:
2008 Cash Utilization Summary
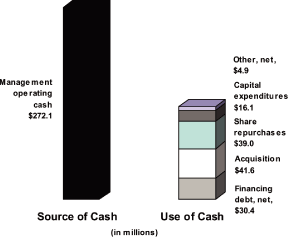
2007 Cash Utilization Summary
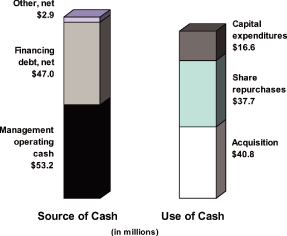
| Year ended December 31, | ||||||||||||
| (in thousands) | 2009 | 2008 | 2007 | |||||||||
Net cash provided by (used for) operating activities |
$ | (33,167 | ) | $ | 339,179 | $ | (92,089 | ) | ||||
Purchases of fleet card receivables |
— | — | (1,922 | ) | ||||||||
Net (decrease) increase in deposits |
(116,859 | ) | (58,943 | ) | 204,390 | |||||||
Net (decrease) increase in borrowed federal funds |
71,723 | (8,175 | ) | (57,221 | ) | |||||||
Management operating cash |
$ | (78,303 | ) | $ | 272,061 | $ | 53,158 | |||||
Management operating cash is not a measure in accordance with generally accepted
accounting principles (“GAAP”). In order to reconcile from management operating cash to the
classifications of cash flow activities presented on our consolidated statement of cash flows, we
have adjusted our cash flows from investing activities for purchases of fleet card receivables, and
our cash flows from financing activities for the changes in deposits and borrowed federal funds.
Our bank subsidiary, FSC, utilizes certificates of deposit to finance our accounts receivable.
FSC issued certificates of deposit in various maturities ranging between three months and two years
and with fixed interest rates ranging from 0.35 percent to 4.00 percent as of December 31, 2009, as
compared to fixed interest rates ranging from 2.85 percent to 5.45 percent as of December 31, 2008
and 4.50 percent to 5.45 percent as of December 31,
2007. As of December 31, 2009, we had
approximately
29
Table of Contents
$415.0 million of certificates of deposit outstanding at a weighted average rate of
1.25 percent, compared to $532.0 million of certificates of deposit at a weighted average rate of
3.85 percent as of December 31, 2008, and approximately $599.0 million of certificates of deposit
outstanding at a weighted average rate of 5.16 percent as of December 31, 2007.
FSC may issue certificates of deposit without limitation on the balance outstanding. However,
FSC must maintain minimum financial ratios, which include risk-based asset and capital
requirements, as prescribed by the FDIC. As of December 31, 2009, certificates of deposit were in
denominations of $250,000 or less, corresponding to the increase in the FDIC insurance limits to
$250,000 as authorized by the Emergency Economic Stabilization Act of 2008. The certificates of
deposit are only payable prior to maturity in the case of death or legally declared mental
incompetence. We believe that our certificates of deposit are paying competitive yields and that
there continues to be consumer demand for these instruments.
Non-interest bearing deposits are required for certain customers as collateral for their
credit accounts. We had $8.3 million of these deposits on hand at December 31, 2009, $8.1 million
at December 31, 2008, and $5.3 million at December 31, 2007.
FSC also borrows from lines of credit on a federal funds rate basis to supplement the
financing of our accounts receivable. Our outstanding federal funds lines of credit were
$155 million during 2009 and 2008 and $160 million during 2007. We have approximately $71.7 million
in lines of credit on a federal funds rate basis as of December 31, 2009.
Liquidity
Our short-term cash requirements consist primarily of payments to major oil companies for
purchases made by our fleet customers, payments on maturing certificates of deposit, interest
payments on our credit facility, cash payments for derivative instruments and other operating
expenses. FSC is responsible for substantially all payments to major oil companies and payments on
maturing certificates of deposit. FSC can fund our short-term cash requirements through the
issuance of certificates of deposit and borrowed federal funds. Any remaining cash needs are
primarily funded through operations. Under FDIC regulations, FSC may not pay any dividend if,
following the payment of the dividend, FSC would be “undercapitalized,” as defined under the
Federal Deposit Insurance Act and applicable regulations.
Our credit facility provides a $450 million revolving line-of-credit. Borrowings on the
revolving line-of-credit bear interest equal to (a) the British Bankers Association LIBOR plus a
margin of 0.45 percent to 1.125 percent based on our consolidated leverage ratio or (b) the higher
of the Federal Funds Rate plus 0.50 percent or the prime rate announced by Bank of America, N.A.,
plus a margin of up to 0.125 percent based on our consolidated leverage ratio. The revolving
line-of-credit facility expires in May 2012, when the outstanding balance will be due. Our
revolving credit facility had an available balance of approximately $320 million at December 31,
2009.
Our credit agreement contains various financial covenants requiring us to maintain certain
financial ratios. Specifically, our credit agreement limits us to a maximum consolidated leverage
ratio of 3.00 to 1.00 at the end of each fiscal quarter until the maturity date. The credit
agreement also requires us to maintain a minimum consolidated interest coverage ratio of 3.00 to
1.00 at the end of each fiscal quarter until the maturity date.
In addition to the financial covenants, the credit agreement contains various customary
restrictive covenants that limit our ability to pay dividends, sell or transfer all or
substantially all of our property or assets, incur more indebtedness or make guarantees, grant or
incur liens on our assets, make investments, loans, advances or acquisitions, engage in mergers,
consolidations, liquidations or dissolutions, enter into sales or leasebacks and change our
accounting policies or reporting practices. FSC is not subject to certain of these restrictions. We
were in compliance with all material covenants and restrictions at December 31, 2009, and expect to
continue to be.
Our fuel price derivatives are currently in a gain position due to the decline in oil prices
during the fourth quarter of 2008. Even with the increases during 2009, the current fuel price is
still below the floor prices set in the previous year. As a result, we have an asset related to
these derivatives of approximately $6.2 million.
We have entered into an interest rate swap arrangement that effectively converts $50 million
of variable rate borrowing to fixed rate borrowing at a rate of approximately 1.35 percent. This
arrangement will expire in July of 2011.
Our long-term cash requirements consist primarily of amounts due to Wyndham as part of our tax
receivable agreement. As a consequence of our separation from Avis, we increased the tax bases of
our tangible and intangible assets to their fair market value (the “Tax Basis Increase”). This Tax
Basis Increase allows us to reduce the amount of future tax payments to the extent that we generate
sufficient taxable income. We were contractually obligated, pursuant to our tax receivable
agreement with Avis, to remit to Avis 85 percent of any such cash savings, subject to repayment if
it is determined that these savings should not have been available to us. We expect to fund these
payments with the cash savings realized as a result of the Tax Basis Increase. Therefore, our
current and expected operating cash flows attributable to the Tax Basis Increase are not expected
to have a significant impact on us.
30
Table of Contents
Pursuant to the Separation and Distribution Agreement dated as of July 27, 2006, by and among
Avis, Realogy, Wyndham and Travelport Inc., Realogy acquired from Cendant the right to receive
62.5 percent of the payments by us to Cendant and Wyndham acquired from Cendant the right to
receive 37.5 percent of the payments by us to Cendant under the 2005 Tax Receivable Agreement.
On June 26, 2009, we entered into a Tax Receivable Prepayment Agreement with Realogy, pursuant
to which we paid Realogy $51 million, less our bank fees and legal expenses, as prepayment in full
to settle the remaining obligations to Realogy under the 2005 Tax Receivable Agreement. These
obligations were previously valued at $187.5 million and this transaction resulted in a gain of
$136.5 million. In connection with the Tax Receivable Prepayment Agreement with Realogy, we entered
into a Ratification Agreement on June 26, 2009, (the “Ratification Agreement”) with Avis, Realogy
and Wyndham which amended the 2005 Tax Receivable Agreement to require the Company to pay
31.875 percent of the future tax savings related to the Tax Basis Increase to Wyndham.
As a result of the Tax Receivable Prepayment Agreement, we will be entitled to receive,
without obligation to a third party, a greater proportion of the future estimated tax benefit of
the Tax Basis Increase. This will be reflected over time in increases in operating cash.
We currently have authorization from our Board to purchase up to $150 million of our common
stock up to July 25, 2010. Through December 31, 2009, we have used $83.0 million of the authorized
amount to acquire shares of our common stock. The program will be funded either through our future
cash flows or through borrowings on our credit facility. Share repurchases will be made on the open
market and may be commenced or suspended at any time. The Company’s management, based on its
evaluation of market and economic conditions and other factors, will determine the timing and
number of shares repurchased.
Management believes that we can adequately fund our cash needs during the next 12 months.
Off-balance Sheet Arrangements
We have the following off-balance sheet arrangements as of December 31, 2009:
| • | Operating leases. We lease office space, office equipment and computer equipment under long-term operating leases, which are recorded in occupancy and equipment or technology leasing and support. | ||
| • | Extension of credit to customers. We have entered into commitments to extend credit in the ordinary course of business. We had approximately $2.8 billion of commitments to extend credit at December 31, 2009, as part of established lending product agreements. These amounts may increase or decrease during 2010 as we extend or contract credit to customers, subject to our appropriate credit reviews, as part of our lending product agreements. Many of these commitments are not expected to be utilized; therefore, we do not believe total unused credit available to customers and customers of strategic relationships represents future cash requirements. We can increase or decrease our customers’ credit lines at our discretion at any time. We believe that we can adequately fund actual cash requirements related to these credit commitments through the issuance of certificates of deposit and borrowed federal funds. | ||
| • | Letters of credit. We are required to post collateral to secure our fuel price sensitive derivative instruments based on any unrealized loss, less any unsecured credit granted by our counter party. At December 31, 2009, we had no unsecured credit nor had we posted a letter of credit for collateral as these instruments were in an unrealized gain position. We have posted a $2.1 million letter of credit as collateral under the terms of our lease agreement for our corporate offices. |
31
Table of Contents
Contractual Obligations
The table below summarizes the estimated dollar amounts of payments under contractual
obligations as of December 31, 2009, for the periods specified:
| 2014 and | ||||||||||||||||||||||||
| (in thousands) | 2010 | 2011 | 2012 | 2013 | Thereafter | Total | ||||||||||||||||||
Operating leases: |
||||||||||||||||||||||||
Facilities |
$ | 2,135 | $ | 1,941 | $ | 1,751 | $ | 1,751 | $ | 7,909 | $ | 15,487 | ||||||||||||
Equipment, including vehicles |
1,959 | 1,390 | 943 | 54 | 3 | 4,349 | ||||||||||||||||||
Preferred stock (a) |
183 | 183 | 183 | 183 | 10,275 | 11,007 | ||||||||||||||||||
Revolving line-of-credit (b) |
— | — | 128,000 | — | — | 128,000 | ||||||||||||||||||
Tax receivable agreement |
7,943 | 8,130 | 8,483 | 8,883 | 74,314 | 107,753 | ||||||||||||||||||
Deposits |
308,266 | 106,730 | — | — | — | 414,996 | ||||||||||||||||||
Borrowed federal funds |
71,723 | — | — | — | — | 71,723 | ||||||||||||||||||
Interest rate swap arrangements (c) |
538 | 314 | — | — | — | 852 | ||||||||||||||||||
Purchase obligations: |
||||||||||||||||||||||||
Technology services |
2,132 | 1,075 | — | — | — | 3,207 | ||||||||||||||||||
Total |
$ | 394,879 | $ | 119,763 | $ | 139,360 | $ | 10,871 | $ | 92,501 | $ | 757,374 | ||||||||||||
| (a) | Assumes December 31, 2009, rate of 1.79% and redemption on February 22, 2015. See Item 8 – Note 13, Preferred Stock. | |
| (b) | Our revolving line-of-credit is set to expire in May of 2012. Amounts in table exclude interest payments. See Item 8 – Note 11, Financing Debt. | |
| (c) | Payments on interest rate swap arrangements have been estimated using the December 31, 2009 LIBOR rates. Any change to this rate will impact future payments. |
32
Table of Contents
Application of Critical Accounting Policies and Estimates
Our discussion and analysis of our financial condition and results of operations are based
upon our consolidated financial statements, which have been prepared in accordance with Generally
Accepted Accounting Principles. Preparation of these financial statements requires us to make
estimates and judgments that affect reported amounts of assets and liabilities, revenue and
expenses and related disclosure of contingent assets and liabilities at the date of our financial
statements. We continually evaluate our judgments and estimates in determination of our financial
condition and operating results. We base our estimates on historical experience and on various
other assumptions that we believe to be reasonable under the circumstances, the results of which
form the basis for making judgments about the carrying values of assets and liabilities that are
not readily apparent from other sources. Estimates are based on information available as of the
date of the financial statements and, accordingly, actual results could differ from these
estimates, sometimes materially. Critical accounting policies and estimates are defined as those
that are both most important to the portrayal of our financial condition and operating results and
require management’s most subjective judgments. Our consolidated financial statements are based on
the selection and application of critical accounting policies and estimates, the most significant
of which are included in the tables below.
Reserve for Credit Losses
| Effect if Actual Results Differ from | ||||
| Description | Assumptions/Approach Used | Assumptions | ||
The reserve for
losses relating to
accounts receivable
represents
management’s
estimate of the
losses inherent in
the Company’s
outstanding
portfolio of
receivables. The
reserve for credit
losses reduces the
Company’s accounts
receivable balances
as reported in its
financial
statements to their
net realizable
value.
|
Reserves for these
losses are primarily
based on a model that
analyzes specific
portfolio statistics,
including average
charge-off rates for
various stages of
receivable aging (i.e.
current, 30 days,
60 days, 90 days) over
historical periods and
average bankruptcy and
recovery rates.
Receivables are
generally written off
when they are 150 days
past due or declaration
of bankruptcy by the
customer.
Also, the reserve reflects management’s judgment regarding overall reserve adequacy. Management considers whether to adjust the reserve that is calculated by the analytic model based on other factors, such as the actual charge-offs for the preceding reporting periods, expected charge-offs and recoveries for the subsequent reporting periods, a review of accounts receivable balances which become past due, changes in customer payment patterns, known fraudulent activity in the portfolio, as well as leading economic and market indicators. |
To the extent historical credit
experience is not indicative of
future performance, actual loss
experience could differ
significantly from management’s
judgments and expectations,
resulting in either higher or lower
future provisions for credit
losses, as applicable. As of December 31, 2009, we have estimated a reserve for credit losses which is 1.3 percent of the total gross accounts receivable balance. An increase to this reserve by 0.5 percent to approximately1.8 percent would increase the provision for credit losses for the year by $4.2 million. Conversely, a decrease to this reserve by 0.5 percent to approximately 0.8 percent would decrease the provision for credit losses for the year by $4.2 million. |
33
Table of Contents
Deferred Tax Asset Valuation
| Effect if Actual Results Differ from | ||||
| Description | Assumptions/Approach Used | Assumptions | ||
The Company
recognizes deferred
tax assets and
liabilities based
on the differences
between the
financial statement
carrying amounts
and the tax bases
of assets and
liabilities. Future
realization of the
tax benefit of
existing deductible
temporary
differences is
contingent upon our
ability to generate
sufficient future
taxable income
within the carry
back and carry
forward periods
available under tax
law. We have
established a
valuation allowance
of $220 thousand
against certain of
our state net
operating losses. A
valuation allowance
has been
established for
those state net
operating losses
that the Company
believes it is more
likely than not
that they will not
be utilized within
the carry forward
period. No other
valuation
allowances have
been established at
this time as
management believes
that it is more
likely than not
that the Company
will realize the
benefits of the
other deferred tax
assets.
|
The Company regularly
reviews its deferred tax
assets for
recoverability.
Management’s
determination of whether
an allowance is required
is based on historical
taxable income or loss,
projected future taxable
income or loss, the
expected timing of the
reversals of existing
temporary differences
and the implementation
of tax planning
strategies.
|
If the Company is unable to
generate sufficient future taxable
income, or if there is a
significant change in the time
period within which the underlying
temporary differences become
taxable or deductible, the Company
may be required to establish
additional valuation allowances
against its deferred tax assets.
At December 31, 2009, the Company had approximately $293 million of gross deferred tax assets. These deferred tax assets consisted primarily of temporary differences related to tax deductible goodwill. The Company also had gross deferred tax liabilities of approximately $109 million primarily consisting of temporary non-tax deductible goodwill with an indefinite reversal period. A determination that no deferred tax assets would be realized at December 31, 2009, would require the establishment of additional valuation allowances determined without regard to existing deferred tax liabilities with indefinite reversal periods. This would increase the provision for income taxes by approximately $284 million. However, under the terms of the tax receivable agreement with Wyndham, to the extent that the Company was unable to utilize the tax benefits created as a consequence of the Company’s separation from Avis, as modified by the June 26, 2009 Ratification Agreement, the Company would realize a gain of approximately $91 million. Therefore, a valuation allowance against 100% of our deferred tax assets coupled with a like judgment concerning the likelihood of the payment of amounts owing to Wyndham, would decrease net income by approximately $193 million. |
34
Table of Contents
Acquired Intangible Assets and Goodwill
| Effect if Actual Results Differ from | ||||
| Description | Assumptions/Approach Used | Assumptions | ||
Goodwill is
comprised of the
cost of business
acquisitions in
excess of the fair
value assigned to
the net tangible
and identifiable
intangible assets
acquired. Goodwill
is not amortized
but is reviewed for
impairment
annually, or when
events or changes
in the business
environment
indicate that the
carrying value of
the reporting unit
may exceed its fair
value. Our other
acquired
intangibles include
assets that
amortize; primarily
software and
customer
relationships, and
those that do not
amortize;
specifically
trademarks and
trade names. The
annual review is
performed as of
October 1 of each
year. Acquired
intangible assets
result from the
allocation of the
cost of an
acquisition.
Certain intangibles
are not amortized;
others are
amortized to
expense over time.
|
For the reporting units
that carry goodwill
balances, our impairment
test consists of a
comparison of each
reporting unit’s
carrying value to its
estimated fair value. A
reporting unit, for the
purpose of the
impairment test, is one
level below the
operating segment level.
We have two reporting
segments that are
further broken into
several reporting units
for the impairment
review. The estimated
fair value of a
reporting unit is
primarily based on
discounted estimated
future cash flows. We
generally validate the
model by applying a
market valuation
approach – specifically
considering other
factors such as the fair
value of comparable
companies to our
reporting units, and a
reconciliation of the
fair value of all our
reporting units to our
overall market
capitalization. The
assumptions used to
estimate the discounted
cash flows are based on
our best estimates about
payment processing
fees/interchange rates,
sales volumes, costs
(including fuel prices),
future growth rates,
capital expenditures and
market conditions over
an estimate of the
remaining operating
period at the reporting
unit level. The discount
rate is based on the
weighted average cost of
capital that is
determined by evaluating
the risk free rate of
return, cost of debt,
and expected equity
premiums.
|
We review the carrying values of
the amortizing assets for
impairment whenever events or
changes in business circumstances
indicate that the carrying amount
of an asset may not be recoverable.
Such circumstances would include,
but are not limited to, a
significant decrease in the
perceived market price of the
intangible, a significant adverse
change in the way the asset is
being used, or a history of
operating or cash flow losses
associated with the use of the
intangible.
Our goodwill resides in multiple reporting units. The profitability of individual reporting units may suffer periodically from downturns in customer demand or other economic factors. Individual reporting units may be relatively more impacted than the Company as a whole. Specifically, during times of economic slowdown, our customers may reduce their expenditures. As a result, demand for the services of one or more of the reporting units could decline which could adversely affect our operations, cash flow, and liquidity and could result in an impairment of goodwill or intangible assets. As of December 31, 2009, the Company had an aggregate of approximately $350 million on its balance sheet related to goodwill and intangible assets of acquired entities. Within this total, approximately $4 million of non-goodwill assets were classified as indefinite-lived, comprised principally of trademarks and trade names. While we currently believe that the fair value of all of our intangibles exceeds carrying value and that those intangibles so classified will contribute indefinitely to the cash flows of the Company, materially different assumptions regarding future performance of our reporting units or the weighted-average cost of capital used in the valuations could result in significant impairment losses and/or amortization expense. |
35
Table of Contents
Valuation of Derivatives
| Effect if Actual Results Differ from | ||||
| Description | Assumptions/Approach Used | Assumptions | ||
The Company has
entered into
several financial
arrangements that
are considered to
be derivative
transactions. Where
the Company has
entered into
interest rate
swaps, the
derivatives have
been designated as
cash flow hedges.
Accordingly, the
interest rate swaps
are recorded at
their fair value on
the consolidated
balance sheet. The
changes in fair
value of the
interest rate swaps
are recorded as a
component of other
comprehensive
income rather than
in earnings. Where
the Company has
entered into fuel
price derivatives,
no hedging
relationship has
been designated.
Accordingly, when
the derivatives are
marked to their
market value, the
related gains or
losses are
recognized
currently in
earnings.
|
None of the derivatives
that exist have readily
determinable fair market
values. Management
determines fair value
through alternative
valuation approaches,
primarily modeling that
considers
over-the-counter market
quotations, time value
and volatility factors
and counterparty credit
risk. On a periodic
basis, management
reviews the statements
provided by the
counterparty to ensure
the fair market values
are reasonable when
compared to the market
value of the underlying
commodity.
|
As of December 31, 2009, the
Company had established that the
net fair value of the derivatives
was an asset of approximately
$6 million. Changes in fuel prices,
interest rates and other variables
have a significant impact on the
value of the derivatives.
Should either (i) the variables underlying pricing methodologies; (ii) the creditworthiness of the counterparty or (iii) the methodologies themselves substantially change, our results of operations could significantly change. |
Changes to Accounting Policies
None.
36
Table of Contents
ITEM 7A. QUANTITATIVE AND QUALITATIVE DISCLOSURES ABOUT MARKET RISK
The Company has entered into market risk sensitive instruments for purposes other than
trading. The discussion below highlights quantitative and qualitative matters related to these
instruments.
Interest Rate Risk
At December 31, 2009, we had borrowings of $128.0 million on our credit facility that bore
interest at a floating rate equal to the one-month LIBOR plus 57.5 basis points. During 2009 we
entered into an interest rate swap contract that ends in July 2012 that fixed the interest rate on
$50 million of the variable rate revolving credit facility.
The following table presents the impact of changes in LIBOR on projected financing interest
expense for 2010 on the unhedged portion of the principal outstanding under the credit facility
(see the discussion of our interest rate swaps in Item 7 in the “Liquidity, Capital Resources and
Cash Flows” section):
| (in thousands) | Impact(a) | |||
Projected financing interest expense on variable rate portion of debt (one-month LIBOR equal
to 0.29338% ) |
$ | 205 | ||
Increases to LIBOR of: |
||||
2.00% |
$ | 1,400 | ||
5.00% |
$ | 3,500 | ||
10.00% |
$ | 7,000 | ||
| (a) | Changes to financing interest expense presented in this table are based on interest payments on the revolving credit facility that bear interest based on one-month LIBOR, based on outstanding balance and rate at December 31, 2009. |
37
Table of Contents
Commodity Price Risk
As discussed in the “Fuel Price Derivatives” section of Item 1, we use derivative instruments
to manage the impact of volatility in fuel prices. We enter into put and call option contracts
(“Options”) based on the wholesale price of unleaded gasoline and retail price of diesel fuel,
which settle on a monthly basis through the second quarter of 2011. The Options are intended to
lock in a range of prices during any given quarter on a portion of our forecasted earnings subject
to fuel price variations. Our fuel price risk management program is designed to purchase derivative
instruments to manage our fuel price-related earnings exposure.
The following table presents information about the Options:
| December 31, | ||||||||||||||||||||||||
| 2009 | 2008 | |||||||||||||||||||||||
| Put Option | Call Option | |||||||||||||||||||||||
| Strike Price | Strike Price | Aggregate | Aggregate | |||||||||||||||||||||
| of Underlying | of Underlying | Notional | Notional | |||||||||||||||||||||
| (per gallon) (a) | (per gallon) (a) | (gallons) (b) | Fair Value | (gallons) | Fair Value | |||||||||||||||||||
Fuel price derivative instruments – unleaded fuel |
||||||||||||||||||||||||
Options settling October 2010 – June 2011 |
$ | 2.013 | $ | 2.073 | 5,836 | (578 | ) | — | — | |||||||||||||||
Options settling July 2010 – March 2011 |
$ | 1.953 | $ | 2.013 | 6,209 | (754 | ) | — | — | |||||||||||||||
Options settling April 2010 – December 2010 |
$ | 1.906 | $ | 1.966 | 4,642 | (776 | ) | — | — | |||||||||||||||
Options settling January 2010 – September 2010 |
$ | 2.860 | $ | 2.920 | 5,219 | 3,349 | 5,219 | 7,000 | ||||||||||||||||
Options settling October 2009 – June 2010 |
$ | 2.430 | $ | 2.490 | 5,302 | 1,418 | 7,860 | 7,938 | ||||||||||||||||
Options settling July 2009 – March 2010 |
$ | 2.443 | $ | 2.503 | 2,573 | 852 | 7,688 | 8,463 | ||||||||||||||||
Options settling April 2009 – December 2009 |
$ | 2.040 | $ | 2.100 | — | — | 7,822 | 5,687 | ||||||||||||||||
Options settling January 2009 – September 2009 |
$ | 1.970 | $ | 2.030 | — | — | 7,674 | 5,512 | ||||||||||||||||
Options settling October 2008 – June 2009 |
$ | 1.850 | $ | 1.910 | — | — | 4,831 | 3,097 | ||||||||||||||||
Options settling July 2008 – March 2009 |
$ | 1.733 | $ | 1.793 | — | — | 2,581 | 1,637 | ||||||||||||||||
Total fuel price derivative instruments – unleaded fuel |
29,781 | 3,511 | 43,675 | 39,334 | ||||||||||||||||||||
Fuel price derivative instruments – diesel |
||||||||||||||||||||||||
Options settling October 2010 – June 2011 |
$ | 3.000 | $ | 3.060 | 2,622 | (437 | ) | — | — | |||||||||||||||
Options settling July 2010 – March 2011 |
$ | 3.000 | $ | 3.060 | 2,790 | (342 | ) | — | — | |||||||||||||||
Options settling April 2010 – December 2010 |
$ | 2.936 | $ | 2.996 | 2,085 | (292 | ) | — | — | |||||||||||||||
Options settling January 2010 – September 2010 |
$ | 4.040 | $ | 4.100 | 2,345 | 2,186 | 2,345 | 2,561 | ||||||||||||||||
Options settling October 2009 – June 2010 |
$ | 3.515 | $ | 3.575 | 2,382 | 1,034 | 3,531 | 2,311 | ||||||||||||||||
Options settling July 2009 – March 2010 |
$ | 3.500 | $ | 3.560 | 1,156 | 492 | 3,454 | 2,391 | ||||||||||||||||
Options settling April 2009 – December 2009 |
$ | 2.975 | $ | 3.035 | — | — | 3,514 | 987 | ||||||||||||||||
Options settling January 2009 – September 2009 |
$ | 2.870 | $ | 2.930 | — | — | 3,448 | 863 | ||||||||||||||||
Options settling October 2008 – June 2009 |
$ | 2.865 | $ | 2.925 | — | — | 2,170 | 611 | ||||||||||||||||
Options settling July 2008 – March 2009 |
$ | 2.753 | $ | 2.813 | — | — | 1,160 | 236 | ||||||||||||||||
Total fuel price derivative instruments – diesel |
13,380 | 2,641 | 19,622 | 9,960 | ||||||||||||||||||||
Total fuel price derivative instruments |
43,161 | 6,152 | 63,297 | 49,294 | ||||||||||||||||||||
| (a) | The settlement of the Options is based upon the New York Mercantile Exchange’s New York Harbor Reformulated Gasoline Blendstock for Oxygen Blending and the U.S. Department of Energy’s weekly retail on-highway diesel fuel price for the month. | |
| (b) | The Options settle on a monthly basis. |
38
Table of Contents
ITEM 8. FINANCIAL STATEMENTS AND SUPPLEMENTARY DATA
INDEX TO CONSOLIDATED FINANCIAL STATEMENTS
| Page | ||||
| 40 | ||||
| 41 | ||||
| 42 | ||||
| 43 | ||||
| 44 | ||||
| 45 | ||||
39
Table of Contents
REPORT OF INDEPENDENT REGISTERED PUBLIC ACCOUNTING FIRM
To the Board of Directors and Stockholders of Wright Express Corporation
South Portland, Maine
South Portland, Maine
We have audited the accompanying consolidated balance sheets of Wright Express Corporation and
subsidiaries (the “Company”) as of December 31, 2009 and 2008, and the related consolidated
statements of income, stockholders’ equity, and cash flows for each of the three years in the
period ended December 31, 2009. We also have audited the Company’s internal control over financial
reporting as of December 31, 2009, based on criteria established
in Internal Control – Integrated
Framework issued by the Committee of Sponsoring Organizations of the Treadway Commission. The
Company’s management is responsible for these financial statements, for maintaining effective
internal control over financial reporting, and for its assessment of the effectiveness of internal
control over financial reporting, included in “Management’s Annual Report on Internal Control Over
Financial Reporting” appearing at Item 9A. Our responsibility is to express an opinion on these
consolidated financial statements and an opinion on the Company’s internal control over financial
reporting based on our audits.
We conducted our audits in accordance with the standards of the Public Company Accounting Oversight
Board (United States). Those standards require that we plan and perform the audit to obtain
reasonable assurance about whether the financial statements are free of material misstatement and
whether effective internal control over financial reporting was maintained in all material
respects. Our audits of the financial statements included examining, on a test basis, evidence
supporting the amounts and disclosures in the financial statements, assessing the accounting
principles used and significant estimates made by management, and evaluating the overall financial
statement presentation. Our audit of internal control over financial reporting included obtaining
an understanding of internal control over financial reporting, assessing the risk that a material
weakness exists, and testing and evaluating the design and operating effectiveness of internal
control based on the assessed risk. Our audits also included performing such other procedures as
we considered necessary in the circumstances. We believe that our audits provide a reasonable
basis for our opinions.
A company’s internal control over financial reporting is a process designed by, or under the
supervision of, the company’s principal executive and principal financial officers, or persons
performing similar functions, and effected by the company’s board of directors, management, and
other personnel to provide reasonable assurance regarding the reliability of financial reporting
and the preparation of financial statements for external purposes in accordance with generally
accepted accounting principles. A company’s internal control over financial reporting includes
those policies and procedures that (1) pertain to the maintenance of records that, in reasonable
detail, accurately and fairly reflect the transactions and dispositions of the assets of the
company; (2) provide reasonable assurance that transactions are recorded as necessary to permit
preparation of financial statements in accordance with generally accepted accounting principles,
and that receipts and expenditures of the company are being made only in accordance with
authorization of management and directors of the company; and (3) provide reasonable assurance
regarding prevention or timely detection of unauthorized acquisition, use, or disposition of the
company’s assets that could have a material effect on the financial statements.
Because of the inherent limitations of internal control over financial reporting, including the
possibility of collusion or improper management override of controls, material misstatements due to
error or fraud may not be prevented or detected on a timely basis. Also, projections of any
evaluation of the effectiveness of the internal control over financial reporting to future periods
are subject to the risk that the controls may become inadequate because of changes in conditions,
or that the degree of compliance with the policies or procedures may deteriorate.
In our opinion, the consolidated financial statements referred to above present fairly, in all
material respects, the financial position of the Company as of December 31, 2009 and 2008, and the
results of its operations and its cash flows for each of the three years in the period ended
December 31, 2009, in conformity with accounting principles generally accepted in the United States
of America. Also, in our opinion, the Company maintained, in all material respects, effective
internal control over financial reporting as of December 31, 2009, based on the criteria
established in Internal Control – Integrated Framework issued by the Committee of Sponsoring
Organizations of the Treadway Commission.
/s/ Deloitte & Touche LLP
Boston, Massachusetts
February 25, 2010
40
Table of Contents
WRIGHT EXPRESS CORPORATION
CONSOLIDATED BALANCE SHEETS
(in thousands, except per share data)
| December 31, | ||||||||
| 2009 | 2008 | |||||||
Assets |
||||||||
Cash and cash equivalents |
$ | 39,304 | $ | 183,117 | ||||
Accounts receivable (less reserve for credit losses of $10,660 in 2009 and $18,435 in 2008) |
844,152 | 702,225 | ||||||
Income taxes receivable |
— | 7,903 | ||||||
Available-for-sale securities |
10,596 | 12,533 | ||||||
Fuel price derivatives, at fair value |
6,152 | 49,294 | ||||||
Property, equipment and capitalized software, net |
44,991 | 44,864 | ||||||
Deferred income taxes, net |
183,602 | 239,957 | ||||||
Goodwill |
315,227 | 315,230 | ||||||
Other intangible assets, net |
34,815 | 39,922 | ||||||
Other assets |
20,823 | 16,810 | ||||||
Total assets |
$ | 1,499,662 | $ | 1,611,855 | ||||
Liabilities and Stockholders’ Equity |
||||||||
Accounts payable |
$ | 283,149 | $ | 249,067 | ||||
Accrued expenses |
30,861 | 34,931 | ||||||
Income taxes payable |
1,758 | — | ||||||
Deposits |
423,287 | 540,146 | ||||||
Borrowed federal funds |
71,723 | — | ||||||
Revolving line-of-credit facilities |
128,000 | 170,600 | ||||||
Other liabilities |
1,815 | 3,083 | ||||||
Amounts due under tax receivable agreement |
107,753 | 309,366 | ||||||
Preferred stock; 10,000 shares authorized: |
||||||||
Series A non-voting convertible, redeemable preferred stock; 0.1 shares issued and outstanding |
10,000 | 10,000 | ||||||
Total liabilities |
1,058,346 | 1,317,193 | ||||||
Commitments and contingencies (Note 18) |
||||||||
Stockholders’ Equity |
||||||||
Common stock $0.01 par value; 175,000 shares authorized, 41,167 in 2009
and 40,966 in 2008 shares issued; 38,196 in 2009 and 38,244 in 2008 shares outstanding |
412 | 410 | ||||||
Additional paid-in capital |
112,063 | 100,359 | ||||||
Retained earnings |
412,138 | 272,479 | ||||||
Other comprehensive (loss) income, net of tax: |
||||||||
Net
unrealized gain (loss) on available-for-sale securities |
23 | (53 | ) | |||||
Net unrealized loss on interest rate swaps |
(176 | ) | (1,736 | ) | ||||
Net foreign currency translation adjustment |
(134 | ) | (55 | ) | ||||
Accumulated other comprehensive loss |
(287 | ) | (1,844 | ) | ||||
Less treasury stock at cost, 2,971 shares in 2009 and 2,722 shares in 2008 |
(83,010 | ) | (76,742 | ) | ||||
Total stockholders’ equity |
441,316 | 294,662 | ||||||
Total liabilities and stockholders’ equity |
$ | 1,499,662 | $ | 1,611,855 | ||||
See notes to consolidated financial statements.
41
Table of Contents
WRIGHT EXPRESS CORPORATION
CONSOLIDATED STATEMENTS OF INCOME
(in thousands, except per share data)
| Year ended December 31, | ||||||||||||
| 2009 | 2008 | 2007 | ||||||||||
Service Revenues |
||||||||||||
Payment processing revenue |
$ | 215,620 | $ | 297,441 | $ | 257,493 | ||||||
Transaction processing revenue |
17,532 | 19,339 | 14,452 | |||||||||
Account servicing revenue |
37,001 | 30,631 | 26,767 | |||||||||
Finance fees |
32,816 | 31,043 | 26,885 | |||||||||
Other |
12,011 | 11,549 | 10,253 | |||||||||
Total service revenues |
314,980 | 390,003 | 335,850 | |||||||||
Product Revenues |
||||||||||||
Hardware and equipment sales |
3,244 | 3,579 | 278 | |||||||||
Total revenues |
318,224 | 393,582 | 336,128 | |||||||||
Expenses |
||||||||||||
Salary and other personnel |
75,123 | 66,969 | 65,014 | |||||||||
Service fees |
27,666 | 20,361 | 14,987 | |||||||||
Provision for credit losses |
17,715 | 45,021 | 20,569 | |||||||||
Technology leasing and support |
9,327 | 8,510 | 8,738 | |||||||||
Occupancy and equipment |
8,718 | 9,159 | 6,091 | |||||||||
Advertising |
4,974 | 5,283 | 4,711 | |||||||||
Marketing |
2,737 | 3,215 | 1,879 | |||||||||
Postage and shipping |
3,105 | 3,248 | 3,433 | |||||||||
Communications |
2,703 | 2,527 | 2,163 | |||||||||
Depreciation and amortization |
21,930 | 20,123 | 15,018 | |||||||||
Operating interest expense |
13,274 | 34,993 | 34,086 | |||||||||
Cost of hardware and equipment sold |
2,803 | 3,155 | 224 | |||||||||
Other |
9,999 | 9,586 | 7,123 | |||||||||
Total operating expenses |
200,074 | 232,150 | 184,036 | |||||||||
Operating income |
118,150 | 161,432 | 152,092 | |||||||||
Financing interest expense |
(6,210 | ) | (11,859 | ) | (12,677 | ) | ||||||
Loss on foreign currency transactions |
(40 | ) | — | — | ||||||||
Loss on extinguishment of debt |
— | — | (1,572 | ) | ||||||||
Gain on settlement of portion of amounts due under tax receivable agreement |
136,485 | — | — | |||||||||
Net realized and unrealized gains (losses) on fuel price derivatives |
(22,542 | ) | 55,206 | (53,610 | ) | |||||||
(Increase) decrease in amount due under tax receivable agreement |
(599 | ) | (9,014 | ) | 78,904 | |||||||
Income before income taxes |
225,244 | 195,765 | 163,137 | |||||||||
Income taxes |
85,585 | 68,125 | 111,560 | |||||||||
Net income |
$ | 139,659 | $ | 127,640 | $ | 51,577 | ||||||
Earnings per share: |
||||||||||||
Basic |
$ | 3.65 | $ | 3.28 | $ | 1.29 | ||||||
Diluted |
$ | 3.55 | $ | 3.22 | $ | 1.27 | ||||||
Weighted average common shares outstanding: |
||||||||||||
Basic |
38,303 | 38,885 | 40,042 | |||||||||
Diluted |
39,364 | 39,787 | 40,751 | |||||||||
See notes to consolidated financial statements.
42
Table of Contents
WRIGHT EXPRESS CORPORATION
CONSOLIDATED STATEMENTS OF STOCKHOLDERS’ EQUITY
(in thousands)
| Year ended December 31, | ||||||||||||
| 2009 | 2008 | 2007 | ||||||||||
Number of common shares issued |
||||||||||||
Balance, beginning of period |
40,966 | 40,798 | 40,430 | |||||||||
Stock issued to employees exercising stock options |
44 | 30 | 250 | |||||||||
Stock issued to employees for vesting of restricted stock units |
157 | 138 | 118 | |||||||||
Balance, end of period |
41,167 | 40,966 | 40,798 | |||||||||
Common stock |
||||||||||||
Balance, beginning of period |
$ | 410 | $ | 408 | $ | 404 | ||||||
Stock issued to employees exercising stock options |
— | — | 3 | |||||||||
Stock issued to employees for vesting of restricted stock units |
2 | 2 | 1 | |||||||||
Balance, end of period |
412 | 410 | 408 | |||||||||
Additional paid-in capital |
||||||||||||
Balance, beginning of period |
100,359 | 98,174 | 89,325 | |||||||||
Net adjustment resulting from tax impact of the initial public offering |
7,358 | (1,379 | ) | — | ||||||||
Stock issued to employees exercising stock options |
585 | 415 | 3,456 | |||||||||
Tax benefit from employees’ stock option and restricted stock plans |
(516 | ) | 113 | 3,023 | ||||||||
Stock-based compensation |
4,277 | 3,036 | 2,370 | |||||||||
Balance, end of period |
112,063 | 100,359 | 98,174 | |||||||||
Retained earnings |
||||||||||||
Balance, beginning of period |
272,479 | 144,839 | 93,262 | |||||||||
Net income |
139,659 | 127,640 | 51,577 | |||||||||
Balance, end of period |
412,138 | 272,479 | 144,839 | |||||||||
Accumulated other comprehensive (loss) income |
||||||||||||
Balance, beginning of period |
(1,844 | ) | (1,451 | ) | 136 | |||||||
Changes in available-for-sale securities, net of tax effect of, $42 in 2009,
$(3) in 2008 and $27 in 2007 |
76 | (4 | ) | 49 | ||||||||
Changes in interest rate swaps, net of tax effect of $904 in 2009,
$(208) in 2008 and $(960) in 2007 |
1,560 | (319 | ) | (1,651 | ) | |||||||
Foreign currency translation |
(79 | ) | (70 | ) | 15 | |||||||
Net other comprehensive (loss) income adjustments |
1,557 | (393 | ) | (1,587 | ) | |||||||
Balance, end of period |
(287 | ) | (1,844 | ) | (1,451 | ) | ||||||
Treasury stock |
||||||||||||
Balance, beginning of period |
(76,742 | ) | (37,711 | ) | — | |||||||
Purchase of
shares of treasury stock; 249 shares in 2009,
1,549 shares in 2008 and 1,173 shares in 2007 |
(6,268 | ) | (39,031 | ) | (37,711 | ) | ||||||
Balance, end of period |
(83,010 | ) | (76,742 | ) | (37,711 | ) | ||||||
Total stockholders’ equity |
$ | 441,316 | $ | 294,662 | $ | 204,259 | ||||||
Comprehensive income |
||||||||||||
Net income |
$ | 139,659 | $ | 127,640 | $ | 51,577 | ||||||
Net other comprehensive (loss) income adjustments |
1,557 | (393 | ) | (1,587 | ) | |||||||
Total comprehensive income |
$ | 141,216 | $ | 127,247 | $ | 49,990 | ||||||
See notes to consolidated financial statements.
43
Table of Contents
WRIGHT EXPRESS CORPORATION
CONSOLIDATED STATEMENTS OF CASH FLOWS
(in thousands)
| Year ended December 31, | ||||||||||||
| 2009 | 2008 | 2007 | ||||||||||
Cash flows from operating activities |
||||||||||||
Net income |
$ | 139,659 | $ | 127,640 | $ | 51,577 | ||||||
Adjustments to reconcile net income to net cash provided by (used for) operating activities: |
||||||||||||
Net unrealized loss (gain) on derivative instruments |
43,142 | (90,892 | ) | 37,074 | ||||||||
Stock-based compensation |
5,736 | 5,216 | 4,508 | |||||||||
Depreciation and amortization |
22,559 | 20,588 | 15,719 | |||||||||
Loss on extinguishment of debt |
— | — | 1,572 | |||||||||
Gain on settlement of portion of amounts due under tax receivable agreement |
(136,485 | ) | — | — | ||||||||
Loss on sale of investment |
15 | — | — | |||||||||
Deferred taxes |
59,558 | 41,967 | 95,117 | |||||||||
Provision for credit losses |
17,715 | 45,021 | 20,569 | |||||||||
Loss on disposal and impairment of property and equipment |
44 | 108 | — | |||||||||
Loss on impairment of internal-use software under development |
814 | 1,538 | — | |||||||||
Changes in operating assets and liabilities, net of effects of acquisitions: |
||||||||||||
Accounts receivable |
(159,623 | ) | 362,444 | (286,236 | ) | |||||||
Other assets |
(4,641 | ) | (328 | ) | (2,163 | ) | ||||||
Accounts payable |
34,053 | (156,463 | ) | 66,048 | ||||||||
Accrued expenses |
(1,651 | ) | (1,105 | ) | 6,756 | |||||||
Income taxes |
12,348 | (4,934 | ) | (4,147 | ) | |||||||
Other liabilities |
(1,282 | ) | (1,475 | ) | 364 | |||||||
Amounts due under tax receivable agreement |
(65,128 | ) | (10,146 | ) | (98,847 | ) | ||||||
Net cash provided by (used for) operating activities |
(33,167 | ) | 339,179 | (92,089 | ) | |||||||
Cash flows from investing activities |
||||||||||||
Purchases of property and equipment |
(17,848 | ) | (16,111 | ) | (16,624 | ) | ||||||
Sale of available-for-sale securities |
7 | — | — | |||||||||
Purchases of available-for-sale securities |
(160 | ) | (4,301 | ) | (2,518 | ) | ||||||
Maturities of available-for-sale securities |
2,194 | 1,255 | 1,123 | |||||||||
Purchases of fleet card receivables |
— | — | (1,922 | ) | ||||||||
Purchase of trade name |
— | (44 | ) | — | ||||||||
Acquisitions, net of cash acquired |
— | (41,613 | ) | (40,806 | ) | |||||||
Net cash used for investing activities |
(15,807 | ) | (60,814 | ) | (60,747 | ) | ||||||
Cash flows from financing activities |
||||||||||||
Excess tax benefits from equity instrument share-based payment arrangements |
— | 113 | 3,023 | |||||||||
Repurchase of share-based awards to satisfy tax withholdings |
(1,464 | ) | (2,225 | ) | (2,188 | ) | ||||||
Proceeds from stock option exercises |
585 | 415 | 3,459 | |||||||||
Net (decrease) increase in deposits |
(116,859 | ) | (58,943 | ) | 204,390 | |||||||
Net increase (decrease) in borrowed federal funds |
71,723 | (8,175 | ) | (57,221 | ) | |||||||
Net (repayments) borrowings on 2007 revolving line-of-credit facility |
(42,600 | ) | (28,800 | ) | 199,400 | |||||||
Loan origination fees paid for 2007 revolving line-of-credit facility |
— | (1,556 | ) | (998 | ) | |||||||
Net repayments on 2005 revolving line-of-credit facility |
— | — | (20,000 | ) | ||||||||
Repayments on term loan |
— | — | (131,000 | ) | ||||||||
Repayments of acquired debt |
— | — | (374 | ) | ||||||||
Purchase of shares of treasury stock |
(6,268 | ) | (39,031 | ) | (37,711 | ) | ||||||
Net cash (used for) provided by financing activities |
(94,883 | ) | (138,202 | ) | 160,780 | |||||||
Effect of exchange rates on cash and cash equivalents |
44 | (65 | ) | 15 | ||||||||
Net change in cash and cash equivalents |
(143,813 | ) | 140,098 | 7,959 | ||||||||
Cash and cash equivalents, beginning of period |
183,117 | 43,019 | 35,060 | |||||||||
Cash and cash equivalents, end of period |
$ | 39,304 | $ | 183,117 | $ | 43,019 | ||||||
See notes to consolidated financial statements.
44
Table of Contents
WRIGHT EXPRESS CORPORATION
NOTES TO CONSOLIDATED FINANCIAL STATEMENTS
(in thousands, except per share data)
| 1. | Summary of Significant Accounting Policies |
Business Description
Wright Express Corporation is a leading provider of payment processing and information
management products and services to the United States commercial and government vehicle fleet
industry. The Company provides products and services in the United States, Canada, New Zealand,
Australia and Europe. Together with the Company’s affiliates, Wright Express markets its products
and services directly, as well as through more than 150 strategic relationships which include major
oil companies, fuel retailers and vehicle maintenance providers. Wright Express also offers a
MasterCard-branded corporate card.
Basis of Presentation
The accompanying consolidated financial statements of Wright Express for the years ended
December 31, 2009, 2008 and 2007, include the accounts of Wright Express and its majority owned
subsidiaries. All intercompany accounts and transactions have been eliminated in consolidation.
For the years ended December 31, 2009 and 2008, hardware and equipment sales, marketing
expense and cost of hardware and equipment sold exceeded the Company’s threshold for individual
disclosure and were shown separately on the consolidated statements of income. In prior periods,
hardware and equipment sales had been included in other revenues, and marketing expense and cost of
hardware and equipment sold had been included in other expenses. Prior period statements have been
conformed to the 2009 presentation.
Use of Estimates and Assumptions
The preparation of financial statements in conformity with accounting principles generally
accepted in the United States of America requires management to make estimates and assumptions that
affect the reported amounts of assets and liabilities and the disclosures of contingent assets and
liabilities as of the date of the financial statements and the reported amounts of revenue and
expenses during the period. Actual results could differ from those estimates and those differences
may be material.
Cash and Cash Equivalents
Highly liquid investments with remaining maturities at the time of purchase of three months or
less (that are readily convertible to cash) are considered to be cash equivalents and are stated at
cost, which approximates market value. Cash equivalents include federal funds sold, which are
unsecured short-term investments entered into with financial institutions.
Accounts Receivable and Reserve for Credit Losses
Accounts receivable balances are stated at net realizable value. The balance includes a
reserve for credit losses which reflects management’s estimate of uncollectible balances resulting
from credit and fraud losses. The reserve for credit losses is established based on the
determination of the amount of probable credit losses inherent in the accounts receivable as of the
reporting date. Management reviews delinquency reports, historical collection rates, economic
trends, and other information in order to make the necessary judgments as to probable credit
losses. Management also uses historical charge off experience to determine the amount of losses
inherent in accounts receivable at the reporting date. Assumptions regarding probable credit losses
are reviewed periodically and may be impacted by actual performance of accounts receivable and
changes in any of the factors discussed above.
Available-for-sale Securities
The Company records certain of its investments as available-for-sale securities.
Available-for-sale securities are carried at fair value, with unrealized gains and losses, net of
tax, reported on the consolidated balance sheet in accumulated other comprehensive income. Realized
gains and losses and declines in fair value judged to be other-than-temporary on available-for-sale
securities are included in non operating revenues and expenses. The cost basis of securities is
based on the specific identification method. Interest and dividends on securities classified as
available-for-sale are included in other revenues.
45
Table of Contents
WRIGHT EXPRESS CORPORATION
NOTES TO CONSOLIDATED FINANCIAL STATEMENTS (continued)
NOTES TO CONSOLIDATED FINANCIAL STATEMENTS (continued)
(in thousands, except per share data)
Derivatives
The Company uses derivative instruments as part of its overall strategy to manage its exposure
to fluctuations in fuel prices and to reduce the impact of interest rate volatility. As a matter of
policy, the Company does not use derivatives for trading or speculative purposes. All derivatives
are recorded at fair value on the consolidated balance sheet.
The Company’s fuel price derivative instruments do not qualify for hedge accounting treatment.
Gains or losses related to fuel price derivative instruments, both realized and unrealized, are
recognized currently in earnings. These instruments are presented on the consolidated balance sheet
as fuel price derivatives, at fair value.
The Company’s interest rate derivatives are designated as cash flow hedges and, accordingly,
the change in fair value associated with the effective portion of these derivative instruments that
qualify for hedge accounting treatment is recorded as a component of other comprehensive income and
the ineffective portion, if any, is reported currently in earnings. Amounts included in other
comprehensive income are reclassified into earnings in the same period during which the hedged item
affects earnings. These instruments are presented as either other assets or accrued expenses on the
consolidated balance sheet.
The Company assesses the hedge effectiveness of the interest rate swaps in accordance with the
requirements outlined in the accounting standards. For these hedges, management documents, both at
inception and over the life of the hedge, at least quarterly, its analysis of actual and expected
hedge effectiveness. For those hedging relationships in which the critical terms of the entire debt
instrument and the derivative are identical, and the creditworthiness of the counterparty to the
hedging instrument remains sound, there is no hedge ineffectiveness so long as those conditions
continue to be met.
Property and Equipment
Property and equipment are stated at cost less accumulated depreciation. Replacements,
renewals and improvements are capitalized and costs for repair and maintenance are expensed as
incurred. Depreciation is computed using the straight-line method over the estimated useful lives
shown below. Leasehold improvements are depreciated using the straight-line method over the lesser
of the useful life of the asset or remaining lease term.
| Estimated Useful Lives | ||||
Furniture, fixtures and equipment |
5 to 7 years | |||
Computer software |
18 months to 7 years | |||
Leasehold improvements |
5 to 15 years | |||
Capitalized Software
The Company develops software that is used in providing processing and information management
services to customers. A significant portion of the Company’s capital expenditures are for the
development of internal-use computer software. Software development costs are capitalized once
technological feasibility of the software has been established. Costs incurred prior to
establishing technological feasibility are expensed as incurred. Technological feasibility is
established when the Company has completed all planning, designing, coding and testing activities
that are necessary to determine that the software can be produced to meet its design
specifications, including functions, features and technical performance requirements.
Capitalization of costs ceases when the software is ready for its intended use. Software
development costs are amortized using the straight-line method over the estimated useful life of
the software. Capitalized costs include interest costs incurred while developing internal-use
computer software. Amounts capitalized for software were $14,030 in 2009, $14,962 in 2008 and
$16,737 in 2007. Amortization for software totaled $15,698 in 2009, $13,650 in 2008 and $11,452 in
2007.
46
Table of Contents
WRIGHT EXPRESS CORPORATION
NOTES TO CONSOLIDATED FINANCIAL STATEMENTS (continued)
NOTES TO CONSOLIDATED FINANCIAL STATEMENTS (continued)
(in thousands, except per share data)
Goodwill and Other Intangible Assets
The Company classifies intangible assets into three categories: (1) intangible assets with
definite lives subject to amortization, (2) intangible assets with indefinite lives not subject to
amortization and (3) goodwill. The Company tests intangible assets with definite lives for
impairment if conditions exist that indicate the carrying value may not be recoverable. Such
conditions may include an economic downturn or a change in the assessment of future operations. The
Company records an impairment charge when the carrying value of the definite-lived intangible asset
is not recoverable from the undiscounted cash flows generated from the use of the asset.
Intangible assets with indefinite lives and goodwill are not amortized. The Company tests
these intangible assets and goodwill for impairment at least annually or more frequently if events
or circumstances indicate that such intangible assets or goodwill might be impaired. All goodwill
and intangible assets are assigned to reporting units, which are one level below the Company’s
operating segments. Goodwill and intangible assets are assigned to the reporting unit which
benefits from the synergies arising from each business combination. The Company performs its
impairment tests at its reporting unit level. Such impairment tests include comparing the fair
value of the respective reporting unit with its carrying value, including goodwill. The Company
uses a variety of methodologies to estimate fair value, including discounted cash
flow analyses. Certain assumptions are used in determining the fair value, including assumptions
about future cash flows and terminal values. When appropriate, the Company considers the
assumptions that it believes hypothetical marketplace participants would use in estimating future
cash flows. In addition, where applicable, an appropriate discount rate is used, based on the
Company’s cost of capital or reporting unit-specific economic factors. When the fair value is
less than the carrying value of the intangible assets or the reporting unit, the Company records an
impairment charge to reduce the carrying value of the assets to fair value. Impairment charges are
recorded in depreciation and amortization expense on the consolidated statement of income. The
Company’s annual goodwill and intangible assets impairment test, performed as of October 1, did not
identify any impairment in any of the years presented.
The Company determines the useful lives of our identifiable intangible assets after
considering the specific facts and circumstances related to each intangible asset. Factors
management considers when determining useful lives include the contractual term of any agreement,
the history of the asset, the Company’s long-term strategy for the use of the asset, any laws or
other local regulations which could impact the useful life of the asset and other economic factors,
including competition and specific market conditions. Intangible assets that are deemed to have
definite lives are amortized over their useful lives, which is the period of time that the asset is
expected to contribute directly or indirectly to future cash flows. An evaluation of the remaining
useful lives of the definite-lived intangible assets is performed periodically to determine if any
change is warranted.
All business combinations occurred prior to January 1, 2009. Accordingly, the accounting
guidance utilized was relevant for those prior periods. This guidance required that acquisition
costs be capitalized rather than expensed. All other differences between the two standards were not
material.
Impairment of Long-lived Assets
Long-lived assets are tested for impairment whenever events or changes in circumstances, such
as a reduction in operating cash flow or a dramatic change in the manner the asset is intended to
be used, indicate the carrying amount of the asset may not be recoverable. If indicators exist, the
Company compares the estimated undiscounted future cash flows associated with these assets or
operations to their carrying value to determine if a write-down to fair value (normally measured by
the expected present value technique) is required. The Company recognized $858 of impairment
expense on its long-lived assets during the year ended December 31, 2009. Impairment expense of
$1,646 was recognized during the year ended December 31, 2008, and no impairment expense was
recognized during the year ended December 31, 2007. These amounts were recorded in occupancy and
equipment in the consolidated statements of income.
Other Assets
The Company has an investment in the stock of the Federal Home Loan Bank totaling $1,562 for
all years presented, which is carried at cost and not considered a readily marketable security.
This investment is included in other assets on the consolidated
balance sheet.
As of December 31, 2009, the Company has concluded that the investment is not impaired.
47
Table of Contents
WRIGHT EXPRESS CORPORATION
NOTES TO CONSOLIDATED FINANCIAL STATEMENTS (continued)
NOTES TO CONSOLIDATED FINANCIAL STATEMENTS (continued)
(in thousands, except per share data)
Fair Value of Financial Instruments
The carrying values of cash and cash equivalents, accounts receivable, accounts payable,
accrued expenses, deposits, borrowed federal funds and other liabilities approximate their
respective fair values due to the short-term nature of such instruments. The carrying values of the
revolving line-of-credit facilities and preferred stock approximate their respective fair values as
the interest rates on these financial instruments are variable. The rates are tied to the London
Interbank Offered Rate (“LIBOR”) and adjust at least quarterly. All other financial instruments are
reflected at fair value on the consolidated balance sheet.
Revenue Recognition
The majority of the Company’s revenues are comprised of transaction-based fees, which
typically are calculated based on measures such as percentage of (i) dollar volume processed; (ii)
number of transactions processed; or (iii) some combination thereof. The Company has entered into
agreements with major oil companies, fuel retailers and vehicle maintenance providers which provide
products or products and services to the Company’s customers. These agreements specify that a
transaction is deemed to be captured when the Company has validated that the transaction has no
errors and has accepted and posted the data to the Company’s records. The Company recognizes
revenues when persuasive evidence of an arrangement exists, the products and services have been
provided to the client, the sales price is fixed or determinable and collectability is reasonably
assured.
A description of the major components of revenue is as follows:
Payment Processing Revenue. Revenue consists of transaction fees assessed to major oil
companies, fuel retailers and vehicle maintenance providers. The fee charged is generally based
upon a percentage of the total transaction amount; however, it may also be based on a fixed amount
charged per transaction or, on a combination of both measures. The fee is deducted from the
Company’s payment to the major oil company, fuel retailer or vehicle maintenance provider and
recorded as revenue at the time the transaction is captured.
Interchange income is earned by the Company’s MasterCard products and is included in payment
processing revenue. Interchange income is a fee paid by a merchant bank to the card-issuing bank
through the interchange network. Interchange fees are set by MasterCard International Inc. and are
based on cardholder purchase volumes. The Company recognizes interchange income as earned.
Transaction Processing Revenue. The Company earns transaction fees, which are principally
based on the number of transactions processed; however, the fees may be a percentage of the total
transaction amount. These fees are recognized at the time the transaction is captured.
Account Servicing Revenue. Revenue is primarily comprised of monthly fees based on fleet
accounts on file, both active and inactive. These fees are primarily in return for providing
monthly vehicle data reports. Account servicing revenue is recognized monthly, as the Company
fulfills its contractual service obligations.
Finance Fees. The Company earns revenue by assessing monthly finance fees on accounts with
overdue balances. These fees are recognized as revenue, net of a provision for uncollectible
accounts, at the time the fees are assessed. The reserve for uncollectible finance fee income
totaled $392 at December 31, 2009, $1,117 at December 31, 2008, and $987 at December 31, 2007. This
reserve is in addition to the Company’s reserve for credit losses.
Other. The Company assesses fees for providing ancillary services, such as information
products and services, professional services and marketing services. Other revenues also include
fees for overnight shipping, certain customized electronic reporting and customer contact services
provided on behalf of certain of the Company’s customers. The Company also assesses fees for
holding receivables related to certain transaction processing transactions. Service-related
revenues are recognized in the period that the work is performed.
Interest and dividends earned on investments in available-for-sale securities also are
included in other revenues, as well as realized gains and losses on such investments.
Investment-related income is recognized in the period that it is earned.
48
Table of Contents
WRIGHT EXPRESS CORPORATION
NOTES TO CONSOLIDATED FINANCIAL STATEMENTS (continued)
NOTES TO CONSOLIDATED FINANCIAL STATEMENTS (continued)
(in thousands, except per share data)
Hardware and Equipment Sales. The Company sells telematics devices as part of its
WEXSmartTM telematics program. In addition, the Company sells assorted equipment to its
Pacific Pride franchisees. The Company recognizes revenue from these sales when the customer has
accepted delivery of the product and collectability of the sales amount is reasonably assured.
From time to time the Company provides rebates and/or incentives to certain customers and
selected strategic relationships in order to induce them to use the Company’s payment processing or
transaction processing services. The revenues described above are net of rebates and incentives
provided to customers. Rebates are recorded in the period in which they are earned. Incentives are
recognized on a pro rata basis over the term of the contract and derecognized only when a
determination is made that the targeted objective will not be achieved.
Stock-Based Compensation
The Company sponsors restricted stock award plans and stock option plans. The Company
recognizes compensation expense related to employee stock awards over their vesting periods based
upon the fair value of the award on the date of grant. In instances
where vesting is dependent upon the realization of certain performance
goals, compensation is estimated and amortized over the vesting
period.
Advertising Costs
Advertising and marketing costs are expensed in the period the advertising occurs.
Income Taxes
Deferred tax assets and liabilities are recognized for the future tax consequences
attributable to differences between the financial statement carrying amounts of existing assets and
liabilities and their respective tax bases. Deferred tax assets and liabilities are measured using
enacted tax rates expected to apply to taxable income in the years in which those temporary
differences are expected to be recovered or settled. The effect on deferred tax assets and
liabilities of a change in tax rates is recognized in the period that includes the enactment date.
The realizability of deferred tax assets must also be assessed. The ultimate realization of
deferred tax assets is dependent upon the generation of future taxable income during the periods in
which the associated temporary differences became deductible. A valuation allowance must be
established for deferred tax assets which are not believed to more likely than not be realized in
the future. Deferred taxes are not provided for the undistributed earnings of the Company’s foreign
subsidiaries that are considered to be indefinitely reinvested outside of the United States.
The impact of an uncertain income tax position on the income tax return is recognized at the
largest amount that is more likely than not to be sustained upon audit by the relevant taxing
authority. An uncertain income tax position will not be recognized if it has less than a 50 percent
likelihood of being sustained. The Company has not currently recognized a material liability for
unrecognized tax benefits. The Company will recognize interest and penalties associated with
uncertain tax positions as part of its income tax provision should such liabilities arise.
49
Table of Contents
WRIGHT EXPRESS CORPORATION
NOTES TO CONSOLIDATED FINANCIAL STATEMENTS (continued)
NOTES TO CONSOLIDATED FINANCIAL STATEMENTS (continued)
(in thousands, except per share data)
Earnings per Common Share
When diluted earnings per common share is calculated, weighted-average outstanding shares are
adjusted for the dilutive effect of shares issuable upon the assumed conversion of the Company’s
convertible, redeemable preferred stock and common stock equivalents, which consist of outstanding
stock options and unvested restricted stock units. The dividends expensed on convertible,
redeemable preferred stock are added back to net income when the related common stock equivalents
are included in the computation of diluted earnings per common share. Holders of unvested
restricted stock units are not entitled to participate in dividends, should they be declared.
Income available for common stockholders used to calculate earnings per share is as follows:
| Year ended December 31, | ||||||||||||
| 2009 | 2008 | 2007 | ||||||||||
Income available for common stockholders – Basic |
$ | 139,659 | $ | 127,640 | $ | 51,577 | ||||||
Convertible, redeemable preferred stock |
248 | 474 | — | |||||||||
Income available for common stockholders – Diluted |
$ | 139,907 | $ | 128,114 | $ | 51,577 | ||||||
Weighted average common shares outstanding used to calculate earnings per share are as
follows:
| Year ended December 31, | ||||||||||||
| 2009 | 2008 | 2007 | ||||||||||
Weighted average common shares outstanding – Basic |
38,303 | 38,885 | 40,042 | |||||||||
Unvested restricted stock units |
396 | 419 | 605 | |||||||||
Stock options |
221 | 39 | 104 | |||||||||
Convertible, redeemable preferred stock |
444 | 444 | — | |||||||||
Weighted average common shares outstanding – Diluted |
39,364 | 39,787 | 40,751 | |||||||||
The following were not included in Weighted average common shares outstanding – Diluted because they are anti-dilutive: |
||||||||||||
Convertible, redeemable preferred stock |
— | — | 444 | |||||||||
Foreign Currency Translation
The financial statements of the Company’s foreign subsidiaries, whose functional currencies
are other than the U.S. dollar, are translated to U.S. dollars as prescribed by the accounting
literature. Assets and liabilities are translated at the year end spot exchange rate, revenue and
expenses at average exchange rates and equity transactions at historical exchange rates. Exchange
differences arising on translation are recorded as a component of accumulated other comprehensive
income. Realized and unrealized gains and losses on foreign currency transactions are recorded
directly to the statement of income.
Accumulated Other Comprehensive Income (Loss)
Accumulated other comprehensive income (loss) includes unrealized losses on available-for-sale
securities, the changes in fair values of derivative instruments designated as hedges of future
cash flows related to interest rate variability and foreign currency translation adjustments
pertaining to the net investment in foreign operations. Amounts are recognized net of tax to the
extent applicable.
50
Table of Contents
WRIGHT EXPRESS CORPORATION
NOTES TO CONSOLIDATED FINANCIAL STATEMENTS (continued)
NOTES TO CONSOLIDATED FINANCIAL STATEMENTS (continued)
(in thousands, except per share data)
| 2. | Supplemental Cash Flow Information |
| Year ended December 31, | ||||||||||||
| 2009 | 2008 | 2007 | ||||||||||
Interest paid |
$ | 28,230 | $ | 47,120 | $ | 43,947 | ||||||
Income taxes paid |
$ | 13,672 | $ | 31,000 | $ | 17,642 | ||||||
Significant Non-cash Transactions
There were no significant non-cash transactions during 2008 and 2009.
During 2007, the Company entered into a software licensing agreement that has been
capitalized. The agreement requires monthly payments over three years in return for the right to
use certain software applications in perpetuity. The net present value of the monthly payments was
$2,872 at the time the agreement was entered into.
| 3. | Business Acquisitions |
Acquisition of TelaPoint, Inc. In August 2007, the Company acquired the stock of TelaPoint,
Inc. (“TelaPoint”) for approximately $40,000 cash. The Company purchased TelaPoint in order to take
advantage of its browser-based supply chain software solutions for bulk petroleum distributors and
retailers.
The following is a reconciliation of the cost of TelaPoint with the net assets acquired and
the ultimate allocation to goodwill:
Consideration paid (including acquisition costs and net of cash acquired) |
$ | 40,806 | ||
Less: |
||||
Net liabilities assumed |
(649 | ) | ||
Acquired software |
9,000 | |||
Customer relationships |
10,000 | |||
Trademarks |
600 | |||
Recorded goodwill |
$ | 21,855 | ||
Acquisition of Pacific Pride Services, Inc. In February 2008, the Company acquired
certain assets and assumed certain liabilities of Pacific Pride Services, Inc. and established
Pacific Pride Services, LLC (“Pacific Pride”) for approximately $32,000 cash. At the time of
purchase, Pacific Pride’s franchise network encompassed more than three-hundred forty independent
fuel franchisees who issued their own Pacific Pride commercial fueling cards to fleet customers.
These cards provide access to fuel at more than two thousand Pacific Pride and strategic partner
locations in the United States and Canada.
51
Table of Contents
WRIGHT EXPRESS CORPORATION
NOTES TO CONSOLIDATED FINANCIAL STATEMENTS (continued)
NOTES TO CONSOLIDATED FINANCIAL STATEMENTS (continued)
(in thousands, except per share data)
The following is a reconciliation of the cost of the net assets acquired from Pacific Pride
Services, Inc. and the ultimate allocation to goodwill:
Consideration paid (including acquisition costs and net of cash acquired) |
$ | 31,540 | ||
Less: |
||||
Accounts receivable |
39,396 | |||
Accounts payable |
(42,341 | ) | ||
Other tangible assets, net |
148 | |||
Acquired software |
300 | |||
Non-compete agreement |
100 | |||
Customer relationships |
13,400 | |||
Trademarks and trade names |
1,400 | |||
Recorded goodwill |
$ | 19,137 | ||
Acquisition of Financial Automation Limited. In August 2008, the Company acquired
certain assets of Financial Automation Limited for approximately $9,250 cash and established Wright
Express New Zealand (“Wright Express New Zealand”) to operate the business of Financial Automation
Limited.
Financial Automation Limited provides fuel card processing software solutions to oil companies
in geographic markets outside the United States.
The following is a reconciliation of the cost of the assets acquired from Financial Automation
Limited and the ultimate allocation to goodwill:
Consideration paid (including acquisition costs and net of cash acquired) |
$ | 10,073 | ||
Less: |
||||
Tangible assets, net |
96 | |||
Acquired software |
7,000 | |||
Customer relationship |
1,500 | |||
Trade name |
100 | |||
Recorded goodwill |
$ | 1,377 | ||
The operations for each of these acquisitions are reported within the results of the
Company’s fleet segment from the acquisition date.
Significant goodwill amounts are present in both the TelaPoint and Pacific Pride acquisitions
based on the Company’s belief that the business models and practices followed by these entities
were sufficiently distinct to warrant the payment of a purchase price premium.
No pro forma information has been included in these financial statements as the results of
operations of TelaPoint, Pacific Pride and Financial Automation Limited for the periods that they
were not part of the Company, are immaterial to the Company’s revenues, net income or earnings per
share.
52
Table of Contents
WRIGHT EXPRESS CORPORATION
NOTES TO CONSOLIDATED FINANCIAL STATEMENTS (continued)
NOTES TO CONSOLIDATED FINANCIAL STATEMENTS (continued)
(in thousands, except per share data)
| 4. | Reserves for Credit Losses |
The following table presents changes in reserves for credit losses related to accounts
receivable:
| Year ended December 31, | ||||||||||||
| 2009 | 2008 | 2007 | ||||||||||
Balance, beginning of period |
$ | 18,435 | $ | 9,466 | $ | 9,749 | ||||||
Provision for credit losses |
17,715 | 45,021 | 20,569 | |||||||||
Charge-offs |
(32,519 | ) | (42,625 | ) | (25,282 | ) | ||||||
Recoveries of amounts previously charged-off |
7,329 | 6,573 | 4,430 | |||||||||
Balance, end of period |
$ | 10,960 | $ | 18,435 | $ | 9,466 | ||||||
| 5. | Investments |
Available-for-sale Securities
The Company’s available-for-sale securities as of December 31 are presented below:
| Gross | Gross | |||||||||||||||
| Unrealized | Unrealized | |||||||||||||||
| Cost | Gains | Losses | Fair Value | |||||||||||||
2009 |
||||||||||||||||
Mortgage-backed securities |
$ | 2,843 | $ | 61 | $ | 18 | $ | 2,886 | ||||||||
Asset-backed securities |
3,176 | — | 43 | 3,133 | ||||||||||||
Municipal bonds |
365 | — | — | 365 | ||||||||||||
Equity securities (a) |
4,176 | 36 | — | 4,212 | ||||||||||||
Total available-for-sale securities |
$ | 10,560 | $ | 97 | $ | 61 | $ | 10,596 | ||||||||
2008 |
||||||||||||||||
Mortgage-backed securities |
$ | 4,232 | $ | 38 | $ | 33 | $ | 4,237 | ||||||||
Asset-backed securities |
3,956 | — | 82 | 3,874 | ||||||||||||
Municipal bonds |
390 | 2 | — | 392 | ||||||||||||
Equity securities (a) |
4,038 | 3 | 11 | 4,030 | ||||||||||||
Total available-for-sale securities |
$ | 12,616 | $ | 43 | $ | 126 | $ | 12,533 | ||||||||
| (a) | These securities exclude $1,593 in equity securities designated as trading as of December 31, 2009, and $1,401 as of December 31, 2008, included in other assets on the consolidated balance sheets. See Note 16 for additional information about the securities designated as trading. |
The Company’s management has determined that the gross unrealized losses on its
investment securities at December 31, 2009, are temporary in nature. The Company reviews its
investments to identify and evaluate investments that have indications of possible impairment.
Factors considered in determining whether a loss is temporary include the length of time and extent
to which fair value has been less than the cost basis, the financial condition and near-term
prospects of the investee, and the Company’s intent and ability to hold the investment for a period
of time sufficient to allow for any anticipated recovery in market value. Substantially all of the
Company’s fixed income securities are rated investment grade or better.
The
Company had maturities of $2,194 of available-for-sale securities for the year ended
December 31, 2009, $1,255 of available-for-sale securities for the year ended December 31, 2008,
and $1,123 of available-for-sale securities for the year ended December 31, 2007.
53
Table of Contents
WRIGHT EXPRESS CORPORATION
NOTES TO CONSOLIDATED FINANCIAL STATEMENTS (continued)
NOTES TO CONSOLIDATED FINANCIAL STATEMENTS (continued)
(in thousands, except per share data)
The maturity dates of the Company’s available-for-sale securities are as follows:
| December 31, | ||||||||||||||||
| 2009 | 2008 | |||||||||||||||
| Cost | Fair Value | Cost | Fair Value | |||||||||||||
Due within 1 year |
$ | — | $ | — | $ | — | $ | — | ||||||||
Due after 1 year through year 5 |
— | — | — | — | ||||||||||||
Due after 5 years through year 10 |
2,150 | 2,130 | 2,878 | 2,834 | ||||||||||||
Due after 10 years |
1,391 | 1,368 | 1,468 | 1,432 | ||||||||||||
Mortgage backed securities with original maturities of 30 years |
2,843 | 2,886 | 4,232 | 4,237 | ||||||||||||
Equity securities with no maturity dates |
4,176 | 4,212 | 4,038 | 4,030 | ||||||||||||
Total |
$ | 10,560 | $ | 10,596 | $ | 12,616 | $ | 12,533 | ||||||||
| 6. | Property, Equipment and Capitalized Software, Net |
Property, equipment and capitalized software, net consist of the following:
| December 31, | ||||||||
| 2009 | 2008 | |||||||
Furniture, fixtures and equipment |
$ | 15,073 | $ | 13,131 | ||||
Computer software |
98,764 | 81,666 | ||||||
Software under development |
2,649 | 6,467 | ||||||
Leasehold improvements |
1,460 | 1,414 | ||||||
Total |
117,946 | 102,678 | ||||||
Less accumulated depreciation and amortization |
(72,955 | ) | (57,814 | ) | ||||
Total property, equipment and capitalized software, net |
$ | 44,991 | $ | 44,864 | ||||
The Company incurred $814 of impairment charges during 2009 and $1,538 during 2008
related to partially completed internal-use software. These charges have been included in occupancy
and equipment expense on the consolidated statements of income.
| 7. | Goodwill and Other Intangible Assets |
The changes in goodwill during the period January 1 to December 31, 2009 were as follows:
| Fleet | MasterCard | |||||||||||
| Segment | Segment | Total | ||||||||||
Goodwill, beginning of period |
$ | 305,517 | $ | 9,713 | $ | 315,230 | ||||||
Impact of foreign currency translation |
(3 | ) | — | (3 | ) | |||||||
Goodwill, end of period |
$ | 305,514 | $ | 9,713 | $ | 315,227 | ||||||
During the period January 1 to December 31, 2009, no goodwill was written off due to
impairment.
54
Table of Contents
WRIGHT EXPRESS CORPORATION
NOTES TO CONSOLIDATED FINANCIAL STATEMENTS (continued)
NOTES TO CONSOLIDATED FINANCIAL STATEMENTS (continued)
(in thousands, except per share data)
The
changes in goodwill during the period January 1 to December 31, 2008 were as follows:
| Fleet | MasterCard | |||||||||||
| Segment | Segment | Total | ||||||||||
Goodwill, beginning of period |
$ | 284,652 | $ | 9,713 | $ | 294,365 | ||||||
Adjustment
to allocation of purchase price for TelaPoint acquisition |
351 | — | 351 | |||||||||
Acquisition
of Pacific Pride |
19,137 | — | 19,137 | |||||||||
Acquisition
of FAL |
1,377 | — | 1,377 | |||||||||
Goodwill, end of period |
$ | 305,517 | $ | 9,713 | $ | 315,230 | ||||||
The changes in intangible assets during the period January 1 to December 31, 2009, were as
follows:
| Net Carrying | Impacts of | Net Carrying | ||||||||||||||
| Amount, | Foreign | Amount, | ||||||||||||||
| Beginning of | Currency | End of | ||||||||||||||
| Period | Amortizations | Translation | Period | |||||||||||||
Definite-lived intangible assets |
||||||||||||||||
Acquired software |
$ | 15,085 | $ | (1,520 | ) | $ | — | $ | 13,565 | |||||||
Non-compete agreement |
17 | (17 | ) | — | — | |||||||||||
Customer relationships |
20,267 | (3,494 | ) | (42 | ) | 16,731 | ||||||||||
Trade name |
88 | (34 | ) | — | 54 | |||||||||||
Indefinite-lived intangible assets |
||||||||||||||||
Trademarks and trade names |
4,465 | — | — | 4,465 | ||||||||||||
Total |
$ | 39,922 | $ | (5,065 | ) | $ | (42 | ) | $ | 34,815 | ||||||
The Company expects amortization expense related to the definite-lived intangible assets
above as follows: $5,431 for 2010; $4,710 for 2011; $4,075 for 2012; $3,459 for 2013 and $2,841
for 2014.
Other intangible assets consist of the following:
| December 31, 2009 | December 31, 2008 | |||||||||||||||||||||||
| Gross | Gross | |||||||||||||||||||||||
| Carrying | Accumulated | Net Carrying | Carrying | Accumulated | Net Carrying | |||||||||||||||||||
| Amount | Amortization | Amount | Amount | Amortization | Amount | |||||||||||||||||||
Definite-lived intangible assets |
||||||||||||||||||||||||
Acquired software |
$ | 16,300 | $ | (2,735 | ) | $ | 13,565 | $ | 16,300 | $ | (1,215 | ) | $ | 15,085 | ||||||||||
Non-compete agreement |
100 | (100 | ) | — | 100 | (83 | ) | 17 | ||||||||||||||||
Customer relationships |
24,858 | (8,127 | ) | 16,731 | 24,900 | (4,633 | ) | 20,267 | ||||||||||||||||
Trade name |
100 | (46 | ) | 54 | 100 | (12 | ) | 88 | ||||||||||||||||
| $ | 41,358 | $ | (11,008 | ) | 30,350 | $ | 41,400 | $ | (5,943 | ) | 35,457 | |||||||||||||
Indefinite-lived intangible assets |
||||||||||||||||||||||||
Trademarks and trade names |
4,465 | 4,465 | ||||||||||||||||||||||
Total |
$ | 34,815 | $ | 39,922 | ||||||||||||||||||||
| 8. | Accounts Payable |
Accounts payable consist of:
| December 31, | ||||||||
| 2009 | 2008 | |||||||
Merchants payable |
$ | 271,307 | $ | 239,899 | ||||
Other payables |
11,842 | 9,168 | ||||||
Total accounts payable |
$ | 283,149 | $ | 249,067 | ||||
55
Table of Contents
WRIGHT EXPRESS CORPORATION
NOTES TO CONSOLIDATED FINANCIAL STATEMENTS (continued)
NOTES TO CONSOLIDATED FINANCIAL STATEMENTS (continued)
(in thousands, except per share data)
| 9. | Deposits and Borrowed Federal Funds |
The following table presents information about deposits:
| December 31, | ||||||||
| 2009 | 2008 | |||||||
Certificates of deposit with maturities within 1 year |
$ | 308,266 | $ | 507,370 | ||||
Certificates of deposit with maturities greater than 1 year and less than 5 years |
106,730 | 24,646 | ||||||
Non-interest bearing deposits |
8,291 | 8,130 | ||||||
Total deposits |
$ | 423,287 | $ | 540,146 | ||||
Weighted average cost of funds on certificates of deposit outstanding |
1.25 | % | 3.85 | % | ||||
Wright Express Financial Services Corporation (“FSC”) issues certificates of deposit in
various maturities ranging between three months and two years and with fixed interest rates ranging
from 0.35 percent to 4.00 percent as of December 31, 2009. FSC may issue certificates of deposit
without limitation on the balance outstanding. However, FSC must maintain minimum financial ratios,
which include risk-based asset and capital requirements, as prescribed by the FDIC. As of
December 31, 2009, certificates of deposit were in denominations of $250 or less, corresponding to
the increase in the FDIC insurance limits to $250 as authorized by the Emergency Economic
Stabilization Act of 2008. The certificates of deposit are only payable prior to maturity in the
case of death or legally declared mental incompetence of the holder.
Non-interest bearing deposits are required for certain customers as collateral for their
credit accounts.
The Company had federal funds lines-of-credit totaling $155,000 at December 31, 2009, and
December 31, 2008. There was $71,723 in outstanding borrowings against these lines-of-credit at
December 31, 2009 and none at December 31, 2008. The average rate on the outstanding borrowings
under lines-of-credit was 0.35 percent at December 31, 2009.
The following table presents the average interest rates for deposits and borrowed federal
funds:
| Year ended December 31, | ||||||||||||
| 2009 | 2008 | 2007 | ||||||||||
Average interest rate: |
||||||||||||
Deposits |
2.39 | % | 4.42 | % | 5.27 | % | ||||||
Borrowed federal funds |
0.43 | % | 2.44 | % | 5.29 | % | ||||||
Average debt balance |
$ | 434,529 | $ | 664,646 | $ | 544,674 | ||||||
56
Table of Contents
WRIGHT EXPRESS CORPORATION
NOTES TO CONSOLIDATED FINANCIAL STATEMENTS (continued)
NOTES TO CONSOLIDATED FINANCIAL STATEMENTS (continued)
(in thousands, except per share data)
10. Derivative Instruments
Fuel Price Derivatives
Derivatives Not Designated as Hedging Instruments
For derivative instruments that are not designated as hedging instruments, the gain or loss on
the derivative is recognized in current earnings. As of December 31, 2009, the Company had the
following put and call option contracts which settle on a monthly basis:
| Aggregate | ||||
| Notional | ||||
| Amount | ||||
| (gallons) (a) | ||||
Fuel price
derivative instruments – unleaded fuel |
||||
Put and call
option contracts settling January 2010 – June 2011 |
29,781 | |||
Fuel price
derivative instruments – diesel |
||||
Put and call
option contracts settling January 2010 – June 2011 |
13,380 | |||
Total fuel price derivative instruments |
43,161 | |||
| (a) | The settlement of the put and call option contracts (in all instances, notional amount of puts and calls are equal; strike prices are different) is based upon the New York Mercantile Exchange’s New York Harbor Reformulated Gasoline Blendstock for Oxygen Blending and the U.S. Department of Energy’s weekly retail on-highway diesel fuel price for the month. |
Interest Rate Swaps
In July 2009, the Company entered into an interest rate swap arrangement for $50 million. This
interest rate swap arrangement was designated as a cash flow hedge intended to reduce a portion of
the variability of the future interest payments on our credit
agreement. Two of the Company’s previous
interest rate swap agreements totaling $80 million expired on
July 22, 2009. The Company’s $25 million interest rate swap
expired on August 24, 2009.
The following table presents information about the Company’s interest rate swap arrangements:
| December 31, | ||||||||||||||||||||||||
| 2009 | 2008 | |||||||||||||||||||||||
| Weighted- | Weighted- | |||||||||||||||||||||||
| Average | Aggregate | Average | Aggregate | |||||||||||||||||||||
| Base Rate | Notional | Fair Value | Base Rate | Notional | Fair Value | |||||||||||||||||||
July 2007 Swaps |
— | % | $ | — | $ | — | 5.20 | % | $ | 80,000 | $ | (2,048 | ) | |||||||||||
August 2007 Swap |
— | % | — | — | 4.73 | % | 25,000 | (694 | ) | |||||||||||||||
July 2009 Swap |
1.35 | % | 50,000 | 278 | — | — | — | |||||||||||||||||
Total |
$ | 50,000 | $ | 278 | $ | 105,000 | $ | (2,742 | ) | |||||||||||||||
57
Table of Contents
WRIGHT EXPRESS CORPORATION
NOTES TO CONSOLIDATED FINANCIAL STATEMENTS (continued)
NOTES TO CONSOLIDATED FINANCIAL STATEMENTS (continued)
(in thousands, except per share data)
The following table presents information on the location and amounts of derivative fair
values in the condensed consolidated balance sheets:
| Asset Derivatives | Liability Derivatives | |||||||||||||||||||||||
| December 31, 2009 | December 31, 2008 | December 31, 2009 | December 31, 2008 | |||||||||||||||||||||
| Balance | Balance | Balance | Balance | |||||||||||||||||||||
| Sheet | Fair | Sheet | Fair | Sheet | Fair | Sheet | Fair | |||||||||||||||||
| Location | Value | Location | Value | Location | Value | Location | Value | |||||||||||||||||
Derivatives designated as hedging instruments |
||||||||||||||||||||||||
Interest rate contracts
|
Other assets | $ | — | Other assets | $ | — | Accrued expenses | $ | 278 | Accrued expenses | $ | 2,742 | ||||||||||||
Derivatives not designated as hedging instruments |
||||||||||||||||||||||||
Commodity contracts
|
Fuel price derivatives, at fair value |
6,152 | Fuel price derivatives, at fair value |
49,294 | Fuel price derivatives, at fair value |
— | Fuel price derivatives, at fair value |
— | ||||||||||||||||
Total derivatives
|
$ | 6,152 | $ | 49,294 | $ | 278 | $ | 2,742 | ||||||||||||||||
The following table presents information on the location and amounts of derivative gains
and losses in the condensed consolidated statements of income:
| Amount of Gain | ||||||||||||||||||||||||||||||||
| or (Loss) | ||||||||||||||||||||||||||||||||
| Reclassified | Amount of Gain or | |||||||||||||||||||||||||||||||
| from | (Loss) Recognized in | |||||||||||||||||||||||||||||||
| Accumulated | Income on Derivative | |||||||||||||||||||||||||||||||
| Amount of Gain or | OCI into | Location of Gain or | (Ineffective Portion | |||||||||||||||||||||||||||||
| (Loss) Recognized in | Income | (Loss) Recognized in | and Amount | |||||||||||||||||||||||||||||
| OCI on Derivative | Location of Gain or | (Effective | Income on Derivative | Excluded from | ||||||||||||||||||||||||||||
| (Effective Portion) (a) | (Loss) Reclassified | Portion) | (Ineffective Portion | Effectiveness | ||||||||||||||||||||||||||||
| Derivatives | from Accumulated | and Amount Excluded | Testing) (b) | |||||||||||||||||||||||||||||
| Designated as | For the period ended | OCI into Income | For the period ended | from Effectiveness | For the period ended | |||||||||||||||||||||||||||
| Hedging Instruments | December 31, | (Effective Portion) | December 31, | Testing) (b) | December 31, | |||||||||||||||||||||||||||
| 2009 | 2008 | 2009 | 2008 | 2009 | 2008 | |||||||||||||||||||||||||||
Interest rate contracts |
$ | 1,560 | $ | (319 | ) | Financing interest expense |
$ | (3,223 | ) | $ | (2,240 | ) | Financing interest expense |
$ | — | $ | — | |||||||||||||||
| Amount of Gain or | ||||||||||||||||||||||||||||||||
| (Loss) Recognized in | ||||||||||||||||||||||||||||||||
| Income on Derivative | ||||||||||||||||||||||||||||||||
| Derivatives Not | Location of Gain or | For the period ended | ||||||||||||||||||||||||||||||
| Designated as | (Loss) Recognized in | December 31, | ||||||||||||||||||||||||||||||
| Hedging Instruments | Income on Derivative | 2009 | 2008 | |||||||||||||||||||||||||||||
Commodity contracts |
Net realized and unrealized (losses) gains on fuel price derivatives |
$ | (22,542 | ) | $ | 55,206 | ||||||||||||||||||||||||||
| (a) | The amount of gain or (loss) recognized in OCI on the Company’s interest rate swap arrangements has been recorded net of tax impacts of $904 in 2009 and $(208) in 2008. | |
| (b) | No ineffectiveness was reclassified into earnings nor was any amount excluded from effectiveness testing. |
58
Table of Contents
WRIGHT EXPRESS CORPORATION
NOTES TO CONSOLIDATED FINANCIAL STATEMENTS (continued)
NOTES TO CONSOLIDATED FINANCIAL STATEMENTS (continued)
(in thousands, except per share data)
The Company uses derivative instruments to manage the impact of volatility in fuel
prices. The Company enters into put and call option contracts (“Options”) based on the wholesale
price of unleaded gasoline and retail price of diesel fuel, which settle on a monthly basis through
the second quarter of 2011. The Options are intended to lock in a range of prices during any given
quarter on a portion of the Company’s forecasted earnings subject to fuel price variations. The
Company’s fuel price risk management program is designed to purchase derivative instruments to
manage its fuel price-related earnings exposure. The fair value of these instruments is recorded in
fuel price derivative instruments, at fair value on the consolidated balance sheets.
The following table presents information about the Options:
| December 31, | ||||||||||||||||||||||||
| 2009 | 2008 | |||||||||||||||||||||||
| Put Option | Call Option | |||||||||||||||||||||||
| Strike Price | Strike Price | Aggregate | Aggregate | |||||||||||||||||||||
| of Underlying | of Underlying | Notional | Notional | |||||||||||||||||||||
| (per gallon) (a) | (per gallon) (a) | (gallons) (b) | Fair Value | (gallons) | Fair Value | |||||||||||||||||||
Fuel price derivative instruments – unleaded fuel |
||||||||||||||||||||||||
Options settling October 2010 – June 2011 |
$ | 2.013 | $ | 2.073 | 5,836 | (578 | ) | — | — | |||||||||||||||
Options settling July 2010 – March 2011 |
$ | 1.953 | $ | 2.013 | 6,209 | (754 | ) | — | — | |||||||||||||||
Options settling April 2010 – December 2010 |
$ | 1.906 | $ | 1.966 | 4,642 | (776 | ) | — | — | |||||||||||||||
Options settling January 2010 – September 2010 |
$ | 2.860 | $ | 2.920 | 5,219 | 3,349 | 5,219 | 7,000 | ||||||||||||||||
Options settling October 2009 – June 2010 |
$ | 2.430 | $ | 2.490 | 5,302 | 1,418 | 7,860 | 7,938 | ||||||||||||||||
Options settling July 2009 – March 2010 |
$ | 2.443 | $ | 2.503 | 2,573 | 852 | 7,688 | 8,463 | ||||||||||||||||
Options settling April 2009 – December 2009 |
$ | 2.040 | $ | 2.100 | — | — | 7,822 | 5,687 | ||||||||||||||||
Options settling January 2009 – September 2009 |
$ | 1.970 | $ | 2.030 | — | — | 7,674 | 5,512 | ||||||||||||||||
Options settling October 2008 – June 2009 |
$ | 1.850 | $ | 1.910 | — | — | 4,831 | 3,097 | ||||||||||||||||
Options settling July 2008 – March 2009 |
$ | 1.733 | $ | 1.793 | — | — | 2,581 | 1,637 | ||||||||||||||||
Total fuel price derivative instruments – unleaded fuel |
29,781 | 3,511 | 43,675 | 39,334 | ||||||||||||||||||||
Fuel price derivative instruments – diesel |
||||||||||||||||||||||||
Options settling October 2010 – June 2011 |
$ | 3.000 | $ | 3.060 | 2,622 | (437 | ) | — | — | |||||||||||||||
Options settling July 2010 – March 2011 |
$ | 3.000 | $ | 3.060 | 2,790 | (342 | ) | — | — | |||||||||||||||
Options settling April 2010 – December 2010 |
$ | 2.936 | $ | 2.996 | 2,085 | (292 | ) | — | — | |||||||||||||||
Options settling January 2010 – September 2010 |
$ | 4.040 | $ | 4.100 | 2,345 | 2,186 | 2,345 | 2,561 | ||||||||||||||||
Options settling October 2009 – June 2010 |
$ | 3.515 | $ | 3.575 | 2,382 | 1,034 | 3,531 | 2,311 | ||||||||||||||||
Options settling July 2009 – March 2010 |
$ | 3.500 | $ | 3.560 | 1,156 | 492 | 3,454 | 2,391 | ||||||||||||||||
Options settling April 2009 – December 2009 |
$ | 2.975 | $ | 3.035 | — | — | 3,514 | 987 | ||||||||||||||||
Options settling January 2009 – September 2009 |
$ | 2.870 | $ | 2.930 | — | — | 3,448 | 863 | ||||||||||||||||
Options settling October 2008 – June 2009 |
$ | 2.865 | $ | 2.925 | — | — | 2,170 | 611 | ||||||||||||||||
Options settling July 2008 – March 2009 |
$ | 2.753 | $ | 2.813 | — | — | 1,160 | 236 | ||||||||||||||||
Total fuel price derivative instruments – diesel |
13,380 | 2,641 | 19,622 | 9,960 | ||||||||||||||||||||
Total fuel price derivative instruments |
43,161 | 6,152 | 63,297 | 49,294 | ||||||||||||||||||||
| (a) | The settlement of the Options is based upon the New York Mercantile Exchange’s New York Harbor Reformulated Gasoline Blendstock for Oxygen Blending and the U.S. Department of Energy’s weekly retail on-highway diesel fuel price for the month. | |
| (b) | The Options settle on a monthly basis. |
59
Table of Contents
WRIGHT EXPRESS CORPORATION
NOTES TO CONSOLIDATED FINANCIAL STATEMENTS (continued)
NOTES TO CONSOLIDATED FINANCIAL STATEMENTS (continued)
(in thousands, except per share data)
The following table summarizes the changes in fair value of the fuel price derivatives
which have been recorded in net realized and unrealized losses on derivative instruments on the
consolidated statements of income:
| Year ended December 31, | ||||||||||||
| 2009 | 2008 | 2007 | ||||||||||
Realized gains (losses) |
$ | 20,600 | $ | (35,686 | ) | $ | (16,536 | ) | ||||
Unrealized (losses) gains |
(43,142 | ) | 90,892 | (37,074 | ) | |||||||
Net realized and unrealized (losses) gains on derivative instruments |
$ | (22,542 | ) | $ | 55,206 | $ | (53,610 | ) | ||||
| 11. | Financing Debt |
Revolving Credit Facility
On May 22, 2007, the Company entered into a revolving credit facility (the “2007 Revolver”)
with a lending syndicate. The 2007 Revolver initially provided for a five-year $350,000 unsecured
revolving line-of-credit. In connection with the 2007 Revolver, the Company paid loan origination
fees of $998. These fees have been recorded as other assets on the consolidated balance sheet and
are being amortized on a straight-line basis (which approximates the effective interest rate
method) over the term of the 2007 Revolver. On May 29, 2008, the Company entered into an
incremental amendment agreement (the “Incremental Amendment Agreement”) of the 2007 Revolver to
increase the aggregate unsecured revolving line-of-credit from $350,000 to $450,000. The Company
incurred $1,556 in loan origination fees in conjunction with entering into the Incremental
Amendment Agreement. These fees have been recorded as other assets on the consolidated balance
sheet and are being amortized over the remaining term of the 2007 Revolver. All other provisions of
the 2007 Revolver remain unchanged.
Amounts outstanding under the 2007 Revolver bear interest at a rate equal to (a) the British
Bankers Association LIBOR plus a margin of 0.45 percent to 1.125 percent based on the Company’s
consolidated leverage ratio or (b) the higher of the Federal Funds Rate plus 0.50 percent or the
prime rate announced by Bank of America, N.A., plus a margin of up to 0.125 percent based on the
Company’s consolidated leverage ratio. In addition, the Company has agreed to pay a quarterly
commitment fee at a rate per annum ranging from 0.10 percent to 0.20 percent of the daily unused
portion of the 2007 Revolver. The Company also has a letter of credit associated with the 2007
Revolver. The letter of credit reduces the amount available for borrowings and may collateralize
certain of the Company’s derivative instruments. The Company is assessed a fee on the liquidation
value of the letter of credit. This fee was 0.125 percent at December 31, 2009, and 0.575 percent
at December 31, 2008. The balance under the letter of credit was $2,100 at December 31, 2009. The
balance of the letter of credit was $1 at December 31, 2008. Any outstanding loans under the
2007 Revolver mature on May 22, 2012, unless extended pursuant to the terms of the 2007 Revolver.
As of December 31, 2009, the Company had approximately $319,900 available under this facility.
Proceeds from the 2007 Revolver were used to refinance the Company’s indebtedness under an
existing credit facility which consisted of a revolving line-of-credit facility (the “2005
Revolver”) and a term loan (the “Term Loan”). All balances owed by the Company, which included
$20,000 on the 2005 Revolver and $131,000 on the Term Loan were paid at this time. In 2007, the
Company expensed $1,572 of unamortized loan origination fees in conjunction with the termination of
the 2005 Revolver and the Term Loan. This charge has been recorded on the consolidated statement of
income as loss on extinguishment of debt.
60
Table of Contents
WRIGHT EXPRESS CORPORATION
NOTES TO CONSOLIDATED FINANCIAL STATEMENTS (continued)
NOTES TO CONSOLIDATED FINANCIAL STATEMENTS (continued)
(in thousands, except per share data)
The following table presents information about the 2007 Revolver:
| December 31, | ||||||||
| 2009 | 2008 | |||||||
Outstanding balance on revolving line-of-credit with interest based on LIBOR |
$ | 120,000 | $ | 155,000 | ||||
Outstanding balance on revolving line-of-credit with interest based on the prime rate |
8,000 | 15,600 | ||||||
Total outstanding balance on revolving line-of-credit facility |
$ | 128,000 | $ | 170,600 | ||||
Weighted average rate based on LIBOR (including impact of interest rate swaps) |
1.26 | % | 3.78 | % | ||||
Rate based on the prime rate |
3.25 | % | 3.26 | % | ||||
Financing Interest
The following table presents the components of financing interest expense:
| Year ended December 31, | ||||||||||||
| 2009 | 2008 | 2007 | ||||||||||
2007 Revolver: |
||||||||||||
Interest expense based on LIBOR |
$ | 1,444 | $ | 7,793 | $ | 6,584 | ||||||
Interest expense based on the prime rate |
219 | 261 | 340 | |||||||||
Fees |
422 | 508 | 162 | |||||||||
Amortization of loan origination fees |
628 | 465 | 144 | |||||||||
| 2,713 | 9,027 | 7,230 | ||||||||||
2005 Revolver: |
||||||||||||
Interest expense based on LIBOR |
— | — | 746 | |||||||||
Interest expense based on the prime rate |
— | — | 199 | |||||||||
Fees |
— | — | 145 | |||||||||
Amortization of loan origination fees |
— | — | 134 | |||||||||
| — | — | 1,224 | ||||||||||
Term Loan: |
||||||||||||
Interest expense based on LIBOR |
— | — | 3,379 | |||||||||
Amortization of loan origination fees |
— | — | 423 | |||||||||
| — | — | 3,802 | ||||||||||
Realized losses (gains) on interest rate swaps (Note 10) |
3,223 | 2,240 | (414 | ) | ||||||||
Dividends on preferred stock (Note 13) |
248 | 474 | 700 | |||||||||
Other |
26 | 118 | 135 | |||||||||
Total financing interest expense |
$ | 6,210 | $ | 11,859 | $ | 12,677 | ||||||
Average interest rate (including impact of interest rate swaps): |
||||||||||||
Based on LIBOR |
2.95 | % | 4.54 | % | 6.07 | % | ||||||
Based on prime |
3.26 | % | 5.01 | % | 8.09 | % | ||||||
Average debt balance at LIBOR |
$ | 158,268 | $ | 221,044 | $ | 169,671 | ||||||
Average debt balance at prime |
$ | 6,729 | $ | 5,210 | $ | 6,660 | ||||||
61
Table of Contents
WRIGHT EXPRESS CORPORATION
NOTES TO CONSOLIDATED FINANCIAL STATEMENTS (continued)
NOTES TO CONSOLIDATED FINANCIAL STATEMENTS (continued)
(in thousands, except per share data)
Debt Covenants
The 2007 Revolver contains various financial covenants requiring the Company to maintain
certain financial ratios. In addition, the 2007 Revolver contains various customary restrictive
covenants that limit the Company’s ability to pay dividends, sell or transfer all or substantially
all of its property or assets, incur more indebtedness or make guarantees, grant or incur liens on
its assets, make investments, loans, advances or acquisitions, engage in mergers, consolidations,
liquidations or dissolutions, enter into sales or leasebacks or change its accounting policies or
reporting practices. FSC is not subject to certain of these restrictions.
| 12. | Related Parties |
During 2009, 2008 and 2007, the Company utilized legal services in the normal course of
business from a law firm where the spouse of one of the Company’s officers is a principal. Amounts
paid to this law firm in connection with services provided were approximately $14 during 2009, $108
during 2008 and $74 during 2007.
| 13. | Preferred Stock |
There were 0.1 shares of Series A non-voting convertible, redeemable preferred stock issued
and outstanding at December 31, 2009 and 2008, with a par value of $0.01 per share and a purchase
price per share and liquidation value per share of $100,000. The discussion below highlights the
features of the preferred stock. Given these features, the Company has treated the preferred stock
as a liability. Accordingly, dividends are recorded as interest expense on the consolidated
statements of income.
Voting rights. Except in the limited circumstances described below and to the extent
required by the Delaware General Corporation Law, the Series A non-voting convertible, redeemable
preferred stock has no voting power with respect to the election of directors or any other
stockholder matters. Consent of the holders of at least 50 percent of the outstanding Series A
non-voting convertible, redeemable preferred stock, voting as a separate class, is required
to (i) increase the authorized number of shares of Series A non-voting convertible, redeemable
preferred stock, or (ii) amend or repeal the Company’s certificate of incorporation in a manner
that adversely affects the rights, preferences or privileges granted to the Series A non-voting
convertible, redeemable preferred stock.
Dividends. The holder of each share of Series A non-voting convertible, redeemable
preferred stock is entitled to receive, out of funds legally available, cumulative cash dividends
at a floating rate equal to the three-month LIBOR, plus 150 basis points, multiplied by $100,000
per share of the Series A non-voting convertible, redeemable preferred stock, per annum, payable on
a quarterly basis commencing on June 15, 2005, in preference to any dividends paid on the Company’s
common stock. If the Company fails to pay these dividends for two quarterly periods, the dividend
rate will increase by 50 basis points until all dividends in arrears have been paid. Dividends on
the Series A non-voting convertible, redeemable preferred stock accrue whether or not the Company
has earnings, whether or not the Company has funds legally available for the payment of such
dividends and whether or not the Company declares such dividends. At December 31, 2009, the cash
dividend rate was 1.79 percent, at December 31, 2008, this rate was 3.37 percent and at
December 31, 2007, this rate was 6.44 percent. The Company recorded interest expense of $248
related to these dividends for the year ended December 31, 2009, $474 for the year ended
December 31, 2008, and $700 for the year ended December 31, 2007. These dividends have been
recorded as financing interest expense on the consolidated statements of income.
Liquidation preference. In the event of the Company’s liquidation, dissolution or winding
up, the holders of the Series A non-voting convertible, redeemable preferred stock are entitled to
receive a liquidation preference of an amount per share of Series A non-voting convertible,
redeemable preferred stock equal to the sum of (i) $100,000 per share of the Company’s Series A
non-voting convertible, redeemable preferred stock, plus (ii) accrued but unpaid dividends. The
liquidation preference will be adjusted for combinations, consolidations, subdivisions or splits of
the Company’s Series A non-voting convertible, redeemable preferred stock. A merger, acquisition or
sale of all or substantially all of the Company’s and its subsidiaries’ assets, in each case, in
which the holders of the Company’s common stock immediately prior to such transaction hold less
than 50 percent of the voting power of the surviving or purchasing entity is treated as a
liquidation of the Company for these purposes. After payment in full to creditors, if the Company’s
assets are insufficient to pay the liquidation preference to the holders of the Series A non-voting
convertible, redeemable preferred stock, all of the Company’s assets will be distributed ratably
among the holders of Series A non-voting convertible, redeemable preferred stock, based upon the
total liquidation preference due each holder. After payment of the liquidation preference to the
holders of the Series A non-voting convertible, redeemable preferred stock, the Company’s remaining
assets will be distributed to the holders of the Company’s common stock.
62
Table of Contents
WRIGHT EXPRESS CORPORATION
NOTES TO CONSOLIDATED FINANCIAL STATEMENTS (continued)
NOTES TO CONSOLIDATED FINANCIAL STATEMENTS (continued)
(in thousands, except per share data)
Conversion. Each share of Series A non-voting convertible, redeemable preferred stock may,
in certain limited circumstances, at the option of the holder, be converted into a number of shares
of common stock equal to the liquidation preference divided by the then applicable conversion
price. In addition, in the event of certain mergers, acquisitions or sales of assets, each holder
will have the right to receive a make-whole premium. The initial per share conversion price is
$22.50 per share and is subject to anti-dilution adjustments. Conversion rights may only be
exercised (i) after five years from the date of issuance, February 14, 2005, of the Series A
non-voting convertible, redeemable preferred stock and only if the Company indicates its intention
to redeem or (ii) immediately prior to a merger, acquisition or sale of all or substantially all
of the Company and its subsidiaries’ assets.
Redemption rights. At any time after five years from the date of issuance, February 14,
2005, of the Series A non-voting convertible, redeemable preferred stock, the Company may redeem,
in whole or in part, the outstanding shares of Series A non-voting convertible, redeemable
preferred stock for $100,000 per share in cash or shares of common stock equal to 101 percent of
the liquidation preference on the redemption date. On the five and one-half year anniversary of the
date of issuance of the Series A non-voting convertible, redeemable preferred stock and on each
anniversary thereafter, each holder may require the Company to redeem their shares of Series A
non-voting convertible, redeemable preferred stock for $100,000 per share in cash equal to the
liquidation preference on the redemption date. At the Company’s option, shares of the Company’s
common stock having the fair market value of the redemption price — see “Liquidation preference”
above may be used to satisfy the redemption request. After 10 years from the date of issuance of
the Series A non-voting convertible, redeemable preferred stock, all of the outstanding shares of
Series A non-voting convertible, redeemable preferred stock must be redeemed for a price per share
in cash equal to the liquidation preference on the redemption date.
| 14. | Income Taxes |
Income before income taxes consisted of the following:
| Year ended December 31, | ||||||||||||||||
| 2009 | 2008 | 2007 | ||||||||||||||
United States |
$ | 228,841 | $ | 196,329 | $ | 163,133 | ||||||||||
Foreign |
(3,597 | ) | (564 | ) | 4 | |||||||||||
| $ | 225,244 | $ | 195,765 | $ | 163,137 | |||||||||||
| Income tax expense (benefit) from continuing operations consisted of the following for the years ended December 31: | ||||||||||||||||
| State | ||||||||||||||||
| United States | and Local | Foreign | Total | |||||||||||||
2009 |
||||||||||||||||
Current |
$ | 22,947 | $ | 2,911 | $ | 172 | $ | 26,030 | ||||||||
Deferred |
$ | 55,646 | $ | 3,973 | $ | (64 | ) | $ | 59,555 | |||||||
2008 |
||||||||||||||||
Current |
$ | 22,896 | $ | 3,245 | $ | 11 | $ | 26,152 | ||||||||
Deferred |
$ | 47,302 | $ | (5,231 | ) | $ | (98 | ) | $ | 41,973 | ||||||
2007 |
||||||||||||||||
Current |
$ | 15,076 | $ | 1,485 | $ | 1 | $ | 16,562 | ||||||||
Deferred |
$ | 13,470 | $ | 81,528 | $ | — | $ | 94,998 | ||||||||
63
Table of Contents
WRIGHT EXPRESS CORPORATION
NOTES TO CONSOLIDATED FINANCIAL STATEMENTS (continued)
NOTES TO CONSOLIDATED FINANCIAL STATEMENTS (continued)
(in thousands, except per share data)
The reconciliation between the income tax computed by applying the U.S. federal statutory
rate and the reported effective tax rate on income from continuing operations is as follows:
| Year ended December 31, | ||||||||||||
| 2009 | 2008 | 2007 | ||||||||||
Federal statutory rate |
35.0 | % | 35.0 | % | 35.0 | % | ||||||
State income taxes (net of federal income tax benefit) and foreign income tax |
3.4 | 1.9 | 1.4 | |||||||||
Revaluation of deferred tax assets for tax rate changes and blending differences, net |
(0.1 | ) | (2.7 | ) | 32.0 | |||||||
Dividend exclusion |
— | 0.1 | 0.1 | |||||||||
Other |
(0.3 | ) | 0.5 | (0.1 | ) | |||||||
Effective tax rate |
38.0 | % | 34.8 | % | 68.4 | % | ||||||
On June 7, 2007, the State of Maine enacted a law effective for tax years beginning on or
after January 1, 2007, which changed the State’s rules for apportioning income related to the
performance of services. The new law effectively reduced taxable income or loss allocable to the
State of Maine. This caused a reduction in the Company’s blended state income tax rate. The effect
of this lower state income tax rate on the temporary differences decreased the Company’s deferred
tax assets which resulted in a charge to the provision for income taxes for the twelve months ended
December 31, 2007, of $80,879.
The tax effects of temporary differences in the recognition of income and expense for tax and
financial reporting purposes that give rise to significant portions of the deferred tax assets and
the deferred tax liabilities are presented below:
| December 31, | ||||||||
| 2009 | 2008 | |||||||
Deferred assets related to: |
||||||||
Reserve for credit losses |
$ | 4,078 | $ | 6,927 | ||||
Stock-based compensation, net |
3,790 | 2,880 | ||||||
State net operating loss carry forwards |
973 | 1,041 | ||||||
Other assets |
2,394 | — | ||||||
Unrealized losses on interest rate swaps and available-for-sale securities, net |
89 | 1,035 | ||||||
Tax deductible intangibles, primarily goodwill, net |
183,632 | 260,367 | ||||||
| 194,956 | 272,250 | |||||||
Deferred tax liabilities related to: |
||||||||
Other assets |
— | 1,454 | ||||||
Property, equipment and capitalized software |
8,875 | 8,564 | ||||||
Derivatives |
2,259 | 22,117 | ||||||
| 11,134 | 32,135 | |||||||
Valuation allowance on state net operating loss carry forwards |
220 | 158 | ||||||
Deferred income taxes, net |
$ | 183,602 | $ | 239,957 | ||||
The deferred tax assets and deferred tax liabilities are included in deferred income
taxes, net on the consolidated balance sheet.
64
Table of Contents
WRIGHT EXPRESS CORPORATION
NOTES TO CONSOLIDATED FINANCIAL STATEMENTS (continued)
NOTES TO CONSOLIDATED FINANCIAL STATEMENTS (continued)
(in thousands, except per share data)
The Company had approximately $302,819 of state and $57 of foreign net operating loss carry
forwards at December 31, 2009 and approximately $289,920 of state and $385 of foreign net operating
loss carry forwards at December 31, 2008. These expire at various times through 2028. Valuation
allowances have been established for those state net operating losses that the Company believes it
is more likely than not that they will not be utilized within the carry forward period.
Deferred income taxes have not been provided for the undistributed (deficit) earnings of the
Company’s foreign subsidiaries, which aggregated to approximately $(4,266) at December 31, 2009,
and $(477) at December 31, 2008. The Company plans to reinvest any earnings for future expansion in
the respective foreign jurisdictions. A portion of the undistributed earnings will be subject to
U.S. taxation upon repatriation as dividends to the U.S. parent. The amount of taxes attributable
to these undistributed earnings is not practicably determinable.
In 2009 the Company (i) received additional information from Avis relative to basis
differences at the time of the initial public offering; and (ii) corrected an improperly recorded
basis difference. This resulted in adjustments to additional paid in capital, the majority of
which (approximately $6,500) were offset by credits to deferred taxes and taxes payable. In 2008
the Company also corrected an improperly recorded basis difference arising from the Avis
transaction. The credit to additional paid in capital was offset by a charge to deferred taxes.
The Company determined that, due to the immateriality of the corrections, revisions to the prior
year financial statements were not necessary.
15. Tax Receivable Agreement
As a consequence of the Company’s separation from its former parent company, the tax basis of
the Company’s net tangible and intangible assets increased (the “Tax Basis Increase”). The Tax
Basis Increase reduced the amount of tax that the Company would pay in the future to the extent the
Company generated taxable income in sufficient amounts. The Company was contractually obligated,
pursuant to its 2005 Tax Receivable Agreement with the Company’s former parent company (Cendant
Corporation), to remit 85 percent of any such cash savings. The estimated total payments owed to
Cendant Corporation based on facts available at that time, was reflected as a liability titled
“Amounts due under tax receivable agreement.”
The amount of these estimated future payments is dependent upon future statutory tax rates and
the Company’s ability to generate sufficient taxable income adequate to cover the tax depreciation,
amortization and interest expense associated with the Tax Basis Increase. The Company regularly
reviews its estimated blended tax rates and projections of future taxable earnings to determine
whether changes in the estimated liability are required. Any changes to the estimated future
payments due to changes to estimated blended tax rates are recorded in the income statement as
changes in amounts due under tax receivable agreement.
In both 2009 and 2008 there has been reassessment of the blended tax rates that are projected
into the future. In 2009 and 2008, the net future benefits increased, which increased the
associated liability to Wyndham Worldwide Corporation (“Wyndham”), resulting in a $599 and $9,014
charge to non-operating expense for the years ended December 31, 2009 and 2008, respectively.
Pursuant to the Separation and Distribution Agreement dated as of July 27, 2006, by and among
Cendant Corporation (now known as Avis Budget Group, Inc. or “Avis”), Realogy Corporation
(“Realogy”), Wyndham and Travelport Inc., Realogy acquired from Cendant the right to receive
62.5 percent of the payments by Wright Express to Cendant and Wyndham acquired from Cendant the
right to receive 37.5 percent of the payments by Wright Express to Cendant under the 2005 Tax
Receivable Agreement.
On June 26, 2009, the Company entered into a Tax Receivable Prepayment Agreement with Realogy,
pursuant to which the Company paid Realogy $51,000, including bank fees and legal expenses, as
prepayment in full to settle the remaining obligations to Realogy under the 2005 Tax Receivable
Agreement. These obligations were previously recorded at $187,485 and this transaction resulted in
a gain of $136,485 in the second quarter of 2009. In connection with the Tax Receivable Prepayment
Agreement with Realogy, the Company entered into a Ratification Agreement on June 26, 2009, (the
“Ratification Agreement”) with Avis, Realogy and Wyndham which amended the 2005 Tax Receivable
Agreement to require the Company to pay 31.875 (which is 85 percent of the original benefit of
37.5 percent) percent of the future tax savings related to the Tax Basis Increase to Wyndham.
16. Employee Benefit Plans
The Company sponsors a 401(k) retirement and savings plan. The Company’s employees who are at
least 18 years of age, have worked at least 1,000 hours in the past year, and have completed one
year of service are eligible to participate in this plan. The
65
Table of Contents
WRIGHT EXPRESS CORPORATION
NOTES TO CONSOLIDATED FINANCIAL STATEMENTS (continued)
NOTES TO CONSOLIDATED FINANCIAL STATEMENTS (continued)
(in thousands, except per share data)
Company matches 100 percent of each employee’s contributions up to a maximum of 6 percent of
each employee’s eligible compensation. All contributions vest immediately. Wright Express has the
right to discontinue this plan at any time. Contributions to the plan are voluntary. The Company
contributed $1,740 for the year ended December 31, 2009, $1,860 for the year ended December 31,
2008, and $1,652 for the year ended December 31, 2007.
The Company also sponsors a defined contribution plan for certain employees designated by the
Company. Participants may elect to defer receipt of designated percentages or amounts of their
compensation. The Company maintains a grantor’s trust to hold the assets under the Company’s
defined contribution plan. The obligation related to the defined contribution plan totaled $1,593
at December 31, 2009, and $1,401 at December 31, 2008. These amounts are included in other
liabilities on the consolidated balance sheet. The assets held in trust are designated as trading
securities and, as such, these trading securities are to be recorded at fair value with any changes
recorded currently to earnings. The aggregate market value of the securities with the trust was
$1,593 at December 31, 2009, and $1,401 at December 31, 2008. Such amounts are included in other
assets on the consolidated balance sheet.
17. Fair Value
The Company holds mortgage-backed and other asset-backed securities, fixed income and equity
securities, derivatives and certain other financial instruments which are carried at fair value.
The Company determines fair value based upon quoted prices when available or through the use of
alternative approaches, such as model pricing, when market quotes are not readily accessible or
available. The Company carries certain of its liabilities at fair value, including its derivative
liabilities. In determining the fair value of the Company’s obligations, various factors are
considered including: closing exchange or over-the-counter market price quotations; time value and
volatility factors underlying options and derivatives; price activity for equivalent instruments;
the Company’s own-credit standing; and counterparty credit risk.
These valuation techniques may be based upon observable and unobservable inputs. Observable
inputs reflect market data obtained from independent sources, while unobservable inputs reflect the
Company’s market assumptions. These two types of inputs create the following fair value hierarchy:
| • | Level 1 – Quoted prices for identical instruments in active markets. | ||
| • | Level 2 – Quoted prices for similar instruments in active markets; quoted prices for identical or similar instruments in markets that are not active; and model-derived valuations whose inputs are observable or whose significant value drivers are observable. | ||
| • | Level 3 – Instruments whose significant value drivers are unobservable. |
66
Table of Contents
WRIGHT EXPRESS CORPORATION
NOTES TO CONSOLIDATED FINANCIAL STATEMENTS (continued)
NOTES TO CONSOLIDATED FINANCIAL STATEMENTS (continued)
(in thousands, except per share data)
The following table presents the Company’s assets and liabilities that are measured at fair
value and the related hierarchy levels for 2009:
| Fair Value Measurements | ||||||||||||||||
| at Reporting Date Using | ||||||||||||||||
| Quoted Prices in | Significant Other | Significant | ||||||||||||||
| Active Markets for | Observable | Unobservable | ||||||||||||||
| December 31, | Identical Assets | Inputs | Inputs | |||||||||||||
| 2009 | (Level 1) | (Level 2) | (Level 3) | |||||||||||||
Assets: |
||||||||||||||||
Mortgage-backed securities |
$ | 2,886 | $ | — | $ | 2,886 | $ | — | ||||||||
Asset-backed securities |
3,133 | — | 3,133 | — | ||||||||||||
Municipal bonds |
365 | — | 365 | — | ||||||||||||
Equity securities |
4,212 | 4,212 | — | — | ||||||||||||
Total available-for-sale securities |
$ | 10,596 | $ | 4,212 | $ | 6,384 | $ | — | ||||||||
Executive deferred compensation plan trust (a) |
$ | 1,593 | $ | 1,593 | $ | — | $ | — | ||||||||
Fuel price
derivatives – diesel |
$ | 2,641 | $ | — | $ | — | $ | 2,641 | ||||||||
Fuel price
derivatives – unleaded fuel |
3,511 | — | 3,511 | — | ||||||||||||
Total fuel price derivatives |
$ | 6,152 | $ | — | $ | 3,511 | $ | 2,641 | ||||||||
Liabilities: |
||||||||||||||||
July 2009 interest rate swap arrangement with a |
||||||||||||||||
base rate of 1.35% and a notional amount of $50,000 |
278 | — | 278 | — | ||||||||||||
Total interest rate swap arrangements (b) |
$ | 278 | $ | — | $ | 278 | $ | — | ||||||||
| (a) | The fair value of these instruments is recorded in other assets. | |
| (b) | The fair value of these instruments is recorded in accrued expenses. |
The following table presents a reconciliation of the beginning and ending balances for
assets (liabilities) measured at fair value on a recurring basis using significant unobservable
inputs (Level 3) during the year ended December 31, 2009:
| Fuel Price | ||||
| Derivatives – Diesel |
||||
Beginning balance |
$ | 9,960 | ||
Total gains
or (losses) – realized/unrealized |
||||
Included in earnings (a) |
(7,319 | ) | ||
Included in other comprehensive income |
— | |||
Purchases, issuances and settlements |
— | |||
Transfers in/(out) of Level 3 |
— | |||
Ending balance |
$ | 2,641 | ||
| (a) | Gains and losses (realized and unrealized) included in earnings for the year ended December 31, 2009, are reported in net realized and unrealized losses on fuel price derivatives on the consolidated statements of income. |
67
Table of Contents
WRIGHT EXPRESS CORPORATION
NOTES TO CONSOLIDATED FINANCIAL STATEMENTS (continued)
NOTES TO CONSOLIDATED FINANCIAL STATEMENTS (continued)
(in thousands, except per share data)
The following table presents the Company’s assets and liabilities that are measured at
fair value and the related hierarchy levels for 2008:
| Fair Value Measurements | ||||||||||||||||
| at Reporting Date Using | ||||||||||||||||
| Quoted Prices | ||||||||||||||||
| in Active | Significant | Significant | ||||||||||||||
| Markets for | Other | Unobservable | ||||||||||||||
| December 31, | Identical Assets | Observable Inputs | Inputs | |||||||||||||
| 2008 | (Level 1) | (Level 2) | (Level 3) | |||||||||||||
Assets: |
||||||||||||||||
Mortgage-backed securities |
$ | 4,237 | $ | — | $ | 4,237 | $ | — | ||||||||
Asset-backed securities |
3,874 | — | 3,874 | — | ||||||||||||
Municipal bonds |
392 | — | 392 | — | ||||||||||||
Equity securities |
4,030 | 4,030 | — | — | ||||||||||||
Total available-for-sale securities |
$ | 12,533 | $ | 4,030 | $ | 8,503 | $ | — | ||||||||
Executive deferred compensation plan trust (a) |
$ | 1,401 | $ | 1,401 | $ | — | $ | — | ||||||||
Fuel price derivatives – diesel |
$ | 9,960 | $ | — | $ | — | $ | 9,960 | ||||||||
Fuel price derivatives – unleaded fuel |
39,334 | — | 39,334 | — | ||||||||||||
Total fuel price derivatives |
$ | 49,294 | $ | — | $ | 39,334 | $ | 9,960 | ||||||||
Liabilities: |
||||||||||||||||
July 2007 interest rate swap arrangements with a base
rate of 5.20% and an aggregate notional amount of $80,000 |
$ | 2,048 | $ | — | $ | 2,048 | $ | — | ||||||||
August 2007 interest rate swap arrangement with a
base rate of 4.73% and a notional amount of $25,000 |
694 | — | 694 | — | ||||||||||||
Total interest rate swap arrangements (b) |
$ | 2,742 | $ | — | $ | 2,742 | $ | — | ||||||||
| (a) | The fair value of these instruments is recorded in other assets. | |
| (b) | The fair value of these instruments is recorded in accrued expenses. |
The following table presents a reconciliation of the beginning and ending balances for
assets (liabilities) measured at fair value on a recurring basis using significant unobservable
inputs (Level 3) during the year ended December 31, 2008:
| Fuel Price Derivatives – |
||||
| Diesel | ||||
Beginning balance |
$ | (14,037 | ) | |
Total gains or (losses) – realized/unrealized |
||||
Included in earnings (a) |
23,997 | |||
Included in other comprehensive income |
— | |||
Purchases, issuances and settlements |
— | |||
Transfers in/(out) of Level 3 |
— | |||
Ending balance |
$ | 9,960 | ||
| (a) | Gains and losses (realized and unrealized) included in earnings for the year ended December 31, 2008, are reported in net realized and unrealized losses on fuel price derivatives on the consolidated statements of income. |
68
Table of Contents
WRIGHT EXPRESS CORPORATION
NOTES TO CONSOLIDATED FINANCIAL STATEMENTS (continued)
NOTES TO CONSOLIDATED FINANCIAL STATEMENTS (continued)
(in thousands, except per share data)
Available-for-sale securities and executive deferred compensation plan trust
When available, the Company uses quoted market prices to determine the fair value of
available-for-sale securities; such items are classified in Level 1 of the fair-value hierarchy.
These securities primarily consist of exchange-traded equity securities.
For mortgage-backed and asset-backed debt securities and bonds, the Company generally uses
quoted prices for recent trading activity of assets with similar characteristics to the debt
security or bond being valued. The securities and bonds priced using such methods are generally
classified as Level 2.
Fuel price derivatives and interest rate swap arrangements
The majority of derivatives entered into by the Company are executed over the counter and so
are valued using internal valuation techniques as no quoted market prices exist for such
instruments. The valuation technique and inputs depend on the type of derivative and the nature of
the underlying instrument. The principal technique used to value these instruments is a comparison
of the spot price of the underlying instrument to its related futures curve adjusted for the
Company’s assumptions of volatility and present value, where appropriate. The fair values of
derivative contracts reflect the expected cash the Company will pay or receive upon settlement of
the respective contracts.
The key inputs depend upon the type of derivative and the nature of the underlying instrument
and include interest rate yield curves, the spot price of the underlying instrument, volatility,
and correlation. The item is placed in either Level 2 or Level 3 depending on the observability of
the significant inputs to the model. Correlation and items with longer tenures are generally less
observable.
18. Commitments and Contingencies
Litigation
The Company is involved in pending litigation in the usual course of business. In the opinion
of management, such litigation will not have a material adverse effect on the Company’s
consolidated financial position, results of operations or cash flows.
Extension of Credit to Customers
The Company had commitments aggregating approximately $2,818,000 at December 31, 2009, and
$3,915,000 at December 31, 2008, related to payment processing services, primarily related to
commitments to extend credit to customers and customers of strategic relationships as part of
established lending product agreements. Many of these are not expected to be used; therefore, total
unused credit available to customers and customers of strategic relationships does not represent
future cash requirements. The Company can increase or decrease its customers’ credit lines at our
discretion at any time. These amounts are not recorded on the consolidated balance sheet.
Operating Leases
The Company leases office space, equipment, and vehicles under non-cancelable operating leases
that expire at various dates through 2019. Two of the Company’s office space lease agreements were
renewed during 2006 and another agreement was renewed in 2007. In addition, the Company rents
office equipment under agreements that may be canceled at any time. Rental expense related to
office space, equipment, and vehicle leases amounted to $3,420 for the year ended December 31,
2009, $3,569 for the year ended December 31, 2008, and $3,231 for the year ended December 31, 2007.
These amounts were included in occupancy and equipment on the consolidated statements of income.
The Company leases information technology hardware and software under agreements that may be
terminated by the Company at any time. Lease expense related to information technology hardware and
software leases totaled $2,627 for the year ended December 31, 2009, $2,625 for the year ended
December 31, 2008, and $2,475 for the year ended December 31, 2007. These amounts were included in
technology leasing and support on the consolidated statements of income.
69
Table of Contents
WRIGHT EXPRESS CORPORATION
NOTES TO CONSOLIDATED FINANCIAL STATEMENTS (continued)
NOTES TO CONSOLIDATED FINANCIAL STATEMENTS (continued)
(in thousands, except per share data)
Future minimum lease payments under non-cancelable operating leases are as follows:
| Payment | ||||
2010 |
4,094 | |||
2011 |
3,331 | |||
2012 |
2,694 | |||
2013 |
1,805 | |||
2014 |
1,754 | |||
2015 and thereafter |
6,158 | |||
Total |
$ | 19,836 | ||
19. Cash and Dividend Restrictions
Cash
Federal Reserve Board regulations may require reserve balances on certain deposits to be
maintained with the Federal Reserve Bank. No such reserves were required at December 31, 2009 or
2008.
Dividends
FSC is chartered under the laws of the State of Utah and the FDIC insures its deposits. Under
Utah law, FSC may only pay a dividend out of undivided profits after it has (i) provided for all
expenses, losses, interest and taxes accrued or due from FSC and (ii) transferred to a surplus fund
10 percent of its net profits before dividends for the period covered by the dividend, until the
surplus reaches 100 percent of its capital stock. For purposes of these Utah dividend limitations,
the FSC’s capital stock is $5,250 and its capital surplus exceeds 100 percent of capital stock.
Under FDIC regulations, FSC may not pay any dividend if, following the payment of the
dividend, FSC would be “undercapitalized,” as defined under the Federal Deposit Insurance Act and
applicable regulations.
FSC complied with the aforementioned dividend restrictions for the years ended December 31,
2009, 2008, and 2007.
20. Stock-Based Compensation
The Company’s 2005 Equity and Incentive Plan (the “Plan”), which is stockholder-approved,
permits the grant of share options, stock appreciation rights, restricted stock, restricted stock
units and other stock- or cash-based awards to non-employee directors, officers, employees,
advisors or consultants for up to 3,200 shares of common stock. The Company believes that such
awards increase efforts on behalf of the Company and promote the success of the Company’s business.
On December 31, 2009, the Company had four share-based compensation programs, which are described
below. The compensation cost that has been charged against income for these programs totals $5,736
for 2009, $5,216 for 2008 and $4,508 for 2007. The total income tax benefit recognized in the
income statement for share-based compensation arrangements was $2,180 for 2009, $1,815 for 2008 and
$3,081 for 2007.
Restricted Stock Units
The Company awards restricted stock units (“RSUs”) to non-employee directors and certain
employees periodically under the Plan. An RSU is a right granted to receive stock at the end of a
specified period. RSU awards generally vest evenly over a period of three or four years. The awards
provide for accelerated vesting if there is a change of control (as defined in the Plan). The fair
value of each RSU award is based on the closing market price of the Company’s stock one business
day prior to the grant date as reported by the New York Stock Exchange (“NYSE”).
70
Table of Contents
WRIGHT EXPRESS CORPORATION
NOTES TO CONSOLIDATED FINANCIAL STATEMENTS (continued)
NOTES TO CONSOLIDATED FINANCIAL STATEMENTS (continued)
(in thousands, except per share data)
A summary of the status of the Company’s RSUs as of December 31, 2009, and changes during the
year then ended is presented below:
| Weighted- | ||||||||
| Average | ||||||||
| Grant-Date | ||||||||
| Units | Fair Value | |||||||
Restricted Stock Units |
||||||||
Balance at January 1, 2009 |
358 | $ | 26.87 | |||||
Granted |
215 | $ | 15.25 | |||||
Vested – shares issued |
(141 | ) | $ | 23.52 | ||||
Vested – shares deferred (a) |
(3 | ) | $ | 32.01 | ||||
Forfeited |
(6 | ) | $ | 28.41 | ||||
Withheld for taxes (b) |
(70 | ) | $ | 22.86 | ||||
Balance at December 31, 2009 |
353 | $ | 21.31 | |||||
| (a) | The Company issued fully vested and non-forfeitable restricted stock units to certain non-employee directors and certain employees that are payable in shares of the Company’s common stock at a later date as specified by the award (deferred stock units or “DSUs”). | |
| (b) | The Company has elected to pay cash equal to the minimum amount required to be withheld for income tax purposes instead of issuing the shares of common stock. The cash is remitted to the appropriate taxing authority and the shares are never issued. |
As of December 31, 2009, there was $6,836 of total unrecognized compensation cost related
to nonvested share-based compensation arrangements granted as RSUs. That cost is expected to be
recognized over a weighted-average period of 1.4 years. The total fair value of shares vested was
$4,242 during 2009, $5,117 during 2008, and $7,931 during 2007.
Deferred Stock Units
Under the Plan, the Company also grants DSUs to non-employee directors and certain employees.
A DSU is a fully vested right to receive stock at a certain point in time in the future. DSUs do
not require any future service or performance obligations to be met. DSUs may be granted
immediately or may initially be granted as RSUs which become DSUs once a previously determined
service obligation has been met. The fair value of each granted DSU award is based on the closing
market price of the Company’s stock on the grant date as reported by the NYSE.
A summary of the status of the Company’s DSUs as of December 31, 2009, and changes during the
year ended December 31, 2009, is presented below:
| Weighted- | ||||||||
| Average | ||||||||
| Grant-Date | ||||||||
| Units | Fair Value | |||||||
Deferred Stock Units |
||||||||
Balance at January 1, 2009 |
80 | $ | 22.55 | |||||
Granted as DSUs |
7 | $ | 20.96 | |||||
Converted from RSUs |
3 | $ | 32.01 | |||||
Converted to common shares |
(15 | ) | $ | 21.36 | ||||
Withheld for taxes (a) |
(6 | ) | $ | 21.36 | ||||
Balance at December 31, 2009 |
69 | $ | 23.23 | |||||
| (a) | The Company has elected to pay cash equal to the minimum amount required to be withheld for income tax purposes instead of issuing the shares of common stock. The cash is remitted to the appropriate taxing authority and the shares are never issued. |
71
Table of Contents
WRIGHT EXPRESS CORPORATION
NOTES TO CONSOLIDATED FINANCIAL STATEMENTS (continued)
NOTES TO CONSOLIDATED FINANCIAL STATEMENTS (continued)
(in thousands, except per share data)
There is no unrecognized compensation cost related to awards granted as, or converted to,
DSUs. The Company has determined that the award was earned when granted and is expensed at that
time. The total fair value of shares granted and vested was $228 during 2009, $242 during 2008, and
$195 during 2007.
Performance Based Restricted Stock Units
The Company also awards performance based restricted stock units (“PBRSUs”) to employees
periodically under the Plan. A PBRSU is a right granted to receive stock at the end of a specified
period. In a PBRSU, the number of shares earned varies based upon meeting certain corporate-wide
performance goals, including revenue and earnings in excess of targets. PBRSU awards generally have
performance goals tracking a one to four year period, depending on the nature of the performance
goal. The fair value of each PBRSU award is based on the closing market price of the Company’s
stock one business day prior to the grant date as reported by the NYSE.
A summary of the status of certain of the Company’s PBRSUs at threshold and target performance
as of December 31, 2009, and changes during the year then ended is presented below:
| Weighted- | ||||||||||||
| Average | ||||||||||||
| Units at | Units at | Grant-Date | ||||||||||
| Threshold | Target | Fair Value | ||||||||||
Performance Based Restricted Stock Units |
45 | 91 | ||||||||||
Balance at January 1, 2009 |
— | |||||||||||
Granted |
— | |||||||||||
Vested |
— | |||||||||||
Forfeited |
(1 | ) | (3 | ) | ||||||||
Balance at December 31, 2009 |
44 | 88 | $ | 35.45 | ||||||||
Management determined that the performance conditions, which expire at December 31, 2010,
of this award are not probable of being met as of December 31, 2009. Accordingly, the Company has
not recognized any compensation cost related to the PBRSU award above. The range of unrecognized
compensation cost related to the award is from $1,554 at threshold, 50 percent below targeted
performance, to $3,110 at target, 100 percent of targeted performance, as of December 31, 2009,
depending whether certain performance conditions are met. No portion of this award had vested as of
December 31, 2009.
In addition to the PBRSUs discussed above, the Company issued approximately 11 units through
two separate awards with a value at targeted performance levels of $228 during 2008. The Company
recognized $209 as compensation cost related to these awards in 2009.
Stock Options
On February 22, 2005, the Company granted options to purchase the Company’s common stock to
certain employees as part of its IPO. Employee stock options granted by the Company had terms
ranging from one to seven years, were fully vested, with exercise prices ranging from $5.72 to
$14.98.
On February 13, 2009, and on March 5, 2009, the Company approved the grant of stock options,
to certain officers and employees under the Plan. Stock options granted generally become
exercisable over three years (with approximately 33 percent of the total grant vesting each year on
the anniversary of the grant date) and expire 8 years from the date of grant.
The fair value of each option award is estimated on the grant date using a
Black-Scholes-Merton option-pricing model that uses the assumptions noted in the following table.
The expected term of the options represents the period of time that options granted are expected to
be outstanding. Expected volatilities are
based on implied volatilities from traded options on the Company’s stock, historical volatility of
the Company’s stock, and other factors. The risk-free interest rate for the period matching the
expected term of the option is based on the U.S. Treasury yield curve in effect at the time of the
grant. The dividend yield is the calculated yield on the Company’s stock at the time of the grant.
72
Table of Contents
WRIGHT EXPRESS CORPORATION
NOTES TO CONSOLIDATED FINANCIAL STATEMENTS (continued)
NOTES TO CONSOLIDATED FINANCIAL STATEMENTS (continued)
(in thousands, except per share data)
The table below summarizes the assumptions used to calculate the fair value:
| February13, 2009 |
March 5, 2009 |
|||||||
Weighted average expected life (in years) |
4.75 | 5.00 | ||||||
Weighted average exercise price |
$ | 13.51 | $ | 13.60 | ||||
Weighted average volatility |
45.76 | % | 46.06 | % | ||||
Weighted average risk-free rate |
1.70 | % | 1.80 | % | ||||
Weighted average dividend yield |
0.00 | % | 0.00 | % | ||||
Weighted average fair value |
$ | 5.50 | $ | 5.72 | ||||
The activity of the stock option plan related to the Company’s employees consisted of:
| Weighted- | ||||||||||||||||
| Weighted- | Average Remaining |
|||||||||||||||
| Average | Contractual | Aggregate | ||||||||||||||
| Exercise | Term (in | Intrinsic | ||||||||||||||
| Shares | Price | years) | Value | |||||||||||||
Stock Options |
||||||||||||||||
Outstanding at January 1, 2009 |
87 | $ | 13.42 | |||||||||||||
Granted |
630 | $ | 13.57 | |||||||||||||
Exercised |
(44 | ) | $ | 9.92 | ||||||||||||
Forfeited or expired |
(7 | ) | $ | 13.53 | ||||||||||||
Outstanding and exercisable at December 31, 2009 |
666 | $ | 13.79 | 7.26 | $ | 12,037 | ||||||||||
No stock options were awarded by the Company during the years 2008 and 2007. The total
intrinsic value of options exercised during the years ended December 31, 2009 and 2008 was $728 and
$495 respectively.
21. Segment Information
Operating segments are defined as components of an enterprise about which separate financial
information is available that is evaluated regularly by the chief operating decision maker, in
deciding how to allocate resources and in assessing performance. The Company’s chief operating
decision maker is its Chief Executive Officer. The operating segments are reviewed separately
because each operating segment represents a strategic business unit that generally offers different
products and serves different markets.
The Company’s chief operating decision maker evaluates the operating results of the Company’s
reportable segments based upon revenues and “adjusted net income,” which is defined by the Company
as net income adjusted for fair value changes of derivative instruments, the amortization of
purchased intangibles, the net impact of tax rate changes on the Company’s deferred tax asset and
related changes in the tax-receivable agreement, non-cash asset impairment charges and the gains on
the extinguishment of a portion of the tax receivable agreement. These adjustments are reflected
net of the tax impact.
The Company operates in two reportable segments, Fleet and MasterCard. The Fleet segment
provides customers with payment and transaction processing services specifically designed for the
needs of vehicle fleet customers. This segment also provides information management services to
these fleet customers. The MasterCard segment provides customers with a payment processing solution
for their corporate purchasing and transaction monitoring needs. Revenue in this segment is derived
from two product lines – corporate charge cards and single use accounts. The MasterCard products
are used by businesses to facilitate purchases of products and utilize the Company’s information
management capabilities.
The accounting policies of the reportable segments are generally the same as those described
in the summary of significant accounting policies.
73
Table of Contents
WRIGHT EXPRESS CORPORATION
NOTES TO CONSOLIDATED FINANCIAL STATEMENTS (continued)
NOTES TO CONSOLIDATED FINANCIAL STATEMENTS (continued)
(in thousands, except per share data)
Financing interest expense and net realized and unrealized losses on derivative instruments
are not allocated to the MasterCard segment in the computation of segment results for internal
evaluation purposes. Total assets are not allocated to the segments.
The following table presents the Company’s reportable segment results for the years ended
December 31, 2009, 2008 and 2007:
| Operating | Depreciation | Provision | ||||||||||||||||||
| Total | Interest | and | Provision for | Adjusted Net | ||||||||||||||||
| Revenues | Expense | Amortization | Income Taxes | Income | ||||||||||||||||
Year ended December 31, 2009 |
||||||||||||||||||||
Fleet |
$ | 281,017 | $ | 11,723 | $ | 16,655 | $ | 47,615 | $ | 77,194 | ||||||||||
MasterCard |
37,207 | 1,551 | 210 | 5,149 | 8,422 | |||||||||||||||
Total |
$ | 318,224 | $ | 13,274 | $ | 16,865 | $ | 52,764 | $ | 85,616 | ||||||||||
Year ended December 31, 2008 |
||||||||||||||||||||
Fleet |
$ | 366,610 | $ | 32,148 | $ | 19,483 | $ | 34,900 | $ | 69,993 | ||||||||||
MasterCard |
26,972 | 2,845 | 640 | 2,217 | 4,155 | |||||||||||||||
Total |
$ | 393,582 | $ | 34,993 | $ | 20,123 | $ | 37,117 | $ | 74,148 | ||||||||||
Year ended December 31, 2007 |
||||||||||||||||||||
Fleet |
$ | 313,618 | $ | 31,490 | $ | 14,299 | $ | 123,240 | $ | 72,357 | ||||||||||
MasterCard |
22,510 | 2,596 | 719 | 2,050 | 3,653 | |||||||||||||||
Total |
$ | 336,128 | $ | 34,086 | $ | 15,018 | $ | 125,290 | $ | 76,010 | ||||||||||
The following table reconciles adjusted net income to net income:
| Year ended December 31, | ||||||||||||
| 2009 | 2008 | 2007 | ||||||||||
Adjusted net income |
$ | 85,616 | $ | 74,148 | $ | 76,010 | ||||||
Unrealized gains (losses) on derivative instruments |
(43,142 | ) | 90,892 | (37,074 | ) | |||||||
Amortization of acquired intangible assets |
(5,066 | ) | (4,854 | ) | (1,089 | ) | ||||||
Asset impairment charge |
(814 | ) | (1,538 | ) | — | |||||||
Non-cash adjustments related to tax receivable agreement |
(599 | ) | — | — | ||||||||
Gain on extinguishment of liability |
136,485 | — | — | |||||||||
Tax impact |
(32,821 | ) | (31,008 | ) | 13,730 | |||||||
Net income |
$ | 139,659 | $ | 127,640 | $ | 51,577 | ||||||
The tax impact of the foregoing adjustments is the difference between the Company’s GAAP
tax provision and a pro forma tax provision based upon the Company’s adjusted net income before
taxes. The methodology utilized for calculating the Company’s adjusted net income tax provision is
the same methodology utilized in calculating the Company’s GAAP tax provision.
74
Table of Contents
WRIGHT EXPRESS CORPORATION
NOTES TO CONSOLIDATED FINANCIAL STATEMENTS (concluded)
NOTES TO CONSOLIDATED FINANCIAL STATEMENTS (concluded)
(in thousands, except per share data)
Geographic Data
| Year ended December 31, | ||||||||||||
| 2009 | 2008 | 2007 | ||||||||||
Total revenues: |
||||||||||||
United States |
$ | 314,808 | $ | 393,137 | $ | 336,123 | ||||||
International |
3,416 | 445 | 5 | |||||||||
Total revenues |
$ | 318,224 | $ | 393,582 | $ | 336,128 | ||||||
22.
Subsequent Event
On February 22, 2010, we purchased put option contracts and sold call option contracts,
designed to be a costless collar, on the price of gasoline and diesel fuel (collectively the
“Options”). The Options have an aggregate notional amount
of approximately 9,657 gallons of
gasoline and diesel fuel and will expire on a monthly basis during the first, second and third
quarters of 2011. The settlement of the Options is based upon the U.S. Department of Energy’s
weekly retail on-highway national US average diesel price and the New York Mercantile Exchange
nearby unleaded gasoline contracts for the month. The Options lock in a weighted average floor
price of approximately $2.86 per gallon and a weighted average ceiling price of approximately $2.92
per gallon.
23. Quarterly Financial Results (Unaudited)
Summarized quarterly results for the two years ended December 31, 2009 and 2008, are as
follows:
| Three months ended | ||||||||||||||||
| March 31 | June 30 | September 30 | December 31 | |||||||||||||
2009 |
||||||||||||||||
Total revenues |
$ | 69,176 | $ | 78,626 | $ | 86,642 | $ | 83,780 | ||||||||
Operating income |
$ | 19,324 | $ | 32,372 | $ | 36,346 | $ | 30,108 | ||||||||
Net income (loss) |
$ | 10,977 | $ | 93,190 | $ | 23,363 | $ | 12,129 | ||||||||
Earnings (loss) per share: |
||||||||||||||||
Basic |
$ | 0.29 | $ | 2.43 | $ | 0.61 | $ | 0.32 | ||||||||
Diluted |
$ | 0.28 | $ | 2.36 | $ | 0.60 | $ | 0.31 | ||||||||
2008 |
||||||||||||||||
Total revenues |
$ | 92,946 | $ | 111,238 | $ | 108,531 | $ | 80,867 | ||||||||
Operating income |
$ | 37,068 | $ | 50,948 | $ | 54,402 | $ | 19,014 | ||||||||
Net income |
$ | 14,528 | $ | (24,383 | ) | $ | 72,344 | $ | 65,151 | |||||||
Earnings per share: |
||||||||||||||||
Basic |
$ | 0.37 | $ | (0.63 | ) | $ | 1.86 | $ | 1.69 | |||||||
Diluted |
$ | 0.36 | $ | (0.63 | ) | $ | 1.82 | $ | 1.66 | |||||||
75
Table of Contents
| ITEM 9. | CHANGES IN AND DISAGREEMENTS WITH ACCOUNTANTS ON ACCOUNTING AND FINANCIAL DISCLOSURE |
Not applicable.
| ITEM 9A. | CONTROLS AND PROCEDURES |
Evaluation of Disclosure Controls and Procedures
The principal executive officer and principal financial officer of Wright Express Corporation
evaluated the effectiveness of the Company’s disclosure controls and procedures as of the end of
the period covered by this report. “Disclosure controls and procedures” are controls and other
procedures of a company that are designed to ensure that information required to be disclosed by
the company in the reports that it files or submits under the Securities Exchange Act of 1934,
within the time periods specified in the SEC’s rules and forms, is recorded, processed, summarized
and reported, and is accumulated and communicated to the company’s management, including its
principal executive officer and principal financial officer, as appropriate to allow timely
decisions regarding required disclosure. Based on their evaluation, the principal executive officer
and principal financial officer of Wright Express Corporation concluded that the Company’s
disclosure controls and procedures were effective as of December 31, 2009.
Management’s Annual Report on Internal Control Over Financial Reporting
Wright Express’ management is responsible for establishing and maintaining adequate internal
control over financial reporting. Internal control over financial reporting is a process designed
to provide reasonable assurance regarding the reliability of financial reporting and the
preparation of financial statements for external purposes in accordance with accounting principles
generally accepted in the United States of America. Under the supervision and with the
participation of management, including the principal executive officer and principal financial
officer, an evaluation was conducted of the effectiveness of the internal control over financial
reporting based on the framework in Internal Control – Integrated Framework issued by The Committee
of Sponsoring Organizations of the Treadway Commission. Based on our evaluation under the framework
in Internal Control – Integrated Framework, management concluded that Wright Express’ internal
control over financial reporting was effective as of December 31, 2009.
The effectiveness of our internal control over financial reporting as of December 31, 2009,
has been audited by Deloitte & Touche LLP, an independent registered public accounting firm, as
stated in their report which is included herein.
Changes in Internal Control Over Financial Reporting
There were no changes in our internal control over financial reporting that occurred during
the fiscal quarter ended December 31, 2009, that have materially affected, or are reasonably likely
to materially affect, the Company’s internal control over financial reporting.
| ITEM 9B. | OTHER INFORMATION |
Not applicable.
76
Table of Contents
PART III
| ITEM 10. | DIRECTORS, EXECUTIVE OFFICERS AND CORPORATE GOVERNANCE |
See the information in the Company’s proxy statement for the 2010 Annual Meeting of
Stockholders captioned “Members of the Board of Directors,” “Non-Director Members of the Executive
Management Team,” “Section 16(a) Beneficial Ownership Reporting Compliance,” “Director
Nominations,” “Communications with the Board of Directors,” “Board and Committee Meetings” and
“Corporate Governance Information,” which information is incorporated herein by reference.
Website Availability of Corporate Governance and Other Documents
The following documents are available on the Corporate Governance page of the investor
relations section of the Company’s website, www.wrightexpress.com: (1) the Code of Business
Conduct and Ethics for Directors, (2) the Code of Ethics for Chief Executive and Senior Financial
Officers, (3) the Company’s Corporate Governance Guidelines and (4) key Board Committee charters,
including charters for the Audit, Corporate Governance and Compensation Committees. Stockholders
also may obtain printed copies of these documents by submitting a written request to Investor
Relations, Wright Express, 97 Darling Avenue, South Portland, Maine 04106. The Company intends to
post on its website, www.wrightexpress.com, all disclosures that are required by law or New York
Stock Exchange listing standards concerning any amendments to, or waivers from, the provisions of
the documents referenced in (1) and (2) above.
| ITEM 11. | EXECUTIVE COMPENSATION |
See the information in the Company’s proxy statement for the 2010 Annual Meeting of
Stockholders captioned “Executive Compensation” and the related subsections, “Director
Compensation” and “Compensation Committee Interlocks and Insider Participation,” which information
is incorporated herein by reference.
| ITEM 12. | SECURITY OWNERSHIP OF CERTAIN BENEFICIAL OWNERS AND MANAGEMENT AND RELATED STOCKHOLDER MATTERS |
See the information in the Company’s proxy statement for the 2010 Annual Meeting of
Stockholders captioned “Securities Authorized for Issuance Under Equity Compensation Plans” and
“Principal Stockholders” and the related subsections, which information is incorporated herein by
reference.
| ITEM 13. | CERTAIN RELATIONSHIPS AND RELATED TRANSACTIONS, AND DIRECTOR INDEPENDENCE |
See the information in the Company’s proxy statement for the 2010 Annual Meeting of
Stockholders captioned “Director Independence” and “Certain Relationships and Related
Transactions,” which information is incorporated herein by reference.
| ITEM 14. | PRINCIPAL ACCOUNTING FEES AND SERVICES |
See the section of the Company’s proxy statement for the 2010 Annual Meeting of Stockholders
captioned “Auditor Selection and Fees,” which information is incorporated herein by reference.
77
Table of Contents
PART IV
| ITEM 15. | EXHIBITS AND FINANCIAL STATEMENT SCHEDULES |
The following documents are filed as part of this report:
1. Financial Statements (see Index to Financial Statements on page 39).
| Exhibit No. | Description | ||||
| 3.1 | Certificate of Incorporation (incorporated by reference to Exhibit No. 3.1 to our Current Report on Form 8-K
filed with the SEC on March 1, 2005, File No. 001-32426). |
||||
| 3.2 | Amended and Restated By-Laws (incorporated by reference to Exhibit No. 3.1 to our Current Report on Form 8-K
filed with the SEC on November 20, 2008, File No. 001-32426). |
||||
| 4.1 | Rights Agreement dated as of February 16, 2005, by and between Wright Express Corporation and Wachovia Bank,
National Association (incorporated by reference to Exhibit No. 4.1 to our Current Report on Form 8-K filed
with the SEC on March 1, 2005, File No. 001-32426). |
||||
| 10.1 | Form of director indemnification agreement (incorporated by reference to Exhibit No. 10.1 to our Current
Report on Form 8-K filed with the SEC on June 8, 2009, File No. 001-32426). |
||||
| 10.2 | Tax Receivable Agreement, dated as of February 22, 2005, by and between Cendant Corporation and Wright Express
Corporation (incorporated by reference to Exhibit No. 10.3 to our Current Report on Form 8-K filed with the
SEC on March 1, 2005, File No. 001-32426). |
||||
| 10.3 | Tax Receivable Prepayment Agreement dated June 26, 2009 by and between Wright Express Corporation and Realogy
Corporation (incorporated by reference to Exhibit No. 10.1 to our Current Report on Form 8-K filed with the
SEC on July 7, 2009, File No. 001-32426). |
||||
| 10.4 | Ratification Agreement dated June 26, 2009 by and among Wright Express Corporation, Realogy Corporation,
Wyndham Worldwide Corporation and Avis Budget Group, Inc. (incorporated by reference to Exhibit No. 10.1 to
our Current Report on Form 8-K filed with the SEC on July 7, 2009, File No. 001-32426). |
||||
| 10.5 | Guarantee, dated as of June 26, 2009, by Apollo Investment Fund VI, L.P., Apollo Overseas Partners VI, L.P.,
Apollo Overseas Partners (Delaware) VI, L.P., Apollo Overseas Partners (Delaware892) VI, L.P. and Apollo
Overseas Partners (Germany) VI, L.P. in favor of Wright Express Corporation (incorporated by reference to
Exhibit No. 10.1 to our Quarterly Report on Form 10-Q filed with the SEC on May 7, 2009, File No. 001-324426)
(incorporated by reference to Exhibit No. 10.3 to our Quarterly Report on Form 10-Q filed with the SEC on
July 30, 2009, File No. 001-324426). |
||||
| 10.6 | Credit Agreement, dated as of May 22, 2007, among Wright Express Corporation, as borrower, Bank of America,
N.A., as administrative agent, swing line lender and L/C issuer, Banc of America Securities LLC and SunTrust
Robinson Humphrey, a division of SunTrust Capital Markets, Inc., as joint lead arrangers and joint book
managers, SunTrust Bank, Inc., as syndication agent, BMO Capital Markets, KeyBank National Association, and TD
Banknorth, N.A., as co-documentation agents, and the other lenders party thereto (incorporated by reference to
Exhibit No. 10.1 to our Current Report on Form 8-K filed with the SEC on May 29, 2007, File No. 001-32426). |
||||
| 10.7 | Guaranty, dated as of May 22, 2007, by and among Wright Express Corporation, the subsidiary guarantors party
thereto, and Bank of America, N.A., as administrative agent for the lenders party to the Credit Agreement
(incorporated by reference to Exhibit No. 10.2 to our Current Report on Form 8-K filed with the SEC on May 29,
2007, File No. 001-32426). |
||||
| 10.8 | Incremental Amendment Agreement among Wright Express Corporation, as borrower; Bank of America, N.A., as
administrative agent, swing line lender and L/C issuer; Banc of America Securities LLC; SunTrust Robinson
Humphrey, a division of SunTrust Capital Markets, Inc., as joint lead arrangers and joint book managers;
SunTrust Bank, Inc., as syndication agent; and with other lenders (incorporated by reference to Exhibit No.
10.1 to our Current Report on Form 8-K filed with the SEC on June 3, 2008, File No. 001-32426). |
||||
| 10.9 | Amendment to Credit Agreement, dated as of June 26, 2009, among Wright Express Corporation, as borrower, each
lender from time to time party thereto and Bank of America, N.A., as Administrative Agent, Swing Line Lender
and L/C Issuer (incorporated by reference to Exhibit No. 10.4 to our Quarterly Report on Form 10-Q filed with
the SEC on July 30, 2009, File No. 001-324426). |
||||
| † 10.10 | Amended and Restated Wright Express Corporation 2005 Equity and Incentive Plan (incorporated by reference to
Exhibit No. 10.1 to our Current Report on Form 8-K filed with the SEC on January 7, 2009, File No. 001-32426). |
||||
| † 10.11 | Wright Express Corporation Employee Stock Purchase Plan (incorporated by reference to Exhibit No. 10.7 to our
Registration Statement on Form S-1 filed with the SEC on February 10, 2005, File No. 333-120679). |
||||
78
Table of Contents
| † 10.12 | Wright Express Corporation Amended and Restated Non-Employee Directors Deferred Compensation Plan
(incorporated by reference to Exhibit No. 10.2 to our Current Report on Form 8-K filed with the SEC on
January 7, 2009, File No. 001-32426). |
||||
| † 10.13 | Amended and Restated Wright Express Corporation Executive Deferred Compensation Plan (incorporated by
reference to Exhibit No. 10.3 to our Current Report on Form 8-K filed with the SEC on January 7, 2009, File
No. 001-32426). |
||||
| † 10.14 | Amended and Restated Wright Express Corporation Short Term Incentive Program (incorporated by reference to
Exhibit No. 10.1 to our Quarterly Report on Form 10-Q filed with the SEC on May 7, 2009, File No.
001-324426).** |
||||
| † 10.15 | Wright Express Corporation Long Term Incentive Program (incorporated by reference to Exhibit No. 10.5 to our
Quarterly Report on Form 10-Q filed with the SEC on May 7, 2009, File No. 001-32426).** |
||||
| † 10.16 | Amended and Restated Wright Express Corporation Severance Pay Plan for Officers (incorporated by reference to
Exhibit No. 10.4 to our Current Report on Form 8-K filed with the SEC on January 7, 2009, File No. 001-32426). |
||||
| † 10.17 | Employment Agreement with Michael E. Dubyak (incorporated by reference to Exhibit No. 10.5 to our Current
Report on Form 8-K filed with the SEC on January 7, 2009, File No. 001-32426). |
||||
| † 10.18 | Form of Employment Agreement for David Maxsimic and Melissa Smith (incorporated by reference to Exhibit No.
10.6 to our Current Report on Form 8-K filed with the SEC on January 7, 2009, File No. 001-32426). |
||||
| † 10.19 | Form of Employment Agreement for Robert Cornett, Hilary Rapkin and Jamie Morin (incorporated by reference to
Exhibit No. 10.7 to our Current Report on Form 8-K filed with the SEC on January 7, 2009, File No. 001-32426). |
||||
| †* 10.20 | Form of Employment Agreement for George Hogan and Richard Stecklair. |
||||
| † 10.21 | Form of Long Term Incentive Program Award Agreement (incorporated by reference to Exhibit No. 10.1 to our
Current Report on Form 8-K filed with the SEC on April 6, 2006, File No. 001-32426). |
||||
| † 10.22 | Form of Non-Employee Director Long Term Incentive Program Award Agreement (for grants received prior to
December 31, 2006) (incorporated by reference to Exhibit 10.3 to our Quarterly Report on Form 10-Q filed with
the SEC on August 5, 2008, File No. 001-32426). |
||||
| † 10.23 | Form of Non-Employee Director Long Term Incentive Program Award Agreement (for grants received subsequent to
December 31, 2006) (incorporated by reference to Exhibit 10.3 to our Quarterly Report on Form 10-Q filed with
the SEC on August 5, 2008, File No. 001-32426). |
||||
| 10.24 | ISDA Master Agreement and Schedule between CITIBANK, National Association and Wright Express Corporation,
dated as of April 20, 2005 (incorporated by reference to Exhibit No. 10.1 to our Current Report on Form 8-K
filed with the SEC on April 27, 2005, File No. 001-32426). |
||||
| 10.25 | Confirmation of transaction between CITIBANK, National Association and Wright Express Corporation, dated
April 21, 2005 (incorporated by reference to Exhibit No. 10.2 to our Current Report on Form 8-K filed with the
SEC on April 27, 2005, File No. 001-32426). |
||||
| 10.26 | ISDA Master Agreement between Fleet National Bank and Wright Express Corporation, dated as of April 20, 2005
(incorporated by reference to Exhibit No. 10.3 to our Current Report on Form 8-K filed with the SEC on
April 27, 2005, File No. 001-32426). |
||||
| 10.27 | ISDA Schedule to the Master Agreement between Fleet National Bank and Wright Express Corporation, dated as of
April 20, 2005 (incorporated by reference to Exhibit No. 10.4 to our Current Report on Form 8-K filed with the
SEC on April 27, 2005, File No. 001-32426). |
||||
| 10.28 | Confirmation of transaction between Fleet National Bank and Wright Express Corporation, dated April 21, 2005
(incorporated by reference to Exhibit No. 10.5 to our Current Report on Form 8-K filed with the SEC on
April 27, 2005, File No. 001-32426). |
||||
| 10.29 | Form of confirmation evidencing purchases of Nymex Unleaded Regular Gasoline put options and call options by
Wright Express Corporation from J. Aron & Company (incorporated by reference to Exhibit 10.18 to our Quarterly
Report on Form 10-Q filed with the SEC on October 28, 2005, File No. 001-32426). |
||||
| 10.30 | Form of confirmation evidencing purchases of Nymex Diesel put options and call options by Wright Express
Corporation from J. Aron & Company (incorporated by reference to Exhibit 10.19 to our Quarterly Report on Form
10-Q filed with the SEC on October 28, 2005, File No. 001-32426). |
||||
| 10.31 | ISDA Credit Support Annex to the Schedule Master Agreement between Bank of America, N.A. (successor to Fleet
National Bank) and Wright Express Corporation, dated as of August 28, 2006 (incorporated by reference to
Exhibit 10.1 to our Quarterly Report on Form 10-Q filed with the SEC on November 20, 2006, File No.
001-32426). |
79
Table of Contents
| 10.32 | Amendment to the ISDA Master Agreement between Bank of America, N.A. (successor to Fleet National Bank) and
Wright Express Corporation, dated as of August 28, 2006 (incorporated by reference to Exhibit 10.2 to our
Quarterly Report on Form 10-Q filed with the SEC on November 20, 2006, File No. 001-32426). |
||||||
| 10.33 | Form of confirmation evidencing purchases and sales of Diesel put options and call options by Wright Express
Corporation from Bank of America, N.A. (incorporated by reference to Exhibit 10.2 to our Quarterly Report on
Form 10-Q filed with the SEC on August 7, 2007, File No. 001-32426). |
||||||
| 10.34 | Form of confirmation evidencing purchases and sales of Nymex Unleaded Regular Gasoline put options and call
options by Wright Express Corporation from Bank of America, N.A. (incorporated by reference to Exhibit 10.1 to
our Quarterly Report on Form 10-Q filed with the SEC on August 7, 2007, File No. 001-32426). |
||||||
| * 10.35 | Novation Agreement and New ISDA Agreement, dated as of October 23, 2009, among Wright Express Corporation,
Bank of America, N.A., and Merrill Lynch Commodities, Inc. |
||||||
| 10.36 | ISDA Master Agreement and Schedule between Bank of Tokyo-Mitsubishi UFJ, Ltd., New York Branch and Wright
Express Corporation, dated as of June 14, 2007 (incorporated by reference to Exhibit 10.3 to our Quarterly
Report on Form 10-Q filed with the SEC on November 7, 2007, File No. 001-32426). |
||||||
| 10.37 | Confirmation of transaction between Bank of Tokyo-Mitsubishi UFJ, Ltd., New York Branch and Wright Express
Corporation, dated as of July 18, 2007 (incorporated by reference to Exhibit 10.4 to our Quarterly Report on
Form 10-Q filed with the SEC on November 7, 2007, File No. 001-32426). |
||||||
| 10.38 | ISDA Master Agreement and Schedule between SunTrust Bank and Wright Express Corporation, dated as of April 5,
2005 (incorporated by reference to Exhibit 10.5 to our Quarterly Report on Form 10-Q filed with the SEC on
November 7, 2007, File No. 001-32426). |
||||||
| 10.39 | Confirmation of transaction between SunTrust Bank and Wright Express Corporation, dated as of July 18, 2007
(incorporated by reference to Exhibit 10.6 to our Quarterly Report on Form 10-Q filed with the SEC on
November 7, 2007, File No. 001-32426). |
||||||
| 10.40 | Confirmation of transaction between SunTrust Bank and Wright Express Corporation, dated as of July 22, 2009
(incorporated by reference to Exhibit No. 10.1 to our Current Report on Form 8-K filed with the SEC on July
24, 2009, File No. 001-32426). |
||||||
| 10.41 | ISDA Master Agreement and Schedule between KeyBank National Association and Wright Express Corporation, dated
as of June 15, 2007 (incorporated by reference to Exhibit 10.7 to our Quarterly Report on Form 10-Q filed with
the SEC on November 7, 2007, File No. 001-32426). |
||||||
| 10.42 | Confirmation of transaction between KeyBank National Association and Wright Express Corporation, dated as of
August 22, 2007 (incorporated by reference to Exhibit 10.8 to our Quarterly Report on Form 10-Q filed with the
SEC on November 7, 2007, File No. 001-32426). |
||||||
| 10.43 | ISDA Master Agreement and Schedule between Wachovia Bank, National Association and Wright Express Corporation,
dated as of July 18, 2007 (incorporated by reference to Exhibit No. 10.1 to our Quarterly Report on Form 10-Q
filed with the SEC on May 8, 2008, File No. 001-32426). |
||||||
| 10.44 | Form of confirmation evidencing purchases of Nymex Unleaded Regular Gasoline put options and call options by
Wright Express Corporation from Wachovia Bank, National Association (incorporated by reference to Exhibit No.
10.2 to our Quarterly Report on Form 10-Q filed with the SEC on May 8, 2008, File No. 001-32426). |
||||||
| * 21.1 | Subsidiaries of the registrant. |
||||||
| * 23.1 | Consent of Independent Registered Accounting Firm – Deloitte & Touche LLP. |
||||||
| * 31.1 | Certification of Chief Executive Officer of Wright Express Corporation pursuant to Rule 13a-14(a) promulgated
under the Securities Exchange Act of 1934, as amended. |
||||||
| * 31.2 | Certification of Chief Financial Officer of Wright Express Corporation pursuant to Rule 13a-14(a) promulgated
under the Securities Exchange Act of 1934, as amended. |
||||||
| * 32.1 | Certification of Chief Executive Officer of Wright Express Corporation pursuant to Rule 13a-14(b) promulgated
under the Securities Exchange Act of 1934, as amended, and Section 1350 of Chapter 63 of Title 18 of the
United States Code. |
||||||
| * 32.2 | Certification of Chief Financial Officer of Wright Express Corporation pursuant to Rule 13a-14(b) promulgated
under the Securities Exchange Act of 1934, as amended, and Section 1350 of Chapter 63 of Title 18 of the
United States Code. |
||||||
| * | Filed with this report. |
||||||
| ** | Portions of exhibit have been omitted pursuant to a request for confidential treatment, which has been granted. |
||||||
| † | Denotes a management contract or compensatory plan or arrangement required to be filed as an exhibit pursuant
to Item 15(b) of this Form 10-K. |
||||||
80
Table of Contents
SIGNATURES
Pursuant to the requirements of Section 13 or 15(d) of the Securities Exchange Act of 1934, the
Registrant has duly caused this report to be signed on its behalf by the undersigned, thereunto
duly authorized.
| WRIGHT EXPRESS CORPORATION |
||||
| February 25, 2010 | By: | /s/ Melissa D. Smith | ||
| Melissa D. Smith | ||||
| CFO and Executive Vice President, Finance
and Operations (principal financial and accounting officer) |
||||
81
Table of Contents
Pursuant to the requirements of the Securities Exchange Act of 1934, this Report has been signed
below by the following persons on behalf of the Registrant and in the capacities and on the dates
indicated.
| February 25, 2010 | /s/ Michael E. Dubyak | |||
| Michael E. Dubyak | ||||
| President, Chief Executive Officer and Chairman of the Board of Directors (principal executive officer) |
||||
| February 25, 2010 | /s/ Rowland T. Moriarty | |||
| Rowland T. Moriarty | ||||
| Lead Director | ||||
| February 25, 2010 | /s/ Shikhar Ghosh | |||
| Shikhar Ghosh | ||||
| Director | ||||
| February 25, 2010 | /s/ Ronald T. Maheu | |||
| Ronald T. Maheu | ||||
| Director | ||||
| February 24, 2010 | /s/ George L. McTavish | |||
| George L. McTavish | ||||
| Director | ||||
| February 25, 2010 | /s/ Kirk Pond | |||
| Kirk Pond | ||||
| Director | ||||
| February 25, 2010 | /s/ Regina O. Sommer | |||
| Regina O. Sommer | ||||
| Director | ||||
| February 25, 2010 | /s/ Jack A. VanWoerkom | |||
| Jack A. VanWoerkom | ||||
| Director | ||||
82
Table of Contents
EXHIBIT INDEX
| Exhibit No. | Description | ||||
| 3.1 | Certificate of Incorporation (incorporated by reference to Exhibit No. 3.1 to our Current Report on Form 8-K
filed with the SEC on March 1, 2005, File No. 001-32426). |
||||
| 3.2 | Amended and Restated By-Laws (incorporated by reference to Exhibit No. 3.1 to our Current Report on Form 8-K
filed with the SEC on November 20, 2008, File No. 001-32426). |
||||
| 4.1 | Rights Agreement dated as of February 16, 2005, by and between Wright Express Corporation and Wachovia Bank,
National Association (incorporated by reference to Exhibit No. 4.1 to our Current Report on Form 8-K filed
with the SEC on March 1, 2005, File No. 001-32426). |
||||
| 10.1 | Form of director indemnification agreement (incorporated by reference to Exhibit No. 10.1 to our Current
Report on Form 8-K filed with the SEC on June 8, 2009, File No. 001-32426). |
||||
| 10.2 | Tax Receivable Agreement, dated as of February 22, 2005, by and between Cendant Corporation and Wright Express
Corporation (incorporated by reference to Exhibit No. 10.3 to our Current Report on Form 8-K filed with the
SEC on March 1, 2005, File No. 001-32426). |
||||
| 10.3 | Tax Receivable Prepayment Agreement dated June 26, 2009 by and between Wright Express Corporation and Realogy
Corporation (incorporated by reference to Exhibit No. 10.1 to our Current Report on Form 8-K filed with the
SEC on July 7, 2009, File No. 001-32426). |
||||
| 10.4 | Ratification Agreement dated June 26, 2009 by and among Wright Express Corporation, Realogy Corporation,
Wyndham Worldwide Corporation and Avis Budget Group, Inc. (incorporated by reference to Exhibit No. 10.1 to
our Current Report on Form 8-K filed with the SEC on July 7, 2009, File No. 001-32426). |
||||
| 10.5 | Guarantee, dated as of June 26, 2009, by Apollo Investment Fund VI, L.P., Apollo Overseas Partners VI, L.P.,
Apollo Overseas Partners (Delaware) VI, L.P., Apollo Overseas Partners (Delaware892) VI, L.P. and Apollo
Overseas Partners (Germany) VI, L.P. in favor of Wright Express Corporation (incorporated by reference to
Exhibit No. 10.1 to our Quarterly Report on Form 10-Q filed with the SEC on May 7, 2009, File No. 001-324426)
(incorporated by reference to Exhibit No. 10.3 to our Quarterly Report on Form 10-Q filed with the SEC on
July 30, 2009, File No. 001-324426). |
||||
| 10.6 | Credit Agreement, dated as of May 22, 2007, among Wright Express Corporation, as borrower, Bank of America,
N.A., as administrative agent, swing line lender and L/C issuer, Banc of America Securities LLC and SunTrust
Robinson Humphrey, a division of SunTrust Capital Markets, Inc., as joint lead arrangers and joint book
managers, SunTrust Bank, Inc., as syndication agent, BMO Capital Markets, KeyBank National Association, and TD
Banknorth, N.A., as co-documentation agents, and the other lenders party thereto (incorporated by reference to
Exhibit No. 10.1 to our Current Report on Form 8-K filed with the SEC on May 29, 2007, File No. 001-32426). |
||||
| 10.7 | Guaranty, dated as of May 22, 2007, by and among Wright Express Corporation, the subsidiary guarantors party
thereto, and Bank of America, N.A., as administrative agent for the lenders party to the Credit Agreement
(incorporated by reference to Exhibit No. 10.2 to our Current Report on Form 8-K filed with the SEC on May 29,
2007, File No. 001-32426). |
||||
| 10.8 | Incremental Amendment Agreement among Wright Express Corporation, as borrower; Bank of America, N.A., as
administrative agent, swing line lender and L/C issuer; Banc of America Securities LLC; SunTrust Robinson
Humphrey, a division of SunTrust Capital Markets, Inc., as joint lead arrangers and joint book managers;
SunTrust Bank, Inc., as syndication agent; and with other lenders (incorporated by reference to Exhibit No.
10.1 to our Current Report on Form 8-K filed with the SEC on June 3, 2008, File No. 001-32426). |
||||
| 10.9 | Amendment to Credit Agreement, dated as of June 26, 2009, among Wright Express Corporation, as borrower, each
lender from time to time party thereto and Bank of America, N.A., as Administrative Agent, Swing Line Lender
and L/C Issuer (incorporated by reference to Exhibit No. 10.4 to our Quarterly Report on Form 10-Q filed with
the SEC on July 30, 2009, File No. 001-324426). |
||||
| † 10.10 | Amended and Restated Wright Express Corporation 2005 Equity and Incentive Plan (incorporated by reference to
Exhibit No. 10.1 to our Current Report on Form 8-K filed with the SEC on January 7, 2009, File No. 001-32426). |
||||
| † 10.11 | Wright Express Corporation Employee Stock Purchase Plan (incorporated by reference to Exhibit No. 10.7 to our
Registration Statement on Form S-1 filed with the SEC on February 10, 2005, File No. 333-120679). |
||||
| † 10.12 | Wright Express Corporation Amended and Restated Non-Employee Directors Deferred Compensation Plan
(incorporated by reference to Exhibit No. 10.2 to our Current Report on Form 8-K filed with the SEC on
January 7, 2009, File No. 001-32426). |
||||
| † 10.13 | Amended and Restated Wright Express Corporation Executive Deferred Compensation Plan (incorporated by
reference to Exhibit No. 10.3 to our Current Report on Form 8-K filed with the SEC on January 7, 2009, File
No. 001-32426). |
||||
83
Table of Contents
| † 10.14 | Amended and Restated Wright Express Corporation Short Term Incentive Program (incorporated by reference to
Exhibit No. 10.1 to our Quarterly Report on Form 10-Q filed with the SEC on May 7, 2009, File No.
001-324426).** |
||||
| † 10.15 | Wright Express Corporation Long Term Incentive Program (incorporated by reference to Exhibit No. 10.5 to our
Quarterly Report on Form 10-Q filed with the SEC on May 7, 2009, File No. 001-32426).** |
||||
| † 10.16 | Amended and Restated Wright Express Corporation Severance Pay Plan for Officers (incorporated by reference to
Exhibit No. 10.4 to our Current Report on Form 8-K filed with the SEC on January 7, 2009, File No. 001-32426). |
||||
| † 10.17 | Employment Agreement with Michael E. Dubyak (incorporated by reference to Exhibit No. 10.5 to our Current
Report on Form 8-K filed with the SEC on January 7, 2009, File No. 001-32426). |
||||
| † 10.18 | Form of Employment Agreement for David Maxsimic and Melissa Smith (incorporated by reference to Exhibit No.
10.6 to our Current Report on Form 8-K filed with the SEC on January 7, 2009, File No. 001-32426). |
||||
| † 10.19 | Form of Employment Agreement for Robert Cornett, Hilary Rapkin and Jamie Morin (incorporated by reference to
Exhibit No. 10.7 to our Current Report on Form 8-K filed with the SEC on January 7, 2009, File No. 001-32426). |
||||
| †* 10.20 | Form of Employment Agreement for George Hogan and Richard Stecklair. |
||||
| † 10.21 | Form of Long Term Incentive Program Award Agreement (incorporated by reference to Exhibit No. 10.1 to our
Current Report on Form 8-K filed with the SEC on April 6, 2006, File No. 001-32426). |
||||
| † 10.22 | Form of Non-Employee Director Long Term Incentive Program Award Agreement (for grants received prior to
December 31, 2006) (incorporated by reference to Exhibit 10.3 to our Quarterly Report on Form 10-Q filed with
the SEC on August 5, 2008, File No. 001-32426). |
||||
| † 10.23 | Form of Non-Employee Director Long Term Incentive Program Award Agreement (for grants received subsequent to
December 31, 2006) (incorporated by reference to Exhibit 10.3 to our Quarterly Report on Form 10-Q filed with
the SEC on August 5, 2008, File No. 001-32426). |
||||
| 10.24 | ISDA Master Agreement and Schedule between CITIBANK, National Association and Wright Express Corporation,
dated as of April 20, 2005 (incorporated by reference to Exhibit No. 10.1 to our Current Report on Form 8-K
filed with the SEC on April 27, 2005, File No. 001-32426). |
||||
| 10.25 | Confirmation of transaction between CITIBANK, National Association and Wright Express Corporation, dated
April 21, 2005 (incorporated by reference to Exhibit No. 10.2 to our Current Report on Form 8-K filed with the
SEC on April 27, 2005, File No. 001-32426). |
||||
| 10.26 | ISDA Master Agreement between Fleet National Bank and Wright Express Corporation, dated as of April 20, 2005
(incorporated by reference to Exhibit No. 10.3 to our Current Report on Form 8-K filed with the SEC on
April 27, 2005, File No. 001-32426). |
||||
| 10.27 | ISDA Schedule to the Master Agreement between Fleet National Bank and Wright Express Corporation, dated as of
April 20, 2005 (incorporated by reference to Exhibit No. 10.4 to our Current Report on Form 8-K filed with the
SEC on April 27, 2005, File No. 001-32426). |
||||
| 10.28 | Confirmation of transaction between Fleet National Bank and Wright Express Corporation, dated April 21, 2005
(incorporated by reference to Exhibit No. 10.5 to our Current Report on Form 8-K filed with the SEC on
April 27, 2005, File No. 001-32426). |
||||
| 10.29 | Form of confirmation evidencing purchases of Nymex Unleaded Regular Gasoline put options and call options by
Wright Express Corporation from J. Aron & Company (incorporated by reference to Exhibit 10.18 to our Quarterly
Report on Form 10-Q filed with the SEC on October 28, 2005, File No. 001-32426). |
||||
| 10.30 | Form of confirmation evidencing purchases of Nymex Diesel put options and call options by Wright Express
Corporation from J. Aron & Company (incorporated by reference to Exhibit 10.19 to our Quarterly Report on Form
10-Q filed with the SEC on October 28, 2005, File No. 001-32426). |
||||
| 10.31 | ISDA Credit Support Annex to the Schedule Master Agreement between Bank of America, N.A. (successor to Fleet
National Bank) and Wright Express Corporation, dated as of August 28, 2006 (incorporated by reference to
Exhibit 10.1 to our Quarterly Report on Form 10-Q filed with the SEC on November 20, 2006, File No.
001-32426). |
||||
| 10.32 | Amendment to the ISDA Master Agreement between Bank of America, N.A. (successor to Fleet National Bank) and
Wright Express Corporation, dated as of August 28, 2006 (incorporated by reference to Exhibit 10.2 to our
Quarterly Report on Form 10-Q filed with the SEC on November 20, 2006, File No. 001-32426). |
||||
| 10.33 | Form of confirmation evidencing purchases and sales of Diesel put options and call options by Wright Express
Corporation from Bank of America, N.A. (incorporated by reference to Exhibit 10.2 to our Quarterly Report on
Form 10-Q filed with the SEC on August 7, 2007, File No. 001-32426). |
84
Table of Contents
| 10.34 | Form of confirmation evidencing purchases and sales of Nymex Unleaded Regular Gasoline put options and call
options by Wright Express Corporation from Bank of America, N.A. (incorporated by reference to Exhibit 10.1 to
our Quarterly Report on Form 10-Q filed with the SEC on August 7, 2007, File No. 001-32426). |
||||||
| * 10.35 | Novation Agreement and New ISDA Agreement, dated as of October 23, 2009, among Wright Express Corporation,
Bank of America, N.A., and Merrill Lynch Commodities, Inc. |
||||||
| 10.36 | ISDA Master Agreement and Schedule between Bank of Tokyo-Mitsubishi UFJ, Ltd., New York Branch and Wright
Express Corporation, dated as of June 14, 2007 (incorporated by reference to Exhibit 10.3 to our Quarterly
Report on Form 10-Q filed with the SEC on November 7, 2007, File No. 001-32426). |
||||||
| 10.37 | Confirmation of transaction between Bank of Tokyo-Mitsubishi UFJ, Ltd., New York Branch and Wright Express
Corporation, dated as of July 18, 2007 (incorporated by reference to Exhibit 10.4 to our Quarterly Report on
Form 10-Q filed with the SEC on November 7, 2007, File No. 001-32426). |
||||||
| 10.38 | ISDA Master Agreement and Schedule between SunTrust Bank and Wright Express Corporation, dated as of April 5,
2005 (incorporated by reference to Exhibit 10.5 to our Quarterly Report on Form 10-Q filed with the SEC on
November 7, 2007, File No. 001-32426). |
||||||
| 10.39 | Confirmation of transaction between SunTrust Bank and Wright Express Corporation, dated as of July 18, 2007
(incorporated by reference to Exhibit 10.6 to our Quarterly Report on Form 10-Q filed with the SEC on
November 7, 2007, File No. 001-32426). |
||||||
| 10.40 | Confirmation of transaction between SunTrust Bank and Wright Express Corporation, dated as of July 22, 2009
(incorporated by reference to Exhibit No. 10.1 to our Current Report on Form 8-K filed with the SEC on July
24, 2009, File No. 001-32426). |
||||||
| 10.41 | ISDA Master Agreement and Schedule between KeyBank National Association and Wright Express Corporation, dated
as of June 15, 2007 (incorporated by reference to Exhibit 10.7 to our Quarterly Report on Form 10-Q filed with
the SEC on November 7, 2007, File No. 001-32426). |
||||||
| 10.42 | Confirmation of transaction between KeyBank National Association and Wright Express Corporation, dated as of
August 22, 2007 (incorporated by reference to Exhibit 10.8 to our Quarterly Report on Form 10-Q filed with the
SEC on November 7, 2007, File No. 001-32426). |
||||||
| 10.43 | ISDA Master Agreement and Schedule between Wachovia Bank, National Association and Wright Express Corporation,
dated as of July 18, 2007 (incorporated by reference to Exhibit No. 10.1 to our Quarterly Report on Form 10-Q
filed with the SEC on May 8, 2008, File No. 001-32426). |
||||||
| 10.44 | Form of confirmation evidencing purchases of Nymex Unleaded Regular Gasoline put options and call options by
Wright Express Corporation from Wachovia Bank, National Association (incorporated by reference to Exhibit No.
10.2 to our Quarterly Report on Form 10-Q filed with the SEC on May 8, 2008, File No. 001-32426). |
||||||
| * 21.1 | Subsidiaries of the registrant. |
||||||
| * 23.1 | Consent of Independent Registered Accounting Firm – Deloitte & Touche LLP. |
||||||
| * 31.1 | Certification of Chief Executive Officer of Wright Express Corporation pursuant to Rule 13a-14(a) promulgated
under the Securities Exchange Act of 1934, as amended. |
||||||
| * 31.2 | Certification of Chief Financial Officer of Wright Express Corporation pursuant to Rule 13a-14(a) promulgated
under the Securities Exchange Act of 1934, as amended. |
||||||
| * 32.1 | Certification of Chief Executive Officer of Wright Express Corporation pursuant to Rule 13a-14(b) promulgated
under the Securities Exchange Act of 1934, as amended, and Section 1350 of Chapter 63 of Title 18 of the
United States Code. |
||||||
| * 32.2 | Certification of Chief Financial Officer of Wright Express Corporation pursuant to Rule 13a-14(b) promulgated
under the Securities Exchange Act of 1934, as amended, and Section 1350 of Chapter 63 of Title 18 of the
United States Code. |
||||||
| * | Filed with this report. |
||||||
| ** | Portions of exhibit have been omitted pursuant to a request for confidential treatment, which has been granted. |
||||||
| † | Denotes a management contract or compensatory plan or arrangement required to be filed as an exhibit pursuant
to Item 15(b) of this Form 10-K. |
||||||
85