Attached files
| file | filename |
|---|---|
| EX-99.1 - EX-99.1 - MYERS INDUSTRIES INC | d87050dex991.htm |
| 8-K - 8-K - MYERS INDUSTRIES INC | d87050d8k.htm |
Earnings Presentation | Third Quarter 2020 Exhibit 99.2
Safe Harbor Statement & Non-GAAP Measures Statements in this release include “forward-looking” statements within the meaning of the Private Securities Litigation Reform Act of 1995. Any statement that is not of historical fact may be deemed “forward-looking”. Words such as “will”, “expect”, “believe”, “project”, “plan”, “anticipate”, “intend”, “objective”, “outlook”, “target”, “goal”, “view” and similar expressions identify forward-looking statements. These statements are based on management's current views and assumptions of future events and financial performance and involve a number of risks and uncertainties, many outside of the Company's control that could cause actual results to materially differ from those expressed or implied. Risks and uncertainties include: impacts from the COVID-19 pandemic on our business, conditions, customers and capital position; the impact of COVID 19 on local, national and global economic conditions; the effects of various governmental responses to the COVID-19 pandemic, raw material availability, increases in raw material costs, or other production costs; risks associated with our strategic growth initiatives or the failure to achieve the anticipated benefits of such initiatives; unanticipated downturn in business relationships with customers or their purchases; competitive pressures on sales and pricing; changes in the markets for the Company’s business segments; changes in trends and demands in the markets in which the Company competes; operational problems at our manufacturing facilities, or unexpected failures at those facilities; future economic and financial conditions in the United States and around the world; inability of the Company to meet future capital requirements; claims, litigation and regulatory actions against the Company; changes in laws and regulations affecting the Company; impact of the upcoming U.S. elections impacts on the regulatory landscape, capital markets, and responses to and management of the COVID-19 pandemic including further economic stimulus from the federal government; and other important factors detailed previously and from time to time in the Company’s filings with the Securities and Exchange Commission, including the Company’s Annual Report on Form 10-K for the year ended December 31, 2019 and subsequent Quarterly Reports on Form 10-Q. Such reports are available on the Securities and Exchange Commission's public reference facilities and its website at www.sec.gov and on the Company's Investor Relations section of its website at www.myersindustries.com. Myers Industries undertakes no obligation to publicly update or revise any forward-looking statements contained herein. These statements speak only as of the date made. The Company refers to certain non-GAAP financial measures throughout this presentation. Adjusted gross margin, adjusted EBITDA margin, debt to adjusted EBITDA margin, Adjusted gross profit, Adjusted operating income, adjusted operating income margin, adjusted EBITDA, diluted adjusted EPS and free cash flow are non-GAAP financial measures and are intended to serve as a supplement to results provided in accordance with accounting principles generally accepted in the United States. Myers Industries believes that such information provides an additional measurement and consistent historical comparison of the Company’s performance. Reconciliations of the non-GAAP financial measures to the most directly comparable GAAP measures are available in the appendix of this presentation.
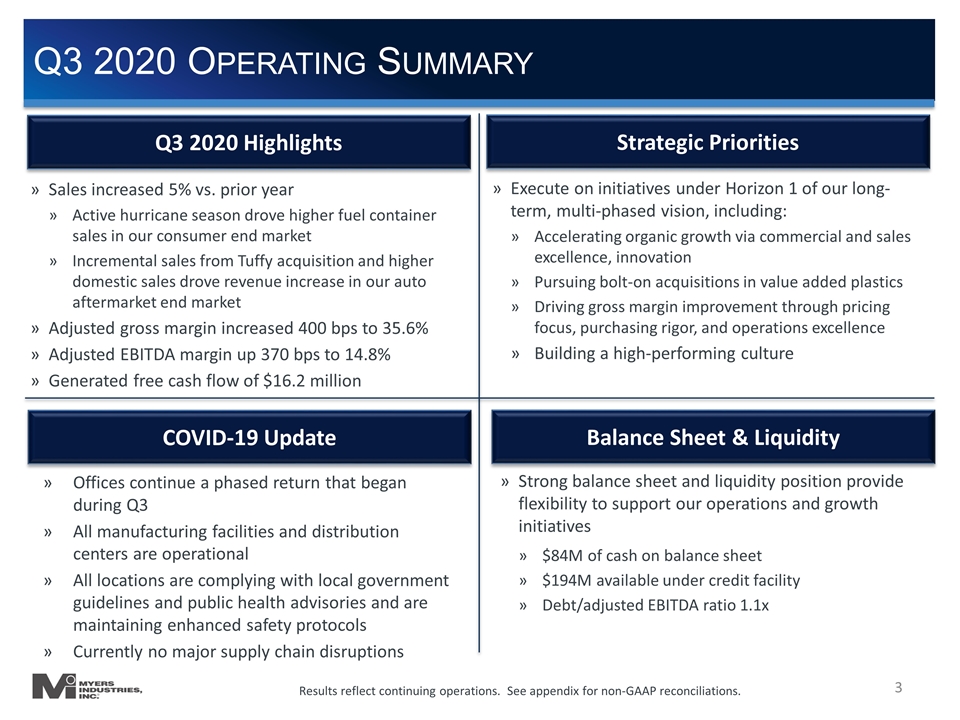
Q3 2020 Operating Summary Results reflect continuing operations. See appendix for non-GAAP reconciliations. Q3 2020 Highlights Sales increased 5% vs. prior year Active hurricane season drove higher fuel container sales in our consumer end market Incremental sales from Tuffy acquisition and higher domestic sales drove revenue increase in our auto aftermarket end market Adjusted gross margin increased 400 bps to 35.6% Adjusted EBITDA margin up 370 bps to 14.8% Generated free cash flow of $16.2 million COVID-19 Update Strategic Priorities Execute on initiatives under Horizon 1 of our long-term, multi-phased vision, including: Accelerating organic growth via commercial and sales excellence, innovation Pursuing bolt-on acquisitions in value added plastics Driving gross margin improvement through pricing focus, purchasing rigor, and operations excellence Building a high-performing culture Strong balance sheet and liquidity position provide flexibility to support our operations and growth initiatives $84M of cash on balance sheet $194M available under credit facility Debt/adjusted EBITDA ratio 1.1x Balance Sheet & Liquidity Offices continue a phased return that began during Q3 All manufacturing facilities and distribution centers are operational All locations are complying with local government guidelines and public health advisories and are maintaining enhanced safety protocols Currently no major supply chain disruptions
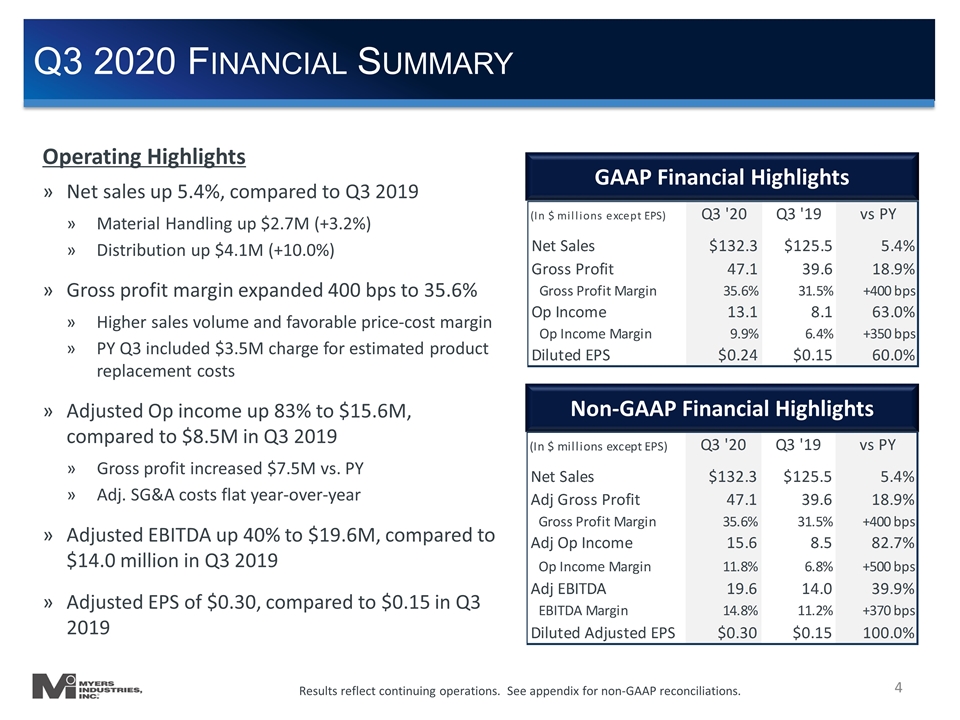
Q3 2020 Financial Summary Operating Highlights Net sales up 5.4%, compared to Q3 2019 Material Handling up $2.7M (+3.2%) Distribution up $4.1M (+10.0%) Gross profit margin expanded 400 bps to 35.6% Higher sales volume and favorable price-cost margin PY Q3 included $3.5M charge for estimated product replacement costs Adjusted Op income up 83% to $15.6M, compared to $8.5M in Q3 2019 Gross profit increased $7.5M vs. PY Adj. SG&A costs flat year-over-year Adjusted EBITDA up 40% to $19.6M, compared to $14.0 million in Q3 2019 Adjusted EPS of $0.30, compared to $0.15 in Q3 2019 GAAP Financial Highlights Non-GAAP Financial Highlights Results reflect continuing operations. See appendix for non-GAAP reconciliations.
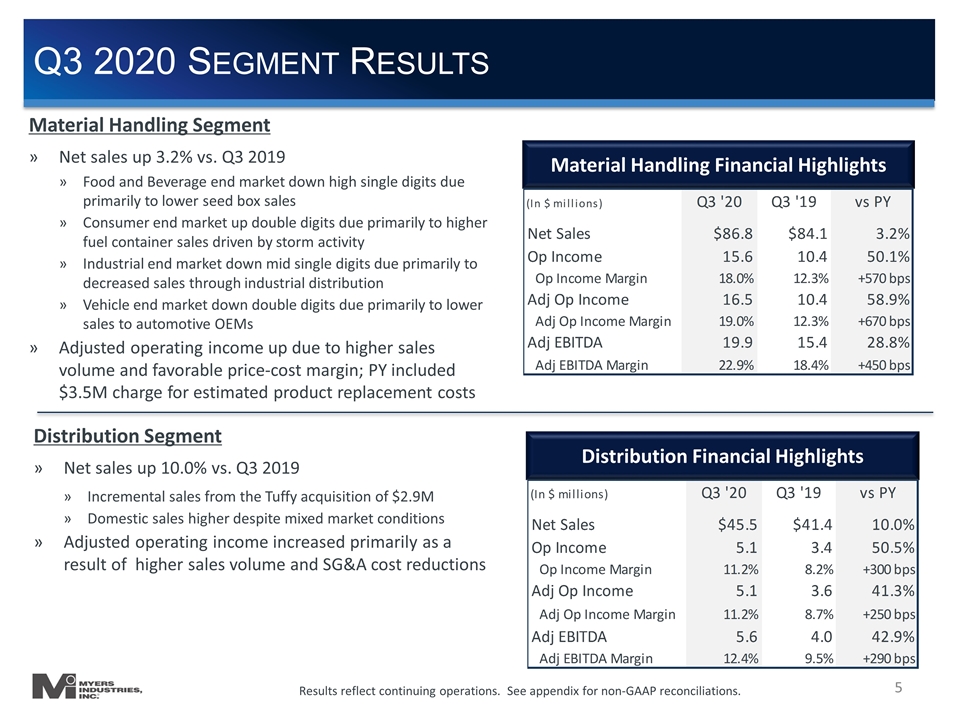
Material Handling Segment Net sales up 3.2% vs. Q3 2019 Food and Beverage end market down high single digits due primarily to lower seed box sales Consumer end market up double digits due primarily to higher fuel container sales driven by storm activity Industrial end market down mid single digits due primarily to decreased sales through industrial distribution Vehicle end market down double digits due primarily to lower sales to automotive OEMs Adjusted operating income up due to higher sales volume and favorable price-cost margin; PY included $3.5M charge for estimated product replacement costs Q3 2020 Segment Results Material Handling Financial Highlights Distribution Financial Highlights Results reflect continuing operations. See appendix for non-GAAP reconciliations. Distribution Segment Net sales up 10.0% vs. Q3 2019 Incremental sales from the Tuffy acquisition of $2.9M Domestic sales higher despite mixed market conditions Adjusted operating income increased primarily as a result of higher sales volume and SG&A cost reductions
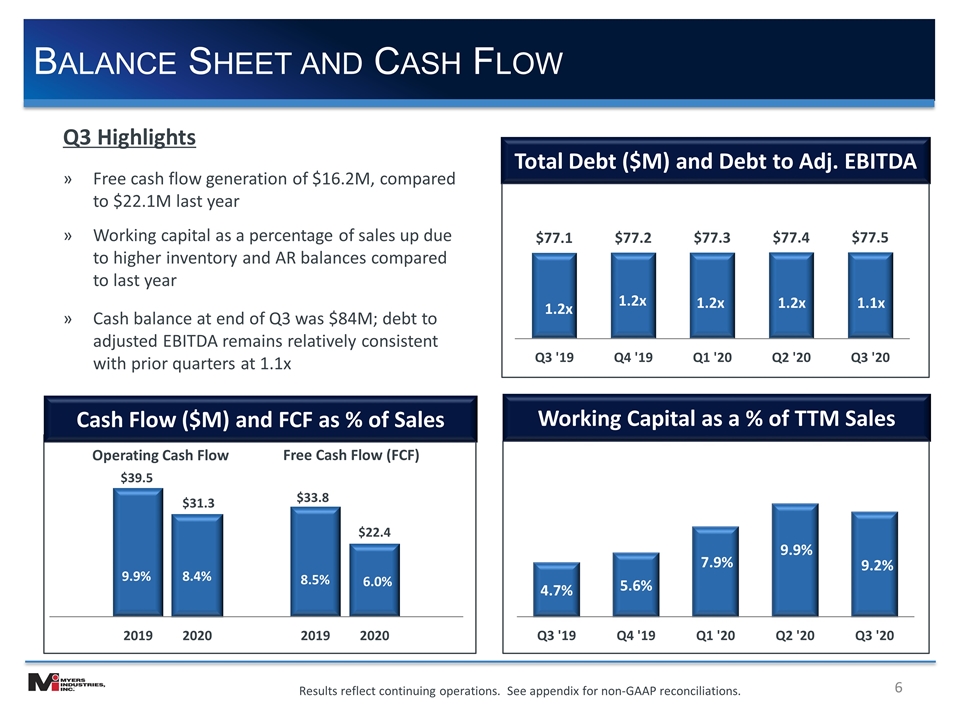
Balance Sheet and Cash Flow Operating Cash Flow Free Cash Flow (FCF) 6.0% 8.5% 8.4% 9.9% 1.2x Q3 Highlights Free cash flow generation of $16.2M, compared to $22.1M last year Working capital as a percentage of sales up due to higher inventory and AR balances compared to last year Cash balance at end of Q3 was $84M; debt to adjusted EBITDA remains relatively consistent with prior quarters at 1.1x Results reflect continuing operations. See appendix for non-GAAP reconciliations. Cash Flow ($M) and FCF as % of Sales Total Debt ($M) and Debt to Adj. EBITDA Working Capital as a % of TTM Sales
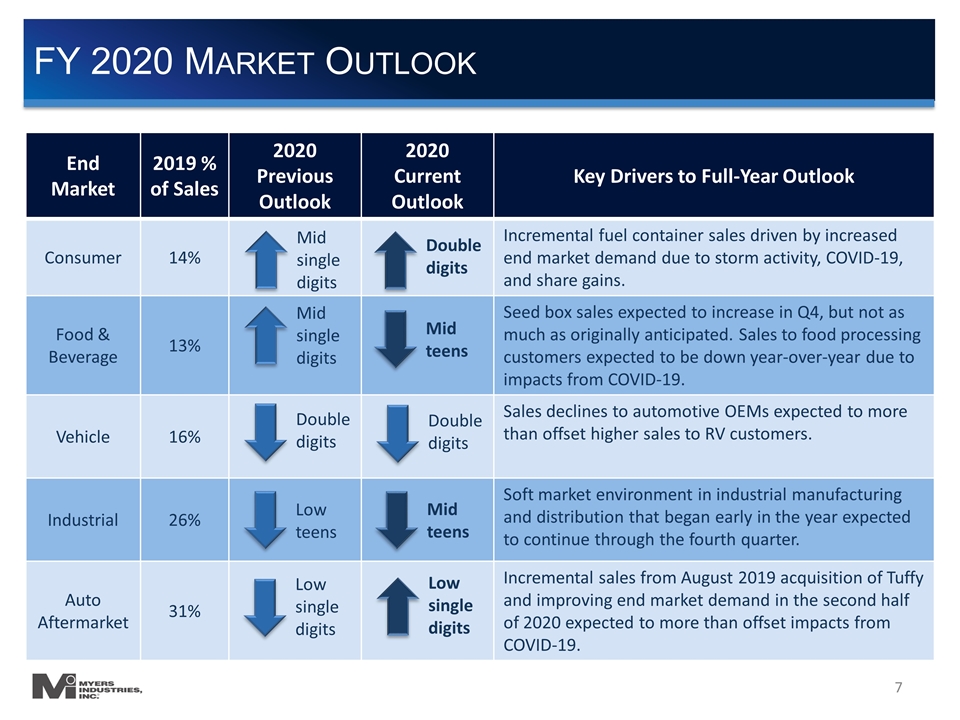
FY 2020 Market Outlook End Market 2019 % of Sales 2020 Previous Outlook 2020 Current Outlook Key Drivers to Full-Year Outlook Consumer 14% Incremental fuel container sales driven by increased end market demand due to storm activity, COVID-19, and share gains. Food & Beverage 13% Seed box sales expected to increase in Q4, but not as much as originally anticipated. Sales to food processing customers expected to be down year-over-year due to impacts from COVID-19. Vehicle 16% Sales declines to automotive OEMs expected to more than offset higher sales to RV customers. Industrial 26% Soft market environment in industrial manufacturing and distribution that began early in the year expected to continue through the fourth quarter. Auto Aftermarket 31% Incremental sales from August 2019 acquisition of Tuffy and improving end market demand in the second half of 2020 expected to more than offset impacts from COVID-19. Mid single digits Mid single digits Double digits Low teens Low single digits Double digits Double digits Low single digits Mid teens Mid teens
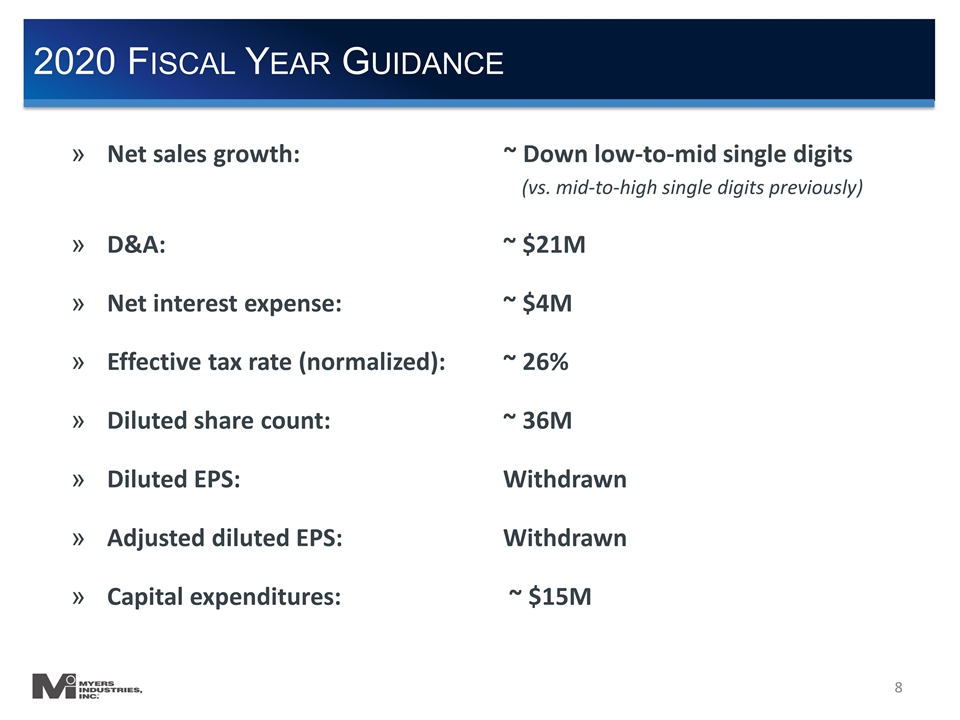
2020 Fiscal Year Guidance Net sales growth:~ Down low-to-mid single digits (vs. mid-to-high single digits previously) D&A: ~ $21M Net interest expense:~ $4M Effective tax rate (normalized):~ 26% Diluted share count:~ 36M Diluted EPS:Withdrawn Adjusted diluted EPS: Withdrawn Capital expenditures:~ $15M
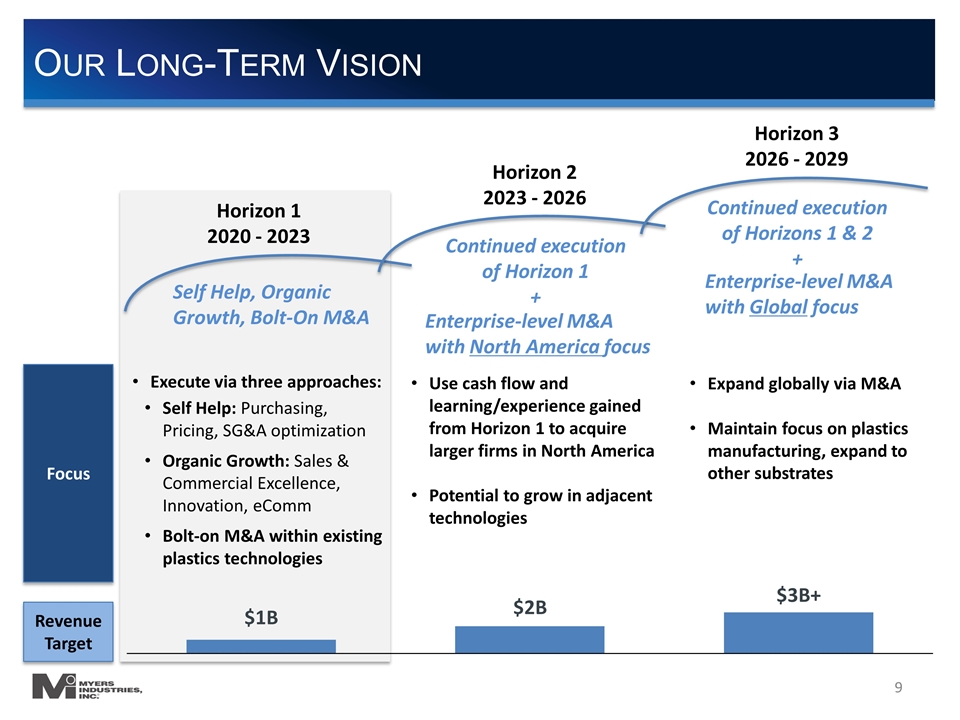
Our Long-Term Vision Horizon 1 2020 - 2023 Horizon 2 2023 - 2026 Horizon 3 2026 - 2029 Focus Revenue Target Execute via three approaches: Self Help: Purchasing, Pricing, SG&A optimization Organic Growth: Sales & Commercial Excellence, Innovation, eComm Bolt-on M&A within existing plastics technologies $1B $2B $3B+ Use cash flow and learning/experience gained from Horizon 1 to acquire larger firms in North America Potential to grow in adjacent technologies Expand globally via M&A Maintain focus on plastics manufacturing, expand to other substrates Self Help, Organic Growth, Bolt-On M&A Enterprise-level M&A with North America focus Enterprise-level M&A with Global focus Continued execution of Horizon 1 + Continued execution of Horizons 1 & 2 +
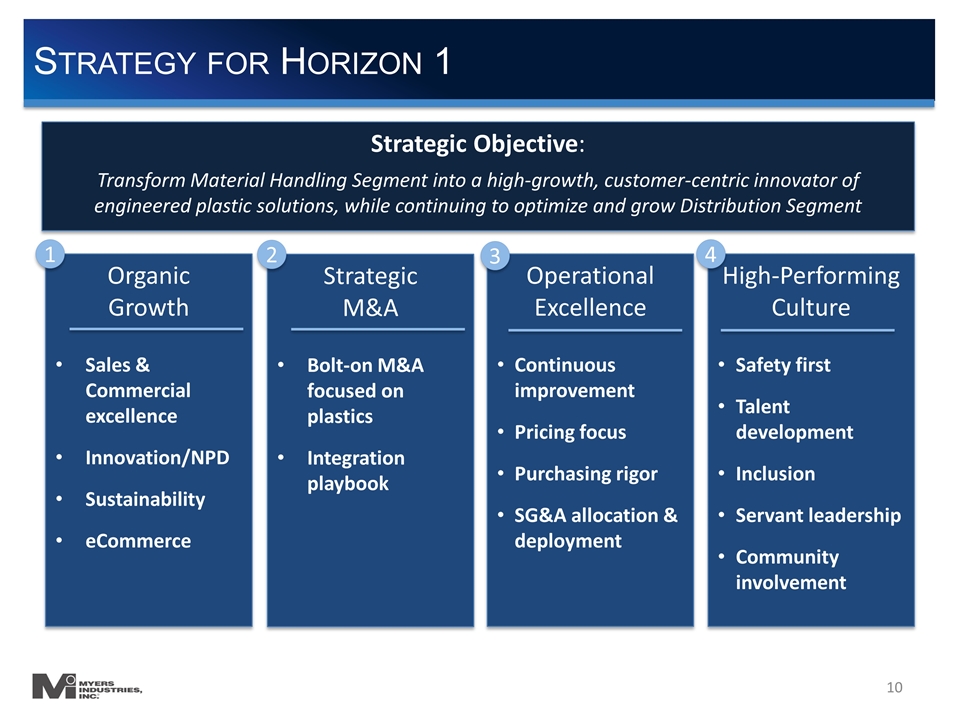
Strategy for Horizon 1 Strategic Objective: Transform Material Handling Segment into a high-growth, customer-centric innovator of engineered plastic solutions, while continuing to optimize and grow Distribution Segment Organic Growth Sales & Commercial excellence Innovation/NPD Sustainability eCommerce Operational Excellence Continuous improvement Pricing focus Purchasing rigor SG&A allocation & deployment High-Performing Culture Safety first Talent development Inclusion Servant leadership Community involvement 1 4 3 Strategic M&A Bolt-on M&A focused on plastics Integration playbook 2

Appendix
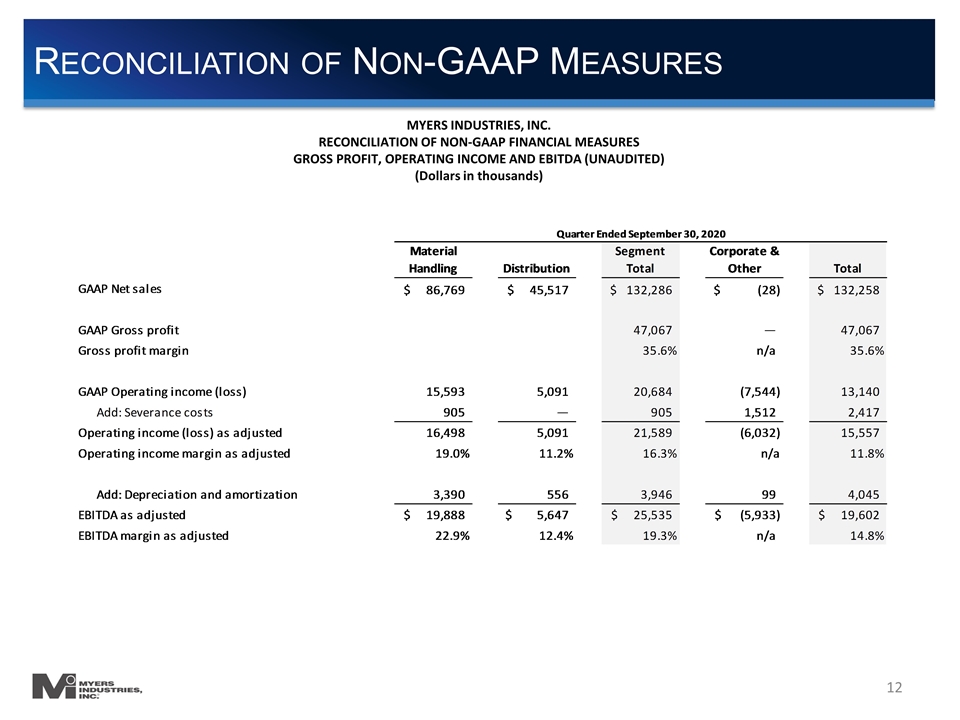
Reconciliation of Non-GAAP Measures MYERS INDUSTRIES, INC. RECONCILIATION OF NON-GAAP FINANCIAL MEASURES GROSS PROFIT, OPERATING INCOME AND EBITDA (UNAUDITED) (Dollars in thousands)
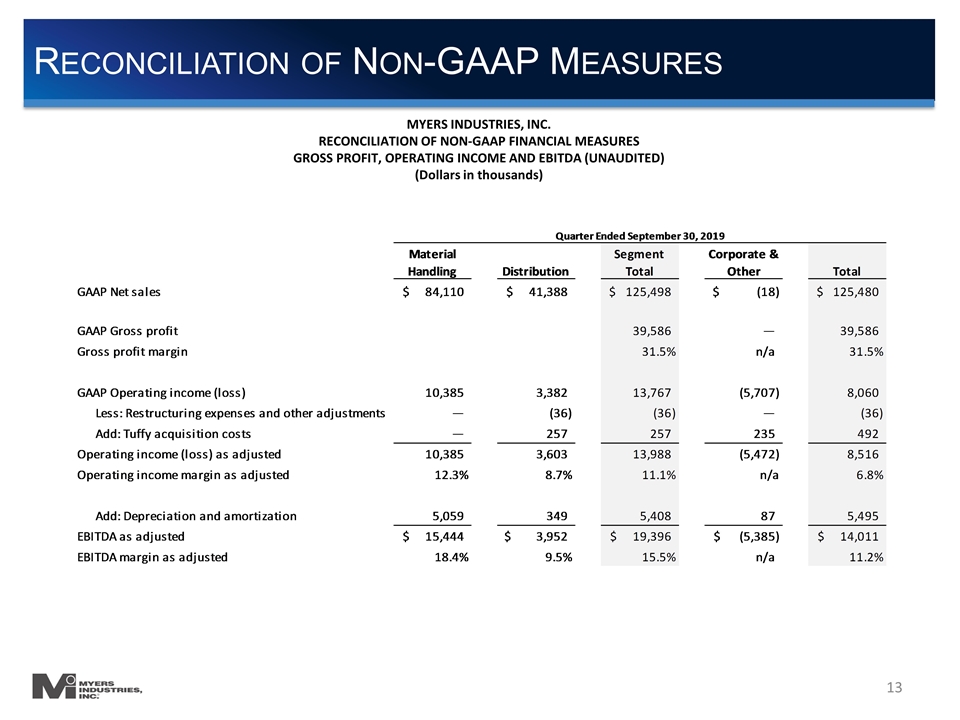
Reconciliation of Non-GAAP Measures MYERS INDUSTRIES, INC. RECONCILIATION OF NON-GAAP FINANCIAL MEASURES GROSS PROFIT, OPERATING INCOME AND EBITDA (UNAUDITED) (Dollars in thousands)
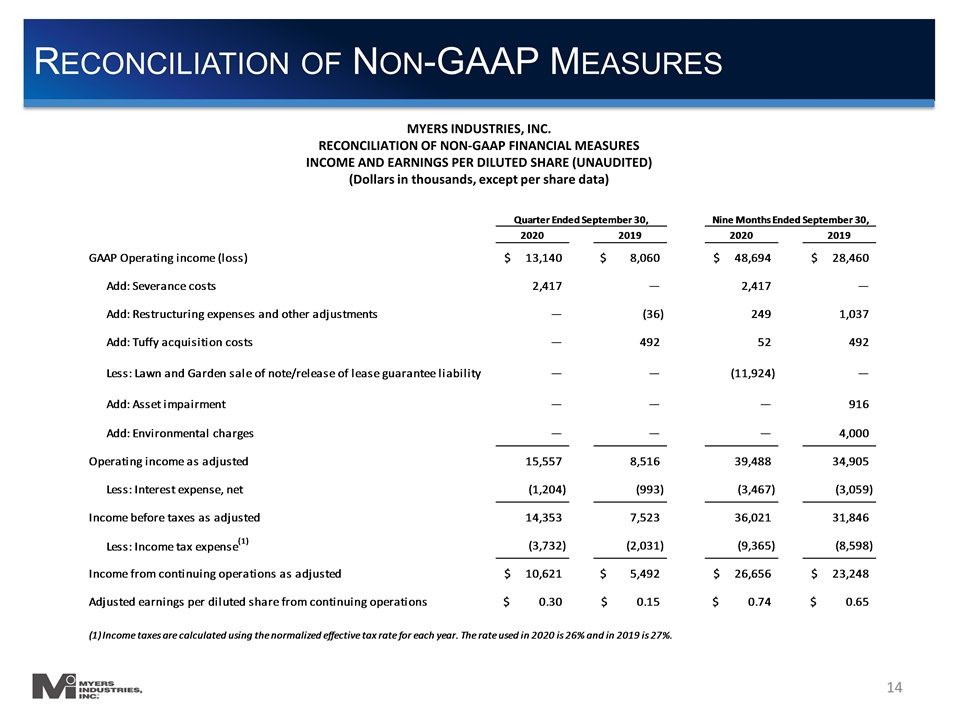
Reconciliation of Non-GAAP Measures MYERS INDUSTRIES, INC. RECONCILIATION OF NON-GAAP FINANCIAL MEASURES INCOME AND EARNINGS PER DILUTED SHARE (UNAUDITED) (Dollars in thousands, except per share data)
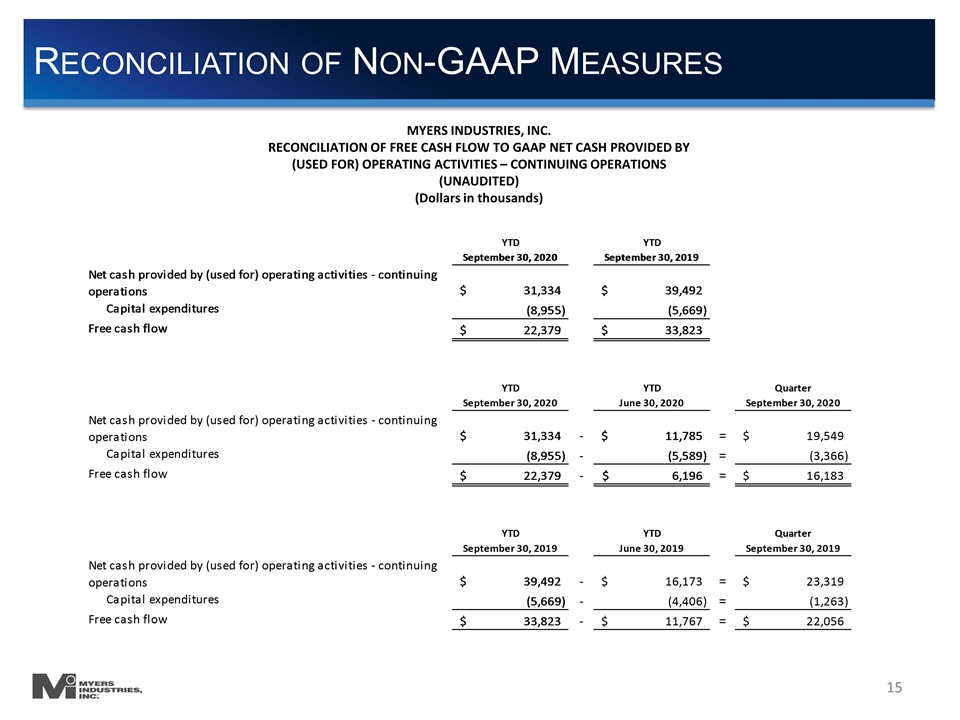
Reconciliation of Non-GAAP Measures MYERS INDUSTRIES, INC. RECONCILIATION OF FREE CASH FLOW TO GAAP NET CASH PROVIDED BY (USED FOR) OPERATING ACTIVITIES – CONTINUING OPERATIONS (UNAUDITED) (Dollars in thousands)
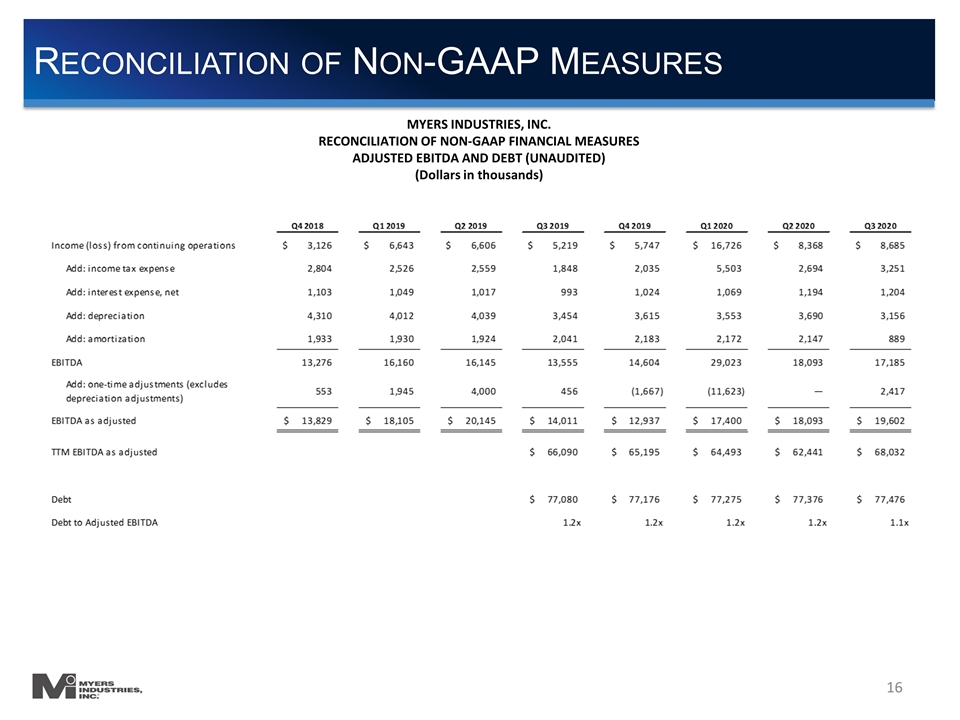
Reconciliation of Non-GAAP Measures MYERS INDUSTRIES, INC. RECONCILIATION OF NON-GAAP FINANCIAL MEASURES ADJUSTED EBITDA AND DEBT (UNAUDITED) (Dollars in thousands)
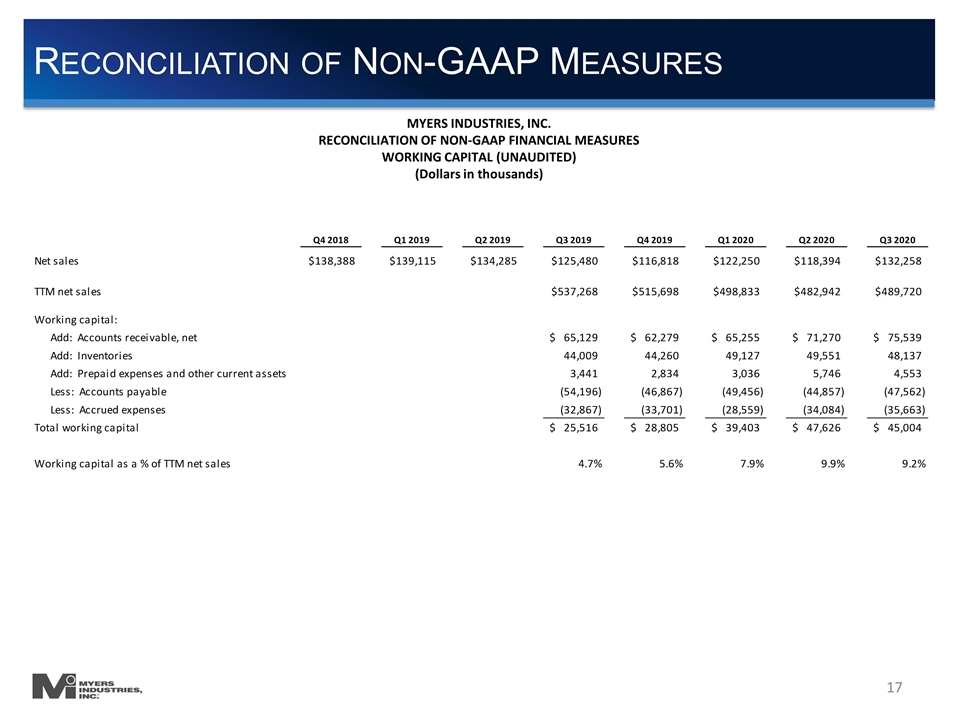
Reconciliation of Non-GAAP Measures MYERS INDUSTRIES, INC. RECONCILIATION OF NON-GAAP FINANCIAL MEASURES WORKING CAPITAL (UNAUDITED) (Dollars in thousands)

