Attached files
| file | filename |
|---|---|
| EX-32 - EX-32 - MYERS INDUSTRIES INC | mye-ex32_6.htm |
| EX-31.B - EX-31.B - MYERS INDUSTRIES INC | mye-ex31b_7.htm |
| EX-31.A - EX-31.A - MYERS INDUSTRIES INC | mye-ex31a_9.htm |
| EX-23 - EX-23 - MYERS INDUSTRIES INC | mye-ex23_11.htm |
| EX-21 - EX-21 - MYERS INDUSTRIES INC | mye-ex21_8.htm |
| EX-10.AO - EX-10.AO - MYERS INDUSTRIES INC | mye-ex10ao_160.htm |
| EX-10.AN - EX-10.AN - MYERS INDUSTRIES INC | mye-ex10an_155.htm |
| EX-10.AM - EX-10.AM - MYERS INDUSTRIES INC | mye-ex10am_156.htm |
| EX-10.AL - EX-10.AL - MYERS INDUSTRIES INC | mye-ex10al_157.htm |
| EX-10.AK - EX-10.AK - MYERS INDUSTRIES INC | mye-ex10ak_158.htm |
| EX-10.AJ - EX-10.AJ - MYERS INDUSTRIES INC | mye-ex10aj_159.htm |
| EX-10.AI - EX-10.AI - MYERS INDUSTRIES INC | mye-ex10ai_154.htm |
SECURITIES AND EXCHANGE COMMISSION
WASHINGTON, D.C. 20549
FORM 10-K
☒ ANNUAL REPORT PURSUANT TO SECTION 13 OR 15(d)
OF THE SECURITIES EXCHANGE ACT OF 1934
FOR THE FISCAL YEAR ENDED December 31, 2017
COMMISSION FILE NUMBER 001-08524
MYERS INDUSTRIES, INC.
(Exact name of registrant as specified in its charter)
|
OHIO |
34-0778636 |
|
(State or other jurisdiction of incorporation or organization) |
(IRS Employer Identification Number) |
|
1293 S. MAIN STREET, AKRON, OHIO (Address of Principal Executive Offices) |
44301 (Zip Code) |
(330) 253-5592 (Telephone Number) |
|
Securities Registered Pursuant to Section 12(b) of the Act: |
Name of Each Exchange On which registered: |
|
Common Stock, Without Par Value (Title of Class) |
New York Stock Exchange |
Securities Registered Pursuant to Section 12(g) of the Act: None
Indicate by check mark if the registrant is a well-known seasoned issuer, as defined in Rule 405 of the Securities Act. Yes ☐ No ☒
Indicate by check mark if the registrant is not required to file reports pursuant to Section 13 or Section 15(d) of the Act. Yes ☐ No ☒
Indicate by check mark whether the registrant (1) has filed all reports required to be filed by Section 13 or 15(d) of the Securities Exchange Act of 1934 during the preceding 12 months (or for such shorter period that the registrant was required to file such reports), and (2) has been subject to the filing requirements for the past 90 days. Yes ☒ No ☐
Indicate by check mark whether the registrant has submitted electronically and posted on its corporate Web site, if any, every Interactive Data File required to be submitted and posted pursuant to Rule 405 of Regulation S-T (232.405 of this chapter) during the preceding 12 months (or for such shorter period that the registrant was required to submit and post such files). Yes ☒ No ☐
Indicate by check mark if disclosure of delinquent filers pursuant to Item 405 of Regulation S-K (229.405 of this chapter) is not contained herein, and will not be contained, to the best of registrant’s knowledge, in definitive proxy or information statements incorporated by reference in Part III of this Form 10-K or any amendment to this Form 10-K. ☒
Indicate by check mark whether the Registrant is a large accelerated filer, an accelerated filer, a non-accelerated filer or a smaller reporting company. See the definitions of “large accelerated filer,” “accelerated filer,” and “smaller reporting company” in Rule 12b-2 of the Exchange Act. (Check one):
|
Large accelerated filer |
☐ |
Accelerated filer |
☒ |
|
Non-Accelerated filer |
☐ (Do not check if a smaller reporting company) |
Smaller reporting company |
☐ |
|
|
|
Emerging growth company |
☐ |
If an emerging growth company, indicate by check mark if the registrant has elected not to use the extended transition period for complying with any new or revised financial accounting standards provided pursuant to Section 13(a) of the Exchange Act. ☐
Indicate by check mark whether the Registrant is a shell company (as defined in Rule 12b-2 of the Act). Yes ☐ No ☒
State the aggregate market value of the voting and non-voting common equity held by non-affiliates computed by reference to the closing sale price on the New York Stock Exchange as of June 30, 2017: $538,844,114
Indicate the number of shares outstanding of registrant’s common stock as of February 28, 2018: 30,509,220 Shares of Common Stock, without par value.
DOCUMENTS INCORPORATED BY REFERENCE:
Portions of the Registrant’s Definitive Proxy Statement for its 2018 Annual Meeting of Stockholders are incorporated by reference in Part III of this Form 10-K.
|
|
|
|
|
|
1 |
|
|
|
6 |
|
|
|
11 |
|
|
|
12 |
|
|
|
13 |
|
|
|
|
|
|
|
|
|
|
|
16 |
|
|
|
18 |
|
|
|
ITEM 7. Management’s Discussion and Analysis of Results of Operations and Financial Condition |
19 |
|
|
ITEM 7A. Quantitative and Qualitative Disclosures About Market Risk |
26 |
|
|
27 |
|
|
|
27 |
|
|
|
28 |
|
|
|
29 |
|
|
|
30 |
|
|
|
31 |
|
|
|
32 |
|
|
|
33 |
|
|
|
ITEM 9. Changes in and Disagreements with Accountants on Accounting and Financial Disclosure |
56 |
|
|
56 |
|
|
|
58 |
|
|
|
|
|
|
|
|
|
|
|
58 |
|
|
|
58 |
|
|
|
58 |
|
|
|
ITEM 13. Certain Relationships and Related Transactions, and Director Independence |
59 |
|
|
59 |
|
|
|
|
|
|
|
|
|
|
|
60 |
|
|
|
|
|
|
64 |
||
|
|
Exhibit 21 |
|
|
|
Exhibit 23 |
|
|
|
Exhibit 31(a) |
|
|
|
Exhibit 31(b) |
|
|
|
Exhibit 32 |
|
|
|
Exhibit 101 |
|
|
|
(a) |
General Development of Business |
Myers Industries, Inc. (the “Company”) was founded in Akron, Ohio, in 1933. The terms “Myers Industries,” “Company,” “we,” “us,” or “our” wherever used herein refer to the Company, unless the context indicates to the contrary. Since then, the Company has grown from a small storefront distributing tire service supplies into an international manufacturing and distribution enterprise. In 1971, the Company went public, and the stock is traded on the New York Stock Exchange under the ticker symbol MYE.
Headquartered in Akron, Ohio, the Company manufactures a diverse range of polymer products for industrial, agricultural, automotive, commercial, and consumer markets. Myers Industries is a leader in the manufacturing of plastic reusable material handling containers and pallets, and plastic fuel tanks. Other principal product lines include plastic storage and organization containers, rubber tire repair products and custom plastic and rubber products.
The Company is also the largest distributor of tools, equipment and supplies for the tire, wheel and undervehicle service industry in the United States. The distribution products range from tire balancers and alignment systems to valve caps, tire repair tools and other consumable service supplies.
As of December 31, 2017, the Company operated nine manufacturing facilities, 20 sales offices, four distribution centers and three distribution branches located throughout North and Central America; had approximately 15,000 manufactured products and over 13,500 distributed products; and had approximately 1,900 employees.
Serving customers around the world, Myers Industries’ brands provide safety and efficiency solutions to a wide variety of customers in diverse niche markets. Myers Industries’ diverse products and solutions help customers improve shop productivity with point of use inventory, store and transport products more safely and efficiently, improve sustainability through reuse, lower overall material handling costs, improve ergonomics for their labor force, eliminate waste and ultimately increase profitability. Myers Industries’ employees think and act like owners, implementing long term improvements both internally and for their customers.
The Company’s business strategy is guided by the following key operating principles: 1) Niche Market Focus, 2) Flexible Operations, and 3) Strong Cash Flow Growth. Applying these principles to our business, management emphasizes:
|
|
• |
Customer intimacy - #1 or #2 in each served market; |
|
|
• |
Strong brands; |
|
|
• |
Process driven, simplified, lean operating principles; |
|
|
• |
Manufacture only value-added components and products; |
|
|
• |
Asset light business model; and |
|
|
• |
Cash return on investment. |
The Company continually reviews its segments and brands for strategic fit and growth potential. The review process is dedicated to furthering innovation and brand leadership in niche markets, building strong customer relationships and positioning the Company for strong financial performance.
|
|
(b) |
Financial Information About Segments |
The response to this section of Item 1 is contained in the Industry Segments footnote of the Notes to Consolidated Financial Statements under Item 8 of this report.
|
|
(c) |
Description of Business |
The Company conducts its business activities in two distinct business segments, Material Handling and Distribution, consistent with the manner in which the Chief Operating Decision Maker evaluates performance and makes resource allocation decisions.
1
In December 2017, the Company approved and completed the sale of its subsidiaries Myers do Brasil Embalagens Plasticas Ltda. and Plasticos Novel do Nordeste Ltda. (collectively, the “Brazil Business”) to allow the Company to focus resources on its core businesses and additional growth opportunities. The Brazil Business designed and manufactured reusable plastic shipping containers, plastic pallets, crates and totes used for closed loop-shipping and storage in Brazil’s automotive, distribution, food, beverage and agriculture industries. The operating results for the Brazil Business are classified as discontinued operations in the Consolidated Statements of Operations under Item 8 of this report. The Brazil Business was part of the Material Handling Segment.
During the second quarter of 2014, the Company's Board of Directors approved the commencement of the sale process to divest its Lawn and Garden business to allow it to focus resources on core growth platforms. The divestiture of the Lawn and Garden business was completed in February 2015 and was sold to an entity controlled by Wingate Partners V, L.P. (“L&G Buyer”). The Lawn and Garden business served the North American horticulture market with plastic products such as seedling trays, nursery products, hanging baskets, custom print containers as well as decorative resin planters. The operating results for the Lawn and Garden business are classified as discontinued operations in the Consolidated Statements of Operations under Item 8 of this report.
In our Material Handling Segment, we design, manufacture, and market a variety of plastic and metal products. These range from plastic reusable material handling containers and small parts storage bins to plastic RV tanks and parts, marine tanks and parts, portable plastic fuel tanks and water containers, portable marine fuel containers, ammunition containers, storage totes, bulk shipping containers, beverage crates and metal carts and cabinets. The Material Handling Segment conducts operations in the United States and Canada. Markets served encompass various niches of industrial manufacturing, food processing, retail/wholesale products distribution, agriculture, automotive, recreational vehicles, marine vehicles, healthcare, appliance, bakery, electronics, textiles, consumer, and others. Products are sold both directly to end-users and through distributors.
The Distribution Segment is engaged in the distribution of tools, equipment and supplies used for tire, wheel and undervehicle service on passenger, heavy truck and off-road vehicles and the manufacturing of tire repair materials and custom rubber products. The product line includes categories such as tire valves and accessories, lifts and alignment equipment, service equipment and tools, and tire repair/retread supplies. The Distribution Segment operates domestically through its sales offices and four regional distribution centers in the United States, and in certain foreign countries through export sales. In addition, the Distribution Segment operates directly in certain foreign markets, principally Central America, through foreign branch operations. Markets served include retail and truck tire dealers, commercial auto and truck fleets, auto dealers, general service and repair centers, tire retreaders, and government agencies.
Information regarding the revenues of each segment classified as continuing operations is contained in the Industry Segments footnote of the Notes to Consolidated Financial Statements under Item 8 of this report.
2
The following table summarizes the key attributes of the business segments for the year ended December 31, 2017:
|
Material Handling Segment |
|
||||||||
|
Net Sales |
|
Key Product Areas |
|
Product Brands |
|
Key Capabilities & Services |
|
Representative Markets |
|
|
$391.3 |
• |
Plastic Reusable Containers & |
• |
Akro-Mils™ |
• |
Product Design |
• |
Agriculture |
|
|
71% |
|
Pallets |
• |
Jamco Products |
• |
Prototyping |
• |
Automotive |
|
|
|
• |
Plastic Storage & |
• |
Buckhorn® |
• |
Product Testing |
• |
Commercial |
|
|
|
|
Organizational Products |
• |
Ameri-Kart® |
• |
Material Formulation |
• |
Food Processing |
|
|
|
• |
Plastic Carts |
• |
Scepter |
• |
Injection Molding |
• |
Food Distribution |
|
|
|
• |
Metal Carts |
|
|
• |
Structural Foam Molding |
• |
Healthcare |
|
|
|
• |
Metal Cabinets |
|
|
• |
Metal Forming |
• |
Industrial |
|
|
|
• |
Wooden Dollies |
|
|
• |
Stainless Steel Forming |
• |
Manufacturing |
|
|
|
• |
Custom Products |
|
|
• |
Wood Fabrication |
• |
Retail Distribution |
|
|
|
|
|
|
|
• |
Powder Coating |
• |
Wholesale Distribution |
|
|
|
|
|
|
|
• |
Material Regrind & Recycling |
• |
Consumer |
|
|
|
|
|
|
|
• |
Plastic Blow Molding |
• |
Recreational Vehicle |
|
|
|
|
|
|
|
• |
Plastic Rotational Molding |
• |
Marine |
|
|
|
|
|
|
|
• |
Thermoforming |
• |
Military |
|
|
|
|
|
|
|
• |
Infrared Welding |
• |
Food & Beverage |
|
|
|
|
|
|
|
|
|
• |
Custom |
|
|
|
|
|
|
|
|
|
|
|
|
|
Distribution Segment |
|
||||||||
|
Net Sales |
|
Key Product Areas |
|
Product Brands |
|
Key Capabilities & Services |
|
Representative Markets |
|
|
$156.4 |
• |
Tire Valves & Accessories |
• |
Myers Tire Supply® |
• |
Broad Sales Coverage |
• |
Retail Tire Dealers |
|
|
29% |
• |
Tire Changing & |
• |
Myers Tire Supply |
• |
Local Sales |
• |
Truck Tire Dealers |
|
|
|
|
Balancing Equipment |
|
International™ |
• |
Four Strategically Placed |
• |
Auto Dealers |
|
|
|
• |
Lifts & Alignment Equipment |
• |
Patch Rubber Company® |
|
Distribution Centers |
• |
Commercial Auto & Truck |
|
|
|
• |
Service Equipment |
• |
Elrick |
• |
International Distribution |
|
Fleets |
|
|
|
• |
Hand Tools |
• |
Fleetline |
• |
Personalized Service |
• |
General Repair & Services |
|
|
|
• |
Tire Repair & Retread |
• |
MTS |
• |
National Accounts |
|
Facilities |
|
|
|
|
Equipment & Supplies |
• |
Phoenix |
• |
Product Training |
• |
Tire Retreaders |
|
|
|
• |
Brake, Transmission & Allied |
• |
Seymoure |
• |
Repair/Service Training |
• |
Tire Repair |
|
|
|
|
Service Equipment & Supplies |
|
|
• |
New Products/Services |
• |
Governmental Agencies |
|
|
|
• |
Highway Markings |
|
|
|
"Speed to Market" |
• |
Telecommunications |
|
|
|
• |
Industrial Rubber |
|
|
• |
Rubber Mixing |
• |
Industrial |
|
|
|
• |
General Shop Supplies |
|
|
• |
Rubber Compounding |
• |
Road Construction |
|
|
|
• |
Tire Pressure Monitoring System |
|
|
• |
Rubber Calendaring |
• |
Mining |
|
|
|
|
|
|
|
• |
Tiered Product Offerings |
|
|
|
|
|
|
|
|
|
|
|
|
|
|
Segments Overview
Material Handling Segment
The Material Handling Segment manufactures highly engineered polymer packaging containers, storage and safety products, and specialty molded parts. The brands within this segment include Buckhorn®, Akro-Mils™, Jamco Products, Ameri-Kart®, and Scepter.
Buckhorn’s reusable containers and pallets are used in closed-loop supply chain systems to help customers improve product protection, increase handling efficiencies, reduce freight costs and eliminate solid waste and disposal costs. Buckhorn offers products to replace costly single use cardboard boxes, wooden pallets, and steel containers. The product line is among the broadest in the industry and includes injection-molded and structural foam-molded constructions. Buckhorn’s product lines include hand-held
3
containers used for inventory control, order management and transportation of retail goods; collapsible and fixed-wall bulk transport containers for light and heavy-duty tasks; intermediate bulk containers for the storage and transport of food, liquid, powder, and granular products; plastic pallets; and specialty boxes designed for storage of items such as seed. Buckhorn also produces a wide variety of specialty products designed for niche applications and custom products designed according to exact customer specifications.
Akro-Mils material handling products provide customers everything they need to store, organize and transport a wide range of goods while increasing overall productivity and profitability. Serving industrial and commercial markets, Akro-Mils products range from AkroBins® — the industry’s leading small parts bins — to Super-Size AkroBins, metal panel and bin hanging systems, metal storage cabinet and bin systems, wire shelving systems, plastic and metal transport carts and a wide variety of custom storage and transport products. Akro-Mils products deliver storage and organization solutions in a wide variety of applications, from creating assembly line workstations to organizing medical supplies and retail displays. Emphasis is placed on product bundling and customizing systems to create specific storage and organization configurations for customers’ operations.
Jamco Products is well established in industrial and commercial markets with its wide selection of welded steel service carts, platform trucks, mobile work centers, racks and cabinets for plastic bins, safety cabinets, medical cylinder carts and more. Jamco Products’ strong product offering, relationships with industrial distributors and reputation for quality and service complements Myers Industries' existing Material Handling businesses.
Ameri-Kart is an industry leading manufacturer and thermoformer of rotational-molded water, fuel and waste handling tanks, plastic trim and interior parts used in the production of seat components, consoles, and other applications throughout the recreational vehicle, marine, and industrial markets. In addition to standard marine parts, Ameri-Kart is well respected within the marine market for its patented Enviro-Fill® overfill prevention system (“OPS”) technology and is the industry’s only turnkey provider of an integrated, Environmental Protection Agency (“EPA”)-compliant marine fuel tank and patented Enviro-Fill diurnal system.
Scepter is a leading producer of portable plastic fuel containers, portable marine fuel tanks and water containers, ammunition containers and storage totes. Scepter was the first provider of Jerry Cans to North America which offer safe, reliable transportation and storage of fuel for the consumer market. Scepter also manufactures a variety of molded products for military applications from high quality containers to safely store and transport large caliber ammunition, to military specified portable fuel and water canisters. Scepter's in-house product engineering and state of the art mold capabilities complements Myers Industries' Material Handling Segment through an increased product offering and global reach.
Distribution Segment
Our Distribution Segment includes the Myers Tire Supply®, Myers Tire Supply International™ and Patch Rubber Company® brands. Within the Distribution Segment we source and manufacture top of the line products for the tire, wheel and undervehicle service industry.
Myers Tire Supply is the largest U.S. distributor and single source for tire, wheel and undervehicle service tools, equipment and supplies. We buy and sell approximately 13,500 different items — everything that professionals need to service passenger, truck and off-road tires, wheels and related components. Independent tire dealers, mass merchandisers, commercial auto and truck fleets, auto dealerships, tire retreaders and general repair facilities rely on our broad product selection, rapid availability and personal service to be more productive and profitably grow their business. Myers Tire Supply International further distributes these product offerings in Central America, through its branch offices, and to other foreign countries, through its U.S. export business.
While the needs and composition of our distribution markets constantly change, we adapt and deliver new products and services that are crucial to our customers’ success. The new product pipeline is driven by a thorough understanding of the market and its customers' needs. Myers Tire Supply in turn works closely with its suppliers to develop innovative products and services to meet these needs.
Patch Rubber Company manufactures one of the most comprehensive lines of tire repair and retreading products in the United States. Service professionals rely on our extensive product selection and quality for safe, cost-effective repairs to passenger, truck and off-road tires. Products include the plug that fills a puncture, the cement that seals the plug, the tire innerliner patch and the final sealing compound. Patch brand repair products maintain a strong position in the tire service markets including sales through the Myers Tire Supply sales network. Patch Rubber also employs its rubber calendering and compounding expertise to create a diverse portfolio of products outside of the tire repair market, such as reflective highway marking tapes. Our rubber-based tape and symbols provide the durability and brightness that construction professionals demand to replace paint for marking road repair, intersections and hazardous areas. Compared with traditional highway paint, the tape stock is easier to apply, more reflective and longer lasting.
4
The Company purchases substantially all of its raw materials from a wide range of third-party suppliers. These materials are primarily polyethylene, polypropylene, and polystyrene plastic resins, all used within the Material Handling Segment, as well as synthetic and natural rubber. Most raw materials are commodity products and available from several domestic suppliers. We believe that the loss of any one supplier or group of suppliers would not have a material adverse effect on our business.
Our Distribution Segment purchases substantially all of its components from third-party suppliers and has multiple sources for its products.
Competition
Competition in our Material Handling Segment is substantial and varied in form and size from manufacturers of similar products and of other products which can be substituted for those produced by the Company. In general, most direct competitors with the Company’s brands are private entities. Myers Industries maintains strong brand presence and market positions in the niche sectors of the markets it serves. The Company does not command substantial, overall market presence in the broad market sectors.
Competition in our Distribution Segment is generally comprised of small companies, regional players and national auto parts chains where product offerings may overlap. Within the overall tire, wheel and undervehicle service market, Myers Industries is the largest U.S. distributor of tools, equipment and supplies offered based on national coverage.
Customer Dependence
In 2017, 2016 and 2015, there were no customers that accounted for more than five percent of total net sales from continuing operations. Myers Industries serves thousands of customers who demand value through product selection, innovation, quality, delivery and responsive personal service. Our brands foster satisfied, loyal customers who have recognized our performance through numerous supplier quality awards.
Employees
As of December 31, 2017, Myers Industries had a total of approximately 1,900 full-time and part-time employees. Of these, approximately 1,335 were employed in the Company’s Material Handling Segment and the Distribution Segment employed approximately 515. The Company’s corporate offices had approximately 50 employees.
As of December 31, 2017, the Company had approximately 140 employees represented by a labor union. The collective bargaining agreement between us and the labor union expires June 2019. We consider our relationship with our employees generally to be satisfactory.
Backlog
The backlog of orders for our operations is estimated to have been approximately $54 million at December 31, 2017 and approximately $31 million at December 31, 2016. Generally, our lead time between customer order and product delivery is less than 90 days, and thus our estimated backlog is substantially expected to be delivered within the succeeding three months. During periods of shorter lead times, backlog may not be a meaningful indicator of future sales. Accordingly, we do not believe our backlog data and comparisons thereof, as of different dates, reliably indicate future sales or shipments.
|
|
(d) |
Financial Information About Geographic Areas |
The response to this section of Item 1 is contained in the Industry Segments footnote of the Notes to Consolidated Financial Statements under Item 8 of this report.
|
|
(e) |
Available Information |
Filings with the SEC. As a public company, we regularly file reports and proxy statements with the Securities and Exchange Commission ("SEC"), such as:
|
|
• |
annual reports on Form 10-K; |
|
|
• |
quarterly reports on Form 10-Q; |
5
|
|
• |
proxy statements on Schedule 14A. |
Anyone may read and copy any of the materials we file with the SEC at its Public Reference Room at 100 F Street, N.E., Washington, DC 20549. Information regarding operations of the Public Reference Room may also be obtained by calling the SEC at 1-800-SEC-0330. The SEC also maintains an internet website that contains our reports, proxy and information statements, and our other SEC filings; the address of that site is http://www.sec.gov.
Also, we make our SEC filings available free of charge on our own internet site as soon as reasonably practicable after we have filed with the SEC. Our internet address is http://www.myersindustries.com. The content on the Company’s website is available for informational purposes only and is not incorporated by reference into this Form 10-K.
Corporate Governance. We have a Code of Business Conduct for our employees and members of our Board of Directors. A copy of this Code is posted on our website in the section titled “Investor Relations”. We will satisfy any disclosure requirement under Item 5.05 of Form 8-K regarding an amendment to, or waiver from, any provision of this Code with respect to our executive officers or directors by disclosing the nature of that amendment or waiver.
Our website also contains additional information about our corporate governance policies, including the charters of our standing board committees. Any of these items are available in print to any shareholder who requests them. Requests should be sent to Corporate Secretary, Myers Industries, Inc., 1293 S. Main Street, Akron, Ohio 44301.
This Form 10-K and the information we are incorporating by reference contain forward-looking statements within the meaning of federal securities laws, including information regarding the Company’s financial outlook, future plans, objectives, business prospects and anticipated financial performance. You can identify these statements by the fact that they include words such as “will,” “believe,” “anticipate,” “expect,” “estimate,” “intend,” “plan,” or variations of these words, or similar expressions. These forward-looking statements are not statements of historical facts and represent only our current expectations regarding such matters. These statements inherently involve a wide range of known and unknown uncertainties. The Company’s actual actions and results could differ materially from what is expressed or implied by these statements. Specific factors that could cause such a difference include those set forth below and other important factors disclosed previously and from time to time in our other filings with the Securities and Exchange Commission. Given these factors, as well as other variables that may affect our operating results, you should not rely on forward-looking statements, assume that past financial performance will be a reliable indicator of future performance, nor use historical trends to anticipate results or trends in future periods. We expressly disclaim any obligation or intention to provide updates to the forward-looking statements and the estimates and assumptions associated with them.
Risks and uncertainties that could cause actual results to differ materially from those expressed or implied in the applicable statements include:
Any significant increase in the cost of raw materials or disruption in the availability of raw materials could adversely affect our performance.
Our ability to manage our cost structure can be adversely affected by movements in commodity and other raw material prices. Our primary raw materials include plastic resins, colorants and natural and synthetic rubbers. Plastic resins in particular are subject to substantial short term price fluctuations, including those arising from supply shortages and changes in the price of natural gas, crude oil and other petrochemical intermediates from which resins are produced, as well as other factors. Over the past several years, we have at times experienced rapidly increasing resin prices. The Company’s revenue and profitability may be materially and adversely affected by these price fluctuations.
Market conditions may limit our ability to raise selling prices to offset increases in our raw material input costs. If we are unsuccessful in developing ways to mitigate raw material cost increases, we may not be able to improve productivity or realize our ongoing cost reduction programs sufficiently to help offset the impact of these increased raw material costs. As a result, higher raw material costs could result in declining margins and operating results.
Changes in raw material availability may also occur due to events beyond our control, including natural disasters such as floods, tornadoes and hurricanes. Our specific molding technologies and/or product specifications can limit our ability to locate alternative suppliers to produce certain products.
6
We may incur inherent risks and may not achieve anticipated benefits associated with our strategic growth initiatives.
Our growth initiatives include internal growth driven by strong brands and new product innovation; development of new, high-growth markets and expansion in existing niche markets; strengthened customer relationships through value-added initiatives and key product partnerships; investments in new technology and processes to reinforce market strength and capabilities in key business groups; consolidation and rationalization activities to further reduce costs and improve productivity within our manufacturing and distribution footprint; an opportunistic and disciplined approach to strategic acquisitions to accelerate growth in our market positions; and potential divestitures of businesses with non-strategic products or markets.
While this is a continuous process, all of these activities and initiatives have inherent risks and there remain significant challenges and uncertainties, including economic and general business conditions that could limit our ability to achieve anticipated benefits associated with announced strategic initiatives and affect our financial results. We may not achieve any or all of these goals and are unable to predict whether these initiatives will produce significant revenues or profits.
We may not realize the improved operating results that we anticipate from past acquisitions or from acquisitions we may make in the future and we may experience difficulties in integrating the acquired businesses or may inherit significant liabilities related to such businesses.
We explore opportunities to acquire businesses that we believe are related to the execution of the Company’s long-term strategy, with a focus on, among other things, asset light business models, flexible operations, and penetration of niche markets. Some of these acquisitions may be material to us. We expect such acquisitions will produce operating results consistent with our other operations and fit within our strategic goals; however, we may be unable to achieve the benefits expected to be realized from our acquisitions. In addition, we may incur additional costs and our management’s attention may be diverted because of unforeseen expenses, difficulties, complications, delays and other risks inherent in acquiring businesses, including the following:
|
|
• |
we may have difficulty integrating the acquired businesses as planned, which may include integration of systems of internal controls over financial reporting and other financial and administrative functions; |
|
|
• |
we may have delays in realizing the benefits of our strategies for an acquired business; |
|
|
• |
the increasing demands on our operational systems and integration costs, including diversion of management’s time and attention, may be greater than anticipated; |
|
|
• |
we may not be able to retain key employees necessary to continue the operations of an acquired business; |
|
|
• |
acquisition costs may be met with cash or debt, increasing the risk that we will be unable to satisfy current financial obligations; and |
|
|
• |
acquired companies may have unknown liabilities that could require us to spend significant amounts of additional capital. |
Our results of operations and financial condition could be adversely affected by a downturn in the general markets or the general economic environment.
We operate in a wide range of geographies, primarily North America and Central America, and, until the divesture of our Brazil Business in the fourth quarter of 2017, South America. Additionally, some of our end markets are cyclical, and some of our products are a capital expense for our customers. Worldwide and regional economic, business and political conditions, including changes in the economic conditions of the broader markets and in our individual niche markets, could have an adverse effect on one or both of our operating segments.
We operate in a very competitive business environment.
Both of our segments participate in markets that are highly competitive. We compete primarily on the basis of product quality, product performance, value, and supply chain competency. Our competitive success also depends on our ability to maintain strong brands, customer relationships and the belief that customers will need our products and services to meet their growth requirements. The development and maintenance of such brands requires continuous investment in brand building, marketing initiatives and advertising. The competition that we face in all of our markets — which varies depending on the particular business segment, product lines and customers — may prevent us from achieving sales, product pricing and income goals, which could affect our financial condition and results of operations.
7
Our operations depend on our ability to maintain continuous, uninterrupted production at our manufacturing facilities, which are subject to physical and other risks that could disrupt production.
We are subject to inherent risks in our diverse manufacturing and distribution activities, including, but not limited to: product quality, safety, licensing requirements and other regulatory issues, environmental events, loss or impairment of key manufacturing or distribution sites, disruptions in logistics and transportation services, labor disputes and industrial accidents. While we maintain insurance covering our manufacturing and production facilities, including business interruption insurance, a catastrophic loss of the use of all or a portion of our facilities due to accident, fire, explosion, or natural disaster, whether short or long-term, could have a material adverse effect on our business, financial condition and results of operations.
Unexpected failures of our equipment and machinery may also result in production delays, revenue loss and significant repair costs, as well as injuries to our employees. Any interruption in production capability may require us to make large capital expenditures to remedy the situation, which could have a negative impact on our profitability and cash flows. Our business interruption insurance may not be sufficient to offset the lost revenues or increased costs that we may experience during a disruption of our operations. A temporary or long-term business disruption could result in a permanent loss of customers. If this were to occur, our future sales levels, and therefore our profitability, could be materially adversely affected.
We derive a portion of our revenues from direct and indirect sales outside the United States and are subject to the risks of doing business in foreign countries.
We currently operate manufacturing, sales and service facilities outside of the United States, particularly in Canada and Central America. For the year ended December 31, 2017, international net sales accounted for approximately 10% of our total net sales from continuing operations. Accordingly, we are subject to risks associated with operations in foreign countries, including:
|
|
• |
fluctuations in currency exchange rates; |
|
|
• |
limitations on the remittance of dividends and other payments by foreign subsidiaries; |
|
|
• |
limitations on foreign investment; |
|
|
• |
additional costs of compliance with local regulations; and |
|
|
• |
in certain countries, higher rates of inflation than in the United States. |
In addition, our operations outside the United States are subject to the risk of new and different legal and regulatory requirements in local jurisdictions, potential difficulties in staffing and managing local operations and potentially adverse tax consequences. The costs related to our international operations could adversely affect our operations and financial results in the future.
Our future performance depends in part on our ability to develop and market new products if there are changes in technology, regulatory requirements or competitive processes.
Changes in technology, regulatory requirements and competitive processes may render certain products obsolete or less attractive. Our performance in the future will depend in part on our ability to develop and market new products that will gain customer acceptance and loyalty, as well as our ability to adapt our product offerings and control our costs to meet changing market conditions. Our operating performance would be adversely affected if we were to incur delays in developing new products or if such products did not gain market acceptance. There can be no assurance that existing or future products will be sufficiently successful to enable us to effectively compete in our markets or, should new product offerings meet with significant customer acceptance, that one or more current or future competitors will not introduce products that render our products noncompetitive.
We may not be successful in protecting our intellectual property rights, including our unpatented proprietary know-how and trade secrets, or in avoiding claims that we infringed on the intellectual property rights of others.
In addition to relying on patent and trademark rights, we rely on unpatented proprietary know-how and trade secrets and employ various methods, including confidentiality agreements with employees and consultants, to protect our know-how and trade secrets. However, these methods and our patents and trademarks may not afford complete protection and there can be no assurance that others will not independently develop the know-how and trade secrets or develop better production methods than us. Further, we may not be able to deter current and former employees, contractors and other parties from breaching confidentiality agreements and misappropriating proprietary information and it is possible that third parties may copy or otherwise obtain and use our information and proprietary technology without authorization or otherwise infringe on our intellectual property rights. Additionally, in the future we may license patents, trademarks, trade secrets and similar proprietary rights to third parties. While we attempt to ensure that our intellectual property and similar proprietary rights are protected when entering into business relationships, third parties may take
8
actions that could materially and adversely affect our rights or the value of our intellectual property, similar proprietary rights or reputation. In the future, we may also rely on litigation to enforce our intellectual property rights and contractual rights and, if not successful, we may not be able to protect the value of our intellectual property. Furthermore, no assurance can be given that we will not be subject to claims asserting the infringement of the intellectual property rights of third parties seeking damages, the payment of royalties or licensing fees and/or injunctions against the sale of our products. Any litigation could be protracted and costly and could have a material adverse effect on our business and results of operations regardless of its outcome.
If we are unable to maintain access to credit financing, our business may be adversely affected.
The Company’s ability to make payments and to refinance our indebtedness, fund planned capital expenditures and acquisitions and pay dividends will depend on our ability to generate cash in the future and retain access to credit financing. This, to some extent, is subject to general economic, financial, competitive, legislative, regulatory and other factors that are beyond our control.
We cannot provide assurance that our business will generate sufficient cash flow from operating activities or that future borrowings will be available to us under our credit facilities in amounts sufficient to enable us to service debt, make necessary capital expenditures or fund other liquidity needs. We may need to refinance all or a portion of our indebtedness, on or before maturity. We cannot be sure that we would be able to refinance any of our indebtedness on commercially reasonable terms or at all.
The credit facilities contain restrictive covenants and cross default provisions that require us to maintain specified financial ratios. The Company’s ability to satisfy those financial ratios can be affected by events beyond our control, and we cannot be assured we will satisfy those ratios. A breach of any of those financial ratio covenants or other covenants could result in a default. Upon the occurrence of an event of default, the lenders could elect to declare the applicable outstanding indebtedness due immediately and payable and terminate all commitments to extend further credit. We cannot be sure that our lenders would waive a default or that we could pay the indebtedness in full if it were accelerated.
If we fail to maintain an effective system of internal control over financial reporting, we may not be able to accurately report our financial results. As a result, current and potential shareholders could lose confidence in our financial reporting, which would harm our business and the trading price of our common stock.
Internal control systems are intended to provide reasonable assurance regarding the preparation and fair presentation of published financial statements. Any failure to maintain effective controls or implement required new or improved controls could cause us to fail to meet our periodic reporting obligations or result in material misstatements in our Consolidated Financial Statements, and substantial costs and resources may be required to rectify these internal control deficiencies. If we have an internal control deficiency and our remedial measures are insufficient, material weaknesses or significant deficiencies in our internal control over financial reporting could be discovered or occur in the future, and our consolidated financial statements may contain material misstatements. See Item 9A – Controls and Procedures for further discussion.
We may be subject to risks relating to our information technology systems.
We rely on information technology systems to process, transmit and store electronic information and manage and operate our business. Such systems are vulnerable to damage or interruption from natural disasters, power loss, telecommunication failures, computer viruses, computer denial-of-service attacks, unauthorized intrusion, and other events, any of which could interrupt our business operations. While we have implemented security measures designed to prevent and mitigate the risk of breaches, information security risks have generally increased in recent years because of the proliferation of new technologies and the increased sophistication and activities of perpetrators of cyber-attacks. A failure in or a breach of security could expose us and our customers and suppliers to risks of misuse of confidential information, manipulation and destruction of data, production downtimes and operations disruptions, which in turn could negatively affect our reputation, competitive position, business, results of operations or cash flows. Furthermore, because the techniques used to carry out cyber-attacks change frequently and in many instances are not recognized until after they are used against a target, we may be unable to anticipate these changes or implement adequate preventative measures.
Future claims, litigation and regulatory actions could adversely affect our financial condition and our ability to conduct our business.
The nature of our business exposes us, from time to time, to breach of contract, warranty or recall claims, or claims for negligence, product liability, strict liability, personal injury or property damage claims. While we strive to ensure that our products comply with applicable government regulatory standards and internal requirements and that our products perform effectively and safely, customers from time to time could claim that our products do not meet contractual requirements, and users could be harmed by use or misuse of our products. This could give rise to breach of contract, warranty or recall claims, or claims for negligence, product liability, strict liability, personal injury or property damage. Such claims can be expensive to defend and may divert the attention of management for
9
significant time periods. While we currently maintain what we believe to be a suitable and adequate product liability insurance, product liability insurance coverage may not be available or adequate in all circumstances and such claims may increase the cost of such insurance coverage. In addition, claims may arise related to patent infringement, environmental liabilities, distributor terminations, commercial contracts, antitrust or competition law, employment law and employee benefits issues and other regulatory matters. While we have in place processes and policies to mitigate these risks and to investigate and address such claims as they arise, we cannot predict the underlying costs to defend or resolve such claims.
Current and future environmental and other governmental laws and requirements could adversely affect our financial condition and our ability to conduct our business.
Our operations are subject to federal, state, local and foreign environmental laws and regulations that impose limitations on the discharge of pollutants into the air and water and establish standards for the handling, use, treatment, storage and disposal of, or exposure to, hazardous wastes and other materials and require clean-up of contaminated sites. Some of these laws and regulations require us to obtain permits, which contain terms and conditions that impose limitations on our ability to emit and discharge hazardous materials into the environment and periodically may be subject to modification, renewal and revocation by issuing authorities. Fines, penalties and other civil or criminal sanctions may be imposed for non-compliance with applicable environmental laws and regulations and the failure to have or to comply with the terms and conditions of required permits. Certain environmental laws in the United States, such as the federal Superfund law and similar state laws, impose liability for the cost of investigation or remediation of contaminated sites upon the current or, in some cases, the former site owners or operators (or their predecessor entities) and upon parties who arranged for the disposal of wastes or transported or sent those wastes to an off-site facility for treatment or disposal, regardless of when the release of hazardous substances occurred or the lawfulness of the activities giving rise to the release. Such liability can be imposed without regard to fault and, under certain circumstances, can be joint and several, resulting in one party being held responsible for the entire obligation.
While we have not been required historically to make significant capital expenditures in order to comply with applicable environmental laws and regulations, we cannot predict with any certainty our future capital expenditure requirements because of continually changing compliance standards and environmental technology. Furthermore, violations or contaminated sites that we do not know about, including contamination caused by prior owners and operators of such sites, or at sites formerly owned or operated by us or our predecessors in connection with discontinued operations, could result in additional compliance or remediation costs or other liabilities, which could be material.
As more fully described in Item 3, “Legal Proceedings,” below, we are a potentially responsible party (“PRP”) in an environmental proceeding and remediation matter in which substantial amounts may be involved. It is possible that adjustments to reserved expenses will be necessary as new information is obtained. Estimates of our liability are based on current facts, laws, regulations and technology. Estimates of our environmental liabilities are further subject to uncertainties regarding the negotiations with the U.S. Environmental Protection Agency (“EPA”), the nature and extent of site contamination, the range of remediation alternatives available, evolving remediation standards, imprecise engineering evaluation and cost estimates, the extent of remedial actions that may be required, the number and financial condition of other PRPs that may be named as well as the extent of their responsibility for the remediation, and the availability of insurance coverage for these expenses. At this time, we have not accrued for such remediation costs as we are unable to estimate the liability at this time. Additionally, we are party to a consent decree regarding another location pursuant to which we are required to contribute to the costs of the remediation project.
We have limited insurance coverage for potential environmental liabilities associated with historic and current operations and we do not anticipate increasing such coverage in the future. We may also assume significant environmental liabilities in acquisitions. Such costs or liabilities could adversely affect our financial situation and our ability to conduct our business.
Environmental regulations specific to plastic products and containers could adversely affect our ability to conduct our business.
Federal, state, local and foreign governments could enact laws or regulations concerning environmental matters that increase the cost of producing, or otherwise adversely affect the demand for, plastic products. Legislation that would prohibit, tax or restrict the sale or use of certain types of plastic and other containers, and would require diversion of solid wastes such as packaging materials from disposal in landfills, has been or may be introduced in the U.S. Congress, in state legislatures and other legislative bodies. While container legislation has been adopted in a few jurisdictions, similar legislation has been defeated in public referenda in several states, local elections and many state and local legislative sessions. There can be no assurance that future legislation or regulation would not have a material adverse effect on us. Furthermore, a decline in consumer preference for plastic products due to environmental considerations could have a negative effect on our business.
10
Our insurance coverage may be inadequate to protect against potential hazardous incidents to our business.
We maintain property, business interruption, product liability and casualty insurance coverage, but such insurance may not provide adequate coverage against potential claims, including losses resulting from war risks, terrorist acts or product liability claims relating to products we manufacture. Consistent with market conditions in the insurance industry, premiums and deductibles for some of our insurance policies have been increasing and may continue to increase in the future. In some instances, some types of insurance may become available only for reduced amounts of coverage, if at all. In addition, there can be no assurance that our insurers would not challenge coverage for certain claims. If we were to incur a significant liability for which we were not fully insured or that our insurers disputed, it could have a material adverse effect on our financial position, results of operations or cash flows.
Our business operations could be significantly disrupted if members of our senior management team were to leave.
Our success depends to a significant degree upon the continued contributions of our senior management team. Our senior management team has extensive marketing, sales, manufacturing, finance and engineering experience, and we believe that the depth of our management team is instrumental to our continued success. The loss of any of our key executive officers in the future could significantly impede our ability to successfully implement our business strategy, financial plans, expansion of services, marketing and other objectives.
Unforeseen future events may negatively impact our economic condition.
Future events may occur that would adversely affect the reported value of our assets. Such events may include, but are not limited to, strategic decisions made in response to changes in economic and competitive conditions, the impact of the economic environment on our customer base, a material adverse change in our relationship with significant customers, or natural disasters or other catastrophic events beyond our control. Any of these events may adversely affect our financial condition and results of operations.
Equity Ownership Concentration
Based solely on the Schedule 13D filed on November 17, 2017, by Gabelli Funds, LLC, GAMCO Asset Management Inc., MJG Associates, Inc., Gabelli & Company Investment Advisors, Inc., Teton Advisors, Inc., Gabelli Foundation, Inc., GGCP, Inc., and GAMCO Investors, Inc., (collectively, the “Gamco Group”), for which the Company disclaims any responsibility, beneficially owned 6,807,576 shares of our common stock, which represented approximately 22% of the 30,301,721 shares outstanding as reported in our Form 10-Q for the quarterly period ended September 30, 2017. Combined, these parties may have sufficient voting power to influence actions requiring the approval of our shareholders.
Changes in laws and regulations may have an adverse impact on our operations.
Changes in laws and regulations and approvals and decisions of courts, regulators, and governmental bodies on any legal claims known or unknown, could have an adverse effect on the Company’s financial results. In late 2017, the United States federal government U.S. tax reform legislation commonly referred to as the U.S. Tax Cuts and Jobs Act of 2017 (the “Tax Act”) was enacted. The Tax Act significantly changes how the U.S. taxes corporations. The Tax Act requires complex computations to be performed that were not previously required in U.S. tax law, significant judgements to be made in interpretation of the provisions of the Tax Act and significant estimates in calculations, and the preparation and analysis of information not previously relevant or regularly produced. The U.S. Treasury Department, the IRS, and other standard-setting bodies could interpret or issue guidance on how provisions of the Tax Act will be applied or otherwise administered that is different from our interpretation. As we complete our analysis of the Tax Act, collect and prepare necessary data, and interpret any additional guidance, we may make adjustments to provisional amounts that we have recorded that may materially impact our provision for income taxes in the period in which the adjustments are made. Given the timing, scope, and magnitude of the changes enacted by the Tax Act, along with on-going implementation efforts, guidance, and other developments from U.S. regulatory and standard-setting bodies, the completion of the accounting for certain tax items included in the consolidated financial statements that have been reported as provisional, may be subject to material change. Any significant changes to our future effective tax rate, including final resolution of provisional amounts relating to effects of the Tax Act, may result in a material adverse effect on our business, financial condition, results of operations, or cash flows.
None.
11
The following table sets forth certain information with respect to properties owned by the Company:
|
|
|
Distribution |
|
|
|
|||||
|
Location |
|
Approximate Floor Space (Square Feet) |
|
|
Approximate Land Area (Acres) |
|
|
Use |
||
|
Akron, Ohio |
|
|
129,000 |
|
|
|
8 |
|
|
Headquarters and distribution center |
|
Akron, Ohio |
|
|
67,000 |
|
|
|
5 |
|
|
Administration and warehousing |
|
Wadsworth, Ohio |
|
|
125,000 |
|
|
|
12 |
|
|
Distribution center |
|
Pomona, California |
|
|
18,000 |
|
|
|
1 |
|
|
Sales and distribution center |
|
|
|
|
|
|
|
|
|
|
|
|
|
|
|
Manufacturing |
|
|
|
|||||
|
Miami, Oklahoma |
|
|
330,000 |
|
|
|
16 |
|
|
Manufacturing and distribution |
|
Sandusky, Ohio |
|
|
305,000 |
|
|
|
8 |
|
|
Manufacturing and distribution |
|
Springfield, Missouri |
|
|
227,000 |
|
|
|
19 |
|
|
Manufacturing and distribution |
|
Wadsworth, Ohio |
|
|
197,000 |
|
|
|
23 |
|
|
Manufacturing and distribution |
|
Bristol, Indiana |
|
|
185,000 |
|
|
|
12 |
|
|
Manufacturing and distribution |
|
Roanoke Rapids, North Carolina |
|
|
172,000 |
|
|
|
20 |
|
|
Manufacturing and distribution |
|
Scarborough, Ontario |
|
|
170,000 |
|
|
|
8 |
|
|
Manufacturing and distribution |
The following table sets forth certain information with respect to facilities leased by the Company:
|
|
|
Manufacturing & Distribution |
|
|
||||
|
Location |
|
Approximate Floor Space (Square Feet) |
|
|
Expiration Date of Lease |
|
Use |
|
|
Cassopolis, Michigan |
|
|
210,000 |
|
|
October 31, 2018 |
|
Manufacturing and distribution |
|
South Beloit, Illinois |
|
|
160,000 |
|
|
September 30, 2018 |
|
Manufacturing and distribution |
|
Springfield, Missouri |
|
|
70,000 |
|
|
October 31, 2019 |
|
Warehousing |
|
Southaven, Mississippi |
|
|
56,000 |
|
|
September 30, 2023 |
|
Distribution center |
|
Salt Lake City, Utah |
|
|
30,000 |
|
|
October 31, 2023 |
|
Distribution center |
|
Milford, Ohio |
|
|
22,000 |
|
|
November 30, 2018 |
|
Administration and sales |
The Company also leases facilities for its sales offices and sales branches in the United States and Central America which, in the aggregate, amount to approximately 50,000 square feet of warehouse and office space. All of these locations are used by the Distribution Segment.
The Company believes that all of its properties, machinery and equipment generally are well maintained and adequate for the purposes for which they are used.
12
The Company is a defendant in various lawsuits and a party to various other legal proceedings, in the ordinary course of business, some of which are covered in whole or in part by insurance. We believe that the outcome of these lawsuits and other proceedings will not individually or in the aggregate have a future material adverse effect on our consolidated financial position, results of operations or cash flows.
New Idria Mercury Mine
In September 2015, the U.S. EPA formally informed a subsidiary of the Company, Buckhorn, Inc. (“Buckhorn”) via a notice letter and related documents (the “Notice Letter”) that it considers Buckhorn to be a potentially responsible party (“PRP”) in connection with the New Idria Mercury Mine Superfund site (“New Idria Mine”). New Idria Mining & Chemical Company (“NIMCC”), which owned and/or operated the New Idria Mine from 1936 through 1976 was merged into Buckhorn Metal Products Inc. in 1981, which was subsequently acquired by Myers Industries in 1987. As a result of the EPA Notice Letter, Buckhorn and the Company have been engaged in negotiations with the EPA with respect to a draft Settlement Agreement and Administrative Order on Consent (“AOC”) proposed by the EPA for the Remedial Investigation/Feasibility Study (“RI/FS”) to determine the extent of remediation necessary and the screening of alternatives.
The Company and the EPA are in the final stages of negotiation on the AOC and related Statement of Work (“SOW”) with regards to the New Idria Mine, and the Company expects to execute the AOC in March 2018. The key terms of the AOC and SOW include, but are not limited to, scope of the site, categories of and schedules for completion of required tasks, administration of future oversight costs, stipulated penalties, and resolution of any disputed items between the parties. As a result of recent negotiations, the Company recognized expected future EPA oversight costs for the RI/FS of $1 million in 2017. In addition, the AOC will require the Company to provide $2 million of financial assurance to the EPA during the estimated three year life of the RI/FS. Per federal statutes, this financial assurance can take several forms, including a financial guarantee by the Company, a letter of credit, or a surety bond. The Company expects to provide this assurance within 30 days following the execution of the AOC, and is currently evaluating the options available under the statute.
The New Idria Mine is located near Hollister, California and was added to the Superfund National Priorities List by the EPA in October 2011, at which time the Company recognized expense of $1.9 million related to performing the RI/FS. In the second quarter of 2016, the Company, based on discussions with the EPA, determined that the RI/FS would begin in 2017 and therefore obtained updated estimated costs to perform the RI/FS. As a result of the updated estimated costs, the Company recorded additional expense of $1.0 million in the second quarter of 2016. In the second quarter of 2017, the Company, based on the status of its discussions with the EPA, determined that field work on the RI/FS would likely begin in 2018 with no changes to the cost estimates to perform the RI/FS. In the third quarter of 2017, the Company recorded an additional reserve of $0.3 million for this project, as a result of additional professional fees and other project costs expected to be incurred as part of the implementation of the AOC and site preparation and stabilization, in advance of starting the RI/FS field work in 2018.
As part of the Notice Letter, the EPA also made a claim for approximately $1.6 million in past costs for actions it claims it has taken in connection with the New Idria Mine since 1993. While the Company is evaluating this past cost claim and may challenge portions of it, in 2015 the Company recognized an expense of $1.3 million related to the claim. These past costs will not be addressed or settled upon execution of the AOC discussed above.
As of December 31, 2017, the Company has a total reserve of $3.6 million related to the New Idria Mine.
As negotiations with the EPA proceed, it is possible that adjustments to the aforementioned reserves will be necessary to reflect new information. Estimates of the Company’s liability are based on current facts, laws, regulations and technology. Estimates of the Company’s environmental liabilities are further subject to uncertainties regarding the negotiations with EPA, the nature and extent of the specific tasks required in the RI/FS, the nature and extent of site contamination, the range of remediation alternatives available, evolving remediation standards, imprecise engineering evaluation and cost estimates, the extent of remedial actions that may be required, the number and financial condition of other PRPs that may be named as well as the extent of their responsibility for the remediation, and the availability of insurance coverage for these expenses.
At this time, we have not accrued for remediation costs in connection with this site as we are unable to estimate the liability, given the circumstances referred to above, including the fact that the final remediation strategy has not yet been determined.
13
New Almaden Mine (formerly referred to as Guadalupe River Watershed)
A number of parties, including the Company and its subsidiary, Buckhorn (as successor to NIMCC), were alleged by trustee agencies of the United States and the State of California to be responsible for natural resource damages due to environmental contamination of areas comprising the historical New Almaden mercury mines located in the Guadalupe River Watershed region in Santa Clara County, California (“County”). In 2005, Buckhorn and the Company, without admitting liability or chain of ownership of NIMCC, resolved the trustees’ claim against them through a consent decree that required them to contribute financially to the implementation by the County of an environmentally beneficial project within the impacted area. Buckhorn and the Company negotiated an agreement with the County, whereby Buckhorn and the Company agreed to reimburse one-half of the County’s costs of implementing the project, originally estimated to be approximately $1.6 million. As a result, in 2005, the Company recognized expense of $0.8 million representing its share of the initial estimated project costs, of which approximately $0.5 million has been paid to date. In April 2016, the Company was notified by the County that the original cost estimate may no longer be appropriate due to expanded scope and increased costs of construction, and provided a revised estimate of between $3.3 million and $4.4 million. The Company completed a detailed review of the support provided by the County for their revised estimate, and as a result, recognized additional expense of $1.2 million in the second and third quarters of 2016. As of December 31, 2017, the Company has a total reserve of $1.5 million related to the New Almaden Mine.
The project has not yet been implemented though significant work on design and planning has been performed. Field work on the project is expected to commence in 2018. As work on the project occurs, it is possible that adjustments to the aforementioned reserves will be necessary to reflect new information. In addition, the Company may have claims against and defenses to claims by the County under the 2005 agreement that could reduce or offset its obligation for reimbursement of some of these potential additional costs. With the assistance of environmental consultants, the Company will closely monitor this matter and will continue to assess its reserves as additional information becomes available.
Lawn and Garden Indemnification Claim
In connection with the sale of the Lawn and Garden business, as described in Note 4, the Company received Notices of Indemnification Claims in April 2015 and July 2016 (collectively, the “Claims”), alleging breaches of certain representations and warranties under the agreement resulting in alleged losses in the amount of approximately $10 million. As described in Note 4, approximately $8.6 million of the sale proceeds that were placed in escrow were due to be released in August 2016, but continue in escrow until the Claims are resolved, which are the subject of a lawsuit in the Delaware Chancery Court.
In December 2017, the Delaware Chancery Court issued a non-final opinion in favor of the L&G Buyer that it is entitled to a distribution of the escrow property on technical grounds, without resolving the merits of the alleged breaches that are the subject of the Claims. The Company intends to appeal this decision, and has the right to a de novo review and believes it has meritorious grounds to reverse the decision. The Company also believes that it has meritorious defenses to the L&G Buyer’s Claims and will vigorously defend its position that it is entitled to the escrow property.
Other
Buckhorn and Schoeller Arca Systems, Inc. (“SAS”) were plaintiffs in a patent infringement lawsuit against Orbis Corp. and Orbis Material Handling, Inc. (“Orbis”) for alleged breach by Orbis of an exclusive patent license agreement from SAS to Buckhorn. SAS is an affiliate of Schoeller Arca Systems Services B.V. (“SASS B.V.”), a Dutch company. SAS manufactures and sells plastic returnable packaging systems for material handling. In the course of the litigation, it was discovered that SAS had given a patent license agreement to a predecessor of Orbis that pre-dated the one that SAS sold to Buckhorn. As a result, judgment was entered in favor of Orbis, and the court awarded attorney fees and costs to Orbis in the amount of $3.1 million, plus interest and costs.
In May 2014, Orbis made demand to SAS that SAS pay the judgment in full, and subsequently in July 2014, Orbis made the same demand to Buckhorn. Buckhorn believed it was not responsible for any of the judgment because it was not a party to the Orbis license. Despite this belief, the Company recorded expense of $3.0 million in 2014 for the entire amount of the unpaid judgment. The United States Court of Appeals for the Federal Circuit reversed the judgment against Buckhorn on July 2, 2015, and found that Buckhorn was not liable to Orbis for any portion of the judgment entered in favor of Orbis. Accordingly, Myers reversed the accrual of $3.0 million in 2015, which was reflected as a reduction of general and administrative expenses. The Federal Circuit Court of Appeals rejected Orbis' petition for rehearing and rehearing en banc. All opportunities for Orbis to appeal have expired. The United States District Court for the Southern District of Ohio has now released Buckhorn’s appellate bond. Buckhorn was also pursuing legal action against SAS and SASS B.V. for fraudulently selling an exclusive patent license they could not sell and related claims. In 2016, the Company settled with SAS and SASS B.V. in return for a payment to the Company of $0.2 million, which was recorded as a reduction in general and administrative expenses.
14
When a loss arising from these or other legal matters is probable and can reasonably be estimated, we record the amount of the estimated loss, or the minimum estimated liability when the loss is estimated using a range, and no point within the range is more probable of occurrence than another. As additional information becomes available, any potential liability related to these matters will be assessed and the estimates will be revised, if necessary.
Based on current available information, management believes that the ultimate outcome of these matters will not have a material adverse effect on our financial position, cash flows or overall trends in our results of operations. However, these matters are subject to inherent uncertainties, and unfavorable rulings could occur. If an unfavorable ruling were to occur, there exists the possibility of a material adverse impact on the financial position and results of operations of the period in which the ruling occurs, or in future periods.
EXECUTIVE OFFICERS OF THE REGISTRANT
Set forth below is certain information concerning the executive officers of the Registrant as of December 31, 2017. Executive officers are appointed annually by the Board of Directors.
|
Name |
|
Age |
|
Title |
|
R. David Banyard |
|
49 |
|
President and Chief Executive Officer |
|
Matteo Anversa |
|
46 |
|
Executive Vice President, Chief Financial Officer and Corporate Secretary |
|
Kevin L. Brackman |
|
45 |
|
Vice President, Chief Accounting Officer |
Mr. Banyard, President and Chief Executive Officer, was appointed to his current position on December 7, 2015. Formerly, Mr. Banyard served as the Group President, Fluid Handling Technologies at Roper Technologies where he led a diverse portfolio of companies serving a wide array of end markets. Prior to that, Mr. Banyard was with Danaher Corporation, where he held successive leadership roles during his six year tenure culminating with his leadership of the Vehicle Systems business unit of Kollmorgen, based in Stockholm, Sweden.
Mr. Anversa, Executive Vice President, Chief Financial Officer and Corporate Secretary, was appointed to his current position on December 1, 2016. Prior to that, he was with Fiat Chrysler Automobiles N.V., where he served as Vice President, Group Financial Planning and Analysis. Prior to that, Mr. Anversa was with General Electric Corporation, where he held successive leadership roles during his sixteen year tenure.
Mr. Brackman, Vice President, Chief Accounting Officer, was appointed to his current position on March 2, 2017. Previously, he served as Vice President, Corporate Controller, since joining the Company in March 2015 and also acted as Interim Chief Financial Officer and Corporate Secretary from March 18, 2016 until December 1, 2016. Prior to that, Mr. Brackman was with Ingersoll-Rand, where he held various finance leadership roles.
15
|
ITEM 5. |
Market for Registrant’s Common Stock and Related Stockholder Matters and Issuer Purchases of Equity Securities |
The Company’s common stock is traded on the New York Stock Exchange (ticker symbol MYE). The approximate number of shareholders of record at December 31, 2017 was 1,043. High and low stock prices and dividends for the last two years were:
|
2017 |
|
Sales Price |
|
|
|
|
|
|||||
|
Quarter Ended |
|
High |
|
|
Low |
|
|
Dividends |
|
|||
|
March 31 |
|
$ |
15.90 |
|
|
$ |
13.20 |
|
|
$ |
0.135 |
|
|
June 30 |
|
|
19.45 |
|
|
|
15.58 |
|
|
|
0.135 |
|
|
September 30 |
|
|
21.30 |
|
|
|
15.40 |
|
|
|
0.135 |
|
|
December 31 |
|
|
22.65 |
|
|
|
18.80 |
|
|
|
0.135 |
|
|
2016 |
|
Sales Price |
|
|
|
|
|
|||||
|
Quarter Ended |
|
High |
|
|
Low |
|
|
Dividends |
|
|||
|
March 31 |
|
$ |
13.22 |
|
|
$ |
10.12 |
|
|
$ |
0.135 |
|
|
June 30 |
|
|
15.76 |
|
|
|
12.23 |
|
|
|
0.135 |
|
|
September 30 |
|
|
15.86 |
|
|
|
12.84 |
|
|
|
0.135 |
|
|
December 31 |
|
|
15.55 |
|
|
|
11.35 |
|
|
|
0.135 |
|
Purchases of equity securities by the issuer
The following table presents information regarding the Company’s stock repurchase plan during the three months ended December 31, 2017.
|
|
|
Total Number of Shares Purchased |
|
|
Average Price Paid per Share |
|
|
Total Number of Shares Purchased as Part of the Publicly Announced Plans or Programs |
|
|
Maximum number of Shares that may yet be Purchased Under the Plans or Programs (1) |
|
||||
|
10/1/17 to 10/31/17 |
|
|
— |
|
|
$ |
— |
|
|
|
5,547,665 |
|
|
|
2,452,335 |
|
|
11/1/17 to 11/30/17 |
|
|
— |
|
|
|
— |
|
|
|
5,547,665 |
|
|
|
2,452,335 |
|
|
12/1/17 to 12/31/17 |
|
|
— |
|
|
|
— |
|
|
|
5,547,665 |
|
|
|
2,452,335 |
|
|
(1) |
On July 11, 2013, the Board authorized the repurchase of up to an additional five million shares of the Company’s common stock. This authorization was in addition to the 2011 Board authorized repurchase of up to five million shares. The Company completed the repurchase of approximately 2.0 million shares in 2011 pursuant to Rule 10b5-1 plans, which were adopted pursuant to the 2011 authorized share repurchase. |
See Item 12 of this Form 10-K for the Equity Compensation Plan Information Table which is incorporated herein by reference.
16
Comparison of 5 Year Cumulative Total Return
Assumes Initial Investment of $100
December 31, 2017
The chart below compares the Company’s cumulative total shareholder return for the five years ended December 31, 2017, to that of the Standard & Poor’s 500 Index – Total Return and the Russell 2000 Index. In all cases, the information is presented on a dividend-reinvested basis and assumes investment of $100 on December 31, 2012.
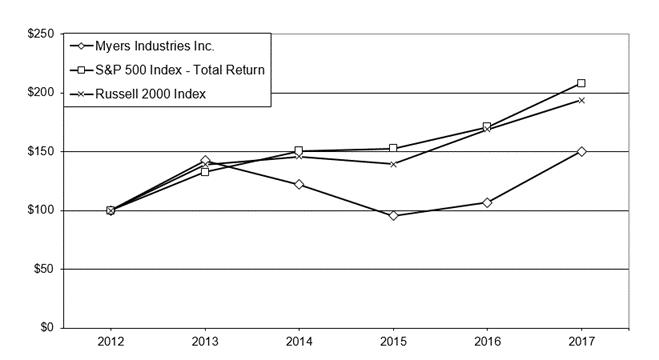
|
|
2012 |
|
|
2013 |
|
|
2014 |
|
|
2015 |
|
|
2016 |
|
|
2017 |
|
||||||
|
Myers Industries Inc. |
|
|
|
|
|
|
|
|
|
|
|
|
|
|
|
|
|
|
|
|
|
|
|
|
Annual Return % |
|
|
|
|
|
42.35 |
|
|
|
(14.36 |
) |
|
|
(21.65 |
) |
|
|
11.74 |
|
|
|
40.72 |
|
|
Cum $ |
|
100.00 |
|
|
|
142.35 |
|
|
|
121.91 |
|
|
|
95.52 |
|
|
|
106.73 |
|
|
|
150.20 |
|
|
S&P 500 Index - Total Return |
|
|
|
|
|
|
|
|
|
|
|
|
|
|
|
|
|
|
|
|
|
|
|
|
Annual Return % |
|
|
|
|
|
32.39 |
|
|
|
13.69 |
|
|
|
1.38 |
|
|
|
11.96 |
|
|
|
21.83 |
|
|
Cum $ |
|
100.00 |
|
|
|
132.39 |
|
|
|
150.51 |
|
|
|
152.59 |
|
|
|
170.84 |
|
|
|
208.14 |
|
|
Russell 2000 Index - Total Return |
|
|
|
|
|
|
|
|
|
|
|
|
|
|
|
|
|
|
|
|
|
|
|
|
Annual Return % |
|
|
|
|
|
38.82 |
|
|
|
4.89 |
|
|
|
(4.41 |
) |
|
|
21.31 |
|
|
|
14.65 |
|
|
Cum $ |
|
100.00 |
|
|
|
138.82 |
|
|
|
145.62 |
|
|
|
139.19 |
|
|
|
168.85 |
|
|
|
193.58 |
|
17
Thousands of Dollars, Except Per Share Data
|
|
|
2017 |
|
|
2016 |
|
|
2015 |
|
|
2014 |
|
|
2013 |
|
|||||
|
Operations for the Year (3) |
|
|
|
|
|
|
|
|
|
|
|
|
|
|
|
|
|
|
|
|
|
Net sales |
|
$ |
547,043 |
|
|
$ |
534,379 |
|
|
$ |
571,020 |
|
|
$ |
576,759 |
|
|
$ |
534,735 |
|
|
Cost of sales |
|
|
389,590 |
|
|
|
372,481 |
|
|
|
395,158 |
|
|
|
419,575 |
|
|
|
376,590 |
|
|
Selling expenses |
|
|
56,614 |
|
|
|
58,782 |
|
|
|
58,456 |
|
|
|
56,097 |
|
|
|
50,634 |
|
|
General and administrative expenses |
|
|
78,889 |
|
|
|
73,797 |
|
|
|
82,333 |
|
|
|
73,938 |
|
|
|
63,969 |
|
|
(Gain) loss on disposal of fixed assets |
|
|
(3,482 |
) |
|
|
628 |
|
|
|
556 |
|
|
|
(20 |
) |
|
|
(72 |
) |
|
Impairment charges |
|
|
544 |
|
|
|
1,329 |
|
|
|
— |
|
|
|
— |
|
|
|
— |
|
|
Loss on extinguishment of debt |
|
|
1,888 |
|
|
|
— |
|
|
|
— |
|
|
|
— |
|
|
|
— |
|
|
Interest, net |
|
|
7,292 |
|
|
|
8,643 |
|
|
|
9,009 |
|
|
|
8,570 |
|
|
|
4,512 |
|
|
Total costs and expenses |
|
|
531,335 |
|
|
|
515,660 |
|
|
|
545,512 |
|
|
|
558,160 |
|
|
|
495,633 |
|
|
Income from continuing operations before income taxes |
|
|
15,708 |
|
|
|
18,719 |
|
|
|
25,508 |
|
|
|
18,599 |
|
|
|
39,102 |
|
|
Income tax expense |
|
|
4,864 |
|
|
|
7,395 |
|
|
|
8,037 |
|
|
|
5,680 |
|
|
|
13,744 |
|
|
Income from continuing operations |
|
$ |
10,844 |
|
|
$ |
11,324 |
|
|
$ |
17,471 |
|
|
$ |
12,919 |
|
|
$ |
25,358 |
|
|
Income (loss) from discontinued operations, net of tax |
|
$ |
(20,733 |
) |
|
$ |
(10,267 |
) |
|
$ |
291 |
|
|
$ |
(21,600 |
) |
|
$ |
644 |
|
|
Net income (loss) |
|
$ |
(9,889 |
) |
|
$ |
1,057 |
|
|
$ |
17,762 |
|
|
$ |
(8,681 |
) |
|
$ |
26,002 |
|
|
Net income per basic share from continuing operations |
|
$ |
0.36 |
|
|
$ |
0.38 |
|
|
$ |
0.57 |
|
|
$ |
0.40 |
|
|
$ |
0.75 |
|
|
Net income per diluted share from continuing operations |
|
$ |
0.35 |
|
|
$ |
0.38 |
|
|
$ |
0.56 |
|
|
$ |
0.40 |
|
|
$ |
0.74 |
|
|
Net income (loss) per basic share from discontinued operations |
|
$ |
(0.69 |
) |
|
$ |
(0.35 |
) |
|
$ |
0.01 |
|
|
$ |
(0.67 |
) |
|
$ |
0.02 |
|
|
Net income (loss) per diluted share from discontinued operations |
|
$ |
(0.68 |
) |
|
$ |
(0.35 |
) |
|
$ |
0.01 |
|
|
$ |
(0.67 |
) |
|
$ |
0.02 |
|
|
Net income (loss) per basic share |
|
$ |
(0.33 |
) |
|
$ |
0.03 |
|
|
$ |
0.58 |
|
|
$ |
(0.27 |
) |
|
$ |
0.77 |
|
|
Net income (loss) per diluted share |
|
$ |
(0.33 |
) |
|
$ |
0.03 |
|
|
$ |
0.57 |
|
|
$ |
(0.27 |
) |
|
$ |
0.76 |
|
|
Financial Position — At Year End (3) |
|
|
|
|
|
|
|
|
|
|
|
|
|
|
|
|
|
|
|
|
|
Total assets(1) |
|
$ |
355,942 |
|
|
$ |
381,684 |
|
|
$ |
429,024 |
|
|
$ |
563,433 |
|
|
$ |
468,344 |
|
|
Current assets |
|
|
150,012 |
|
|
|
141,151 |
|
|
|
154,541 |
|
|
|
285,441 |
|
|
|
234,910 |
|
|
Current liabilities |
|
|
98,653 |
|
|
|
79,312 |
|
|
|
117,045 |
|
|
|
153,814 |
|
|
|
150,583 |
|
|
Working capital |
|
|
51,359 |
|
|
|
61,839 |
|
|
|
37,496 |
|
|
|
131,627 |
|
|
|
84,327 |
|
|
Other assets(1) |
|
|
122,026 |
|
|
|
134,267 |
|
|
|
151,982 |
|
|
|
154,365 |
|
|
|
151,588 |
|
|
Property, plant and equipment, net |
|
|
83,904 |
|
|
|
106,266 |
|
|
|
122,501 |
|
|
|
123,627 |
|
|
|
81,846 |
|
|
Less: |
|
|
|
|
|
|
|
|
|
|
|
|
|
|
|
|
|
|
|
|
|
Long-term debt, less current portion(1) |
|
|
151,036 |
|
|
|
189,522 |
|
|
|
191,881 |
|
|
|
235,029 |
|
|
|
43,234 |
|
|
Other long-term liabilities |
|
|
8,236 |
|
|
|
9,452 |
|
|
|
13,543 |
|
|
|
15,851 |
|
|
|
25,375 |
|
|
Deferred income taxes(2) |
|
|
4,265 |
|
|
|
10,365 |
|
|
|
8,852 |
|
|
|
12,168 |
|
|
|
13,645 |
|
|
Shareholders’ Equity |
|
|
93,752 |
|
|
|
93,033 |
|
|
|
97,703 |
|
|
|
146,571 |
|
|
|
235,507 |
|
|
Common Shares Outstanding |
|
|
30,495,737 |
|
|
|
30,019,561 |
|
|
|
29,521,566 |
|
|
|
31,162,962 |
|
|
|
33,572,778 |
|
|
Book Value Per Common Share |
|
$ |
3.07 |
|
|
$ |
3.10 |
|
|
$ |
3.31 |
|
|
$ |
4.70 |
|
|
$ |
7.01 |
|
|
Other Data |
|
|
|
|
|
|
|
|
|
|
|
|
|
|
|
|
|
|
|
|
|
Dividends paid |
|
$ |
16,341 |
|
|
$ |
16,221 |
|
|
$ |
16,675 |
|
|
$ |
15,707 |
|
|
$ |
9,103 |
|
|
Dividends declared per Common Share |
|
$ |
0.54 |
|
|
$ |
0.54 |
|
|
$ |
0.54 |
|
|
$ |
0.52 |
|
|
$ |
0.36 |
|
|
Average Basic Common Shares Outstanding during the year |
|
|
30,222,289 |
|
|
|
29,750,378 |
|
|
|
30,616,485 |
|
|
|
32,232,965 |
|
|
|
33,588,720 |
|
|
(1) |
Balances for 2013-2015 reflect the retrospective change to the balance sheet presentation of unamortized debt issuance costs in conjunction with the adoption of ASU 2015-03 in 2016. Under this guidance, unamortized debt issuance costs are to be presented as a reduction of the corresponding debt liability rather than a separate asset. |
|
(2) |
Balances as of December 31, 2015 reflect the prospective change to the balance sheet presentation of deferred taxes in conjunction with the adoption of ASU 2015-17. Under this guidance, all deferred tax assets and liabilities are classified as long-term. |
|
(3) |
Historical information has been adjusted to reflect discontinued operations presentation. See Note 4 to the consolidated financial statements. |
18
Executive Overview
The Company conducts its business activities in two distinct segments: The Material Handling Segment and the Distribution Segment. The Brazil Business, which was sold in December 2017, and the Lawn and Garden business, which was sold in February 2015, are classified as discontinued operations in all periods presented.
The Company designs, manufactures, and markets a variety of plastic and rubber products. Our Material Handling Segment manufactures products that range from plastic reusable material handling containers and small parts storage bins to plastic OEM parts, custom plastic products, consumer fuel containers, military water containers as well as ammunition packaging and shipping containers. Our Distribution Segment is engaged in the distribution of tools, equipment and supplies used for tire, wheel and under vehicle service on passenger, heavy truck and off-road vehicles, as well as the manufacturing of tire repair and retreading products.
Results of Operations: 2017 versus 2016
Net Sales:
|
(dollars in millions) |
|
Twelve Months Ended December 31, |
|
|
|
|
|
|
|
|
|
|||||
|
Segment |
|
2017 |
|
|
2016 |
|
|
Change |
|
|
% Change |
|
||||
|
Material Handling |
|
$ |
391.3 |
|
|
$ |
363.9 |
|
|
$ |
27.4 |
|
|
|
8 |
% |
|
Distribution |
|
|
156.4 |
|
|
|
170.7 |
|
|
|
(14.3 |
) |
|
|
(8 |
)% |
|
Inter-company elimination |
|
|
(0.7 |
) |
|
|
(0.2 |
) |
|
|
(0.5 |
) |
|
|
|
|
|
Total net sales |
|
$ |
547.0 |
|
|
$ |
534.4 |
|
|
$ |
12.6 |
|
|
|
2 |
% |
Net sales for the year ended December 31, 2017 were $547.0 million, an increase of $12.6 million or 2% compared to the prior year. Net sales were positively impacted by higher sales volumes of approximately $4.0 million, higher pricing of $7.5 million and the effect of favorable foreign currency translation of approximately $1.1 million.
Net sales in the Material Handling Segment increased $27.4 million or 8% for the year ended December 31, 2017 compared to the prior year. The increase in net sales was due to higher sales volume of $19.9 million, mainly due to increased demand in the Company’s consumer and food and beverage markets, higher pricing of $6.4 million, and the effect of favorable foreign currency translation of $1.1 million.
Net sales in the Distribution Segment decreased $14.3 million or 8% in the year ended December 31, 2017 compared to the prior year primarily due to lower volume. A significant portion of this volume decline resulted from a strategic decision to exit a low margin product line with a customer in early 2017, which contributed to overall gross margin improvement in this segment. The remainder of the decrease in volume was across all product lines and regions, including our export and international channels; however, the Company saw most of this decline early in 2017, as both demand and pricing improved throughout the second half of the year.
Cost of Sales & Gross Profit:
|
|
|
Twelve Months Ended December 31, |
|
|
|
|
|
|
|
|
|
|||||
|
(dollars in millions) |
|
2017 |
|
|
2016 |
|
|
Change |
|
|
% Change |
|
||||
|
Cost of sales |
|
$ |
389.6 |
|
|
$ |
372.5 |
|
|
$ |
17.1 |
|
|
|
5 |
% |
|
Gross profit |
|
$ |
157.5 |
|
|
$ |
161.9 |
|
|
$ |
(4.4 |
) |
|
|
(3 |
)% |
|
Gross profit as a percentage of sales |
|
|
28.8 |
% |
|
|
30.3 |
% |
|
|
|
|
|
|
|
|
Gross profit margin decreased to 28.8% for the year ended December 31, 2017 compared to 30.3% for the same period in 2016, primarily due to higher raw material costs and operating inefficiencies, as well as restructuring and related costs of $7.5 million within the Material Handling Segment. These impacts were partially offset by higher pricing and a favorable sales mix.
19
Selling, General and Administrative Expenses:
|
|
|
Twelve Months Ended December 31, |
|
|
|
|
|
|
|
|
|
|||||
|
(dollars in millions) |
|
2017 |
|
|
2016 |
|
|
Change |
|
|
% Change |
|
||||
|
SG&A expenses |
|
$ |
135.5 |
|
|
$ |
132.6 |
|
|
$ |
2.9 |
|
|
|
2 |
% |
|
SG&A expenses as a percentage of sales |
|
|
24.8 |
% |
|
|
24.8 |
% |
|
|
|
|
|
|
|
|
Selling, general and administrative (“SG&A”) expenses for the year ended December 31, 2017 were $135.5 million, an increase of $2.9 million or 2% compared to the prior year. SG&A expenses in 2017 were unfavorably impacted by higher legal and professional fees of $1.0 million, costs associated with the restructuring within the Material Handling Segment of $1.2 million, and the non-recurring reversal of a long-term liability of approximately $2.3 million recognized in 2016, partially offset by lower expenses related to the environmental contingencies of approximately $0.8 million, which is described in Note 9 to the consolidated financial statements.
Restructuring:
As further discussed in Note 6 to the consolidated financial statements, the Company initiated a restructuring plan (the “Plan”) in the first quarter of 2017 to improve the Company’s organizational structure and operational efficiency within the Material Handling Segment. The Company has incurred a total of $7.6 million of restructuring costs in connection with the Plan during 2017. The Company also recorded $3.9 million in net gains on sales of assets in 2017, primarily related to the closure and sale of the Bluffton, Indiana facility and certain equipment. All actions under the Plan were substantially completed by the end of 2017.
As a result of the Plan, the Company expects to save approximately $10 million on an annualized basis, of which $8 million is expected to be realized in 2018.
(Gain) Loss on Disposal of Fixed Assets:
The gain on disposal of fixed assets for the year ended December 31, 2017 was $3.5 million compared to a loss of $0.6 million in the prior year. The gains in 2017 were primarily due to the sale of the Bluffton facility and certain equipment associated with the restructuring plan within the Material Handling Segment, as discussed in Note 6 to the consolidated financial statements.
Impairment Charges:
During the year ended December 31, 2017, the Company recorded an impairment charge of $0.5 million related to assets held for sale at its Scarborough, Ontario, Canada location, as discussed in Note 2 to the consolidated financial statements. The building was sold in December 2017.
The Company recorded $1.3 million of non-cash impairment charges, primarily related to long-lived assets associated with the exit of a non-strategic product line in the Material Handling Segment during the year ended December 31, 2016, as discussed in Note 2 to the consolidated financial statements.
Net Interest Expense:
|
|
|
Twelve Months Ended December 31, |
|
|
|
|
|
|
|
|
|
|||||
|
(dollars in millions) |
|
2017 |
|
|
2016 |
|
|
Change |
|
|
% Change |
|
||||
|
Net interest expense |
|
$ |
7.3 |
|
|
$ |
8.6 |
|
|
$ |
(1.3 |
) |
|
|
(15 |
)% |
|
Outstanding borrowings, net of deferred financing costs |
|
$ |
151.0 |
|
|
$ |
189.5 |
|
|
$ |
(38.5 |
) |
|
|
(20 |
)% |
|
Average borrowing rate |
|
|
4.94 |
% |
|
|
4.69 |
% |
|
|
|
|
|
|
|
|
Net interest expense for the year ended December 31, 2017 was $7.3 million compared to $8.6 million during 2016. The decrease in net interest expense is due to a decrease in average borrowings during the year ended December 31, 2017 compared to the prior year, partially offset by a slightly higher borrowing rate.
20
Loss on Extinguishment of Debt:
During the year ended December, 31, 2017, the Company recorded a loss on extinguishment of debt of approximately $1.9 million related to the purchase of a portion of the outstanding Senior Unsecured Notes in 2017, as discussed in Note 10 to the consolidated financial statements.
Income Taxes:
|
|
|
Twelve Months Ended December 31, |
|
|||||
|
(dollars in millions) |
|
2017 |
|
|
2016 |
|
||
|
Income from continuing operations before income taxes |
|
$ |
15.7 |
|
|
$ |
18.7 |
|
|
Income tax expense |
|
$ |
4.9 |
|
|
$ |
7.4 |
|
|
Effective tax rate |
|
|
31.0 |
% |
|
|
39.5 |
% |
The effective tax rate was 31.0% for the year ended December 31, 2017 compared to 39.5% in the prior year. The 2017 effective tax rate is lower than our statutory rate and the effective tax rate for the same period in 2016, primarily due to the enactment of the Tax Act in December 2017, which reduces the U.S. federal corporate income tax rate from 35% to 21%, effective January 1, 2018. As a result the Company revalued its U.S. deferred tax assets and liabilities to reflect the lower U.S. corporate rates, which resulted in a tax benefit of $3.0 million in 2017. This was partially offset by a $1.8 million provision for one-time transition tax expense under the Tax Act related to certain foreign earnings previously not taxed in the U.S.
Discontinued Operations:
Loss from discontinued operations, net of income taxes was $20.7 million for the year ended December 31, 2017 compared to loss of $10.3 million for the year ended December 31, 2016. In 2017, this result included a loss on sale of the Brazil Business of $35.0 million (pre-tax), offset primarily by a tax benefit of $15 million, which was generated as a result of a worthless stock deduction for the Brazil Business.
Results of Operations: 2016 versus 2015
Net Sales:
|
(dollars in millions) |
|
Twelve Months Ended December 31, |
|
|
|
|
|
|
|
|
|
|||||
|
Segment |
|
2016 |
|
|
2015 |
|
|
Change |
|
|
% Change |
|
||||
|
Material Handling |
|
$ |
363.9 |
|
|
$ |
384.3 |
|
|
$ |
(20.4 |
) |
|
|
(5 |
)% |
|
Distribution |
|
|
170.7 |
|
|
|
187.6 |
|
|
|
(16.9 |
) |
|
|
(9 |
)% |
|
Inter-company elimination |
|
|
(0.2 |
) |
|
|
(0.9 |
) |
|
|
0.7 |
|
|
|
|
|
|
Total net sales |
|
$ |
534.4 |
|
|
$ |
571.0 |
|
|
$ |
(36.6 |
) |
|
|
(6 |
)% |
Net sales for the year ended December 31, 2016 were $534.4 million, a decrease of $36.6 million or 6% compared to the prior year. Net sales were negatively impacted by lower sales volumes of approximately $24.4 million, lower indexed pricing of $9.7 million and the unfavorable effect of foreign currency translation of approximately $2.5 million.
Net sales in the Material Handling Segment decreased $20.4 million or 5% for the year ended December 31, 2016 compared to the prior year. The decrease in net sales was due to lower sales volume of $7.5 million, mainly in the food and beverage end market, partially offset by favorable sales volume in the vehicle end market, unfavorable pricing of $10.4 million and the effect of unfavorable foreign currency translation of $2.5 million.
Net sales in the Distribution Segment decreased $16.9 million or 9% in the year ended December 31, 2016 compared to the prior year. The decrease in net sales was primarily due to lower equipment sales and lower sales volume in the retread market segment, partially offset by higher pricing. Additionally, the Company implemented a sales force improvement initiative in 2016 that, in some territories, had a negative impact on sales. The initiative is designed to broaden market coverage, upgrade the talent of our sales team and improve the overall sales process. It resulted in some sales force turnover and territory gaps during the year with the resulting reductions in sales from those territories.
21
|
|
|
Twelve Months Ended December 31, |
|
|
|
|
|
|
|
|
|
|||||
|
(dollars in millions) |
|
2016 |
|
|
2015 |
|
|
Change |
|
|
% Change |
|
||||
|
Cost of sales |
|
$ |
372.5 |
|
|
$ |
395.2 |
|
|
$ |
(22.7 |
) |
|
|
(6 |
)% |
|
Gross profit |
|
$ |
161.9 |
|
|
$ |
175.9 |
|
|
$ |
(14.0 |
) |
|
|
(8 |
)% |
|
Gross profit as a percentage of sales |
|
|
30.3 |
% |
|
|
30.8 |
% |
|
|
|
|
|
|
|
|
Gross profit margin decreased to 30.3% in the year ended December 31, 2016 compared to 30.8% in the prior year primarily due to lower pricing and lower sales volume, partially offset by lower input costs for plastic resins.
Selling, General and Administrative Expenses:
|
|
|
Twelve Months Ended December 31, |
|
|
|
|
|
|
|
|
|
|||||
|
(dollars in millions) |
|
2016 |
|
|
2015 |
|
|
Change |
|
|
% Change |
|
||||
|
SG&A expenses |
|
$ |
132.6 |
|
|
$ |
140.8 |
|
|
$ |
(8.2 |
) |
|
|
(6 |
)% |
|
SG&A expenses as a percentage of sales |
|
|
24.8 |
% |
|
|
24.7 |
% |
|
|
|
|
|
|
|
|
SG&A expenses for the year ended December 31, 2016 were $132.6 million, a decrease of $8.2 million or 6% compared to the prior year. SG&A expenses were favorably impacted by lower compensation expense and other employee-related costs of approximately $9.1 million, lower legal and professional costs of $1.5 million associated with the Brazilian investigation completed in the first quarter of 2015 and the non-recurring reversal of a long-term liability of approximately $2.3 million recognized in 2016, partially offset by additional environmental contingency expense of $0.9 million and the absence of a $3.0 million benefit recognized in 2015 related to the reversal of the legal reserve associated with the Orbis litigation, each described in Note 9 to the consolidated financial statements.
Impairment Charges:
The Company recorded $1.3 million of non-cash impairment charges, primarily related to long-lived assets associated with the exit of a non-strategic product line in the Material Handling Segment during the year ended December 31, 2016, as discussed in Note 2 to the consolidated financial statements. No impairment charges were recorded during the same period in 2015.
Net Interest Expense:
|
|
|
Twelve Months Ended December 31, |
|
|
|
|
|
|
|
|
|
|||||
|
(dollars in millions) |
|
2016 |
|
|
2015 |
|
|
Change |
|
|
% Change |
|
||||
|
Net interest expense |
|
$ |
8.6 |
|
|
$ |
9.0 |
|
|
$ |
(0.4 |
) |
|
|
(4 |
)% |
|
Outstanding borrowings, net of deferred financing costs |
|
$ |
189.5 |
|
|
$ |
191.9 |
|
|
$ |
(2.4 |
) |
|
|
(1 |
)% |
|
Average borrowing rate |
|
|
4.69 |
% |
|
|
4.59 |
% |
|
|
|
|
|
|
|
|
Net interest expense for the year ended December 31, 2016 was $8.6 million compared to $9.0 million during 2015. The decrease in net interest expense is due to a decrease in average borrowings during the year ended December 31, 2016 compared to the prior year, and higher interest income on the note receivable from the sale of the Lawn and Garden business described in Note 4 to the consolidated financial statements.
Income Taxes:
|
|
|
Twelve Months Ended December 31, |
|
|||||
|
(dollars in millions) |
|
2016 |
|
|
2015 |
|
||
|
Income from continuing operations before taxes |
|
$ |
18.7 |
|
|
$ |
25.5 |
|
|
Income tax expense |
|
$ |
7.4 |
|
|
$ |
8.0 |
|
|
Effective tax rate |
|
|
39.5 |
% |
|
|
31.5 |
% |
22
The effective tax rate was 39.5% for the year ended December 31, 2016 compared to 31.5% in the prior year. The 2016 effective rate is higher than our statutory rate and the effective tax rate for the same period in 2015, due primarily to a valuation allowance of $0.6 million related to Brazil and increased state tax expense.
Discontinued Operations:
Loss from discontinued operations, net of income taxes was $10.3 million for the year ended December 31, 2016 compared to income of $0.3 million for the year ended December 31, 2015. Impairment charges of $8.5 million related to the Brazil Business were included in loss from discontinued operations for the year ended December 31, 2016. A gain on sale of the Lawn and Garden business of $1.9 million, pre-tax, was included in income (loss) from discontinued operations for the year ended December 31, 2015.
Financial Condition & Liquidity and Capital Resources
Operating Activities
Cash provided by operating activities from continuing operations was $49.1 million, $34.0 million and $43.4 million for the years ended December 31, 2017, 2016 and 2015, respectively.
The increase in cash provided by continuing operations of $15.1 million during the year ended December 31, 2017 compared to 2016 was mainly due to an increase in cash provided by working capital of $23.4 million, which was driven by a significant increase in accounts payable in 2017. This increase in accounts payable occurred primarily in the Material Handling Segment as a result of higher demand near year-end, as well as strategic initiatives from the 2017 restructuring plan. These initiatives included outsourcing production of certain product lines after the closure of the Bluffton facility, which results in increased payables to these strategic partners. Income from continuing operations was $10.8 million for the year ended December 31, 2017 compared to $11.3 million for the same period in 2016. Income from continuing operations in 2017 includes gains on sale of assets of $3.5 million and non-cash deferred tax benefits of $5.7 million.
The decrease in cash provided by continuing operations during the year ended December 31, 2016 compared to 2015 was mainly due to an increase in the use of working capital, primarily due to a significant reduction in accounts payable in 2016. The decline in operating cash flow also included a decrease in income from continuing operations of $6.2 million, which includes non-cash impairment charges of $1.3 million, a decrease of $1.6 million in non-cash stock-based compensation expense. Income from continuing operations was $11.3 million in 2016 compared to $17.5 million in 2015. Depreciation and amortization costs from continuing operations were $31.8 million in the year ended December 31, 2016, compared to $32.3 million for the year ended December 31, 2015. The lower depreciation and amortization are attributable to the reduction of $9.3 million in capital expenditures in 2016 compared to 2015.
Investing Activities
Capital expenditures were $5.8 million, $12.5 million and $21.8 million for the years ended December 31, 2017, 2016 and 2015, respectively. Higher capital spending in 2016 and 2015 compared to 2017 was due to additional investments that were made for new manufacturing focused on growth and productivity improvements in addition to higher spending at Scepter. The Company paid a final working capital adjustment to the buyer of the Lawn and Garden business of approximately $4.0 million in the first quarter of 2016 as described in Note 4 to the consolidated financial statements. During 2015, the Company received approximately $69.8 million in cash proceeds in connection with the sale of the Lawn and Garden business and $1.0 million in connection with the sale of WEK (which occurred in 2014).
Financing Activities
Net repayments on the credit facility were $16.5 million for the year ended December 31, 2017 compared to net repayments of $3.8 million for the year ended December 31, 2016. The Company used cash of $23.8 million to purchase a portion of the outstanding Senior Unsecured Notes in 2017, as discussed in Note 10 to the consolidated financial statements. The Company used cash to pay dividends of $16.3 million, $16.2 million and $16.7 million for the years 2017, 2016 and 2015, respectively. In addition, under a share repurchase plan, the Company used cash of $30.0 million to purchase 1,992,379 shares of its stock in 2015. The Company did not repurchase any stock during the years ended December 31, 2017 and 2016.
Credit Sources
In March 2017, the Company entered into a Fifth Amended and Restated Loan Agreement (the “Loan Agreement”). The Loan Agreement replaced the pre-existing $300 million senior revolving credit facility with a $200 million facility and extended the term from December 2018 to March 2022. In addition, the Loan Agreement provides for a maximum Leverage Ratio of 3.75 for the first and second quarters of 2017, stepping down to 3.5 in the third quarter of 2017, and 3.25 thereafter.
23
Borrowings under the Loan Agreement bear interest at the LIBOR rate, prime rate, federal funds effective rate, the Canadian deposit offered rate, or the eurocurrency reference rate depending on the type of loan requested by the Company, in each case plus the applicable margin as set forth in the Loan Agreement.
The Company has outstanding Senior Unsecured Notes totaling $78 million with a group of investors pursuant to a note purchase agreement. The series of four notes range in face value from $11 million to $40 million, with interest rates ranging from 4.67% to 5.45%, payable semiannually, and maturing between 2021 and 2026.
Total debt outstanding at December 31, 2017 was $151.0 million, net of deferred financing costs of $1.6 million, compared with $189.5 million at December 31, 2016. The Company’s Loan Agreement provides available borrowing up to $200 million, reduced for letters of credit issued. As of December 31, 2017, the Company had $4.4 million of letters of credit issued related to insurance and other financing contracts in the ordinary course of business. As of December 31, 2017, there was $121.0 million available under our Loan Agreement.
As of December 31, 2017, the Company was in compliance with all its debt covenants. The most restrictive financial covenants for all of the Company’s debt are an interest coverage ratio (defined as earnings before interest, taxes, depreciation and amortization, as adjusted, divided by interest expense) and a leverage ratio (defined as total debt divided by earnings before interest, taxes, depreciation and amortization, as adjusted). The ratios as of and for the period ended December 31, 2017 are shown in the following table:
|
|
|
Required Level |
|
Actual Level |
|
|
|
Interest Coverage Ratio |
|
3.00 to 1 (minimum) |
|
|
7.58 |
|
|
Leverage Ratio |
|
3.25 to 1 (maximum) |
|
|
2.40 |
|
The Company believes that cash flows from operations and available borrowing under its Loan Agreement will be sufficient to meet expected business requirements including capital expenditures, dividends, working capital, debt service and to fund the stock repurchase program into the foreseeable future.
Contractual Obligations
The following summarizes the Company’s estimated future cash outflows from financial contracts and commitments reflecting our current debt structure:
|
|
|
Less than 1 Year |
|
|
2-3 Years |
|
|
4-5 Years |
|
|
Thereafter |
|
|
Total |
|
|||||
|
|
|
|
|
|
|
(Amounts in Thousands) |
|
|
|
|
|
|||||||||
|
Principal payments on debt |
|
$ |
— |
|
|
$ |
— |
|
|
$ |
114,632 |
|
|
$ |
38,000 |
|
|
$ |
152,632 |
|
|
Interest |
|
|
5,947 |
|
|
|
7,789 |
|
|
|
4,131 |
|
|
|
3,419 |
|
|
|
21,286 |
|
|
Lease payments |
|
|
2,486 |
|
|
|
1,605 |
|
|
|
1,154 |
|
|
|
390 |
|
|
|
5,635 |
|
|
Retirement obligations and other benefits |
|
|
536 |
|
|
|
832 |
|
|
|
732 |
|
|
|
1,302 |
|
|
|
3,402 |
|
|
Total |
|
$ |
8,969 |
|
|
$ |
10,226 |
|
|
$ |
120,649 |
|
|
$ |
43,111 |
|
|
$ |
182,955 |
|
Not included in the table above is an estimate from a one-time, provisional charge of $1.8 million related to the transition tax on certain foreign earnings previously untaxed in the United States. Uncertain tax position liabilities are also excluded from the contractual obligations table because a reasonably reliable estimate of the period of cash settlement with the respective tax authority cannot be made.
Critical Accounting Policies
The discussion and analysis of the Company’s financial condition and results of operations are based on the accompanying consolidated financial statements, which are prepared in accordance with accounting principles generally accepted in the United States of America (“U.S. GAAP”). As indicated in the Summary of Significant Accounting Policies included in the Notes to Consolidated Financial Statements (included in Item 8 of this report), the amount of assets, liabilities, revenue and expenses reported are affected by estimates and judgments that are necessary to comply with U.S. GAAP. The Company bases its estimates on prior experience and other assumptions that they consider reasonable to their circumstances. The Company believes the following matters may involve a high degree of judgment and complexity.
Inventory — Inventories are valued at the lower of cost or market for last-in, first-out (“LIFO”) inventory and lower of cost or net realizable value for first-in, first-out (“FIFO”) inventory. Cost is determined by the LIFO method for approximately 30 percent of the Company’s inventories and the FIFO method for all other inventories. Where appropriate, standard cost systems are utilized and
24
appropriate variances are evaluated for purposes of determining cost; the standards are adjusted as necessary to ensure they approximate actual costs. Estimates of lower of cost or net realizable value of inventory are determined based upon current economic conditions, historical sales quantities and patterns and, in some cases, the specific risk of loss on specifically identified inventories.
Goodwill — Goodwill is subject to annual impairment testing, unless significant changes in circumstances indicate a potential impairment may have occurred sooner. The Company conducts its annual impairment assessment as of October 1. Such assessment can be done on a qualitative or quantitative basis. When conducting a qualitative assessment, the Company considers relevant events and circumstances that affect the fair value or carrying amount of the reporting unit. A quantitative test is required only if the Company concludes that it is more likely than not (defined as a likelihood of more than 50%) that a reporting unit’s fair value is less than its carrying amount. If under the quantitative assessment the fair value of a reporting unit is less than its carrying amount, then the amount of the impairment loss, if any, must be recorded.
At October 1, 2017, after considering changes to assumptions used in the most recent quantitative annual testing for each reporting unit, including macroeconomic conditions, industry and market considerations, overall financial performance, the magnitude of the excess of fair value over the carrying amount of each reporting unit as determined in the most recent quantitative annual testing, and other factors, management concluded that it was not more likely than not that the fair values of the reporting units were less than their respective carrying values and, therefore, did not perform a quantitative analysis.
Contingencies — In the ordinary course of business, the Company is involved in various legal proceedings and contingencies. The Company has recorded liabilities for these matters in accordance with FASB ASC 450, Contingencies (“ASC 450”). ASC 450 requires a liability to be recorded based on our estimate of the probable cost of the resolution of a contingency. When management believes that a loss arising from these matters is probable and can reasonably be estimated, they record the amount of the estimated loss, or the minimum estimated liability when the loss is estimated using a range, and no point within the range is more probable of occurrence than another. As additional information becomes available, any potential liability related to these matters will be assessed and the estimates will be revised, if necessary. The actual resolution of these contingencies may differ from our estimates. If a contingency were settled for an amount greater than our estimate, a future charge to income would result. Likewise, if a contingency were settled for an amount that is less than our estimate, a future credit to income would result.
Revenue Recognition — The Company recognizes revenues from the sale of products, net of actual and estimated returns, at the point of passage of title and risk of loss, which is generally at time of shipment, and collectability of the fixed or determinable sales price is reasonably assured.
Income Taxes — Deferred tax assets and liabilities are recognized for the future tax consequences attributable to differences between the financial statement carrying amounts of assets and liabilities and their respective tax bases and operating loss and tax credit carryforwards. Deferred tax assets and liabilities are measured using enacted tax rates expected to apply to taxable income in the years in which those differences are expected to be received or settled. The effect on deferred tax assets and liabilities of a change in tax rates is recognized in income in the period the change is enacted.
ASC 740, Income Taxes ("ASC 740") requires that deferred tax assets be reduced by a valuation allowance, if based on all available evidence, it is more likely than not that the deferred tax asset will not be realized. The Company evaluates the recovery of its deferred tax assets by assessing the adequacy of future expected taxable income from all sources, including reversal of taxable temporary differences, forecasted operating earnings and available tax planning strategies. These sources of income inherently rely heavily on estimates.
Significant judgement is required in determining the Company’s tax expense and in evaluating its tax positions, including evaluating uncertainties under ASC 740. ASC 740 provides detailed guidance for the financial statement recognition, measurement and disclosure of uncertain tax positions recognized in an enterprise’s financial statements. Income tax positions must meet a more-likely-than-not recognition threshold at the effective date to be recognized under ASC 740. The Company recognizes potential accrued interest and penalties related to unrecognized tax benefits as a component of income tax expense.
In response to the complexities and timing of the Tax Act, the SEC issued Staff Accounting Bulletin No. 118, Income Tax Accounting Implications of the Tax Cuts and Jobs Act (“SAB 118”). Per the guidance in SAB 118, adjustments to the provisional amounts recorded by the Company in 2017 that are identified within a subsequent period of up to one year from the enactment date will be included as an adjustment in the period the amounts are determined.
Recent Accounting Pronouncements
Information regarding the recent accounting pronouncements is contained in the Summary of Significant Accounting Policies footnote of the Notes to Consolidated Financial Statements under Item 8 of this report.
25
Market Risk and Derivative Financial Instruments
The Company has certain financing arrangements that require interest payments based on floating interest rates. The Company’s financial results are subject to changes in the market rate of interest. At present, the Company has not entered into any interest rate swaps or other derivative instruments to fix the interest rate on any portion of its financing arrangements with floating rates. Accordingly, based on current debt levels at December 31, 2017, if market interest rates increase one percent, the Company’s interest expense would increase approximately $0.7 million annually.
Some of the Company’s subsidiaries operate in foreign countries and their financial results are subject to exchange rate movements. The Company has operations in Canada with foreign currency exposure, primarily due to sales made from businesses in Canada to customers in the United States ("U.S."). These sales are denominated in U.S. dollars. The Company has a systematic program to limit its exposure to fluctuations in exchange rates related to certain assets and liabilities of its operations in Canada that are denominated in U.S. dollars. The net exposure generally ranges from $1 million to $5 million. The foreign currency contracts and arrangements created under this program are not designated as hedged items under Financial Accounting Standards Board (“FASB”) Accounting Standard Codification (“ASC”) 815, Derivatives and Hedging, and accordingly, the changes in the fair value of the foreign currency arrangements, which have been immaterial, are recorded in the income statement. The Company’s foreign currency arrangements are typically three months or less and are settled before the end of a reporting period. At December 31, 2017, the Company had no foreign currency arrangements or contracts in place.
The Company uses certain commodities, primarily plastic resins and natural rubber, in its manufacturing processes. The cost of operations can be affected as the market for these commodities changes. The Company currently has no derivative contracts to hedge this risk; however, the Company also has no significant obligations to purchase fixed quantities of such commodities in future periods. Significant future increases in the cost of these commodities or other adverse changes in the general economic environment could have a material adverse impact on the Company’s financial position, results of operations or cash flows.
26
Report of Independent Registered Public Accounting Firm
To the Shareholders and the Board of Directors of
Myers Industries, Inc. and Subsidiaries
Opinion on the Financial Statements
We have audited the accompanying consolidated statements of financial position of Myers Industries, Inc. and Subsidiaries (the Company) as of December 31, 2017 and 2016, and the related consolidated statements of operations, comprehensive income (loss), shareholders' equity and cash flows for each of the three years in the period ended December 31, 2017, and the related notes (collectively referred to as the “consolidated financial statements”). In our opinion, the consolidated financial statements present fairly, in all material respects, the consolidated financial position of the Company at December 31, 2017 and 2016, and the consolidated results of its operations and its cash flows for each of the three years in the period ended December 31, 2017, in conformity with U.S. generally accepted accounting principles.
We also have audited, in accordance with the standards of the Public Company Accounting Oversight Board (United States) (PCAOB), the Company's internal control over financial reporting as of December 31, 2017, based on criteria established in Internal Control-Integrated Framework issued by the Committee of Sponsoring Organizations of the Treadway Commission (2013 framework) and our report dated March 9, 2018 expressed an unqualified opinion thereon.
Basis for Opinion
These financial statements are the responsibility of the Company's management. Our responsibility is to express an opinion on the Company’s financial statements based on our audits. We are a public accounting firm registered with the PCAOB and are required to be independent with respect to the Company in accordance with the U.S. federal securities laws and the applicable rules and regulations of the Securities and Exchange Commission and the PCAOB.
We conducted our audits in accordance with the standards of the PCAOB. Those standards require that we plan and perform the audit to obtain reasonable assurance about whether the financial statements are free of material misstatement, whether due to error or fraud. Our audits included performing procedures to assess the risks of material misstatement of the financial statements, whether due to error or fraud, and performing procedures that respond to those risks. Such procedures included examining, on a test basis, evidence regarding the amounts and disclosures in the financial statements. Our audits also included evaluating the accounting principles used and significant estimates made by management, as well as evaluating the overall presentation of the financial statements. We believe that our audits provide a reasonable basis for our opinion.
/s/ Ernst & Young LLP
We have served as the Company’s auditor since 2011.
Akron, Ohio
March 9, 2018
27
MYERS INDUSTRIES, INC. AND SUBSIDIARIES
Consolidated Statements of Operations
For the Years Ended December 31, 2017, 2016, and 2015
(Dollars in thousands, except per share data)
|
|
For the Year Ended December 31, |
|
|||||||||
|
|
2017 |
|
|
2016 |
|
|
2015 |
|
|||
|
Net sales |
$ |
547,043 |
|
|
$ |
534,379 |
|
|
$ |
571,020 |
|
|
Cost of sales |
|
389,590 |
|
|
|
372,481 |
|
|
|
395,158 |
|
|
Gross profit |
|
157,453 |
|
|
|
161,898 |
|
|
|
175,862 |
|
|
Selling expenses |
|
56,614 |
|
|
|
58,782 |
|
|
|
58,456 |
|
|
General and administrative expenses |
|
78,889 |
|
|
|
73,797 |
|
|
|
82,333 |
|
|
|
|
135,503 |
|
|
|
132,579 |
|
|
|
140,789 |
|
|
(Gain) loss on disposal of fixed assets |
|
(3,482 |
) |
|
|
628 |
|
|
|
556 |
|
|
Impairment charges |
|
544 |
|
|
|
1,329 |
|
|
|
— |
|
|
Operating income |
|
24,888 |
|
|
|
27,362 |
|
|
|
34,517 |
|
|
Interest |
|
|
|
|
|
|
|
|
|
|
|
|
Income |
|
(1,361 |
) |
|
|
(1,262 |
) |
|
|
(1,067 |
) |
|
Expense |
|
8,653 |
|
|
|
9,905 |
|
|
|
10,076 |
|
|
Interest expense, net |
|
7,292 |
|
|
|
8,643 |
|
|
|
9,009 |
|
|
Loss on extinguishment of debt |
|
1,888 |
|
|
|
— |
|
|
|
— |
|
|
Income from continuing operations before income taxes |
|
15,708 |
|
|
|
18,719 |
|
|
|
25,508 |
|
|
Income tax expense |
|
4,864 |
|
|
|
7,395 |
|
|
|
8,037 |
|
|
Income from continuing operations |
|
10,844 |
|
|
|
11,324 |
|
|
|
17,471 |
|
|
Income (loss) from discontinued operations, net of income tax |
|
(20,733 |
) |
|
|
(10,267 |
) |
|
|
291 |
|
|
Net income (loss) |
$ |
(9,889 |
) |
|
$ |
1,057 |
|
|
$ |
17,762 |
|
|
Income per common share from continuing operations: |
|
|
|
|
|
|
|
|
|
|
|
|
Basic |
$ |
0.36 |
|
|
$ |
0.38 |
|
|
$ |
0.57 |
|
|
Diluted |
$ |
0.35 |
|
|
$ |
0.38 |
|
|
$ |
0.56 |
|
|
Income (loss) per common share from discontinued operations: |
|
|
|
|
|
|
|
|
|
|
|
|
Basic |
$ |
(0.69 |
) |
|
$ |
(0.35 |
) |
|
$ |
0.01 |
|
|
Diluted |
$ |
(0.68 |
) |
|
$ |
(0.35 |
) |
|
$ |
0.01 |
|
|
Net income (loss) per common share: |
|
|
|
|
|
|
|
|
|
|
|
|
Basic |
$ |
(0.33 |
) |
|
$ |
0.03 |
|
|
$ |
0.58 |
|
|
Diluted |
$ |
(0.33 |
) |
|
$ |
0.03 |
|
|
$ |
0.57 |
|
|
Dividends declared per share |
$ |
0.54 |
|
|
$ |
0.54 |
|
|
$ |
0.54 |
|
The accompanying notes are an integral part of these statements.
28
MYERS INDUSTRIES, INC. AND SUBSIDIARIES
Consolidated Statements of Comprehensive Income (Loss)
For the Years Ended December 31, 2017, 2016, and 2015
(Dollars in thousands)
|
|
|
For the Year Ended December 31, |
|
|||||||||
|
|
|
2017 |
|
|
2016 |
|
|
2015 |
|
|||
|
Net income (loss) |
|
$ |
(9,889 |
) |
|
$ |
1,057 |
|
|
$ |
17,762 |
|
|
Other comprehensive income (loss) |
|
|
|
|
|
|
|
|
|
|
|
|
|
Foreign currency translation adjustment |
|
|
2,391 |
|
|
|
5,105 |
|
|
|
(27,622 |
) |
|
Reclassification adjustment for foreign currency translation included in net income (loss) |
|
|
17,201 |
|
|
|
— |
|
|
|
— |
|
|
Pension liability, net of tax expense (benefit) of $14 in 2017, ($95) in 2016, and $113 in 2015 |
|
|
41 |
|
|
|
(169 |
) |
|
|
200 |
|
|
Total other comprehensive income (loss) |
|
|
19,633 |
|
|
|
4,936 |
|
|
|
(27,422 |
) |
|
Comprehensive income (loss) |
|
$ |
9,744 |
|
|
$ |
5,993 |
|
|
$ |
(9,660 |
) |
The accompanying notes are an integral part of these statements.
29
MYERS INDUSTRIES, INC. AND SUBSIDIARIES
Consolidated Statements of Financial Position
As of December 31, 2017 and 2016
(Dollars in thousands)
|
|
|
December 31, |
|
|
December 31, |
|
||
|
|
|
2017 |
|
|
2016 |
|
||
|
Assets |
|
|
|
|
|
|
|
|
|
Current Assets |
|
|
|
|
|
|
|
|
|
Cash |
|
$ |
2,520 |
|
|
$ |
2,404 |
|
|
Restricted cash |
|
|
8,659 |
|
|
|
8,635 |
|
|
Accounts receivable, less allowances of $1,313 and $1,497, respectively |
|
|
76,650 |
|
|
|
64,282 |
|
|
Income tax receivable |
|
|
12,954 |
|
|
|
2,208 |
|
|
Inventories, net |
|
|
47,025 |
|
|
|
44,785 |
|
|
Prepaid expenses and other current assets |
|
|
2,204 |
|
|
|
4,639 |
|
|
Current assets of discontinued operations |
|
|
— |
|
|
|
14,198 |
|
|
Total Current Assets |
|
|
150,012 |
|
|
|
141,151 |
|
|
Other Assets |
|
|
|
|
|
|
|
|
|
Property, plant, and equipment, net |
|
|
83,904 |
|
|
|
106,266 |
|
|
Goodwill |
|
|
59,971 |
|
|
|
59,219 |
|
|
Intangible assets, net |
|
|
39,049 |
|
|
|
46,868 |
|
|
Deferred income taxes |
|
|
120 |
|
|
|
83 |
|
|
Notes receivable |
|
|
18,737 |
|
|
|
18,275 |
|
|
Other |
|
|
4,149 |
|
|
|
3,313 |
|
|
Noncurrent assets of discontinued operations |
|
|
— |
|
|
|
6,509 |
|
|
Total Assets |
|
$ |
355,942 |
|
|
$ |
381,684 |
|
|
|
|
|
|
|
|
|
|
|
|
Liabilities and Shareholders’ Equity |
|
|
|
|
|
|
|
|
|
Current Liabilities |
|
|
|
|
|
|
|
|
|
Accounts payable |
|
$ |
63,581 |
|
|
$ |
47,573 |
|
|
Accrued expenses |
|
|
|
|
|
|
|
|
|
Employee compensation |
|
|
15,544 |
|
|
|
11,276 |
|
|
Taxes, other than income taxes |
|
|
1,664 |
|
|
|
1,600 |
|
|
Accrued interest |
|
|
2,392 |
|
|
|
3,202 |
|
|
Other current liabilities |
|
|
15,472 |
|
|
|
12,911 |
|
|
Current liabilities of discontinued operations |
|
|
— |
|
|
|
2,750 |
|
|
Total Current Liabilities |
|
|
98,653 |
|
|
|
79,312 |
|
|
Long-term debt |
|
|
151,036 |
|
|
|
189,522 |
|
|
Other liabilities |
|
|
8,236 |
|
|
|
9,203 |
|
|
Deferred income taxes |
|
|
4,265 |
|
|
|
10,365 |
|
|
Noncurrent liabilities of discontinued operations |
|
|
— |
|
|
|
249 |
|
|
Shareholders’ Equity |
|
|
|
|
|
|
|
|
|
Serial Preferred Shares (authorized 1,000,000 shares; none issued and outstanding) |
|
|
— |
|
|
|
— |
|
|
Common Shares, without par value (authorized 60,000,000 shares; outstanding 30,495,737 and 30,019,561; net of treasury shares of 7,456,720 and 7,932,896, respectively) |
|
|
18,547 |
|
|
|
18,234 |
|
|
Additional paid-in capital |
|
|
209,253 |
|
|
|
202,033 |
|
|
Accumulated other comprehensive loss |
|
|
(14,541 |
) |
|
|
(34,174 |
) |
|
Retained deficit |
|
|
(119,507 |
) |
|
|
(93,060 |
) |
|
Total Shareholders’ Equity |
|
|
93,752 |
|
|
|
93,033 |
|
|
Total Liabilities and Shareholders’ Equity |
|
$ |
355,942 |
|
|
$ |
381,684 |
|
The accompanying notes are an integral part of these statements.
30
MYERS INDUSTRIES, INC. AND SUBSIDIARIES
Consolidated Statements of Shareholders’ Equity
For the Years Ended December 31, 2017, 2016 and 2015
(Dollars in thousands, except per share data)
|
|
|
Common Shares |
|
|
Additional Paid-In |
|
|
Accumulated Other Comprehensive |
|
|
Retained |
|
|
Total Shareholders' |
|
|||||||||
|
|
|
Number |
|
|
Amount |
|
|
Capital |
|
|
Income (Loss) |
|
|
Deficit |
|
|
Equity |
|
||||||
|
Balance at January 1, 2015 |
|
|
31,162,962 |
|
|
$ |
18,855 |
|
|
$ |
218,394 |
|
|
$ |
(11,688 |
) |
|
$ |
(78,990 |
) |
|
$ |
146,571 |
|
|
Net income |
|
|
— |
|
|
|
— |
|
|
|
— |
|
|
|
— |
|
|
|
17,762 |
|
|
|
17,762 |
|
|
Issuances under option plans |
|
|
239,908 |
|
|
|
162 |
|
|
|
2,613 |
|
|
|
— |
|
|
|
— |
|
|
|
2,775 |
|
|
Dividend reinvestment plan |
|
|
8,968 |
|
|
|
5 |
|
|
|
144 |
|
|
|
— |
|
|
|
— |
|
|
|
149 |
|
|
Restricted stock vested |
|
|
120,723 |
|
|
|
78 |
|
|
|
(78 |
) |
|
|
— |
|
|
|
— |
|
|
|
— |
|
|
Restricted stock and stock option grants |
|
|
— |
|
|
|
— |
|
|
|
5,277 |
|
|
|
— |
|
|
|
— |
|
|
|
5,277 |
|
|
Tax benefit from options |
|
|
— |
|
|
|
— |
|
|
|
38 |
|
|
|
— |
|
|
|
— |
|
|
|
38 |
|
|
Foreign currency translation adjustment |
|
|
— |
|
|
|
— |
|
|
|
— |
|
|
|
(27,622 |
) |
|
|
— |
|
|
|
(27,622 |
) |
|
Repurchase of common stock |
|
|
(1,992,379 |
) |
|
|
(1,193 |
) |
|
|
(28,830 |
) |
|
|
— |
|
|
|
— |
|
|
|
(30,023 |
) |
|
Stock contributions |
|
|
8,250 |
|
|
|
5 |
|
|
|
143 |
|
|
|
— |
|
|
|
— |
|
|
|
148 |
|
|
Shares withheld for employee taxes on equity awards |
|
|
(26,866 |
) |
|
|
(17 |
) |
|
|
(958 |
) |
|
|
— |
|
|
|
— |
|
|
|
(975 |
) |
|
Declared dividends - $0.54 per share |
|
|
— |
|
|
|
— |
|
|
|
— |
|
|
|
— |
|
|
|
(16,597 |
) |
|
|
(16,597 |
) |
|
Pension liability, net of tax of $113 |
|
|
— |
|
|
|
— |
|
|
|
— |
|
|
|
200 |
|
|
|
— |
|
|
|
200 |
|
|
Balance at December 31, 2015 |
|
|
29,521,566 |
|
|
|
17,895 |
|
|
|
196,743 |
|
|
|
(39,110 |
) |
|
|
(77,825 |
) |
|
|
97,703 |
|
|
Net income |
|
|
— |
|
|
|
— |
|
|
|
— |
|
|
|
— |
|
|
|
1,057 |
|
|
|
1,057 |
|
|
Issuances under option plans |
|
|
374,958 |
|
|
|
205 |
|
|
|
3,030 |
|
|
|
— |
|
|
|
— |
|
|
|
3,235 |
|
|
Dividend reinvestment plan |
|
|
10,520 |
|
|
|
6 |
|
|
|
133 |
|
|
|
— |
|
|
|
— |
|
|
|
139 |
|
|
Restricted stock vested |
|
|
169,929 |
|
|
|
104 |
|
|
|
(104 |
) |
|
|
— |
|
|
|
— |
|
|
|
— |
|
|
Stock compensation expense |
|
|
— |
|
|
|
24 |
|
|
|
3,333 |
|
|
|
— |
|
|
|
— |
|
|
|
3,357 |
|
|
Tax benefit from options |
|
|
— |
|
|
|
— |
|
|
|
64 |
|
|
|
— |
|
|
|
— |
|
|
|
64 |
|
|
Foreign currency translation adjustment |
|
|
— |
|
|
|
— |
|
|
|
— |
|
|
|
5,105 |
|
|
|
— |
|
|
|
5,105 |
|
|
Shares withheld for employee taxes on equity awards |
|
|
(57,412 |
) |
|
|
— |
|
|
|
(1,166 |
) |
|
|
— |
|
|
|
— |
|
|
|
(1,166 |
) |
|
Declared dividends - $0.54 per share |
|
|
— |
|
|
|
— |
|
|
|
— |
|
|
|
— |
|
|
|
(16,292 |
) |
|
|
(16,292 |
) |
|
Pension liability, net of tax of $95 |
|
|
— |
|
|
|
— |
|
|
|
— |
|
|
|
(169 |
) |
|
|
— |
|
|
|
(169 |
) |
|
Balance at December 31, 2016 |
|
|
30,019,561 |
|
|
|
18,234 |
|
|
|
202,033 |
|
|
|
(34,174 |
) |
|
|
(93,060 |
) |
|
|
93,033 |
|
|
Net loss |
|
|
— |
|
|
|
— |
|
|
|
— |
|
|
|
— |
|
|
|
(9,889 |
) |
|
|
(9,889 |
) |
|
Issuances under option plans |
|
|
375,292 |
|
|
|
229 |
|
|
|
4,167 |
|
|
|
— |
|
|
|
— |
|
|
|
4,396 |
|
|
Dividend reinvestment plan |
|
|
7,625 |
|
|
|
5 |
|
|
|
126 |
|
|
|
— |
|
|
|
— |
|
|
|
131 |
|
|
Restricted stock vested |
|
|
130,036 |
|
|
|
79 |
|
|
|
(79 |
) |
|
|
— |
|
|
|
— |
|
|
|
— |
|
|
Stock compensation expense |
|
|
— |
|
|
|
— |
|
|
|
3,626 |
|
|
|
— |
|
|
|
— |
|
|
|
3,626 |
|
|
Foreign currency translation adjustment |
|
|
— |
|
|
|
— |
|
|
|
— |
|
|
|
2,391 |
|
|
|
— |
|
|
|
2,391 |
|
|
Shares withheld for employee taxes on equity awards |
|
|
(36,777 |
) |
|
|
— |
|
|
|
(620 |
) |
|
|
— |
|
|
|
— |
|
|
|
(620 |
) |
|
Declared dividends - $0.54 per share |
|
|
— |
|
|
|
— |
|
|
|
— |
|
|
|
— |
|
|
|
(16,558 |
) |
|
|
(16,558 |
) |
|
Pension liability, net of tax of $14 |
|
|
— |
|
|
|
— |
|
|
|
— |
|
|
|
41 |
|
|
|
— |
|
|
|
41 |
|
|
Reclassification adjustment for foreign currency translation included in net loss |
|
|
— |
|
|
|
— |
|
|
|
— |
|
|
|
17,201 |
|
|
|
— |
|
|
|
17,201 |
|
|
Balance at December 31, 2017 |
|
|
30,495,737 |
|
|
$ |
18,547 |
|
|
$ |
209,253 |
|
|
$ |
(14,541 |
) |
|
$ |
(119,507 |
) |
|
$ |
93,752 |
|
The accompanying notes are an integral part of these statements.
31
MYERS INDUSTRIES, INC. AND SUBSIDIARIES
Consolidated Statements of Cash Flows
For the Years Ended December 31, 2017, 2016 and 2015
(Dollars in thousands)
|
|
|
For the Year Ended December 31, |
|
|||||||||
|
|
|
2017 |
|
|
2016 |
|
|
2015 |
|
|||
|
Cash Flows From Operating Activities |
|
|
|
|
|
|
|
|
|
|
|
|
|
Net income (loss) |
|
$ |
(9,889 |
) |
|
$ |
1,057 |
|
|
$ |
17,762 |
|
|
Income (loss) from discontinued operations, net of income taxes |
|
|
(20,733 |
) |
|
|
(10,267 |
) |
|
|
291 |
|
|
Income from continuing operations |
|
|
10,844 |
|
|
|
11,324 |
|
|
|
17,471 |
|
|
Adjustments to reconcile income from continuing operations to net cash provided by (used for) operating activities |
|
|
|
|
|
|
|
|
|
|
|
|
|
Depreciation |
|
|
19,952 |
|
|
|
22,049 |
|
|
|
22,418 |
|
|
Amortization |
|
|
8,886 |
|
|
|
9,743 |
|
|
|
9,912 |
|
|
Accelerated depreciation associated with restructuring activities |
|
|
1,993 |
|
|
|
— |
|
|
|
— |
|
|
Non-cash stock-based compensation expense |
|
|
3,626 |
|
|
|
3,357 |
|
|
|
4,934 |
|
|
(Gain) loss on disposal of fixed assets |
|
|
(3,482 |
) |
|
|
628 |
|
|
|
556 |
|
|
Loss on extinguishment of debt |
|
|
1,888 |
|
|
|
— |
|
|
|
— |
|
|
Deferred taxes |
|
|
(5,663 |
) |
|
|
555 |
|
|
|
211 |
|
|
Accrued interest income on note receivable |
|
|
(1,360 |
) |
|
|
(1,268 |
) |
|
|
(1,060 |
) |
|
Impairment charges |
|
|
544 |
|
|
|
1,329 |
|
|
|
— |
|
|
Other |
|
|
256 |
|
|
|
155 |
|
|
|
104 |
|
|
Payments on performance based compensation |
|
|
(1,010 |
) |
|
|
(1,794 |
) |
|
|
(1,303 |
) |
|
Other long-term liabilities |
|
|
723 |
|
|
|
(592 |
) |
|
|
1,936 |
|
|
Cash flows provided by (used for) working capital |
|
|
|
|
|
|
|
|
|
|
|
|
|
Accounts receivable |
|
|
(6,757 |
) |
|
|
6,411 |
|
|
|
(5,032 |
) |
|
Inventories |
|
|
(1,876 |
) |
|
|
8,603 |
|
|
|
3,666 |
|
|
Prepaid expenses and other current assets |
|
|
2,209 |
|
|
|
1,047 |
|
|
|
147 |
|
|
Accounts payable and accrued expenses |
|
|
18,299 |
|
|
|
(27,594 |
) |
|
|
(10,588 |
) |
|
Net cash provided by (used for) operating activities - continuing operations |
|
|
49,072 |
|
|
|
33,953 |
|
|
|
43,372 |
|
|
Net cash provided by (used for) operating activities - discontinued operations |
|
|
(4,633 |
) |
|
|
(232 |
) |
|
|
(5,640 |
) |
|
Net cash provided by (used for) operating activities |
|
|
44,439 |
|
|
|
33,721 |
|
|
|
37,732 |
|
|
Cash Flows From Investing Activities |
|
|
|
|
|
|
|
|
|
|
|
|
|
Capital expenditures |
|
|
(5,814 |
) |
|
|
(12,489 |
) |
|
|
(21,787 |
) |
|
Proceeds from sale of property, plant and equipment |
|
|
11,058 |
|
|
|
450 |
|
|
|
1,261 |
|
|
Proceeds (payments) related to sale of business |
|
|
— |
|
|
|
(4,034 |
) |
|
|
70,762 |
|
|
Net cash provided by (used for) investing activities - continuing operations |
|
|
5,244 |
|
|
|
(16,073 |
) |
|
|
50,236 |
|
|
Net cash provided by (used for) investing activities - discontinued operations |
|
|
(1,107 |
) |
|
|
(16 |
) |
|
|
(2,521 |
) |
|
Net cash provided by (used for) investing activities |
|
|
4,137 |
|
|
|
(16,089 |
) |
|
|
47,715 |
|
|
Cash Flows From Financing Activities |
|
|
|
|
|
|
|
|
|
|
|
|
|
Net borrowings (repayments) on credit facility |
|
|
(16,474 |
) |
|
|
(3,804 |
) |
|
|
(37,110 |
) |
|
Repayments of senior unsecured notes |
|
|
(23,798 |
) |
|
|
— |
|
|
|
— |
|
|
Cash dividends paid |
|
|
(16,341 |
) |
|
|
(16,221 |
) |
|
|
(16,675 |
) |
|
Proceeds from issuance of common stock |
|
|
4,527 |
|
|
|
3,374 |
|
|
|
2,924 |
|
|
Excess tax benefit from stock-based compensation |
|
|
— |
|
|
|
64 |
|
|
|
38 |
|
|
Repurchase of common stock |
|
|
— |
|
|
|
— |
|
|
|
(30,023 |
) |
|
Shares withheld for employee taxes on equity awards |
|
|
(620 |
) |
|
|
(1,166 |
) |
|
|
(975 |
) |
|
Deferred financing costs |
|
|
(1,030 |
) |
|
|
— |
|
|
|
— |
|
|
Net cash provided by (used for) financing activities - continuing operations |
|
|
(53,736 |
) |
|
|
(17,753 |
) |
|
|
(81,821 |
) |
|
Net cash provided by (used for) financing activities - discontinued operations |
|
|
— |
|
|
|
— |
|
|
|
— |
|
|
Net cash provided by (used for) financing activities |
|
|
(53,736 |
) |
|
|
(17,753 |
) |
|
|
(81,821 |
) |
|
Foreign exchange rate effect on cash |
|
|
(208 |
) |
|
|
665 |
|
|
|
(958 |
) |
|
Less: Net increase (decrease) in cash classified within discontinued operations |
|
|
(5,484 |
) |
|
|
493 |
|
|
|
3,992 |
|
|
Net increase (decrease) in cash |
|
|
116 |
|
|
|
51 |
|
|
|
(1,324 |
) |
|
Cash at January 1 |
|
|
2,404 |
|
|
|
2,353 |
|
|
|
3,677 |
|
|
Cash at December 31 |
|
$ |
2,520 |
|
|
$ |
2,404 |
|
|
$ |
2,353 |
|
|
Supplemental Disclosures of Cash Flow Information |
|
|
|
|
|
|
|
|
|
|
|
|
|
Cash paid during the year for |
|
|
|
|
|
|
|
|
|
|
|
|
|
Interest |
|
$ |
8,913 |
|
|
$ |
8,917 |
|
|
$ |
10,131 |
|
|
Income taxes |
|
$ |
5,651 |
|
|
$ |
8,136 |
|
|
$ |
10,136 |
|
The accompanying notes are an integral part of these statements.
32
MYERS INDUSTRIES, INC. AND SUBSIDIARIES
Notes to Consolidated Financial Statements
(Dollars in thousands, except where otherwise indicated)
1. Summary of Significant Accounting Policies
Basis of Presentation
The consolidated financial statements include the accounts of Myers Industries, Inc. and all wholly owned subsidiaries (collectively, the “Company”). All intercompany accounts and transactions have been eliminated in consolidation. All subsidiaries that are not wholly owned and are not included in the consolidated operating results of the Company are immaterial investments which have been accounted for under the equity or cost method. The preparation of financial statements in conformity with U.S. generally accepted accounting principles (“GAAP”) requires management to make estimates and assumptions that affect the reported amounts of assets and liabilities and disclosures at the date of the financial statements and the reported amount of revenues and expenses during the reported period. Actual results could differ from those estimates.
During the fourth quarter of 2017, the Company completed the sale of certain subsidiaries in Brazil. As further discussed in Note 4, the results of operations and cash flows of these subsidiaries have been classified as discontinued operations in the consolidated financial statements for all periods presented.
Accounting Standards Adopted
In March 2016, the Financial Accounting Standards Board (“FASB”) issued Accounting Standards Update (“ASU”) 2016-09, Compensation - Stock Compensation - Improvements to Employee Share-Based Payment Accounting, which involves several aspects of the accounting for share-based payment transactions, including the income tax consequences, classification of awards as either equity or liabilities, and classification on the statement of cash flows. Under the new standard, income tax benefits and deficiencies are to be recognized as income tax expense or benefit in the income statement and the tax effects of exercised or vested awards should be treated as discrete items in the reporting period in which they occur. An entity should also recognize excess tax benefits regardless of whether the benefit reduces taxes payable in the current period. Excess tax benefits should be classified along with other income tax cash flows as an operating activity. In regards to forfeitures, the entity may make an entity-wide accounting policy election to either estimate the number of awards that are expected to vest or account for forfeitures when they occur. The Company adopted this ASU effective January 1, 2017 and elected to recognize forfeitures as they occur. The cash flow classification requirements of ASU 2016-09 were applied prospectively. The adoption of this ASU did not have a material impact on the Company’s results of operations, cash flows or financial position.
In August 2016, the FASB issued ASU 2016-15, Statement of Cash Flows – Classification of Certain Cash Receipts and Cash Payments, which clarifies how entities should classify certain cash receipts and cash payments on the statement of cash flows. The new guidance also clarifies how the predominance principle should be applied when cash receipts and cash payments have aspects of more than one class of cash flows. This ASU is effective for fiscal years beginning after December 15, 2017, including interim periods within that reporting period, with early adoption permitted. The Company early adopted this standard in the fourth quarter of 2017. The adoption of this standard did not have a significant impact on the Company’s consolidated financial statements.
Accounting Standards Not Yet Adopted
In February 2018, the FASB issued ASU 2018-02, Income Statement – Reporting Comprehensive Income (Topic 220). This ASU allows a reclassification from accumulated other comprehensive income to retained earnings for stranded tax effects resulting from the Tax Cuts and Jobs Act. The new standard also requires certain disclosures about stranded tax effects. This ASU is effective for fiscal years beginning after December 15, 2018, and interim periods within those fiscal years, with early adoption permitted. The ASU should be applied either in the period of adoption or retrospectively to each period (or periods) in which the effect of the change in the U.S. federal corporate income tax rate in the Tax Cuts and Jobs Act of 2017 (as further discussed in Note 11) is recognized. The Company is currently evaluating the impact the adoption of this standard will have on its consolidated financial statements.
In March 2017, the FASB issued ASU 2017-07, Compensation – Retirement Benefits (Topic 715) – Improving the Presentation of Net Periodic Pension Cost and Net Periodic Postretirement Benefit Cost. This ASU requires that an employer report the service cost component in the same line item(s) as other compensation costs arising from services rendered by the pertinent employees during the period. The other components of net benefit cost are required to be presented in the income statement separately from the service cost component and outside a subtotal of income from operations, if one is presented. The ASU also allows only the service cost component to be eligible for capitalization when applicable. The ASU is effective for annual periods beginning after December 15, 2017, and interim periods within those annual periods. The ASU should be applied retrospectively for the presentation of the service
33
MYERS INDUSTRIES, INC. AND SUBSIDIARIES
Notes to Consolidated Financial Statements - (Continued)
(Dollars in thousands, except where otherwise indicated)
cost component and the other components of net periodic pension cost and net periodic postretirement benefit cost in the income statement and prospectively, on and after the effective date, for the capitalization of the service cost component of net periodic pension cost and net periodic postretirement benefit in assets. The Company does not anticipate that adoption of this standard will have a material impact on its consolidated financial statements as the pension plan is frozen.
In January 2017, the FASB issued ASU 2017-04, Intangibles - Goodwill and Other (Topic 350) - Simplifying the Test for Goodwill Impairment. This ASU eliminates Step 2 of the goodwill impairment test and requires goodwill impairment to be measured as the amount by which a reporting unit’s carrying amount exceeds its fair value, not to exceed the carrying amount of its goodwill. The ASU is effective for annual or any interim goodwill impairment tests in fiscal years beginning after December 15, 2019. The guidance allows for early adoption for impairment testing dates after January 1, 2017. While the Company has elected not to early adopt this guidance for fiscal year 2017 and will continue to evaluate the timing of adoption, it does not believe that the adoption of this guidance will have a material impact on its consolidated financial statements.
In November 2016, the FASB issued ASU 2016-18, Statement of Cash Flows (Topic 230) - Restricted Cash. This ASU requires that companies include amounts generally described as restricted cash and restricted cash equivalents, along with cash and cash equivalents, when reconciling the beginning-of-period and end-of-period amounts shown on the statement of cash flows. The ASU should be applied using a retrospective transition method to each period presented and is effective for annual reporting periods beginning after December 15, 2017 and interim periods within those annual periods. To the extent there are changes in the Company’s restricted cash balances, adoption of this standard will impact the presentation within the statement of cash flows.
In October 2016, the FASB issued ASU 2016-16, Accounting for Income Taxes: Intra-Entity Transfers of Assets Other Than Inventory (Topic 740). This ASU requires immediate recognition of the income tax consequences of intercompany asset transfers other than inventory. The ASU is effective for annual reporting periods beginning after December 15, 2017 and interim periods within those annual periods. The Company does not anticipate that adoption of this standard will have a material impact on its consolidated financial statements.
In June 2016, the FASB issued ASU 2016-13, Financial Instruments – Credit Losses: Measurement of Credit Losses on Financial Instruments, which introduces new guidance for the accounting for credit losses on instruments. The new guidance introduces an approach based on expected losses to estimate credit losses on certain types of financial instruments. This ASU is effective for fiscal years beginning after December 15, 2019 including interim periods within that reporting period, with early adoption permitted for fiscal years beginning after December 15, 2018. The Company is currently evaluating the impact the adoption of this standard will have on its consolidated financial statements.
In February 2016, the FASB issued ASU 2016-02, Leases (Topic 842). Under ASU 2016-02, an entity will be required to recognize right-of-use assets and lease liabilities on its balance sheet and disclose key information about leasing arrangements. ASU 2016-02 offers specific accounting guidance for a lessee, a lessor and sale and leaseback transactions. Lessees and lessors are required to disclose qualitative and quantitative information about leasing arrangements to enable a user of the financial statements to assess the amount, timing and uncertainty of cash flows arising from leases. The new standard is effective for the Company beginning January 1, 2019 and requires a modified retrospective approach. The Company is currently evaluating the impact the adoption of this standard will have on its consolidated financial statements.
In May 2014, the FASB issued ASU 2014-09, Revenue from Contracts with Customers, to clarify the principles used to recognize revenue for all entities. Under ASU 2014-09, an entity will recognize revenue when it transfers promised goods or services to customers in an amount that reflects the consideration to which a company expects to be entitled in exchange for those goods or services. Additional disclosures will also be required to help users of financial statements understand the nature, amount, and timing of revenue and cash flows arising from contracts. The new guidance is effective January 1, 2018, with early adoption permitted for January 1, 2017. Entities have the option to apply the new guidance under a retrospective approach to each prior reporting period presented, or a modified retrospective approach with the cumulative effect of initially applying the new guidance recognized at the date of initial application within the Consolidated Statements of Shareholders’ Equity. The Company will adopt the new guidance effective January 1, 2018 under the modified retrospective approach. As part of the implementation plan developed, the Company identified its revenue streams and completed its contract review for each of these revenue streams to assess the impact of the new guidance on its consolidated financial statements. This assessment included the potential impact of whether revenue from certain product lines would be required to be recognized over time rather than at a point in time. Based on the results of these reviews, the adoption of this standard will not have a material impact on the timing or measurement of revenue recognition in the Company’s consolidated financial statements. Additionally, the standard requires new disclosures related to revenue, which the Company is in the process of finalizing.
34
MYERS INDUSTRIES, INC. AND SUBSIDIARIES
Notes to Consolidated Financial Statements - (Continued)
(Dollars in thousands, except where otherwise indicated)
Translation of Foreign Currencies
All asset and liability accounts of consolidated foreign subsidiaries are translated at the current exchange rate as of the end of the accounting period and income statement items are translated monthly at an average currency exchange rate for the period. The resulting translation adjustment is recorded in other comprehensive income (loss) as a separate component of shareholders' equity.
Fair Value Measurement
The Company follows guidance included in Accounting Standards Codification (“ASC”) 820, Fair Value Measurements and Disclosures, for its financial assets and liabilities, as required. The guidance established a common definition for fair value to be applied under U.S. GAAP requiring the use of fair value, established a framework for measuring fair value, and expanded disclosure requirements about such fair value measurements. The guidance did not require any new fair value measurements, but rather applied to all other accounting pronouncements that require or permit fair value measurements. Under ASC 820, the hierarchy that prioritizes the inputs to valuation techniques used to measure fair value is divided into three levels:
|
|
Level 1: |
Unadjusted quoted prices in active markets for identical assets or liabilities. |
|
|
Level 2: |
Unadjusted quoted prices in active markets for similar assets or liabilities, unadjusted quoted prices for identical similar assets or liabilities in markets that are not active or inputs that are observable either directly or indirectly. |
|
|
Level 3: |
Unobservable inputs for which there is little or no market data or which reflect the entity’s own assumptions. |
The Company has financial instruments, including cash, accounts receivable, accounts payable and accrued expenses. The fair value of these financial instruments approximate carrying value due to the nature and relative short maturity of these assets and liabilities.
The fair value of debt under the Company’s Loan Agreement, as defined in Note 10, approximates carrying value due to the floating rates and relative short maturity (less than 90 days) of the revolving borrowings under this agreement. The fair value of the Company’s fixed rate senior unsecured notes was estimated using market observable inputs for the Company’s comparable peers with public debt, including quoted prices in active markets and interest rate measurements which are considered Level 2 inputs. At December 31, 2017 and 2016, the aggregate fair value of the Company's outstanding fixed rate senior unsecured notes was estimated at $78.0 million and $98.0 million, respectively.
Concentration of Credit Risk
Financial instruments that potentially subject the Company to concentration of credit risk primarily consist of trade accounts receivable. The concentration of accounts receivable credit risk is generally limited based on the Company’s diversified operations, with customers spread across many industries and countries. The Company’s largest single customer in 2017 accounts for approximately 5% of net sales with no other customer greater than 4%. Outside of the United States, only customers located in Canada, which account for approximately 2.4% of net sales, are significant to the Company’s operations. In addition, management has established certain requirements that customers must meet before credit is extended. The financial condition of customers is continually monitored and collateral is usually not required. The Company evaluates the collectability of accounts receivable based on a combination of factors. In circumstances where the Company is aware of a specific customer’s inability to meet its financial obligations, a specific allowance for doubtful accounts is recorded against amounts due to reduce the net recognized receivable to the amount the Company reasonably believes will be collected. Additionally, the Company also reviews historical trends for collectability in determining an estimate for its allowance for doubtful accounts. If economic circumstances change substantially, estimates of the recoverability of amounts due the Company could be reduced by a material amount. Expense related to bad debts was approximately $0.7 million, $0.8 million and $0.3 million for 2017, 2016 and 2015, respectively, and is recorded within selling expenses in the Consolidated Statement of Operations. Deductions from the allowance for doubtful accounts, net of recoveries, were approximately $0.7 million, $0.4 million and $0.5 million for 2017, 2016 and 2015, respectively.
Inventories
Inventories are valued at the lower of cost or market for last-in, first-out (“LIFO”) inventory and lower of cost or net realizable value for first-in, first-out (“FIFO”) inventory. Approximately 30 percent of our inventories are valued using the LIFO method of determining cost. Cost of other inventories is determined using methods that approximate the FIFO method.
35
MYERS INDUSTRIES, INC. AND SUBSIDIARIES
Notes to Consolidated Financial Statements - (Continued)
(Dollars in thousands, except where otherwise indicated)
Inventories at December 31 consist of the following:
|
|
|
December 31, |
|
|
December 31, |
|
||
|
|
|
2017 |
|
|
2016 |
|
||
|
Finished and in-process products |
|
$ |
30,874 |
|
|
$ |
31,081 |
|
|
Raw materials and supplies |
|
|
16,151 |
|
|
|
13,704 |
|
|
|
|
$ |
47,025 |
|
|
$ |
44,785 |
|
If the FIFO method of inventory cost valuation had been used exclusively by the Company, inventories would have been $5.6 million and $4.7 million higher than reported at December 31, 2017 and 2016, respectively. Cost of sales decreased by $0.1 million and less than $0.1 million in 2017 and 2015, respectively, as a result of the liquidation of LIFO inventories. Cost of sales increased by $0.1 million in 2016 as a result of the liquidation of LIFO inventories.
Property, Plant and Equipment
Property, plant and equipment are carried at cost less accumulated depreciation and amortization. The Company provides for depreciation and amortization on the basis of the straight-line method over the estimated useful lives of the assets as follows:
|
Buildings |
20 to 40 years |
|
Machinery and Equipment |
3 to 10 years |
|
Leasehold Improvements |
5 to 10 years |
The Company’s property, plant and equipment by major asset class at December 31 consists of:
|
|
|
December 31, |
|
|
December 31, |
|
||
|
|
|
2017 |
|
|
2016 |
|
||
|
Land |
|
$ |
7,815 |
|
|
$ |
8,916 |
|
|
Buildings and leasehold improvements |
|
|
59,730 |
|
|
|
65,425 |
|
|
Machinery and equipment |
|
|
260,880 |
|
|
|
299,065 |
|
|
|
|
|
328,425 |
|
|
|
373,406 |
|
|
Less allowances for depreciation and amortization |
|
|
(244,521 |
) |
|
|
(267,140 |
) |
|
|
|
$ |
83,904 |
|
|
$ |
106,266 |
|
At December 31, 2017 and 2016, the Company had approximately $6.9 million and $6.2 million, respectively, of capitalized software costs included in machinery and equipment. Amortization expense related to capitalized software costs was approximately $1.0 million, $0.6 million and $0.5 million in 2017, 2016 and 2015, respectively.
Long-Lived Assets
The Company reviews its long-lived assets and identifiable intangible assets with finite lives for impairment whenever events or changes in circumstances indicate that the carrying amount of an asset may not be recoverable. Determination of potential impairment related to assets to be held and used is based upon undiscounted future cash flows resulting from the use and ultimate disposition of the asset. For assets held for sale, the amount of potential impairment may be based upon appraisal of the asset, estimated market value of similar assets or estimated cash flow from the disposition of the asset. Refer to Note 2 for discussion of the impairment charges.
Revenue Recognition
The Company recognizes revenues from the sale of products, net of actual and estimated returns, at the point of passage of title and risk of loss, which is generally at time of shipment, and collectability of the fixed or determinable sales price is reasonably assured.
36
MYERS INDUSTRIES, INC. AND SUBSIDIARIES
Notes to Consolidated Financial Statements - (Continued)
(Dollars in thousands, except where otherwise indicated)
Accumulated Other Comprehensive Income (Loss)
Changes in accumulated other comprehensive income (loss) and are as follows:
|
|
|
Foreign Currency |
|
|
Defined Benefit Pension Plans |
|
|
Total |
|
|||
|
Balance at January 1, 2015 |
|
$ |
(9,825 |
) |
|
$ |
(1,863 |
) |
|
$ |
(11,688 |
) |
|
Other comprehensive income before reclassifications |
|
|
(17,131 |
) |
|
|
144 |
|
|
|
(16,987 |
) |
|
Amounts reclassified from accumulated other comprehensive income, net of tax of ($32) (1) |
|
|
(10,491 |
) |
|
|
56 |
|
|
|
(10,435 |
) |
|
Net current-period other comprehensive income (loss) |
|
|
(27,622 |
) |
|
|
200 |
|
|
|
(27,422 |
) |
|
Balance at December 31, 2015 |
|
|
(37,447 |
) |
|
|
(1,663 |
) |
|
|
(39,110 |
) |
|
Other comprehensive income (loss) before reclassifications |
|
|
5,105 |
|
|
|
(222 |
) |
|
|
4,883 |
|
|
Amounts reclassified from accumulated other comprehensive income, net of tax of ($30) (1) |
|
|
— |
|
|
|
53 |
|
|
|
53 |
|
|
Net current-period other comprehensive income (loss) |
|
|
5,105 |
|
|
|
(169 |
) |
|
|
4,936 |
|
|
Balance at December 31, 2016 |
|
|
(32,342 |
) |
|
|
(1,832 |
) |
|
|
(34,174 |
) |
|
Other comprehensive income before reclassifications |
|
|
2,391 |
|
|
|
(31 |
) |
|
|
2,360 |
|
|
Amounts reclassified from accumulated other comprehensive income, net of tax of ($24) (1) (2) |
|
|
17,201 |
|
|
|
72 |
|
|
|
17,273 |
|
|
Net current-period other comprehensive income (loss) |
|
|
19,592 |
|
|
|
41 |
|
|
|
19,633 |
|
|
Balance at December 31, 2017 |
|
$ |
(12,750 |
) |
|
$ |
(1,791 |
) |
|
$ |
(14,541 |
) |
|
|
(1) |
The accumulated other comprehensive income (loss) components related to defined benefit pension plans are included in the computation of net periodic pension cost. See Note 12, Retirement Plans for additional details. |
|
|
(2) |
Cumulative translation adjustment associated with the sale of the Brazil Business, as further discussed in Note 4, was included in the carrying value of assets disposed of. |
Shipping and Handling
Costs for shipments to customers are classified as selling expenses for the Company’s manufacturing business and as cost of sales for the Company’s distribution business in the accompanying Consolidated Statements of Operations. The Company incurred costs for shipments to customers of approximately $8.2 million, $8.9 million and $8.5 million in selling expenses for the years ended December 31, 2017, 2016 and 2015, respectively and $6.0 million, $6.1 million, and $6.2 million in cost of sales for the years ended December 31, 2017, 2016 and 2015. All other internal distribution costs are recorded in selling expenses.
Stock Based Compensation
The Company has stock plans that provide for the granting of stock-based compensation to employees and to non-employee directors. Shares issued for option exercises or restricted shares may be either from authorized but unissued shares or treasury shares. The Company records the costs of the plan under the provisions of ASC 718, Compensation — Stock Compensation. For transactions in which the Company obtains employee services in exchange for an award of equity instruments, the Company measures the cost of the services based on the grant date fair value of the award. The Company recognizes the cost over the period during which an employee is required to provide services in exchange for the award, referred to as the requisite service period (usually the vesting period).
Income Taxes
Income taxes are accounted for under the liability method. Deferred tax assets and liabilities are recognized for the future tax consequences attributable to differences between the financial statement carrying amounts of assets and liabilities and their respective tax bases and operating loss and tax credit carryforwards. Deferred tax assets and liabilities are measured using enacted tax rates expected to apply to taxable income in the years in which those differences are expected to be received or settled. The effect on deferred tax assets and liabilities of a change in tax rates is recognized in income in the period the change is enacted.
37
MYERS INDUSTRIES, INC. AND SUBSIDIARIES
Notes to Consolidated Financial Statements - (Continued)
(Dollars in thousands, except where otherwise indicated)
The Company evaluates its tax positions in accordance with ASC 740, Income Taxes. ASC 740 provides detailed guidance for the financial statement recognition, measurement and disclosure of uncertain tax positions recognized in an enterprise’s financial statements. Income tax positions must meet a more-likely-than-not recognition threshold at the effective date to be recognized under ASC 740. The Company recognizes potential accrued interest and penalties related to unrecognized tax benefits as a component of income tax expense.
Cash and Cash Equivalents
The Company considers all highly liquid instruments purchased with a maturity of three months or less to be cash equivalents. Cash equivalents are stated at cost, which approximates market value. The Company maintains operating cash and reserves for replacement balances in financial institutions which, from time to time, may exceed federally insured limits. The Company periodically assesses the financial condition of these institutions and believes that the risk of loss is minimal.
Cash flows used in investing activities excluded $0.6 million, $0.1 million and $6.6 million of accrued capital expenditures in 2017, 2016 and 2015, respectively.
2. Impairment Charges
During the second quarter of 2017, an underutilized building at the Company’s Scarborough, Ontario, Canada location, in the Material Handling Segment, was identified for closure and classified as held for sale as of June 30, 2017. This building was recorded at its fair value, less estimated costs to sell, of $3.2 million (based primarily on a third party offer considered to be a Level 2 input), which resulted in an impairment charge of approximately $0.5 million recognized in the second quarter of 2017. In December 2017, the building was sold for approximately $3.1 million, which resulted in an additional loss on sale of $0.1 million.
During 2016, the Company recorded impairment charges of $1.3 million, primarily related to long-lived assets associated with the exit of a non-strategic product line in the Material Handling Segment.
3. Goodwill and Intangible Assets
The Company tests for impairment of goodwill and indefinite-lived intangible assets on at least an annual basis, unless significant changes in circumstances indicate a potential impairment may have occurred sooner. Such changes in circumstances may include, but are not limited to, significant changes in economic and competitive conditions, the impact of the economic environment on the Company’s customer base or its businesses, or a material negative change in its relationships with significant customers.
The Company conducted its annual impairment assessment as of October 1 for all of its reporting units, noting no impairment in continuing operations in 2017, 2016 or 2015.
During the 2017 annual review of goodwill, management performed a qualitative assessment for all of its reporting units. After considering changes to assumptions used in the most recent quantitative annual testing for each reporting unit, including macroeconomic conditions, industry and market considerations, overall financial performance, the magnitude of the excess of fair value over the carrying amount of each reporting unit as determined in the most recent quantitative annual testing, and other factors, management concluded that it was not more likely than not that the fair values of the reporting units were less than their respective carrying values and, therefore, did not perform a quantitative analysis in 2017. A quantitative analysis was performed at October 1, 2016 and 2015.
The change in the carrying amount of goodwill for the years ended December 31, 2017 and 2016 is as follows:
|
|
|
Distribution |
|
|
Material Handling |
|
|
Total |
|
|||
|
January 1, 2016 |
|
$ |
505 |
|
|
$ |
58,382 |
|
|
$ |
58,887 |
|
|
Foreign currency translation |
|
|
— |
|
|
|
332 |
|
|
|
332 |
|
|
December 31, 2016 |
|
$ |
505 |
|
|
$ |
58,714 |
|
|
$ |
59,219 |
|
|
Foreign currency translation |
|
|
— |
|
|
|
752 |
|
|
|
752 |
|
|
December 31, 2017 |
|
$ |
505 |
|
|
$ |
59,466 |
|
|
$ |
59,971 |
|
38
MYERS INDUSTRIES, INC. AND SUBSIDIARIES
Notes to Consolidated Financial Statements - (Continued)
(Dollars in thousands, except where otherwise indicated)
Intangible assets other than goodwill primarily consist of trade names, customer relationships, patents, and technology assets established in connection with acquisitions. These intangible assets, other than certain trade names, are amortized over their estimated useful lives. The Company performs an annual impairment assessment for the indefinite lived trade names which had a carrying value of $9,972 and $10,050 at December 31, 2017 and 2016, respectively. In performing this assessment the Company uses an income approach, based primarily on Level 3 inputs, to estimate the fair value of the trade name. The Company records an impairment charge if the carrying value of the trade name exceeds the estimated fair value at the date of assessment.
Intangible assets at December 31, 2017 and 2016 consisted of the following:
|
|
|
|
|
|
|
2017 |
|
|
2016 |
|
||||||||||||||||||
|
|
|
Weighted Average Remaining Useful Life (years) |
|
|
Gross |
|
|
Accumulated Amortization |
|
|
Net |
|
|
Gross |
|
|
Accumulated Amortization |
|
|
Net |
|
|||||||
|
Trade Names – Indefinite Lived |
|
|
|
|
|
$ |
9,972 |
|
|
$ |
— |
|
|
$ |
9,972 |
|
|
$ |
10,050 |
|
|
$ |
— |
|
|
$ |
10,050 |
|
|
Trade Names |
|
|
7.5 |
|
|
|
80 |
|
|
|
(40 |
) |
|
|
40 |
|
|
|
80 |
|
|
|
(34 |
) |
|
|
46 |
|
|
Customer Relationships |
|
|
2.0 |
|
|
|
41,043 |
|
|
|
(27,396 |
) |
|
|
13,647 |
|
|
|
39,774 |
|
|
|
(21,127 |
) |
|
|
18,647 |
|
|
Technology |
|
|
6.2 |
|
|
|
24,980 |
|
|
|
(9,590 |
) |
|
|
15,390 |
|
|
|
24,980 |
|
|
|
(7,037 |
) |
|
|
17,943 |
|
|
Patents |
|
|
0.0 |
|
|
|
11,730 |
|
|
|
(11,730 |
) |
|
|
— |
|
|
|
11,730 |
|
|
|
(11,548 |
) |
|
|
182 |
|
|
|
|
|
|
|
|
$ |
87,805 |
|
|
$ |
(48,756 |
) |
|
$ |
39,049 |
|
|
$ |
86,614 |
|
|
$ |
(39,746 |
) |
|
$ |
46,868 |
|
Intangible amortization expense was $8,378, $9,277 and $9,447 in 2017, 2016 and 2015, respectively. Estimated annual amortization expense for intangible assets with finite lives for the next five years is: $8,198 in 2018; $7,824 in 2019; $4,946 in 2020; $2,278 in 2021 and $2,278 in 2022.
4. Discontinued Operations
On December 18, 2017, the Company, collectively with its wholly owned subsidiary, Myers Holdings Brasil, Ltda. (“Holdings”), completed the sale of its subsidiaries, Myers do Brasil Embalagens Plasticas Ltda. and Plasticos Novel do Nordeste Ltda. (collectively, the “Brazil Business”), to Novel Holdings – Eireli (“Buyer”), an entity controlled by a member of the Brazil Business’ management team. The divestiture of the Brazil Business will allow the Company to focus resources on its core businesses and additional growth opportunities. The Brazil Business is a leading designer and manufacturer of reusable plastic shipping containers, plastic pallets, crates and totes used for closed-loop shipping and storage in Brazil’s automotive, distribution, food, beverage and agriculture industries. The sale of the Brazil Business included manufacturing facilities and offices located in Lauro de Freitas City, Bahia, Brazil; Ibipora, Parana, Brazil; and Jaguarinuna, Brazil. The Brazil Business was part of the Company’s Material Handling Segment.
Pursuant to the terms of the Quota Purchase Agreement by and among the Company, Holdings and Buyer (the “Purchase Agreement”), the Buyer paid a purchase price of one U.S. Dollar to the Company and has assumed all liabilities and obligations of the Brazil Business, whether arising prior to or after the closing of the transaction. There are no additional amounts due, or to be settled, under the terms of the Purchase Agreement with the Buyer. The Company recorded a loss on the sale of the Brazil Business during the fourth quarter of 2017 of $35.0 million, which included $1.2 million of cash held by the Brazil Business and approximately $0.3 million of costs to sell. In addition, the Company recorded a U.S. tax benefit of approximately $15 million as a result of a worthless stock deduction related to the Company’s investment in the Brazil Business.
The Company has agreed to be the guarantor under a factoring arrangement between the Buyer and Banco Alfa de Investimento S.A. until December 31, 2019 for up to $7 million, in the event the Buyer is unable to meet its obligations under this arrangement. The Company also holds a first lien against certain machinery and equipment, exercisable only upon default by the Buyer under the guaranty. Based on the nature of the guaranty, as well as the existence of the lien, the Company believes the fair value of the guaranty is immaterial (based primarily on Level 3 inputs), and thus has recorded no liability related to this guaranty in the Consolidated Statement of Financial Position. This guaranty also creates a variable interest to the Company in the Brazil Business. Based on the terms of the transaction and the fact that the Company has no management involvement or voting interests in the Brazil Business following the sale, the Company does not have any power to direct the significant activities of the Brazil Business, and is thus not the primary beneficiary.
39
MYERS INDUSTRIES, INC. AND SUBSIDIARIES
Notes to Consolidated Financial Statements - (Continued)
(Dollars in thousands, except where otherwise indicated)
During the second quarter of 2014, the Company’s Board of Directors approved the commencement of the sale process to divest its Lawn and Garden business to allow it to focus resources on its core growth platforms. The business was sold February 17, 2015 to an entity controlled by Wingate Partners V, L.P. (“L&G Buyer”), a private equity firm, for $110.0 million, subject to a working capital adjustment. The terms of the agreement include a $90.0 million cash payment, promissory notes totaling $20.0 million that mature in August 2020, a 6% interest rate and approximately $8.6 million placed in escrow that was due to be settled by August 2016, but has been extended until certain indemnification claims are resolved, as discussed in Note 9. The fair value of the notes at the date of sale was $17.8 million. The carrying value of the notes as of December 31, 2017 and 2016, was $18.7 million and $18.3 million, respectively, which represents the fair value at date of sale plus accretion and is included in Notes Receivable in the accompanying Consolidated Statements of Financial Position. The fair value of the notes receivable was calculated using Level 2 inputs as defined in Note 1. Interest income on the notes receivable was $1.3 million, $1.3 million, and $1.0 million during the years ended December 31, 2017, 2016 and 2015 and was recognized based on the stated interest rate above. The final working capital adjustment resulted in a cash payment to the buyer of approximately $4.0 million in 2016. The total gain on the sale of the Lawn and Garden business in 2015 was $0.5 million, net of tax, and is included in income (loss) from discontinued operations in the accompanying Consolidated Statements of Operations.
On June 20, 2014, the Company completed the sale of the assets and associated liabilities of its wholly-owned subsidiaries WEK Industries, Inc. and Whiteridge Plastics LLC (collectively “WEK”) for approximately $20.7 million, which includes a working capital adjustment of approximately $0.8 million. Of the total proceeds from the sale of WEK, approximately $1.0 million was held in escrow until it was received in December 2015. The Company recorded a gain on the sale of WEK in 2014 of approximately $3.0 million, net of tax of $1.6 million, which was included in income (loss) from discontinued operations in the Consolidated Statements of Operations.
Summarized selected financial information for Brazil Business, Lawn and Garden business and WEK for the years ended December 31, 2017, 2016 and 2015 are presented in the following table:
|
|
|
|
For the Year Ended December 31, |
|
|||||||||
|
|
|
|
2017* |
|
|
2016 |
|
|
2015** |
|
|||
|
Net sales |
|
|
$ |
29,976 |
|
|
$ |
23,683 |
|
|
$ |
59,853 |
|
|
Cost of sales |
|
|
|
25,359 |
|
|
|
20,941 |
|
|
|
50,772 |
|
|
Selling, general, and administrative |
|
|
|
6,748 |
|
|
|
5,438 |
|
|
|
13,898 |
|
|
(Gain) loss on disposal of assets |
|
|
|
(32 |
) |
|
|
226 |
|
|
|
62 |
|
|
Impairment charges |
|
|
|
— |
|
|
|
8,545 |
|
|
|
— |
|
|
Interest income, net |
|
|
|
(286 |
) |
|
|
(469 |
) |
|
|
(10 |
) |
|
Gain (loss) on the disposal of the discontinued operations |
|
|
|
(34,956 |
) |
|
|
— |
|
|
|
1,873 |
|
|
Loss from discontinued operations before income tax |
|
|
|
(36,769 |
) |
|
|
(10,998 |
) |
|
|
(2,996 |
) |
|
Income tax benefit |
|
|
|
(16,036 |
) |
|
|
(731 |
) |
|
|
(3,287 |
) |
|
Income (loss) from discontinued operations, net of income tax |
|
|
$ |
(20,733 |
) |
|
$ |
(10,267 |
) |
|
$ |
291 |
|
|
* |
Includes Brazil Business operating results through December 18, 2017. |
|
** |
Includes Lawn and Garden operating results through February 17, 2015. |
40
MYERS INDUSTRIES, INC. AND SUBSIDIARIES
Notes to Consolidated Financial Statements - (Continued)
(Dollars in thousands, except where otherwise indicated)
The assets and liabilities of discontinued operations are stated separately as of December 31, 2016 in the Consolidated Statement of Financial Position and are comprised of the following items:
|
|
|
December 31, 2016 |
|
|
|
Cash and cash equivalents |
|
$ |
5,484 |
|
|
Accounts receivable, net |
|
|
7,328 |
|
|
Inventories |
|
|
1,238 |
|
|
Prepaid expenses and other current assets |
|
|
148 |
|
|
Total current assets |
|
|
14,198 |
|
|
|
|
|
|
|
|
Intangible assets, net |
|
|
1,126 |
|
|
Deferred income taxes |
|
|
134 |
|
|
Property, plant and equipment, net |
|
|
5,215 |
|
|
Other |
|
|
34 |
|
|
Total noncurrent assets |
|
|
6,509 |
|
|
Total assets of the disposal group classified as discontinued operations |
|
$ |
20,707 |
|
|
|
|
|
|
|
|
Accounts payable |
|
$ |
1,415 |
|
|
Accrued expenses |
|
|
1,335 |
|
|
Total current liabilities |
|
|
2,750 |
|
|
|
|
|
|
|
|
Deferred income taxes |
|
|
249 |
|
|
Total noncurrent liabilities |
|
|
249 |
|
|
Total liabilities of the disposal group classified as discontinued operations |
|
$ |
2,999 |
|
5. Net Income (Loss) Per Common Share
Net income (loss) per common share, as shown on the accompanying Consolidated Statements of Operations, is determined on the basis of the weighted average number of common shares outstanding during the periods as follows:
|
|
|
For the Year Ended December 31, |
|
|||||||||
|
|
|
2017 |
|
|
2016 |
|
|
2015 |
|
|||
|
Weighted average common shares outstanding basic |
|
|
30,222,289 |
|
|
|
29,750,378 |
|
|
|
30,616,485 |
|
|
Dilutive effect of stock options and restricted stock |
|
|
340,357 |
|
|
|
217,534 |
|
|
|
327,208 |
|
|
Weighted average common shares outstanding diluted |
|
|
30,562,646 |
|
|
|
29,967,912 |
|
|
|
30,943,693 |
|
Options to purchase 242,500, 551,761 and 463,200 shares of common stock that were outstanding at December 31, 2017, 2016 and 2015, respectively, were not included in the computation of diluted earnings per share as the exercise prices of these options was greater than the average market price of common shares, and were therefore anti-dilutive.
6. Restructuring
The charges related to various restructuring programs implemented by the Company are included in cost of sales and selling, general and administrative (“SG&A”) expenses depending on the type of cost incurred. The restructuring charges recognized in the years ended 2017, 2016 and 2015 are presented in the following table.
|
|
|
|
2017 |
|
|
2016 |
|
|
2015 |
|
|||||||||||||||||||||||||||
|
Segment |
|
|
Cost of sales |
|
|
SG&A |
|
|
Total |
|
|
Cost of sales |
|
|
SG&A |
|
|
Total |
|
|
Cost of sales |
|
|
SG&A |
|
|
Total |
|
|||||||||
|
Distribution |
|
|
$ |
— |
|
|
$ |
— |
|
|
$ |
— |
|
|
$ |
— |
|
|
$ |
— |
|
|
$ |
— |
|
|
$ |
— |
|
|
$ |
124 |
|
|
$ |
124 |
|
|
Material Handling |
|
|
|
7,389 |
|
|
|
164 |
|
|
|
7,553 |
|
|
|
— |
|
|
|
— |
|
|
|
— |
|
|
|
1,340 |
|
|
|
912 |
|
|
|
2,252 |
|
|
Corporate |
|
|
|
— |
|
|
|
— |
|
|
|
— |
|
|
|
— |
|
|
|
— |
|
|
|
— |
|
|
|
— |
|
|
|
35 |
|
|
|
35 |
|
|
Total |
|
|
$ |
7,389 |
|
|
$ |
164 |
|
|
$ |
7,553 |
|
|
$ |
— |
|
|
$ |
— |
|
|
$ |
— |
|
|
$ |
1,340 |
|
|
$ |
1,071 |
|
|
$ |
2,411 |
|
41
MYERS INDUSTRIES, INC. AND SUBSIDIARIES
Notes to Consolidated Financial Statements - (Continued)
(Dollars in thousands, except where otherwise indicated)
On March 9, 2017, the Company announced a restructuring plan (the “Plan”) to improve the Company’s organizational structure and operational efficiency within the Material Handling Segment, which related primarily to anticipated facility shutdowns and associated activities. Total restructuring costs expected to be incurred are approximately $7.6 million, which includes employee severance and other employee-related costs of approximately $3.1 million, $2.5 million related to equipment relocation and facility shut down costs and non-cash charges, primarily accelerated depreciation charges on property, plant and equipment, of approximately $2.0 million. All actions under the Plan were substantially completed by the end of the year as further described below.
During 2017, the Company incurred restructuring charges of $5.5 million related to closing a manufacturing plant in Bluffton, Indiana. In the third quarter of 2017, the Bluffton facility and certain related equipment were sold for approximately $6.0 million, which resulted in a gain of $2.6 million. Additional gains of $1.5 million for the year ended December 31, 2017 were recognized on other asset dispositions in connection with closing this plant.
In the second quarter of 2017, the Company finalized the specific actions to be taken under the Plan to reduce headcount in its Scarborough, Ontario, Canada location. These actions resulted in the recognition of $1.6 million of severance and related costs for the year ended December 31, 2017.
During 2017, the Company recognized $0.5 million of restructuring charges related to the planned closure of a manufacturing plant in Sandusky, Ohio, which is expected to take place in the first quarter of 2018.
The table below summarizes restructuring activity for the year ended December 31, 2017:
|
|
|
Employee Reduction |
|
|
Accelerated Depreciation |
|
|
Other Exit Costs |
|
|
Total |
|
||||
|
Balance at January 1, 2017 |
|
$ |
— |
|
|
$ |
— |
|
|
$ |
— |
|
|
$ |
— |
|
|
Charges to expense |
|
|
3,022 |
|
|
|
1,993 |
|
|
|
2,538 |
|
|
|
7,553 |
|
|
Cash payments |
|
|
(1,924 |
) |
|
|
— |
|
|
|
(2,448 |
) |
|
|
(4,372 |
) |
|
Non-cash utilization |
|
|
— |
|
|
|
(1,993 |
) |
|
|
— |
|
|
|
(1,993 |
) |
|
Balance at December 31, 2017 |
|
$ |
1,098 |
|
|
$ |
— |
|
|
$ |
90 |
|
|
$ |
1,188 |
|
In addition to the restructuring costs noted above, the Company has also incurred other associated costs of the Plan of $1.1 million for the year ended December 31, 2017, of which $0.1 million is included in cost of sales and $1.0 is included in general and administrative expenses in the accompanying Consolidated Statements of Operations, and are primarily related to third party consulting costs.
In 2015, the Material Handling Segment consolidated two manufacturing plants, streamlined Brazilian operations, closed a Canadian branch operation and sold a product line. The Company recorded $2.3 million of restructuring cost for these initiatives, primarily related to severance and moving expenses for equipment and inventory.
7. Other Current Liabilities
As of December 31, 2017 and 2016, the balance in other current liabilities is comprised of the following:
|
|
|
December 31, |
|
|
December 31, |
|
||
|
|
|
2017 |
|
|
2016 |
|
||
|
Deposits and amounts due to customers |
|
$ |
3,102 |
|
|
$ |
2,562 |
|
|
Dividends payable |
|
|
4,478 |
|
|
|
4,260 |
|
|
Accrued litigation and professional fees |
|
|
417 |
|
|
|
452 |
|
|
Current portion of environmental reserves |
|
|
1,322 |
|
|
|
605 |
|
|
Other accrued expenses |
|
|
6,153 |
|
|
|
5,032 |
|
|
|
|
$ |
15,472 |
|
|
$ |
12,911 |
|
42
MYERS INDUSTRIES, INC. AND SUBSIDIARIES
Notes to Consolidated Financial Statements - (Continued)
(Dollars in thousands, except where otherwise indicated)
Subject to shareholder approval, which was received on April 26, 2017, the Board of Directors approved the Company’s Amended and Restated 2017 Incentive Stock Plan (the “2017 Plan”) on March 2, 2017. The 2017 Plan authorizes the Compensation Committee of the Board of Directors to issue up to 5,126,950 shares of various stock awards including stock options, performance stock units, restricted stock units and other forms of equity-based awards to key employees and directors. Options granted and outstanding vest over the requisite service period and expire ten years from the date of grant.
The following tables summarize stock option activity in the past three years:
Options granted in 2017, 2016 and 2015 were as follows:
|
Year |
|
Options |
|
|
Exercise Price |
|
||
|
2017 |
|
|
397,759 |
|
|
$ |
14.30 |
|
|
2016 |
|
|
271,350 |
|
|
$ |
11.62 |
|
|
2015 |
|
|
208,200 |
|
|
$ |
18.67 |
|
Options exercised in 2017, 2016 and 2015 were as follows:
|
Year |
|
Options |
|
|
Exercise Price |
|
|
2017 |
|
|
375,292 |
|
|
$9.97 to $20.93 |
|
2016 |
|
|
334,836 |
|
|
$9.00 to $14.77 |
|
2015 |
|
|
239,508 |
|
|
$9.97 to $17.02 |
In addition, options totaling 218,130, 162,565 and 71,567 expired or were forfeited during the years ended December 31, 2017, 2016 and 2015, respectively.
Options outstanding and exercisable at December 31, 2017, 2016 and 2015 were as follows:
|
Year |
|
Outstanding |
|
|
Range of Exercise Prices |
|
Exercisable |
|
|
Weighted Average Exercise Price |
|
|||
|
2017 |
|
|
988,167 |
|
|
$9.97 to $20.93 |
|
|
539,993 |
|
|
$ |
16.23 |
|
|
2016 |
|
|
1,183,830 |
|
|
$9.97 to $20.93 |
|
|
934,898 |
|
|
$ |
14.88 |
|
|
2015 |
|
|
1,409,881 |
|
|
$9.00 to $20.93 |
|
|
1,231,544 |
|
|
$ |
13.47 |
|
The fair value of options granted is estimated using an option pricing model based on the assumptions set forth in the following table. The Company uses historical data to estimate employee exercise and departure behavior. The risk free interest rate is based on the U.S. Treasury yield curve in effect at the time of grant and through the expected term. The dividend yield rate is based on the Company’s historical dividend yield. The expected volatility is derived from historical volatility of the Company’s shares and those of similar companies measured against the market as a whole. In 2017, 2016 and 2015, the Company used the binomial lattice option pricing model based on the assumptions set forth in the following table.
|
|
|
2017 |
|
|
2016 |
|
|
2015 |
|
|||
|
Risk free interest rate |
|
|
2.50 |
% |
|
|
1.80 |
% |
|
|
2.10 |
% |
|
Expected dividend yield |
|
|
3.80 |
% |
|
|
4.60 |
% |
|
|
2.90 |
% |
|
Expected life of award (years) |
|
|
4.10 |
|
|
8.00 |
|
|
|
8.00 |
|
|
|
Expected volatility |
|
|
50.00 |
% |
|
|
50.00 |
% |
|
|
50.00 |
% |
|
Fair value per option |
|
$ |
4.47 |
|
|
$ |
3.45 |
|
|
$ |
6.03 |
|
43
MYERS INDUSTRIES, INC. AND SUBSIDIARIES
Notes to Consolidated Financial Statements - (Continued)
(Dollars in thousands, except where otherwise indicated)
The following table provides a summary of stock option activity for the period ended December 31, 2017:
|
|
|
Shares |
|
|
Average Exercise Price |
|
|
Weighted Average Life (in Years) |
|
|||
|
Outstanding at December 31, 2016 |
|
|
1,183,830 |
|
|
$ |
14.50 |
|
|
|
|
|
|
Options granted |
|
|
397,759 |
|
|
|
14.30 |
|
|
|
|
|
|
Options exercised |
|
|
(375,292 |
) |
|
|
11.71 |
|
|
|
|
|
|
Canceled or forfeited |
|
|
(218,130 |
) |
|
|
16.08 |
|
|
|
|
|
|
Expired |
|
|
— |
|
|
|
— |
|
|
|
|
|
|
Outstanding at December 31, 2017 |
|
|
988,167 |
|
|
|
15.13 |
|
|
|
7.24 |
|
|
Exercisable at December 31, 2017 |
|
|
539,993 |
|
|
$ |
16.23 |
|
|
|
5.85 |
|
The intrinsic value of a stock option is the amount by which the market value of the underlying stock exceeds the exercise price of the option. The intrinsic value of stock options exercised in 2017, 2016 and 2015 was $2,813, $1,809 and $1,151, respectively.
The following table provides a summary of restricted stock units and restricted stock activity for the year ended December 31, 2017:
|
|
|
Shares |
|
|
Average Grant-Date Fair Value |
|
||
|
Unvested shares at December 31, 2016 |
|
|
331,410 |
|
|
|
|
|
|
Granted |
|
|
238,111 |
|
|
$ |
14.57 |
|
|
Vested |
|
|
(100,006 |
) |
|
|
14.89 |
|
|
Forfeited |
|
|
(56,865 |
) |
|
|
13.91 |
|
|
Unvested shares at December 31, 2017 |
|
|
412,650 |
|
|
|
|
|
Restricted stock units are rights to receive shares of common stock, subject to forfeiture and other restrictions, which vest over a two or three year period. Restricted shares are considered to be non-vested shares under the accounting guidance for share-based payment and are not reflected as issued and outstanding shares until the restrictions lapse. At that time, the shares are released to the grantee and the Company records the issuance of the shares. Restricted stock awards are valued based on the market price of the underlying shares on the grant date. Compensation expense is recognized on a straight-line basis over the requisite service period. At December 31, 2017, restricted stock awards had vesting periods up through December 2020.
Included in the December 31, 2017 unvested shares are 211,769 performance-based restricted stock units. The fair value of these awards is calculated using the market price of the underlying common stock on the date of grant. In determining fair value, the Company does not take into account performance-based vesting requirements. For these awards, the performance-based vesting requirements determines the number of shares that ultimately vest, which can vary from 0% to 200% of target depending on the level of achievement of established performance criteria. Compensation expense is recognized over the requisite service period subject to adjustment based on the probable number of shares expected to vest under the performance condition.
Stock compensation expense was approximately $3,626, $3,357 and $4,934 for the years ended December 31, 2017, 2016 and 2015, respectively. These expenses are included in general and administrative expenses in the accompanying Consolidated Statements of Operations. Total unrecognized compensation cost related to non-vested share based compensation arrangements at December 31, 2017 was approximately $5,317 which will be recognized over the next three years, as such compensation is earned.
9. Contingencies
The Company is a defendant in various lawsuits and a party to various other legal proceedings, in the ordinary course of business, some of which are covered in whole or in part by insurance. We believe that the outcome of these lawsuits and other proceedings will not individually or in the aggregate have a future material adverse effect on our consolidated financial position, results of operations or cash flows.
44
MYERS INDUSTRIES, INC. AND SUBSIDIARIES
Notes to Consolidated Financial Statements - (Continued)
(Dollars in thousands, except where otherwise indicated)
In September 2015, the U.S. Environmental Protection Agency (“EPA”) formally informed a subsidiary of the Company, Buckhorn, Inc. (“Buckhorn”) via a notice letter and related documents (the “Notice Letter”) that it considers Buckhorn to be a potentially responsible party (“PRP”) in connection with the New Idria Mercury Mine Superfund site (“New Idria Mine”). New Idria Mining & Chemical Company (“NIMCC”), which owned and/or operated the New Idria Mine from 1936 through 1976 was merged into Buckhorn Metal Products Inc. in 1981, which was subsequently acquired by Myers Industries in 1987. As a result of the EPA Notice Letter, Buckhorn and the Company have been engaged in negotiations with the EPA with respect to a draft Settlement Agreement and Administrative Order on Consent (“AOC”) proposed by the EPA for the Remedial Investigation/Feasibility Study (“RI/FS”) to determine the extent of remediation necessary and the screening of alternatives.
The Company and the EPA are in the final stages of negotiation on the AOC and related Statement of Work (“SOW”) with regards to the New Idria Mine, and the Company expects to execute the AOC in March 2018. The key terms of the AOC and SOW include, but are not limited to, scope of the site, categories of and schedules for completion of required tasks, administration of future oversight costs, stipulated penalties, and resolution of any disputed items between the parties. As a result of recent negotiations, the Company recognized expected future EPA oversight costs for the RI/FS of $1 million in 2017. In addition, the AOC will require the Company to provide $2 million of financial assurance to the EPA during the estimated three year life of the RI/FS. Per federal statutes, this financial assurance can take several forms, including a financial guarantee by the Company, a letter of credit, or a surety bond. The Company expects to provide this assurance within 30 days following the execution of the AOC, and is currently evaluating the options available under the statute.
The New Idria Mine is located near Hollister, California and was added to the Superfund National Priorities List by the EPA in October 2011, at which time the Company recognized expense of $1.9 million related to performing the RI/FS. In the second quarter of 2016, the Company, based on discussions with the EPA, determined that the RI/FS would begin in 2017 and therefore obtained updated estimated costs to perform the RI/FS. As a result of the updated estimated costs, the Company recorded additional expense of $1.0 million in the second quarter of 2016. In the second quarter of 2017, the Company, based on the status of its discussions with the EPA, determined that field work on the RI/FS would likely begin in 2018 with no changes to the cost estimates to perform the RI/FS. In the third quarter of 2017, the Company recorded an additional reserve of $0.3 million for this project, as a result of additional professional fees and other project costs expected to be incurred as part of the implementation of the AOC and site preparation and stabilization, in advance of starting the RI/FS field work in 2018.
As part of the Notice Letter, the EPA also made a claim for approximately $1.6 million in past costs for actions it claims it has taken in connection with the New Idria Mine since 1993. While the Company is evaluating this past cost claim and may challenge portions of it, in 2015 the Company recognized an expense of $1.3 million related to the claim. These past costs will not be addressed or settled upon execution of the AOC discussed above.
As of December 31, 2017 and 2016, the Company had a total reserve of $3.6 million and $2.5 million, respectively, related to the New Idria Mine. As of December 31, 2017, $1.0 million is classified in Other Current Liabilities and $2.6 million is classified in Other Liabilities on the Consolidated Statements of Financial Position. All charges related to this claim have been recorded with general and administrative expenses in the Consolidated Statement of Operations.
As negotiations with the EPA proceed it is possible that adjustments to the aforementioned reserves will be necessary to reflect new information. Estimates of the Company’s liability are based on current facts, laws, regulations and technology. Estimates of the Company’s environmental liabilities are further subject to uncertainties regarding the negotiations with EPA, the nature and extent of the specific tasks required in the RI/FS, the nature and extent of site contamination, the range of remediation alternatives available, evolving remediation standards, imprecise engineering evaluation and cost estimates, the extent of remedial actions that may be required, the number and financial condition of other PRPs that may be named as well as the extent of their responsibility for the remediation, and the availability of insurance coverage for these expenses.
At this time, we have not accrued for remediation costs in connection with this site as we are unable to estimate the liability, given the circumstances referred to above, including the fact that the final remediation strategy has not yet been determined.
45
MYERS INDUSTRIES, INC. AND SUBSIDIARIES
Notes to Consolidated Financial Statements - (Continued)
(Dollars in thousands, except where otherwise indicated)
New Almaden Mine (formerly referred to as Guadalupe River Watershed)
A number of parties, including the Company and its subsidiary, Buckhorn (as successor to NIMCC), were alleged by trustee agencies of the United States and the State of California to be responsible for natural resource damages due to environmental contamination of areas comprising the historical New Almaden mercury mines located in the Guadalupe River Watershed region in Santa Clara County, California (“County”). In 2005, Buckhorn and the Company, without admitting liability or chain of ownership of NIMCC, resolved the trustees’ claim against them through a consent decree that required them to contribute financially to the implementation by the County of an environmentally beneficial project within the impacted area. Buckhorn and the Company negotiated an agreement with the County, whereby Buckhorn and the Company agreed to reimburse one-half of the County’s costs of implementing the project, originally estimated to be approximately $1.6 million. As a result, in 2005, the Company recognized expense of $0.8 million representing its share of the initial estimated project costs, of which approximately $0.5 million has been paid to date. In April 2016, the Company was notified by the County that the original cost estimate may no longer be appropriate due to expanded scope and increased costs of construction, and provided a revised estimate of between $3.3 million and $4.4 million. The Company completed a detailed review of the support provided by the County for the revised estimate, and as a result, recognized additional expense of $1.2 million in the second and third quarters of 2016. As of December 31, 2017 and 2016, the Company has a total reserve of $1.5 million related to the New Almaden Mine. As of December 31, 2017, $0.3 million is classified in Other Current Liabilities and $1.2 million is classified in Other Liabilities on the Consolidated Statements of Financial Position. All charges related to this claim have been recorded with general and administrative expenses in the Consolidated Statement of Operations.
The project has not yet been implemented though significant work on design and planning has been performed. Field work on the project is expected to commence in 2018. As work on the project occurs, it is possible that adjustments to the aforementioned reserves will be necessary to reflect new information. In addition, the Company may have claims against and defenses to claims by the County under the 2005 agreement that could reduce or offset its obligation for reimbursement of some of these potential additional costs. With the assistance of environmental consultants, the Company will closely monitor this matter and will continue to assess its reserves as additional information becomes available.
Lawn and Garden Indemnification Claim
In connection with the sale of the Lawn and Garden business, as described in Note 4, the Company received a Notices of Indemnification Claims in April 2015 and July 2016 (collectively, the “Claims”), alleging breaches of certain representations and warranties under the agreement resulting in alleged losses in the amount of approximately $10 million. As described in Note 4, approximately $8.6 million of the sale proceeds that were placed in escrow were due to be settled in August 2016, but continue in escrow until the Claims are resolved, which are the subject of a lawsuit in the Delaware Chancery Court.
In December 2017, the Delaware Chancery Court issued a non-final opinion in favor of the L&G Buyer that it is entitled to a distribution of the escrow property on technical grounds, without resolving the merits of the alleged breaches that are the subject of the Claims. The Company intends to appeal this decision, and has the right to a de novo review and believes it has meritorious grounds to reverse the decision. The Company also believes that it has meritorious defenses to the L&G Buyer’s Claims and will vigorously defend its position that it is entitled to the escrow property.
Other
Buckhorn and Schoeller Arca Systems, Inc. (“SAS”) were plaintiffs in a patent infringement lawsuit against Orbis Corp. and Orbis Material Handling, Inc. (“Orbis”) for alleged breach by Orbis of an exclusive patent license agreement from SAS to Buckhorn. SAS is an affiliate of Schoeller Arca Systems Services B.V. (“SASS B.V.”), a Dutch company. SAS manufactures and sells plastic returnable packaging systems for material handling. In the course of the litigation, it was discovered that SAS had given a patent license agreement to a predecessor of Orbis that pre-dated the one that SAS sold to Buckhorn. As a result, judgment was entered in favor of Orbis, and the court awarded attorney fees and costs to Orbis in the amount of $3.1 million, plus interest and costs.
46
MYERS INDUSTRIES, INC. AND SUBSIDIARIES
Notes to Consolidated Financial Statements - (Continued)
(Dollars in thousands, except where otherwise indicated)
In May 2014, Orbis made demand to SAS that SAS pay the judgment in full, and subsequently in July 2014, Orbis made the same demand to Buckhorn. Buckhorn believed it was not responsible for any of the judgment because it was not a party to the Orbis license. Despite this belief, the Company recorded expense of $3.0 million during the third quarter of 2014 for the entire amount of the unpaid judgment. The United States Court of Appeals for the Federal Circuit reversed the judgment against Buckhorn on July 2, 2015, and found that Buckhorn was not liable to Orbis for any portion of the judgment entered in favor of Orbis. Accordingly, Myers reversed the accrual of $3.0 million during the second quarter of 2015, which was reflected as a reduction of general and administrative expenses in the accompanying Consolidated Statements of Operations. The Federal Circuit Court of Appeals rejected Orbis' petition for rehearing and rehearing en banc. All opportunities for Orbis to appeal have expired. The United States District Court for the Southern District of Ohio has now released Buckhorn’s appellate bond. Buckhorn was also pursuing legal action against SAS and SASS B.V. for fraudulently selling an exclusive patent license they could not sell and related claims. In 2016, the Company settled with SAS and SASS B.V. in return for a payment to the Company of $0.2 million, which was recorded as a reduction in general and administrative expenses in the Consolidated Statements of Operations.
When a loss arising from these or other legal matters is probable and can reasonably be estimated, we record the amount of the estimated loss, or the minimum estimated liability when the loss is estimated using a range, and no point within the range is more probable of occurrence than another. As additional information becomes available, any potential liability related to these matters will be assessed and the estimates will be revised, if necessary.
Based on current available information, management believes that the ultimate outcome of these matters will not have a material adverse effect on our financial position, cash flows or overall trends in our results of operations. However, these matters are subject to inherent uncertainties, and unfavorable rulings could occur. If an unfavorable ruling were to occur, there exists the possibility of a material adverse impact on the financial position and results of operations of the period in which the ruling occurs, or in future periods.
10. Long-Term Debt and Loan Agreements
Long-term debt at December 31, 2017 and 2016 consisted of the following:
|
|
|
December 31, |
|
|
December 31, |
|
||
|
|
|
2017 |
|
|
2016 |
|
||
|
Loan Agreement |
|
$ |
74,632 |
|
|
$ |
90,686 |
|
|
4.67% Senior Unsecured Notes due 2021 |
|
|
40,000 |
|
|
|
40,000 |
|
|
5.25% Senior Unsecured Notes due 2024 |
|
|
11,000 |
|
|
|
11,000 |
|
|
5.30% Senior Unsecured Notes due 2024 |
|
|
15,000 |
|
|
|
29,000 |
|
|
5.45% Senior Unsecured Notes due 2026 |
|
|
12,000 |
|
|
|
20,000 |
|
|
|
|
|
152,632 |
|
|
|
190,686 |
|
|
Less unamortized deferred financing costs |
|
|
1,596 |
|
|
|
1,164 |
|
|
|
|
$ |
151,036 |
|
|
$ |
189,522 |
|
In March 2017, the Company entered into a Fifth Amended and Restated Loan Agreement (the “Loan Agreement”). The Loan Agreement replaced the pre-existing $300 million senior revolving credit facility with a $200 million facility and extended the term from December 2018 to March 2022. In addition, the Loan Agreement provides for a maximum Leverage Ratio of 3.75 for the first and second quarters of 2017, stepping down to 3.5 in the third quarter of 2017, and 3.25 thereafter.
Under the terms of the Loan Agreement, the Company may borrow up to $200 million, reduced for letters of credit issued. As of December 31, 2017, the Company had $121.0 million available under the Loan Agreement. The Company had $4.4 million of letters of credit issued related to insurance and other financing contracts in the ordinary course of business at December 31, 2017. Borrowings under the Loan Agreement bear interest at the LIBOR rate, prime rate, federal funds effective rate, the Canadian deposit offered rate, or the eurocurrency reference rate depending on the type of loan requested by the Company, in each case plus the applicable margin as set forth in the Loan Agreement.
The Company’s Senior Unsecured Notes (“Notes”) range in face value from $11 million to $40 million, with interest rates ranging from 4.67% to 5.45%, payable semiannually, and maturing between 2021 and 2026. In September 2017, the Company made an offer to all holders of the $100 million Notes to purchase all or a portion of the Notes prior to their maturity dates. In October 2017, one
47
MYERS INDUSTRIES, INC. AND SUBSIDIARIES
Notes to Consolidated Financial Statements - (Continued)
(Dollars in thousands, except where otherwise indicated)
note holder accepted the offer and elected to tender $22 million in Notes. The Company purchased the Notes from the holder on October 31, 2017 for approximately $23.8 million, which includes the outstanding principal balance of $22.0 million and a make-whole premium of $1.8 million. A loss on extinguishment of debt of approximately $1.9 million was recorded during the fourth quarter of 2017, which consisted of the make-whole premium plus unamortized deferred financing costs of $0.1 million. At December 31, 2017, $78 million of the Notes were outstanding.
Amortization expense of the deferred financing costs was $508, $466, and $465 for the years ended December 31, 2017, 2016 and 2015, respectively, and is included in interest expense in the Consolidated Statement of Operations.
The average interest rate on borrowings under our loan agreements were 4.94% for 2017, 4.69% for 2016, and 4.59% for 2015, which includes a quarterly facility fee on the used and unused portion.
As of December 31, 2017, the Company was in compliance with all of its debt covenants associated with its Loan Agreement and Notes. The most restrictive financial covenants for all of the Company’s debt are an interest coverage ratio (defined as earnings before interest, taxes, depreciation and amortization, as adjusted, divided by interest expense) and a leverage ratio (defined as total debt divided by earnings before interest, taxes, depreciation and amortization, as adjusted). The ratios as of December 31, 2017 are shown in the following table:
|
|
|
Required Level |
|
Actual Level |
|
|
|
Interest Coverage Ratio |
|
3.00 to 1 (minimum) |
|
|
7.58 |
|
|
Leverage Ratio |
|
3.25 to 1 (maximum) |
|
|
2.40 |
|
11. Income Taxes
The effective tax rate from continuing operations was 31.0% in 2017, 39.5% in 2016 and 31.5% in 2015. A reconciliation of the Federal statutory income tax rate to the Company’s effective tax rate is as follows:
|
|
|
Percent of Income before Income Taxes |
|
|||||||||
|
|
|
2017 |
|
|
2016 |
|
|
2015 |
|
|||
|
Statutory Federal income tax rate |
|
|
35.0 |
% |
|
|
35.0 |
% |
|
|
35.0 |
% |
|
State income taxes - net of Federal tax benefit |
|
|
8.3 |
|
|
|
3.0 |
|
|
|
0.2 |
|
|
Foreign tax rate differential |
|
|
(1.6 |
) |
|
|
(0.9 |
) |
|
|
(2.2 |
) |
|
Domestic production deduction |
|
|
(5.2 |
) |
|
|
(3.2 |
) |
|
|
(3.4 |
) |
|
Non-deductible expenses |
|
|
0.4 |
|
|
|
2.9 |
|
|
|
1.5 |
|
|
Impact of tax law changes |
|
|
(7.4 |
) |
|
|
— |
|
|
|
— |
|
|
Changes in unrecognized tax benefits |
|
|
0.9 |
|
|
|
(0.8 |
) |
|
|
(1.6 |
) |
|
Foreign tax incentives |
|
|
— |
|
|
|
(0.4 |
) |
|
|
— |
|
|
Valuation allowances |
|
|
— |
|
|
|
3.2 |
|
|
|
— |
|
|
Other |
|
|
0.6 |
|
|
|
0.7 |
|
|
|
2.0 |
|
|
Effective tax rate for the year |
|
|
31.0 |
% |
|
|
39.5 |
% |
|
|
31.5 |
% |
Income from continuing operations before income taxes was attributable to the following sources:
|
|
|
2017 |
|
|
2016 |
|
|
2015 |
|
|||
|
United States |
|
$ |
12,979 |
|
|
$ |
17,010 |
|
|
$ |
19,546 |
|
|
Foreign |
|
|
2,729 |
|
|
|
1,709 |
|
|
|
5,962 |
|
|
Totals |
|
$ |
15,708 |
|
|
$ |
18,719 |
|
|
$ |
25,508 |
|
48
MYERS INDUSTRIES, INC. AND SUBSIDIARIES
Notes to Consolidated Financial Statements - (Continued)
(Dollars in thousands, except where otherwise indicated)
Income tax expense (benefit) from continuing operations consisted of the following:
|
|
|
2017 |
|
|
2016 |
|
|
2015 |
|
|||||||||||||||
|
|
|
Current |
|
|
Deferred |
|
|
Current |
|
|
Deferred |
|
|
Current |
|
|
Deferred |
|
||||||
|
Federal |
|
$ |
6,304 |
|
|
$ |
(4,394 |
) |
|
$ |
5,684 |
|
|
$ |
(413 |
) |
|
$ |
6,677 |
|
|
$ |
(368 |
) |
|
Foreign |
|
|
1,821 |
|
|
|
(883 |
) |
|
|
515 |
|
|
|
741 |
|
|
|
337 |
|
|
|
1,308 |
|
|
State and local |
|
|
2,402 |
|
|
|
(386 |
) |
|
|
641 |
|
|
|
227 |
|
|
|
812 |
|
|
|
(729 |
) |
|
|
|
$ |
10,527 |
|
|
$ |
(5,663 |
) |
|
$ |
6,840 |
|
|
$ |
555 |
|
|
$ |
7,826 |
|
|
$ |
211 |
|
On December 22, 2017, the United States enacted the Tax Cuts and Jobs Act (the “Tax Act”). Effective January 1, 2018, the Tax Act establishes a corporate income tax rate of 21%, replacing the current 35% rate, and creates a territorial tax system rather than a worldwide system, which generally eliminates the U.S. federal income tax on dividends from foreign subsidiaries. The transition to the territorial system includes a one-time deemed repatriation transition tax (“Transition Tax”) on certain foreign earnings previously untaxed in the United States. The Company has made reasonable estimates for certain provisions under the Tax Act and has recorded a provisional net benefit to income tax expense of $1.2 million related to its enactment. This net benefit includes a provisional deferred tax benefit of $3.0 million related to revaluing the net U.S. deferred tax liabilities to reflect the lower U.S. corporate tax rate. The deferred tax benefit is offset by a provision of $1.8 million related to the Transition Tax. In general, the Transition Tax imposed by the Tax Act results in the taxation of foreign earnings and profits (“E&P”) at a 15.5% rate on liquid assets and 8% on the remaining unremitted foreign E&P, both net of foreign tax credits. The provisional amounts for the Transition Tax recorded by the Company in 2017 included the undistributed E&P for all the Company’s foreign subsidiaries.
Additional provisions of the Tax Act which may have an impact to the Company in future periods include, but are not limited to, the repeal of the domestic production deduction, limitations on interest expense deductions, accelerated depreciation that will allow for full expensing of qualified property, provisions related to performance-based executive compensation and other international provisions resulting from the territorial tax system established, as noted above.
In response to the complexities and timing of issuance of the Tax Act, the SEC issued Staff Accounting Bulletin No. 118, Income Tax Accounting Implications of the Tax Cuts and Jobs Act (“SAB 118”). Management believes that it has made reasonable estimates of the impacts of the Tax Act in its 2017 consolidated financial statements. However, as the Company completes its analysis of the Tax Act, collects further data and reviews additional information and guidance issued by the U.S. Treasury Department, the IRS, and other standard-setting bodies, the provisional amounts included in the 2017 financial statements may be subject to adjustment. Per the guidance in SAB 118, adjustments to the provisional amounts recorded by the Company in 2017 that are identified within a subsequent period of up to one year from the enactment date will be included as an adjustment in the period the amounts are determined.
Except as provided for under the Transition Tax, no additional provision has been recorded as of December 31, 2017, related to the unremitted earnings of foreign subsidiaries. In accordance with SAB 118, the Company will continue to evaluate the impact of the Tax Act on its assertion that these earnings will be indefinitely reinvested. As noted above, the E&P for all foreign subsidiaries has been included in the calculation of the provisional Transition Tax, and thus, should there be a repatriation of earnings from any foreign subsidiaries in future periods, the Company would be subject to only foreign withholding tax.
49
MYERS INDUSTRIES, INC. AND SUBSIDIARIES
Notes to Consolidated Financial Statements - (Continued)
(Dollars in thousands, except where otherwise indicated)
Significant components of the Company’s deferred taxes as of December 31, 2017 and 2016 are as follows:
|
|
|
2017 |
|
|
2016 |
|
||
|
Deferred income tax liabilities |
|
|
|
|
|
|
|
|
|
Property, plant and equipment |
|
$ |
6,255 |
|
|
$ |
11,529 |
|
|
Tax-deductible goodwill |
|
|
5,202 |
|
|
|
9,136 |
|
|
State deferred taxes |
|
|
132 |
|
|
|
360 |
|
|
Other |
|
|
149 |
|
|
|
889 |
|
|
|
|
|
11,738 |
|
|
|
21,914 |
|
|
Deferred income tax assets |
|
|
|
|
|
|
|
|
|
Compensation |
|
|
3,030 |
|
|
|
5,686 |
|
|
Inventory valuation |
|
|
502 |
|
|
|
769 |
|
|
Allowance for uncollectible accounts |
|
|
268 |
|
|
|
487 |
|
|
Non-deductible accruals |
|
|
2,195 |
|
|
|
3,525 |
|
|
Non-deductible intangibles |
|
|
1,193 |
|
|
|
1,165 |
|
|
Capital loss carryforwards |
|
|
1,982 |
|
|
|
— |
|
|
Net operating loss carryforwards |
|
|
405 |
|
|
|
— |
|
|
|
|
|
9,575 |
|
|
|
11,632 |
|
|
Valuation Allowance |
|
|
(1,982 |
) |
|
|
— |
|
|
|
|
|
7,593 |
|
|
|
11,632 |
|
|
Net deferred income tax liability |
|
$ |
4,145 |
|
|
$ |
10,282 |
|
ASC 740, Income Taxes, requires that deferred tax assets be reduced by a valuation allowance, if based on all available evidence, it is more likely than not that the deferred tax asset will not be realized. Available evidence includes the reversal of existing taxable temporary differences, future taxable income exclusive of temporary differences, taxable income in carryback years and tax planning strategies.
As further discussed in Note 4, the Company sold its investments in certain Brazilian subsidiaries on December 18, 2017. In connection with this divestiture, the Company incurred a capital loss of $9.5 million on its investment in the Myers do Brazil business and recorded a deferred tax asset of $2.0 million as the result of this capital loss carryforward. A valuation allowance of $2.0 million has been recorded against this deferred tax asset as the recovery of the asset is not more likely than not as of December 31, 2017. In addition, in accordance with ASC 740, for the year ended December 31, 2016 the Company allocated $0.6 million of a valuation allowance related to the Brazil Business to income from continuing operations in the Consolidated Statement of Operations, as this valuation allowance related to the change in estimated realizability of the beginning of the year net deferred tax asset in the Brazil Business.
The Company recorded a tax benefit of approximately $15 million generated as a result of a worthless stock deduction for the Novel do Nordeste business included in the divestiture. Although management believes that the worthless stock deduction is valid, there can be no assurance that the IRS will not challenge it and, if challenged, that the Company will prevail. This tax benefit is included in the net loss from discontinued operations in the Consolidated Statements of Operations for the year ended December 31, 2017.
The following table summarizes the activity related to the Company’s unrecognized tax benefits:
|
|
|
2017 |
|
|
2016 |
|
|
2015 |
|
|||
|
Balance at January 1 |
|
$ |
478 |
|
|
$ |
151 |
|
|
$ |
483 |
|
|
Increases related to previous year tax positions |
|
|
359 |
|
|
|
478 |
|
|
|
151 |
|
|
Reductions due to lapse of applicable statute of limitations |
|
|
(478 |
) |
|
|
(151 |
) |
|
|
(483 |
) |
|
Reduction due to settlements |
|
|
— |
|
|
|
— |
|
|
|
— |
|
|
Balance at December 31 |
|
$ |
359 |
|
|
$ |
478 |
|
|
$ |
151 |
|
The total amount of gross unrecognized tax benefits that would reduce the Company’s effective tax rate was $0.4 million, $0.5 million and $0.2 million at December 31, 2017, 2016 and 2015.
50
MYERS INDUSTRIES, INC. AND SUBSIDIARIES
Notes to Consolidated Financial Statements - (Continued)
(Dollars in thousands, except where otherwise indicated)
The Company and its subsidiaries file U.S. Federal, state and local, and non-U.S. income tax returns. As of December 31, 2017, the Company is no longer subject to U.S. Federal examinations by tax authorities for tax years before 2014. The Company is subject to state and local examinations for tax years of 2012 through 2016. In addition, the Company is subject to non-U.S. income tax examinations for tax years of 2012 through 2016.
12. Retirement Plans
The Company and certain of its subsidiaries have pension and profit sharing plans covering substantially all of their employees. The Company’s defined benefit pension plan, The Pension Agreement between Akro-Mils and United Steelworkers of America Local No. 1761-02, provides benefits primarily based upon a fixed amount for each year of service. The plan was frozen in 2007, and thus benefits for service were no longer accumulated after this date.
Net periodic pension cost for the years ended December 31, 2017, 2016 and 2015 was as follows:
|
|
|
For the Year Ended December 31, |
|
|||||||||
|
|
|
2017 |
|
|
2016 |
|
|
2015 |
|
|||
|
Interest cost |
|
$ |
253 |
|
|
$ |
270 |
|
|
$ |
272 |
|
|
Expected return on assets |
|
|
(295 |
) |
|
|
(319 |
) |
|
|
(332 |
) |
|
Amortization of net loss |
|
|
96 |
|
|
|
82 |
|
|
|
88 |
|
|
Net periodic pension cost |
|
$ |
54 |
|
|
$ |
33 |
|
|
$ |
28 |
|
The reconciliation of changes in projected benefit obligations are as follows:
|
|
|
December 31, |
|
|||||
|
|
|
2017 |
|
|
2016 |
|
||
|
Projected benefit obligation at beginning of year |
|
$ |
6,503 |
|
|
$ |
6,465 |
|
|
Interest cost |
|
|
253 |
|
|
|
270 |
|
|
Actuarial loss |
|
|
276 |
|
|
|
238 |
|
|
Expenses paid |
|
|
(84 |
) |
|
|
(92 |
) |
|
Benefits paid |
|
|
(369 |
) |
|
|
(378 |
) |
|
Projected benefit obligation at end of year |
|
$ |
6,579 |
|
|
$ |
6,503 |
|
|
Accumulated benefit obligation at end of year |
|
$ |
6,579 |
|
|
$ |
6,503 |
|
The assumptions used to determine the net periodic benefit cost and benefit obligations are as follows:
|
|
|
December 31, |
|
|||||||||
|
|
|
2017 |
|
|
2016 |
|
|
2015 |
|
|||
|
Discount rate for net periodic pension cost |
|
|
4.00 |
% |
|
|
4.30 |
% |
|
|
3.90 |
% |
|
Discount rate for benefit obligations |
|
|
3.50 |
% |
|
|
4.00 |
% |
|
|
4.30 |
% |
|
Expected long-term return of plan assets |
|
|
7.75 |
% |
|
|
7.75 |
% |
|
|
7.50 |
% |
The expected long-term rate of return assumption is based on the actual historical rate of return on assets adjusted to reflect recent market conditions and future expectations consistent with the Company’s current asset allocation and investment policy. This policy provides for aggressive capital growth balanced with moderate income production. Though inherent risks of equity exposure exist, returns generally are less volatile than maximum growth programs. The assumed discount rates represent long-term high quality corporate bond rates commensurate with the liability duration of the plan.
51
MYERS INDUSTRIES, INC. AND SUBSIDIARIES
Notes to Consolidated Financial Statements - (Continued)
(Dollars in thousands, except where otherwise indicated)
The following table reflects the change in the fair value of the plan’s assets:
|
|
|
December 31, |
|
|||||
|
|
|
2017 |
|
|
2016 |
|
||
|
Fair value of plan assets at beginning of year |
|
$ |
5,183 |
|
|
$ |
5,443 |
|
|
Actual return on plan assets |
|
|
531 |
|
|
|
210 |
|
|
Company contributions |
|
|
— |
|
|
|
— |
|
|
Expenses paid |
|
|
(84 |
) |
|
|
(92 |
) |
|
Benefits paid |
|
|
(369 |
) |
|
|
(378 |
) |
|
Fair value of plan assets at end of year |
|
$ |
5,261 |
|
|
$ |
5,183 |
|
The fair value of plan assets are all categorized as level 1 and were determined based on period end closing, quoted prices in active markets.
The weighted average asset allocations at December 31, 2017 and 2016 are as follows:
|
|
|
December 31, |
|
|||||
|
|
|
2017 |
|
|
2016 |
|
||
|
U.S. Equities securities |
|
|
72 |
% |
|
|
72 |
% |
|
U.S. Debt securities |
|
|
24 |
% |
|
|
24 |
% |
|
Cash |
|
|
4 |
% |
|
|
4 |
% |
|
Total |
|
|
100 |
% |
|
|
100 |
% |
The following table provides a reconciliation of the funded status of the plan at December 31, 2017 and 2016:
|
|
|
December 31, |
|
|||||
|
|
|
2017 |
|
|
2016 |
|
||
|
Projected benefit obligation |
|
$ |
6,579 |
|
|
$ |
6,503 |
|
|
Plan assets at fair value |
|
|
5,261 |
|
|
|
5,183 |
|
|
Funded status |
|
$ |
(1,318 |
) |
|
$ |
(1,320 |
) |
The funded status shown above is included in Other Liabilities in the Company’s Consolidated Statements of Financial Position at December 31, 2017 and 2016. The Company does not expect to make a contribution to the plan in 2018.
Benefit payments projected for the plan are as follows:
|
2018 |
|
$ |
360 |
|
|
2019 |
|
|
366 |
|
|
2020 |
|
|
371 |
|
|
2021 |
|
|
372 |
|
|
2022 |
|
|
370 |
|
|
2023-2027 |
|
|
1,874 |
|
The Myers Industries Profit Sharing and 401(k) Plan is maintained for the Company’s U.S. based employees, not covered under defined benefit plans, who have met eligibility service requirements. The Company recognized expense related to the 401(k) employer matching contribution in the amount of $2,302, $2,324 and $2,363 in 2017, 2016 and 2015, respectively.
In addition, the Company has a Supplemental Executive Retirement Plan (“SERP”) to provide certain participating senior executives with retirement benefits in addition to amounts payable under the 401(k) plan. Expense related to the SERP was approximately $128, $192 and $188 for the years ended December 2017, 2016 and 2015, respectively. The SERP liability was based on the discounted present value of expected future benefit payments using a discount rate of 3.5% at December 31, 2017 and 4.0% at December 31, 2016. The SERP liability was approximately $2,923 and $3,319 at December 31, 2017 and 2016, respectively, and is included in Accrued Employee Compensation and Other Liabilities on the accompanying Consolidated Statements of Financial Position. The SERP is unfunded.
52
MYERS INDUSTRIES, INC. AND SUBSIDIARIES
Notes to Consolidated Financial Statements - (Continued)
(Dollars in thousands, except where otherwise indicated)
13. Leases
The Company and certain of its subsidiaries are committed under non-cancelable operating leases involving certain facilities and equipment. Aggregate rental expense for all leased assets was $3,198, $3,625 and $3,647 for the years ended December 31, 2017, 2016 and 2015, respectively.
Future minimum rental commitments are as follows:
|
Year Ended December 31, |
|
|
|
|
|
2018 |
|
$ |
2,486 |
|
|
2019 |
|
|
942 |
|
|
2020 |
|
|
663 |
|
|
2021 |
|
|
590 |
|
|
2022 |
|
|
564 |
|
|
Thereafter |
|
|
390 |
|
|
Total |
|
$ |
5,635 |
|
14. Industry Segments
Using the criteria of ASC 280, Segment Reporting, the Company manages its business under two operating segments, Material Handling and Distribution, consistent with the manner in which our Chief Operating Decision Maker evaluates performance and makes resource allocation decisions. None of the reportable segments include operating segments that have been aggregated. These segments contain individual business components that have been combined on the basis of common management, customers, products, production processes and other economic characteristics. The Company accounts for intersegment sales and transfers at cost plus a specified mark-up.
The Material Handling Segment manufactures a broad selection of plastic reusable containers, pallets, small parts bins, bulk shipping containers, storage and organization products and rotationally-molded plastic tanks for water, fuel and waste handling. This segment conducts its primary operations in the United States and Canada. Markets served encompass various niches of industrial manufacturing, food processing, retail/wholesale products distribution, agriculture, automotive, recreational vehicles, marine vehicles, healthcare, appliance, bakery, electronics, textiles, consumer, and others. Products are sold both directly to end-users and through distributors.
The Distribution Segment is engaged in the distribution of equipment, tools, and supplies used for tire servicing and automotive undervehicle repair and the manufacture of tire repair and retreading products. The product line includes categories such as tire valves and accessories, tire changing and balancing equipment, lifts and alignment equipment, service equipment and tools, and tire repair/retread supplies. The Distribution Segment operates domestically through its sales offices and four regional distribution centers in the United States, and in certain foreign countries through export sales. In addition, the Distribution Segment operates directly in certain foreign markets, principally Central America, through foreign branch operations. Markets served include retail and truck tire dealers, commercial auto and truck fleets, auto dealers, general service and repair centers, tire retreaders, and government agencies.
53
MYERS INDUSTRIES, INC. AND SUBSIDIARIES
Notes to Consolidated Financial Statements - (Continued)
(Dollars in thousands, except where otherwise indicated)
Total sales from foreign business units were approximately $53.9 million, $64.2 million, and $75.1 million for the years ended December 31, 2017, 2016 and 2015, respectively. Total export sales to countries outside the U.S. were approximately $17.2 million, $18.6 million, and $25.6 million for the years ended December 31, 2017, 2016 and 2015, respectively. Sales made to customers in Canada accounted for approximately 2.4% of total net sales in 2017, 4.6% in 2016 and 5.5% in 2015. There are no other individual foreign countries for which sales are material. Long-lived assets in foreign countries, primarily in Canada, consisted of property, plant and equipment, and were approximately $17.6 million at December 31, 2017 and $22.4 million at December 31, 2016.
|
|
|
2017 |
|
|
2016 |
|
|
2015 |
|
|||
|
Net Sales |
|
|
|
|
|
|
|
|
|
|
|
|
|
Material Handling |
|
$ |
391,313 |
|
|
$ |
363,956 |
|
|
$ |
384,351 |
|
|
Distribution |
|
|
156,428 |
|
|
|
170,660 |
|
|
|
187,637 |
|
|
Inter-company sales |
|
|
(698 |
) |
|
|
(237 |
) |
|
|
(968 |
) |
|
Total net sales |
|
$ |
547,043 |
|
|
$ |
534,379 |
|
|
$ |
571,020 |
|
|
|
|
|
|
|
|
|
|
|
|
|
|
|
|
Income (loss) from continuing operations before income taxes |
|
|
|
|
|
|
|
|
|
|
|
|
|
Material Handling |
|
$ |
38,874 |
|
|
$ |
40,776 |
|
|
$ |
53,418 |
|
|
Distribution |
|
|
9,073 |
|
|
|
12,834 |
|
|
|
16,114 |
|
|
Corporate |
|
|
(23,059 |
) |
|
|
(26,248 |
) |
|
|
(35,015 |
) |
|
Total operating income |
|
|
24,888 |
|
|
|
27,362 |
|
|
|
34,517 |
|
|
Interest expense, net |
|
|
(7,292 |
) |
|
|
(8,643 |
) |
|
|
(9,009 |
) |
|
Loss on extinguishment of debt |
|
|
(1,888 |
) |
|
|
— |
|
|
|
— |
|
|
Income from continuing operations before income taxes |
|
$ |
15,708 |
|
|
$ |
18,719 |
|
|
$ |
25,508 |
|
|
|
|
|
|
|
|
|
|
|
|
|
|
|
|
Identifiable Assets |
|
|
|
|
|
|
|
|
|
|
|
|
|
Material Handling |
|
$ |
257,863 |
|
|
$ |
268,634 |
|
|
$ |
307,799 |
|
|
Distribution |
|
|
49,822 |
|
|
|
56,072 |
|
|
|
58,772 |
|
|
Corporate |
|
|
48,257 |
|
|
|
36,271 |
|
|
|
34,746 |
|
|
Discontinued operations |
|
|
— |
|
|
|
20,707 |
|
|
|
27,707 |
|
|
Total identifiable assets |
|
$ |
355,942 |
|
|
$ |
381,684 |
|
|
$ |
429,024 |
|
|
|
|
|
|
|
|
|
|
|
|
|
|
|
|
Capital Additions, Net |
|
|
|
|
|
|
|
|
|
|
|
|
|
Material Handling |
|
$ |
5,165 |
|
|
$ |
10,933 |
|
|
$ |
19,482 |
|
|
Distribution |
|
|
622 |
|
|
|
1,424 |
|
|
|
1,795 |
|
|
Corporate |
|
|
27 |
|
|
|
132 |
|
|
|
510 |
|
|
Total capital additions, net |
|
$ |
5,814 |
|
|
$ |
12,489 |
|
|
$ |
21,787 |
|
|
|
|
|
|
|
|
|
|
|
|
|
|
|
|
Depreciation and Amortization |
|
|
|
|
|
|
|
|
|
|
|
|
|
Material Handling |
|
$ |
28,506 |
|
|
$ |
29,270 |
|
|
$ |
30,018 |
|
|
Distribution |
|
|
1,174 |
|
|
|
1,221 |
|
|
|
998 |
|
|
Corporate |
|
|
1,151 |
|
|
|
1,301 |
|
|
|
1,314 |
|
|
Total depreciation and amortization |
|
$ |
30,831 |
|
|
$ |
31,792 |
|
|
$ |
32,330 |
|
15. Subsequent Events (Unaudited)
On February 27, 2018, the Company sold a distribution center in Pomona, California for approximately $2.3 million, net of approximately $0.1 million in closing costs. The Company concurrently entered into an agreement to lease the facility back from the buyer for a period of 10 years. This facility is included in our Distribution Segment.
54
MYERS INDUSTRIES, INC. AND SUBSIDIARIES
Notes to Consolidated Financial Statements - (Continued)
(Dollars in thousands, except where otherwise indicated)
16. Summarized Quarterly Results of Operations (Unaudited)
|
Quarter Ended 2017 |
|
March 31 |
|
|
June 30 |
|
|
September 30 |
|
|
December 31 |
|
|
Total |
|
|||||
|
Net Sales |
|
$ |
136,572 |
|
|
$ |
135,252 |
|
|
$ |
135,113 |
|
|
$ |
140,106 |
|
|
$ |
547,043 |
|
|
Gross Profit |
|
|
41,761 |
|
|
|
38,292 |
|
|
|
39,143 |
|
|
|
38,257 |
|
|
|
157,453 |
|
|
Income (loss) from continuing operations (3) (4) |
|
|
3,458 |
|
|
|
2,482 |
|
|
|
3,083 |
|
|
|
1,821 |
|
|
|
10,844 |
|
|
Income (loss) from discontinued operations, net (1) (2) |
|
|
(344 |
) |
|
|
(489 |
) |
|
|
174 |
|
|
|
(20,074 |
) |
|
|
(20,733 |
) |
|
Net income (loss)(1) (2) (3) (4) |
|
|
3,114 |
|
|
|
1,993 |
|
|
|
3,257 |
|
|
|
(18,253 |
) |
|
|
(9,889 |
) |
|
Income (loss) per common share from continuing operations: |
|
|
|
|
|
|
|
|
|
|
|
|
|
|
|
|
|
|
|
|
|
Basic* |
|
$ |
0.12 |
|
|
$ |
0.08 |
|
|
$ |
0.10 |
|
|
$ |
0.06 |
|
|
$ |
0.36 |
|
|
Diluted* |
|
$ |
0.11 |
|
|
$ |
0.08 |
|
|
$ |
0.10 |
|
|
$ |
0.06 |
|
|
$ |
0.35 |
|
|
Income (loss) per common share from discontinued operations: |
|
|
|
|
|
|
|
|
|
|
|
|
|
|
|
|
|
|
|
|
|
Basic* |
|
$ |
(0.02 |
) |
|
$ |
(0.01 |
) |
|
$ |
0.01 |
|
|
$ |
(0.66 |
) |
|
$ |
(0.69 |
) |
|
Diluted* |
|
$ |
(0.01 |
) |
|
$ |
(0.01 |
) |
|
$ |
0.01 |
|
|
$ |
(0.65 |
) |
|
$ |
(0.68 |
) |
|
Net income (loss) per share: |
|
|
|
|
|
|
|
|
|
|
|
|
|
|
|
|
|
|
|
|
|
Basic* |
|
$ |
0.10 |
|
|
$ |
0.07 |
|
|
$ |
0.11 |
|
|
$ |
(0.60 |
) |
|
$ |
(0.33 |
) |
|
Diluted* |
|
$ |
0.10 |
|
|
$ |
0.07 |
|
|
$ |
0.11 |
|
|
$ |
(0.59 |
) |
|
$ |
(0.33 |
) |
|
|
|
|
|
|
|
|
|
|
|
|
|
|
|
|
|
|
|
|
|
|
|
Quarter Ended 2016 |
|
March 31 |
|
|
June 30 |
|
|
September 30 |
|
|
December 31 |
|
|
Total |
|
|||||
|
Net Sales |
|
$ |
147,177 |
|
|
$ |
138,244 |
|
|
$ |
125,669 |
|
|
$ |
123,289 |
|
|
$ |
534,379 |
|
|
Gross Profit |
|
|
48,440 |
|
|
|
43,482 |
|
|
|
34,676 |
|
|
|
35,300 |
|
|
|
161,898 |
|
|
Income (loss) from continuing operations |
|
|
5,722 |
|
|
|
5,921 |
|
|
|
580 |
|
|
|
(899 |
) |
|
|
11,324 |
|
|
Income (loss) from discontinued operations, net (5) |
|
|
(9,115 |
) |
|
|
(427 |
) |
|
|
(166 |
) |
|
|
(559 |
) |
|
|
(10,267 |
) |
|
Net income (loss)(5) |
|
|
(3,393 |
) |
|
|
5,494 |
|
|
|
414 |
|
|
|
(1,458 |
) |
|
|
1,057 |
|
|
Income (loss) per common share from continuing operations: |
|
|
|
|
|
|
|
|
|
|
|
|
|
|
|
|
|
|
|
|
|
Basic* |
|
$ |
0.19 |
|
|
$ |
0.20 |
|
|
$ |
0.02 |
|
|
$ |
(0.03 |
) |
|
$ |
0.38 |
|
|
Diluted* |
|
$ |
0.19 |
|
|
$ |
0.20 |
|
|
$ |
0.02 |
|
|
$ |
(0.03 |
) |
|
$ |
0.38 |
|
|
Income (loss) per common share from discontinued operations: |
|
|
|
|
|
|
|
|
|
|
|
|
|
|
|
|
|
|
|
|
|
Basic* |
|
$ |
(0.30 |
) |
|
$ |
(0.01 |
) |
|
$ |
(0.01 |
) |
|
$ |
(0.02 |
) |
|
$ |
(0.35 |
) |
|
Diluted* |
|
$ |
(0.30 |
) |
|
$ |
(0.01 |
) |
|
$ |
(0.01 |
) |
|
$ |
(0.02 |
) |
|
$ |
(0.35 |
) |
|
Net income (loss) per share: |
|
|
|
|
|
|
|
|
|
|
|
|
|
|
|
|
|
|
|
|
|
Basic* |
|
$ |
(0.11 |
) |
|
$ |
0.19 |
|
|
$ |
0.01 |
|
|
$ |
(0.05 |
) |
|
$ |
0.03 |
|
|
Diluted* |
|
$ |
(0.11 |
) |
|
$ |
0.19 |
|
|
$ |
0.01 |
|
|
$ |
(0.05 |
) |
|
$ |
0.03 |
|
|
(1) |
A loss on the sale of the Brazil Business of $35 million was recognized during the fourth quarter of 2017. This loss is included in loss from discontinued operations in the accompanying Consolidated Statements of Operations. |
|
(2) |
During the quarter ended December 31, 2017, the Company recorded a U.S. tax benefit of approximately $15 million as a result of a worthless stock deduction related to the Company’s investment in the Brazil Business. This benefit is included in loss from discontinued operations in the accompanying Consolidated Statements of Operations. |
|
(3) |
During the quarter ended December 31, 2017, the Company recorded a loss on extinguishment of debt of approximately $1.9 million. |
|
(4) |
During the quarter ended December 31, 2017, the Company recorded a net tax benefit of approximately $1.2 million related to the Tax Act. |
|
(5) |
During the quarter ended March 31, 2016, the Company concluded that the goodwill, intangibles and other long-lived assets related to Novel were impaired and recorded an impairment charge of $8.5 million. |
|
* |
The sum of the earnings per share for the four quarters in a year does not necessarily equal the total year earnings per share due to the computation of weighted shares outstanding during each respective period. |
55
None.
Evaluation of Disclosure Controls and Procedures
The Company maintains disclosure controls and procedures, as defined under Rules 13a-15(e) and 15d-15(e) of the Securities Exchange Act of 1934, as amended, that are designed to ensure that information required to be disclosed in the Company’s reports under the Securities Exchange Act of 1934 is recorded, processed, summarized and reported within the time periods specified in the Commission’s rules and forms and that such information is accumulated and communicated to the Company’s management, including its Chief Executive Officer and Chief Financial Officer, as appropriate, to allow for timely decisions regarding required disclosure.
The Company carries out a variety of on-going procedures, under the supervision and with the participation of the Company’s management, including the Company’s Chief Executive Officer and Chief Financial Officer, to evaluate the effectiveness of the design and operation of the Company’s disclosure controls and procedures. Based on the foregoing, the Company’s Chief Executive Officer and Chief Financial Officer concluded that the Company’s disclosure controls and procedures were effective as of December 31, 2017.
Management’s report on internal control over financial reporting, and the report of the independent registered public accounting firm on internal control over financial reporting are titled “Management’s Annual Assessment of and Report on Internal Control Over Financial Reporting” and “Report of Independent Registered Public Accounting Firm”, respectively, and are included herein.
Changes in Internal Control Over Financial Reporting
There have been no changes in our internal control over financial reporting during the period covered by this report that have materially affected, or are reasonably likely to materially affect, our internal control over financial reporting.
Management’s Annual Assessment of and Report on Internal Control Over Financial Reporting
Management is responsible for establishing and maintaining adequate internal control over financial reporting, as defined in Exchange Act Rule 13a-15(f). The Company’s internal control over financial reporting is a process designed to provide reasonable assurance regarding the reliability of financial reporting and the preparation of financial statements for external purposes in accordance with accounting principles generally accepted in the United States of America.
Because of its inherent limitation, internal control over financial reporting may not prevent or detect misstatements. Also, projections of any evaluation of effectiveness to future periods are subject to the risk that controls may become inadequate because of changes in conditions, or that the degree of compliance with the policies or procedures may deteriorate.
Under the supervision and with the participation of management, including the Chief Executive Officer and Chief Financial Officer, the Company conducted an evaluation of the effectiveness of the Company’s internal control over financial reporting based on the framework in “Internal Control – Integrated Framework” issued by the Committee of Sponsoring Organizations of the Treadway Commission (2013 framework). Based on this assessment, management concluded that the Company maintained effective internal control over financial reporting as of December 31, 2017.
The effectiveness of the Company’s internal control over financial reporting as of December 31, 2017 has been audited by Ernst & Young LLP, an independent registered public accounting firm, as stated in their report included herein.
|
R. David Banyard |
Matteo Anversa |
|
President and |
Executive Vice President, |
|
Chief Executive Officer |
Chief Financial Officer and Corporate Secretary |
56
Report of Independent Registered Public Accounting Firm
To the Shareholders and the Board of Directors of
Myers Industries, Inc. and Subsidiaries
Opinion on Internal Control over Financial Reporting
We have audited Myers Industries, Inc. and Subsidiaries’ internal control over financial reporting as of December 31, 2017, based on criteria established in Internal Control — Integrated Framework issued by the Committee of Sponsoring Organizations of the Treadway Commission (2013 framework) (the COSO criteria). In our opinion, Myers Industries, Inc. and Subsidiaries (the Company) maintained, in all material respects, effective internal control over financial reporting as of December 31, 2017, based on the COSO criteria.
We also have audited, in accordance with the standards of the Public Company Accounting Oversight Board (United States) (PCAOB), the consolidated statements of financial position of Myers Industries, Inc. and Subsidiaries as of December 31, 2017 and 2016, and the related consolidated statements of operations, comprehensive income (loss), shareholders’ equity and cash flows for each of the three years in the period ended December 31, 2017 and the related notes of the Company and our report dated March 9, 2018 expressed an unqualified opinion thereon.
Basis for Opinion
The Company’s management is responsible for maintaining effective internal control over financial reporting and for its assessment of the effectiveness of internal control over financial reporting included in the accompanying Management’s Annual Assessment of and Report on Internal Control Over Financial Reporting. Our responsibility is to express an opinion on the Company’s internal control over financial reporting based on our audit. We are a public accounting firm registered with the PCAOB and are required to be independent with respect to the Company in accordance with the U.S. federal securities laws and the applicable rules and regulations of the Securities and Exchange Commission and the PCAOB.
We conducted our audit in accordance with the standards of the PCAOB. Those standards require that we plan and perform the audit to obtain reasonable assurance about whether effective internal control over financial reporting was maintained in all material respects.
Our audit included obtaining an understanding of internal control over financial reporting, assessing the risk that a material weakness exists, testing and evaluating the design and operating effectiveness of internal control based on the assessed risk, and performing such other procedures as we considered necessary in the circumstances. We believe that our audit provides a reasonable basis for our opinion.
Definition and Limitations of Internal Control Over Financial Reporting
A company’s internal control over financial reporting is a process designed to provide reasonable assurance regarding the reliability of financial reporting and the preparation of financial statements for external purposes in accordance with generally accepted accounting principles. A company’s internal control over financial reporting includes those policies and procedures that (1) pertain to the maintenance of records that, in reasonable detail, accurately and fairly reflect the transactions and dispositions of the assets of the company; (2) provide reasonable assurance that transactions are recorded as necessary to permit preparation of financial statements in accordance with generally accepted accounting principles, and that receipts and expenditures of the company are being made only in accordance with authorizations of management and directors of the company; and (3) provide reasonable assurance regarding prevention or timely detection of unauthorized acquisition, use, or disposition of the company’s assets that could have a material effect on the financial statements.
Because of its inherent limitations, internal control over financial reporting may not prevent or detect misstatements. Also, projections of any evaluation of effectiveness to future periods are subject to the risk that controls may become inadequate because of changes in conditions, or that the degree of compliance with the policies or procedures may deteriorate.
/s/ Ernst & Young LLP
Akron, Ohio
March 9, 2018
57
None.
For information about the directors of the Company, see the sections titled “Proposal No. 1 – Election of Directors”, “Nominees”, “Corporate Governance Guidelines”, “Corporate Governance and Compensation Practices”, “Board and Committee Independence”, “Board Committees and Meetings”, “Committee Charters and Policies”, and “Shareholder Nomination Process” of the Company’s Proxy Statement filed with the Securities and Exchange Commission for the Company’s annual meeting of shareholders to be held on April 25, 2018 (“Proxy Statement”), which is incorporated herein by reference.
Each member of the Company’s Audit Committee is financially literate and independent as defined under the Company’s Independence Criteria Policy and the independence standards set by the New York Stock Exchange. The Board has identified Robert A. Stefanko, Jane Scaccetti, F. Jack Liebau, Jr. and Daniel R. Lee as “Audit Committee Financial Experts”.
Information about the Executive Officers of Registrant appears in Part I of this Report.
Disclosures by the Company with respect to compliance with Section 16(a) appears under the section entitled “Section 16(a) Beneficial Ownership Reporting Compliance” in the Proxy Statement, and is incorporated herein by reference.
For information about our Code of Ethics see the section titled “Corporate Governance and Compensation Practices” of our Proxy Statement, which is incorporated herein by reference.
See the sections titled “Executive Compensation and Related Information”, “Compensation Committee Interlocks and Insider Participation”, "Compensation Committee Report on Executive Compensation”, “Risk Assessment of Compensation Practices”, “Corporate Governance Guidelines”, “Corporate Governance and Compensation Practices” and “Board Role in Risk Oversight” of the Proxy Statement, which are incorporated herein by reference.
|
ITEM 12. |
Security Ownership of Certain Beneficial Owners and Management and Related Stockholder Matters |
See the sections titled “Security Ownership of Certain Beneficial Owners and Management,” and “Proposal No. 1 - Election of Directors” of the Proxy Statement, which are incorporated herein by reference.
|
|
|
(A) |
|
|
(B) |
|
|
(C) |
|
|||
|
Plan Category |
|
Number of Securities to be Issued Upon Exercise of Outstanding Options, Warrants and Rights |
|
|
Weighted-average Exercise Price of Outstanding Options, Warrants and Rights |
|
|
Number of Securities Remaining Available for Future Issuance Under Equity Compensation Plans (Excluding Securities Reflected in Column (A)) |
|
|||
|
Equity Compensation Plans Approved by Security Holders |
|
|
1,400,817 |
|
(1) |
$ |
15.13 |
|
(2) |
|
1,915,039 |
|
|
Equity Compensation Plans Not Approved by Security Holders |
|
–0– |
|
|
–0– |
|
|
–0– |
|
|||
|
Total |
|
|
1,400,817 |
|
|
|
|
|
|
|
1,915,039 |
|
|
(1) |
This information is as of December 31, 2017 and includes outstanding stock option and restricted share awards granted under the 2017 Incentive Stock Plan and 1999 Incentive Stock Plan. |
|
(2) |
Represents the weighted average exercise price of outstanding stock options and does not take into account outstanding restricted share awards, which do not have an exercise price. |
58
See the sections titled “Policies and Procedures with Respect to Related Party Transactions” and “Corporate Governance Guidelines”, “ Corporate Governance and Compensation Practices” and “Board and Committee Independence” of the Proxy Statement, which are incorporated herein by reference.
Required information regarding fees paid to and services provided by the Company’s independent registered public accounting firm and the pre-approval policies and procedures of the Audit Committee of the Company’s Board of Directors is set forth under the section titled “Matters Relating to the Independent Registered Public Accounting Firm” of the Proxy Statement, which is incorporated herein by reference.
59
The following consolidated financial statements of the Registrant appear in Part II of this Report:
|
15. |
(A)(1) Financial Statements |
Consolidated Financial Statements of Myers Industries, Inc. and Subsidiaries
|
|
• |
Report of Independent Registered Public Accounting Firm |
|
|
• |
Consolidated Statements of Operations For The Years Ended December 31, 2017, 2016 and 2015 |
|
|
• |
Consolidated Statements of Comprehensive Income (Loss) For the Years Ended December 31, 2017, 2016 and 2015 |
|
|
• |
Consolidated Statements of Financial Position As of December 31, 2017 and 2016 |
|
|
• |
Consolidated Statements of Shareholders’ Equity For The Years Ended December 31, 2017, 2016 and 2015 |
|
|
• |
Consolidated Statements of Cash Flows For The Years Ended December 31, 2017, 2016 and 2015 |
|
|
• |
Notes to Consolidated Financial Statements For The Years Ended December 31, 2017, 2016 and 2015 |
|
15. |
(A)(2) Financial Statement Schedules |
All schedules are omitted because they are inapplicable, not required, or because the information is included in the consolidated financial statements or notes thereto which appear in Part II of this Report.
60
EXHIBIT INDEX
|
2(a) |
|
|
2(b) |
|
|
2(c) |
|
|
2(d) |
|
|
2(e) |
|
|
2(f) |
|
|
3(a) |
|
|
3(b) |
|
|
10(a) |
|
|
10(b) |
|
|
10(c) |
|
|
10(d) |
|
|
10(e) |
|
|
10(f) |
|
|
10(g) |
|
|
10(h) |
|
|
10(i) |
|
|
10(j) |
|
|
10(k) |
|
|
10(l) |
|
|
10(m) |
61
|
10(o) |
|
|
10(p) |
|
|
10(q) |
|
|
10(r) |
|
|
10(s) |
|
|
10(t) |
|
|
10(u) |
|
|
10(v) |
|
|
10(w) |
|
|
10(x) |
|
|
10(y) |
|
|
10(z) |
|
|
10(aa) |
|
|
10(ab) |
|
|
10(ac) |
|
|
10(ad) |
|
|
10(ae) |
|
|
10(af) |
|
|
10(ag) |
|
|
10(ah) |
|
|
10(ai) |
|
|
10(aj) |
62
|
10(al) |
|
|
10(am) |
|
|
10(an) |
|
|
10(ao) |
|
|
14 |
|
|
21 |
List of Direct and Indirect Subsidiaries, and Operating Divisions, of Myers Industries, Inc. |
|
23 |
|
|
31(a) |
|
|
31(b) |
|
|
32 |
|
|
101 |
The following financial information from Myers Industries, Inc. Annual Report on Form 10-K for the year ended December 31, 2017, formatted in XBRL includes: (i) Consolidated Statements of Financial Position (ii) Consolidated Statements of Operations, (iii) Consolidated Statements of Comprehensive Income (Loss), (iv) Consolidated Statements of Cash Flows, (v) Consolidated Statements of Shareholders' Equity, and (vi) the Notes to Consolidated Financial Statements. |
|
* |
Indicates executive compensation plan or arrangement. |
|
** |
Pursuant to Item 601(b)(2) of Regulation S-K, certain exhibits and schedules have been omitted from this filing. The registrant agrees to furnish the Commission on a supplemental basis a copy of any omitted exhibit or schedule. |
63
Pursuant to the requirements of Section 13 or 15(d) of the Securities Exchange Act of 1934, the Registrant has duly caused this report to be signed on its behalf by the undersigned, thereunto duly authorized.
|
MYERS INDUSTRIES, INC. |
|
/s/ Matteo Anversa |
|
Matteo Anversa |
|
Executive Vice President, Chief Financial Officer and Corporate Secretary |
Pursuant to the requirements of the Securities Exchange Act of 1934, this report has been signed below by the following persons on behalf of the Registrant and in the capacities and on the dates indicated.
|
SIGNATURE |
|
TITLE |
|
DATE |
|
/s/ R. David Banyard |
|
President, Chief Executive Officer and Director (Principal Executive Officer) |
|
March 9, 2018 |
|
R. DAVID BANYARD |
|
|
|
|
|
|
|
|
|
|
|
/s/ Matteo Anversa |
|
Executive Vice President, Chief Financial Officer and Corporate Secretary (Principal Financial Officer) |
|
March 9, 2018 |
|
MATTEO ANVERSA |
|
|
|
|
|
|
|
|
|
|
|
/s/ Kevin L. Brackman |
|
Vice President, Chief Accounting Officer (Principal Accounting Officer) |
|
March 9, 2018 |
|
KEVIN L. BRACKMAN |
|
|
|
|
|
|
|
|
|
|
|
/s/ Sarah R. Coffin |
|
Director |
|
March 9, 2018 |
|
SARAH R. COFFIN |
|
|
|
|
|
|
|
|
|
|
|
/s/ John B. Crowe |
|
Director |
|
March 9, 2018 |
|
JOHN B. CROWE |
|
|
|
|
|
|
|
|
|
|
|
/s/ William A. Foley |
|
Director |
|
March 9, 2018 |
|
WILLIAM A. FOLEY |
|
|
|
|
|
|
|
|
|
|
|
/s/ Daniel R. Lee |
|
Director |
|
March 9, 2018 |
|
DANIEL R. LEE |
|
|
|
|
|
|
|
|
|
|
|
/s/ F. Jack Liebau, Jr. |
|
Director |
|
March 9, 2018 |
|
F. JACK LIEBAU, JR. |
|
|
|
|
|
|
|
|
|
|
|
/s/ Bruce M. Lisman |
|
Director |
|
March 9, 2018 |
|
BRUCE M. LISMAN |
|
|
|
|
|
|
|
|
|
|
|
/s/ Jane Scaccetti |
|
Director |
|
March 9, 2018 |
|
JANE SCACCETTI |
|
|
|
|
|
|
|
|
|
|
|
/s/ Robert A. Stefanko |
|
Director |
|
March 9, 2018 |
|
ROBERT A. STEFANKO |
|
|
|
|
64