Attached files
UNITED STATES
SECURITIES AND EXCHANGE COMMISSION
Washington, D.C. 20549
———————
FORM 10-Q
———————
☒ QUARTERLY REPORT
PURSUANT TO SECTION 13 OR 15(d) OF THE SECURITIES EXCHANGE ACT OF
1934
For the
quarterly period ended: September 30, 2020
or
☐ TRANSITION REPORT
PURSUANT TO SECTION 13 OR 15(d) OF THE SECURITIES EXCHANGE ACT OF
1934
For the
transition period from: _____________ to _____________

ISSUER DIRECT
CORPORATION
(Exact name of registrant as
specified in its charter)
———————
|
Delaware
|
1-10185
|
26-1331503
|
|
(State or Other
Jurisdiction
|
(Commission
|
(I.R.S.
Employer
|
|
of
Incorporation)
|
File
Number)
|
Identification
No.)
|
1 Glenwood
Avenue, Suite 1001, Raleigh NC 27603
(Address of
Principal Executive Office) (Zip Code)
(919)
481-4000
(Registrant’s
telephone number, including area code)
N/A
(Former name, former address and former fiscal year, if changed
since last report)
———————
Indicate
by check mark whether the registrant (1) has filed all reports
required to be filed by Section 13 or 15(d) of the Securities
Exchange Act of 1934 during the preceding 12 months (or for such
shorter period that the registrant was required to file such
reports), and (2) has been subject to such filing requirements for
the past 90 days. Yes ☒ No ☐
Indicate by check mark whether the
registrant has submitted electronically and posted on its corporate
website, if any, every Interactive Data File required to be
submitted and posted pursuant to Rule 405 of Regulation S-T during
the preceding 12 months (or for such shorter period that the
registrant was required to submit and post such files). Yes ☒
No ☐
Indicate by check
mark whether the registrant is a large accelerated filer, an
accelerated filer, a non-accelerated filer, smaller reporting
company, or an emerging growth company. See the definitions of
“large accelerated filer,” “accelerated
filer”, “smaller reporting company” and "emerging
growth company" in Rule 12b-2 of the Exchange Act. (Check
one):
|
Large accelerated
filer
|
☐
|
Accelerated
filer
|
☐
|
|
Non-accelerated
filer
|
☐ (Do not check if a smaller
reporting company)
|
Smaller reporting
company
|
☒
|
|
|
|
Emerging growth
company
|
☐
|
If
an emerging growth company, indicate by check mark if the
registrant has elected not to use the extended transition period
for complying with any new or revised financial accounting
standards provided pursuant to Section 13(a) of the Exchange Act.
☐
Indicate by check mark whether the
registrant is a shell company (as defined in Rule 12b-2 of the Act)
Yes ☐ No ☒
Indicate the number of shares
outstanding of each of the issuer’s classes of common stock,
as of the latest practicable date 3,741,752 shares of common stock
were issued and outstanding as of October 29,
2020.
Securities
registered pursuant to Section 12(b) of the
Act:
|
Title of each class
|
Trading Symbol(s)
|
Name of each exchange on which registered
|
|
Common Stock,
par value $0.001
|
ISDR
|
NYSE
American
|
TABLE OF CONTENTS
PART I - FINANCIAL INFORMATION
|
3
|
||
|
|
3
|
|
|
|
4
|
|
|
|
5
|
|
|
|
6
|
|
|
|
7
|
|
|
|
8
|
|
|
16
|
||
|
24
|
||
|
24
|
|
PART
II – OTHER INFORMATION
|
||
|
|
||
|
25
|
||
|
25
|
||
|
25
|
||
|
25
|
||
|
25
|
||
|
25
|
||
|
25
|
||
|
|
26
|
|
2
PART I – FINANCIAL INFORMATION
ITEM 1. FINANCIAL STATEMENTS
CONSOLIDATED BALANCE SHEETS
(in
thousands, except share and per share amounts)
|
|
September 30,
|
December 31,
|
|
|
2020
|
2019
|
|
ASSETS
|
(unaudited)
|
|
|
Current
assets:
|
|
|
|
Cash
and cash equivalents
|
$18,429
|
$15,766
|
|
Accounts
receivable (net of allowance for doubtful accounts of $617 and
$700, respectively)
|
2,445
|
2,051
|
|
Income
tax receivable
|
—
|
48
|
|
Other
current assets
|
220
|
141
|
|
Total
current assets
|
21,094
|
18,006
|
|
Capitalized
software (net of accumulated amortization of $2,616 and $2,153,
respectively)
|
671
|
1,134
|
|
Fixed
assets (net of accumulated amortization of $278 and $181,
respectively)
|
817
|
899
|
|
Right-of-use asset
– leases
|
1,904
|
2,127
|
|
Deferred tax
asset
|
262
|
256
|
|
Other
long-term assets
|
76
|
77
|
|
Goodwill
|
6,376
|
6,376
|
|
Intangible
assets (net of accumulated amortization of $5,429 and $4,937,
respectively)
|
3,023
|
3,515
|
|
Total assets
|
$34,223
|
$32,390
|
|
|
|
|
|
LIABILITIES AND STOCKHOLDERS’ EQUITY
|
|
|
|
Current
liabilities:
|
|
|
|
Accounts
payable
|
$355
|
$266
|
|
Accrued
expenses
|
1,367
|
1,151
|
|
Note payable
– short-term (net of discount of $0 and $19,
respectively)
|
320
|
301
|
|
Income
taxes payable
|
545
|
310
|
|
Deferred
revenue
|
2,098
|
1,812
|
|
Total
current liabilities
|
4,685
|
3,840
|
|
Deferred
income tax liability
|
120
|
141
|
|
Lease liabilities
– long-term
|
2,054
|
2,309
|
|
Total liabilities
|
6,859
|
6,290
|
|
Commitments
and contingencies
|
|
|
|
Stockholders'
equity:
|
|
|
|
Preferred
stock, $0.001 par value, 1,000,000 shares authorized, no shares
issued and outstanding as of September 30, 2020 and December 31,
2019, respectively.
|
—
|
—
|
|
Common stock $0.001 par value, 20,000,000 shares
authorized, 3,741,752 and 3,786,398 shares issued and outstanding as of September 30,
2020 and December 31, 2019, respectively.
|
4
|
4
|
|
Additional
paid-in capital
|
21,757
|
22,275
|
|
Other
accumulated comprehensive loss
|
(21)
|
(16)
|
|
Retained
earnings
|
5,624
|
3,837
|
|
Total stockholders' equity
|
27,364
|
26,100
|
|
Total liabilities and stockholders’ equity
|
$34,223
|
$32,390
|
The
accompanying notes are an integral part of these unaudited
financial statements.
3
ISSUER DIRECT CORPORATION AND SUBSIDIARIES
CONSOLIDATED STATEMENTS OF OPERATIONS
(UNAUDITED)
(in
thousands, except share and per share amounts)
|
|
For the Three
Months Ended
|
For the Nine
Months Ended
|
||
|
|
September
30,
|
September
30,
|
September
30,
|
September
30,
|
|
|
2020
|
2019
|
2020
|
2019
|
|
Revenues
|
$4,882
|
$4,019
|
$13,782
|
$12,336
|
|
Cost of
revenues
|
1,387
|
1,222
|
4,002
|
3,774
|
|
Gross
profit
|
3,495
|
2,797
|
9,780
|
8,562
|
|
Operating costs and
expenses:
|
|
|
|
|
|
General and
administrative
|
1,052
|
1,229
|
3,465
|
3,912
|
|
Sales and marketing
expenses
|
973
|
871
|
2,819
|
2,566
|
|
Product
development
|
212
|
288
|
571
|
968
|
|
Depreciation and
amortization
|
182
|
229
|
600
|
659
|
|
Total operating
costs and expenses
|
2,419
|
2,617
|
7,455
|
8,105
|
|
Operating
income
|
1,076
|
180
|
2,325
|
457
|
|
Interest income
(expense), net
|
(4)
|
79
|
55
|
265
|
|
Income before
income taxes
|
1,072
|
259
|
2,380
|
722
|
|
Income tax
expense
|
283
|
59
|
593
|
105
|
|
Net
income
|
$789
|
$200
|
$1,787
|
$617
|
|
Income per share
– basic
|
$0.21
|
$0.05
|
$0.48
|
$0.16
|
|
Income per share
– fully diluted
|
$0.21
|
$0.05
|
$0.47
|
$0.16
|
|
Weighted average
number of common shares outstanding – basic
|
3,740
|
3,853
|
3,754
|
3,853
|
|
Weighted average
number of common shares outstanding – fully
diluted
|
3,768
|
3,868
|
3,778
|
3,874
|
The
accompanying notes are an integral part of these unaudited
financial statements.
4
ISSUER DIRECT CORPORATION AND SUBSIDIARIES
CONSOLIDATED STATEMENTS OF COMPREHENSIVE INCOME
(UNAUDITED)
(in
thousands)
|
|
For the Three
Months Ended
|
For the Nine
Months Ended
|
||
|
|
September 30,
|
September 30,
|
September 30,
|
September 30,
|
|
|
2020
|
2019
|
2020
|
2019
|
|
Net
income
|
$789
|
$200
|
$1,787
|
$617
|
|
Foreign
currency translation adjustment
|
(42)
|
(7)
|
(5)
|
(20)
|
|
Comprehensive
income
|
$747
|
$193
|
$1,782
|
$597
|
The
accompanying notes are an integral part of these unaudited
financial statements.
5
ISSUER DIRECT CORPORATION AND SUBSIDIARIES
CONSOLIDATED STATEMENTS OF STOCKHOLDERS’ EQUITY
(UNAUDITED)
(in
thousands, except share and per share amounts)
|
|
Common
Stock
|
Additional
Paid-in
|
Other
Accumulated Comprehensive
Income
|
Retained
|
Total
Stockholders
|
|
|
|
Shares
|
Amount
|
Capital
|
(Loss)
|
Earnings
|
Equity
|
|
Balance
at December 31, 2018
|
3,829,572
|
$4
|
$22,525
|
$(17)
|
$3,151
|
$25,663
|
|
Stock-based
compensation expense
|
—
|
—
|
137
|
—
|
—
|
137
|
|
Exercise of stock
awards, net of tax
|
24,996
|
—
|
—
|
—
|
—
|
—
|
|
Foreign currency
translation
|
—
|
—
|
—
|
(3)
|
—
|
(3)
|
|
Net
income
|
—
|
—
|
—
|
—
|
205
|
205
|
|
Balance
at March 31, 2019
|
3,854,568
|
$4
|
$22,662
|
$(20)
|
$3,356
|
$26,002
|
|
Stock-based
compensation expense
|
—
|
—
|
131
|
—
|
—
|
131
|
|
Exercise of stock
awards, net of tax
|
8,000
|
—
|
—
|
—
|
—
|
—
|
|
Foreign currency
translation
|
—
|
—
|
—
|
(10)
|
—
|
(10)
|
|
Net
income
|
—
|
—
|
—
|
—
|
212
|
212
|
|
Balance
at June 30, 2019
|
3,862,568
|
$4
|
$22,793
|
$(30)
|
$3,568
|
$26,335
|
|
Stock-based
compensation expense
|
—
|
—
|
127
|
—
|
—
|
127
|
|
Exercise of stock
awards, net of tax
|
—
|
—
|
—
|
—
|
—
|
—
|
|
Stock repurchase
and retirement
|
(24,980)
|
—
|
(236)
|
—
|
—
|
(236)
|
|
Foreign currency
translation
|
—
|
—
|
—
|
(7)
|
—
|
(7)
|
|
Net
income
|
—
|
—
|
—
|
—
|
200
|
200
|
|
Balance
at September 30, 2019
|
3,837,588
|
$4
|
$22,684
|
$(37)
|
$3,768
|
$26,419
|
|
|
|
|
|
|
|
|
|
Balance
at December 31, 2019
|
3,786,398
|
$4
|
$22,275
|
$(16)
|
$3,837
|
$26,100
|
|
Stock-based
compensation expense
|
—
|
—
|
45
|
—
|
—
|
45
|
|
Exercise of stock
awards, net of tax
|
8,002
|
—
|
—
|
—
|
—
|
—
|
|
Stock repurchase
and retirement
|
(21,700)
|
—
|
(203)
|
—
|
—
|
(203)
|
|
Foreign currency
translation
|
—
|
—
|
—
|
40
|
—
|
40
|
|
Net
income
|
—
|
—
|
—
|
—
|
226
|
226
|
|
Balance
at March 31, 2020
|
3,772,700
|
$4
|
$22,117
|
$24
|
$4,063
|
$26,208
|
|
Stock-based
compensation expense
|
—
|
—
|
84
|
—
|
—
|
84
|
|
Exercise of stock
awards, net of tax
|
24,000
|
—
|
—
|
—
|
—
|
—
|
|
Stock repurchase
and retirement
|
(62,198)
|
—
|
(582)
|
—
|
—
|
(582)
|
|
Foreign currency
translation
|
—
|
—
|
—
|
(3)
|
—
|
(3)
|
|
Net
income
|
—
|
—
|
—
|
—
|
772
|
772
|
|
Balance
at June 30, 2020
|
3,734,502
|
$4
|
$21,619
|
$21
|
$4,835
|
$26,479
|
|
Stock-based
compensation expense
|
—
|
—
|
72
|
—
|
—
|
72
|
|
Exercise of stock
awards, net of tax
|
7,250
|
—
|
66
|
—
|
—
|
66
|
|
Foreign currency
translation
|
—
|
—
|
—
|
(42)
|
—
|
(42)
|
|
Net
income
|
—
|
—
|
—
|
—
|
789
|
789
|
|
Balance
at September 30, 2020
|
3,741,752
|
$4
|
$21,757
|
$(21)
|
$5,624
|
$27,364
|
The
accompanying notes are an integral part of these consolidated
financial statements.
6
ISSUER DIRECT CORPORATION AND SUBSIDIARIES
CONSOLIDATED STATEMENTS OF CASH
FLOWS
(UNAUDITED)
(in
thousands)
|
|
For the Nine Months Ended
|
|
|
|
September 30,
|
September 30,
|
|
|
2020
|
2019
|
|
Cash flows from operating activities:
|
|
|
|
Net
income
|
$1,787
|
$617
|
|
Adjustments
to reconcile net income to net cash provided by operating
activities:
|
|
|
|
Depreciation
and amortization
|
1,052
|
1,261
|
|
Bad
debt expense
|
242
|
700
|
|
Deferred
income taxes
|
(27)
|
(46)
|
|
Non-cash
interest expense
|
19
|
19
|
|
Stock-based
compensation expense
|
201
|
396
|
|
Changes
in operating assets and liabilities:
|
|
|
|
Decrease
(increase) in accounts receivable
|
(634)
|
(1,166)
|
|
Decrease
(increase) in other assets
|
191
|
(117)
|
|
Increase
(decrease) in accounts payable
|
89
|
26
|
|
Increase
(decrease) in accrued expenses and other liabilities
|
195
|
(56)
|
|
Increase
(decrease) in deferred revenue
|
285
|
321
|
|
Net
cash provided by operating activities
|
3,400
|
1,955
|
|
|
|
|
|
Cash flows from investing activities:
|
|
|
|
Purchase
of VisualWebcaster Platform
|
—
|
(2,788)
|
|
Capitalized
software
|
—
|
(20)
|
|
Purchase
of fixed assets
|
(15)
|
(302)
|
|
Net
cash used in investing activities
|
(15)
|
(3,110)
|
|
|
|
|
|
Cash flows from financing activities:
|
|
|
|
Proceeds
from exercise of stock options, net of income taxes
|
66
|
—
|
|
Payment
for stock repurchase and retirement
|
(785)
|
(236)
|
|
Net
cash used in financing activities
|
(719)
|
(236)
|
|
|
|
|
|
Net
change in cash
|
2,666
|
(1,391)
|
|
Cash
– beginning
|
15,766
|
17,222
|
|
Currency
translation adjustment
|
(3)
|
(24)
|
|
Cash
– ending
|
$18,429
|
$15,807
|
|
|
|
|
|
Supplemental disclosures:
|
|
|
|
Cash
paid for income taxes
|
$323
|
$218
|
|
Non-cash activities:
|
|
|
|
Right-of-use
assets obtained in exchange for lease liabilities
|
$—
|
$260
|
The
accompanying notes are an integral part of these unaudited
financial statements.
7
ISSUER DIRECT CORPORATION AND SUBSIDIARIES
NOTES TO CONSOLIDATED FINANCIAL
STATEMENTS
(UNAUDITED)
Note 1. Basis of Presentation
The
unaudited interim consolidated balance sheet as of September 30,
2020 and consolidated statements of operations, comprehensive
income, stockholders’ equity, and cash flows for the three
and nine-month periods ended September 30, 2020 and 2019 included
herein, have been prepared in accordance with the instructions for
Form 10-Q under the Securities Exchange Act of 1934, as amended
(the “Exchange Act”), and Article 10 of Regulation S-X
under the Exchange Act. In the opinion of management, they include
all normal recurring adjustments necessary for a fair presentation
of the financial statements. Results of operations reported for the
interim periods are not necessarily indicative of results for the
entire year. Certain information and footnote disclosures normally
included in financial statements prepared in accordance with
accounting principles generally accepted in the United States ("US
GAAP") have been condensed or omitted pursuant to such rules and
regulations relating to interim financial statements. The interim
financial information should be read in conjunction with the 2019
audited financial statements of Issuer Direct Corporation (the
“Company”, “We”, or “Our”)
filed on Form 10-K.
Note 2. Summary of Significant Accounting Policies
The
consolidated financial statements include the accounts of the
Company and its wholly owned subsidiaries. Significant intercompany
accounts and transactions are eliminated in
consolidation.
Earnings Per Share (EPS)
Earnings per share
guidance requires that basic net income per common share be
computed by dividing net income for the period by the weighted
average number of common shares outstanding during the period.
Diluted net income per share is computed by dividing the net income
for the period by the weighted average number of common and
dilutive common equivalent shares outstanding during the period.
Shares issuable upon the exercise of stock options totaling 25,000
and 75,000 were excluded in the computation of diluted earnings per
common share during the three and nine-month periods ended
September 30, 2020, respectively, because their impact was
anti-dilutive. Shares issuable upon the exercise of stock options
totaling 93,000 were excluded in the computation of diluted
earnings per common share during the three and nine-month periods
ended September 30, 2019, because their impact was
anti-dilutive.
Revenue Recognition
Substantially all
the Company’s revenue comes from contracts with customers for
subscriptions to its cloud-based products or contracts for
communications and compliance products and services. Customers
consist primarily of corporate issuers and professional firms, such
as investor relations and public relations firms. In the case of
our news distribution and webcasting offerings, our customers also
include private companies. The Company accounts for a contract with
a customer when there is an enforceable contract between the
Company and the customer, the rights of the parties are identified,
the contract has economic substance, and collectability of the
contract consideration is probable. The Company's revenues are
measured based on consideration specified in the contract with each
customer.
The
Company's contracts include either a subscription to our entire
platform or certain modules within our platform, or an agreement to
perform services, or any combination thereof, and often contain
multiple subscriptions and services. For these bundled contracts,
the Company accounts for individual subscriptions and services as
separate performance obligations if they are distinct, which is
when a product or service is separately identifiable from other
items in the bundled package, and a customer can benefit from it on
its own or with other resources that are readily available to the
customer. The Company separates revenue from its contracts into two
revenue streams: i) Platform and Technology and ii) Services.
Performance obligations of Platform and Technology contracts
include providing subscriptions to certain modules or the entire
Platform id.
system, distributing press releases on a per release basis or
conducting webcasts or virtual annual meetings on a per event
basis. Performance obligations of Services contracts include
obligations to deliver compliance services and annual report
printing and distribution on either a stand ready obligation or on
a per project or event basis. Set up fees for compliance services
are considered a separate performance obligation and are satisfied
upfront. Set up fees for our transfer agent module and investor
relations content management module are immaterial. The
Company’s subscription and service contracts are generally
for one year, with automatic renewal clauses included in the
contract until the contract is cancelled. The contracts do not
contain any rights of returns, guarantees or warranties. Since
contracts are generally for one year, all the revenue is expected
to be recognized within one year from the contract start date. As
such, the Company has elected the optional exemption that allows
the Company not to disclose the transaction price allocated to
performance obligations that are unsatisfied or partially satisfied
at the end of each reporting period.
8
The
Company recognizes revenue for subscriptions evenly over the
contract period, upon distribution for per release contracts and
upon event completion for webcasting and virtual annual meeting
events. For service contracts that include stand ready obligations,
revenue is recognized evenly over the contract period. For all
other services delivered on a per project or event basis, the
revenue is recognized at the completion of the event. The Company
believes recognizing revenue for subscriptions and stand ready
obligations using a time-based measure of progress, best reflects
the Company’s performance in satisfying the
obligations.
For
bundled contracts, revenue is allocated to each performance
obligation based on its relative standalone selling price.
Standalone selling prices are based on observable prices at which
the Company separately sells the subscription or services. If a
standalone selling price is not directly observable, the Company
uses the residual method to allocate any remaining price to that
subscription or service. The Company regularly reviews standalone
selling prices and updates these estimates if
necessary.
The
Company invoices its customers based on the billing schedules
designated in its contracts, typically upfront on either a monthly,
quarterly or annual basis or per transaction at the completion of
the performance obligation. Deferred revenue for the periods
presented was primarily related to subscription and service
contracts, which are billed upfront, quarterly or annually, however
the revenue has not yet been recognized. The associated deferred
revenue is generally recognized ratably over the billing period.
Additionally, deferred revenue is related to pre-paid packages of
press releases for which the releases have not yet been
disseminated. Deferred revenue as of September 30, 2020 and
December 31, 2019 was $2,098,000 and $1,812,000, respectively, and
is expected to be recognized within one year. Revenue recognized
for the nine months ended September 30, 2020 and 2019, that was
included in the deferred revenue balance at the beginning of each
reporting period, was approximately $1,663,000 and $873,000,
respectively. Accounts receivable, net of allowance for doubtful
accounts, related to contracts with customers was $2,445,000 and
$2,051,000 as of September 30, 2020 and December 31, 2019,
respectively. Since substantially all the contracts have terms of
one year or less, the Company has elected to use the practical
expedient regarding the existence of a significant
financing.
Costs
to obtain contracts with customers consist primarily of sales
commissions. As of September 30, 2020 and December 31, 2019, the
Company has capitalized $34,000 and $21,000, respectively, of costs
to obtain contracts that are expected to be amortized over more
than one year. For contract costs expected to be amortized in less
than one year, the Company has elected to use the practical
expedient allowing the recognition of incremental costs of
obtaining a contract as an expense when incurred. The Company has
considered historical renewal rates, expectations of future
renewals and economic factors in making these
determinations.
Cash Equivalents
For
purposes of the Company’s financial statements, the Company
considers all highly liquid investments purchased with an original
maturity date of three months or less to be cash
equivalents.
Accounts Receivable and Allowance for Doubtful
Accounts
The
Company monitors outstanding receivables based on factors
surrounding the credit risk of specific customers, historical
trends, and other information. Credit is granted on an unsecured
basis. The allowance for doubtful accounts is estimated based on an
assessment of the Company’s ability to collect on customer
accounts receivable. There is judgment involved with estimating the
allowance for doubtful accounts and if the financial condition of
the Company’s customers were to deteriorate, resulting in
their inability to make the required payments, the Company may be
required to record additional allowances or charges against
revenues. The Company generally writes-off accounts receivable
against the allowance when it determines a balance is uncollectible
and no longer actively pursues its collection.
Concentration of Credit Risk
Financial
instruments and related items which potentially subject the Company
to concentrations of credit risk consist primarily of cash, cash
equivalents and accounts receivables. The Company places its cash
and temporary cash investments with credit quality institutions.
Such cash balances are typically in excess of the FDIC insurance
limit of $250,000. To reduce its risk associated with the failure
of such financial institutions, the Company evaluates at least
annually the rating of the financial institution in which it holds
deposits. As of September 30, 2020, the total amount exceeding such
limit was $17,365,000. The Company also had cash-on-hand of $32,000
in Europe and $333,000 in Canada as of September 30,
2020.
The
Company believes it did not have any financial instruments that
could have potentially subjected us to significant concentrations
of credit risk for any relevant period.
Use of Estimates
The
preparation of financial statements in conformity with US GAAP
requires management to make estimates and assumptions that affect
the reported amounts of assets and liabilities and disclosure of
contingent assets and liabilities at the date of the financial
statements and the reported amounts of revenues and expenses during
the reporting period. Significant estimates include the allowance
for doubtful accounts and the valuation of goodwill, intangible
assets, deferred tax assets, and stock-based compensation. Actual
results could differ from those estimates.
9
Income Taxes
We
comply with Financial Accounting Standards Board
(“FASB”) ASC No. 740 – Income Taxes which
requires an asset and liability approach to financial accounting
and reporting for income taxes. Deferred income tax assets and
liabilities are computed for differences between the financial
statement and tax bases of assets and liabilities that will result
in future taxable or deductible amounts based on enacted tax laws
and rates applicable to the periods in which the differences are
expected to affect taxable income. Valuation allowances are
established, when necessary, to reduce deferred income tax assets
to the amounts expected to be realized. For any uncertain tax
positions, we recognize the impact of a tax position, only if it is
more likely than not of being sustained upon examination, based on
the technical merits of the position. Our policy regarding the
classification of interest and penalties is to classify them as
income tax expense in our financial statements, if applicable. At
the end of each interim period, we estimate the effective tax rate
we expect to be applicable for the full year and this rate is
applied to our results for the interim year-to-date period and then
adjusted for any discrete period items.
Capitalized Software
Costs
incurred to develop our cloud-based platform products are
capitalized when the preliminary project phase is complete,
management commits to fund the project and it is probable the
project will be completed and used for its intended purposes. Once
the software is substantially complete and ready for its intended
use, the software is amortized over its estimated useful life,
which is typically four years. Costs related to design or
maintenance of the software are expensed as incurred. Capitalized
costs and amortization for the three and nine-month periods ended
September 30, 2020 and 2019, are as follows (in
thousands):
|
|
For the Three
Months Ended
|
For the Nine
Months Ended
|
||
|
|
September 30,
|
September 30,
|
September 30,
|
September 30,
|
|
|
2020
|
2019
|
2020
|
2019
|
|
|
|
|
|
|
|
Capitalized
software development costs
|
$—
|
$—
|
$—
|
$20
|
|
Amortization
included in cost of revenues
|
143
|
201
|
454
|
602
|
|
Amortization
included in depreciation and amortization
|
1
|
5
|
9
|
14
|
Lease Accounting
We
determine if an arrangement is a lease at inception. Our operating
lease agreements are primarily for office space and are included
within lease right-of-use (“ROU”) assets and lease
liabilities on the consolidated balance sheets.
ROU
assets represent our right to use an underlying asset for the lease
term and lease liabilities represent our obligation to make lease
payments arising from the lease. ROU assets and lease liabilities
are recognized at the commencement date based on the present value
of lease payments over the lease term. Our variable lease payments
consist of non-lease services related to the lease and payments
under operating leases classified as short-term. Variable lease
payments are excluded from the ROU assets and lease liabilities and
are recognized in the period in which the obligation for those
payments is incurred. As most of our leases do not provide an
implicit rate, we use our incremental borrowing rate based on the
information available at commencement date in determining the
present value of lease payments. ROU assets include any lease
payments made and exclude lease incentives. Rental expense for
lease payments related to operating leases is recognized on a
straight-line basis over the lease term.
Fair Value Measurements
ASC
Topic 820 establishes a fair value hierarchy that requires an
entity to maximize the use of observable inputs and minimize the
use of unobservable inputs when measuring fair value. Assets and
liabilities recorded at fair value in the financial statements are
categorized based upon the hierarchy of levels of judgment
associated with the inputs used to measure their fair value.
Hierarchical levels directly related to the amount of subjectivity
associated with the inputs to fair valuation of these assets and
liabilities, are as follows:
●
Level 1 –
Quoted prices are available in active markets for identical assets
or liabilities at the reporting date. Generally, this includes debt
and equity securities that are traded in an active market. Our cash
and cash equivalents are quoted at Level 1.
●
Level 2 –
Observable inputs other than Level 1 prices such as quoted prices
for similar assets or liabilities; quoted prices in markets that
are not active; or other inputs that are observable or can be
corroborated by observable market data for substantially the full
term of the assets or liabilities. Generally, this includes debt
and equity securities that are not traded in an active
market.
●
Level 3 –
Unobservable inputs that are supported by little or no market
activity and that are significant to the fair value of the assets
or liabilities. Level 3 assets and liabilities include financial
instruments whose value is determined using pricing models,
discounted cash flow methodologies, or other valuation techniques,
as well as instruments for which the determination of fair value
requires significant management judgment or
estimation.
As of
September 30, 2020 and December 31, 2019, we believe that the fair
value of our financial instruments other than cash and cash
equivalents, such as, accounts receivable, our line of credit,
notes payable, and accounts payable approximate their carrying
amounts.
10
Translation of Foreign Financial Statements
The
financial statements of the foreign subsidiaries of the Company
have been translated into U.S. dollars. All assets and liabilities
have been translated at current rates of exchange in effect at the
end of the period. Income and expense items have been translated at
the average exchange rates for the year or the applicable interim
period. The gains or losses that result from this process are
recorded as a separate component of other accumulated comprehensive
income until the entity is sold or substantially
liquidated.
Business Combinations, Goodwill and Intangible Assets
We
account for business combinations under FASB ASC No. 805 –
Business Combinations and the related acquired intangible assets
and goodwill under FASB ASC No. 350 – Intangibles –
Goodwill and Other. The authoritative guidance for business
combinations specifies the criteria for recognizing and reporting
intangible assets apart from goodwill. We record the assets
acquired and liabilities assumed in business combinations at their
respective fair values at the date of acquisition, with any excess
purchase price recorded as goodwill. Goodwill is an asset
representing the future economic benefits arising from other assets
acquired in a business combination that are not individually
identified and separately recognized. Intangible assets consist of
client relationships, customer lists, distribution partner
relationships, software, technology, non-compete agreements and
trademarks that are initially measured at fair value. At the time
of the business combination, trademarks are considered an
indefinite-lived asset and, as such, are not amortized as there is
no foreseeable limit to cash flows generated from them. The
goodwill and intangible assets are assessed annually for
impairment, or whenever conditions indicate the asset may be
impaired, and any such impairment will be recognized in the period
identified. The client relationships (7-10 years), customer lists
(3 years), distribution partner relationships (10 years),
non-compete agreements (5 years) and software and technology (3-6
years) are amortized over their estimated useful
lives.
Comprehensive Income
Comprehensive
income consists of net income and other comprehensive income
related to changes in the cumulative foreign currency translation
adjustment.
Advertising
The
Company expenses advertising costs as incurred.
Stock-based compensation
The
authoritative guidance for stock compensation requires that
companies estimate the fair value of share-based payment awards on
the date of the grant using an option-pricing model. The associated
cost is recognized over the period during which an employee or
director is required to provide service in exchange for the
award.
Recently adopted accounting pronouncements
On
January 1, 2020, the Company adopted ASU 2017-04 Intangibles – Goodwill and Other (Topic
350): Simplifying the Test for Goodwill
Impairment. These amendments
eliminate Step 2 from the goodwill impairment test. The annual, or
interim, goodwill impairment test is performed by comparing the
fair value of a reporting unit with its carrying amount. An
impairment charge should be recognized for the amount by which the
carrying amount exceeds the reporting unit’s fair value;
however, the loss recognized should not exceed the total amount of
goodwill allocated to that reporting unit. In addition, income tax
effects from any tax-deductible goodwill on the carrying amount of
the reporting unit should be considered when measuring the goodwill
impairment loss, if applicable. The amendments also eliminate the
requirements for any reporting unit with a zero or negative
carrying amount to perform a qualitative assessment and, if it
fails that qualitative test, to perform Step 2 of the goodwill
impairment test. An entity still has the option to perform the
qualitative assessment for a reporting unit to determine if the
quantitative impairment test is necessary. The Company adopted this
amendment as of January 1, 2020 and it has not, nor is it expected
to have a significant impact to the financial
statements.
Note 3: Recent Acquisitions
Acquisition of the VisualWebcaster Platform
(“VWP”)
On
January 3, 2019 (the “Closing Date”), the Company
entered into an Asset Purchase Agreement (the “VWP
Agreement”) with Onstream Media Corporation, a Florida
corporation (the “Seller”), whereby the Company
purchased certain assets related primarily to customer accounts,
intellectual property, lease deposits and assumed certain existing
contractual obligations related primarily to data processing and
storage, bandwidth and facility leases relating to the
Seller’s VisualWebcaster Platform. The accounts receivable
and the accounts payable related to VWP and existing as of the
Closing Date were not included as part of the VWP
Agreement.
11
The
acquisition was accounted for under the acquisition method of
accounting for business combinations in accordance with FASB ASC
805, Business Combinations, which requires, among other things,
that the assets acquired and liabilities assumed be recognized at
their fair values as of the acquisition date. Acquisition-related
costs, which totaled approximately $155,000, are not included as a
component of the acquisition accounting, but are recognized as
expenses in the periods in which the costs are incurred. The
Company employed a third-party valuation firm to assist in
determining the purchase price allocation of assets and liabilities
acquired from Seller. The valuation resulted in the tangible and
intangible assets and liabilities disclosed below. The income
approach was used to determine the value of the customer
relationships and non-compete agreement. The income approach
determines the fair value for the asset based on the present value
of cash flows projected to be generated by the asset. Projected
cash flows are discounted at a rate of return that reflects the
relative risk of achieving the cash flow and the time value of
money. Projected cash flows considered multiple factors, including
current revenue from existing customers; analysis of expected
revenue and attrition trends; reasonable contract renewal
assumptions from the perspective of a marketplace participant;
probability of executives competing, expected profit margins giving
consideration to marketplace synergies; and required returns to
contributory assets. The relief from royalty method was used to
value the technology. The relief from royalty method determines the
fair value by calculating what a typical license fee would be in
order to obtain the same or similar license of the technology from
market participants. Projected cash flows consider revenue
assumptions allocated to the technology.
The
transaction consisted of a single cash payment to the Seller in the
amount of $2,788,000. In connection with the acquisition, the
Company assumed two short-term leases associated with an office and
co-location for certain computer equipment in New York City, New
York as well as entered into a three-year office lease in Florida.
In addition to the intangible assets listed below, the purchase
price included lease deposits of $13,000 and a right of use asset
and corresponding lease liability for the office lease in Florida
in the amount of $125,000.
The
identified intangible assets as a result of the acquisition are as
follows (in 000’s):
|
Customer
relationships
|
$865
|
|
Technology
|
497
|
|
Non-compete
agreement
|
69
|
|
Goodwill
|
1,344
|
|
|
$2,775
|
Note 4: Equity
2014 Equity Incentive Plan
On May
23, 2014, the shareholders of the Company approved the 2014 Equity
Incentive Plan (the “2014 Plan”). Under the terms of
the 2014 Plan, the Company is authorized to issue incentive awards
for common stock up to 200,000 shares to employees and other
personnel. On June 10, 2016 and June 17, 2020, the shareholders of
the Company approved an additional 200,000 and 200,000 awards,
respectively, to be issued under the 2014 Plan, bringing the total
number of shares to be awarded to 600,000. The awards may be in the
form of incentive stock options, nonqualified stock options,
restricted stock, restricted stock units and performance awards.
The 2014 Plan is effective through March 31, 2024. As of September
30, 2020, there are 236,583 shares which remain to be granted under
the 2014 Plan.
The
following table summarizes information about stock options
outstanding and exercisable at September 30, 2020:
|
|
Options
Outstanding
|
Options
Exercisable
|
||
|
Exercise Price
Range
|
Number
|
Weighted
Average
Remaining
Contractual
Life (in
Years)
|
Weighted
Average
Exercise
Price
|
Number
|
|
$0.01 - 7.00
|
10,000
|
5.14
|
$6.80
|
10,000
|
|
$7.01 - 8.00
|
15,313
|
2.99
|
$7.76
|
15,313
|
|
$8.01 - 12.00
|
7,167
|
6.13
|
$9.88
|
5,167
|
|
$12.01 - 15.00
|
47,750
|
7.70
|
$13.10
|
35,250
|
|
$15.01 - 17.40
|
24,000
|
7.67
|
$17.40
|
24,000
|
|
Total
|
104,230
|
6.65
|
$12.48
|
89,730
|
As of
September 30, 2020, the Company had unrecognized stock compensation
related to the options of $35,000, which will be recognized through
2021.
During
the nine months ended September 30, 2020, the Company granted
18,000 restricted stock units with an intrinsic value of $10.67, to
certain members of the Board of Directors of the Company. The
vesting period for the restricted stock units is the earlier of the
2021 annual meeting of shareholders or one year depending on
whether a director stands for re-election at the 2021 annual
meeting. During the nine months ended September 30, 2020, 32,000
restricted stock units with an intrinsic value of $11.61 vested. As
of September 30, 2020, there was $142,000 of unrecognized
compensation cost related to our unvested restricted stock units,
which will be recognized through 2021.
12
Stock repurchase and retirement
On
August 7, 2019, the Company publicly announced a share repurchase
program under which the Company is authorized to repurchase up to
$1,000,000 of its common shares. On March 16, 2020, the Company
publicly announced that the Company increased the share repurchase
program to repurchase up to $2,000,000 of its common shares. As of
September 30, 2020, the Company repurchased a total of 160,068
shares at an aggregate cost of $1,552,000 (not including
commissions of $7,000) as shown in the table below ($ in
000’s, except share or per share amounts):
|
|
Shares
Repurchased
|
|||
|
Period
|
Total Number of
Shares Repurchased
|
Average Price
Paid Per Share
|
Total Number of
Shares Purchased as Part of Publicly Announced Program
|
Maximum Dollar
Value of Shares that May Yet Be Purchased Under the
Program
|
|
August 7 -31,
2019
|
22,150
|
$9.34
|
22,150
|
$793
|
|
September 1-30,
2019
|
2,830
|
$10.00
|
2,830
|
$765
|
|
October 1-31,
2019
|
39,363
|
$10.44
|
39,363
|
$354
|
|
November 1-30,
2019
|
11,827
|
$10.43
|
11,827
|
$231
|
|
December 1-31,
2019
|
—
|
—
|
—
|
$231
|
|
January 1-31,
2020
|
—
|
—
|
—
|
$231
|
|
February 1-29,
2020
|
—
|
—
|
—
|
$231
|
|
March 1-31,
2020
|
21,700
|
$9.33
|
21,700
|
$1,028
|
|
April 1-30,
2020
|
22,698
|
$9.02
|
22,698
|
$823
|
|
May 1-31,
2020
|
39,500
|
$9.51
|
39,500
|
$448
|
|
June 1-30,
2020
|
—
|
—
|
—
|
$448
|
|
July 1-31,
2020
|
—
|
—
|
—
|
$448
|
|
August 1-31,
2020
|
—
|
—
|
—
|
$448
|
|
September 1-30,
2020
|
—
|
—
|
—
|
$448
|
|
Total
|
160,068
|
$9.70
|
160,068
|
$448
|
Note 5: Income taxes
We
recognized income tax expense of $283,000 and $593,000 during the
three and nine-month periods ended September 30, 2020,
respectively, compared to $59,000 and $105,000 during the same
periods of 2019. At the end of each interim period, we estimate the
effective tax rate we expect to be applicable for the full fiscal
year and this rate is applied to our results for the year-to-date
period, and then adjusted for any discrete period items. For the
three and nine-month periods ended September 30, 2020, the variance
between the Company’s effective tax rate and the U.S.
statutory rate of 21% is primarily attributable to state income
taxes. For the three and nine-month periods ended September 30,
2019, the variance between the Company’s effective tax rate
and the U.S. statutory rate is primarily attributable to the excess
stock-based compensation tax benefit recognized in income tax
expense during the periods, as well as foreign statutory tax rate
differentials and tax credits.
The
Company analyzed legislation enacted on March 27, 2020, The
Coronavirus Aid, Relief and Economic Security (“CARES”)
Act. and noted it does not have a significant impact to the
Company.
Note 6: Leases
Generally, our
leasing activity consists of office leases. In March 2019, we
signed a new lease to move our corporate headquarters to Raleigh,
North Carolina. As we continue our transition from a services-based
company to a cloud-based platform company, the new lease affords us
the ability to separate our warehouse from our corporate office.
The new lease, which had a lease commencement date of October 2,
2019, is for 9,766 square feet and expires December 31, 2027.
Minimum lease payments are $2,997,000, not including a tenant
improvement allowance of $488,000, which is included in fixed
assets as of September 30, 2020. We recognized a ROU asset and
corresponding lease liability of $2,596,000, which represents the
present value of minimum lease payments discounted at 3.77%, the
Company’s incremental borrowing rate at lease
inception.
13
Additionally, we
have an office in Salt Lake City, Utah, which is on a short-term
lease that is less than twelve months. As a result, we have elected
the short-term lease recognition exemption for our Utah office
lease, which means, for those leases we do not expect to extend
beyond twelve months, we will not recognize ROU assets or lease
liabilities.
In
connection with the Company’s acquisition of VWP (See Note
3), the Company assumed two short-term leases in New York City, NY
and entered into a three-year office lease in Florida. We have
elected the short-term lease exemption for the two New York leases
because we do not expect them to extend beyond twelve months. For
the Florida lease, which was signed on January 4, 2019, we
recognized a ROU asset and corresponding lease liability of
$125,000, which represents the present value of minimum lease
payments discounted at 4.25%, the Company’s incremental
borrowing rate at lease inception.
Lease
liabilities totaled $2,445,000 as of September 30, 2020. The
current portion of this liability of $391,000 is included in
Accrued expenses on the Consolidated balance sheets and the
long-term portion of $2,054,000 is included in Lease liabilities on
the Consolidated Balance Sheets. Rent expense consists of both
operating lease expense from amortization of our ROU assets as well
as variable lease expense which consists of non-lease components of
office leases (i.e. common area maintenance) or rent expense
associated with short- term leases. The components of lease expense
were as follows (in 000’s):
|
|
For the Three
Months Ended
|
For the Nine
Months Ended
|
||
|
|
September 30,
|
September 30,
|
September 30,
|
September 30,
|
|
|
2020
|
2019
|
2020
|
2019
|
|
Lease expense
|
|
|
|
|
|
Operating lease
expense
|
$87
|
$41
|
$261
|
$124
|
|
Variable lease
expense
|
33
|
52
|
99
|
136
|
|
Total lease
expense
|
$120
|
$93
|
$360
|
$260
|
The
weighted-average remaining non-cancelable lease term for our
operating leases was 7.1 years as of September 30, 2020. As of
September 30, 2020, the weighted-average discount rate used to
determine the lease liability was 3.8%. The future minimum lease
payments to be made under non-cancelable operating leases at
September 30, 2020, are as follows (in 000’s):
|
Year
Ended December 31:
|
|
|
2020
|
$97
|
|
2021
|
394
|
|
2022
|
359
|
|
2023
|
369
|
|
2024
|
379
|
|
Thereafter
|
1,201
|
|
Total lease
payments
|
$2,799
|
|
Present value
adjustment
|
(354)
|
|
Lease
liability
|
2,445
|
We have
performed an evaluation of our other contracts with customers and
suppliers in accordance with Topic 842 and have determined that,
except for the leases described above, none of our contracts
contain a lease.
Note 7: Revenue
We
consider ourselves to be a single reportable segment under the
authoritative guidance for segment reporting, specifically a
shareholder communications and compliance company for publicly
traded and private companies. The following tables present revenue
disaggregated by revenue stream in (000’s):
|
|
Three months ended September 30,
|
|||
|
Revenue Streams
|
2020
|
2019
|
||
|
Platform
and Technology
|
$3,613
|
74.0%
|
$2,712
|
67.5%
|
|
Services
|
1,269
|
26.0%
|
1,307
|
32.5%
|
|
Total
|
$4,882
|
100.0%
|
$4,019
|
100.0%
|
|
|
Nine months ended September 30,
|
|||
|
Revenue Streams
|
2020
|
2019
|
||
|
Platform
and Technology
|
$9,599
|
69.6%
|
$8,038
|
65.2%
|
|
Services
|
4,183
|
30.4%
|
4,298
|
34.8%
|
|
Total
|
$13,782
|
100.0%
|
$12,336
|
100.0%
|
14
No
customers accounted for more than 10% of the operating revenues
during the three and nine-month periods ended September 30, 2020 or
2019.
Note 8: Line of Credit
Effective October
3, 2019, the Company renewed its unsecured Line of Credit, which
increased the term to two years, with all other provisions
remaining the same. The amount of funds available for borrowing are
$3,000,000 and the interest rate is LIBOR plus 1.75%. As of
September 30, 2020, the interest rate was 1.90% and the Company did
not owe any amounts on the Line of Credit.
Note 9: COVID-19 Pandemic
On
January 30, 2020, the World Health Organization declared the
COVID-19 outbreak a "Public Health Emergency of International
Concern" and on March 11, 2020, declared it to be a pandemic.
Actions taken around the world to help mitigate the spread of
COVID-19 include restrictions on travel, quarantines or
“stay-at-home” restrictions in certain areas and forced
closures for certain types of public places and businesses.
COVID-19 and actions taken to mitigate it have had and are expected
to continue to have an adverse impact on the economies and
financial markets globally, including the geographical areas in
which we operate. Although our offices were initially ordered
temporarily closed for the safety of our employees, their families
and our community, on June 1, 2020, we began slowly re-opening our
offices, which are now open for all employees who elect to return
to the office.
While
it is unknown how long these conditions will last, including
whether a worldwide resurgence will occur, and what the complete
financial impact will be to the Company, we could experience a
material disruption of our employees and operations, a decline in
revenue, a decline in value of our assets, deterioration of our
customer base and the inability of our customers to pay for
subscriptions or services provided. To date, we have seen both
positive and negative impacts to our business. Several in-person
conferences scheduled to occur in the first half of the year were
either cancelled or delayed and we also experienced a delay in
transactions processed by the Depository Trust Company in our
transfer agent business. However, our ability to pivot and enhance
our product offering with our virtual products generated increased
revenue from virtual annual meetings and webcasting during the
second and third quarters. Despite the short-term increase in
revenue, the concentrations of our customer base within middle,
small and micro-cap public customers make it reasonably possible
that we are vulnerable to the risk of a near-term negative impact
related to the COVID-19 outbreak if a substantial portion of these
customers are forced to scale back or cease operations. We are
closely monitoring the impact of the COVID-19 pandemic on all
aspects of our business and are unable at this time to predict the
continued impact that COVID-19 will have on our business, financial
position, and operating results in future periods due to numerous
uncertainties.
15
ITEM 2. MANAGEMENT’S DISCUSSION
AND ANALYSIS OF FINANCIAL CONDITION AND RESULTS OF
OPERATIONS.
The discussion of the financial condition and results of operations
of the Company set forth below should be read in conjunction with
the consolidated financial statements and related notes thereto
included elsewhere in this Form10-Q. This Form10-Q contains
forward-looking statements that involve risks and uncertainties.
The statements contained in this Form10-Q that are not purely
historical are forward-looking statements within the meaning of
Section 27a of the Securities Act and Section 21e of the Exchange
Act. When used in this Form10-Q, or in the documents incorporated
by reference into this Form 10-Q, the words
“anticipate,” “believe,”
“estimate,” “intend” and
“expect” and similar expressions are intended to
identify such forward-looking statements. Such forward-looking
statements include, without limitation, the statements regarding
the Company’s strategy, future sales, future expenses, future
liquidity and capital resources. All forward-looking statements in
this Form10-Q are based upon information available to the Company
on the date of this Form10-Q, and the Company assumes no obligation
to update any such forward-looking statements. The Company’s
actual results could differ materially from those discussed in this
Form10-Q for many reasons, including the impact of the COVID-19
pandemic. Factors that could cause or contribute to such
differences (“Cautionary Statements”) include, but are
not limited to, those discussed in Item 1. Business —
“Risk Factors” and elsewhere in the Company’s
Annual Report on Form10-K for the year ended December 31, 2019,
which are incorporated by reference into this Form 10-Q. All
subsequent written and oral forward-looking statements attributable
to the Company, or persons acting on the Company’s behalf,
are expressly qualified in their entirety by the Cautionary
Statements.
Overview
Issuer
Direct Corporation and its subsidiaries are hereinafter
collectively referred to as “Issuer Direct”, the
“Company”, “We” or “Our” unless
otherwise noted. Our corporate offices are located at One Glenwood
Ave., Suite 1001, Raleigh, North Carolina, 27603.
We
announce material financial information to our investors using our
investor relations website, SEC filings, investor events, news and
earnings releases, public conference calls, webcasts and social
media. We use these channels to communicate with our investors and
the public about our company, our products and services and other
related matters. It is possible that information we post on some of
these channels could be deemed to be material information.
Therefore, we encourage investors, the media and others interested
in our company to review the information we post to all our
channels, including our social media accounts.
Issuer Direct is a premier provider of
communications and compliance technology solutions that are
designed to help organizations tell their stories globally. Issuer
Direct's principal platform, Platform id., empowers users by thoughtfully integrating the
most relevant tools, technologies and products, thus eliminating
the complexity associated with producing and distributing their
business communications and financial
information.
We work with a diverse customer base, which
includes not only corporate issuers and private companies, but also
investment banks, professional firms, such as investor relations
and public relations firms, as well as the accounting and legal
communities. We also sell products and services to others in the
financial services industry, including brokerage firms and mutual
funds. Our customers and their service providers utilize
Platform id. and
related solutions from document creation all the way to
dissemination to regulatory bodies, news outlets, financial
platforms and their shareholders. Private companies primarily use
our news distribution and webcasting products and services to
disseminate their message globally. Platform id.’s subscription platform guides thousands of
customers through the process of communicating their message to a
large audience.
We
also work with several select stock exchanges by making available
certain parts of our platform under agreements to integrate our
offerings within their products. We believe such partnerships will
continue to yield increased exposure to a targeted customer base
that could impact our revenue and overall brand in the
market.
On
January 30, 2020, the World Health Organization declared the
COVID-19 outbreak a "Public Health Emergency of International
Concern" and on March 11, 2020, declared it to be a pandemic.
Actions taken around the world to help mitigate the spread of
COVID-19 include restrictions on travel, quarantines or
“stay-at-home” restrictions in certain areas and forced
closures for certain types of public places and businesses.
COVID-19 and actions taken to mitigate it have had and are expected
to continue to have an adverse impact on the economies and
financial markets globally, including the geographical areas in
which we operate. Although our offices were initially ordered
temporarily closed for the safety of our employees, their families
and our community, on June 1, 2020 we began slowly re-opening our
offices, which are now open to all employees who elect to return to
the office.
While
it is unknown how long these conditions will last, including
whether a worldwide resurgence will occur, and what the complete
financial impact will be to the Company, we could experience a
material disruption of our employees and operations, a decline in
revenue, a decline in value of our assets, deterioration of our
customer base and the inability of our customers to pay for
subscriptions or services provided. To date, we have seen both
positive and negative impacts to our business. Several in-person
conferences scheduled to occur in the first half of the year were
either cancelled or delayed and we also experienced a delay in
transactions processed by the Depository Trust Company, banks and
brokers in our transfer agent business. However, our ability to
pivot and enhance our product offering with our virtual products
generated increased revenue during the second and third quarters.
Despite the short-term increase in revenue, the concentrations of
our customer base within middle, small and micro-cap public
customers make it reasonably possible that we are vulnerable to the
risk of a near-term negative impact related to the COVID-19
outbreak if a substantial portion of these customers are forced to
scale back or cease operations. We are closely monitoring the
impact of the COVID-19 pandemic on all aspects of our business and
are unable at this time to predict the continued impact that
COVID-19 will have on our business, financial position, and
operating results in future periods due to numerous
uncertainties.
16
Toward
the end of the first quarter of 2020 and in response to the
COVID-19 pandemic, we began enhancing our products by adding
virtual components, as well as focusing our selling efforts on our
webcasting technologies previously acquired in January 2019. One
example of this approach is emphasizing our virtual annual meeting
product, which combines our proxy voting platform with a virtual
component, allowing our customers the ability to hold their annual
meeting virtually instead of hosting an in-person meeting.
Additionally, we improved our conference software by adding a
virtual component allowing participants to attend via video webcast
and participate in one-on-one meetings with audio, video and share
features. Lastly, we have advanced our webcasting product to
include features for investment banks to perform virtual roadshows,
analyst days and other types of events.
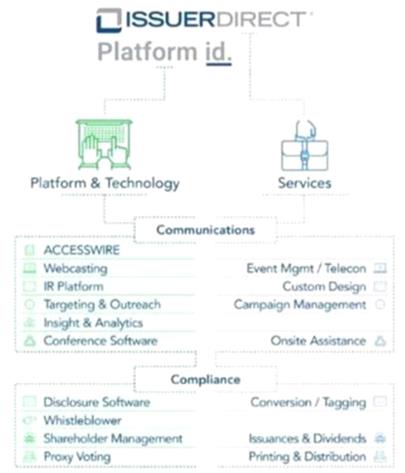
In
order to provide a good representation of our business and reflect
our platform first engagement strategy, we report revenue in two
revenue streams: (i) Platform and Technology and (ii) Services. Set
forth below is an infographic depicting the modules included in
Platform id. and
the services we provide:
17
Platform and Technology
As we continue to focus on our cloud-based
subscription business, we expect the Platform and Technology
portion of our business to continue to increase in the future, both
in terms of overall revenue and as compared to the Services portion
of our business. Platform and Technology revenue grew to 74% of
total revenue during the third quarter of 2020 compared to 67%
during the third quarter of 2019. In 2020, the growth was due to a
combination of increased revenue from our new virtual
products and conference software, increased revenue from our
newswire business, as well
as, increased subscriptions of
Platform id.
We continue to invest in both our current
Platform id.
offerings as well as additional
capabilities that we intend to incorporate into our Platform and
Technology offerings to further advance our strategy of bringing
the issuer and investor closer together. During the first quarter,
we were able to pivot portions of our platform to specifically
address COVID-19 business limitations. This resulted in a new
Virtual Annual Meeting product, which combines our webcasting and
proxy voting technology together. Additionally, we also upgraded
technology of our conference software product to allow conferences
to go fully virtual and hold one-on-one meetings
with audio, video and share
features. We believe these
developments will assist us in delivering best of breed solutions
to the market, but also lead us into new opportunities
during this changing, challenging environment.
Platform id.
Platform id.
is our cloud-based subscription
platform that efficiently and effectively helps our customers
manage their events when seeking to distribute their messaging to
key constituents, investors, markets and regulatory systems around
the globe. Platform id.
consists of several related but
distinct shareholder communications and compliance modules that
public companies utilize every quarter when they have requirements
to meet reporting obligations as well as fair disclosure to the
markets.
Within most of our target markets, customers
require several individual services and/or software providers to
meet their investor relations, communications and compliance needs.
We believe Platform id.
can address all these needs in a
single, secure, cloud-based platform - one that offers a customer
control, increases efficiencies, demonstrates clear value and, most
importantly, delivers consistent and compliant messaging from one
centralized platform.
Communications Modules
ACCESSWIRE
Our press release offering, which is marketed
under the brand ACCESSWIRE, is a cost-effective, Regulation Fair Disclosure
(“FD”) news dissemination and media outreach service.
The ACCESSWIRE product offering focuses on press release
distribution for both private and public companies globally.
ACCESSWIRE is dependent upon several key partners for news
distribution and disruption in any of our partnerships could have a
materially adverse impact on our ACCESSWIRE and overall
business.
We
believe ACCESSWIRE has become a competitive alternative to the
traditional newswires because we have been able to integrate
customer editing features and improve the targeting and analytics
reporting systems as well as increase its distribution footprint.
We recently released a new e-commerce element to our ACCESSWIRE
product, whereby customers can self-select their distribution and
then register, upload their press release and tell their story in
minutes without contacting a sales or operational employee.
Further, we have additional technology enhancements planned to be
released before the end of this fiscal year, which we believe will
further provide value to our customers around the drafting,
collaboration and engagement process.
Part
of our market strategy for ACCESSWIRE is to provide flexible
pricing, by offering our customers the option to pay per release or
enter into longer-term, flat-fee subscriptions. We believe this
strategy, combined with technology innovation and continually
adding distribution will enable us to continue to add new customers
in 2020 and beyond, resulting in an increase in market share.
Currently, ACCESSWIRE is available within Platform id. as part of a
subscription or as a stand-alone module.
Professional Conference Organizer (PCO) Module
At the end of 2018, we released a new module to
Platform id., centered around the professional conference
organizer (“PCO”). This subscription is being
licensed to investor conference organizers, which in the aggregate
we believe hold an estimated 1,000 plus events a year, although
this number has been and is expected to be reduced significantly in
the near future and possibly long-term as a result of COVID-19.
This cloud-based product is integrated within Platform id. and enhances our
communications module subscription offerings of newswire,
newsrooms, webcasting and shareholder targeting.
This
cloud-based platform, also available as a mobile app, offers
organizers, issuers and investors the ability to register, request
and approve one-on-one meetings, manage schedules, perform event
promotion and sponsorship, print attendee badges and manage
lodging. By combining this module with the other components of
Platform id., we
believe it gives us a unique offering for PCOs that is not
available elsewhere in the market.
18
We
believe entering this business expands our current Platform and
Technology revenue base, and as an adjacency, should assist in
making Platform id.
a platform of choice for investment banks, issuers and
investors.
As
noted, COVID-19 has caused restrictions on travel, quarantines in
many areas, and forced closures of public gatherings, which
includes investor conferences. As a result, all conferences
scheduled to use our software this year in an on-site venue have
either converted to virtual platform or cancelled all together. We
have seen slightly more than half of these events move to a smaller
virtual format, which in many cases includes our virtual component
that we upgraded earlier this year. We are encouraged by the
industry adoption of virtual technologies in general and believe
more banks and conference organizers may embrace this option for
more investor events in the future.
Investor Network
Over the past few years, we have been focused on
refining the model of digital distribution of our customers’
message to the investment community and beyond. This has been
accomplished by integrating our shareholder outreach module,
Investor Network, into and with Platform id.
Most of the customers subscribing to
this module today are historical Annual Report Service
(“ARS”) users, as well as new customers purchasing the
entire Platform id.
subscription. We have migrated some of
the customers from the traditional ARS business into this new
digital subscription business, however, we continue to see customer
attrition for customers who subscribe to this as a stand-alone
product as well.
Webcasting
The earnings event industry is a highly
competitive space with a majority of the business being driven from
practitioners in investor relations and communications firms. We
estimate there are approximately 5,000 companies in North America
conducting earnings events each quarter that include
teleconference, webcast, or both as part of their events.
Platform id. also
incorporates other elements of the
earnings event, including earnings date/call announcement, earnings
press release and both SEC Form 8-K and SEDAR (the Canadian
equivalent of EDGAR) filings. There are a handful of our
competitors that can offer an integrated full-service solution
today. However, we believe our real-time event setup and integrated
approach to our news platform offers a more effective way to manage
the event process.
Additionally,
as a commitment to broadening the reach of our webcast platform,
all events are streamed within our shareholder outreach module,
which helps drive new audiences and gives companies the ability to
view their analytics and engagement of each event. We believe these
analytics, which will be a component of our Insight and Analytics
module, will increase the demand for our webcasting platform among
the corporate issuer community and beyond.
Our VWP
product is a leading cloud-based webcast, webinar and training
platform that delivers live and on-demand streaming of events to
audiences of all sizes. VWP allows customers to create, produce and
deliver events, which we feel integrates well into Platform
id. VWP enables us
the ability to host thousands of additional webcasts each year,
expanding and diversifying our webcast business from our historical
earnings-based events to include corporate meetings, training
sessions, town hall-type events, annual meetings and deal and
non-deal roadshows. As we expand our platform, it is vital for us
to have solutions that service both our core public companies but
also a growing segment of private customers. As a result of
COVID-19, most companies have been holding meetings virtually,
which has increased demand for this product.
Investor Relations Content
Our investor relations content network is another
component of Platform id., which is used to create the investor
relations’ tab of a company’s website. This investor
relations content network is a robust series of data feeds
including news feeds, stock feeds, fundamentals, regulatory
filings, corporate governance and many other components which are
aggregated from a majority of the major exchanges and news
distribution outlets around the world. Customers can subscribe to
one or more of these data feeds or as a component of a fully
designed and hosted website for pre-IPO companies, SEC reporting
companies and partners seeking to display our content on their
corporate sites. The clear benefit to our investor relations module
is its integration into Platform id.
As such, companies can produce content
for public distribution and it is automatically linked to their
corporate website, distributed to targeted groups and placed into
our data feed partners.
Compliance Modules
Platform id.’s disclosure reporting module is a document
conversion, editing and filing offering which is designed for
reporting companies and professionals seeking to insource the
filing process to the SEC’s EDGAR system. This module is
available in both a secure public cloud within our Platform
id.
subscription as well as in a private
cloud option for corporations, mutual funds and the legal community
looking to further enhance their internal document process. As this
module has begun to be adopted by our customers, we have seen a
negative impact on our legacy disclosure conversion services
business. However, the margins associated with our Platform and
Technology business compared to our Services business are higher
and align with our long-term strategy, and as such, we believe this
module will have a positive impact on our compliance business going
forward.
Our whistleblower module is an add-on product
within Platform id.
This system delivers secure
notifications and basic incident workflow management processes that
align with a company’s corporate governance whistleblower
policy. As a supported and subsidized bundle product of the New
York Stock Exchange (“NYSE”) offerings, we are able to
gain relationships with new IPO customers and other larger cap
customers listed on the NYSE.
19
A valued subscription add-on in our
Platform id.
offering is the ability for our
customers to gain access to real-time information about their
shareholders, stock ledgers and reports and to issue new shares
from our cloud-based stock transfer module. Managing the
capitalization table of a public company or pre-IPO company is a
cornerstone of corporate governance and transparency, and as such
companies and community banks have chosen us to assist with their
stock transfer needs, including bond offerings and dividend
management. This is an industry which has experienced declining
overall revenues as it was affected by the replacement of paper
certificates with digital certificates. However, we have been
focused on selling subscriptions of the stock transfer component of
our platform, allowing customers to gain access to our cloud-based
system in order to move shares or query shareholders, which we
believe has resulted in a more efficient process for both our
customers and us.
Our
proxy module is marketed as a fully integrated, real-time voting
platform for our customers and their shareholders of record. This
module is utilized for every annual meeting or special meeting we
manage for our customers and offers both full-set mailing and
notice of internet availability options. We have also upgraded this
offering to now offer the ability for our customers to hold their
annual general meeting virtually. This product will utilize our
webcasting technology to allow all shareholders of our customers to
participate in the meeting regardless of location. Shareholders can
utilize our voting platform prior to the meeting or vote in person
at the virtual meeting by going to the meeting’s dedicated
URL and entering their specific unique identifying number supplied
to them on either their proxy card or electronically.
Services
Given our focus on cloud-based subscription
business and as we have previously reported, we expect to see
continued decreases in the overall revenues associated with our
Services business. Typically, Services revenues relate to
activities where substantial incremental resources are required to
perform the work for our customers and/or hard goods are utilized
as part of the engagement. To date, most of our Services have been
related to converting and editing SEC documents and XBRL tagging,
which has been our core compliance business over the last 14 years
and completing SEDAR filings. Services also include
telecommunications services and print, fulfillment and delivery of
stock certificates, proxy materials or annual reports depending on
each customer’s engagement. Services are not required but are
optional for customers that utilize our Platform
id.
and are typically invoiced as
used.
Our investor outreach and engagement offering,
formerly known as ARS, was acquired from PIR in 2013. The ARS
business has existed for over 20 years primarily as a physical hard
copy delivery service of annual reports and prospectuses. We
continue to operate a portion of this legacy system for customers
who opt to take advantage of physical delivery of material.
Additionally, we continue to attempt to migrate the install base
over to subscriptions of our digital outreach engagement module
within Platform id.
We believe we will continue to see
further attrition of both customers and revenues in this category
as we focus our efforts on our Platform and Technology
business.
In our
Services business, we expect demand will continue to shift from
traditional printed, service-based engagements to digital
distribution offerings. This was true before COVID-19 and we
believe the recent outbreak will only increase the demand for
digital offerings in the future. Specifically, this may cause
transition in the areas of print and proxy fulfillment and paper
processing of stock-records and certificates to digital
distribution, voting and transfer of records.
Results of Operations
Comparison of results of operations for the three and nine months
ended September 30, 2020 and 2019:
|
|
Three months ended
|
Nine months ended
|
||
|
|
September 30,
|
September 30,
|
||
|
Revenue Streams
|
2020
|
2019
|
2020
|
2019
|
|
|
|
|
|
|
|
Platform and Technology
|
|
|
|
|
|
Revenue
|
$3,613
|
$2,712
|
$9,599
|
$8,038
|
|
Gross
margin
|
$2,769
|
$2,014
|
$7,329
|
$5,960
|
|
Gross
margin %
|
77%
|
74%
|
76%
|
74%
|
|
|
|
|
|
|
|
Services
|
|
|
|
|
|
Revenue
|
$1,269
|
$1,307
|
$4,183
|
$4,298
|
|
Gross
margin
|
$726
|
$783
|
$2,451
|
$2,602
|
|
Gross
margin %
|
57%
|
60%
|
59%
|
61%
|
|
|
|
|
|
|
|
Total
|
|
|
|
|
|
Revenue
|
$4,882
|
$4,019
|
$13,782
|
$12,336
|
|
Gross
margin
|
$3,495
|
$2,797
|
$9,780
|
$8,562
|
|
Gross
margin %
|
72%
|
70%
|
71%
|
69%
|
20
Revenues
Total
revenue increased by $863,000, or 21%, to $4,882,000 during the
three-month period ended September 30, 2020, as compared to
$4,019,000 during the same period of 2019. Total revenue increased
by $1,446,000, or 12%, to $13,782,000 during the nine-month period
ended September 30, 2020, compared to $12,336,000 during the same
period of 2019. The increase in total revenue is attributable to
our Platform and Technology revenue stream.
Platform and
Technology revenue increased $901,000, or 33%, and $1,561,000, or
19%, during the three and nine-month periods ended September 30,
2020, respectively, as compared to the same periods of 2019. The
increase in revenue is due to a combination of increased revenue
from our webcasting, conference software and newswire products, as
well as increased licenses of Platform id. During the three and nine
months ended September 30, 2020, we benefited from our ability to
pivot and enhance our products with virtual components, including
virtual annual meetings, virtual conferences and enhanced
webcasting features to allow banks to conduct virtual roadshows,
analyst days and other types of events. Additionally, ACCESSWIRE
revenue for the three and nine months ended September 30, 2020
increased 22% and 14%, respectively, compared to the same periods
of the prior year. Revenue from licenses of Platform id. increased as a result of
the additional licenses signed during the final quarter of 2019 and
first three quarters of 2020. During the three and nine months
ended September 30, 2020 we entered into 42 and 107 licenses of
Platform id. with
annual contract value of $360,000 and $766,000, respectively. This
brings our total subscriptions of Platform id. to 320 with annual contract
value of $2,477,000, as of September 30, 2020, compared to 255
subscriptions with annual contract value of $2,033,000 as of
December 31, 2019. Platform and Technology revenue increased to 74%
and 70% of total revenue during the three and nine months ended
September 30, 2020, respectively, as compared to 67% and 65% during
the same periods of the prior year.
Services revenue
decreased $38,000, or 3%, and $115,000, also 3%, during the three
and nine-month periods ended September 30, 2020, as compared to the
same periods of 2019. The decrease in revenue is due to continued
customer attrition of our ARS services as well as a decline in
transfer agent services due to a combination of less corporate
transactions and directives, as well as, an increased shift from
paper-based processing of transactions to electronic processing.
These decreases were partially offset by increases in print and
proxy fulfillment, due to increased projects associated with annual
meetings, and teleconferencing and other webcasting services, as a
result of accompanying the increased demand for virtual webcasting
products.
No
customers accounted for more than 10% of the revenues during the
three and nine-month periods ended September 30, 2020 or
2019.
Revenue Backlog
At
September 30, 2020, our deferred revenue balance was $2,098,000,
which we expect to recognize over the next twelve months, compared
to $1,812,000 at December 31, 2019, an increase of 16%. Deferred
revenue primarily consists of advance billings for subscriptions of
our cloud-based products and pre-paid packages of our news
distribution product, as well as, advance billings for annual
contracts for legacy ARS services.
Cost of Revenues and Gross Margin
Platform and
Technology cost of revenues consists primarily of direct labor
costs, newswire distribution costs, third party licensing and
amortization of capitalized software costs related to platforms
licensed to customers. Services costs of revenue consists primarily
of direct labor costs, warehousing, logistics, print production
materials, postage, and outside services directly related to the
delivery of services to our customers. Cost of revenues increased
by $165,000, or 14%, and $228,000, or 6% during the three and
nine-month periods ended September 30, 2020, respectively, as
compared to the same periods of 2019. Overall gross margin
increased $698,000, or 25%, and $1,218,000, or 14%, during the
three and nine-month periods ended September 30, 2020,
respectively, as compared to the same periods of the prior year.
Gross margin percentages increased to 72% and 71% during the three
and nine months ended September 30, 2020, respectively, compared to
70% and 69% during the same periods of 2019.
Gross
margin percentage from Platform and Technology revenue was 77% and
76% during the three and nine-month periods ended September 30,
2020, respectively, as compared to 74% during the same periods of
2019. The increase in gross margin percentage is primarily
attributable to the additional webcasting revenue associated with
the virtual events completed during the year with a relatively
fixed cost structure.
Gross
margins from our Services revenue decreased to 57% and 59% during
the three and nine-month periods ended September 30, 2020,
respectively, as compared to 60% and 61% during the same periods of
2019. The decrease is due in part to lower revenue from transfer
agent services with relatively fixed costs and increased webcasting
service revenue which typically has a lower margin than other
services.
21
Operating Expenses
General and Administrative Expense
General
and administrative expenses consist primarily of salaries,
stock-based compensation, insurance, fees for professional
services, general corporate expenses (including bad debt expense)
and facility and equipment expenses. General and administrative
expenses decreased $177,000, or 14%, and $447,000 or 11%, during
the three and nine-month periods ended September 30, 2020,
respectively, as compared the same periods of 2019. This decrease
is primarily due to a decrease in our bad debt provision of $85,000
and $458,000 during the three and nine months ended September 30,
2020, respectively, compared to the prior year. The high bad debt
provision in the prior year was primarily related to reserves on
accounts receivable balances of two significant investment
commentary newswire customers which were written off in 2019. Also
contributing to the decrease in general and administrative expenses
was a decrease in stock compensation expenses. These decreases were
partially offset by an increase in rent expense and for the nine
months ended September 30, 2020 an increase in employee
expenses.
As a
percentage of revenue, general and administrative expenses were 22%
and 25% for the three and nine-month periods ended September 30,
2020, respectively, compared to 31% and 32% for the same periods of
the prior year.
Sales and Marketing Expenses
Sales
and marketing expenses consist primarily of salaries, stock-based
compensation, sales commissions, advertising expenses, tradeshow
expenses and other marketing expenses. Sales and marketing expenses
for the three and nine-month periods ended September 30, 2020,
increased $102,000, or 12%, and $253,000, or 10%, respectively,
compared to the same periods of 2019. This increase is directly
related to our investment in our sales and marketing initiatives
with an increase in personnel costs and digital
marketing.
As a
percentage of revenue, sales and marketing expense were 20% for
both the three and nine-month periods ended September 30, 2020,
respectively, compared to 22% and 21% for the same periods of the
prior year.
Product Development Expenses
Product
Development expenses consist primarily of salaries, stock-based
compensation, bonuses and licenses to develop new products and
technology to complement and/or enhance Platform id. Product development
expenses decreased $76,000, or 26%, and $397,000, or 41%, during
the three and nine-month periods ended September 30, 2020, compared
to the same periods in 2019. The decrease is due to a decrease in
headcount within the development team and use of more specialized
consultants. We anticipate product development expenses to begin to
increase toward previous levels in future periods.
As a
percentage of revenue, product development expenses were 4% for
both the three and nine-month periods ended September 30, 2020,
respectively, compared to 7% and 8% during the same periods of
2019, respectively.
Depreciation and Amortization
Depreciation and
amortization expenses decreased $47,000, or 21%, and $59,000, or
9%, during the three and nine-month periods ended September 30,
2020, respectively, as compared to the same periods of 2019. The
decrease is primarily related to intangible assets associated with
the acquisition of PIR that became fully amortized during the
year.
Interest income, net
Interest income
(expense), net, represents interest income on deposit and money
market accounts, as well as, the non-cash interest expense
associated with the present value of the remaining anniversary
payments of the Interwest acquisition. The decrease in interest
income and corresponding increase in interest expense during the
three and nine months ended September 30, 2020, as compared to the
same periods of the prior year, is due to a decrease in interest
rates associated with deposit and money market
accounts.
Income tax expense
We
recognized income tax expense of $283,000 and $593,000 during the
three and nine-month periods ended September 30, 2020,
respectively, compared to $59,000 and $105,000 during the same
periods of 2019. At the end of each interim period, we estimate the
effective tax rate we expect to be applicable for the full fiscal
year and this rate is applied to our results for the year-to-date
period, and then adjusted for any discrete period items. For the
three and nine-month periods ended September 30, 2020, the variance
between the Company’s effective tax rate and the U.S.
statutory rate of 21% is primarily attributable to state income
taxes. For the three and nine-month periods ended September 30,
2019, the variance between the Company’s effective tax rate
and the U.S. statutory rate is primarily attributable to the excess
stock-based compensation tax benefit recognized in income tax
expense during the periods, as well as foreign statutory tax rate
differentials and tax credits.
22
Net Income
Net
income for the three and nine-month periods ended September 30,
2020 was $789,000 and $1,787,000, respectively, compared to
$200,000 and $617,000 for the same periods of 2019.
The
increase in net income is partially due to realizing the scale of
our Platform and Technology products through increased revenue and
higher gross margin percentages. Additionally, we experienced lower
operating expenses which were partially offset by a decline in
interest income and higher taxes.
Liquidity and Capital Resources
As of
September 30, 2020, we had $18,429,000 in cash and cash equivalents
and $2,445,000 in net accounts receivable. Current liabilities at
September 30, 2020, totaled $4,685,000 including our accounts
payable, deferred revenue, accrued payroll liabilities, income
taxes payable, current portion of remaining payments for Interwest,
lease liabilities and other accrued expenses. At September 30,
2020, our current assets exceeded our current liabilities by
$16,409,000.
Effective October
3, 2019, the Company renewed its unsecured Line of Credit, which
increased the term to two years, with all other provisions
remaining the same. The amount of funds available for borrowing are
$3,000,000 and the interest rate is LIBOR plus 1.75%. As of
September 30, 2020, the interest rate was 1.90% and the Company did
not owe any amounts on the Line of Credit.
2020 Outlook
The following statements and certain statements made elsewhere in
this document are based upon current expectations. These statements
are forward looking and are subject to factors that could cause
actual results to differ materially from those suggested here,
including, without limitation, demand for and acceptance of our
services, new developments, competition and general economic or
market conditions, particularly in the domestic and international
capital markets. Refer also to the Cautionary Statement Concerning
Forward Looking Statements included in this report.
On
January 30, 2020, the World Health Organization declared the
COVID-19 outbreak a "Public Health Emergency of International
Concern" and on March 11, 2020, declared it to be a pandemic.
Actions taken around the world to help mitigate the spread of
COVID-19 include restrictions on travel, quarantines or
“stay-at-home” restrictions in certain areas and forced
closures for certain types of public places and businesses.
COVID-19 and actions taken to mitigate it have had and are expected
to continue to have an adverse impact on the economies and
financial markets globally, including the geographical areas in
which we operate. Although our offices were initially ordered
temporarily closed for the safety of our employees, their families
and our community, on June 1, 2020 we began slowly re-opening our
offices, which are now open for all employees who elect to return
to the office.
While
it is unknown how long these conditions will last, including
whether a worldwide resurgence will occur, and what the complete
financial impact will be to the Company, we could experience a
material disruption of our employees and operations, a decline in
revenue, a decline in value of our assets, deterioration of our
customer base and the inability of our customers to pay for
subscriptions or services provided. To date, we have seen both
positive and negative impacts to our business. Several in-person
conferences scheduled to occur in the first half of the year were
either cancelled or delayed and we also experienced a delay in
transactions processed by the Depository Trust Company and banks
and brokers in our transfer agent business. However, our ability to
pivot and enhance our product offering with our virtual products
generated increased revenue during the second and third quarters.
Despite the short-term increase in revenue, the concentrations of
our customer base within middle, small and micro-cap public
customers make it reasonably possible that we are vulnerable to the
risk of a near-term negative impact related to the COVID-19
outbreak if a substantial portion of these customers are forced to
scale back or cease operations. We are closely monitoring the
impact of the COVID-19 pandemic on all aspects of our business and
are unable at this time to predict the continued impact that
COVID-19 will have on our business, financial position, and
operating results in future periods due to numerous
uncertainties.
Overall, the demand for our platforms and services
continues to be stable in a majority of the segments we serve. We
are seeing increased demand for virtual events using both our
conference software and webcasting products, as customers are
opting to hold virtual meetings. During the first quarter, we were
able to pivot portions of our platform to specifically address
COVID-19 business limitations. This resulted in a new Virtual
Annual Meeting product, which combines our webcasting and proxy
voting technology together. Additionally, we also upgraded
technology of our conference software product to allow conferences
to go fully virtual and hold one-on-one meetings
with audio, video and share
features.
We believe these developments will assist us in
delivering best of breed solutions to the market, but also lead us
into new opportunities during this changing and challenging
environment. The extent to how long these shifts in demands will
occur is uncertain at this time and could be longer than just 2020.
However, we cannot make any assurances at this time that our
product upgrades will be accepted by customers and revenue will be
significant enough to offset losses in other aspects of our
business in the long-term.
23
The
transition to a platform subscription model has been and will
continue to be key for our long-term sustainable growth. We will
also continue to focus on the following key strategic initiatives
during 2020:
●
Continue to expand
our Platform and Technology products and adapt to this changing
environment,
●
Continue to grow
through acquisitions in areas of strategic focus,
●
Expand customer
base,
●
Continue to expand
our newswire distribution,
●
Continue
development of our Insight and Analytics module,
●
Generate profitable
sustainable growth,
●
Generate cash flows
from operations.
We
believe there is significant demand for our products around the
world among the middle, small and micro-cap markets, as well as
private companies, as they seek to find better platforms and tools
to disseminate and communicate their messages. Although this demand
may decrease or shift in the near term as a result of COVID-19, we
believe we have the product sets, platforms, capacity and ability
to adapt during these changing times to meet their
requirements.
We
have invested and will continue to invest in our product sets,
platforms and intellectual property development via internal
development and acquisitions. Currently, the acquisition
environment is very difficult due to COVID-19, however,
acquisitions remain a core part of our strategy. This investment
strategy is key to enhancing our overall offerings in the market
and necessary to keep our competitive advantages and facilitate the
next round of growth that management believes it can achieve when
the pandemic has passed. If we are successful in this effort, we
believe we can further increase our market share and revenues per
user as we move forward, once we return to a more traditional
business environment.
Off-Balance Sheet Arrangements
We have
no off-balance sheet arrangements that have or are reasonably
likely to have a current or future effect on our financial
condition, changes in financial condition, revenues or expenses,
results of operations, liquidity, capital expenditures or capital
resources that is material to stockholders.
ITEM 3. QUANTITATIVE AND QUALITATIVE
DISCLOSURES ABOUT MARKET RISK.
Not
applicable
ITEM 4. CONTROLS AND
PROCEDURES.
As of
the end of the period covered by this quarterly report on Form10-Q,
the Company’s Chief Executive Officer and Chief Financial
Officer conducted an evaluation of the Company’s disclosure
controls and procedures (as defined in Rules 13a-15 and 15d-15 of
the Securities Exchange Act of 1934). Based upon this evaluation,
the Company’s Chief Executive Officer and Chief Financial
Officer concluded that the Company’s disclosure controls and
procedures are effective and have not changed since its most recent
annual report.
Changes in Internal Control over Financial Reporting
We
regularly review our system of internal control over financial
reporting to ensure we maintain an effective internal control
environment. There were no changes in our internal control over
financial reporting that occurred during the period covered by this
Quarterly Report on Form 10-Q that have materially affected, or are
reasonably likely to materially affect, our internal control over
financial reporting.
24
PART II – OTHER
INFORMATION
ITEM 1. LEGAL PROCEEDINGS.
From
time to time, we may be involved in litigation that arises through
the normal course of business. As of the date of this filing, we
are neither a party to any litigation nor are we aware of any such
threatened or pending litigation that might result in a material
adverse effect to our business.
ITEM 1A. RISK FACTORS.
There
have been no material changes to our risk factors as previously
disclosed in our most recent Form 10-K filing, except as set forth
below.
The recent COVID-19 outbreak could harm our business and results of
operations.
On
January 30, 2020, the World Health Organization declared the
COVID-19 outbreak a "Public Health Emergency of International
Concern" and on March 11, 2020, declared it to be a pandemic. We
have undertaken measures to protect our employees, partners and
customers by requiring a majority of our employees to work remotely
at certain times. There can be no assurance that these measures
will be effective, however, or that we can adopt them without
adversely affecting our business operations. In addition, the
COVID-19 outbreak has created and may continue to create
significant uncertainty in global financial markets, which may
materially decrease spending, demand for our solutions, the
viability of our customers, the value of our assets and harm our
business and results of operations.
The ultimate extent of the impact of any epidemic, pandemic or
other health crisis in our business, financial condition and
results of operations will depend on future developments, which are
highly uncertain and cannot be predicted.
ITEM 2. UNREGISTERED SALES OF EQUITY
SECURITIES AND USE OF PROCEEDS.
None.
ITEM 3. DEFAULTS UPON SENIOR
SECURITIES.
None.
ITEM 4. MINE SAFETY
DISCLOSURE.
Not
applicable.
ITEM 5. OTHER INFORMATION.
None.
ITEM 6. EXHIBITS.
(a)
Exhibits.
|
Exhibit
|
|
|
|
Number
|
|
Description
|
|
|
Certification
of Chief Executive Officer pursuant to Section 302 of the
Sarbanes-Oxley Act of 2002.*
|
|
|
|
Certification
of Chief Financial Officer pursuant to Section 302 of the
Sarbanes-Oxley Act of 2002.*
|
|
|
|
Certification
of Chief Executive Officer pursuant to Section 906 of the
Sarbanes-Oxley Act of 2002.*
|
|
|
|
Certification
of Chief Financial Officer pursuant to Section 906 of the
Sarbanes-Oxley Act of 2002.*
|
|
|
|
|
|
|
101.INS
|
|
XBRL
Instance Document.**
|
|
101.SCH
|
|
XBRL
Taxonomy Extension Schema Document.**
|
|
101.CAL
|
|
XBRL
Taxonomy Calculation Linkbase Document.**
|
|
101.LAB
|
|
XBRL
Taxonomy Label Linkbase Document.**
|
|
101.PRE
|
|
XBRL
Taxonomy Presentation Linkbase Document.**
|
|
101.DEF
|
|
XBRL
Taxonomy Extension Definition Linkbase Document. **
|
_______________________________
|
*
|
filed
or furnished herewith
|
|
**
|
submitted
electronically herewith
|
25
SIGNATURES
Pursuant to the
requirements of the Securities Exchange Act of 1934, the registrant
has duly caused this report to be signed on its behalf by the
undersigned thereunto duly authorized.
Date:
October 29, 2020
|
|
ISSUER DIRECT CORPORATION
|
|
|
|
|
|
|
|
|
|
|
|
|
|
|
|
|
|
|
|
By:
|
/s/
Brian R. Balbirnie
|
|
|
|
|
Brian
R. Balbirnie
|
|
|
|
|
Chief
Executive Officer
|
|
|
|
|
|
|
|
|
|
|
|
|
|
By:
|
/s/
Steven Knerr
|
|
|
|
|
Steven
Knerr
|
|
|
|
|
Chief
Financial Officer
|
|
|
|
|
|
|
26